
PIONEER DRILLING COMPANY2008 Annua l Repor t1250 N.E. Loop 410
Suite 1000San Antonio, Texas 78209www.pioneerdrlg.com
PIO
NE
ER
DR
ILLING
CO
MP
AN
Y 20
08 A
NN
UA
L RE
PO
RT
24148rrdD1R1.indd 1 4/1/09 4:29 PM

MONTANA
UTAHKANSAS
OKLAHOMA
LOUISANA
COLOMBIA
TEXAS
COLORADO
NORTHDAKOTA
Areas of Operations
Drilling Services Division Offices:Corpus Christi, TexasHenderson, TexasParadise, TexasWoodward, Oklahoma
Corporate Office – San Antonio, Texas
Vernal, UtahWilliston, North DakotaBogotá, Colombia
Well Servicing> 74 newly built well-service
rigs in service> Average age 1.5 years
Wireline> 61 wireline trucks> Average age 3 years
Fishing and Rental Services> Fishing and rental services
and equipment
Year Ended Nine Months Ended(In thousands, except per share data) December 31, 2008(2) December 31, 2007(1) 2007 2006 2005
Revenues $610,884 $313,884 $416,178 $284,148 $185,246
Income (loss) before income taxes (56,688) 57,774 130,789 79,813 17,161
Net earnings (loss) (62,745) 39,645 84,180 50,567 10,812
Earnings (loss) per common share - diluted (1.26) 0.79 1.68 1.06 0.30
Total assets 824,479 560,212 501,495 400,678 276,009
Long-term debt and capital lease obligations, less current portion 262,115 — — — 13,445
Shareholders’ equity 414,118 471,072 428,109 340,676 221,615
Net cash provided by operating activities 186,391 115,455 131,530 97,084 33,665
(1) Effective December 31, 2007, Pioneer Drilling Company changed its fiscal year end from March 31 to December 31, resulting in a nine month reporting period from April 1, 2007 to December 31, 2007. (2) Includes goodwill and intangible asset impairment charges of $171.493 ($136,607 net of tax).
Selected Financial Data Years Ended March 31,
Production Services Division Offices:
DirectorsDean A. BurkhardtChairman of the Board Pioneer Drilling Company, Rancher, Investor and Consultant
Wm. Stacy LockePresident and Chief Executive OfficerPioneer Drilling Company
John Michael RauhRetired, Former Vice President and Corporate Controller Kerr-McGee Corporation
C. John ThompsonChairman and Chief Executive OfficerVentana Capital Advisors, Inc.
Scott D. UrbanPartner in Edgewater Energy Partners
OfficersWm. Stacy LockePresident and Chief Executive Officer
Lorne E. PhillipsExecutive Vice President and Chief Financial Officer
F.C. “Red” West Executive Vice President and President of Drilling Services Division
Joseph B. Eustace Executive Vice President and President of Production Services Division
Carlos R. PeñaVice President, General Counsel, Corporate Secretary, and Compliance Officer
Corporate InformationCorporate HeadquartersPioneer Drilling Company1250 N.E. Loop 410, Suite 1000San Antonio, Texas 78209210.828.7689Fax 210.828.8228
Stock ListingThe American Stock Exchange: PDC (NYSE Alternext US)
AuditorsKPMG LLP300 Convent, Suite 1200 San Antonio, Texas 78205
Shareholder ContactLorne E. PhillipsExecutive Vice President andChief Financial Officer210.828.7689Fax [email protected]
Investor RelationsKenneth S. DennardDennard Rupp Gray & Easterly, LLC713.529.6600Fax 713.529.9989
Certain information in this Annual Report, and other statements that express a belief, expectation or intention, as well as those that are not statements of historical fact, are forward-looking statements. Forward-looking statements are generally accompanied by words such as “estimate,” “project,” “predict,” “believe,” “expect,” “anticipate,” “plan,” “intend,” “seek,” “will,” “should,” “goal” or other words and phrases of similar import that convey the uncertainty of future events or outcomes. We disclaim any obligation to update any of these forward-looking statements, and we caution you not to rely on them unduly. We have based these forward-looking statements on our current expectations and assumptions about future events. While our management considers these expectations and assumptions to be reasonable, they are inherently subject to significant business, economic, competitive, regulatory and other risks, contingencies and uncertainties, most of which are difficult to predict and many of which are beyond our control. These risks, contingencies and uncertainties include, among other matters, the risks set forth in Item 1A—“Risk Factors” of our Form 10-K for the year ended December 31, 2008. These risks, contingencies and uncertainties could cause our actual results to differ materially from those expressed in a forward-looking statement contained in this Annual Report. Unpredictable or unknown factors we have not discussed in this Annual Report or elsewhere could also have material adverse effects on actual results of matters that are the subject of our forward-looking statements. We advise our shareholders to (1) be aware that important factors not referred to above could affect the accuracy of our forward-looking statements and (2) use caution and common sense when considering our forward-looking statements.
24148rrdD1R1.indd 2 4/1/09 4:29 PM

2008 was indeed a year of transformation for Pioneer. We
completed our first ten months of operations with our new
Production Services Division, achieved our goal of operating
five rigs in Colombia, and obtained the highest contracted
dayrates for land rigs in our history. Our evolution into a
multi-service, geographically diversified and international
oilfield services provider has begun.
This growth and success is reflected in our financial results. After excluding
the impact of non-cash impairment charges, Pioneer generated $611 million
in revenues, $215 million in earnings before interest, taxes, depreciation and
amortization (EBITDA) and $74 million in net earnings for calendar year 2008.
Goodwill and intangible assets were recorded earlier in the year in connection
with the acquisitions that comprise our Production Services Division. During
the fourth quarter of 2008, we recognized $171 million in non-cash impairment
charges to goodwill and intangible assets as a result of an overall downturn in
our industry brought on by the rapid decline in commodity prices, the weakening
economy and high levels of natural gas in storage.
During the year, we added one newly-built, 1500 horsepower diesel electric
rig to our U.S. land fleet, 12 new, high-horsepower workover rigs, eight
wireline units and $2 million in additional fishing and rental equipment.
These additions bring our current fleet counts to 71 land rigs, five of which
are in Colombia, 74 workover rigs, 61 wireline units and approximately
$15 million of fishing and rental equipment. Our 71st land rig will begin
operating in April 2009 in the Bakken Shale in North Dakota under a three
year contract. This rig is a state of the art 1500 horsepower AC electric rig.
To Our Shareholders
Wm. Stacy LockePresident and Chief Executive Officer
2008 Annual Report 1
24148rrdD2R1.indd 1 3/31/09 5:46 PM

2 Pioneer Drilling Company
As we transition into 2009, we have an entirely different set of market
conditions at work when compared to the recent past. Challenged by
declining oil and natural gas prices, credit market turmoil, a worldwide
recession and suppressed equity valuations, our customers have reduced
capital spending dramatically. As a result, the U.S. land rig count has declined
over 900 rigs, or 45%, from October 2008 to March 2009, and continues
to decline today. Along with declining utilizations, land rig dayrates have
declined by roughly 35%. These same market forces are driving utilization
and profitability down in our Production Services Division as well.
In this challenging market, our posture has become cautious. We have taken
measures to downsize our cost structure, such as reducing our workforce
by roughly 40%, rolling back hourly wages, reducing salaried employee
compensation, discontinuing the Company match to our 401(k) and
curtailing other expenses. In addition, we have scaled back our projected
capital expenditure budget for 2009 by 63% to $65 million, down from
$176 million last year. We will continue to reduce costs and cash outlays as
required by changing market conditions.
We are very fortunate to have a seasoned and effective management team
that will take the necessary steps and make the difficult decisions to ensure
the Company’s long term well-being. As with every down cycle, an up cycle
will follow. Please be patient as we navigate through this difficult year and
trust that your management team and Board of Directors are working hard
on your behalf.
Sincerely,
Wm. Stacy LockePresident and Chief Executive Officer
DrillingServices
75%
REVENUE
2008 contributions by Service Line
DrillingServices
72%
ProductionServices
28%
ProductionServices
25%
MARGIN
24148rrdD2R1.indd 2 3/27/09 12:12 PM

UNITED STATESSECURITIES AND EXCHANGE COMMISSION
Washington, D. C. 20549
FORM 10-K(Mark one)È ANNUAL REPORT PURSUANT TO SECTION 13 OR 15(d) OF THE SECURITIES EXCHANGE
ACT OF 1934For the period ended December 31, 2008
or‘ TRANSITION REPORT PURSUANT TO SECTION 13 OR 15(d) OF THE SECURITIES EXCHANGE
ACT OF 1934
Commission File Number: 1-8182
PIONEER DRILLING COMPANY(Exact name of registrant as specified in its charter)
TEXAS 74-2088619(State or other jurisdiction of
incorporation or organization)(I.R.S. Employer
Identification Number)
1250 N.E. Loop 410, Suite 1000San Antonio, Texas 78209
(Address of principal executive offices) (Zip Code)
Registrant’s telephone number, including area code: (210) 828-7689Securities registered pursuant to Section 12(b) of the Act:
Title of each class Name of each exchange on which registered
Common Stock, $0.10 par value American Stock Exchange (NYSE Alternext US)Securities registered pursuant to Section 12(g) of the Act: None
Indicate by check mark if the registrant is a well-known seasoned issuer, as defined in Rule 405 of the SecuritiesAct. Yes ‘ No È
Indicate by check mark if the registrant is not required to file reports pursuant to Section 13 or Section 15(d) of theExchange Act. Yes ‘ No È
Indicate by check mark whether the Registrant: (1) has filed all reports required to be filed by Section 13 or 15(d) of theSecurities Act of 1934 during the preceding 12 months (or for such shorter period that the registrant was required to file suchreports), and (2) has been subject to such filing requirements for the past 90 days. Yes È No ‘
Indicate by check mark if disclosure of delinquent filers pursuant to Item 405 of Regulation S-K is not contained herein,and will not be contained, to the best of registrant’s knowledge, in definitive proxy or information statements incorporated byreference in Part III of this Form 10-K or any amendment to this Form 10-K. ‘
Indicate by check mark whether the registrant is a large accelerated filer, an accelerated filer, a non-accelerated filer, or asmaller reporting company. See definitions of “large accelerated filer,” “accelerated filer,” “non-accelerated filer,” and “smallerreporting company” in Rule 12b-2 of the Exchange Act. (Check one):
Large accelerated filer È Accelerated filer ‘
Non-accelerated filer ‘ (Do not check if a smaller reporting company) Smaller reporting company ‘Indicate by check mark whether the registrant is a shell company (as defined in Rule 12b-2 of the Exchange Act).
Yes ‘ No ÈThe aggregate market value of the registrant’s common stock held by nonaffiliates of the registrant on the last business day
of the registrant’s most recently completed second fiscal quarter (based on the closing sales price on the American StockExchange (NYSE Alternext US) on June 30, 2008) was approximately $932.0 million.
As of February 6, 2009, there were 49,997,578 shares of common stock, par value $0.10 per share, of the registrant issuedand outstanding.
DOCUMENTS INCORPORATED BY REFERENCEPortions of the proxy statement related to the registrant’s 2009 Annual Meeting of Shareholders are incorporated by
reference into Part III of this report.


TABLE OF CONTENTS
Page
PART IIntroductory Note . . . . . . . . . . . . . . . . . . . . . . . . . . . . . . . . . . . . . . . . . . . . . . . . . . . . . . . . . . . . 1
Item 1. Business . . . . . . . . . . . . . . . . . . . . . . . . . . . . . . . . . . . . . . . . . . . . . . . . . . . . . . . . . . . . . . . . . . . 2Item 1A. Risk Factors . . . . . . . . . . . . . . . . . . . . . . . . . . . . . . . . . . . . . . . . . . . . . . . . . . . . . . . . . . . . . . . . 17Item 1B. Unresolved Staff Comments . . . . . . . . . . . . . . . . . . . . . . . . . . . . . . . . . . . . . . . . . . . . . . . . . . . . 27Item 2. Properties . . . . . . . . . . . . . . . . . . . . . . . . . . . . . . . . . . . . . . . . . . . . . . . . . . . . . . . . . . . . . . . . . . 27Item 3. Legal Proceedings . . . . . . . . . . . . . . . . . . . . . . . . . . . . . . . . . . . . . . . . . . . . . . . . . . . . . . . . . . . . 28Item 4. Submission of Matters to a Vote of Security Holders . . . . . . . . . . . . . . . . . . . . . . . . . . . . . . . . 28
PART II
Item 5. Market for Registrant’s Common Equity, Related Shareholder Matters and Issuer Purchasesof Equity Securities . . . . . . . . . . . . . . . . . . . . . . . . . . . . . . . . . . . . . . . . . . . . . . . . . . . . . . . . . . 28
Item 6. Selected Financial Data . . . . . . . . . . . . . . . . . . . . . . . . . . . . . . . . . . . . . . . . . . . . . . . . . . . . . . . 30Item 7. Management’s Discussion and Analysis of Financial Condition and Results of Operations . . 31Item 7A. Quantitative and Qualitative Disclosures About Market Risk . . . . . . . . . . . . . . . . . . . . . . . . . . 53Item 8. Financial Statements and Supplementary Data . . . . . . . . . . . . . . . . . . . . . . . . . . . . . . . . . . . . . 55Item 9. Changes in and Disagreements With Accountants on Accounting and Financial
Disclosure . . . . . . . . . . . . . . . . . . . . . . . . . . . . . . . . . . . . . . . . . . . . . . . . . . . . . . . . . . . . . . . . . . 86Item 9A. Controls and Procedures . . . . . . . . . . . . . . . . . . . . . . . . . . . . . . . . . . . . . . . . . . . . . . . . . . . . . . . 86Item 9B. Other Information . . . . . . . . . . . . . . . . . . . . . . . . . . . . . . . . . . . . . . . . . . . . . . . . . . . . . . . . . . . . 88
PART IIIItem 10. Directors, Executive Officers and Corporate Governance . . . . . . . . . . . . . . . . . . . . . . . . . . . . . 88Item 11. Executive Compensation . . . . . . . . . . . . . . . . . . . . . . . . . . . . . . . . . . . . . . . . . . . . . . . . . . . . . . 88Item 12. Security Ownership of Certain Beneficial Owners and Management and Relate Shareholder
Matters . . . . . . . . . . . . . . . . . . . . . . . . . . . . . . . . . . . . . . . . . . . . . . . . . . . . . . . . . . . . . . . . . . . . 88Item 13. Certain Relationships and Related Transactions, and Director Independence . . . . . . . . . . . . . . 88Item 14. Principal Accountant Fees and Services . . . . . . . . . . . . . . . . . . . . . . . . . . . . . . . . . . . . . . . . . . . 88
PART IVItem 15. Exhibits and Financial Statement Schedules . . . . . . . . . . . . . . . . . . . . . . . . . . . . . . . . . . . . . . . 89


PART I
INTRODUCTORY NOTE
SPECIAL NOTE REGARDING FORWARD-LOOKING STATEMENTS
From time to time, our management or persons acting on our behalf make forward-looking statements toinform existing and potential security holders about our company. These statements may include projections andestimates concerning the timing and success of specific projects and our future backlog, revenues, income andcapital spending. Forward-looking statements are generally accompanied by words such as “estimate,” “project,”“predict,” “believe,” “expect,” “anticipate,” “plan,” “intend,” “seek,” “will,” “should,” “goal” or other words thatconvey the uncertainty of future events or outcomes. These forward-looking statements speak only as of the dateon which they are first made, which in the case of forward-looking statements made in this report is the date ofthis report. Sometimes we will specifically describe a statement as being a forward-looking statement and refer tothis cautionary statement.
In addition, various statements that this Annual Report on Form 10-K contains, including those that expressa belief, expectation or intention, as well as those that are not statements of historical fact, are forward-lookingstatements. Those forward-looking statements appear in Item 1—“Business” and Item 3—“Legal Proceedings” inPart I of this report; in Item 5—“Market for Registrant’s Common Equity, Related Shareholder Matters andIssuer Purchases of Equity Securities,” Item 7—“Management’s Discussion and Analysis of Financial Conditionand Results of Operations,” Item 7A—“Quantitative and Qualitative Disclosures About Market Risk” and in theNotes to Consolidated Financial Statements we have included in Item 8 of Part II of this report; and elsewhere inthis report. These forward-looking statements speak only as of the date of this report. We disclaim any obligationto update these statements, and we caution you not to rely on them unduly. We have based these forward-lookingstatements on our current expectations and assumptions about future events. While our management considersthese expectations and assumptions to be reasonable, they are inherently subject to significant business,economic, competitive, regulatory and other risks, contingencies and uncertainties, most of which are difficult topredict and many of which are beyond our control. These risks, contingencies and uncertainties relate to, amongother matters, the following:
• general economic and business conditions and industry trends;
• risks associated with the current global crisis and its impact on capital markets and liquidity;
• the continued strength of the drilling services or production services in the geographic areas where weoperate;
• levels and volatility of oil and gas prices;
• decisions about onshore exploration and development projects to be made by oil and gas companies;
• the highly competitive nature of our business;
• the supply of marketable drilling rigs, workover rigs and wireline units within the industry;
• the success or failure of our acquisition strategy, including our ability to finance acquisitions andmanage growth;
• the continued availability of drilling rig, workover rig and wireline unit components;
• our future financial performance, including availability, terms and deployment of capital;
• the continued availability of qualified personnel; and
• changes in, or our failure or inability to comply with, governmental regulations, including thoserelating to the environment.
We believe the items we have outlined above are important factors that could cause our actual results todiffer materially from those expressed in a forward-looking statement contained in this report or elsewhere. Wehave discussed many of these factors in more detail elsewhere in this report. These factors are not necessarily all
1
the important factors that could affect us. Unpredictable or unknown factors we have not discussed in this reportcould also have material adverse effects on actual results of matters that are the subject of our forward-lookingstatements. We do not intend to update our description of important factors each time a potential important factorarises, except as required by applicable securities laws and regulations. We advise our security holders that theyshould (1) be aware that important factors not referred to above could affect the accuracy of our forward-lookingstatements and (2) use caution and common sense when considering our forward-looking statements. Also,please read the risk factors set forth in Item 1A—“Risk Factors.”
Item 1. Business
In December 2007, our Board of Directors approved a change in our fiscal year end from March 31st toDecember 31st. The fiscal year end change was effective December 31, 2007 and resulted in a nine monthreporting period from April 1, 2007 to December 31, 2007. Fiscal years beginning with the year endedDecember 31, 2008, will represent twelve month reporting periods. We implemented the fiscal year end changeto align our United States reporting period with the required Colombian statutory reporting period as well as thereporting periods of peer companies in the industry.
General
Pioneer Drilling Company provides drilling services and production services to independent and major oiland gas exploration and production companies throughout the United States and internationally in Colombia. Ourcompany was incorporated in 1979 as the successor to a business that had been operating since 1968. Over theyears, our business has grown through acquisitions and through organic growth. Since September 1999, we havesignificantly expanded our drilling rig fleet by adding 42 rigs through acquisitions and by adding 27 rigs throughthe construction of rigs from new and used components. On March 1, 2008, we significantly expanded ourservice offerings when we acquired the production services businesses of WEDGE Group Incorporated(“WEDGE”) for $314.7 million and Prairie Investors d/b/a Competition Wireline (“Competition”) for $30.0million which provide well services, wireline services and fishing and rental services. We funded the WEDGEacquisition primarily with $311.5 million of borrowings under our $400 million senior secured revolving creditfacility. As of February 23, 2009, the senior secured revolving credit facility has an outstanding balance of$257.5 million, all of which matures in February 2013. Drilling services and production services are fundamentalto establishing and maintaining the flow of oil and natural gas throughout the productive life at a well site andenable us to meet multiple needs of our customers.
We currently conduct our operations through two operating segments: our Drilling Services Division andour Production Services Division. The following is a description of these two operating segments. Financialinformation about our operating segments is included in Note 11, Segment Information, of the Notes toConsolidated Financial Statements, included in Part II Item 8, Financial Statements and Supplementary Data, ofthis Annual Report on Form 10-K.
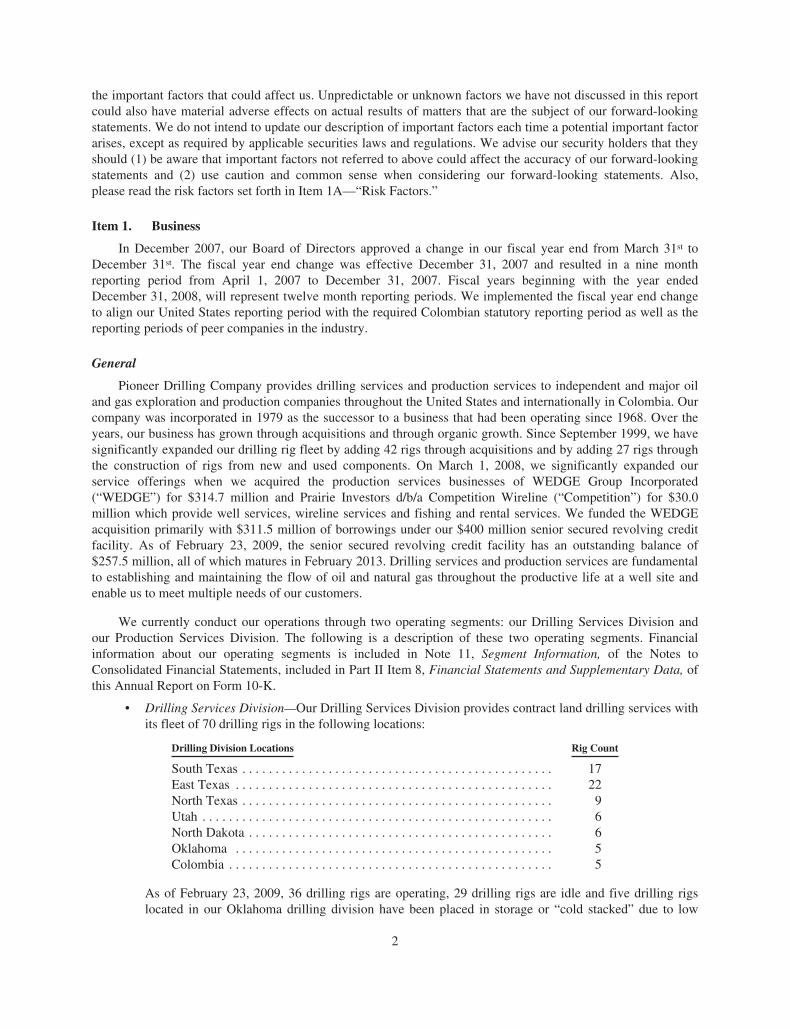
• Drilling Services Division—Our Drilling Services Division provides contract land drilling services withits fleet of 70 drilling rigs in the following locations:
Drilling Division Locations Rig Count
South Texas . . . . . . . . . . . . . . . . . . . . . . . . . . . . . . . . . . . . . . . . . . . . . . . 17East Texas . . . . . . . . . . . . . . . . . . . . . . . . . . . . . . . . . . . . . . . . . . . . . . . . 22North Texas . . . . . . . . . . . . . . . . . . . . . . . . . . . . . . . . . . . . . . . . . . . . . . . 9Utah . . . . . . . . . . . . . . . . . . . . . . . . . . . . . . . . . . . . . . . . . . . . . . . . . . . . . 6North Dakota . . . . . . . . . . . . . . . . . . . . . . . . . . . . . . . . . . . . . . . . . . . . . . 6Oklahoma . . . . . . . . . . . . . . . . . . . . . . . . . . . . . . . . . . . . . . . . . . . . . . . . 5Colombia . . . . . . . . . . . . . . . . . . . . . . . . . . . . . . . . . . . . . . . . . . . . . . . . . 5
As of February 23, 2009, 36 drilling rigs are operating, 29 drilling rigs are idle and five drilling rigslocated in our Oklahoma drilling division have been placed in storage or “cold stacked” due to low
2

demand for drilling rigs in this region. We are actively marketing all our idle drilling rigs and we areearning revenue on two of these rigs through early termination fees on their drilling contracts withterms expiring in March 2009 and May 2009. We are constructing a 1500 horsepower drilling rig thatwe expect to be completed and available for operation in the in our North Dakota drilling divisionunder a contract with a three year term beginning March 2009. In addition to our drilling rigs, weprovide the drilling crews and most of the ancillary equipment needed to operate our drilling rigs. Weobtain our contracts for drilling oil and natural gas wells either through competitive bidding or throughdirect negotiations with customers. Our drilling contracts generally provide for compensation on eithera daywork, turnkey or footage basis. Contract terms generally depend on the complexity and risk ofoperations, the on-site drilling conditions, the type of equipment used and the anticipated duration ofthe work to be performed.
• Production Services Division—Our Production Services Division provides a broad range of wellservices to oil and gas drilling and producing companies, including workover services, wirelineservices, and fishing and rental services. Our production services operations are managed regionallyand are concentrated in the major United States onshore oil and gas producing regions in the GulfCoast, Mid-Continent, and Rocky Mountain states. We provide our services to a diverse group of oiland gas companies. The primary productions services we offer are the following:
• Well Services. Existing and newly-drilled wells require a range of services to establish andmaintain production over their useful lives. We use our fleet of 74 workover rigs in seven divisionlocations to provide these required services, including maintenance of existing wells, workover ofexisting wells, completion of newly-drilled wells, and plugging and abandonment of wells at theend of their useful lives. We have a premium workover rig fleet consisting of sixty-nine 550horseposewer rigs, four 600 horsepower rigs, and one 400 horsepower rig. The average age of thisfleet is 1.4 years as of December 31, 2008. As of February 23, 2009, 62 workover rigs areoperating and 12 workover rigs are idle with no crews assigned.
• Wireline Services. In order for oil and gas companies to better understand the reservoirs they aredrilling or producing, they require logging services to accurately characterize reservoir rocks andfluids. When a producing well is completed, they also must perforate the production casing toestablish a flow path between the reservoir and the wellbore. We use our fleet of 59 truck mountedwireline units in 15 division locations to provide these important logging and perforating services.We provide both open and cased-hole logging services, including the latest pulsed-neutrontechnology. In addition, we provide services which allow oil and gas companies to evaluate theintegrity of wellbore casing, recover pipe, or install bridge plugs. Our truck mounted wirelineunits have an average age of 3.7 years as of December 31, 2008.
• Fishing and Rental Services. During drilling operations, oil and gas companies are often requiredto rent unique equipment such as power swivels, foam air units, blow-out preventers, air drillingequipment, pumps, tanks, pipe, tubing, and fishing tools. We have approximately $15 millionworth of fishing and rental tools that we provide out of four locations in Texas and Oklahoma.
Pioneer Drilling Company’s corporate office is located at 1250 N.E. Loop 410, Suite 1000, San Antonio,Texas 78209. Our phone number is (210) 828-7689 and our website address is www.pioneerdrlg.com. We makeavailable free of charge though our website our Annual Reports on Form 10-K, Quarterly Reports on Form 10-Q,Current Reports on Form 8-K, and all amendments to those reports as soon as reasonably practicable after suchmaterial is electronically filed with the Securities and Exchange Commission (the “SEC”). Information on ourwebsite is not incorporated into this report or otherwise made part of this report.
Industry Overview
In recent months, there has been substantial volatility and a decline in oil and natural gas prices due to thedeteriorating global economic environment. In addition, there has been substantial uncertainty in the capitalmarkets and access to financing is uncertain. These conditions have adversely affected our business environment.
3

Our customers have curtailed their drilling programs and reduced their production activities, which has resultedin a decrease in demand for drilling and production services and a reduction in day rates and utilization. Inaddition, certain of our customers could experience an inability to pay suppliers in the event they are unable toaccess the capital markets to fund their business operations.
Demand for oilfield services offered by our industry is a function of our customers’ willingness to makeoperating and capital expenditures to explore for, develop and produce hydrocarbons, which in turn is affected bycurrent and expected levels of oil and natural gas prices. For three years before the end of 2008, domesticexploration and production spending increased as oil and natural gas prices increased. Oil and natural gas pricesdeclined significantly at the end of 2008 and in recent months in a deteriorating global economic environment,and exploration and production companies have announced cuts in their exploration budgets for 2009. We expectthese reductions in oil and gas exploration budgets to result in a reduction in our rig utilization and revenue ratesin 2009. In addition, we may experience a shift to more turnkey and footage drilling contracts from dayworkdrilling contracts. For additional information concerning the effects of the volatility in oil and gas prices anduncertainty in capital markets, see Item 1A—“Risk Factors” in Part I of this Annual Report on Form 10-K.
On February 6, 2009 the spot price for West Texas Intermediate crude oil was $40.17, the spot price forHenry Hub natural gas was $4.67 and the Baker Hughes land rig count was 1,330, a 21% decrease from 1,677 onFebruary 8, 2008. The average weekly spot prices of West Texas Intermediate crude oil and Henry Hub naturalgas, the average weekly domestic land rig count per the Baker Hughes land rig count, and the average monthlydomestic workover rig count for the year ended December 31, 2008, the nine months ended December 31, 2007and each of the previous five years ended March 31 were:
Year EndedDecember 31,
2008
Nine MonthsEnded
December 31,2007
Years Ended March 31,
2007 2006 2005 2004
Oil (West TexasIntermediate) . . . . . . . . . . . . . . . . . . . . . . . $99.86 $77.42 $64.96 $59.94 $45.04 $31.47
Natural Gas (Henry Hub) . . . . . . . . . . . . . . . . . . $ 8.81 $ 6.82 $ 6.53 $ 9.10 $ 5.99 $ 5.27U.S. Land Rig Count . . . . . . . . . . . . . . . . . . . . . 1,792 1,684 1,589 1,329 1,110 964U.S. Workover Rig Count . . . . . . . . . . . . . . . . . 2,514 2,394 2,376 2,271 2,087 1,996
Increased expenditures for exploration and production activities generally lead to increased demand for ourdrilling services and production services. Over the past several years, rising oil and natural gas prices and thecorresponding increase in onshore oil and natural gas exploration and production spending led to expandeddrilling and well service activity as reflected by the increases in the U.S. land rig counts and U.S. workover rigcounts over the previous five years.
Exploration and production spending is generally categorized as either a capital expenditure or an operatingexpenditure. Activities designed to add hydrocarbon reserves are classified as capital expenditures, while thoseassociated with maintaining or accelerating production are categorized as operating expenditures.
Capital expenditures by oil and gas companies tend to be relatively sensitive to volatility in oil or natural gasprices because project decisions are tied to a return on investment spanning a number of years. As such, capitalexpenditure economics often require the use of commodity price forecasts which may prove inaccurate in theamount of time required to plan and execute a capital expenditure project (such as the drilling of a deep well).When commodity prices are depressed for even a short period of time, capital expenditure projects are routinelydeferred until prices return to an acceptable level.
In contrast, both mandatory and discretionary operating expenditures are more stable than capitalexpenditures for exploration. Mandatory operating expenditure projects involve activities that cannot be avoidedin the short term, such as regulatory compliance, safety, contractual obligations and projects to maintain the welland related infrastructure in operating condition. Discretionary operating expenditure projects may not be critical
4

to the short-term viability of a lease or field, but these projects are less sensitive to commodity price volatility ascompared to capital expenditures for exploration. Discretionary operating expenditure work is evaluatedaccording to a simple short-term payout criterion which is far less dependent on commodity price forecasts.
Our business is influenced substantially by both operating and capital expenditures by exploration andproduction companies. Because existing oil and natural gas wells require ongoing spending to maintainproduction, expenditures by exploration and production companies for the maintenance of existing wells arerelatively stable and predictable. In contrast, capital expenditures by exploration and production companies forexploration and drilling are more directly influenced by current and expected oil and natural gas prices andgenerally reflect the volatility of commodity prices.
Our Strategy
In past years, our strategy was to become a premier land drilling company through steady and disciplinedgrowth. We executed this strategy by acquiring and building a high quality drilling rig fleet that operates inactive drilling markets in the United States. Our long-term strategy is to maintain and leverage our position as aleading land drilling company and evolve into a premier multi-service, international oilfield services provider.The key elements of this long-term strategy include:
• Expand our Operations into International Markets—In early 2007, we announced our intention toexpand internationally and began negotiating drilling contracts in Colombia. We currently have fivedrilling rigs located in Colombia.
• Pursue Opportunities into Other Oilfield Services—We strive to mitigate the cyclical risk in oilfieldservices by complementing our drilling services with certain production services. Effective March 1,2008, we acquired the production services businesses of WEDGE and Competition which provide wellservices, wireline services and fishing and rental services. We now have a fleet of 74 workover rigs, 59wireline units and approximately $15 million of fishing and rental tools equipment that operate out offacilities in Texas, Kansas, North Dakota, Colorado, Utah, Montana, Louisiana and Oklahoma. Weexpanded our Production Services Division with the acquisitions of Paltec, Inc. (Paltec) in August 2008and Pettus Well Service (Pettus) in October 2008, both operating in Texas.
• Continue Growth with Select Capital Deployment—We intend to continue growing our business bymaking selective acquisitions, continuing new-build programs and / or upgrading our existing assets.Our capital investment decisions are determined by strategic fit and an analysis of the projected returnon capital employed on each of those alternatives. We are currently constructing one 1500 horsepowerdrilling rig that we expect to be completed and available for operation in our North Dakota drillingdivision under a contract with a three year term beginning March 2009. In addition, we will takedelivery of two new wireline units in 2009.
With the recent decline in oil and natural gas prices due to the deteriorating global economic environmentand the expected reductions in our rig utilization and revenue rates in 2009, our near-term strategy is to maintaina strong balance sheet and ample liquidity. Management has initiated certain cost reduction measures includingworkforce and wage rate reductions that will reduce operating expenses during the downturn in the industrycycle. Budgeted capital expenditures for 2009 represent routine capital expenditures necessary to keep ourequipment in safe and efficient working order and limited discretionary capital expenditures of new equipment orupgrades of existing equipment. In addition, our marketing initiatives are focused on identifying regionalopportunities and evaluating more turnkey drilling contract opportunities. We believe this near-term strategy willposition us to take advantage of business opportunities and continue our long-term growth strategy.
5

Overview of Our Segments and Services
Drilling Services Division
A land drilling rig consists of engines, a hoisting system, a rotating system, pumps and related equipment tocirculate drilling fluid, blowout preventers and related equipment.
Diesel or gas engines are typically the main power sources for a drilling rig. Power requirements for drillingjobs may vary considerably, but most land drilling rigs employ two or more engines to generate between 500 and2,000 horsepower, depending on well depth and rig design. Most drilling rigs capable of drilling in deepformations, involving depths greater than 15,000 feet, use diesel-electric power units to generate and deliverelectric current through cables to electrical switch gears, then to direct-current electric motors attached to theequipment in the hoisting, rotating and circulating systems.
Drilling rigs use long strings of drill pipe and drill collars to drill wells. Drilling rigs are also used to setheavy strings of large-diameter pipe, or casing, inside the borehole. Because the total weight of the drill stringand the casing can exceed 500,000 pounds, drilling rigs require significant hoisting and braking capacities.Generally, a drilling rig’s hoisting system is made up of a mast, or derrick, a traveling block and hook assemblythat attaches to the rotating system, a mechanism known as the drawworks, a drilling line and ancillaryequipment. The drawworks mechanism consists of a revolving drum, around which the drilling line is wound,and a series of shafts, clutches and chain and gear drives for generating speed changes and reverse motion. Thedrawworks also houses the main brake, which has the capacity to stop and sustain the weights used in the drillingprocess. When heavy loads are being lowered, a hydraulic or electric auxiliary brake assists the main brake toabsorb the great amount of energy developed by the mass of the traveling block, hook assembly, drill pipe, drillcollars and drill bit or casing being lowered into the well.
The rotating equipment from top to bottom consists of a top drive or a swivel, the kelly, and kelly bushing,the rotary table, drill pipe, drill collars and the drill bit. We refer to the equipment between the top drive or swiveland the drill bit as the drill stem. In a top drive system, the top drive hangs from a hook at the bottom of thetraveling block. The top drive has a passageway for drilling mud to get into the drill pipe, and it has a heavy-dutyelectric motor connected to a threaded drive shaft which connects to and rotates the drill pipe. In a kelly drivesystem, The swivel assembly sustains the weight of the drill stem, permits its rotation and affords a rotatingpressure seal and passageway for circulating drilling fluid into the top of the drill string. The swivel also has alarge handle that fits inside the hook assembly at the bottom of the traveling block. Drilling fluid enters the drillstem through a hose, called the rotary hose, attached to the side of the swivel. The kelly is a triangular, square orhexagonal piece of pipe, usually 40 feet long, that transmits torque from the rotary table to the drill stem andpermits its vertical movement as it is lowered into the hole. The bottom end of the kelly fits inside acorresponding triangular, square or hexagonal opening in a device called the kelly bushing. The kelly bushing, inturn, fits into a part of the rotary table called the master bushing. As the master bushing rotates, the kelly bushingalso rotates, turning the kelly, which rotates the drill pipe and thus the drill bit. Drilling fluid is pumped throughthe kelly on its way to the bottom. The rotary table, equipped with its master bushing and kelly bushing, suppliesthe necessary torque to turn the drill stem. The drill pipe and drill collars are both steel tubes through whichdrilling fluid can be pumped. Drill pipe, sometimes called drill string, comes in 30-foot sections, or joints, withthreaded sections on each end. Drill collars are heavier than drill pipe and are also threaded on the ends. Collarsare used on the bottom of the drill stem to apply weight to the drilling bit. At the end of the drill stem is the bit,which chews up the formation rock and dislodges it so that drilling fluid can circulate the fragmented materialback up to the surface where the circulating system filters it out of the fluid.
Drilling fluid, often called mud, is a mixture of clays, chemicals and water or oil, which is carefullyformulated for the particular well being drilled. Drilling mud accounts for a major portion of the cost incurredand equipment used in drilling a well. Bulk storage of drilling fluid materials, the pumps and the mud-mixingequipment are placed at the start of the circulating system. Working mud pits and reserve storage are at the otherend of the system. Between these two points, the circulating system includes auxiliary equipment for drillingfluid maintenance and equipment for well pressure control. Within the system, the drilling mud is typically
6

routed from the mud pits to the mud pump and from the mud pump through a standpipe and the rotary hose to thedrill stem. The drilling mud travels down the drill stem to the bit, up the annular space between the drill stem andthe borehole and through the blowout preventer stack to the return flow line. It then travels to a shale shaker forremoval of rock cuttings, and then back to the mud pits, which are usually steel tanks. The reserve pits, usuallyone or two fairly shallow excavations, are used for waste material and excess water around the location.
In a continuing effort to improve our rig fleet, we have installed top drives in 10 rigs, iron roughnecks in 37rigs, walking systems in one rig (with three other systems available for installation) and automatic catwalks intwo rigs.
There are numerous factors that differentiate land drilling rigs, including their power generation systems andtheir drilling depth capabilities. The actual drilling depth capability of a rig may be less than or more than itsrated depth capability due to numerous factors, including the size, weight and amount of the drill pipe on the rig.The intended well depth and the drill site conditions determine the amount of drill pipe and other equipmentneeded to drill a well. Generally, land rigs operate with crews of five to six persons.
Our drilling rig fleet consists of 70 rigs. Not included in our 70 drilling rig count is a 1500 horsepower rigthat we expect to be completed and available for operation in our North Dakota drilling division under a contractwith a three year term beginning March 2009. We own all the rigs in our fleet. With the recent decline in demandfor drilling services, as of February 23, 2009, we have 36 drilling rigs operating, 29 drilling rigs are idle and fivedrilling rigs located in our Oklahoma division have been placed in storage or “cold stacked” due to low demandfor drilling rigs in this region. We are actively marketing all our idle drilling rigs and we are earning revenues ontwo of these rigs through early termination fees on these drilling contracts with terms expiring in March 2009 andMay 2009.
The following table sets forth historical information regarding utilization for our drilling rig fleet:
YearEnded
December 31,
NineMonthsEnded
December 31, Years ended March 31,
2008 2007 2007 2006 2005 2004
Average number of operating rigs forthe period . . . . . . . . . . . . . . . . . . . . . . 67.4 66.7 60.8 52.3 40.1 27.3
Average utilization rate . . . . . . . . . . . . . 89% 89% 95% 95% 96% 88%
We believe that our drilling rigs and other related equipment are in good operating condition. Ouremployees perform periodic maintenance and minor repair work on our drilling rigs. We rely on various oilfieldservice companies for major repair work and overhaul of our drilling equipment when needed. We also engage inperiodic improvement of our drilling equipment. In the event of major breakdowns or mechanical problems, ourrigs could be subject to significant idle time and a resulting loss of revenue if the necessary repair services are notimmediately available.
As of February 6, 2009, we owned a fleet of 80 trucks and related transportation equipment that we use totransport our drilling rigs to and from drilling sites. By owning our own trucks, we reduce the cost of rig movesand reduce downtime between rig moves.
As a provider of contract land drilling services, our business and the profitability of our operations dependon the level of drilling activity by oil and gas exploration and production companies operating in the geographicmarkets where we operate. The oil and gas exploration and production industry is a historically cyclical industrycharacterized by significant changes in the levels of exploration and development activities. During periods ofreduced drilling activity or excess rig capacity, price competition tends to increase and the profitability ofdaywork contracts tends to decrease. In this competitive price environment, we may be more inclined to enterinto turnkey and footage contracts that expose us to greater risk of loss without commensurate increases inpotential contract profitability.
7

We obtain our contracts for drilling oil and gas wells either through competitive bidding or through directnegotiations with customers. Our drilling contracts generally provide for compensation on either a daywork,turnkey or footage basis. The contract terms we offer generally depend on the complexity and risk of operations,the on-site drilling conditions, the type of equipment used and the anticipated duration of the work to beperformed. Generally, our contracts provide for the drilling of a single well and typically permit the customer toterminate on short notice. However, we have entered into more longer-term drilling contracts during periods ofhigh rig demand. In addition, we generally construct new drilling rigs once we have entered into longer-termdrilling contracts for such rigs. As of February 6, 2009, we had 27 contracts with terms of six months to threeyears in duration, of which 18 will expire by August 6, 2009, six have a remaining term of six to 12 months, onehas a remaining term of 12 to 18 months and two have a remaining term in excess of 18 months.
The following table presents, by type of contract, information about the total number of wells we completedfor our customers during each of the last three fiscal years.
Type of Contract
YearEnded
December 31,2008
NineMonthsEnded
December 31,2007
YearEnded
March 31,2007
Daywork . . . . . . . . . . . . . . . . . . . . . . . . . . . . . . . . . . . . . . . . . 828 606 742Turnkey . . . . . . . . . . . . . . . . . . . . . . . . . . . . . . . . . . . . . . . . . 10 5 2Footage . . . . . . . . . . . . . . . . . . . . . . . . . . . . . . . . . . . . . . . . . . 71 66 60
Total number of wells . . . . . . . . . . . . . . . . . . . . . . . . . . 909 677 804
Daywork Contracts. Under daywork drilling contracts, we provide a drilling rig and required personnel toour customer who supervises the drilling of the well. We are paid based on a negotiated fixed rate per day whilethe rig is used. Daywork drilling contracts specify the equipment to be used, the size of the hole and the depth ofthe well. Under a daywork drilling contract, the customer bears a large portion of the out-of-pocket drilling costsand we generally bear no part of the usual risks associated with drilling, such as time delays and unanticipatedcosts.
Turnkey Contracts. Under a turnkey contract, we agree to drill a well for our customer to a specified depthand under specified conditions for a fixed price, regardless of the time required or the problems encountered indrilling the well. We provide technical expertise and engineering services, as well as most of the equipment anddrilling supplies required to drill the well. We often subcontract for related services, such as the provision ofcasing crews, cementing and well logging. Under typical turnkey drilling arrangements, we do not receiveprogress payments and are paid by our customer only after we have performed the terms of the drilling contractin full.
The risks to us under a turnkey contract are substantially greater than on a well drilled on a daywork basis.This is primarily because under a turnkey contract we assume most of the risks associated with drillingoperations generally assumed by the operator in a daywork contract, including the risk of blowout, loss of hole,stuck drill pipe, machinery breakdowns, abnormal drilling conditions and risks associated with subcontractors’services, supplies, cost escalations and personnel. We employ or contract for engineering expertise to analyzeseismic, geologic and drilling data to identify and reduce some of the drilling risks we assume. We use the resultsof this analysis to evaluate the risks of a proposed contract and seek to account for such risks in our bidpreparation. We believe that our operating experience, qualified drilling personnel, risk management program,internal engineering expertise and access to proficient third-party engineering contractors have allowed us toreduce some of the risks inherent in turnkey drilling operations. We also maintain insurance coverage againstsome, but not all, drilling hazards. However, the occurrence of uninsured or under-insured losses or operatingcost overruns on our turnkey jobs could have a material adverse effect on our financial position and results ofoperations.
8

Footage Contracts. Under footage contracts, we are paid a fixed amount for each foot drilled, regardless ofthe time required or the problems encountered in drilling the well. We typically pay more of the out-of-pocketcosts associated with footage contracts as compared to daywork contracts. Similar to a turnkey contract, the risksto us on a footage contract are greater because we assume most of the risks associated with drilling operationsgenerally assumed by the operator in a daywork contract, including loss of hole, stuck drill pipe, machinerybreakdowns, abnormal drilling conditions and risks associated with subcontractors’ services, supplies, costescalation and personnel. As with turnkey contracts, we manage this additional risk through the use ofengineering expertise and bid the footage contracts accordingly. However, the occurrence of uninsured or under-insured losses or operating cost overruns on our footage jobs could have a material adverse effect on ourfinancial position and results of operations.
Production Services Division
Well Services. We provide rig-based well services, including maintenance of existing wells, workover ofexisting wells, completion of newly-drilled wells, and plugging and abandonment of wells at the end of theiruseful lives.
Regular maintenance is generally required throughout the life of a well to sustain optimal levels of oil andgas production. We believe regular maintenance comprises the largest portion of our work in this businesssegment. Common maintenance services include repairing inoperable pumping equipment in an oil well andreplacing defective tubing in a gas well. Our maintenance services involve relatively low-cost, short-durationjobs which are part of normal well operating costs. The need for maintenance does not directly depend on thelevel of drilling activity, although it is somewhat impacted by short-term fluctuations in oil and gas prices.Accordingly, maintenance services generally experience relatively stable demand; however, when oil or gasprices are too low to justify additional expenditures, operating companies may choose to temporarily shut inproducing wells rather than incur additional maintenance costs.
In addition to periodic maintenance, producing oil and gas wells occasionally require major repairs ormodifications called workovers, which are typically more complex and more time consuming than maintenanceoperations. Workover services include extensions of existing wells to drain new formations either throughperforating the well casing to expose additional productive zones not previously produced, deepening well boresto new zones or the drilling of lateral well bores to improve reservoir drainage patterns. Our workover rigs arealso used to convert former producing wells to injection wells through which water or carbon dioxide is thenpumped into the formation for enhanced oil recovery operations. Workovers also include major subsurfacerepairs such as repair or replacement of well casing, recovery or replacement of tubing and removal of foreignobjects from the well bore. These extensive workover operations are normally performed by a workover rig withadditional specialized auxiliary equipment, which may include rotary drilling equipment, mud pumps, mud tanksand fishing tools, depending upon the particular type of workover operation. All of our well servicing rigs aredesigned to perform complex workover operations. A workover may require a few days to several weeks andgenerally requires additional auxiliary equipment. The demand for workover services is sensitive to oil and gasproducers’ intermediate and long-term expectations for oil and gas prices.
Completion services involve the preparation of newly drilled wells for production. The completion processmay involve selectively perforating the well casing in the productive zones to allow oil or gas to flow into thewell bore, stimulating and testing these zones and installing the production string and other downhole equipment.We provide well service rigs to assist in this completion process. Newly drilled wells are frequently completedby well servicing rigs to minimize the use of higher cost drilling rigs in the completion process. The completionprocess typically requires a few days to several weeks, depending on the nature and type of the completion, andgenerally requires additional auxiliary equipment. Accordingly, completion services require less well-to-wellmobilization of equipment and generally provide higher operating margins than regular maintenance work. Thedemand for completion services is directly related to drilling activity levels, which are sensitive to changes in oiland gas prices.
9

Well servicing rigs are also used in the process of permanently closing oil and gas wells no longer capableof producing in economic quantities. Many well operators bid this work on a “turnkey” basis, requiring theservice company to perform the entire job, including the sale or disposal of equipment salvaged from the well aspart of the compensation received, and complying with state regulatory requirements. Plugging and abandonmentwork can provide favorable operating margins and is less sensitive to oil and gas pricing than drilling andworkover activity since well operators must plug a well in accordance with state regulations when it is no longerproductive. We perform plugging and abandonment work throughout our core areas of operation in conjunctionwith equipment provided by other service companies.
When we provide well services, we typically bill customers on an hourly basis during the period that the rigproviding services is actively working. As of December 31, 2008, our fleet of well service rigs totaled 74 rigs.These rigs are located mostly in Texas, serving the Gulf Coast and ArkLaTex regions, though we also have fiverigs in Louisiana and four rigs in North Dakota. We estimate that approximately 20% of our rigs are located inpredominantly oil regions while 80% of our rigs are located in predominantly natural gas regions. Our fleet isone of the youngest in the industry, consisting primarily of premium, 550 HP rigs capable of working at depths of20,000 feet.
Wireline Services. We provide both open and cased-hole wireline services with our fleet of 59 wirelinetrucks. We provide these services in Texas, Kansas, Colorado, Utah, Montana, and North Dakota. Wirelineservices typically utilize a single truck equipped with a spool of wireline that is used to lower and raise a varietyof specialized tools in and out of the wellbore. These tools can be used to measure pressures and temperatures aswell as the condition of the casing and the cement that holds the casing in place. Other applications for wirelinetools include placing equipment in or retrieving equipment from the wellbore, or perforating the casing andcutting off pipe that is stuck in the well so that the free section can be recovered. Electric wireline contains aconduit that allows signals to be transmitted to or from tools located in the well. Wireline trucks are often used inplace of a well servicing rig when there is no requirement to remove tubulars from the well in order to makerepairs. Wireline trucks, like well servicing rigs, are utilized throughout the life of a well.
Fishing and Rental Services. Our rental and fishing tool business provides a range of specialized servicesand equipment that are utilized on a non-routine basis for both drilling and well servicing operations. Drilling andwell servicing rigs are equipped with a complement of tools to complete routine operations under normalconditions for most projects in the geographic area where they are employed. When downhole problems developwith drilling or servicing operations, or conditions require non-routine equipment, our customers will usually relyon a provider of rental and fishing tools to augment equipment that is provided with a typical drilling or wellservicing rig package. The important rental tools that we offer include air drilling equipment, foam units, powerswivels, and blowout preventers.
The term “fishing” applies to a wide variety of downhole operations designed to correct a problem that hasdeveloped when drilling or servicing a well. Often, the problem involves equipment that has become lodged inthe well and cannot be removed without special equipment. Our customers employ our technicians and our toolsthat are specifically suited to retrieve the trapped equipment, or “fish,” in order for operations to resume.
Our Production Services operations are impacted by seasonal factors. Our business can be negativelyimpacted during the winter months due to inclement weather, fewer daylight hours, and holidays. Because ourwell service rigs and wireline units are mobile, during periods of heavy snow, ice or rain, we may not be able tomove our equipment between locations.
10

Customers
We provide drilling services and production services to numerous major and independent oil and gascompanies that are active in the geographic areas in which we operate. The following table shows our threelargest customers as a percentage of our total revenue for each of our last three fiscal years.
Customer
TotalRevenue
Percentage
Fiscal Year Ended December 31, 2008:EOG Resources, Inc. . . . . . . . . . . . . . . . . . . . . . . . . . . . . . . . . . . . . . . . . . . . . . . . 10.0%Ecopetrol . . . . . . . . . . . . . . . . . . . . . . . . . . . . . . . . . . . . . . . . . . . . . . . . . . . . . . . . 7.4%Anadarko Petroleum Corporation . . . . . . . . . . . . . . . . . . . . . . . . . . . . . . . . . . . . . 6.4%
Nine Months Ended December 31, 2007:EOG Resources, Inc. . . . . . . . . . . . . . . . . . . . . . . . . . . . . . . . . . . . . . . . . . . . . . . . 13.1%Anadarko Petroleum Corporation . . . . . . . . . . . . . . . . . . . . . . . . . . . . . . . . . . . . . 8.8%Chesapeake Operating Inc. . . . . . . . . . . . . . . . . . . . . . . . . . . . . . . . . . . . . . . . . . . . 7.7%
Fiscal Year Ended March 31, 2007:EOG Resources, Inc. . . . . . . . . . . . . . . . . . . . . . . . . . . . . . . . . . . . . . . . . . . . . . . . 9.7%Chesapeake Operating Inc. . . . . . . . . . . . . . . . . . . . . . . . . . . . . . . . . . . . . . . . . . . . 9.1%Anadarko Petroleum Corporation . . . . . . . . . . . . . . . . . . . . . . . . . . . . . . . . . . . . . 6.1%
Competition
Drilling Services Division
We encounter substantial competition from other drilling contractors. Our primary market areas are highlyfragmented and competitive. The fact that drilling rigs are mobile and can be moved from one market to anotherin response to market conditions heightens the competition in the industry.
The drilling contracts we compete for are usually awarded on the basis of competitive bids. Our principalcompetitors are Helmerich & Payne, Inc., Precision Drilling Trust, Patterson-UTI Energy, Inc. and NaborsIndustries, Inc. In addition to pricing and rig availability, we believe the following factors are also important toour customers in determining which drilling contractors to select:
• the type and condition of each of the competing drilling rigs;
• the mobility and efficiency of the rigs;
• the quality of service and experience of the rig crews;
• the safety records of the rigs;
• the offering of ancillary services; and
• the ability to provide drilling equipment adaptable to, and personnel familiar with, new technologiesand drilling techniques.
While we must be competitive in our pricing, our competitive strategy generally emphasizes the quality ofour equipment, the safety record of our rigs and the experience of our rig crews to differentiate us from ourcompetitors.
11

Contract drilling companies compete primarily on a regional basis, and the intensity of competition mayvary significantly from region to region at any particular time. If demand for drilling services improves in aregion where we operate, our competitors might respond by moving in suitable rigs from other regions. An influxof rigs from other regions could rapidly intensify competition and make any improvement in demand for drillingrigs in a particular region short-lived.
Many of our competitors have greater financial, technical and other resources than we do. Their greatercapabilities in these areas may enable them to:
• better withstand industry downturns;
• compete more effectively on the basis of price and technology;
• better retain skilled rig personnel; and
• build new rigs or acquire and refurbish existing rigs so as to be able to place rigs into service morequickly than us in periods of high drilling demand.
Production Services Division
The market for production services is highly competitive. Competition is influenced by such factors asprice, capacity, availability of work crews, type and condition of equipment and reputation and experience of theservice provider. We believe that an important competitive factor in establishing and maintaining long-termcustomer relationships is having an experienced, skilled and well-trained work force. In recent years, many ofour larger customers have placed increased emphasis on the safety performance and quality of the crews,equipment and services provided by their contractors. We have devoted, and will continue to devote, substantialresources toward employee safety and training programs. Although we believe customers consider all of thesefactors, price is generally the primary factor in determining which service provider is awarded the work.However, we believe that most customers are willing to pay a slight premium for the quality and efficient servicewe provide.
The largest well service providers that we compete with are Key Energy Services, Basic Energy Services,Nabors Industries, Complete Production Services and CC Forbes. In addition, there are numerous smallercompanies that compete in our well service markets.
The wireline market is dominated by Schlumberger Ltd. and Halliburton Company. These companies have asubstantially larger asset base than Pioneer and operate in all major U.S. oil and natural gas producing basins.Other competitors include Weatherford International, Baker Atlas, Superior Energy Services, Basic EnergyServices, and Key Energy Services. The market for wireline services is very competitive, but historically we havecompeted effectively with our competitors based on performance and strong customer service.
The fishing and rental tools market is fragmented compared to our other product lines. Companies whichprovide fishing services generally compete based on the reputation of their fishing tool operators and theirrelationships with customers. Competition for rental tools is sometimes based on price; however, in most cases,when a customer chooses a specific fishing tool operator for a particular job, then the necessary rental equipmentwill be part of that job as well. Our primary competitors include: Baker Oil Tools, Weatherford International,Basic Energy Services, Key Energy Services, Quail Tools (owned by Parker Drilling) and Knight Oil Tools.
The need for well servicing, wireline, and fishing and rental services fluctuates, primarily, in relation to theprice (or anticipated price) of oil and natural gas, which, in turn, is driven by the supply of and demand for oiland natural gas. Generally, as supply of those commodities decreases and demand increases, service andmaintenance requirements increase as oil and natural gas producers attempt to maximize the productivity of theirwells in a higher priced environment.
12

The level of our revenues, earnings and cash flows are substantially dependent upon, and affected by, thelevel of domestic and international oil and gas exploration and development activity, as well as the equipmentcapacity in any particular region. For a more detailed discussion, see Item 7. “Management’s Discussion andAnalysis of Financial Condition and Results of Operations.”
Raw Materials
The materials and supplies we use in our drilling and production services operations include fuels to operateour drilling and well service equipment, drilling mud, drill pipe, drill collars, drill bits and cement. We do notrely on a single source of supply for any of these items. While we are not currently experiencing any shortages,from time to time there have been shortages of drilling equipment and supplies during periods of high demand.Shortages could result in increased prices for drilling equipment or supplies that we may be unable to pass on tocustomers. In addition, during periods of shortages, the delivery times for equipment and supplies can besubstantially longer. Any significant delays in our obtaining drilling equipment or supplies could limit drillingoperations and jeopardize our relations with customers. In addition, shortages of drilling equipment or suppliescould delay and adversely affect our ability to obtain new contracts for our rigs, which could have a materialadverse effect on our financial condition and results of operations.
Operating Risks and Insurance
Our operations are subject to the many hazards inherent in the contract land drilling business, including therisks of:
• blowouts;
• fires and explosions;
• loss of well control;
• collapse of the borehole;
• lost or stuck drill strings; and
• damage or loss from natural disasters.
Any of these hazards can result in substantial liabilities or losses to us from, among other things:
• suspension of drilling operations;
• damage to, or destruction of, our property and equipment and that of others;
• personal injury and loss of life;
• damage to producing or potentially productive oil and gas formations through which we drill; and
• environmental damage.
We seek to protect ourselves from some but not all operating hazards through insurance coverage. However,some risks are either not insurable or insurance is available only at rates that we consider uneconomical. Thoserisks include pollution liability in excess of relatively low limits. Depending on competitive conditions and otherfactors, we attempt to obtain contractual protection against uninsured operating risks from our customers.However, customers who provide contractual indemnification protection may not in all cases maintain adequateinsurance to support their indemnification obligations. We can offer no assurance that our insurance orindemnification arrangements will adequately protect us against liability or loss from all the hazards of ouroperations. The occurrence of a significant event that we have not fully insured or indemnified against or thefailure of a customer to meet its indemnification obligations to us could materially and adversely affect ourresults of operations and financial condition. Furthermore, we may not be able to maintain adequate insurance inthe future at rates we consider reasonable.
13

Our current insurance coverage includes property insurance on our rigs, drilling equipment and realproperty. Our insurance coverage for property damage to our rigs and to our drilling equipment is based on ourestimates of the cost of comparable used equipment to replace the insured property. The policy provides for adeductible on rigs of $250,000 per occurrence ($500,000 deductible for rigs with an insured value greater than$10 million). Our third-party liability insurance coverage is $51 million per occurrence and in the aggregate, witha deductible of $260,000 per occurrence. We believe that we are adequately insured for public liability andproperty damage to others with respect to our operations. However, such insurance may not be sufficient toprotect us against liability for all consequences of well disasters, extensive fire damage or damage to theenvironment.
In addition, we generally carry insurance coverage to protect against certain hazards inherent in our turnkeycontract drilling operations. This insurance covers “control-of-well,” including blowouts above and below thesurface, redrilling, seepage and pollution. This policy provides coverage of $3 million, $5 million, $10 million,$15 million or $20 million depending on the area in which the well is drilled and its target depth, subject to adeductible of the greater of 15% of the well’s anticipated dry hole cost or $150,000. This policy also providescare, custody and control insurance, with a limit of $1 million, subject to a $100,000 deductible.
Employees
We currently have approximately 1,952 employees. Approximately 247 of these employees are salariedadministrative or supervisory employees. The rest of our employees are hourly employees working in operationsfor our Drilling Services Division and Production Services Division. The number of hourly employees fluctuatesdepending on the utilization of our drilling rigs, workover rigs and wireline units at any particular time. None ofour employment arrangements are subject to collective bargaining arrangements.
Our operations require the services of employees having the technical training and experience necessary toobtain proper operational standards. As a result, our operations depend, to a considerable extent, on thecontinuing availability of such personnel. Although we have not encountered material difficulty in hiring andretaining employees in our operations, shortages of qualified personnel have occurred in our industry. If weshould suffer any material loss of personnel to competitors or be unable to employ additional or replacementpersonnel with the requisite level of training and experience to adequately operate our equipment, our operationscould be materially and adversely affected. While we believe our wage rates are competitive and ourrelationships with our employees are satisfactory, a significant increase in the wages paid by other employerscould result in a reduction in our workforce, increases in wage rates, or both. The occurrence of either of theseevents for a significant period of time could have a material and adverse effect on our financial condition andresults of operations.
Facilities
Our corporate office facilities are located at 1250 N.E. Loop 410, Suite 1000 San Antonio, Texas 78209 andare leased with costs escalating from $26,809 per month to $29,316 per month with a non-cancelable lease termexpiring in December 2013. We conduct our business operations through 40 real estate locations in the UnitedStates (Texas, Oklahoma, Colorado, Utah, North Dakota and Kansas) and internationally in Colombia. These realestate locations are primarily used for division offices and storage and maintenance yards. We own 10 of thesereal estate locations and the remaining 30 real estate locations are leased with costs ranging from $175 per monthto $8,917 per month with non-cancelable lease terms expiring through April 2013.
Governmental Regulation
Our operations are subject to stringent laws and regulations relating to containment, disposal and controllingthe discharge of hazardous oilfield waste and other non-hazardous waste material into the environment, requiringremoval and cleanup under certain circumstances, or otherwise relating to the protection of the environment. Inaddition, our operations are often conducted in or near ecologically sensitive areas, such as wetlands, which are
14

subject to special protective measures and which may expose us to additional operating costs and liabilities foraccidental discharges of oil, natural gas, drilling fluids or contaminated water, or for noncompliance with otheraspects of applicable laws. We are also subject to the requirements of the federal Occupational Safety and HealthAct (“OSHA”) and comparable state statutes. The OSHA hazard communication standard, the EnvironmentalProtection Agency “community right-to-know” regulations under Title III of the Federal Superfund Amendmentand Reauthorization Act and comparable state statutes require us to organize and report information about thehazardous materials we use in our operations to employees, state and local government authorities and localcitizens.
Environmental laws and regulations are complex and subject to frequent change. In some cases, they canimpose liability for the entire cost of cleanup on any responsible party, without regard to negligence or fault, andcan impose liability on us for the conduct of others or conditions others have caused, or for our acts thatcomplied with all applicable requirements when we performed them. We may also be exposed to environmentalor other liabilities originating from businesses and assets that we purchased from others. Compliance withapplicable environmental laws and regulations has not, to date, materially affected our capital expenditures,earnings or competitive position, although compliance measures have added to our costs of operating drillingequipment in some instances. We do not expect to incur material capital expenditures in our next fiscal year inorder to comply with current environment control regulations. However, our compliance with amended, new ormore stringent requirements, stricter interpretations of existing requirements or the future discovery ofcontamination may require us to make material expenditures or subject us to liabilities that we currently do notanticipate.
In addition, our business depends on the demand for land drilling services from the oil and gas industry and,therefore, is affected by tax, environmental and other laws relating to the oil and gas industry generally, bychanges in those laws and by changes in related administrative regulations. It is possible that these laws andregulations may in the future add significantly to our operating costs or those of our customers, or otherwisedirectly or indirectly affect our operations.
Our wireline operations involve the use of radioactive isotopes along with other nuclear, electrical, acoustic,and mechanical devices. Our activities involving the use of isotopes are regulated by the U.S. Nuclear RegulatoryCommission and specified agencies of certain states. Additionally, we use high explosive charges for perforatingcasing and formations, and we use various explosive cutters to assist in wellbore cleanout. Such operations areregulated by the U.S. Department of Justice, Bureau of Alcohol, Tobacco, Firearms, and Explosives and requireus to obtain licenses or other approvals for the use of densitometers as well as explosive charges. We haveobtained these licenses and approvals when necessary and believe that we are in substantial compliance withthese federal requirements.
Among the services we provide, we operate as a motor carrier and therefore are subject to regulation by theU.S. Department of Transportation and by various state agencies. These regulatory authorities exercise broadpowers, governing activities such as the authorization to engage in motor carrier operations and regulatory safety.There are additional regulations specifically relating to the trucking industry, including testing and specificationof equipment and product handling requirements. The trucking industry is subject to possible regulatory andlegislative changes that may affect the economics of the industry by requiring changes in operating practices orby changing the demand for common or contract carrier services or the cost of providing truckload services.Some of these possible changes include increasingly stringent environmental regulations, changes in the hours ofservice regulations which govern the amount of time a driver may drive in any specific period, onboard black boxrecorder devices or limits on vehicle weight and size.
Interstate motor carrier operations are subject to safety requirements prescribed by the U.S. Department ofTransportation. To a large degree, intrastate motor carrier operations are subject to state safety regulations thatmirror federal regulations. Such matters as weight and dimension of equipment are also subject to federal andstate regulations.
15

From time to time, various legislative proposals are introduced, including proposals to increase federal,state, or local taxes, including taxes on motor fuels, which may increase our costs or adversely impact therecruitment of drivers. We cannot predict whether, or in what form, any increase in such taxes applicable to uswill be enacted.
Available Information
Our Web site address is www.pioneerdrlg.com. Our annual reports on Form 10-K, quarterly reports on Form10-Q, current reports on Form 8-K and amendments to those reports, are available free of charge through ourWebsite as soon as reasonably practicable after we electronically file those materials with, or furnish thosematerials to, the Securities and Exchange Commission. The public may read and copy these materials at theSecurities and Exchange Commission’s Public Reference Room at 100 F Street, N.E., Washington, DC 20549.For additional information on the Securities and Exchange Commission’s Public Reference Room, please call1-800-SEC-0330. In addition, the Securities and Exchange Commission maintains an Internet site atwww.sec.gov that contains reports, proxy and information statements and other information regarding issuers thatfile electronically. We have also posted on our Web site our: Charters for the Audit, Compensation, andNominating and Corporate Governance Committees of our Board; Code of Conduct and Ethics; Rules ofConduct; and Company Contact Information.
16

Item 1A. Risk Factors
The information set forth in this Item 1A should be read in conjunction with the rest of the informationincluded in this report, including “Management’s Discussion and Analysis of Financial Condition and Results ofOperations” in Item 7 the historical financial statements and related notes this report contains. While we attemptto identify, manage and mitigate risks and uncertainties associated with our business to the extent practical underthe circumstances, some level of risk and uncertainty will always be present. Additional risks and uncertaintiesnot presently known to us or that we currently believe are immaterial also may negatively impact our business,financial condition or operating results.
Set forth below are various risks and uncertainties that could adversely impact our business, financialcondition, results of operations and cash flows.
Risks Relating to the Oil and Gas Industry
We derive all our revenues from companies in the oil and gas exploration and production industry, ahistorically cyclical industry with levels of activity that are significantly affected by the levels and volatility ofoil and gas prices.
As a provider of contract land drilling services and oil and gas production services, our business depends onthe level of exploration and production activity by oil and gas companies operating in the geographic marketswhere we operate. The oil and gas exploration and production industry is a historically cyclical industrycharacterized by significant changes in the levels of exploration and development activities. Oil and gas prices,and market expectations of potential changes in those prices, significantly affect the levels of those activities.Worldwide political, economic, and military events as well as natural disasters have contributed to oil and gasprice volatility and are likely to continue to do so in the future. Any prolonged reduction in the overall level ofexploration and development activities, whether resulting from changes in oil and gas prices or otherwise, couldmaterially and adversely affect us in many ways by negatively impacting:
• our revenues, cash flows and profitability;
• the fair market value of our drilling rig fleet and production service assets;
• our ability to maintain or increase our borrowing capacity;
• our ability to obtain additional capital to finance our business and make acquisitions, and the cost ofthat capital; and
• our ability to retain skilled rig personnel whom we would need in the event of an upturn in the demandfor our services.
Depending on the market prices of oil and gas, oil and gas exploration and production companies maycancel or curtail their drilling programs and may lower production spending on existing wells, thereby reducingdemand for our services. Oil and gas prices have been volatile historically and, we believe, will continue to be soin the future. Many factors beyond our control affect oil and gas prices, including:
• the cost of exploring for, producing and delivering oil and gas;
• the discovery rate of new oil and gas reserves;
• the rate of decline of existing and new oil and gas reserves;
• available pipeline and other oil and gas transportation capacity;
• the ability of oil and gas companies to raise capital;
• economic conditions in the United States and elsewhere;
• actions by OPEC, the Organization of Petroleum Exporting Countries;
17

• political instability in the Middle East and other major oil and gas producing regions;
• governmental regulations, both domestic and foreign;
• domestic and foreign tax policy;
• weather conditions in the United States and elsewhere;
• the pace adopted by foreign governments for the exploration, development and production of theirnational reserves;
• the price of foreign imports of oil and gas; and
• the overall supply and demand for oil and gas.
As a result of recent declines in oil and natural gas prices and substantial uncertainty in the capital marketsdue to the deteriorating global economic environment, our customers have reduced spending on explorationand production and this has resulted in a decrease in demand for our services. We are unable to determinewhether customers and/or vendors and suppliers will be able to access financing necessary to sustain theircurrent level of operations, fulfill their commitments and/or fund future operations and obligations. Thedeteriorating global economic environment may impact industry fundamentals, and the potential resultingdecrease in demand for drilling and production services could adversely affect our business.
Oil and natural gas prices, and market expectations of potential changes in these prices, significantly impactthe level of worldwide drilling and production services activities. Oil and natural gas prices have declinedsignificantly during recent months in a deteriorating global economic environment. This decline in oil and naturalgas prices, as well as the current crisis in the global credit markets, have caused exploration and productioncompanies to reduce their overall level of drilling and production services activity and spending. When drillingand production activity and spending declines, both day rates and utilization have historically declined. As aresult, the recent declines in oil and natural gas prices and the global economic crisis could materially andadversely affect our business and financial results.
Moreover, the deteriorating global economic environment may impact fundamentals that are critical to ourindustry, such as the global demand for, and consumption of, oil and natural gas. Reduced demand for oil andnatural gas generally results in lower prices for these commodities and may impact the economics of planneddrilling projects and ongoing production projects, resulting in the curtailment, reduction, delay or postponementof such projects for an indeterminate period of time. Companies that planned to finance exploration, developmentor production projects through the capital markets may be forced to curtail, reduce, postpone or delay drilling orproduction services activities, and also may experience inability to pay suppliers. The deteriorating globaleconomic environment could also impact our vendors and suppliers’ ability to meet obligations to providematerials and services in general. If any of the foregoing were to occur, it could have a material adverse effect onour business and financial results.
Risks Relating to Our Business
Reduced demand for or excess capacity of drilling services or production services could adversely affect ourprofitability.
Our profitability in the future will depend on many factors, but largely on pricing and utilization rates forour drilling and production services. A reduction in the demand for drilling rigs or an increase in the supply ofdrilling rigs, whether through new construction or refurbishment, could decrease the dayrates and utilization ratesfor our drilling services, which would adversely affect our revenues and profitability. An increase in supply ofwell service rigs, wireline units and fishing and rental tools equipment, without a corresponding increase indemand, could similarly decrease the pricing and utilization rates of our production services, which wouldadversely affect our revenues and profitability.
18

We operate in a highly competitive, fragmented industry in which price competition could reduce ourprofitability.
We encounter substantial competition from other drilling contractors and other oilfield service companies.Our primary market areas are highly fragmented and competitive. The fact that drilling, workover and well-servicing rigs are mobile and can be moved from one market to another in response to market conditionsheightens the competition in the industry and may result in an oversupply of rigs in an area. Contract drillingcompanies and other oilfield service companies compete primarily on a regional basis, and the intensity ofcompetition may vary significantly from region to region at any particular time. If demand for drilling orproduction services improves in a region where we operate, our competitors might respond by moving in suitablerigs from other regions. An influx of rigs from other regions could rapidly intensify competition, reduceprofitability and make any improvement in demand for drilling or production services short-lived.
Most drilling services contracts and production services contracts are awarded on the basis of competitivebids, which also results in price competition. In addition to pricing and rig availability, we believe the followingfactors are also important to our customers in determining which drilling services or production services providerto select:
• the type and condition of each of the competing drilling, workover and well-servicing rigs;
• the mobility and efficiency of the rigs;
• the quality of service and experience of the rig crews;
• the safety records of the rigs;
• the offering of ancillary services; and
• the ability to provide drilling and production equipment adaptable to, and personnel familiar with, newtechnologies and drilling and production techniques.
While we must be competitive in our pricing, our competitive strategy generally emphasizes the quality ofour equipment, the safety record of our rigs, our ability to offer ancillary services and the quality of service andexperience of our rig crews to differentiate us from our competitors. This strategy is less effective as lowerdemand for drilling and production services or an oversupply of drilling, workover and well-servicing rigsintensifies price competition and makes it more difficult for us to compete on the basis of factors other than price.In all of the markets in which we compete, an oversupply of rigs can cause greater price competition, which canreduce our profitability.
We face competition from many competitors with greater resources.
Many of our competitors have greater financial, technical and other resources than we do. Their greatercapabilities in these areas may enable them to:
• better withstand industry downturns;
• compete more effectively on the basis of price and technology;
• retain skilled rig personnel; and
• build new rigs or acquire and refurbish existing rigs so as to be able to place rigs into service morequickly than us in periods of high drilling demand.
Unexpected cost overruns on our turnkey drilling jobs and our footage contracts could adversely affect ourfinancial position and our results of operations.
We have historically derived a portion of our revenues from turnkey drilling contracts, and turnkey contractsmay represent a component of our future revenues. The occurrence of uninsured or under-insured losses oroperating cost overruns on our turnkey jobs could have a material adverse effect on our financial position and
19

results of operations. Under a typical turnkey drilling contract, we agree to drill a well for our customer to aspecified depth and under specified conditions for a fixed price. We provide technical expertise and engineeringservices, as well as most of the equipment and drilling supplies required to drill the well. We often subcontractfor related services, such as the provision of casing crews, cementing and well logging. Under typical turnkeydrilling arrangements, we do not receive progress payments and are paid by our customer only after we haveperformed the terms of the drilling contract in full. For these reasons, the risk to us under a turnkey drillingcontract is substantially greater than for a well drilled on a daywork basis because we must assume most of therisks associated with drilling operations that the operator generally assumes under a daywork contract, includingthe risks of blowout, loss of hole, stuck drill pipe, machinery breakdowns, abnormal drilling conditions and risksassociated with subcontractors’ services, supplies, cost escalations and personnel. Similar to our turnkeycontracts, under a footage contract we assume most of the risks associated with drilling operations that theoperator generally assumes under a daywork contract.
Although we attempt to obtain insurance coverage to reduce certain of the risks inherent in our turnkeydrilling operations, adequate coverage may be unavailable in the future and we might have to bear the full cost ofsuch risks, which could have an adverse effect on our financial condition and results of operations.
Our operations involve operating hazards, which, if not insured or indemnified against, could adversely affectour results of operations and financial condition.
Our operations are subject to the many hazards inherent in the drilling, workover and well-servicingindustries, including the risks of:
• blowouts;
• cratering;
• fires and explosions;
• loss of well control;
• collapse of the borehole;
• damaged or lost drilling equipment; and
• damage or loss from natural disasters.
Any of these hazards can result in substantial liabilities or losses to us from, among other things:
• suspension of operations;
• damage to, or destruction of, our property and equipment and that of others;
• personal injury and loss of life;
• damage to producing or potentially productive oil and gas formations through which we drill; and
• environmental damage.
We seek to protect ourselves from some but not all operating hazards through insurance coverage. However,some risks are either not insurable or insurance is available only at rates that we consider uneconomical. Thoserisks include pollution liability in excess of relatively low limits. Depending on competitive conditions and otherfactors, we attempt to obtain contractual protection against uninsured operating risks from our customers.However, customers who provide contractual indemnification protection may not in all cases maintain adequateinsurance to support their indemnification obligations. Our insurance or indemnification arrangements may notadequately protect us against liability or loss from all the hazards of our operations. The occurrence of asignificant event that we have not fully insured or indemnified against or the failure of a customer to meet itsindemnification obligations to us could materially and adversely affect our results of operations and financialcondition. Furthermore, we may be unable to maintain adequate insurance in the future at rates we considerreasonable.
20

We face increased exposure to operating difficulties because we primarily focus on providing drilling andproduction services for natural gas.
Most of our drilling and production contracts are with exploration and production companies in search ofnatural gas. Drilling on land for natural gas generally occurs at deeper drilling depths than drilling for oil.Although deep-depth drilling and production services expose us to risks similar to risks encountered in shallow-depth drilling and production services, the magnitude of the risk for deep-depth drilling and production servicesis greater because of the higher costs and greater complexities involved in providing drilling and productionservices for deep wells. We generally do not insure risks related to operating difficulties other than blowouts. Ifwe do not adequately insure the increased risk from blowouts or if our contractual indemnification rights areinsufficient or unfulfilled, our profitability and other results of operations and our financial condition could beadversely affected in the event we encounter blowouts or other significant operating difficulties while providingdrilling or production services at deeper depths.
Our current primary focus on drilling for customers in search of natural gas could place us at a competitivedisadvantage if we were to change our primary focus to drilling for customers in search of oil.
Our drilling rig fleet consists of rigs capable of drilling on land at drilling depths of 6,000 to 18,000 feetbecause most of our contracts are with customers drilling in search of natural gas, which generally occurs atdeeper drilling depths than drilling in search of oil, which often occurs at drilling depths less than 6,000 feet.Generally, larger drilling rigs capable of deep drilling generally incur higher mobilization costs than smallerdrilling rigs drilling at shallower depths. If our primary focus shifts from drilling for customers in search ofnatural gas to drilling for customers in search of oil, the majority of our rig fleet would be disadvantaged incompeting for new oil drilling projects as compared to competitors that primarily use shallower drilling depthrigs when drilling in search of oil.
We could be adversely affected if shortages of equipment, supplies or personnel occur.
From time to time there have been shortages of drilling and production services equipment and suppliesduring periods of high demand which we believe could recur. Shortages could result in increased prices fordrilling and production services equipment or supplies that we may be unable to pass on to customers. Inaddition, during periods of shortages, the delivery times for equipment and supplies can be substantially longer.Any significant delays in our obtaining drilling and production services equipment or supplies could limit drillingand production services operations and jeopardize our relations with customers. In addition, shortages of drillingand production services equipment or supplies could delay and adversely affect our ability to obtain newcontracts for our rigs, which could have a material adverse effect on our financial condition and results ofoperations.
Our strategy of constructing drilling rigs during periods of peak demand requires that we maintain anadequate supply of drilling rig components to complete our rig building program. Our suppliers may be unable tocontinue providing us the needed drilling rig components if their manufacturing sources are unable to fulfill theircommitments.
Our operations require the services of employees having the technical training and experience necessary toobtain the proper operational results. As a result, our operations depend, to a considerable extent, on thecontinuing availability of such personnel. Shortages of qualified personnel are occurring in our industry. If weshould suffer any material loss of personnel to competitors or be unable to employ additional or replacementpersonnel with the requisite level of training and experience to adequately operate our equipment, our operationscould be materially and adversely affected. A significant increase in the wages paid by other employers couldresult in a reduction in our workforce, increases in wage rates, or both. The occurrence of either of these eventsfor a significant period of time could have a material and adverse effect on our financial condition and results ofoperations.
21

Our acquisition strategy exposes us to various risks, including those relating to difficulties in identifyingsuitable acquisition opportunities and integrating businesses, assets and personnel, as well as difficulties inobtaining financing for targeted acquisitions and the potential for increased leverage or debt servicerequirements.
As a key component of our business strategy, we have pursued and intend to continue to pursue acquisitionsof complementary assets and businesses. For example, since March 31, 2003, our drilling rig fleet has increasedfrom 24 to 70 drilling rigs, as a result of acquisitions and rig construction. In addition, during the first quarter of2008, we completed the acquisition of the production services businesses of WEDGE and Competition.
Our acquisition strategy in general, and our recent acquisitions in particular, involve numerous inherentrisks, including:
• unanticipated costs and assumption of liabilities and exposure to unforeseen liabilities of acquiredbusinesses, including environmental liabilities;
• difficulties in integrating the operations and assets of the acquired business and the acquired personnel;
• limitations on our ability to properly assess and maintain an effective internal control environment overan acquired business in order to comply with applicable periodic reporting requirements;
• potential losses of key employees and customers of the acquired businesses;
• risks of entering markets in which we have limited prior experience; and
• increases in our expenses and working capital requirements.
The process of integrating an acquired business may involve unforeseen costs and delays or otheroperational, technical and financial difficulties that may require a disproportionate amount of managementattention and financial and other resources. Possible future acquisitions may be for purchase prices significantlyhigher than those we paid for previous acquisitions. Our failure to achieve consolidation savings, to incorporatethe acquired businesses and assets into our existing operations successfully or to minimize any unforeseenoperational difficulties could have a material adverse effect on our financial condition and results of operations.
In addition, we may not have sufficient capital resources to complete additional acquisitions. Historically,we have funded the growth of our rig fleet through a combination of debt and equity financing. We may incursubstantial additional indebtedness to finance future acquisitions and also may issue equity securities orconvertible securities in connection with such acquisitions. Debt service requirements could represent asignificant burden on our results of operations and financial condition and the issuance of additional equity orconvertible securities could be dilutive to our existing shareholders. Furthermore, we may not be able to obtainadditional financing on satisfactory terms.
Even if we have access to the necessary capital, we may be unable to continue to identify additional suitableacquisition opportunities, negotiate acceptable terms or successfully acquire identified targets.
Our indebtedness could restrict our operations and make us more vulnerable to adverse economic conditions.
For several years we have had little or no long-term debt. In connection with the acquisition of theproduction services businesses of WEDGE and Competition, we entered into a new $400 million, five-year,senior secured revolving credit facility. As of December 31, 2008, our total debt was approximately $272.5million.
Our current and future indebtedness could have important consequences, including:
• impairing our ability to make investments and obtain additional financing for working capital, capitalexpenditures, acquisitions or other general corporate purposes;
• limiting our ability to use operating cash flow in other areas of our business because we must dedicatea substantial portion of these funds to make principal and interest payments on our indebtedness;
22

• making us more vulnerable to a downturn in our business, our industry or the economy in general as asubstantial portion of our operating cash flow could be required to make principal and interestpayments on our indebtedness, making it more difficult to react to changes in our business and inindustry and market conditions;
• limiting our ability to obtain additional financing that may be necessary to operate or expand ourbusiness;
• putting us at a competitive disadvantage to competitors that have less debt; and
• increasing our vulnerability to rising interest rates.
We anticipate that our cash generated by operations and our ability to borrow under the currently unusedportion of our senior secured revolving credit facility should allow us to meet our routine financial obligationsfor the foreseeable future. However, our ability to make payments on our indebtedness, and to fund plannedcapital expenditures, will depend on our ability to generate cash in the future. This, to a certain extent, is subjectto conditions in the oil and gas industry, general economic and financial conditions, competition in the marketswhere we operate, the impact of legislative and regulatory actions on how we conduct our business and otherfactors, all of which are beyond our control. If our business does not generate sufficient cash flow fromoperations to service our outstanding indebtedness, we may have to undertake alternative financing plans, suchas:
• refinancing or restructuring our debt;
• selling assets;
• reducing or delaying acquisitions or capital investments, such as refurbishments of our rigs and relatedequipment; or
• seeking to raise additional capital.
However, we may be unable to implement alternative financing plans, if necessary, on commerciallyreasonable terms or at all, and any such alternative financing plans might be insufficient to allow us to meet ourdebt obligations. If we are unable to generate sufficient cash flow or are otherwise unable to obtain the fundsrequired to make principal and interest payments on our indebtedness, or if we otherwise fail to comply with thevarious covenants in our senior secured revolving credit facility or other instruments governing any futureindebtedness, we could be in default under the terms of our senior secured revolving credit facility or suchinstruments. In the event of a default, the Lenders under our senior secured revolving credit facility could elect todeclare all the loans made under such facility to be due and payable together with accrued and unpaid interest andterminate their commitments thereunder and we or one or more of our subsidiaries could be forced intobankruptcy or liquidation. Any of the foregoing consequences could materially and adversely affect our business,financial condition, results of operations and prospects.
Our senior secured revolving credit facility imposes restrictions on us that may affect our ability tosuccessfully operate our business.
Our senior secured revolving credit facility limits our ability to take various actions, such as:
• limitations on the incurrence of additional indebtedness;
• restrictions on investments, mergers or consolidations, asset dispositions, acquisitions, transactionswith affiliates and other transactions without the lenders’ consent; and
• limitation on dividends and distributions.
In addition, our senior secured revolving credit facility requires us to maintain certain financial ratios and tosatisfy certain financial conditions, which may require us to reduce our debt or take some other action in order tocomply with them. The failure to comply with any of these financial conditions, such as financial ratios or
23

covenants, would cause an event of default under our senior secured revolving credit facility. An event of default,if not waived, could result in acceleration of the outstanding indebtedness under our senior secured revolvingcredit facility, in which case the debt would become immediately due and payable. If this occurs, we may not beable to pay our debt or borrow sufficient funds to refinance it. Even if new financing is available, it may not beavailable on terms that are acceptable to us. These restrictions could also limit our ability to obtain futurefinancings, make needed capital expenditures, withstand a downturn in our business or the economy in general,or otherwise conduct necessary corporate activities. We also may be prevented from taking advantage of businessopportunities that arise because of the limitations imposed on us by the restrictive covenants under our seniorsecured revolving credit facility.
Our international operations are subject to political, economic and other uncertainties not encountered in ourdomestic operations.
As we continue to implement our strategy of expanding into areas outside the United States, ourinternational operations will be subject to political, economic and other uncertainties not generally encounteredin our U.S. operations. These will include, among potential others:
• risks of war, terrorism, civil unrest and kidnapping of employees;
• expropriation, confiscation or nationalization of our assets;
• renegotiation or nullification of contracts;
• foreign taxation;
• the inability to repatriate earnings or capital due to laws limiting the right and ability of foreignsubsidiaries to pay dividends and remit earnings to affiliated companies;
• changing political conditions and changing laws and policies affecting trade and investment;
• regional economic downturns;
• the overlap of different tax structures;
• the burden of complying with multiple and potentially conflicting laws;
• the risks associated with the assertion of foreign sovereignty over areas in which our operations areconducted;
• difficulty in collecting international accounts receivable; and
• potentially longer payment cycles.
Our international operations may also face the additional risks of fluctuating currency values, hard currencyshortages and controls of foreign currency exchange. Additionally, in some jurisdictions, we may be subject toforeign governmental regulations favoring or requiring the awarding of contracts to local contractors or requiringforeign contractors to employ citizens of, or purchase supplies from, a particular jurisdiction. These regulationscould adversely affect our ability to compete.
Our operations are subject to various laws and governmental regulations that could restrict our futureoperations and increase our operating costs.
Many aspects of our operations are subject to various federal, state and local laws and governmentalregulations, including laws and regulations governing:
• environmental quality;
• pollution control;
• remediation of contamination;
24

• preservation of natural resources;
• transportation, and
• worker safety.
Our operations are subject to stringent federal, state and local laws, rules and regulations governing theprotection of the environment and human health and safety. Some of those laws, rules and regulations relate tothe disposal of hazardous substances, oilfield waste and other waste materials and restrict the types, quantitiesand concentrations of those substances that can be released into the environment. Several of those laws alsorequire removal and remedial action and other cleanup under certain circumstances, commonly regardless offault. Our operations routinely involve the handling of significant amounts of waste materials, some of which areclassified as hazardous substances. Planning, implementation and maintenance of protective measures arerequired to prevent accidental discharges. Spills of oil, natural gas liquids, drilling fluids and other substancesmay subject us to penalties and cleanup requirements. Handling, storage and disposal of both hazardous andnon-hazardous wastes are also subject to these regulatory requirements. In addition, our operations are oftenconducted in or near ecologically sensitive areas, such as wetlands, which are subject to special protectivemeasures and which may expose us to additional operating costs and liabilities for accidental discharges of oil,gas, drilling fluids, contaminated water or other substances, or for noncompliance with other aspects ofapplicable laws and regulations.
The federal Clean Water Act, as amended by the Oil Pollution Act, the federal Clean Air Act, the federalResource Conservation and Recovery Act, the federal Comprehensive Environmental Response, Compensation,and Liability Act, or CERCLA, the Safe Drinking Water Act, the Occupational Safety and Health Act, or OSHA,and their state counterparts and similar statutes are the primary statutes that impose the requirements describedabove and provide for civil, criminal and administrative penalties and other sanctions for violation of theirrequirements. The OSHA hazard communication standard, the Environmental Protection Agency “communityright-to-know” regulations under Title III of the federal Superfund Amendment and Reauthorization Act andcomparable state statutes require us to organize and report information about the hazardous materials we use inour operations to employees, state and local government authorities and local citizens. In addition, CERCLA,also known as the “Superfund” law, and similar state statutes impose strict liability, without regard to fault or thelegality of the original conduct, on certain classes of persons who are considered responsible for the release orthreatened release of hazardous substances into the environment. These persons include the current owner oroperator of a facility where a release has occurred, the owner or operator of a facility at the time a releaseoccurred, and companies that disposed of or arranged for the disposal of hazardous substances found at aparticular site. This liability may be joint and several. Such liability, which may be imposed for the conduct ofothers and for conditions others have caused, includes the cost of removal and remedial action as well asdamages to natural resources. Few defenses exist to the liability imposed by environmental laws and regulations.It is also common for third parties to file claims for personal injury and property damage caused by substancesreleased into the environment.
Environmental laws and regulations are complex and subject to frequent change. Failure to comply withgovernmental requirements or inadequate cooperation with governmental authorities could subject a responsibleparty to administrative, civil or criminal action. We may also be exposed to environmental or other liabilitiesoriginating from businesses and assets which we acquired from others. Our compliance with amended, new ormore stringent requirements, stricter interpretations of existing requirements or the future discovery ofcontamination or regulatory noncompliance may require us to make material expenditures or subject us toliabilities that we currently do not anticipate.
In addition, our business depends on the demand for land drilling and production services from the oil andgas industry and, therefore, is affected by tax, environmental and other laws relating to the oil and gas industrygenerally, by changes in those laws and by changes in related administrative regulations. It is possible that theselaws and regulations may in the future add significantly to our operating costs or those of our customers, orotherwise directly or indirectly affect our operations.
25

Among the services we provide, we operate as a motor carrier and therefore are subject to regulation by theU.S. Department of Transportation and by various state agencies. These regulatory authorities exercise broadpowers, governing activities such as the authorization to engage in motor carrier operations and regulatory safety.There are additional regulations specifically relating to the trucking industry, including testing and specificationof equipment and product handling requirements. The trucking industry is subject to possible regulatory andlegislative changes that may affect the economics of the industry by requiring changes in operating practices orby changing the demand for common or contract carrier services or the cost of providing truckload services.Some of these possible changes include increasingly stringent environmental regulations, changes in the hours ofservice regulations which govern the amount of time a driver may drive in any specific period, onboard black boxrecorder devices or limits on vehicle weight and size.
Interstate motor carrier operations are subject to safety requirements prescribed by the U.S. Department ofTransportation. To a large degree, intrastate motor carrier operations are subject to state safety regulations thatmirror federal regulations. Such matters as weight and dimension of equipment are also subject to federal andstate regulations.
From time to time, various legislative proposals are introduced, including proposals to increase federal,state, or local taxes, including taxes on motor fuels, which may increase our costs or adversely impact therecruitment of drivers. We cannot predict whether, or in what form, any increase in such taxes applicable to uswill be enacted.
Our combined operating history may not be sufficient for investors to evaluate our business and prospects.
The acquisition of the production services businesses of WEDGE and Competition significantly expandedour operations and assets. Our historical combined financial statements include financial information based onthe separate production services businesses of WEDGE and Competition. As a result, the historical and proforma information presented may not provide an accurate indication of what our actual results would have beenif the acquisition of the production services businesses of WEDGE and Competition had been completed at thebeginning of the periods presented or of what our future results of operations are likely to be. Our future resultswill depend on our ability to efficiently manage our combined operations and execute our business strategy.
Risk Relating to Our Capitalization and Organizational Documents
We do not intend to pay dividends on our common stock in the foreseeable future, and therefore onlyappreciation of the price of our common stock will provide a return to our shareholders.
We have not paid or declared any dividends on our common stock and currently intend to retain anyearnings to fund our working capital needs and growth opportunities. Any future dividends will be at thediscretion of our board of directors after taking into account various factors it deems relevant, including ourfinancial condition and performance, cash needs, income tax consequences and restrictions imposed by the TexasBusiness Corporation Act and other applicable laws and by our credit facilities. Our debt arrangements includeprovisions that generally prohibit us from paying dividends on our capital stock, including our common stock.
We may issue preferred stock whose terms could adversely affect the voting power or value of our commonstock.
Our articles of incorporation authorize us to issue, without the approval of our shareholders, one or moreclasses or series of preferred stock having such designations, preferences, limitations and relative rights,including preferences over our common stock respecting dividends and distributions, as our board of directorsmay determine. The terms of one or more classes or series of preferred stock could adversely impact the votingpower or value of our common stock. For example, we might grant holders of preferred stock the right to electsome number of our directors in all events or on the happening of specified events or the right to veto specifiedtransactions. Similarly, the repurchase or redemption rights or liquidation preferences we might assign to holdersof preferred stock could affect the residual value of the common stock.
26

Provisions in our organizational documents could delay or prevent a change in control of our company even ifthat change would be beneficial to our shareholders.
The existence of some provisions in our organizational documents could delay or prevent a change incontrol of our company even if that change would be beneficial to our shareholders. Our articles of incorporationand bylaws contain provisions that may make acquiring control of our company difficult, including:
• provisions regulating the ability of our shareholders to nominate candidates for election as directors orto bring matters for action at annual meetings of our shareholders;
• limitations on the ability of our shareholders to call a special meeting and act by written consent;
• provisions dividing our board of directors into three classes elected for staggered terms; and
• the authorization given to our board of directors to issue and set the terms of preferred stock.
We may continue to experience market conditions that could adversely affect the liquidity of our auction ratepreferred security investment.
At December 31, 2008, we held $15.9 million (par value) of investments comprised of tax exempt, auctionrate preferred securities (“ARPSs”), which are variable-rate preferred securities and have a long-term maturitywith the interest rate being reset through “Dutch auctions” that are held every 7 days. The ARPSs havehistorically traded at par because of the frequent interest rate resets and because they are callable at par at theoption of the issuer. Interest is paid at the end of each auction period. Our ARPSs are AAA/Aaa rated securities,collateralized by municipal bonds and backed by assets that are equal to or greater than 200% of the liquidationpreference. Until February 2008, the auction rate securities market was highly liquid. Beginning mid-February2008, we experienced several “failed” auctions, meaning that there was not enough demand to sell all of thesecurities that holders desired to sell at auction. The immediate effect of a failed auction is that such holderscannot sell the securities at auction and the interest rate on the security resets to a maximum auction rate. Wehave continued to receive interest payments on our ARPSs in accordance with their terms. Unless a futureauction is successful or the issuer calls the security pursuant to redemption prior to maturity, we may not be ableto access the funds we invested in our ARPSs without a loss of principal. We have no reason to believe that anyof the underlying municipal securities that collateralize our ARPSs are presently at risk of default. We believe wewill ultimately be able to liquidate our investments without material loss primarily due to the collateral securingthe ARPSs. We do not currently intend to attempt to sell our ARPSs at a discount since our liquidity needs areexpected to be met with cash flows from operating activities and our senior secured revolving credit facility. OurARPSs are designated as available-for-sale and are reported at fair market value with the related unrealized gainsor losses, included in accumulated other comprehensive income (loss), net of tax, a component of shareholders’equity. The estimated fair value of our ARPSs at December 31, 2008 was $13.9 million compared with a parvalue of $15.9 million. The $2.0 million difference represents a fair value discount due to the current lack ofliquidity which is considered temporary and is recorded as an unrealized loss. We would recognize animpairment charge if the fair value of our investments falls below the cost basis and is judged to be other-than-temporary. Our ARPSs are classified with other long-term assets on our consolidated balance sheet as ofDecember 31, 2008 because of our inability to the determine recovery period of our investments.
Item 1B. Unresolved Staff Comments
Not applicable.
Item 2. Properties
For a description of our significant properties, see “Business—Overview of Our Segments and Services”and “Business—Facilities” in Item 1 of this report. We consider each of our significant properties to be suitablefor its intended use.
27

Item 3. Legal Proceedings
Due to the nature of our business, we are, from time to time, involved in routine litigation or subject todisputes or claims related to our business activities, including workers’ compensation claims andemployment-related disputes. In the opinion of our management, none of the pending litigation, disputes orclaims against us will have a material adverse effect on our financial condition or results of operations.
Item 4. Submission of Matters to a Vote of Security Holders
We did not submit any matter to a vote of our shareholders during the quarter ended December 31, 2008.
PART II
Item 5. Market for Registrant’s Common Equity, Related Shareholder Matters and Issuer Purchases ofEquity Securities
As of February 6, 2009, 49,997,578 shares of our common stock were outstanding, held by 560 shareholdersof record. The number of record holders does not necessarily bear any relationship to the number of beneficialowners of our common stock.
Our common stock trades on the American Stock Exchange (NYSE Alternext US) under the symbol “PDC.”The following table sets forth, for each of the periods indicated, the high and low sales prices per share on theAmerican Stock Exchange (NYSE Alternext US):
Low High
Fiscal Year Ended December 31, 2008:First Quarter . . . . . . . . . . . . . . . . . . . . . . . . . . . . . . . . . . . . . . . . . . . . . . . . . . . $10.59 $16.70Second Quarter . . . . . . . . . . . . . . . . . . . . . . . . . . . . . . . . . . . . . . . . . . . . . . . . . 15.29 20.64Third Quarter . . . . . . . . . . . . . . . . . . . . . . . . . . . . . . . . . . . . . . . . . . . . . . . . . . . 12.49 18.82Fourth Quarter . . . . . . . . . . . . . . . . . . . . . . . . . . . . . . . . . . . . . . . . . . . . . . . . . . 4.85 13.09
Nine Months Ended December 31, 2007:First Quarter . . . . . . . . . . . . . . . . . . . . . . . . . . . . . . . . . . . . . . . . . . . . . . . . . . . $12.69 $16.00Second Quarter . . . . . . . . . . . . . . . . . . . . . . . . . . . . . . . . . . . . . . . . . . . . . . . . . 11.81 14.88Third Quarter . . . . . . . . . . . . . . . . . . . . . . . . . . . . . . . . . . . . . . . . . . . . . . . . . . . 11.49 12.49
Fiscal Year Ended March 31, 2007:First Quarter . . . . . . . . . . . . . . . . . . . . . . . . . . . . . . . . . . . . . . . . . . . . . . . . . . . $12.60 $18.00Second Quarter . . . . . . . . . . . . . . . . . . . . . . . . . . . . . . . . . . . . . . . . . . . . . . . . . 10.79 15.70Third Quarter . . . . . . . . . . . . . . . . . . . . . . . . . . . . . . . . . . . . . . . . . . . . . . . . . . . 11.57 14.65Fourth Quarter . . . . . . . . . . . . . . . . . . . . . . . . . . . . . . . . . . . . . . . . . . . . . . . . . . 11.46 13.47
The last reported sales price for our common stock on the American Stock Exchange (NYSE Alternext US)on February 6, 2009 was $5.08 per share.
We have not paid or declared any dividends on our common stock and currently intend to retain earnings tofund our working capital needs and growth opportunities. Any future dividends will be at the discretion of ourboard of directors after taking into account various factors it deems relevant, including our financial conditionand performance, cash needs, income tax consequences and the restrictions Texas and other applicable laws andour credit facilities then impose. Our debt arrangements include provisions that generally prohibit us from payingdividends, other than dividends on our preferred stock. We currently have no preferred stock outstanding.
No shares of our common stock were purchased by or on behalf of our company or any affiliated purchaserduring the fiscal year ended December 31, 2008.
28

Performance Graph
The following graph compares, for the periods from December 31, 2003 to December 31, 2008, thecumulative total shareholder return on our common stock with the (1) cumulative total return on the companiesthat comprise the AMEX Composite Index, (2) an old peer group index that includes the five companies thatprimarily provide contract drilling services, and (3) a new peer group index that includes five companies thatprovide contract drilling services and / or production services. With the acquisition of WEDGE and Competitionon March 1, 2008, we expanded our operations beyond providing only contract drilling services and beganproviding production services. We believe the companies included in the new peer group index better reflect ourpeers with similar service offerings. The comparison assumes that $100 was invested on December 31, 2003 inour common stock, the companies that compose the AMEX Composite Index and the companies that composethe old and new peer group indexes, and further assumes all dividends were reinvested.
The companies that comprise the old peer group index are Helmerich & Payne, Inc., Grey Wolf, Inc.,Patterson-UTI Energy, Inc., Nabors Industries Ltd. and Unit Corp. The companies that comprise the new peergroup index are Patterson-UTI Energy, Inc., Nabors Industries Ltd., Bronco Drilling Company, Precision DrillingTrust and Key Energy Services.
Comparison of 5 Year Cumulative Total ReturnAssumes Initial Investment of $100
December 2008
0.00Dec-2003 Dec-2005 Dec-2006 Dec-2007 Dec-2008Dec-2004
50.00
100.00
150.00
200.00
250.00
300.00
350.00
400.00
Pioneer Drilling Co. Amex Composite New Peer Group Old Peer Group
Equity Compensation Plan Information
The following table provides information on our equity compensation plans as of December 31, 2008:
Plan category
Number of securities to beissued upon exercise of
outstanding options,warrants and rights
Weighted-averageexercise price per shareof outstanding options,
warrants and rights
Number of securitiesremaining available forfuture issuance under
equity compensation plans(1)
Equity compensation plans approved bysecurity holders . . . . . . . . . . . . . . . . . . 3,769,695 $12.85 2,035,073
Equity compensation plans not approvedby security holders — — —
Total . . . . . . . . . . . . . . . . . . . . . . . . . . . . 3,769,695 $12.85 2,035,073
(1) Includes 822,489 shares that may be issued in the form of restricted stock or restricted stock units under theAmended and Restated Pioneer Drilling Company 2007 Incentive Plan.
29

Item 6. Selected Financial Data
The following information derives from our audited financial statements. You should review thisinformation in conjunction with “Management’s Discussion and Analysis of Financial Condition and Results ofOperations” in Item 7 of this report and the historical financial statements and related notes this report contains.
Year EndedDecember 31,
2008 (1)(2)
Nine monthsEnded
December 31,2007
Years Ended March 31,
2007 2006 2005
(In thousands, except per share amounts)
Statement of Operations Data:Revenues . . . . . . . . . . . . . . . . . . . . . . . . . . $ 610,884 $ 313,884 $ 416,178 $ 284,148 $185,246(Loss) income from operations . . . . . . . . . (43,954) 55,260 126,976 77,909 18,774(Loss) income before income taxes . . . . . . (56,688) 57,774 130,789 79,813 17,161Net (loss) earnings applicable to common
stockholders . . . . . . . . . . . . . . . . . . . . . . (62,745) 39,645 84,180 50,567 10,812(Loss) earnings per common
share-basic . . . . . . . . . . . . . . . . . . . . . . . $ (1.26) $ 0.80 $ 1.70 $ 1.08 $ 0.31(Loss) earnings per common
share-diluted . . . . . . . . . . . . . . . . . . . . . . $ (1.26) $ 0.79 $ 1.68 $ 1.06 $ 0.30
Other Financial Data:Net cash provided by operating
activities . . . . . . . . . . . . . . . . . . . . . . . . . $ 186,391 $ 115,455 $ 131,530 $ 97,084 $ 33,665Net cash used in investing activities . . . . . (505,615) (123,858) (137,960) (125,217) (75,320)Net cash provided by financing
activities . . . . . . . . . . . . . . . . . . . . . . . . . 269,342 161 201 49,634 109,513Capital expenditures . . . . . . . . . . . . . . . . . . 148,096 128,038 147,230 128,871 80,388
As of December 31, As of March 31,
2008 (1) 2007 2007 2006 2005
(In thousands)
Balance Sheet Data:Working capital . . . . . . . . . . . . . . . . . . . . . . . . . . $ 64,372 $ 99,807 $124,089 $106,904 $ 76,327Property and equipment, net . . . . . . . . . . . . . . . . . 627,562 417,022 342,901 260,783 170,566Long-term debt and capital lease obligations,
excluding current installments . . . . . . . . . . . . . 262,115 — — — 13,445Shareholders’ equity . . . . . . . . . . . . . . . . . . . . . . . 414,118 471,072 428,109 340,676 221,615Total assets . . . . . . . . . . . . . . . . . . . . . . . . . . . . . . 824,479 560,212 501,495 400,678 276,009
(1) The statement of operations data and other financial data for the year ended December 31, 2008 and thebalance sheet data as of December 31, 2008 includes the impact of the acquisitions of WEDGE andCompetition, both of which occurred on March 1, 2008. See Note 2 to Consolidated Financial Statements,included in Part II, Item 8, Financial Statements and Supplementary Data, of this Annual Report on Form10-K.
(2) The statement of operations data and other financial data for the year ended December 31, 2008 reflect theimpact of a goodwill impairment charge of $118.6 million and an intangible asset impairment charge of$52.8 million. See Note 1 to Consolidated Financial Statements, included in Part II, Item 8, FinancialStatements and Supplementary Data, of this Annual Report on Form 10-K.
30

Item 7. Management’s Discussion and Analysis of Financial Condition and Results of Operations
Statements we make in the following discussion that express a belief, expectation or intention, as well asthose that are not historical fact, are forward-looking statements that are subject to risks, uncertainties andassumptions. Our actual results, performance or achievements, or industry results, could differ materially fromthose we express in the following discussion as a result of a variety of factors, including general economic andbusiness conditions and industry trends, the continued strength or weakness of the contract land drilling industryin the geographic areas in which we operate, decisions about onshore exploration and development projects tobe made by oil and gas companies, the highly competitive nature of our business, the availability, terms anddeployment of capital, the availability of qualified personnel, and changes in, or our failure or inability tocomply with, government regulations, including those relating to the environment. We have discussed many ofthese factors in more detail elsewhere in this report, including under the headings “Special Note RegardingForward-Looking Statements” in the Introductory Note to Part I and “Risk Factors” in Item 1A. These factorsare not necessarily all the important factors that could affect us. Unpredictable or unknown factors we have notdiscussed in this report or could also have material adverse effect on actual results of matters that are thesubject of our forward-looking statements. All forward-looking statements speak only as the date on which theyare made and we undertake no duty to update or revise any forward-looking statements. We advise ourshareholders that they should (1) be aware that important factors not referred to above could affect the accuracyof our forward-looking statements and (2) use caution and common sense when considering our forward-lookingstatements.
Company Overview
Pioneer Drilling Company provides drilling services and production services to independent and major oiland gas exploration and production companies throughout the United States and internationally in Colombia. Ourcompany was incorporated in 1979 as the successor to a business that had been operating since 1968. Over theyears, our business has grown through acquisitions and through organic growth. Since September 1999, we havesignificantly expanded our drilling rig fleet by adding 42 rigs through acquisitions and by adding 27 rigs throughthe construction of rigs from new and used components. On March 1, 2008, we significantly expanded ourservice offerings when we acquired the production services businesses of WEDGE Group Incorporated(“WEDGE”) for $314.7 million and Prairie Investors d/b/a Competition Wireline (“Competition”) for $30.0million which provide well services, wireline services and fishing and rental services. We funded the WEDGEacquisition primarily with $311.5 million of borrowings under our $400 million senior secured revolving creditfacility. As of February 23, 2009, the senior secured revolving credit facility had an outstanding balance of$257.5 million, all of which matures in February 2013. Drilling services and production services are fundamentalto establishing and maintaining the flow of oil and natural gas throughout the productive life at a well site andenable us to meet multiple needs of our customers.
31

Business Segments
We currently conduct our operations through two operating segments: our Drilling Services Division andour Production Services Division. The following is a description of these two operating segments. Financialinformation about our operating segments is included in Note 11, Segment Information, of the Notes toConsolidated Financial Statements, included in Part II, Item 8, Financial Statements and Supplementary Data, ofthis Annual Report on Form 10-K.
• Drilling Services Division—Our Drilling Services Division provides contract land drilling services withits fleet of 70 drilling rigs in the following locations:
Drilling Division Locations Rig Count
South Texas . . . . . . . . . . . . . . . . . . . . . . . . . . . . . . . . . . . . . . . . . . . . . . . 17East Texas . . . . . . . . . . . . . . . . . . . . . . . . . . . . . . . . . . . . . . . . . . . . . . . . 22North Texas . . . . . . . . . . . . . . . . . . . . . . . . . . . . . . . . . . . . . . . . . . . . . . . 9Utah . . . . . . . . . . . . . . . . . . . . . . . . . . . . . . . . . . . . . . . . . . . . . . . . . . . . . 6North Dakota . . . . . . . . . . . . . . . . . . . . . . . . . . . . . . . . . . . . . . . . . . . . . . 6Oklahoma . . . . . . . . . . . . . . . . . . . . . . . . . . . . . . . . . . . . . . . . . . . . . . . . 5Colombia . . . . . . . . . . . . . . . . . . . . . . . . . . . . . . . . . . . . . . . . . . . . . . . . . 5
As of February 23, 2009, 36 drilling rigs are operating, 29 drilling rigs are idle and five drilling rigslocated in our Oklahoma drilling division have been placed in storage or “cold stacked” due to lowdemand for drilling rigs in this region. We are actively marketing all our idle drilling rigs and we areearning revenue on two of these rigs through early termination fees on their drilling contracts with aterm expiring in March 2009 and May 2009. We are constructing a 1500 horsepower drilling rig thatwe expect to be completed and available for operation in the in our North Dakota drilling divisionunder a contract with a three year term beginning March 2009. In addition, to our drilling rigs, weprovide the drilling crews and most of the ancillary equipment needed to operate our drilling rigs. Weobtain our contracts for drilling oil and natural gas wells either through competitive bidding or throughdirect negotiations with customers. Our drilling contracts generally provide for compensation on eithera daywork, turnkey or footage basis. Contract terms generally depend on the complexity and risk ofoperations, the on-site drilling conditions, the type of equipment used and the anticipated duration ofthe work to be performed.
• Production Services Division—Our Production Services Division provides a broad range of wellservices to oil and gas drilling and producing companies, including workover services, wirelineservices, and fishing and rental services. Our production services operations are managed regionallyand are concentrated in the major United States onshore oil and gas producing regions in the GulfCoast, Mid-Continent, and Rocky Mountain states. We provide our services to a diverse group of oiland gas companies. The primary productions services we offer are the following:
• Well Services. Existing and newly-drilled wells require a range of services to establish andmaintain production over their useful lives. We use our fleet of 74 workover rigs in seven divisionlocations to provide these required services, including maintenance of existing wells, workover ofexisting wells, completion of newly-drilled wells, and plugging and abandonment of wells at theend of their useful lives. We have a premium workover rig fleet consisting of sixty-nine 550horseposewer rigs, four 600 horsepower rigs, and one 400 horsepower rig. The average age of thisfleet is 1.4 years as of December 31, 2008. As of February 23, 2009, 62 workover rigs areoperating and 12 workover rigs are idle with no crews assigned.
• Wireline Services. In order for oil and gas companies to better understand the reservoirs they aredrilling or producing, they require logging services to accurately characterize reservoir rocks andfluids. When a producing well is completed, they also must perforate the production casing toestablish a flow path between the reservoir and the wellbore. We use our fleet of 59 truck mountedwireline units in 15 division locations to provide these important logging and perforating services.
32

We provide both open and cased-hole logging services, including the latest pulsed-neutrontechnology. In addition, we provide services which allow oil and gas companies to evaluate theintegrity of wellbore casing, recover pipe, or install bridge plugs. Our truck mounted wirelineunits have an average age of 3.7 years as of December 31, 2008.
• Fishing and Rental Services. During drilling operations, oil and gas companies are often requiredto rent unique equipment such as power swivels, foam air units, blow-out preventers, air drillingequipment, pumps, tanks, pipe, tubing, and fishing tools. We have approximately $15 millionworth of fishing and rental tools that we provide out of four locations in Texas and Oklahoma.
Market Conditions in Our Industry
In recent months, there has been substantial volatility and a decline in oil and natural gas prices due to thedeteriorating global economic environment. In addition, there has been substantial uncertainty in the capitalmarkets and access to financing is uncertain. These conditions have adversely affected our business environment.Our customers have curtailed their drilling programs and reduced their production activities, which has resultedin a decrease in demand for drilling and production services and a reduction in day rates and utilization. Inaddition, certain of our customers could experience an inability to pay suppliers in the event they are unable toaccess the capital markets to fund their business operations.
Demand for oilfield services offered by our industry is a function of our customers’ willingness to makeoperating and capital expenditures to explore for, develop and produce hydrocarbons, which in turn is affected bycurrent and expected levels of oil and natural gas prices. For three years before the end of 2008, domesticexploration and production spending increased as oil and natural gas prices increased. Oil and natural gas pricesdeclined significantly at the end of 2008 and in recent months in a deteriorating global economic environment,and exploration and production companies have announced cuts in their exploration budgets for 2009. We expectthese reductions in oil and gas exploration budgets to result in a reduction in our rig utilization and revenue ratesin 2009. In addition, we may experience a shift to more turnkey and footage drilling contracts from dayworkdrilling contracts. For additional information concerning the effects of the volatility in oil and gas prices anduncertainty in capital markets, see Item 1A—“Risk Factors” in Part I of this Annual Report on Form 10-K.
On February 6, 2009 the spot price for West Texas Intermediate crude oil was $40.17, the spot price forHenry Hub natural gas was $4.67 and the Baker Hughes land rig count was 1,330, a 21% decrease from 1,677 onFebruary 8, 2008. The average weekly spot prices of West Texas Intermediate crude oil and Henry Hub naturalgas, the average weekly domestic land rig count per the Baker Hughes land rig count, and the average monthlydomestic workover rig count for the year ended December 31, 2008, the nine months ended December 31, 2007and each of the previous five years ended March 31 were:
Year EndedDecember 31,
2008
Nine MonthsEnded
December 31,2007
Years Ended March 31,
2007 2006 2005 2004
Oil (West TexasIntermediate) . . . . . . . . . . . . . . . . . . . . . . . $99.86 $77.42 $64.96 $59.94 $45.04 $31.47
Natural Gas (Henry Hub) . . . . . . . . . . . . . . . . . . $ 8.81 $ 6.82 $ 6.53 $ 9.10 $ 5.99 $ 5.27U.S. Land Rig Count . . . . . . . . . . . . . . . . . . . . . 1,792 1,684 1,589 1,329 1,110 964U.S. Workover Rig Count . . . . . . . . . . . . . . . . . 2,514 2,394 2,376 2,271 2,087 1,996
Increased expenditures for exploration and production activities generally leads to increased demand for ourdrilling services and production services. Over the past several years, rising oil and natural gas prices and thecorresponding increase in onshore oil and natural gas exploration and production spending led to expandeddrilling and well service activity as reflected by the increases in the U.S. land rig counts and U.S. workover rigcounts over the previous five years.
33

With the recent decline in oil and natural gas prices due to the deteriorating global economic environmentand the expected reductions in our rig utilization and revenue rates in 2009, our near-term strategy is to maintaina strong balance sheet and ample liquidity. Management has initiated certain cost reduction measures includingworkforce and wage rate reductions that will reduce operating expenses during the downturn in the industrycycle. Budgeted capital expenditures for 2009 represent routine capital expenditures necessary to keep ourequipment in safe and efficient working order and limited discretionary capital expenditures of new equipment orupgrades of existing equipment. In addition, our marketing initiatives are focused on identifying regionalopportunities and evaluating more turnkey drilling contract opportunities. We believe this near-term strategy willposition us to take advantage of business opportunities and continue our long-term growth strategy.
Exploration and production spending is generally categorized as either a capital expenditure or an operatingexpenditure. Activities designed to add hydrocarbon reserves are classified as capital expenditures, while thoseassociated with maintaining or accelerating production are categorized as operating expenditures.
Capital expenditures by oil and gas companies tend to be relatively sensitive to volatility in oil or natural gasprices because project decisions are tied to a return on investment spanning a number of years. As such, capitalexpenditure economics often require the use of commodity price forecasts which may prove inaccurate in theamount of time required to plan and execute a capital expenditure project (such as the drilling of a deep well).When commodity prices are depressed for even a short period of time, capital expenditure projects are routinelydeferred until prices return to an acceptable level.
In contrast, both mandatory and discretionary operating expenditures are more stable than capitalexpenditures for exploration. Mandatory operating expenditure projects involve activities that cannot be avoidedin the short term, such as regulatory compliance, safety, contractual obligations and projects to maintain the welland related infrastructure in operating condition. Discretionary operating expenditure projects may not be criticalto the short-term viability of a lease or field, but these projects are less sensitive to commodity price volatility ascompared to capital expenditures for exploration. Discretionary operating expenditure work is evaluatedaccording to a simple short-term payout criterion which is far less dependent on commodity price forecasts.
Our business is influenced substantially by both operating and capital expenditures by exploration andproduction companies. Because existing oil and natural gas wells require ongoing spending to maintainproduction, expenditures by exploration and production companies for the maintenance of existing wells arerelatively stable and predictable. In contrast, capital expenditures by exploration and production companies forexploration and drilling are more directly influenced by current and expected oil and natural gas prices andgenerally reflect the volatility of commodity prices.
Liquidity and Capital Resources
Sources of Capital Resources
Our principal sources of liquidity consist of: (i) cash and cash equivalents (which equaled $26.8 million asof December 31, 2008); (ii) cash generated from operations; and (iii) the unused portion of our senior securedrevolving credit facility which has borrowing availability of $133.2 million as of February 23, 2009. There are nolimitations on our ability to access the full borrowing availability under the senior secured revolving creditfacility other than maintaining compliance with the covenants in the credit agreement. Our principal liquidityrequirements have been for working capital needs, capital expenditures and acquisitions.
On February 29, 2008, we entered into a credit agreement with Wells Fargo Bank, N.A. and a syndicate oflenders (collectively the “Lenders”). The credit agreement provides for a senior secured revolving credit facility,with sub-limits for letters of credit and a swing-line facility of up to an aggregate principal amount of $400million, all of which mature on February 28, 2013. The senior secured revolving credit facility and theobligations thereunder are secured by substantially all our domestic assets and are guaranteed by certain of ourdomestic subsidiaries. Borrowings under the senior secured revolving credit facility bear interest, at our option, at
34

the bank prime rate or at the LIBOR rate, plus an applicable per annum margin in each case. The applicable perannum margin is determined based upon our leverage ratio in accordance with a pricing grid in the creditagreement. The per annum margin for LIBOR rate borrowings ranges from 1.50% to 2.50% and for bank primerate borrowings ranges from 0.50% to 1.50%. Based on the terms in the credit agreement, the LIBOR margin andbank prime rate margin in effect until delivery of our financial statements and the compliance certificate forDecember 31, 2008 were 2.25% and 1.25%, respectively. A commitment fee is due quarterly based on theaverage daily unused amount of the commitments of the Lenders under the senior secured revolving creditfacility. In addition, a fronting fee is due for each letter of credit issued and a quarterly letter of credit fee is duebased on the average undrawn amount of letter of credit outstanding during such period. We may repay the seniorsecured revolving credit facility balance outstanding in whole or in part at any time without premium or penalty.The senior secured revolving credit facility replaced the $20.0 million credit facility we previously had withFrost National Bank. Borrowings under the senior secured revolving credit facility were used to fund theWEDGE acquisition and are available for future acquisitions, working capital and other general corporatepurposes.
At February 23, 2009, we had $257.5 million outstanding under the revolving portion of the senior securedrevolving credit facility and $9.3 million in committed letters of credit. Under the terms of the credit agreement,committed letters of credit are applied against our borrowing capacity under the senior secured revolving creditfacility. The borrowing availability under the senior secured revolving credit facility was $133.2 million atFebruary 23, 2009. Principal payments of $15.0 million made after December 31, 2008 are classified in thecurrent portion of long-term debt as of December 31, 2008. The outstanding balance under our senior securedcredit facility is not due until maturity on February 28, 2013. However, when cash and working capital issufficient, we may make principal payments to reduce the outstanding debt balance prior to maturity.
At December 31, 2008, we held $15.9 million (par value) of investments comprised of tax exempt, auctionrate preferred securities (“ARPSs”), which are variable-rate preferred securities and have a long-term maturitywith the interest rate being reset through “Dutch auctions” that are held every 7 days. The ARPSs havehistorically traded at par because of the frequent interest rate resets and because they are callable at par at theoption of the issuer. Interest is paid at the end of each auction period. Our ARPSs are AAA/Aaa rated securities,collateralized by municipal bonds and backed by assets that are equal to or greater than 200% of the liquidationpreference. Until February 2008, the auction rate securities market was highly liquid. Beginning mid-February2008, we experienced several “failed” auctions, meaning that there was not enough demand to sell all of thesecurities that holders desired to sell at auction. The immediate effect of a failed auction is that such holderscannot sell the securities at auction and the interest rate on the security resets to a maximum auction rate. Wehave continued to receive interest payments on our ARPSs in accordance with their terms. Unless a futureauction is successful or the issuer calls the security pursuant to redemption prior to maturity, we may not be ableto access the funds we invested in our ARPSs without a loss of principal. We have no reason to believe that anyof the underlying municipal securities that collateralize our ARPSs are presently at risk of default. We believe wewill ultimately be able to liquidate our investments without material loss primarily due to the collateral securingthe ARPSs. We do not currently intend to attempt to sell our ARPSs at a discount since our liquidity needs areexpected to be met with cash flows from operating activities and our senior secured revolving credit facility. OurARPSs are designated as available-for-sale and are reported at fair market value with the related unrealized gainsor losses, included in accumulated other comprehensive income (loss), net of tax, a component of shareholders’equity. The estimated fair value of our ARPSs at December 31, 2008 was $13.9 million compared with a parvalue of $15.9 million. The $2.0 million difference represents a fair value discount due to the current lack ofliquidity which is considered temporary and is recorded as an unrealized loss. We would recognize animpairment charge if the fair value of our investments falls below the cost basis and is judged to be other-than-temporary. Our ARPSs are classified with other long-term assets on our consolidated balance sheet as ofDecember 31, 2008 because of our inability to determine the recovery period of our investments.
35

Uses of Capital Resources
On March 1, 2008, we acquired the production services business of WEDGE which provided well services,wireline services and fishing and rental services with a fleet of 62 workover rigs, 45 wireline units andapproximately $13 million of fishing and rental tools equipment through facilities in Texas, Kansas, NorthDakota, Colorado, Montana, Utah and Oklahoma. The aggregate purchase price for the acquisition wasapproximately $314.7 million, which consisted of assets acquired of $340.8 million and liabilities assumed of$26.1 million. The aggregate purchase price included $3.4 million of costs incurred to acquire the productionservices business from WEDGE. We financed the acquisition with approximately $3.2 million of cash on handand $311.5 million of debt incurred under our new $400 million senior secured revolving credit facility.
On March 1, 2008, immediately following the acquisition of the production services business fromWEDGE, we acquired the production services business from Competition which provided wireline services witha fleet of 6 wireline units through its facilities in Montana. The aggregate purchase price for the Competitionacquisition was approximately $30.0 million, which consisted of assets acquired of $30.1 million and liabilitiesassumed of $0.1 million. The aggregate purchase price includes $0.4 million of costs incurred to acquire theproduction services business from Competition. We financed the acquisition with $26.7 million cash on hand anda note payable due to the prior owner for $3.3 million.
On August 29, 2008, we acquired the wireline services business from Paltec. The aggregate purchase pricewas $7.8 million which we financed with $6.5 million in cash and a sellers note of $1.3 million. Intangible andother assets of $4.3 million and goodwill of $0.1 million were recorded in connection with the acquisition.
On October 1, 2008, we acquired the well services business from Pettus Well Service. The aggregatedpurchase price was $3.0 million which we financed with $2.8 million in cash and a sellers note of $0.2 million.Intangible and other assets of $1.2 million and goodwill of $0.1 million were recorded in connection with theacquisition.
For the year ended December 31, 2008 and the nine months ended December 31, 2007, the additions to ourproperty and equipment consisted of the following (amounts in thousands):
Year endedDecember 31,
2008
Nine months endedDecember 31,
2007
Drilling Services Division:Routine rigs . . . . . . . . . . . . . . . . . . . . . . . . . . . . . . . . . . . . . . . . $ 17,860 $ 16,029Discretionary . . . . . . . . . . . . . . . . . . . . . . . . . . . . . . . . . . . . . . . 61,034 52,292New-builds and acquisitions . . . . . . . . . . . . . . . . . . . . . . . . . . . 30,281 59,717
Total Drilling Services Division . . . . . . . . . . . . . . . . . . . . 109,175 128,038
Production Services Division:Routine . . . . . . . . . . . . . . . . . . . . . . . . . . . . . . . . . . . . . . . . . . . . 4,740 —Discretionary . . . . . . . . . . . . . . . . . . . . . . . . . . . . . . . . . . . . . . . 1,175 —New-builds and acquisitions . . . . . . . . . . . . . . . . . . . . . . . . . . . 33,006 —
Total Production Services Division . . . . . . . . . . . . . . . . . . 38,921 —
$148,096 $128,038
We capitalized $0.3 million of interest costs in property and equipment for the year ended December 31,2008 and no capitalized interest cost for the nine months ended December 31, 2007.
We constructed a 1500 horsepower drilling rig that was completed and placed into service in December2008. As of December 31, 2008, we were constructing another 1500-horsepower drilling rig that we expect tocomplete and place in service in March 2009. Our Drilling Services Division incurred $28.4 million of rig
36

construction costs for these two 1500 horsepower drilling rigs during the year ended December 31, 2008. Inaddition, our Production Services Division incurred $20.2 million acquiring 14 workover rigs and $5.0 millionacquiring 10 wireline units during the year ended December 31, 2008. During the nine months endedDecember 31, 2007, we incurred $56.2 million to purchase and upgrade the 3 drilling rigs acquired for expansioninto international markets.
For the fiscal year ending December 31, 2009, we project capital expenditures of approximately $84.5million, comprised of newly approved capital expenditures of approximately $50.2 million for our DrillingServices Division and approximately $15.0 million for our Production Services Division and previouslyapproved capital expenditures from 2008 of approximately $19.3 million that will be carried over and incurred in2009. We expect to fund these capital expenditures primarily from operating cash flow in excess of our workingcapital and other normal cash flow requirements.
Working Capital
Our working capital was $64.4 million at December 31, 2008, compared to $99.8 million at December 31,2007. Our current ratio, which we calculate by dividing our current assets by our current liabilities, was 1.8 atDecember 31, 2008 compared to 3.4 at December 31, 2007.
Our operations have historically generated cash flows sufficient to at least meet our requirements for debtservice and normal capital expenditures. However, during periods when higher percentages of our drillingcontracts are turnkey and footage contracts, our short-term working capital needs could increase.
The changes in the components of our working capital were as follows (amounts in thousands):
December 31,2008
December 31,2007 Change
Cash and cash equivalents . . . . . . . . . . . . . . . . . . . . . . . . . . . $ 26,821 $ 76,703 $(49,882)Receivables, net . . . . . . . . . . . . . . . . . . . . . . . . . . . . . . . . . . . 87,161 47,370 39,791Unbilled receivables . . . . . . . . . . . . . . . . . . . . . . . . . . . . . . . 12,262 7,861 4,401Deferred income taxes . . . . . . . . . . . . . . . . . . . . . . . . . . . . . . 6,270 3,670 2,600Inventory . . . . . . . . . . . . . . . . . . . . . . . . . . . . . . . . . . . . . . . . 3,874 1,180 2,694Prepaid expenses and other current . . . . . . . . . . . . . . . . . . . . 8,902 5,073 3,829
Current assets . . . . . . . . . . . . . . . . . . . . . . . . . . . . . . . . . . . . . 145,290 141,857 3,433
Accounts payable . . . . . . . . . . . . . . . . . . . . . . . . . . . . . . . . . . 21,830 21,424 406Current portion of long-term debt . . . . . . . . . . . . . . . . . . . . . 17,298 — 17,298Prepaid drilling contracts . . . . . . . . . . . . . . . . . . . . . . . . . . . . 1,171 1,933 (762)Accrued expenses—payroll and related employee costs . . . . 13,592 5,172 8,420Accrued expenses—insurance premiums and deductibles . . 17,520 9,548 7,972Accrued expenses—other . . . . . . . . . . . . . . . . . . . . . . . . . . . 9,507 3,973 5,534
Current liabilities . . . . . . . . . . . . . . . . . . . . . . . . . . . . . . . . . . 80,918 42,050 38,868
Working capital . . . . . . . . . . . . . . . . . . . . . . . . . . . . . . . . . . . $ 64,372 $ 99,807 $(35,435)
The decrease in cash and cash equivalents was primarily due to our use of $147.5 million for certainproperty and equipment expenditures, debt payments of $87.8 million and $39.2 million of cash to fund theWEDGE, Competition, Paltec, Inc. and Pettus Well Service acquisitions. These uses of cash and cash equivalentswere partially offset by $186.4 million of cash provided by operating activities and borrowings under the creditline of $47.9 million.
The increase in our receivables at December 31, 2008 as compared to December 31, 2007 was due toreceivables of $20.7 million at December 31, 2008 that relate to our new Production Services Division that wasformed when we acquired the production services businesses of WEDGE and Competition on March 1, 2008, an
37

increase in receivables of $14.7 million for our Drilling Services Division and an increase of $4.4 million forfederal income tax refunds. The increase in receivables for our Drilling Services Division is primarily due to a$2,774 per day increase in average revenue rates and a 3.5% increase in the number of revenue days for thequarter ended December 31, 2008, compared to the quarter ended December 31, 2007.
The increase in unbilled receivables at December 31, 2008 as compared to December 31, 2007 wasprimarily due to an increase in unbilled receivables of $4.5 million that relate to our drilling contracts inColombia.
The increase in inventory at December 31, 2008 as compared to December 31, 2007 was primarily due tothe addition of inventory of $1.6 million for our new Production Services Division and an increase of $1.1million of inventory primarily related to our third, fourth and fifth drilling rigs that began operating in Colombiain February 2008, August 2008 and November 2008, respectively. We maintain inventories of replacement partsand supplies for our drilling rigs operating in Colombia to ensure efficient operations in geographically remoteareas.
The increase in prepaid expenses and other current assets at December 31, 2008 as compared toDecember 31, 2007 is primarily due to $2.2 million in prepaid expenses and other current assets of our newProduction Services Division. The increase also relates to additional prepaid insurance and deferred mobilizationcosts for the third, fourth and fifth drilling rigs that began operating in Colombia in 2008. In addition, prepaidexpenses and other current assets increased by $0.9 million relating to funds held in a trust account that will bedistributed to our former Chief Financial Officer on March 2, 2009 in accordance with the terms of the severanceagreement and $0.7 million relating to funds held in escrow that will be paid to the former owner of Competition.
The increase in accounts payable was primarily due to $4.6 million for our new Production ServicesDivision and an increase of $1.5 million in accounts payable for our expanded operations in Colombia during2008. The overall increase in accounts payable was partially offset by a decrease in drilling equipment purchasesthat were accrued at December 31, 2008 as compared to December 31, 2007.
The increase in the current portion of long-term debt at December 31, 2008 is primarily due to principalpayments that were made after December 31, 2008 to reduce the outstanding balance of our senior securedrevolving credit facility and the current portion of our subordinated notes payable. The outstanding balance underour senior secured credit facility is not due until maturity on February 28, 2013. However, when cash andworking capital is sufficient, we may make principal payments to reduce the outstanding debt balance prior tomaturity.
The increase in accrued payroll and related employee costs was due to an increase in the number ofemployees primarily due to our new Production Services Division and an increase in the number of daysrepresented in the payroll accrual at December 31, 2008 as compared to December 31, 2007. In addition, accruedpayroll and related employee costs increased due to the payment obligation of $0.9 million to our former ChiefFinancial Officer.
The increase in accrued insurance premiums and deductibles was primarily due to increases in costsincurred for the self-insurance portion of our health and workers compensation insurance and other insurancecosts during the year ended December 31, 2008 as compared to December 31, 2007.
The increase in other accrued expenses at December 31, 2008 as compared to December 31, 2007 isprimarily due to $1.8 million in accrued expenses of our new Production Services Division and an increase of$1.5 million relating to our expanded operations in Colombia during 2008. In addition, accrued expensesincreased due to a payment obligation of $0.7 million to the former owner of Competition, as noted in theprepaid and other current asset description above.
38

Long-term Debt
Long-term debt as of December 31, 2008 consists of the following (amounts in thousands):
Senior secured credit facility . . . . . . . . . . . . . . . . . . . . . . . . . . . . . . . . . . . . . . . . . $272,500Subordinated notes payable . . . . . . . . . . . . . . . . . . . . . . . . . . . . . . . . . . . . . . . . . . 6,534Other . . . . . . . . . . . . . . . . . . . . . . . . . . . . . . . . . . . . . . . . . . . . . . . . . . . . . . . . . . . . 379
279,413Less current portion . . . . . . . . . . . . . . . . . . . . . . . . . . . . . . . . . . . . . . . . . . . . . . . . (17,298)
$262,115
Contractual Obligations
The following table includes all our contractual obligations of the types specified below at December 31,2008 (amounts in thousands):
Payments Due by Period
Contractual Obligations TotalLess than 1
year 2-3 years 4-5 yearsMore than 5
years
Long-term debt . . . . . . . . . . . . . . . . . . . . . . . . . . . . . . . $279,413 $17,298 $ 3,314 $258,801 $—Interest on long term debt . . . . . . . . . . . . . . . . . . . . . . 29,097 7,181 13,973 7,943 —Purchase commitments . . . . . . . . . . . . . . . . . . . . . . . . 35,876 30,754 5,122 — —Operating leases . . . . . . . . . . . . . . . . . . . . . . . . . . . . . . 4,803 1,566 2,228 1,009 —Restricted cash obligation . . . . . . . . . . . . . . . . . . . . . . 4,140 1,540 1,300 1,300 —Other . . . . . . . . . . . . . . . . . . . . . . . . . . . . . . . . . . . . . . 100 100 — — —
Total . . . . . . . . . . . . . . . . . . . . . . . . . . . . . . . . . . . . . . . $353,429 $58,439 $25,937 $269,053 $—
Long-term debt consists of $272.5 million outstanding under our senior secured credit facility, $6.5 millionoutstanding under subordinated notes payable to certain employees that are former shareholders of previouslyacquired production services businesses and other debt of $0.4 million. The outstanding balance under our seniorsecured credit facility is not due until maturity on February 28, 2013, but principal payments of $15.0 millionmade after December 31, 2008 are classified in the current portion of long-term debt as of December 31, 2008.We may make principal payments to reduce the outstanding debt balance prior to maturity when cash andworking capital is sufficient.
Interest payment obligations on our senior secured credit facility are estimated based on (1) interest ratesthat are in effect on February 6, 2009, (2) $15.0 million of principal payments that have been made afterDecember 31, 2008 to reduce the outstanding principal balance, and (3) the remaining principal balance of$257.5 million to be paid at maturity in February 2013. Interest payment obligations on our subordinated notespayable are based on interest rates ranging from 5.44% to 14%, with quarterly payments of principal and interestand final maturity dates ranging from January 2009 to March 2013.
Purchase obligations primarily relate to drilling rig and workover rig upgrades, acquisitions or newconstruction.
Operating leases consist of lease agreements with terms in excess of one year for office space, operatingfacilities, equipment and personal property.
As of December 31, 2008, we had restricted cash in the amount of $3.3 million held in an escrow account tobe used for future payments in connection with the acquisition of Competition. The former owner of Competitionwill receive annual installments of $0.7 million payable over a five year term from the escrow account. Inaddition, we had restricted cash in the amount of $0.9 million in a trust account that will be distributed to ourformer Chief Financial Officer on March 2, 2009 in accordance with the terms of the severance agreement.
39

Debt Requirements
Effective June 11, 2008, we entered into a Waiver Agreement with the Lenders to waive the requirement toprovide certain financial statements in conjunction with our compliance certificate within the time periodrequired by the credit agreement. The Waiver Agreement required us to provide the financial statements and ourcompliance certificate on or before August 13, 2008. Until we provided these financial statements and ourcompliance certificate, the aggregate principal amount outstanding under the credit agreement could not exceed$350 million at any time (provided, however, that the commitment fee would continue to be calculated based onthe total commitment of $400 million), and the per annum margin applicable to all amounts outstanding underthe credit agreement would increase from the current rate of 2.25% for LIBOR rate borrowings and 1.25% forbank prime rate borrowings to 2.50% for LIBOR rate borrowings and 1.50% for bank prime rate borrowings. Therequired financial statements and our compliance certificate were delivered concurrently with the filing of theQuarterly Report on Form 10-Q for the quarterly period ended March 31, 2008 which occurred on August 5,2008.
At December 31, 2008, we were in compliance with the restrictive covenants contained in the creditagreement which include the following:
• We must have a maximum consolidated leverage ratio no greater than 3.00 to 1.00 for any fiscalquarter through March 31, 2009, 2.75 to 1.00 for any fiscal quarter ending June 30, 2009 throughMarch 31, 2010, and 2.50 to 1.00 for any fiscal quarter ending June 30, 2010 through maturity inFebruary 2013;
• If our maximum consolidated leverage ratio is greater than 2.25 to 1.00 at the end of any fiscal quarter,then we must have a minimum asset coverage ratio no less than 1.25 to 1.00; and
• We must have a minimum interest coverage ratio no less than 3.00 to 1.00.
At December 31, 2008, our consolidated leverage ratio was 1.28 to 1.00 and our interest coverage ratio was17.15 to 1.00. The credit agreement has additional restrictive covenants that, among other things, limit theincurrence of additional debt to a maximum of $15 million (other than debt under the senior secured revolvingcredit facility), investments, liens, dividends, acquisitions, redemptions of capital stock, prepayments ofindebtedness, asset dispositions, mergers and consolidations, transactions with affiliates, capital expenditures,hedging contracts, sale leasebacks and other matters customarily restricted in such agreements. In addition, thecredit agreement contains customary events of default, including without limitation, payment defaults, breachesof representations and warranties, covenant defaults, cross-defaults to certain other material indebtedness inexcess of specified amounts, certain events of bankruptcy and insolvency, judgment defaults in excess ofspecified amounts, failure of any guaranty or security document supporting the credit agreement and change ofcontrol. Non-compliance with restrictive covenants or other events of default under the credit agreement couldtrigger an early repayment requirement and terminate the senior secured revolving credit facility.
Critical Accounting Policies and Estimates
Revenue and cost recognition
Our Drilling Services Division earns revenues by drilling oil and gas wells for our customers underdaywork, turnkey or footage contracts, which usually provide for the drilling of a single well. We recognizerevenues on daywork contracts for the days completed based on the dayrate each contract specifies. Werecognize revenues from our turnkey and footage contracts on the percentage-of-completion method based on ourestimate of the number of days to complete each contract. Individual contracts are usually completed in less than60 days. The risks to us under a turnkey contract and, to a lesser extent, under footage contracts, are substantiallygreater than on a contract drilled on a daywork basis. Under a turnkey contract, we assume most of the risksassociated with drilling operations that are generally assumed by the operator in a daywork contract, includingthe risks of blowout, loss of hole, stuck drill pipe, machinery breakdowns and abnormal drilling conditions, aswell as risks associated with subcontractors’ services, supplies, cost escalations and personnel operations.
40

Our management has determined that it is appropriate to use the percentage-of-completion method, asdefined in the American Institute of Certified Public Accountants’ Statement of Position 81-1, to recognizerevenue on our turnkey and footage contracts. Although our turnkey and footage contracts do not have expressterms that provide us with rights to receive payment for the work that we perform prior to drilling wells to theagreed-on depth, we use this method because, as provided in applicable accounting literature, we believe weachieve a continuous sale for our work-in-progress and believe, under applicable state law, we ultimately couldrecover the fair value of our work-in-progress even in the event we were unable to drill to the agreed-on depth inbreach of the applicable contract. However, in the event we were unable to drill to the agreed-on depth in breachof the contract, ultimate recovery of that value would be subject to negotiations with the customer and thepossibility of litigation.
If a customer defaults on its payment obligation to us under a turnkey or footage contract, we would need torely on applicable law to enforce our lien rights, because our turnkey and footage contracts do not expressly grantto us a security interest in the work we have completed under the contract and we have no ownership rights in thework-in-progress or completed drilling work, except any rights arising under the applicable lien statute onforeclosure. If we were unable to drill to the agreed-on depth in breach of the contract, we also would need torely on equitable remedies outside of the contract, including quantum meruit, available in applicable courts torecover the fair value of our work-in-progress under a turnkey or footage contract.
We accrue estimated contract costs on turnkey and footage contracts for each day of work completed basedon our estimate of the total costs to complete the contract divided by our estimate of the number of days tocomplete the contract. Contract costs include labor, materials, supplies, repairs and maintenance, operatingoverhead allocations and allocations of depreciation and amortization expense. In addition, the occurrence ofuninsured or under-insured losses or operating cost overruns on our turnkey and footage contracts could have amaterial adverse effect on our financial position and results of operations. Therefore, our actual results for acontract could differ significantly if our cost estimates for that contract are later revised from our original costestimates for a contract in progress at the end of a reporting period which was not completed prior to the releaseof our financial statements.
With most drilling contracts, we receive payments contractually designated for the mobilization of rigs andother equipment. Payments received, and costs incurred for the mobilization services are deferred and recognizedon a straight line basis over the contract term of certain drilling contracts. Costs incurred to relocate rigs andother drilling equipment to areas in which a contract has not been secured are expensed as incurred.Reimbursements that we receive for out-of-pocket expenses are recorded as revenue and the out-of-pocketexpenses for which they relate are recorded as operating costs.
The asset “unbilled receivables” represents revenues we have recognized in excess of amounts billed ondrilling contracts and production services in progress. The asset “prepaid expenses and other” includes deferredmobilization costs for certain drilling contracts. The liability “prepaid drilling contracts” represents deferredmobilization revenues for certain drilling contracts and amounts collected on contracts in excess of revenuesrecognized.
Our Production Services Division earns revenues for well services, wireline services and fishing and rentalservices pursuant to master services agreements based on purchase orders, contracts or other persuasive evidenceof an arrangement with the customer that include fixed or determinable prices. Production service revenue isrecognized when the service has been rendered and collectibility is reasonably assured.
Long-lived Assets and Intangible Assets
We evaluate for potential impairment of long-lived assets and intangible assets subject to amortization whenindicators of impairment are present, as defined in SFAS No. 144, Accounting for the Impairment or Disposal ofLong-Lived Assets. Circumstances that could indicate a potential impairment include significant adverse changesin industry trends, economic climate, legal factors, and an adverse action or assessment by a regulator. More
41

specifically, significant adverse changes in industry trends include significant declines in revenue rates,utilization rates, oil and natural gas market prices and industry rig counts for drilling rigs and workover rigs. Inperforming the impairment evaluation, we estimate the future undiscounted net cash flows relating to long-livedassets and intangible assets grouped at the lowest level that cash flows can be identified. For our ProductionServices Division, our long-lived assets and intangible assets are grouped at the reporting unit level which is onelevel below the operating segment level. For our Drilling Services Division, we perform an impairmentevaluation and estimate future undiscounted cash flows for individual drilling rig assets. If the sum of theestimated future undiscounted net cash flows is less than the carrying amount of the long-lived assets andintangible assets for these asset grouping levels, then we would recognize an impairment charge. The amount ofan impairment charge would be measured as the difference between the carrying amount and the fair value ofthese assets. The assumptions used in the impairment evaluation for long-lived assets and intangible assets areinherently uncertain and require management judgment.
We performed an impairment analysis of our long-lived assets and intangible assets at December 31, 2008,due to significant adverse changes in the economic and business climate that resulted in decreases in estimatedrevenues, margins and cash flows. Essentially all our intangible assets were recorded in connection with theacquisitions of the production services businesses from WEDGE, Competition, Pettus and Paltec when revenues,margins and cash flows were at historically high levels earlier in 2008. We determined that the sum of theestimated future undiscounted net cash flows is less than the carrying amount of the long-lived assets andintangible assets in each reporting unit at December 31, 2008. Our long-lived asset and intangible assetimpairment analysis for the reporting units in our Production Services Division resulted in no impairment chargeto property and equipment and a non-cash impairment charge of $52.8 million to the carrying value of ourintangible assets for customers relationships for the year ended December 31, 2008. For our Drilling ServicesDivision, we have not recorded an impairment charge on any long-lived assets for the year ended December 31,2008. The assumptions used in the impairment evaluation for long-lived assets and intangible assets areinherently uncertain and require management judgment. This impairment charge is not expected to have animpact on our liquidity or debt covenants; however, it is a reflection of the overall downturn in our industry anddecline in our projected cash flows.
Goodwill
Goodwill results from business acquisitions and represents the excess of acquisition costs over the fair valueof the net assets acquired. We account for goodwill and other intangible assets under the provisions of SFASNo. 142, Goodwill and Other Intangible Assets. Goodwill is tested for impairment annually as of December 31 ormore frequently if events or changes in circumstances indicate that the asset might be impaired. Circumstancesthat could indicate a potential impairment include a significant adverse change in the economic or businessclimate, a significant adverse change in legal factors, an adverse action or assessment by a regulator,unanticipated competition, loss of key personnel and the likelihood that a reporting unit or significant portion of areporting unit will be sold or otherwise disposed of. These circumstances could lead to our net book valueexceeding our market capitalization which is another indicator of a potential impairment in goodwill. SFAS No.142 requires a two-step process for testing impairment. First, the fair value of each reporting unit is compared toits carrying value to determine whether an indication of impairment exists. All our goodwill is related to ourProduction Services Division operating segment and is allocated to its three reporting units which are wellservices, wireline services and fishing and rental services. Second, if impairment is indicated, then the fair valueof the reporting unit’s goodwill is determined by allocating the unit’s fair value to its assets and liabilities(including any unrecognized intangible assets) as if the reporting unit had been acquired in a businesscombination on the impairment test date. The amount of impairment for goodwill is measured as the excess ofthe carrying value of the reporting unit over its fair value.
When estimating fair values of a reporting unit for our goodwill impairment test, we use a combination ofan income approach and a market approach which incorporates both management’s views and those of themarket. The income approach provides an estimated fair value based on each reporting unit’s anticipated cash
42

flows that are discounted using a weighted average cost of capital rate. The market approach provides anestimated fair value based on our market capitalization that is computed using the 30-day average market price ofour common stock and the number of shares outstanding as of the impairment test date. The estimated fair valuescomputed using the income approach and the market approach are then equally weighted and combined into asingle fair value. The primary assumptions used in the income approach are estimated cash flows and weightedaverage cost of capital. Estimated cash flows are primarily based on projected revenues, operating costs andcapital expenditures and are discounted based on comparable industry average rates for weighted average cost ofcapital. We utilized discount rates based on weighted average cost of capital ranging from 15.8% to 16.7% whenwe estimated fair values of our reporting units as of December 31, 2008. The primary assumptions used in themarket approach is the allocation of total market capitalization to each reporting unit, which is based on projectedEBITDA percentages for each reporting unit, and control premiums, which are based on comparable industryaverages. We utilized a 30% control premium when we estimated fair values of our reporting units as ofDecember 31, 2008. To ensure the reasonableness of the estimated fair values of our reporting units, we performa reconciliation of our total market capitalization to the total estimated fair value of all our reporting units. Theassumptions used in estimating fair values of reporting units and performing the goodwill impairment test areinherently uncertain and require management judgment.
Our common stock price per share declined in market value from $13.30 at September 30, 2008, to $5.57 atDecember 31, 2008, which resulted in our net book value exceeding our market capitalization during most of thistime period. We believe the decline in the market price of our common stock resulted from a significant adversechange in the economic and business climate as financial markets reacted to the credit crisis facing major lendinginstitutions and worsening conditions in the overall economy during the fourth quarter of the year endedDecember 31, 2008. During the same time, there were significant declines in oil and natural gas prices whichlead to declines in production service revenues, margins and cash flows. We considered the impact of thesesignificant adverse changes in the economic and business climate as we performed our annual impairmentassessment of goodwill as of December 31, 2008. The estimated fair values of our reporting units werenegatively impacted by significant reductions in estimated cash flows for the income approach component and asignificant reduction in our market capitalization for the market approach component of our fair value estimationprocess. Our goodwill was initially recorded in connection with the acquisitions of the production servicesbusinesses from WEDGE, Competition, Pettus and Paltec, all of which occurred between March 1, 2008 andOctober 1, 2008, when production service revenues, margins and cash flows and our market capitalization wereat historically high levels.
Our goodwill impairment analysis lead us to conclude that there would be no remaining implied valueattributable to our goodwill and accordingly, we recorded a non-cash charge of $118.6 million to our operatingresults for the year ended December 31, 2008, for the full impairment of our goodwill. Our goodwill impairmentanalysis would have lead to the same full impairment conclusion if we increased or decreased our discount ratesor control premiums by 10% when estimating the fair values of our reporting units. This impairment charge isnot expected to have an impact on our liquidity or debt covenants; however, it is a reflection of the overalldownturn in our industry and decline in our projected cash flows.
Deferred taxes
We provide deferred taxes for the basis differences in our property and equipment between financialreporting and tax reporting purposes and other costs such as compensation, foreign net operating losscarryforwards, employee benefit and other accrued liabilities which are deducted in different periods for financialreporting and tax reporting purposes. For property and equipment, basis differences arise from differences indepreciation periods and methods and the value of assets acquired in a business acquisition where we acquire anentity rather than just its assets. For financial reporting purposes, we depreciate the various components of ourdrilling rigs, workover rigs and wireline units over 2 to 25 years and refurbishments over 3 to 5 years, whilefederal income tax rules require that we depreciate drilling rigs, workover rigs, wireline units and refurbishmentsover 5 years. Therefore, in the first 5 years of our ownership of a drilling rig, workover rig or wireline unit, our
43

tax depreciation exceeds our financial reporting depreciation, resulting in our providing deferred taxes on thisdepreciation difference. After 5 years, financial reporting depreciation exceeds tax depreciation, and the deferredtax liability begins to reverse.
Accounting estimates
We consider the recognition of revenues and costs on turnkey and footage contracts to be critical accountingestimates. On these types of contracts, we are required to estimate the number of days needed for us to completethe contract and our total cost to complete the contract. Our actual costs could substantially exceed our estimatedcosts if we encounter problems such as lost circulation, stuck drill pipe or an underground blowout on contractsstill in progress subsequent to the release of the financial statements. We receive payment under turnkey andfootage contracts when we deliver to our customer a well completed to the depth specified in the contract, unlessthe customer authorizes us to drill to a more shallow depth. Since 1995, we have completed all our turnkey orfootage contracts. Although our initial cost estimates for turnkey and footage contracts do not include costestimates for risks such as stuck drill pipe or loss of circulation, we believe that our experienced managementteam, our knowledge of geologic formations in our areas of operations, the condition of our drilling equipmentand our experienced crews have previously enabled us to make reasonable cost estimates and complete contractsaccording to our drilling plan. While we do bear the risk of loss for cost overruns and other events that are notspecifically provided for in our initial cost estimates, our pricing of turnkey and footage contracts takes such risksinto consideration. When we encounter, during the course of our drilling operations, conditions unforeseen in thepreparation of our original cost estimate, we increase our cost estimate to complete the contract. If we anticipatea loss on a contract in progress at the end of a reporting period due to a change in our cost estimate, we accrue theentire amount of the estimated loss, including all costs that are included in our revised estimated cost to completethat contract, in our consolidated statement of operations for that reporting period. During the year endedDecember 31, 2008, we experienced losses on six of the 81 turnkey and footage contracts completed, with a lossof less than $25,000 each on three of these contracts and a loss of less than $130,000 each on the remaining threecontracts. We are more likely to encounter losses on turnkey and footage contracts in periods in which revenuerates are lower for all types of contracts. During periods of reduced demand for drilling rigs, our overallprofitability on turnkey and footage contracts has historically exceeded our profitability on daywork contracts.
Revenues and costs during a reporting period could be affected for contracts in progress at the end of areporting period which have not been completed before our financial statements for that period are released. Wedid not have any turnkey or footage contracts in progress at December 31, 2008. Our unbilled receivables of$12.3 million at December 31, 2008 did not include any amounts related to turnkey or footage contracts.
We estimate an allowance for doubtful accounts based on the creditworthiness of our customers as well asgeneral economic conditions. We evaluate the creditworthiness of our customers based on commercial creditreports, trade references, bank references, financial information, production information and any past experiencewe have with the customer. Consequently, any change in those factors could affect our estimate of our allowancefor doubtful accounts. In some instances, we require new customers to establish escrow accounts or makeprepayments. We typically invoice our customers at 15-day intervals during the performance of dayworkcontracts and upon completion of the daywork contract. Turnkey and footage contracts are invoiced uponcompletion of the contract. Our typical contract provides for payment of invoices in 10 to 30 days. We generallydo not extend payment terms beyond 30 days and have not extended payment terms beyond 90 days for any ofour contracts in the last three fiscal years. We had an allowance for doubtful accounts of $1.6 million atDecember 31, 2008 and no allowance for doubtful accounts at December 31, 2007.
Our determination of the useful lives of our depreciable assets, which directly affects our determination ofdepreciation expense and deferred taxes is also a critical accounting estimate. A decrease in the useful life of ourproperty and equipment would increase depreciation expense and reduce deferred taxes. We provide fordepreciation of our drilling, production, transportation and other equipment on a straight-line method over usefullives that we have estimated and that range from 2 to 25 years. We record the same depreciation expense whether
44

a drilling rig, workover rig or wireline unit is idle or working. Our estimates of the useful lives of our drilling,production, transportation and other equipment are based on our more than 35 years of experience in the oilfieldservices industry with similar equipment. Effective January 1, 2008, we reassessed the estimated useful livesassigned to a group of 19 drilling rigs that were recently constructed. These drilling rigs were constructed withnew components that have longer estimated useful lives when compared to other drilling rigs that are equippedwith older components. As a result, we increased the estimated useful lives for this group of recently constructeddrilling rigs from an average useful life of 9 years to 12 years. This change in the estimated useful lives of thisgroup of 19 drilling rigs resulted in a $3.8 million decrease in depreciation and amortization expense for the yearended December 31, 2008.
As of December 31, 2008, we had foreign deferred tax assets consisting of foreign net operating losses andother tax benefits available to reduce future taxable income in a foreign jurisdiction. In assessing the realizabilityof our foreign deferred tax assets, we only recognize a tax benefit to the extent of taxable income that we expectto earn in the foreign jurisdiction in future periods. Due to recent declines in oil and natural gas prices and thedownturn in our industry, we anticipate reductions in drilling rig utilization and revenue rates in 2009.Consequently, we have a valuation allowance of $5.4 million that fully offsets our foreign deferred tax assets.The foreign net operating loss has an indefinite carryforward period. The foreign net operating loss is primarilydue to the special income tax benefits permitted by the Colombian government that allows us to recover 140% ofthe cost of certain imported assets. We exported a 1500 horsepower drilling rig to Colombia in October 2008. Toobtain this special income tax benefit, our U.S operating company sold this drilling rig in October 2008 toStayton Asset Group, a variable interest entity established for this transaction for which we are the primarybeneficiary. Stayton Asset Group immediately sold this drilling rig to our operating entity in Colombia.
Our accrued insurance premiums and deductibles as of December 31, 2008 include accruals for costsincurred under the self-insurance portion of our health insurance of approximately $1.1 million and our workers’compensation, general liability and auto liability insurance of approximately $9.6 million. We have a deductibleof $125,000 per covered individual per year under the health insurance. We have a deductible of $500,000 peroccurrence under our workers’ compensation insurance, except in North Dakota, where we do not have adeductible. We have deductibles of $250,000 and $100,000 per occurrence under our general liability insuranceand auto liability insurance, respectively. We accrue for these costs as claims are incurred based on historicalclaim development data, and we accrue the costs of administrative services associated with claims processing.We also evaluate our workers’ compensation claim cost estimates based on estimates provided by a professionalactuary.
45

Results of Operations
Effective March 1, 2008, we acquired the production services businesses of WEDGE and Competitionwhich provide well services, wireline services and fishing and rental services. These acquisitions resulted in theformation of our new operating segment, the Production Services Division. We consolidated the results of theseacquisitions from the day they were acquired. These acquisitions affect the comparability from period to periodof our historical results, and our historical results may not be indicative of our future results.
Statements of Operations Analysis—Year Ended December 31, 2008 Compared with the Year EndedDecember 31, 2007
The following table provides information about our operations for the years ended December 31, 2008 andDecember 31, 2007.
Years endedDecember 31,
2008 2007
(amounts in thousands)
Drilling Services Division:Revenues . . . . . . . . . . . . . . . . . . . . . . . . . . . . . . . . . . . . . . . . . . . . . . . . . . $456,890 $417,231Operating costs . . . . . . . . . . . . . . . . . . . . . . . . . . . . . . . . . . . . . . . . . . . . . 269,846 250,564
Drilling Services Division margin . . . . . . . . . . . . . . . . . . . . . . . . . . $187,044 $166,667
Average number of drilling rigs . . . . . . . . . . . . . . . . . . . . . . . . . . . . . . . . 67.4 66.1Utilization rate . . . . . . . . . . . . . . . . . . . . . . . . . . . . . . . . . . . . . . . . . . . . . . 89% 89%Revenue days . . . . . . . . . . . . . . . . . . . . . . . . . . . . . . . . . . . . . . . . . . . . . . . 22,057 21,492
Average revenues per day . . . . . . . . . . . . . . . . . . . . . . . . . . . . . . . . . . . . . $ 20,714 $ 19,413Average operating costs per day . . . . . . . . . . . . . . . . . . . . . . . . . . . . . . . . 12,234 11,658
Drilling Services Division margin per day . . . . . . . . . . . . . . . . . . . . $ 8,480 $ 7,755
Production Services Division:Revenues . . . . . . . . . . . . . . . . . . . . . . . . . . . . . . . . . . . . . . . . . . . . . . . . . . $153,994 $ —Operating costs . . . . . . . . . . . . . . . . . . . . . . . . . . . . . . . . . . . . . . . . . . . . . 80,097 —
Production Services Division margin . . . . . . . . . . . . . . . . . . . . . . . . $ 73,897 $ —
Combined:Revenues . . . . . . . . . . . . . . . . . . . . . . . . . . . . . . . . . . . . . . . . . . . . . . . . . . $610,884 $417,231Operating costs . . . . . . . . . . . . . . . . . . . . . . . . . . . . . . . . . . . . . . . . . . . . . 349,943 250,564
Combined margin . . . . . . . . . . . . . . . . . . . . . . . . . . . . . . . . . . . . . . . $260,941 $166,667
EBITDA . . . . . . . . . . . . . . . . . . . . . . . . . . . . . . . . . . . . . . . . . . . . . . . . . . $214,766 $144,583
46

We present Drilling Services Division margin, Production Services Division margin, combined margin andearnings before interest, taxes, depreciation, amortization and impairments (EBITDA) information because webelieve it provides investors and our management additional information to assist them in assessing our businessand performance in comparison to other companies in our industry. Since Drilling Services Division margin,Production Services Division margin, combined margin and EBITDA are “non-GAAP” financial measure underthe rules and regulations of the SEC, we are providing the following reconciliation of combined margin andEBITDA to net (loss) earnings, which is the nearest comparable GAAP financial measure.
Year endedDecember 31,
2008 2007
(amounts in thousands)
Reconciliation of combined margin andEBITDA to net (loss) earnings:
Combined margin . . . . . . . . . . . . . . . . . . . . . . . . . . . . . . . . . . . . . . . . . . . 260,941 166,667Selling, general and administrative . . . . . . . . . . . . . . . . . . . . . . . . . (44,834) (19,608)Bad debt expense . . . . . . . . . . . . . . . . . . . . . . . . . . . . . . . . . . . . . . . (423) (2,612)Other income (expense) . . . . . . . . . . . . . . . . . . . . . . . . . . . . . . . . . . (918) 136
EBITDA . . . . . . . . . . . . . . . . . . . . . . . . . . . . . . . . . . . . . . . . . . . . . . . . . . 214,766 144,583Depreciation and amortization . . . . . . . . . . . . . . . . . . . . . . . . . . . . . (88,145) (63,588)Impairment of goodwill . . . . . . . . . . . . . . . . . . . . . . . . . . . . . . . . . . (118,646) —Impairment of intangible assets . . . . . . . . . . . . . . . . . . . . . . . . . . . . (52,847) —Interest income (expense), net . . . . . . . . . . . . . . . . . . . . . . . . . . . . . (11,816) 3,266Income tax expense . . . . . . . . . . . . . . . . . . . . . . . . . . . . . . . . . . . . . (6,057) (27,398)
Net (loss) earnings . . . . . . . . . . . . . . . . . . . . . . . . . . . . . . . . . . $ (62,745) $ 56,863
Our Drilling Services Division’s revenues increased by $39.7 million, or 10%, for the year endedDecember 31, 2008, as compared to the year ended December 31, 2007, due to an increase in average contractdrilling revenues of $1,301 per day, or 7%, that resulted from an increased demand for drilling rigs and higherrevenues per day earned by our Colombian operations that expanded significantly during 2008. The increase inDrilling Services Divisions revenues is also due to a 3% increase in revenue days that resulted from a slightlyhigher average number of drilling rigs.
Our Drilling Services Division’s operating costs grew by $19.3 million, or 8%, for the year endedDecember 31, 2008, as compared to the year ended December 31, 2007, due to an increase in average contractdrilling operating costs of $576 per day, or 5%, that resulted primarily from higher operating costs per day forour Colombian operations which has higher labor and fuel costs when compared to drilling operations in theUnited States. This increase in our Drilling Services Division’s operating costs is also due to a 3% increase inrevenue days that resulted from a slightly higher average number of drilling rigs.
Our Production Services Division’s revenue of $154.0 million and operating costs of $80.1 million for theyear ended December 31, 2008 are based on the operating results for this new operating segment which wascreated on March 1, 2008 when we acquired the production services businesses of WEDGE and Competition.
Our selling, general and administrative expense for the year ended December 31, 2008 increased byapproximately $25.2 million, or 129%, compared to the year ended December 31, 2007. The increase resulted from$4.4 million in additional compensation-related expenses incurred for existing and new employees in our corporateoffice which includes $0.9 million paid to our former Chief Financial Officer pursuant to a severance agreement.Professional and consulting expenses increased $5.2 million during the year ended December 31, 2008 whichincludes approximately $3.1 million due to an investigation conducted by the special subcommittee of our Board ofDirectors. In addition, we incurred $15.1 million and $0.7 million of additional selling, general and administrativeexpenses relating to our Production Service Division and our Colombian operations, respectively.
47

Our bad debt expense decreased by $2.2 million for the year ended December 31, 2008, as compared to theyear ended December 31, 2007, primarily due to a write-off of a trade receivable during the year endedDecember 31, 2007 for a former customer in bankruptcy.
Our other income for the year ended December 31, 2008 decreased by $1.0 million as compared to the yearended December 31, 2007, primarily due to foreign currency translation losses relating to our operations inColombia.
Our depreciation and amortization expenses increased by $24.6 million, or 39%, for the year endedDecember 31, 2008, as compared to December 31, 2007. The increase resulted primarily from additionaldepreciation and amortization expense of $21.8 million for our Production Services Division acquisitions, whichincludes an increase in amortization expense of intangible assets of $8.3 million. The increase is also due to theincreases in the average size of our drilling rig fleet, which consisted of newly constructed rigs. Partiallyoffsetting the increase in depreciation and amortization expense was a decrease of $3.8 million for the year endedDecember 31, 2008, resulting from the change in the estimated useful lives of a group of 19 drilling rigs from anaverage useful life of 9 years to 12 years.
We recorded goodwill of $118.6 million in our Production Services Division operating segment inconnection with the acquisitions of the production services businesses from WEDGE, Competition, Pettus andPaltec, all of which occurred during the year ended December 31, 2008. On December 31, 2008, we performedan impairment analysis that lead us to conclude that there would be no remaining implied value attributable toour goodwill, and, accordingly, we recorded a non-cash charge of $118.6 million for the full impairment of ourgoodwill. In addition, we performed an intangible asset impairment analysis on December 31, 2008, whichresulted in a reduction to our intangible asset carrying value of customers’ relationships and a non-cashimpairment charge of $52.8 million. These impairment charges are not expected to have an impact on ourliquidity or debt covenants; however, they are a reflection of the overall downturn in our industry and decline inour projected cash flows.
Interest expense for the year ended December 31, 2008 is primarily related to interest due on the amountsoutstanding under our senior secured revolving credit facility which was primarily used to fund the acquisitionsof the production services businesses of WEDGE and Competition on March 1, 2008.
Our income tax expense is $6.1 million for the year ended December 31, 2008, as compared to an expectedincome tax benefit of $19.8 million, which is based on the federal statutory rate of 35%, primarily due to thepermanent differences between GAAP requirements and United States income tax regulations. Certain types ofgoodwill are not amortizable for income tax purposes. A significant portion of the goodwill impairment chargerecorded for GAAP purposes during the year ended December 31, 2008, is not deductible for income taxpurposes in the current year or in future years. Therefore, our results of operations reflect a pretax loss for GAAPpurposes, but our results of operations will reflect pretax income for tax purposes. The increase in income taxexpense was partially offset by tax benefits in foreign jurisdictions and other permanent differences.
48

Statements of Operations Analysis—Nine Months Ended December 31, 2007 Compared with the NineMonths Ended December 31, 2006
The following table provides information about our operations for the nine months ended December 31,2007 and December 31, 2006.
Nine Months EndedDecember 31,
2007 2006
(In thousands)
Contract drilling revenues:Daywork contracts . . . . . . . . . . . . . . . . . . . . . . . . . . . . . . . . . . . . . . . . . . . $292,617 $302,272Turnkey contracts . . . . . . . . . . . . . . . . . . . . . . . . . . . . . . . . . . . . . . . . . . . 4,979 —Footage contracts . . . . . . . . . . . . . . . . . . . . . . . . . . . . . . . . . . . . . . . . . . . . 16,288 10,559
Total contract drilling revenues . . . . . . . . . . . . . . . . . . . . . . . . . . . . $313,884 $312,831
Contract drilling costs:Daywork contracts . . . . . . . . . . . . . . . . . . . . . . . . . . . . . . . . . . . . . . . . . . . $175,299 $152,625Turnkey contracts . . . . . . . . . . . . . . . . . . . . . . . . . . . . . . . . . . . . . . . . . . . 3,168 —Footage contracts . . . . . . . . . . . . . . . . . . . . . . . . . . . . . . . . . . . . . . . . . . . . 12,907 7,538
Total contract drilling costs . . . . . . . . . . . . . . . . . . . . . . . . . . . . . . . . $191,374 $160,163
Drilling margin:Daywork contracts . . . . . . . . . . . . . . . . . . . . . . . . . . . . . . . . . . . . . . . . . . . $117,318 $149,647Turnkey contracts . . . . . . . . . . . . . . . . . . . . . . . . . . . . . . . . . . . . . . . . . . . 1,811 —Footage contracts . . . . . . . . . . . . . . . . . . . . . . . . . . . . . . . . . . . . . . . . . . . . 3,381 3,021
Total drilling margin . . . . . . . . . . . . . . . . . . . . . . . . . . . . . . . . . . . . . $122,510 $152,668
Revenue days by type of contract:Daywork contracts . . . . . . . . . . . . . . . . . . . . . . . . . . . . . . . . . . . . . . . . . . . 15,203 15,084Turnkey contracts . . . . . . . . . . . . . . . . . . . . . . . . . . . . . . . . . . . . . . . . . . . 118 —Footage contracts . . . . . . . . . . . . . . . . . . . . . . . . . . . . . . . . . . . . . . . . . . . . 968 643
Total revenue days . . . . . . . . . . . . . . . . . . . . . . . . . . . . . . . . . . . . . . 16,289 15,727
EBITDA . . . . . . . . . . . . . . . . . . . . . . . . . . . . . . . . . . . . . . . . . . . . . . . . . . . . . . $104,241 $139,548
Contract drilling revenue per revenue day . . . . . . . . . . . . . . . . . . . . . . . . . . . . $ 19,270 $ 19,891Contract drilling costs per revenue day . . . . . . . . . . . . . . . . . . . . . . . . . . . . . . . $ 11,749 $ 10,184Drilling margin per revenue day . . . . . . . . . . . . . . . . . . . . . . . . . . . . . . . . . . . . $ 7,521 $ 9,707Rig utilization rates . . . . . . . . . . . . . . . . . . . . . . . . . . . . . . . . . . . . . . . . . . . . . . 89% 97%Average number of rigs during the period . . . . . . . . . . . . . . . . . . . . . . . . . . . . 66.7 59.6
49

We present drilling margin and earnings before interest, taxes, depreciation and amortization (EBITDA)information because we believe it provides investors and our management additional information to assist themin assessing our business and performance in comparison to other companies in our industry. Since drillingmargin and EBITDA are “non-GAAP” financial measure under the rules and regulations of the SEC, we areproviding the following reconciliation of drilling margin and EBITDA to net earnings, which is the nearestcomparable GAAP financial measure.
Nine Months EndedDecember 31,
2007 2006
(In thousands)
Reconciliation of drilling margin andEBITDA to net earnings:
Drilling margin . . . . . . . . . . . . . . . . . . . . . . . . . . . . . . . . . . . . . . . . . . . . . $122,510 $152,668General and administrative expense . . . . . . . . . . . . . . . . . . . . . . . . . (15,786) (12,370)Bad debt expense . . . . . . . . . . . . . . . . . . . . . . . . . . . . . . . . . . . . . . . . (2,612) (800)Other income . . . . . . . . . . . . . . . . . . . . . . . . . . . . . . . . . . . . . . . . . . . 129 50
EBITDA . . . . . . . . . . . . . . . . . . . . . . . . . . . . . . . . . . . . . . . . . . . . . . . . . . 104,241 139,548
Income tax expense . . . . . . . . . . . . . . . . . . . . . . . . . . . . . . . . . . . . . . (18,129) (37,341)Interest income (expense), net . . . . . . . . . . . . . . . . . . . . . . . . . . . . . . 2,385 2,874Depreciation and amortization . . . . . . . . . . . . . . . . . . . . . . . . . . . . . (48,852) (38,120)
Net earnings . . . . . . . . . . . . . . . . . . . . . . . . . . . . . . . . . . . . . . . . $ 39,645 $ 66,961
Our contract drilling revenues grew by $1.1 million, or .3%, for the nine months ended December 31, 2007from the nine months ended December 31, 2006, due to a 4% increase in revenue days due to an increase in thenumber of rigs in our fleet. The overall increase was partially offset by a decrease in contract drilling revenues of$621 per day, or 3%, resulting from a reduced demand for drilling rigs.
Our contract drilling costs grew by $31.2 million, or 19.5%, during the nine months ended December 31,2007 from the corresponding period in 2006, primarily due to the increase in the number of revenue daysresulting from the increase in the number of rigs in our fleet. Our contract drilling costs per revenue dayincreased by $1,565, or 15%, during the nine months ended December 31, 2007 from the corresponding period in2006, primarily due to higher payroll and higher repairs and maintenance expenses. Contract drilling costs alsoincreased due to a shift to more turnkey and footage revenue days as a percentage of total revenue days. Turnkeyand footage revenue days represented 7% of total revenue days during the nine months ended December 31,2007, compared to 4% during the nine months ended December 31, 2006. Under turnkey and footage contracts,we provide supplies and materials such as fuel, drill bits, casing and drilling fluids, which significantly add todrilling costs when compared to daywork contracts. These costs are also included in the revenues we recognizefor turnkey and footage contracts, resulting in higher revenue rates per day for turnkey and footage contractscompared to daywork contracts which do not include such costs.
Our general and administrative expense for the nine months ended December 31, 2007 increased by $3.4million, or 28%, compared to the corresponding period in 2006. The increase resulted from $1.1 million inadditional compensation-related expenses for salaries, bonuses, relocation benefits and stock options incurred forexisting and new employees in our corporate office. Professional and consulting expenses increased $1.1 millionduring the nine months ended December 31, 2007. In addition, we incurred $.3 million of additional general andadministrative expenses during the nine months ended December 31, 2007 relating to the commencement of ourColombian operations.
Our depreciation and amortization expenses for the nine months ended December 31, 2007 increased by$10.7 million, or 28%, compared to the corresponding period in 2006. These increase in 2007 over 2006 resultedprimarily from an increase in the average size of our rig fleet, which increases consisted entirely of newly
50

constructed rigs. The higher costs of our new rigs increased our average depreciation costs per revenue day by$575 to $2,999 from $2,424 during the nine months ended December 31, 2007, compared to the correspondingperiod in 2006.
Interest income for the nine months ended December 31, 2007 decreased by $.5 million, or 16%, comparedto the corresponding period in 2006 due to lower average cash and cash equivalents balances during the ninemonths ended December 31, 2007 as compared to the corresponding period in 2006. Average cash and cashequivalents balances were $74.2 million and $85.8 million during the nine months ended 2007 and 2006,respectively.
Our effective income tax rates of 31.4% and 35.8% for the nine months ended December 31, 2007 and2006, respectively, differ from the federal statutory rate of 35% due to tax benefits in foreign jurisdictions, taxbenefits recognized for a previously unrecognized tax position, permanent differences and state income taxes.
Our contract land drilling operations are subject to various federal and state laws and regulations designed toprotect the environment. Maintaining compliance with these regulations is part of our day-to-day operatingprocedures. We monitor each of our yard facilities and each of our rig locations on a day-to-day basis forpotential environmental spill risks. In addition, we maintain a spill prevention control and countermeasures planfor each yard facility and each rig location. The costs of these procedures represent only a small portion of ourroutine employee training, equipment maintenance and job site maintenance costs. We estimate the annualcompliance costs for this program to be approximately $.4 million. We are not aware of any potentialenvironmental clean-up obligations that would have a material adverse effect on our financial condition or resultsof operations.
Inflation
Due to the increased rig count in each of our market areas over the past several years, availability ofpersonnel to operate our rigs is limited. In April 2005, January 2006, May 2006 and September 2008, we raisedwage rates for our drilling rig personnel by an average of 6%, 6%, 14% and 6%, respectively. We were able topass these wage rate increases on to our customers based on contract terms. In February 2009, we reduced wagerates for drilling rig personnel to offset the wage rate increases from September 2008. We do not expect wagerate increases during the fiscal year ending December 31, 2009.
We are experiencing increases in costs for rig repairs and maintenance and costs of rig upgrades and new rigconstruction, due to the increased industry-wide demand for equipment, supplies and service. We estimate thesecosts increased by 10% to 15% during the fiscal years ended December 31, 2007 and 2008. We do not expectsimilar cost increases during the fiscal year ending December 31, 2009.
Off-Balance Sheet Arrangements
We do not currently have any off-balance sheet arrangements.
Recently Issued Accounting Standards
In September 2006, the FASB issued SFAS No. 157, Fair Value Measurements. SFAS No. 157 defines fairvalue, establishes a framework for measuring fair value and expands disclosure of fair value measurements.SFAS No. 157 applies under other accounting pronouncements that require or permit fair value measurementsand, accordingly, does not require any new fair value measurements. SFAS No. 157, as issued, was effective forfinancial statement issued for fiscal years beginning after November 15, 2007, and interim periods within thosefiscal years. However, on February 12, 2008, the FASB issued FSP FAS No. 157-2, Effective Dates of FASBStatement No. 157, which delays the effective date of SFAS No. 157 for fiscal years beginning afterNovember 15, 2008 for all nonfinancial assets and nonfinancial liabilities, except those that are recognized ordisclosed at fair value in the financial statements on a recurring basis. The adoption of SFAS No. 157 did nothave a material impact on our financial position or results of operations.
51

In February 2007, the FASB issued SFAS No. 159, The Fair Value Option for Financial Assets andFinancial Liabilities—Including an amendment of FASB Statement No. 115. This statement permits entities tochoose to measure many financial instruments and certain other items at fair value that are not currently requiredto be measured at fair value and establishes presentation and disclosure requirements designed to facilitatecomparisons between entities that choose different measurement attributes for similar types of assets andliabilities. SFAS No. 159 is effective for fiscal years beginning after November 15, 2007. The adoption of SFASNo. 159 did not have a material impact on our financial position or results of operations.
In December 2007, the FASB issued SFAS No. 160, Noncontrolling interests in Consolidated FinancialStatements—an Amendment of ARB No. 51. This statement establishes accounting and reporting standards for thenon-controlling interest in a subsidiary and for the deconsolidation of a subsidiary. SFAS No. 160 clarifies that anon-controlling interest in a subsidiary, which is sometimes referred to as minority interest, is an ownershipinterest in the consolidated entity that should be reported as a component of equity in the consolidated financialstatements. Among other requirements, SFAS No. 160 requires consolidated net income to be reported atamounts that include the amounts attributable to both the parent and the non-controlling interest. It also requiresdisclosure, on the face of the consolidated income statement, of the amounts of consolidated net incomeattributable to the parent and to the non-controlling interest. SFAS No.160 is effective for fiscal years beginningon or after December 15, 2008. We do not expect the adoption to have a material impact on our financial positionor results of operations.
In December 2007, the FASB issued SFAS No. 141R (revised 2007) which replaces SFAS No. 141,Business Combinations (“SFAS No. 141R”). SFAS No. 141R applies to all transactions and other events inwhich one entity obtains control over one or more other businesses. SFAS No. 141R requires an acquirer, uponinitially obtaining control of another entity, to recognize the assets, liabilities and any non-controlling interest inthe acquiree at fair value as of the acquisition date. Contingent consideration is required to be recognized andmeasured at fair value on the date of acquisition rather than at a later date when the amount of that considerationmay be determinable beyond a reasonable doubt. This fair value approach replaces the cost-allocation processrequired under SFAS No. 141 whereby the cost of an acquisition was allocated to the individual assets acquiredand liabilities assumed based on their estimated fair value. SFAS No. 141R requires acquirers to expenseacquisition-related costs as incurred rather than allocating such costs to the assets acquired and liabilitiesassumed, as was previously the case under SFAS No. 141. Under SFAS No.141R, the requirements of SFAS No.146, Accounting for Costs Associated with Exit or Disposal Activities, would have to be met in order to accruefor a restructuring plan in purchase accounting. Pre-acquisition contingencies are to be recognized at fair value,unless it is a non-contractual contingency that is not likely to materialize, in which case, nothing should berecognized in purchase accounting and, instead, that contingency would be subject to the recognition criteria ofSFAS No. 5, Accounting for Contingencies. SFAS No.141R is expected to have a significant impact on ouraccounting for business combinations closing on or after January 1, 2009.
In March 2008, the FASB issued SFAS No. 161, Disclosures about Derivative Instruments and HedgingActivities—an amendment of FASB Statement No. 133 (“SFAS No. 161”). SFAS No. 161 changes the disclosurerequirements for derivative instruments and hedging activities. Entities are required to provide enhanceddisclosures about (a) how and why an entity uses derivative instruments, (b) how derivative instruments andrelated hedged items are accounted for under Statement 133 and its related interpretations, and (c) how derivativeinstruments and related hedged items affect an entity’s financial position, financial performance, and cash flows.The guidance in SFAS No. 161 is effective for financial statements issued for fiscal years and interim periodsbeginning after November 15, 2008, with early application encouraged. This Statement encourages, but does notrequire, comparative disclosures for earlier periods at initial adoption. We do not have any derivative instrumentsand expect the adoption of SFAS No. 161 to have no impact on our financial position or results of operations.
In April 2008, the FASB issued FSP SFAS 142-3, Determination of the Useful Life of Intangible Assets.This guidance is intended to improve the consistency between the useful life of a recognized intangible assetunder SFAS 142, Goodwill and Other Intangible Assets, and the period of expected cash flows used to measurethe fair value of the asset under SFAS 141R when the underlying arrangement includes renewal or extension of
52

terms that would require substantial costs or result in a material modification to the asset upon renewal orextension. Companies estimating the useful life of a recognized intangible asset must now consider theirhistorical experience in renewing or extending similar arrangements or, in the absence of historical experience,must consider assumptions that market participants would use about renewal or extension as adjusted for SFASNo. 142’s entity-specific factors. FSP 142-3 is effective for periods beginning on or after January 1, 2009. We donot expect the adoption to have a material impact on our financial position or results of operations.
In May 2008, the FASB issued SFAS No. 162, The Hierarchy of Generally Accepted Accounting Principles(“SFAS No. 162”). SFAS No. 162 identifies the sources of accounting principles and the framework for selectingthe principles used in the preparation of financial statements that are presented in conformity with generallyaccepted accounting principles. SFAS No. 162 is effective 60 days following approval by the Securities andExchange Commission of the Public Company Accounting Oversight Board’s amendments to AU Section 411,The Meaning of Present Fairly in Conformity with Generally Accepted Accounting Principles. The adoption ofSFAS No. 162 did not have a material impact on our financial position or results of operations.
In June 2008, the FASB issued FSP No. EITF 03-6-1, Determining Whether Instruments Granted in Share-Based Payment Transactions are Participating Securities. This FSP provides that unvested share-based paymentawards that contain nonforfeitable rights to dividends are participating securities and shall be included in thecomputation of earnings per share pursuant to the two class method. This FSP is effective for financial statementsissued for fiscal years beginning after December 15, 2008 and interim periods within those years. We do notexpect the adoption of this FSP to have a material impact on our financial position or results of operations.
Item 7A. Quantitative and Qualitative Disclosures About Market Risk
Interest Rate Risk
We are subject to interest rate market risk on our variable rate debt. As of December 31, 2008, we had$272.5 million outstanding under our senior secured revolving credit facility subject to variable interest rate risk.The impact of a 1% increase in interest rates on this amount of debt would result in increased interest expense ofapproximately $2.7 million and a decrease in net income of approximately $1.8 million during an annual period.
At December 31, 2008, we held $15.9 million (par value) of investments comprised of tax exempt, auctionrate preferred securities (“ARPSs”), which are variable-rate preferred securities and have a long-term maturitywith the interest rate being reset through “Dutch auctions” that are held every 7 days. The ARPSs havehistorically traded at par because of the frequent interest rate resets and because they are callable at par at theoption of the issuer. Interest is paid at the end of each auction period. Our ARPSs are AAA/Aaa rated securities,collateralized by municipal bonds and backed by assets that are equal to or greater than 200% of the liquidationpreference. Until February 2008, the auction rate securities market was highly liquid. Beginning mid-February2008, we experienced several “failed” auctions, meaning that there was not enough demand to sell all of thesecurities that holders desired to sell at auction. The immediate effect of a failed auction is that such holderscannot sell the securities at auction and the interest rate on the security resets to a maximum auction rate. Wehave continued to receive interest payments on our ARPSs in accordance with their terms. Unless a futureauction is successful or the issuer calls the security pursuant to redemption prior to maturity, we may not be ableto access the funds we invested in our ARPSs without a loss of principal. We have no reason to believe that anyof the underlying municipal securities that collateralize our ARPSs are presently at risk of default. We believe wewill ultimately be able to liquidate our investments without material loss primarily due to the collateral securingthe ARPSs. We do not currently intend to attempt to sell our ARPSs at a discount since our liquidity needs areexpected to be met with cash flows from operating activities and our senior secured revolving credit facility. OurARPSs are designated as available-for-sale and are reported at fair market value with the related unrealized gainsor losses, included in accumulated other comprehensive income (loss), net of tax, a component of shareholders’equity. The estimated fair value of our ARPSs at December 31, 2008 was $13.9 million compared with a parvalue of $15.9 million. The $2.0 million difference represents a fair value discount due to the current lack of
53

liquidity which is considered temporary and is recorded as an unrealized loss. We would recognize animpairment charge if the fair value of our investments falls below the cost basis and is judged to be other-than-temporary. Our ARPSs are classified with other long-term assets on our consolidated balance sheet as ofDecember 31, 2008 because of our inability to determine the recovery period of our investments.
Foreign Currency Risk
While the U.S. dollar is the functional currency for reporting purposes for our Colombian operations, weenter into transactions denominated in Colombian pesos. Nonmonetary assets and liabilities are translated athistorical rates and monetary assets and liabilities are translated at exchange rates in effect at the end of theperiod. Income statement accounts are translated at average rates for the period. As a result, Colombian Pesodenominated transactions are affected by changes in exchange rates. We generally accept the exposure toexchange rate movements without using derivative financial instruments to manage this risk. Therefore, bothpositive and negative movements in the Colombian Peso currency exchange rate against the U.S. dollar has andwill continue to affect the reported amount of revenues, expenses, profit, and assets and liabilities in theCompany’s consolidated financial statements.
The impact of currency rate changes on our Colombian Peso denominated transactions and balances resultedin foreign currency losses of $1.4 million for the year ended December 31, 2008.
54

Item 8. Financial Statements and Supplementary Data
PIONEER DRILLING COMPANY
INDEX TO CONSOLIDATED FINANCIAL STATEMENTS
Page
Reports of Independent Registered Public Accounting Firm . . . . . . . . . . . . . . . . . . . . . . . . . . . . . . . . . . . . . . 56
Consolidated Balance Sheets as of December 31, 2008 and December 31, 2007 . . . . . . . . . . . . . . . . . . . . . . 58
Consolidated Statements of Operations for the Year Ended December 31, 2008, the Nine Months EndedDecember 31, 2007 and the Year Ended March 31, 2007. . . . . . . . . . . . . . . . . . . . . . . . . . . . . . . . . . . . . . . 59
Consolidated Statements of Shareholders’ Equity and Comprehensive Income for the Year EndedDecember 31, 2008, the Nine Months Ended December 31, 2007 and the Year Ended March 31,2007. . . . . . . . . . . . . . . . . . . . . . . . . . . . . . . . . . . . . . . . . . . . . . . . . . . . . . . . . . . . . . . . . . . . . . . . . . . . . . . . 60
Consolidated Statements of Cash Flows for the Year Ended December 31, 2008, the Nine Months EndedDecember 31, 2007 and the Year Ended March 31, 2007. . . . . . . . . . . . . . . . . . . . . . . . . . . . . . . . . . . . . . . 61
Notes to Consolidated Financial Statements . . . . . . . . . . . . . . . . . . . . . . . . . . . . . . . . . . . . . . . . . . . . . . . . . . 62
55

Report of Independent Registered Public Accounting Firm
To the Board of Directors and ShareholdersPioneer Drilling Company:
We have audited the accompanying consolidated balance sheets of Pioneer Drilling Company andsubsidiaries as of December 31, 2008 and 2007, and the related consolidated statements of operations,shareholders’ equity and comprehensive income, and cash flows for the year ended December 31, 2008, the ninemonths ended December 31, 2007 and the year ended March 31, 2007. These consolidated financial statementsand financial statement schedule are the responsibility of the Company’s management. Our responsibility is toexpress an opinion on these consolidated financial statements based on our audits.
We conducted our audits in accordance with the standards of the Public Company Accounting OversightBoard (United States). Those standards require that we plan and perform the audit to obtain reasonable assuranceabout whether the financial statements are free of material misstatement. An audit includes examining, on a testbasis, evidence supporting the amounts and disclosures in the financial statements. An audit also includesassessing the accounting principles used and significant estimates made by management, as well as evaluatingthe overall financial statement presentation. We believe that our audits provide a reasonable basis for ouropinion.
In our opinion, the consolidated financial statements referred to above present fairly, in all material respects,the financial position of Pioneer Drilling Company and subsidiaries as of December 31, 2008 and 2007, and theresults of their operations and their cash flows for the year ended December 31, 2008, the nine months endedDecember 31, 2007 and the year ended March 31, 2007, in conformity with U.S. generally accepted accountingprinciples.
We also have audited, in accordance with the standards of the Public Company Accounting Oversight Board(United States), the effectiveness of Pioneer Drilling Company’s internal control over financial reporting as ofDecember 31, 2008, based on criteria established in Internal Control—Integrated Framework issued by theCommittee of Sponsoring Organizations of the Treadway Commission (COSO), and our report datedFebruary 25, 2009 expressed an unqualified opinion on the effectiveness of the Company’s internal control overfinancial reporting.
/s/ KPMG LLP
San Antonio, TexasFebruary 25, 2009
56

Report of Independent Registered Public Accounting Firm
The Board of Directors and StockholdersPioneer Drilling Company:
We have audited Pioneer Drilling Company’s internal control over financial reporting as of December 31,2008, based on criteria established in Internal Control—Integrated Framework issued by the Committee ofSponsoring Organizations of the Treadway Commission (COSO). Pioneer Drilling Company’s management isresponsible for maintaining effective internal control over financial reporting and for its assessment of theeffectiveness of internal control over financial reporting included in the accompanying Management’s Report onInternal Control Over Financial Reporting. Our responsibility is to express an opinion on the Company’s internalcontrol over financial reporting based on our audit.
We conducted our audit in accordance with the standards of the Public Company Accounting OversightBoard (United States). Those standards require that we plan and perform the audit to obtain reasonable assuranceabout whether effective internal control over financial reporting was maintained in all material respects. Ouraudit included obtaining an understanding of internal control over financial reporting, assessing the risk that amaterial weakness exists, and testing and evaluating the design and operating effectiveness of internal controlbased on the assessed risk. Our audit also included performing such other procedures as we considered necessaryin the circumstances. We believe that our audit provides a reasonable basis for our opinion.
A company’s internal control over financial reporting is a process designed to provide reasonable assuranceregarding the reliability of financial reporting and the preparation of financial statements for external purposes inaccordance with generally accepted accounting principles. A company’s internal control over financial reportingincludes those policies and procedures that (1) pertain to the maintenance of records that, in reasonable detail,accurately and fairly reflect the transactions and dispositions of the assets of the company; (2) provide reasonableassurance that transactions are recorded as necessary to permit preparation of financial statements in accordancewith generally accepted accounting principles, and that receipts and expenditures of the company are being madeonly in accordance with authorizations of management and directors of the company; and (3) provide reasonableassurance regarding prevention or timely detection of unauthorized acquisition, use, or disposition of thecompany’s assets that could have a material effect on the financial statements.
Because of its inherent limitations, internal control over financial reporting may not prevent or detectmisstatements. Also, projections of any evaluation of effectiveness to future periods are subject to the risk thatcontrols may become inadequate because of changes in conditions, or that the degree of compliance with thepolicies or procedures may deteriorate.
In our opinion, Pioneer Drilling Company maintained, in all material respects, effective internal control overfinancial reporting as of December 31, 2008, based on criteria established in Internal Control—IntegratedFramework issued by the Committee of Sponsoring Organizations of the Treadway Commission.
Pioneer Drilling Company acquired the production services businesses of WEDGE Group Incorporated,Prairie Investors d/b/a Competition Wireline, Paltec, Inc. and Pettus Well Service (acquired companies) during2008, and management excluded from its assessment of the effectiveness of Pioneer Drilling Company’s internalcontrol over financial reporting as of December 31, 2008, the acquired companies’ internal control over financialreporting associated with total assets of $232.1 million and total revenues of $154.0 million included in theconsolidated financial statement amounts of Pioneer Drilling Company as of and for the year endedDecember 31, 2008. Our audit of internal control over financial reporting of Pioneer Drilling Company alsoexcluded an evaluation of the internal control over financial reporting of the acquired companies.
We also have audited, in accordance with the standards of the Public Company Accounting Oversight Board(United States), the consolidated balance sheets of Pioneer Drilling Company and subsidiaries as ofDecember 31, 2008 and 2007, and the related consolidated statements of operations, shareholders’ equity andcomprehensive income, and cash flows for the year ended December 31, 2008, the nine months endedDecember 31, 2007 and the year ended March 31, 2007, and our report dated February 25, 2009 expressed anunqualified opinion on those consolidated financial statements.
/s/ KPMG LLP
San Antonio, TexasFebruary 25, 2009
57

PIONEER DRILLING COMPANY AND SUBSIDIARIES
CONSOLIDATED BALANCE SHEET
December 31,2008
December 31,2007
(In thousands, except share data)ASSETSCurrent assets:
Cash and cash equivalents . . . . . . . . . . . . . . . . . . . . . . . . . . . . . . . . . . . . . . . . $ 26,821 $ 76,703Receivables, net of allowance for doubtful accounts . . . . . . . . . . . . . . . . . . . 87,161 47,370Unbilled receivables . . . . . . . . . . . . . . . . . . . . . . . . . . . . . . . . . . . . . . . . . . . . 12,262 7,861Deferred income taxes . . . . . . . . . . . . . . . . . . . . . . . . . . . . . . . . . . . . . . . . . . . 6,270 3,670Inventory . . . . . . . . . . . . . . . . . . . . . . . . . . . . . . . . . . . . . . . . . . . . . . . . . . . . . 3,874 1,180Prepaid expenses and other current assets . . . . . . . . . . . . . . . . . . . . . . . . . . . . 8,902 5,073
Total current assets . . . . . . . . . . . . . . . . . . . . . . . . . . . . . . . . . . . . . . . . . . . . . . . . . 145,290 141,857
Property and equipment, at cost . . . . . . . . . . . . . . . . . . . . . . . . . . . . . . . . . . . . . . . 858,491 578,697Less accumulated depreciation and amortization . . . . . . . . . . . . . . . . . . . . . . . . . . 230,929 161,675
Net property and equipment . . . . . . . . . . . . . . . . . . . . . . . . . . . . . . . . . . . . . . . . . . 627,562 417,022Deferred income taxes . . . . . . . . . . . . . . . . . . . . . . . . . . . . . . . . . . . . . . . . . . . . . . . — 573Intangible assets, net of amortization . . . . . . . . . . . . . . . . . . . . . . . . . . . . . . . . . . . 29,913 57Other long-term assets . . . . . . . . . . . . . . . . . . . . . . . . . . . . . . . . . . . . . . . . . . . . . . . 21,714 703
Total assets . . . . . . . . . . . . . . . . . . . . . . . . . . . . . . . . . . . . . . . . . . . . . . . . . . . . . . . $824,479 $560,212
LIABILITIES AND SHAREHOLDERS’ EQUITYCurrent liabilities:
Accounts payable . . . . . . . . . . . . . . . . . . . . . . . . . . . . . . . . . . . . . . . . . . . . . . . $ 21,830 $ 21,424Current portion of long-term debt . . . . . . . . . . . . . . . . . . . . . . . . . . . . . . . . . . 17,298 —Prepaid drilling contracts . . . . . . . . . . . . . . . . . . . . . . . . . . . . . . . . . . . . . . . . . 1,171 1,933Accrued expenses:
Payroll and related employee costs . . . . . . . . . . . . . . . . . . . . . . . . . . . . . 13,592 5,172Insurance premiums and deductibles . . . . . . . . . . . . . . . . . . . . . . . . . . . . 17,520 9,548Other . . . . . . . . . . . . . . . . . . . . . . . . . . . . . . . . . . . . . . . . . . . . . . . . . . . . 9,507 3,973
Total current liabilities . . . . . . . . . . . . . . . . . . . . . . . . . . . . . . . . . . . . . . . . . . . . . . 80,918 42,050Long-term debt, less current portion . . . . . . . . . . . . . . . . . . . . . . . . . . . . . . . . . . . . 262,115 —Other long-term liabilities . . . . . . . . . . . . . . . . . . . . . . . . . . . . . . . . . . . . . . . . . . . . 6,413 254Deferred income taxes . . . . . . . . . . . . . . . . . . . . . . . . . . . . . . . . . . . . . . . . . . . . . . . 60,915 46,836
Total liabilities . . . . . . . . . . . . . . . . . . . . . . . . . . . . . . . . . . . . . . . . . . . . . . . . . . . . . 410,361 89,140
Commitments and contingenciesShareholders’ equity:
Preferred stock, 10,000,000 shares authorized; none issued andoutstanding . . . . . . . . . . . . . . . . . . . . . . . . . . . . . . . . . . . . . . . . . . . . . . . . . — —
Common stock $.10 par value; 100,000,000 shares authorized; 49,997,578shares and 49,650,978 shares issued and outstanding at December 31,2008 and December 31, 2007, respectively . . . . . . . . . . . . . . . . . . . . . . . . . 5,000 4,965
Additional paid-in capital . . . . . . . . . . . . . . . . . . . . . . . . . . . . . . . . . . . . . . . . 301,923 294,922Accumulated earnings . . . . . . . . . . . . . . . . . . . . . . . . . . . . . . . . . . . . . . . . . . . 108,440 171,185Accumulated other comprehensive loss . . . . . . . . . . . . . . . . . . . . . . . . . . . . . (1,245) —
Total shareholders’ equity . . . . . . . . . . . . . . . . . . . . . . . . . . . . . . . . . . . . . . . . . . . . 414,118 471,072
Total liabilities and shareholders’ equity . . . . . . . . . . . . . . . . . . . . . . . . . . . . . . . . $824,479 $560,212
See accompanying notes to consolidated financial statements.
58

PIONEER DRILLING COMPANY AND SUBSIDIARIES
CONSOLIDATED STATEMENTS OF OPERATIONS
Year EndedDecember 31, 2008
Nine MonthsEnded
December 31, 2007Year Ended
March 31, 2007
(In thousands, except per share data)
Revenues:Drilling services . . . . . . . . . . . . . . . . . . . . . . . . . . . . . . . $456,890 $313,884 $416,178Production services . . . . . . . . . . . . . . . . . . . . . . . . . . . . 153,994 — —
Total revenue . . . . . . . . . . . . . . . . . . . . . . . . . . . . . . . . . 610,884 313,884 416,178
Costs and expenses:Drilling services . . . . . . . . . . . . . . . . . . . . . . . . . . . . . . . 269,846 191,374 219,353Production services . . . . . . . . . . . . . . . . . . . . . . . . . . . . 80,097 — —Depreciation and amortization . . . . . . . . . . . . . . . . . . . . 88,145 48,852 52,856Selling, general and administrative . . . . . . . . . . . . . . . . 44,834 15,786 16,193Bad debt expense . . . . . . . . . . . . . . . . . . . . . . . . . . . . . . 423 2,612 800Impairment of goodwill . . . . . . . . . . . . . . . . . . . . . . . . . 118,646 — —Impairment of intangible assets . . . . . . . . . . . . . . . . . . . 52,847 — —
Total operating costs and expenses . . . . . . . . . . . . . . . . 654,838 258,624 289,202
(Loss) income from operations . . . . . . . . . . . . . . . . . . . . . . . (43,954) 55,260 126,976
Other (expense) income:Interest expense . . . . . . . . . . . . . . . . . . . . . . . . . . . . . . . (13,072) (16) (73)Interest income . . . . . . . . . . . . . . . . . . . . . . . . . . . . . . . . 1,256 2,401 3,828Other . . . . . . . . . . . . . . . . . . . . . . . . . . . . . . . . . . . . . . . . (918) 129 58
Total other (expense) income . . . . . . . . . . . . . . . . . . . . . (12,734) 2,514 3,813
(Loss) income before income taxes . . . . . . . . . . . . . . . . . . . . (56,688) 57,774 130,789Income tax expense . . . . . . . . . . . . . . . . . . . . . . . . . . . . . . . . (6,057) (18,129) (46,609)
Net (loss) earnings . . . . . . . . . . . . . . . . . . . . . . . . . . . . . . . . . $ (62,745) $ 39,645 $ 84,180
(Loss) earnings per common share—Basic . . . . . . . . . . . . . . $ (1.26) $ 0.80 $ 1.70
(Loss) earnings per common share—Diluted . . . . . . . . . . . . . $ (1.26) $ 0.79 $ 1.68
Weighted average number of shares outstanding—Basic . . . 49,789 49,645 49,603
Weighted average number of sharesoutstanding—Diluted . . . . . . . . . . . . . . . . . . . . . . . . . . . . . 49,789 50,201 50,132
See accompanying notes to consolidated financial statements.
59

PIONEER DRILLING COMPANY AND SUBSIDIARIES
CONSOLIDATED STATEMENTS OF SHAREHOLDERS’ EQUITY AND COMPREHENSIVEINCOME
SharesCommon
AmountCommon
AdditionalPaid InCapital
AccumulatedEarnings
AccumulatedOther
ComprehensiveLoss
TotalShareholders’
Equity
(In thousands)
Balance as of March 31, 2006 . . . . . . . . . . 49,592 $4,959 $288,356 $ 47,361 $ — $340,676Comprehensive income:
Net earnings . . . . . . . . . . . . . . . . . . . . — — — 84,179 — 84,179
Total comprehensive income . . . . . . . . . . . — — — — — 84,179
Issuance of common stock for:Exercise of options and related
income tax benefits of $24 . . . . . . . 37 4 190 — — 194Stock-based compensation expense . . . . . . — — 3,061 — — 3,061
Balance as of March 31, 2007 . . . . . . . . . . 49,629 4,963 291,607 131,540 — 428,110Comprehensive income:
Net earnings . . . . . . . . . . . . . . . . . . . . — — — 39,645 — 39,645
Total comprehensive income . . . . . . . . . . . — — — — — 39,645
Issuance of common stock for:Exercise of options and related
income tax benefits of $54 . . . . . . . 22 2 158 — — 160Stock-based compensation expense . . . . . . — — 3,157 — — 3,157
Balance as of December 31, 2007 . . . . . . . 49,651 $4,965 $294,922 $171,185 $ — $471,072Comprehensive loss:
Net loss . . . . . . . . . . . . . . . . . . . . . . . . — — — (62,745) — (62,745)Unrealized loss on securities . . . . . . . — — — — (1,245) (1,245)
Total comprehensive loss . . . . . . . . . . . . . . (63,990)
Exercise of options and related income taxbenefits of $244 . . . . . . . . . . . . . . . . . . . 170 17 1,011 — — 1,028
Issuance of restricted stock . . . . . . . . . . . . 177 18 (34) — — (16)Stock-based compensation expense . . . . . . — — 6,024 — — 6,024
Balance as of December 31, 2008 . . . . . . . 49,998 $5,000 $301,923 $108,440 $(1,245) $414,118
See accompanying notes to consolidated financial statements.
60

PIONEER DRILLING COMPANY AND SUBSIDIARIES
CONSOLIDATED STATEMENTS OF CASH FLOWS
Year EndedDecember 31, 2008
Nine MonthsEnded
December 31, 2007Year Ended
March 31, 2007
(In thousands)Cash flows from operating activities:
Net (loss) earnings . . . . . . . . . . . . . . . . . . . . . . . . . . . . . . . . $ (62,745) $ 39,645 $ 84,180Adjustments to reconcile net (loss) earnings to net
cash provided by operating activities:Depreciation and amortization . . . . . . . . . . . . . . . . . . 88,145 48,852 52,856Allowance for doubtful accounts . . . . . . . . . . . . . . . . . 1,591 2,612 800(Gain) loss on dispositions of property and
equipment . . . . . . . . . . . . . . . . . . . . . . . . . . . . . . . . (805) 2,809 5,760Stock-based compensation expense . . . . . . . . . . . . . . 4,597 3,157 3,061Impairment of goodwill and intangibles assets . . . . . . 171,493 — —Deferred income taxes . . . . . . . . . . . . . . . . . . . . . . . . . (2,310) 5,947 10,653Change in other assets . . . . . . . . . . . . . . . . . . . . . . . . . 265 (519) 20Change in non-current liabilities . . . . . . . . . . . . . . . . . (621) (92) (41)Changes in current assets and liabilities:
Receivables . . . . . . . . . . . . . . . . . . . . . . . . . . . . . (24,867) 9,692 (23,170)Inventory . . . . . . . . . . . . . . . . . . . . . . . . . . . . . . . (927) (1,180) —Prepaid expenses & other current assets . . . . . . . (2,390) (1,420) (1,445)Accounts payable . . . . . . . . . . . . . . . . . . . . . . . . . (2,610) 919 (137)Income tax payable . . . . . . . . . . . . . . . . . . . . . . . 409 — (6,843)Prepaid drilling contracts . . . . . . . . . . . . . . . . . . . (762) 1,933 (140)Accrued expenses . . . . . . . . . . . . . . . . . . . . . . . . 17,928 3,100 5,976
Net cash provided by operating activities . . . . . . . . . . . . . . 186,391 115,455 131,530
Cash flows from investing activities:Acquisition of production services business of
WEDGE . . . . . . . . . . . . . . . . . . . . . . . . . . . . . . . . . . (313,621) — —Acquisition of production services business of
Competition . . . . . . . . . . . . . . . . . . . . . . . . . . . . . . . (26,772) — —Acquisition of other production services
businesses . . . . . . . . . . . . . . . . . . . . . . . . . . . . . . . . (9,301) — —Purchases of property and equipment . . . . . . . . . . . . . (147,455) (126,158) (144,507)Purchase of auction rate securities, net . . . . . . . . . . . . (15,900) — —Proceeds from sale of property and equipment . . . . . . 4,008 2,300 6,547Proceeds from insurance recoveries . . . . . . . . . . . . . . 3,426 — —
Net cash used in investing activities . . . . . . . . . . . . . . . . . . . . . . (505,615) (123,858) (137,960)
Cash flows from financing activities:Payments of debt . . . . . . . . . . . . . . . . . . . . . . . . . . . . . (87,767) — —Proceeds from issuance of debt . . . . . . . . . . . . . . . . . . 359,400 — —Debt issuance costs . . . . . . . . . . . . . . . . . . . . . . . . . . . (3,319) — —Proceeds from exercise of options . . . . . . . . . . . . . . . . 784 107 174Excess tax benefit of stock option exercises . . . . . . . . 244 54 27
Net cash provided by financing activities . . . . . . . . . . . . . . . . . . 269,342 161 201
Net decrease in cash and cash equivalents . . . . . . . . . . . . . . . . . (49,882) (8,242) (6,229)Beginning cash and cash equivalents . . . . . . . . . . . . . . . . . . . . . 76,703 84,945 91,174
Ending cash and cash equivalents . . . . . . . . . . . . . . . . . . . . . . . . $ 26,821 $ 76,703 $ 84,945
Supplementary disclosure:Interest paid . . . . . . . . . . . . . . . . . . . . . . . . . . . . . . . . . . . . . $ 12,468 $ 15 $ 104Income tax paid . . . . . . . . . . . . . . . . . . . . . . . . . . . . . . . . . . $ 11,166 $ 9,473 $ 46,258
See accompanying notes to consolidated financial statements.
61

PIONEER DRILLING COMPANY AND SUBSIDIARIES
NOTES TO CONSOLIDATED FINANCIAL STATEMENTS
1. Organization and Summary of Significant Accounting Policies
Business and Principles of Consolidation
Pioneer Drilling Company and subsidiaries provide drilling and production services to our customers inselect oil and natural gas exploration and production regions in the United States and Colombia. Our DrillingServices Division provides contract land drilling services with its fleet of 70 drilling rigs in the followinglocations:
Drilling Division Locations Rig Count
South Texas . . . . . . . . . . . . . . . . . . . . . . . . . . . . . . . . . . . . . . . . . . . . . . . 17East Texas . . . . . . . . . . . . . . . . . . . . . . . . . . . . . . . . . . . . . . . . . . . . . . . . 22North Texas . . . . . . . . . . . . . . . . . . . . . . . . . . . . . . . . . . . . . . . . . . . . . . . 9Utah . . . . . . . . . . . . . . . . . . . . . . . . . . . . . . . . . . . . . . . . . . . . . . . . . . . . . 6North Dakota . . . . . . . . . . . . . . . . . . . . . . . . . . . . . . . . . . . . . . . . . . . . . . 6Oklahoma . . . . . . . . . . . . . . . . . . . . . . . . . . . . . . . . . . . . . . . . . . . . . . . . 5Colombia . . . . . . . . . . . . . . . . . . . . . . . . . . . . . . . . . . . . . . . . . . . . . . . . . 5
As of February 23, 2009, 36 drilling rigs are operating, 29 drilling rigs are idle and five drilling rigs locatedin our Oklahoma drilling division have been placed in storage or “cold stacked” due to low demand for drillingrigs in this region. We are actively marketing all our idle drilling rigs and we are earning revenue on two of theserigs through early termination fees on their drilling contracts with terms expiring in March 2009 and May 2009.We are constructing a 1500 horsepower drilling rig that we expect to be completed and available for operation inthe in our North Dakota drilling division under a contract with a three year term beginning March 2009.
Our Production Services Division provides a broad range of well services to oil and gas drilling andproducing companies, including workover services, wireline services, and fishing and rental services. Ourproduction services operations are managed regionally and are concentrated in the major United States onshoreoil and gas producing regions in the Gulf Coast, Mid-Continent, and Rocky Mountain states. We have a premiumfleet of 74 workover rigs consisting of sixty-nine 550 horseposewer rigs, four 600 horsepower rigs, and one 400horsepower rig. As of February 23, 2009, 62 workover rigs are operating and 12 workover rigs are idle with nocrews assigned. We provide wireline services with a fleet of 59 wireline units and rental services withapproximately $15 million of fishing and rental tools.
The accompanying consolidated financial statements include the accounts of Pioneer Drilling Company andour wholly owned subsidiaries. All intercompany balances and transactions have been eliminated inconsolidation. In December 2007, our Board of Directors approved a change in our fiscal year end fromMarch 31st to December 31st. The fiscal year end change was effective December 31, 2007 and resulted in a ninemonth reporting period from April 1, 2007 to December 31, 2007. We implemented the fiscal year end change toalign our United States reporting period with the required Colombian statutory reporting period as well as thereporting periods of peer companies in the industry.
The accompanying consolidated financial statements have been prepared in accordance with accountingprinciples generally accepted in the United States of America. In preparing the accompanying consolidatedfinancial statements, we make various estimates and assumptions that affect the amounts of assets and liabilitieswe report as of the dates of the balance sheets and income and expenses we report for the periods shown in theincome statements and statements of cash flows. Our actual results could differ significantly from thoseestimates. Material estimates that are particularly susceptible to significant changes in the near term relate to ourrecognition of revenues and costs for turnkey contracts, our estimate of the allowance for doubtful accounts, ourestimate of the self-insurance portion of our health and workers’ compensation insurance, our estimate of assetimpairments, our estimate of deferred taxes and our determination of depreciation and amortization expense.
62

Drilling Contracts
Our drilling contracts generally provide for compensation on either a daywork, turnkey or footagebasis. Contract terms generally depend on the complexity and risk of operations, the on-site drilling conditions,the type of equipment used and the anticipated duration of the work to be performed. Generally, our contractsprovide for the drilling of a single well and typically permit the customer to terminate on short notice. However,we have entered into more longer-term drilling contracts during periods of high rig demand. In addition, we haveentered into longer-term drilling contracts for our newly constructed rigs. As of February 6, 2009, we had 27contracts with terms of six months to three years in duration, of which 18 will expire by August 6, 2009, six havea remaining term of six to 12 months, one has a remaining term of 12 to 18 months and two have a remainingterm in excess of 18 months.
Foreign Currencies
Our functional currency for our foreign subsidiary in Colombia is the U.S. dollar. Nonmonetary assets andliabilities are translated at historical rates and monetary assets and liabilities are translated at exchange rates ineffect at the end of the period. Income statement accounts are translated at average rates for the period. Gains andlosses from remeasurement of foreign currency financial statements into U.S. dollars and from foreign currencytransactions are included in other income or expense.
Revenue and Cost Recognition
Drilling Services—We earn revenues by drilling oil and natural gas wells for our customers under daywork,turnkey or footage contracts, which usually provide for the drilling of a single well. We recognize revenues ondaywork contracts for the days completed based on the dayrate each contract specifies. We recognize revenuesfrom our turnkey and footage contracts on the percentage-of-completion method based on our estimate of thenumber of days to complete each contract. With most drilling contracts, we receive payments contractuallydesignated for the mobilization of rigs and other equipment. Payments received, and costs incurred for themobilization services are deferred and recognized on a straight line basis over the contract term of certain drillingcontracts. Costs incurred to relocate rigs and other drilling equipment to areas in which a contract has not beensecured are expensed as incurred. Reimbursements that we receive for out-of-pocket expenses are recorded asrevenue and the out-of-pocket expenses for which they relate are recorded as operating costs.
Our management has determined that it is appropriate to use the percentage-of-completion method, asdefined in the American Institute of Certified Public Accountants’ Statement of Position 81-1, to recognizerevenue on our turnkey and footage contracts. Although our turnkey and footage contracts do not have expressterms that provide us with rights to receive payment for the work that we perform prior to drilling wells to theagreed-on depth, we use this method because, as provided in applicable accounting literature, we believe weachieve a continuous sale for our work-in-progress and we believe, under applicable state law, we ultimatelycould recover the fair value of our work-in-progress even in the event we were unable to drill to the agreed-ondepth in breach of the applicable contract. However, in the event we were unable to drill to the agreed-on depthin breach of the contract, ultimate recovery of that value would be subject to negotiations with the customer andthe possibility of litigation.
If a customer defaults on its payment obligation to us under a turnkey or footage contract, we would need torely on applicable law to enforce our lien rights, because our turnkey and footage contracts do not expressly grantto us a security interest in the work we have completed under the contract and we have no ownership rights in thework-in-progress or completed drilling work, except any rights arising under the applicable lien statute onforeclosure. If we were unable to drill to the agreed-on depth in breach of the contract, we also would need torely on equitable remedies outside of the contract, including quantum meruit, available in applicable courts torecover the fair value of our work-in-progress under a turnkey or footage contract.
We accrue estimated contract costs on turnkey and footage contracts for each day of work completed basedon our estimate of the total costs to complete the contract divided by our estimate of the number of days to
63

complete the contract. Contract costs include labor, materials, supplies, repairs and maintenance, operatingoverhead allocations and allocations of depreciation and amortization expense. We charge general andadministrative expenses to expense as we incur them. Changes in job performance, job conditions and estimatedprofitability on uncompleted contracts may result in revisions to costs and income. When we encounter, duringthe course of our drilling operations, conditions unforeseen in the preparation of our original cost estimate, weimmediately increase our cost estimate for the additional costs to complete the contract. If we anticipate a loss ona contract in progress at the end of a reporting period due to a change in our cost estimate, we immediatelyaccrue the entire amount of the estimated loss including all costs that are included in our revised estimated cost tocomplete that contract in our consolidated statement of operations for that reporting period. We had no turnkey orfootage contracts in progress as of December 31, 2008.
Production Services—We earn revenues for well services, wireline services and fishing and rental servicesbased on purchase orders, contracts or other persuasive evidence of an arrangement with the customer, such asmaster service agreements, that include fixed or determinable prices. These production services revenues arerecognized when the services have been rendered and collectibility is reasonably assured.
The asset “unbilled receivables” represents revenues we have recognized in excess of amounts billed ondrilling contracts and production services in progress. The asset “prepaid expenses and other current assets”includes deferred mobilization costs for certain drilling contracts. The liability “prepaid drilling contracts”represents deferred mobilization revenues for certain drilling contracts and amounts collected on contracts inexcess of revenues recognized
Cash and Cash Equivalents
For purposes of the statements of cash flows, we consider all highly liquid debt instruments purchased witha maturity of three months or less to be cash equivalents. Cash equivalents consist of investments in corporateand government money market accounts. Cash equivalents at December 31, 2008 and 2007 were $26.8 millionand $76.7 million, respectively.
Restricted Cash
As of December 31, 2008, we had restricted cash in the amount of $3.3 million held in an escrow account tobe used for future payments in connection with the acquisition of Prairie Investors d/b/a Competition Wireline(“Competition”). The former owner of Competition will receive annual installments of $0.7 million payable overa five year term from the escrow account. Restricted cash of $0.7 million and $2.6 million is recorded in othercurrent assets and other-long term assets, respectively. The associated obligation of $0.7 million and $2.6 millionis recorded in other accrued expenses and other long-term liabilities, respectively.
On August 28, 2008, we deposited $0.9 million into a trust account in accordance with the terms of theseverance agreement in connection with the resignation of our former Chief Financial Officer. The trust accountbalance of $0.9 million plus net earnings will be distributed to our former Chief Financial Officer on March 2,2009. As of December 31, 2008, this trust account had a balance of $0.9 million and is recorded in other currentassets with the associated obligation recorded in accrued expenses.
Trade Accounts Receivable
We record trade accounts receivable at the amount we invoice our customers. These accounts do not bearinterest. The allowance for doubtful accounts is our best estimate of the amount of probable credit losses in ouraccounts receivable as of the balance sheet date. We determine the allowance based on the credit worthiness ofour customers and general economic conditions. Consequently, an adverse change in those factors could affectour estimate of our allowance for doubtful accounts. We determine the allowance based on the credit worthinessof our customers and general economic conditions. Consequently, an adverse change in those factors could affectour estimate of our allowance for doubtful accounts. We review our allowance for doubtful accounts on a
64

monthly basis. Balances more than 90 days past due are reviewed individually for collectibility. We charge offaccount balances against the allowance after we have exhausted all reasonable means of collection anddetermined that the potential for recovery is remote. We do not have any off-balance sheet credit exposurerelated to our customers.
The changes in our allowance for doubtful accounts consist of the following (amounts in thousands):
Year EndedDecember 31, 2008
NineMonths Ended
December 31, 2007Year Ended
March 31, 2007
Balance at beginning of year . . . . . . . . . . . . . . . . . . . . . . . . . $ — $ 1,000 $ 200Increase in allowance charged to expense . . . . . . . . . . . 1,591 2,612 800Accounts charged against the allowance, net of
recoveries . . . . . . . . . . . . . . . . . . . . . . . . . . . . . . . . . . (17) (3,612) —
Balance at end of year . . . . . . . . . . . . . . . . . . . . . . . . . . . . . . $1,574 $ — $1,000
Prepaid Expenses and Other Current Assets
Prepaid expenses and other current assets include items such as insurance, rent deposits and fees, andrestricted cash. We routinely expense these items in the normal course of business over the periods theseexpenses benefit. Prepaid expenses and other current assets also include deferred mobilization costs for certaindrilling contracts that are recognized on a straight line basis over the contract term.
Investments
Other long-term assets include investments in tax exempt, auction rate preferred securities (“ARPS”). OurARPSs are classified with other long-term assets on our consolidated balance sheet as of December 31, 2008because of our inability to determine the recovery period of our investments.
At December 31, 2008, we held $15.9 million (par value) of ARPSs, which are variable-rate preferredsecurities and have a long-term maturity with the interest rate being reset through “Dutch auctions” that are heldevery 7 days. The ARPSs have historically traded at par because of the frequent interest rate resets and becausethey are callable at par at the option of the issuer. Interest is paid at the end of each auction period. Our ARPSsare AAA/Aaa rated securities, collateralized by municipal bonds and backed by assets that are equal to or greaterthan 200% of the liquidation preference. Until February 2008, the auction rate securities market was highlyliquid. Beginning mid-February 2008, we experienced several “failed” auctions, meaning that there was notenough demand to sell all of the securities that holders desired to sell at auction. The immediate effect of a failedauction is that such holders cannot sell the securities at auction and the interest rate on the security resets to amaximum auction rate. We have continued to receive interest payments on our ARPSs in accordance with theirterms. We may not be able to access the funds we invested in our ARPSs without a loss of principal, unless afuture auction is successful or the issuer calls the security pursuant to redemption prior to maturity. We have noreason to believe that any of the underlying municipal securities that collateralize our ARPSs are presently at riskof default. We believe we will ultimately be able to liquidate our investments without material loss primarily dueto the collateral securing the ARPSs. We do not currently intend to attempt to sell our ARPSs since our liquidityneeds are expected to be met with cash flows from operating activities and our senior secured revolving creditfacility.
Our ARPSs are reported at amounts that reflect our estimate of fair value. Statement of FinancialAccounting Standards (“SFAS”) No. 157, Fair Value Measurement, provides a hierarchal framework associatedwith the level of subjectivity used in measuring assets and liabilities at fair value. To estimate the fair values ofour ARPSs, we used inputs defined by SFAS 157 as level 3 inputs which are unobservable for the asset orliability and are developed based on the best information available in the circumstances. We estimate the fairvalue of our ARPSs based on discounted cash flow models and secondary market comparisons of similarsecurities.
65

Our ARPSs are designated as available-for-sale and are reported at fair market value with the relatedunrealized gains or losses, included in accumulated other comprehensive income (loss), net of tax, a componentof shareholders’ equity. The estimated fair value of our ARPSs at December 31, 2008 was $13.9 millioncompared with a par value of $15.9 million. The $2.0 million difference represents a fair value discount due tothe current lack of liquidity which is considered temporary and is recorded as an unrealized loss, net of tax, inaccumulated other comprehensive income (loss). We would recognize an impairment charge in our statement ofoperations if the fair value of our investments falls below the cost basis and is judged to be other-than-temporary.
Inventories
Inventories primarily consist of drilling rig replacement parts and supplies held for use by our DrillingServices Division’s operations and supplies held for use by our Production Services Division’s operations.Inventories are valued at the lower of cost (first in, first out or actual) or market value.
Property and Equipment
Property and equipment are carried at cost less accumulated depreciation. Depreciation is provided for ourassets over the estimated useful lives of the assets using the straight-line method. We record the samedepreciation expense whether a rig is idle or working. We charge our expenses for maintenance and repairs tooperating costs. We charge our expenses for renewals and betterments to the appropriate property and equipmentaccounts.
We recorded gains (losses) on disposition of our property and equipment in contract drilling costs of $0.8million, ($2.8) million and ($5.8) million for the year ended December 31, 2008, the nine months endedDecember 31, 2007 and the year ended March 31, 2007, respectively. During the year ended December 31, 2008,we capitalized $0.3 million of interest costs incurred during the construction periods of certain drillingequipment. We did not capitalize any interest costs during the nine months ended December 31, 2007 or duringthe year ended March 31, 2007. We incurred $10.2 million of costs on one drilling rig that was underconstruction at December 31, 2008. We had no rigs under construction at December 31, 2007, and we incurredapproximately $8.6 million of costs for rigs under construction at March 31, 2007.
We evaluate for potential impairment of long-lived assets and intangible assets subject to amortization whenindicators of impairment are present, as defined in SFAS No. 144, Accounting for the Impairment or Disposal ofLong-Lived Assets. Circumstances that could indicate a potential impairment include significant adverse changesin industry trends, economic climate, legal factors, and an adverse action or assessment by a regulator. Morespecifically, significant adverse changes in industry trends include significant declines in revenue rates,utilization rates, oil and natural gas market prices and industry rig counts for drilling rigs and workover rigs. Inperforming an impairment evaluation, we estimate the future undiscounted net cash flows from the use andeventual disposition of long-lived assets and intangible assets grouped at the lowest level that cash flows can beidentified. For our Production Services Division, our long-lived assets and intangible assets are grouped at thereporting unit level which is one level below the operating segment level. For our Drilling Services Division, weperform an impairment evaluation and estimate future undiscounted cash flows for individual drilling rig assets.If the sum of the estimated future undiscounted net cash flows is less than the carrying amount of the long-livedassets and intangible assets for these asset grouping levels, then we would recognize an impairment charge. Theamount of an impairment charge would be measured as the difference between the carrying amount and the fairvalue of these assets. As described in the Intangible Asset section of Note 1, our long-lived asset and intangibleasset impairment analysis for the reporting units in our Production Services Division resulted in no impairmentcharge to property and equipment and a non-cash impairment charge of $52.8 million to the carrying value of ourintangible assets for customers relationships for the year ended December 31, 2008. This impairment charge isnot expected to have an impact on our liquidity or debt covenants; however, it is a reflection of the overalldownturn in our industry and decline in our projected cash flows. For our Drilling Services Division, we have not
66

recorded an impairment charge on any long-lived assets for the year ended December 31, 2008. The assumptionsused in the impairment evaluation for long-lived assets and intangible assets are inherently uncertain and requiremanagement judgment.
Effective January 1, 2008, management reassessed the estimated useful lives assigned to a group of 19drilling rigs that were recently constructed. These drilling rigs were constructed with new components that havelonger estimated useful lives when compared to other drilling rigs that are equipped with older components. As aresult, we increased the estimated useful lives for this group of recently constructed drilling rigs from an averageuseful life of 9 years to 12 years. The following table provides the impact of this change in depreciation andamortization expense for the year ended December 31, 2008 (amounts in thousands):
Year EndedDecember 31, 2008
Depreciation and amortization expense using prior useful lives . . . . . . . . . . . . . . . . . $91,921Impact of change in estimated useful lives . . . . . . . . . . . . . . . . . . . . . . . . . . . . . . . . . (3,776)
Depreciation and amortization expense, as reported . . . . . . . . . . . . . . . . . . . . . . . . . . $88,145
Diluted (loss) earnings per common share using prior useful lives . . . . . . . . . . . . . . $ (1.31)Impact of change in estimated useful lives . . . . . . . . . . . . . . . . . . . . . . . . . . . . . . . . . 0.05
Diluted (loss) earnings per common share, as reported . . . . . . . . . . . . . . . . . . . . . . . $ (1.26)
As of December 31, 2008, the estimated useful lives of our asset classes are as follows:
Lives
Drilling rigs and equipment . . . . . . . . . . . . . . . . . . . . . . . . . . . . . . . . . . . . . . . . . . . . . . . . . . . . . 3 - 25Workover rigs and equipment . . . . . . . . . . . . . . . . . . . . . . . . . . . . . . . . . . . . . . . . . . . . . . . . . . . 5 -20Wireline units and equipment . . . . . . . . . . . . . . . . . . . . . . . . . . . . . . . . . . . . . . . . . . . . . . . . . . . 2 - 10Fishing and rental tools equipment . . . . . . . . . . . . . . . . . . . . . . . . . . . . . . . . . . . . . . . . . . . . . . . 7Vehicles . . . . . . . . . . . . . . . . . . . . . . . . . . . . . . . . . . . . . . . . . . . . . . . . . . . . . . . . . . . . . . . . . . . . 3 - 10Office equipment . . . . . . . . . . . . . . . . . . . . . . . . . . . . . . . . . . . . . . . . . . . . . . . . . . . . . . . . . . . . . 3 - 5Buildings and improvements . . . . . . . . . . . . . . . . . . . . . . . . . . . . . . . . . . . . . . . . . . . . . . . . . . . . 3 - 40
Goodwill
Goodwill results from business acquisitions and represents the excess of acquisition costs over the fair valueof the net assets acquired. We account for goodwill and other intangible assets under the provisions of SFASNo. 142, Goodwill and Other Intangible Assets. Goodwill is tested for impairment annually as of December 31 ormore frequently if events or changes in circumstances indicate that the asset might be impaired. Circumstancesthat could indicate a potential impairment include a significant adverse change in the economic or businessclimate, a significant adverse change in legal factors, an adverse action or assessment by a regulator,unanticipated competition, loss of key personnel and the likelihood that a reporting unit or significant portion of areporting unit will be sold or otherwise disposed of. These circumstances could lead to our net book valueexceeding our market capitalization which is another indicator of a potential impairment in goodwill. SFAS No.142 requires a two-step process for testing impairment. First, the fair value of each reporting unit is compared toits carrying value to determine whether an indication of impairment exists. All our goodwill is related to ourProduction Services Division operating segment and is allocated to its three reporting units which are wellservices, wireline services and fishing and rental services. Second, if impairment is indicated, then the fair valueof the reporting unit’s goodwill is determined by allocating the unit’s fair value to its assets and liabilities(including any unrecognized intangible assets) as if the reporting unit had been acquired in a businesscombination on the impairment test date. The amount of impairment for goodwill is measured as the excess ofthe carrying value of the reporting unit over its fair value.
67

When estimating fair values of a reporting unit for our goodwill impairment test, we use a combination ofan income approach and a market approach which incorporates both management’s views and those of themarket. The income approach provides an estimated fair value based on each reporting unit’s anticipated cashflows that are discounted using a weighted average cost of capital rate. The market approach provides anestimated fair value based on our market capitalization that is computed using the prior 30-day average marketprice of our common stock and the number of shares outstanding as of the impairment test date. The estimatedfair values computed using the income approach and the market approach are then equally weighted andcombined into a single fair value. The primary assumptions used in the income approach are estimated cashflows and weighted average cost of capital. Estimated cash flows are primarily based on projected revenues,operating costs and capital expenditures and are discounted based on comparable industry average rates forweighted average cost of capital. We utilized discount rates based on weighted average cost of capital rangingfrom 15.8% to 16.7% when we estimated fair values of our reporting units as of December 31, 2008. The primaryassumptions used in the market approach is the allocation of total market capitalization to each reporting unit,which is based on projected EBITDA percentages for each reporting unit, and control premiums, which are basedon comparable industry averages. We utilized a 30% control premium when we estimated fair values of ourreporting units as of December 31, 2008. To ensure the reasonableness of the estimated fair values of ourreporting units, we perform a reconciliation of our total market capitalization to the total estimated fair value ofall our reporting units. The assumptions used in estimating fair values of reporting units and performing thegoodwill impairment test are inherently uncertain and require management judgment.
Our common stock price per share declined in market value from $13.30 at September 30, 2008, to $5.57 atDecember 31, 2008, which resulted in our net book value exceeding our market capitalization during most of thistime period. We believe the decline in the market price of our common stock resulted from a significant adversechange in the economic and business climate as financial markets reacted to the credit crisis facing major lendinginstitutions and worsening conditions in the overall economy during the fourth quarter of the year endedDecember 31, 2008. During the same time, there were significant declines in oil and natural gas prices whichlead to declines in production service revenues, margins and cash flows. We considered the impact of thesesignificant adverse changes in the economic and business climate as we performed our annual impairmentassessment of goodwill as of December 31, 2008. The estimated fair values of our reporting units werenegatively impacted by significant reductions in estimated cash flows for the income approach component and asignificant reduction in our market capitalization for the market approach component of our fair value estimationprocess. Our goodwill was initially recorded in connection with the acquisitions of the production servicesbusinesses from WEDGE, Competition, Pettus and Paltec, all of which occurred between March 1, 2008 andOctober 1, 2008, when production service revenues, margins and cash flows and our market capitalization wereat historically high levels.
Our goodwill impairment analysis lead us to conclude that there would be no remaining implied fair valueattributable to our goodwill and accordingly, we recorded a non-cash charge of $118.6 million to our operatingresults for the year ended December 31, 2008, for the full impairment of our goodwill. Our goodwill impairmentanalysis would have lead to the same full impairment conclusion if we increased or decreased our discount ratesor control premiums by 10% when estimating the fair values of our reporting units. This impairment charge isnot expected to have an impact on our liquidity or debt covenants; however, it is a reflection of the overalldownturn in our industry and decline in our projected cash flows.
Changes in the carrying amount of goodwill by operating segment are as follows (amounts in thousands):
DrillingServicesDivision
ProductionServicesDivision Total
Goodwill balance at January 1, 2008 . . . . . . . . . . . . . . . . . . . . . . . . . . . . . . $ — $ — $ —Goodwill relating to acquisitions . . . . . . . . . . . . . . . . . . . . . . . . . . . . . . . . . — 118,646 118,646Impairment . . . . . . . . . . . . . . . . . . . . . . . . . . . . . . . . . . . . . . . . . . . . . . . . . . — (118,646) (118,646)
Goodwill balance at December 31, 2008 . . . . . . . . . . . . . . . . . . . . . . . . . . . $ — $ — $ —
68

Intangible Assets
All our intangible assets are subject to amortization and consist of customers relationships, non-competeagreements and trade names. Essentially all of our intangible assets were recorded in connection with theacquisitions of the production services businesses from WEDGE, Competition, Pettus and Paltec, all of whichoccurred between March 1, 2008 and October 1, 2008 as described in Note 2. Intangible assets consist of thefollowing components (amounts in thousands):
December 31,2008
December 31,2007
Cost:Customer Relationships . . . . . . . . . . . . . . . . . . . . . . . . . . . . . . . . . . . . . . . . . . . . . $ 87,316 $—Non-compete . . . . . . . . . . . . . . . . . . . . . . . . . . . . . . . . . . . . . . . . . . . . . . . . . . . . . 2,304 150Trade marks . . . . . . . . . . . . . . . . . . . . . . . . . . . . . . . . . . . . . . . . . . . . . . . . . . . . . . 1,600 —
Accumulated amortization:Customer Relationships . . . . . . . . . . . . . . . . . . . . . . . . . . . . . . . . . . . . . . . . . . . . . (6,069) —Non-compete . . . . . . . . . . . . . . . . . . . . . . . . . . . . . . . . . . . . . . . . . . . . . . . . . . . . . (791) (93)Trade marks . . . . . . . . . . . . . . . . . . . . . . . . . . . . . . . . . . . . . . . . . . . . . . . . . . . . . . (1,600) —
Impairment:Customer Relationships . . . . . . . . . . . . . . . . . . . . . . . . . . . . . . . . . . . . . . . . . . . . . (52,847) —
$ 29,913 $ 57
We evaluate for potential impairment of long-lived assets and intangible assets subject to amortization whenindicators of impairment are present, as defined in SFAS No. 144, Accounting for the Impairment or Disposal ofLong-Lived Assets. Circumstances that could indicate a potential impairment include significant adverse changesin industry trends, economic climate, legal factors, and an adverse action or assessment by a regulator. Morespecifically, significant adverse changes in industry trends include significant declines in revenue rates,utilization rates, oil and natural gas market prices and industry rig counts for drilling rigs and workover rigs. Inperforming the impairment evaluation, we estimate the future undiscounted net cash flows relating to long-livedassets and intangible assets grouped at the lowest level that cash flows can be identified. Our long-lived assetsand intangible assets for our Production Services Division are grouped one level below the operating segment inthe three reporting units which are well services, wireline services and fishing and rental services. If the sum ofthe estimated future undiscounted net cash flows is less than the carrying amount of the long-lived assets andintangible assets in each reporting unit, then we would recognize an impairment charge. The amount of animpairment charge would be measured as the difference between the carrying amount and the fair value of theseassets. The assumptions used in the impairment evaluation for long-lived assets and intangible assets areinherently uncertain and require management judgment.
We performed an impairment analysis of our long-lived assets and intangible assets at December 31, 2008,due to significant adverse changes in the economic and business climate that resulted in decreases in estimatedrevenues, margins and cash flows. Essentially all our intangible assets were recorded in connection with theacquisitions of the production services businesses from WEDGE, Competition, Pettus and Paltec when revenues,margins and cash flows were at historically high levels earlier in 2008. We determined that the sum of theestimated future undiscounted net cash flows is less than the carrying amount of the long-lived assets andintangible assets in each reporting unit at December 31, 2008. Our impairment analysis resulted in a reduction toour intangible asset carrying value of customers relationships and a non-cash impairment charge of $52.8 millionrecorded to our operating results for the year ended December 31, 2008.
Amortization expense for our customer relationships are calculated using the straight-line method over theirrespective estimated economic useful lives which range from four to nine years. Amortization expense for ournon-compete agreements are calculated using the straight-line method over the period of the agreements whichrange from one to five years. Amortization expense was $8.4 million for the year ended December 31, 2008,$34,000 for the nine month period ended December 31, 2007 and $47,000 for the year ended March 31, 2007.
69

Amortization expense is estimated to be approximately $4.5 million, $4.3 million, $3.8 million, $3.7 million and$3.7 million for the years ending December 31, 2009, 2010, 2011, 2012 and 2013, respectively. These futureamortization amounts are estimates and reflect the impact of the $52.8 million impairment charge to intangibleassets. Actual amortization amounts may be different due to future acquisitions, impairments, changes inamortization periods, or other factors.
Other Long-Term Assets
Other long-term assets consist of our investment in ARPSs, restricted cash held in an escrow account, cashdeposits related to the deductibles on our workers’ compensation insurance policies and loan fees, net ofamortization. Loan fees are being amortized over the five-year term of the related senior secured revolver creditfacility described in Note 3.
Income Taxes
Pursuant to Statement of Financial Accounting Standards (“SFAS”) No. 109, “Accounting for IncomeTaxes,” we follow the asset and liability method of accounting for income taxes, under which we recognizedeferred tax assets and liabilities for the future tax consequences attributable to differences between the financialstatement carrying amounts of existing assets and liabilities and their respective tax basis. We measure ourdeferred tax assets and liabilities by using the enacted tax rates we expect to apply to taxable income in the yearsin which we expect to recover or settle those temporary differences. Under SFAS No. 109, we reflect in incomethe effect of a change in tax rates on deferred tax assets and liabilities in the period during which the changeoccurs.
Comprehensive (Loss) Income
Comprehensive (loss) income is comprised of net (loss) income and other comprehensive loss. Othercomprehensive loss includes the change in the fair value of our ARPSs, net of tax, for the year endedDecember 31, 2008. We had no other comprehensive income (loss) for the year ended December 31, 2008, thenine months ended December 31, 2007 or the year ended March 31, 2007. The following table sets forth thecomponents of comprehensive (loss) income:
Year EndedDecember 31,
2008
Nine MonthsEnded
December 31,2007
Year EndedMarch 31,
2007
(amounts in thousands)
Net (loss) income . . . . . . . . . . . . . . . . . . . . . . . . . . . . . . . . . . . . . . . . . . . . $(62,745) $39,645 $84,180Other comprehensive loss—unrealized loss on securities . . . . . . . . . . . . (1,245) — —
Comprehensive (loss) income . . . . . . . . . . . . . . . . . . . . . . . . . . . . . . . . . . $(63,990) $39,645 $84,180
Earnings Per Common Share
We compute and present earnings per common share in accordance with SFAS No. 128, “Earnings perShare.” This standard requires dual presentation of basic and diluted earnings per share on the face of ourstatement of operations.
Stock-based Compensation
Effective April 1, 2006, we adopted SFAS No. 123 (Revised), Share-Based Payment (“SFAS 123R”),utilizing the modified prospective approach. Prior to the adoption of SFAS 123R, we accounted for stock optiongrants in accordance with the intrinsic-value-based method prescribed by Accounting Principles Board OpinionNo. 25, Accounting for Stock Issued to Employees (“APB 25”), and related interpretations, as permitted by SFASNo. 123, Accounting for Stock-Based Compensation (“SFAS 123”). Accordingly, we recognized no
70

compensation expense for stock options granted, as all stock options were granted at an exercise price equal tothe closing market value of the underlying common stock on the date of grant. Under the modified prospectiveapproach, compensation cost for the fiscal year ended December 31, 2008 includes compensation cost for allstock options granted prior to, but not yet vested as of, April 1, 2006, based on the grant-date fair value estimatedin accordance with SFAS 123, and compensation cost for all stock options granted subsequent to April 1, 2006,based on the grant-date fair value estimated in accordance with SFAS 123R. We use the graded vesting methodfor recognizing compensation costs for stock options.
Compensation costs of approximately $3.1 million and $0.9 million for stock options were recognized inselling, general and administrative expense and operating costs, respectively, for the year ended December 31,2008, of which $0.1 million relate to stock options granted to outside directors. Compensation costs ofapproximately $2.5 million and $0.7 million for stock options were recognized in selling, general andadministrative and operating costs, respectively, for the nine months ended December 31, 2007. Approximately$0.4 million of the compensation costs included in selling, general and administrative expense relate to stockoptions granted to outside directors that vested immediately upon grant pursuant to our stock option plans.Compensation costs of approximately $2.5 million and $0.5 million for stock options were recognized in selling,general and administrative expense and operating costs, respectively, for the fiscal year ended March 31, 2007.Approximately $0.3 million of the compensation costs included in selling, general and administrative expenserelate to stock options granted to outside directors that vested immediately upon grant pursuant to our stockoption plans.
We receive a tax deduction for certain stock option exercises during the period the options are exercised,generally for the excess of the market price of our common stock on the exercise date over the exercise price ofthe stock options. In accordance with SFAS 123R, we reported all excess tax benefits resulting from the exerciseof stock options as financing cash flows in our consolidated statement of cash flows. There were 170,054 stockoptions exercised during the year ended December 31, 2008 and 22,500 stock options exercised during the ninemonths ended December 31, 2007.
Restricted stock awards consist of our common stock that vest over a 3 year period. The fair value ofrestricted stock is based on the closing price of our common stock on the date of the grant. We amortize the fairvalue of the restricted stock awards to compensation expense using the graded vesting method. For the yearended December 31, 2008, 178,261 restricted stock awards were granted with a weighted-average grant dateprice of $17.07. Compensation costs of approximately $0.5 million and $0.1 for restricted stock awards wererecognized in selling, general and administrative expense and operating costs, respectively, for the year endedDecember 31, 2008.
Related-Party Transactions
Our Chief Executive Officer, President of Drilling Services Division, Senior Vice President of DrillingServices Division—Marketing, and a Vice President of Drilling Services Division—Operations occasionallyacquire at fair value a 1% to 5% minority working interest in oil and natural gas wells that we drill for one of ourcustomers. Our President of Drilling Services Division acquired a minority working interest in two wells that wedrilled for this customer during the year ended December 31, 2008. These individuals acquired minority workinginterests in four and three wells that we drilled for this customer during the nine months ended December 31,2007 and the year ended March 31, 2007, respectively. We recognized drilling services revenues of $2.0 million,$1.6 million and $1.9 million on these wells during the year ended December 31, 2008, the nine months endedDecember 31, 2007 and the year ended March 31, 2007, respectively.
In connection with the acquisitions of the production services businesses from WEDGE Group Incorporated(“WEDGE”) and Competition on March 1, 2008, we have leases for various operating and office facilities withentities that are owned by former WEDGE employees and Competition employees that are now employees of ourcompany. Rent expense for the year ended December 31, 2008 was approximately $479,000 for these relatedparty leases. In addition, we have non-compete agreements with several former WEDGE employees that are now
71

employees of our company. These non-compete agreements are recorded as intangible assets with a cost, net ofaccumulated amortization, of $1.4 million at December 31, 2008. See note 2 for further information regarding theacquisitions.
We purchased goods and services during the year ended December 31, 2008 from eight vendors that areowned by employees of our company. For the year ended December 31, 2008, we purchased $330,000 of wellservicing equipment from one of these related party vendors and purchases from the remaining seven relatedparty vendors were $232,000.
Recently Issued Accounting Standards
In September 2006, the FASB issued SFAS No. 157, Fair Value Measurements. SFAS No. 157 defines fairvalue, establishes a framework for measuring fair value and expands disclosure of fair value measurements.SFAS No. 157 applies under other accounting pronouncements that require or permit fair value measurementsand, accordingly, does not require any new fair value measurements. SFAS No. 157, as issued, was effective forfinancial statement issued for fiscal years beginning after November 15, 2007, and interim periods within thosefiscal years. However, on February 12, 2008, the FASB issued FSP FAS No. 157-2, Effective Dates of FASBStatement No. 157, which delays the effective date of SFAS No. 157 for fiscal years beginning afterNovember 15, 2008 for all nonfinancial assets and nonfinancial liabilities, except those that are recognized ordisclosed at fair value in the financial statements on a recurring basis. The adoption of SFAS No. 157 did nothave a material impact on our financial position or results of operations.
In February 2007, the FASB issued SFAS No. 159, The Fair Value Option for Financial Assets andFinancial Liabilities—Including an amendment of FASB Statement No. 115. This statement permits entities tochoose to measure many financial instruments and certain other items at fair value that are not currently requiredto be measured at fair value and establishes presentation and disclosure requirements designed to facilitatecomparisons between entities that choose different measurement attributes for similar types of assets andliabilities. SFAS No. 159 is effective for fiscal years beginning after November 15, 2007. The adoption of SFASNo. 159 did not have a material impact on our financial position or results of operations.
In December 2007, the FASB issued SFAS No. 160, Noncontrolling interests in Consolidated FinancialStatements—an Amendment of ARB No. 51. This statement establishes accounting and reporting standards for thenon-controlling interest in a subsidiary and for the deconsolidation of a subsidiary. SFAS No. 160 clarifies that anon-controlling interest in a subsidiary, which is sometimes referred to as minority interest, is an ownershipinterest in the consolidated entity that should be reported as a component of equity in the consolidated financialstatements. Among other requirements, SFAS No. 160 requires consolidated net income to be reported atamounts that include the amounts attributable to both the parent and the non-controlling interest. It also requiresdisclosure, on the face of the consolidated income statement, of the amounts of consolidated net incomeattributable to the parent and to the non-controlling interest. SFAS No.160 is effective for fiscal years beginningon or after December 15, 2008. We do not expect the adoption to have a material impact on our financial positionor results of operations.
In December 2007, the FASB issued SFAS No. 141R (revised 2007) which replaces SFAS No. 141,Business Combinations (“SFAS No. 141R”). SFAS No. 141R applies to all transactions and other events inwhich one entity obtains control over one or more other businesses. SFAS No. 141R requires an acquirer, uponinitially obtaining control of another entity, to recognize the assets, liabilities and any non-controlling interest inthe acquiree at fair value as of the acquisition date. Contingent consideration is required to be recognized andmeasured at fair value on the date of acquisition rather than at a later date when the amount of that considerationmay be determinable beyond a reasonable doubt. This fair value approach replaces the cost-allocation processrequired under SFAS No. 141 whereby the cost of an acquisition was allocated to the individual assets acquiredand liabilities assumed based on their estimated fair value. SFAS No. 141R requires acquirers to expenseacquisition-related costs as incurred rather than allocating such costs to the assets acquired and liabilities
72

assumed, as was previously the case under SFAS No. 141. Under SFAS No.141R, the requirements of SFAS No.146, Accounting for Costs Associated with Exit or Disposal Activities, would have to be met in order to accruefor a restructuring plan in purchase accounting. Pre-acquisition contingencies are to be recognized at fair value,unless it is a non-contractual contingency that is not likely to materialize, in which case, nothing should berecognized in purchase accounting and, instead, that contingency would be subject to the recognition criteria ofSFAS No. 5, Accounting for Contingencies. SFAS No.141R is expected to have a significant impact on ouraccounting for business combinations closing on or after January 1, 2009.
In March 2008, the FASB issued SFAS No. 161, Disclosures about Derivative Instruments and HedgingActivities—an amendment of FASB Statement No. 133 (“SFAS No. 161”). SFAS No. 161 changes the disclosurerequirements for derivative instruments and hedging activities. Entities are required to provide enhanceddisclosures about (a) how and why an entity uses derivative instruments, (b) how derivative instruments andrelated hedged items are accounted for under Statement 133 and its related interpretations, and (c) how derivativeinstruments and related hedged items affect an entity’s financial position, financial performance, and cash flows.The guidance in SFAS No. 161 is effective for financial statements issued for fiscal years and interim periodsbeginning after November 15, 2008, with early application encouraged. This Statement encourages, but does notrequire, comparative disclosures for earlier periods at initial adoption. We do not have any derivative instrumentsand expect the adoption of SFAS No. 161 to have no impact on our financial position or results of operations.
In April 2008, the FASB issued FSP SFAS 142-3, Determination of the Useful Life of Intangible Assets.This guidance is intended to improve the consistency between the useful life of a recognized intangible assetunder SFAS 142, Goodwill and Other Intangible Assets, and the period of expected cash flows used to measurethe fair value of the asset under SFAS 141R when the underlying arrangement includes renewal or extension ofterms that would require substantial costs or result in a material modification to the asset upon renewal orextension. Companies estimating the useful life of a recognized intangible asset must now consider theirhistorical experience in renewing or extending similar arrangements or, in the absence of historical experience,must consider assumptions that market participants would use about renewal or extension as adjusted for SFASNo. 142’s entity-specific factors. FSP 142-3 is effective for periods beginning on or after January 1, 2009. We donot expect the adoption to have a material impact on our financial position or results of operations.
In May 2008, the FASB issued SFAS No. 162, The Hierarchy of Generally Accepted Accounting Principles(“SFAS No. 162”). SFAS No. 162 identifies the sources of accounting principles and the framework for selectingthe principles used in the preparation of financial statements that are presented in conformity with generallyaccepted accounting principles. SFAS No. 162 is effective 60 days following approval by the Securities andExchange Commission of the Public Company Accounting Oversight Board’s amendments to AU Section 411,The Meaning of Present Fairly in Conformity with Generally Accepted Accounting Principles. The adoption ofSFAS No. 162 did not have a material impact on our financial position or results of operations.
In June 2008, the FASB issued FSP No. EITF 03-6-1, Determining Whether Instruments Granted in Share-Based Payment Transactions are Participating Securities. This FSP provides that unvested share-based paymentawards that contain nonforfeitable rights to dividends are participating securities and shall be included in thecomputation of earnings per share pursuant to the two class method. This FSP is effective for financial statementsissued for fiscal years beginning after December 15, 2008 and interim periods within those years. We do notexpect the adoption of this FSP to have a material impact on our financial position or results of operations.
Reclassifications
Certain amounts in the financial statements for the prior years have been reclassified to conform to thecurrent year’s presentation.
73

2. Acquisitions
On March 1, 2008, we acquired the production services business from WEDGE which provided wellservices, wireline services and fishing and rental services with a fleet of 62 workover rigs, 45 wireline units andapproximately $13 million of fishing and rental equipment through its facilities in Texas, Kansas, North Dakota,Colorado, Utah and Oklahoma. The aggregate purchase price for the acquisition was approximately $314.7million, which consisted of assets acquired of $340.8 million and liabilities assumed of $26.1 million. Theaggregate purchase price includes $3.4 million of costs incurred to acquire the production services business fromWEDGE. We financed the acquisition with approximately $3.2 million of cash on hand and $311.5 million ofdebt incurred under our senior secured revolving credit facility described in Note 3.
The following table summarizes the allocation of the purchase price and related acquisition costs to theestimated fair value of the assets acquired and liabilities assumed as of the date of acquisition (amounts inthousands):
Cash acquired . . . . . . . . . . . . . . . . . . . . . . . . . . . . . . . . . . . . . . . . . . . . . . . . . . . . . $ 1,168Other current assets . . . . . . . . . . . . . . . . . . . . . . . . . . . . . . . . . . . . . . . . . . . . . . . . 22,102Property and equipment . . . . . . . . . . . . . . . . . . . . . . . . . . . . . . . . . . . . . . . . . . . . . 138,493Intangibles and other assets . . . . . . . . . . . . . . . . . . . . . . . . . . . . . . . . . . . . . . . . . . 66,118Goodwill . . . . . . . . . . . . . . . . . . . . . . . . . . . . . . . . . . . . . . . . . . . . . . . . . . . . . . . . . 112,869
Total assets acquired . . . . . . . . . . . . . . . . . . . . . . . . . . . . . . . . . . . . . . . . . . . $340,750
Current liabilities . . . . . . . . . . . . . . . . . . . . . . . . . . . . . . . . . . . . . . . . . . . . . . . . . . $ 10,655Long-term debt . . . . . . . . . . . . . . . . . . . . . . . . . . . . . . . . . . . . . . . . . . . . . . . . . . . . 1,462Other long term liabilities . . . . . . . . . . . . . . . . . . . . . . . . . . . . . . . . . . . . . . . . . . . 13,949
Total liabilities assumed . . . . . . . . . . . . . . . . . . . . . . . . . . . . . . . . . . . . . . . . . $ 26,066
Net assets acquired . . . . . . . . . . . . . . . . . . . . . . . . . . . . . . . . . . . . . . . . . . . . . $314,684
The following unaudited pro forma consolidated summary financial information gives effect of theacquisition of the production services business from WEDGE as though it was effective as of the beginning ofeach of the years ended December 31, 2008 and 2007. Pro forma adjustments primarily relate to additionaldepreciation, amortization and interest costs. The pro forma information reflects our company’s historical dataand historical data from the acquired production services business from WEDGE for the periods indicated. Thepro forma data may not be indicative of the results we would have achieved had we completed the acquisition onJanuary 1, 2007 or 2008, or what we may achieve in the future and should be read in conjunction with theaccompanying historical financial statements.
Pro Forma
Years EndedDecember 31,
2008
Nine MonthsEnded
December 31,2007
(in thousands)
Total revenues . . . . . . . . . . . . . . . . . . . . . . . . . . . . . . . . . . . . . . . . . . . . . . $634,535 $401,461Net (loss) earnings . . . . . . . . . . . . . . . . . . . . . . . . . . . . . . . . . . . . . . . . . . . $ (62,514) $ 44,504(Loss) earnings per common share
Basic . . . . . . . . . . . . . . . . . . . . . . . . . . . . . . . . . . . . . . . . . . . . . . . . . . $ (1.26) $ 0.90Diluted . . . . . . . . . . . . . . . . . . . . . . . . . . . . . . . . . . . . . . . . . . . . . . . . $ (1.26) $ 0.89
On March 1, 2008, immediately following the acquisition of the production services business fromWEDGE, we acquired the production services business from Competition which provided wireline services witha fleet of 6 wireline units through its facilities in Montana. The aggregate purchase price for the Competitionacquisition was approximately $30.0 million, which consisted of assets acquired of $30.1 million and liabilities
74

assumed of $0.1 million. The aggregate purchase price includes $0.4 million of costs incurred to acquire theproduction services business from Competition. We financed the acquisition with $26.7 million cash on hand anda note payable due to the prior owner for $3.3 million. Goodwill of $5.3 million and intangible assets and otherassets of $18.0 million were recorded in connection with the acquisition.
On August 29, 2008, we acquired the wireline services business from Paltec, Inc. The aggregate purchaseprice was $7.8 million which we financed with $6.5 million in cash and a sellers note of $1.3 million. Intangibleand other assets of $4.3 million and goodwill of $0.1 million were recorded in connection with the acquisition.
On October 1, 2008, we acquired the well services business from Pettus Well Service. The aggregatedpurchase price was $3.0 million which we financed with $2.8 million in cash and a sellers note of $0.2 million.Intangible and other assets of $1.2 million and goodwill of $0.1 million were recorded in connection with theacquisition.
The acquisitions of the production services businesses from WEDGE, Competition, Paltec and Pettus wereaccounted for as acquisitions of businesses. The purchase price allocations for these production servicesbusinesses have been finalized as of December 31, 2008. Goodwill was recognized as part of the WEDGE,Competition, Paltec and Pettus acquisitions since the purchase price exceeded the estimated fair value of theassets acquired and liabilities assumed. We believe that the goodwill is related to the acquired workforces, futuresynergies between our existing Drilling Services Division and our new Production Services Division and theability to expand our service offerings. These acquisitions occurred between March 1, 2008 and October 1, 2008,when production service revenues, margins and cash flows and our market capitalization were at historically highlevels. As described in note 1, our goodwill impairment analysis performed at December 31, 2008 led us toconclude that there would be no remaining implied value attributable to our goodwill and accordingly, werecorded a non-cash charge of $118.6 million for a full impairment of goodwill relating to these acquisitions. Wealso performed an impairment analysis which resulted in an impairment charge of $52.8 million and reduction inthe intangible asset carrying value of customer relationships relating to these acquisitions. These impairmentcharges were primarily related to significant adverse changes in the economic and business climate that occurredduring the fourth quarter of the year ended December 31, 2008.
3. Long-term Debt, Subordinated Debt and Note Payable
Long-term debt as of December 31, 2008 consists of the following (amounts in thousands):
Senior secured credit facility . . . . . . . . . . . . . . . . . . . . . . . . . . . . . . . . . . . . . . . . . $272,500Subordinated notes payable . . . . . . . . . . . . . . . . . . . . . . . . . . . . . . . . . . . . . . . . . . 6,534Other . . . . . . . . . . . . . . . . . . . . . . . . . . . . . . . . . . . . . . . . . . . . . . . . . . . . . . . . . . . . 379
279,413Less current portion . . . . . . . . . . . . . . . . . . . . . . . . . . . . . . . . . . . . . . . . . . . . . . . . (17,298)
$262,115
Senior Secured Revolving Credit Facility
On February 29, 2008, we entered into a credit agreement with Wells Fargo Bank, N.A. and a syndicate oflenders (collectively the “Lenders”). The credit agreement provides for a senior secured revolving credit facility,with sub-limits for letters of credit and a swing-line facility of up to an aggregate principal amount of $400million, all of which mature on February 28, 2013. The senior secured revolving credit facility and theobligations thereunder are secured by substantially all our domestic assets and are guaranteed by certain of ourdomestic subsidiaries. Borrowings under the senior secured revolving credit facility bear interest, at our option, atthe bank prime rate or at the LIBOR rate, plus an applicable per annum margin in each case. The applicable perannum margin is determined based upon our leverage ratio in accordance with a pricing grid in the creditagreement. The per annum margin for LIBOR rate borrowings ranges from 1.50% to 2.50% and for bank prime
75

rate borrowings ranges from 0.50% to 1.50%. Based on the terms in the credit agreement, the LIBOR margin andbank prime rate margin in effect until delivery of our financial statements and the compliance certificate forDecember 31, 2008 are 2.25% and 1.25%, respectively. A commitment fee is due quarterly based on the averagedaily unused amount of the commitments of the Lenders under the senior secured revolving credit facility. Inaddition, a fronting fee is due for each letter of credit issued and a quarterly letter of credit fee is due based on theaverage undrawn amount of letters of credit outstanding during such period. We may repay the senior securedrevolving credit facility balance outstanding in whole or in part at any time without premium or penalty. Thesenior secured revolving credit facility replaced the $20.0 million credit facility we previously had with FrostNational Bank. Borrowings under the senior secured revolving credit facility were used to fund the WEDGEacquisition and are available for future acquisitions, working capital and other general corporate purposes.
At February 23, 2009, we had $257.5 million outstanding under the revolving portion of the senior securedrevolving credit facility and $9.3 million in committed letters of credit. Under the terms of the credit agreement,committed letters of credit are applied against our borrowing capacity under the senior secured revolving creditfacility. The borrowing availability under the senior secured revolving credit facility was $133.2 million atFebruary 23, 2009. There are no limitations on our ability to access the full borrowing availability under thesenior secured revolving credit facility other than maintaining compliance with the covenants in the creditagreement. Principal payments of $15.0 million made after December 31, 2008 are classified in the currentportion of long-term debt as of December 31, 2008. The outstanding balance under our senior secured creditfacility is not due until maturity on February 28, 2013. However, when cash and working capital is sufficient, wemay make principal payments to reduce the outstanding debt balance prior to maturity.
Effective June 11, 2008, we entered into a Waiver Agreement with the Lenders to waive the requirement toprovide certain financial statements in conjunction with our compliance certificate within the time periodrequired by the credit agreement. The Waiver Agreement required us to provide the financial statements and ourcompliance certificate on or before August 13, 2008. Until we provided these financial statements and ourcompliance certificate, the aggregate principal amount outstanding under the credit agreement could not exceed$350 million at any time (provided, however, that the commitment fee would continue to be calculated based onthe total commitment of $400 million), and the per annum margin applicable to all amounts outstanding underthe credit agreement would increase from the current rate of 2.25% for LIBOR rate borrowings and 1.25% forbank prime rate borrowings to 2.50% for LIBOR rate borrowings and 1.50% for bank prime rate borrowings. Therequired financial statements and our compliance certificate were delivered concurrently with the filing of theQuarterly Report on Form 10-Q for the quarterly period ended March 31, 2008 which occurred on August 5,2008.
At December 31, 2008, we were in compliance with the restrictive covenants contained in the creditagreement which include the following:
• We must have a maximum consolidated leverage ratio no greater than 3.00 to 1.00 for any fiscalquarter through March 31, 2009, 2.75 to 1.00 for any fiscal quarter ending June 30, 2009 throughMarch 31, 2010, and 2.50 to 1.00 for any fiscal quarter ending June 30, 2010 through maturity inFebruary 2013;
• If our maximum consolidated leverage ratio is greater than 2.25 to 1.00 at the end of any fiscal quarter,then we must have a minimum asset coverage ratio no less than 1.25 to 1.00; and
• We must have a minimum interest coverage ratio no less than 3.00 to 1.00.
At December 31, 2008, our consolidated leverage ratio was 1.28 to 1.00 and our interest coverage ratio was17.15 to 1.00. The credit agreement has additional restrictive covenants that, among other things, limit theincurrence of additional debt to a maximum of $15 million (other than debt under the senior secured revolvingcredit facility), investments, liens, dividends, acquisitions, redemptions of capital stock, prepayments ofindebtedness, asset dispositions, mergers and consolidations, transactions with affiliates, capital expenditures,hedging contracts, sale leasebacks and other matters customarily restricted in such agreements. In addition, thecredit agreement contains customary events of default, including without limitation, payment defaults, breaches
76

of representations and warranties, covenant defaults, cross-defaults to certain other material indebtedness inexcess of specified amounts, certain events of bankruptcy and insolvency, judgment defaults in excess ofspecified amounts, failure of any guaranty or security document supporting the credit agreement and change ofcontrol. Non-compliance with restrictive covenants or other events of default under the credit agreement couldtrigger an early repayment requirement and terminate the senior secured revolving credit facility.
Subordinated Notes Payable and Other
In addition to amounts outstanding under the senior secured revolving credit facility, long-term debtincludes subordinated notes payable to certain employees that are former shareholders of the production servicesbusinesses that were acquired by WEDGE prior to our acquisition of WEDGE on March 1, 2008, a subordinatednote payable to an employee that is a former shareholder of Competition, two subordinated notes payable tocertain employees that are former shareholders of Paltec, Inc. and Pettus Well Service. These subordinated notespayable have interest rates ranging from 5.44% to 14%, require quarterly payments of principal and interest andhave final maturity dates ranging from January 2009 to March 2013. The aggregate outstanding balance of thesesubordinated notes payable was $6.5 million as of December 31, 2008.
Other debt represents financing arrangements for computer software with an outstanding balance of $0.4million at December 31, 2008.
4. Leases
We lease our corporate office facilities in San Antonio, Texas at a cost escalating from $26,809 per monthto $29,316 per month pursuant to a lease extending through December 2013. We recognize rent expense on astraight line basis for our corporate office lease. In addition, we lease real estate at 30 other locations undernon-cancelable operating leases at costs ranging from $175 per month to $8,917 per month, pursuant to leasesexpiring through April 2013. These real estate locations are used primarily for division offices and storage andmaintenance yards. We also lease office equipment under non-cancelable operating leases expiring through May2012.
Future lease obligations required under non-cancelable operating leases as of December 31, 2008 were asfollows (amounts in thousands):
Years Ended December 31,
2009 . . . . . . . . . . . . . . . . . . . . . . . . . . . . . . . . . . . . . . . . . . . . . . . . . . . . . . . . . . . . . . $1,5662010 . . . . . . . . . . . . . . . . . . . . . . . . . . . . . . . . . . . . . . . . . . . . . . . . . . . . . . . . . . . . . . 1,2792011 . . . . . . . . . . . . . . . . . . . . . . . . . . . . . . . . . . . . . . . . . . . . . . . . . . . . . . . . . . . . . . 9492012 . . . . . . . . . . . . . . . . . . . . . . . . . . . . . . . . . . . . . . . . . . . . . . . . . . . . . . . . . . . . . . 6072013 . . . . . . . . . . . . . . . . . . . . . . . . . . . . . . . . . . . . . . . . . . . . . . . . . . . . . . . . . . . . . . 402Thereafter . . . . . . . . . . . . . . . . . . . . . . . . . . . . . . . . . . . . . . . . . . . . . . . . . . . . . . . . . . —
$4,803
Rent expense under operating leases for the year ended December 31, 2008 was $1.4 million and $0.3million for the nine months ended December 31, 2007 and the year ended March 31, 2007.
77

5. Income Taxes
The jurisdictional components of (loss) income before income taxes consist of the following (amounts inthousands):
Year EndedDecember 31,
2008
Nine Months EndedDecember 31,
2007
Year EndedMarch 31,
2007
Domestic . . . . . . . . . . . . . . . . . . . . . . . . . . . . . . . . . . . $(62,388) $55,752 $130,789Foreign . . . . . . . . . . . . . . . . . . . . . . . . . . . . . . . . . . . . 5,700 2,022 —
(Loss) income before income tax . . . . . . . . . . . . . . . . $(56,688) $57,774 $130,789
The components of our income tax expense (benefit) consist of the following (amounts in thousands):
Year EndedDecember 31,
2008
Nine Months EndedDecember 31,
2007
Year EndedMarch 31,
2007
Current tax:Federal . . . . . . . . . . . . . . . . . . . . . . . . . . . . . . . . $3,777 $10,587 $34,252State . . . . . . . . . . . . . . . . . . . . . . . . . . . . . . . . . . 1,181 1,593 1,704Foreign . . . . . . . . . . . . . . . . . . . . . . . . . . . . . . . . 348 — —
5,306 12,180 35,956
Deferred taxes:Federal . . . . . . . . . . . . . . . . . . . . . . . . . . . . . . . . 476 6,533 9,195State . . . . . . . . . . . . . . . . . . . . . . . . . . . . . . . . . . (211) (100) 1,458Foreign . . . . . . . . . . . . . . . . . . . . . . . . . . . . . . . . 486 (484) —
751 5,949 10,653
Income tax expense . . . . . . . . . . . . . . . . . . . . . . . $6,057 $18,129 $46,609
The difference between the income tax expense and the amount computed by applying the federal statutoryincome tax rate 35% to (loss) income before income taxes consist of the following (amounts in thousands):
Year EndedDecember 31,
2008
Nine Months EndedDecember 31,
2007
Year EndedMarch 31,
2007
Expected tax (benefit) expense . . . . . . . . . . . . . . . . . . $(19,840) $20,221 $45,776State income taxes . . . . . . . . . . . . . . . . . . . . . . . . . . . 556 971 2,417Incentive stock options . . . . . . . . . . . . . . . . . . . . . . . . 508 538 547Goodwill impairment . . . . . . . . . . . . . . . . . . . . . . . . . 26,752 — —Tax benefits in foreign jurisdictions . . . . . . . . . . . . . . (1,377) (1,191) —Domestic production activities deduction . . . . . . . . . (457) (729) (1,388)Tax-exempt interest income . . . . . . . . . . . . . . . . . . . . (219) (475) (422)Non deductible items for tax purposes . . . . . . . . . . . . 247 61 48Uncertain tax positions . . . . . . . . . . . . . . . . . . . . . . . . — (717) (372)Other, net . . . . . . . . . . . . . . . . . . . . . . . . . . . . . . . . . . (113) (550) 3
$ 6,057 $18,129 $46,609
78

Income tax expense (benefit) was allocated as follows (amounts in thousands):
Year EndedDecember 31,
2008
Nine Months EndedDecember 31,
2007
Year EndedMarch 31,
2007
Results of operations . . . . . . . . . . . . . . . . . . . . . . . . . . $6,057 $18,129 $46,609Stockholders’ equity . . . . . . . . . . . . . . . . . . . . . . . . . . (963) (54) (24)
$5,094 $18,075 $46,585
Deferred income taxes arise from temporary differences between the tax bases of assets and liabilities andtheir reported amounts in the consolidated financial statements. The components of our deferred income taxassets and liabilities were as follows (amounts in thousands):
December 31,2008
December 31,2007
Deferred tax assets:Auction rate preferred securities . . . . . . . . . . . . . . . . . . . . . . . . . . . . $ 719 $ —Intangibles . . . . . . . . . . . . . . . . . . . . . . . . . . . . . . . . . . . . . . . . . . . . . 23,207 —Employee benefits and insurance claims accruals . . . . . . . . . . . . . . . 4,963 3,292Accounts receivable reserve . . . . . . . . . . . . . . . . . . . . . . . . . . . . . . . 600 —Employee stock based compensation . . . . . . . . . . . . . . . . . . . . . . . . . 2,222 1,095Accrued expenses not deductible for tax purposes . . . . . . . . . . . . . . 1,730 498Accrued revenue not income for book purposes . . . . . . . . . . . . . . . . 1,784 613Foreign net operating loss carryforward . . . . . . . . . . . . . . . . . . . . . . 4,705 3,637
39,930 9,135Valuation allowance . . . . . . . . . . . . . . . . . . . . . . . . . . . . . . . . . . . . . . (5,382) (3,997)
Total deferred tax assets . . . . . . . . . . . . . . . . . . . . . . . . . . . . . . . 34,548 5,138
Deferred tax liabilities:Property and equipment . . . . . . . . . . . . . . . . . . . . . . . . . . . . . . . . . . . 89,193 47,731
Total deferred tax liabilities . . . . . . . . . . . . . . . . . . . . . . . . . . . . . . . . 89,193 47,731
Net deferred tax liabilities . . . . . . . . . . . . . . . . . . . . . . . . . . . . . $54,645 $42,593
In assessing the realizability of deferred tax assets, we consider whether it is more likely than not that someportion or all of the deferred tax assets will not be realized. Based on the expectation of future taxable incomeand that the deductible temporary differences will offset existing taxable temporary differences, we believe it ismore likely than not that we will realize the benefits of these deductible temporary differences, net of the existingvaluation allowance at December 31, 2008.
As of December 31, 2008, we had foreign deferred tax assets consisting of foreign net operating losses andother tax benefits available to reduce future taxable income in a foreign jurisdiction. In assessing the realizabilityof our foreign deferred tax assets, we only recognize a tax benefit to the extent of taxable income that we expectto earn in the foreign jurisdiction in future periods. Due to recent declines in oil and natural gas prices and thedownturn in our industry, we anticipate reductions in drilling rig utilization and revenue rates in 2009.Consequently, we have a valuation allowance of $5.4 million that fully offsets our foreign deferred tax assets.The foreign net operating loss has an indefinite carryforward period.
Deferred income taxes have not been provided on the future tax consequences attributable to differencebetween the financial statements carrying amounts of existing assets and liabilities and the respective tax bases ofour foreign subsidiary based on the determination that such differences are essentially permanent in duration inthat the earnings of the subsidiary is expected to be indefinitely reinvested in foreign operations. As of
79

December 31, 2008, the cumulative undistributed earnings of the subsidiary was approximately $1.9 million. Ifthose earnings were not considered indefinitely reinvested, deferred income taxes would have been recorded afterconsideration of foreign tax credits. It is not practicable to estimate the amount of additional tax that might bepayable on those earnings, if distributed.
We have no unrecognized tax benefits relating to FIN No. 48 and no unrecognized tax benefit activityduring the year ended December 31, 2008.
We adopted a policy to record interest and penalty expense related to income taxes as interest and otherexpense, respectively. At December 31, 2008, no interest or penalties have been or are required to be accrued.Our open tax years for our federal income tax returns are for the years ended March 31, 2007 and December 31,2007.
6. Fair Value of Financial Instruments
The carrying amounts of our cash and cash equivalents, trade receivables and payables approximate theirfair values.
7. (Loss) Earnings Per Common Share
The following table presents a reconciliation of the numerators and denominators of the basic (loss)earnings per share and diluted (loss) earnings per share comparisons as required by SFAS No. 128 (amounts inthousands, except per share data):
Year EndedDecember 31,
2008
Nine Months EndedDecember 31,
2007
Year EndedMarch 31,
2007
BasicNet (loss) earnings . . . . . . . . . . . . . . . . . . . . . . . . . . . $(62,745) $39,645 $84,180
Weighted average shares . . . . . . . . . . . . . . . . . . . . . . 49,789 49,645 49,603
(Loss) earnings per share . . . . . . . . . . . . . . . . . . . . . . $ (1.26) $ 0.80 $ 1.70
DilutedNet (loss) earnings . . . . . . . . . . . . . . . . . . . . . . . . . . . $(62,745) $39,645 $84,180Effect of dilutive securities . . . . . . . . . . . . . . . . . . . . . — — —
Net (loss) earnings available to commonshareholders after assumed conversion . . . . . . . . . $(62,745) $39,645 $84,180
Weighted average shares:Outstanding . . . . . . . . . . . . . . . . . . . . . . . . . . . . . 49,789 49,645 49,603Options . . . . . . . . . . . . . . . . . . . . . . . . . . . . . . . . — 556 529
49,789 50,201 50,132
(Loss) earnings per share . . . . . . . . . . . . . . . . . . . . . . $ (1.26) $ 0.79 $ 1.68
All outstanding stock options were excluded from the diluted loss per share calculation for the year endedDecember 31, 2008 because the effect of their inclusion would be antidilutive, or would decrease the reportedloss per share.
80
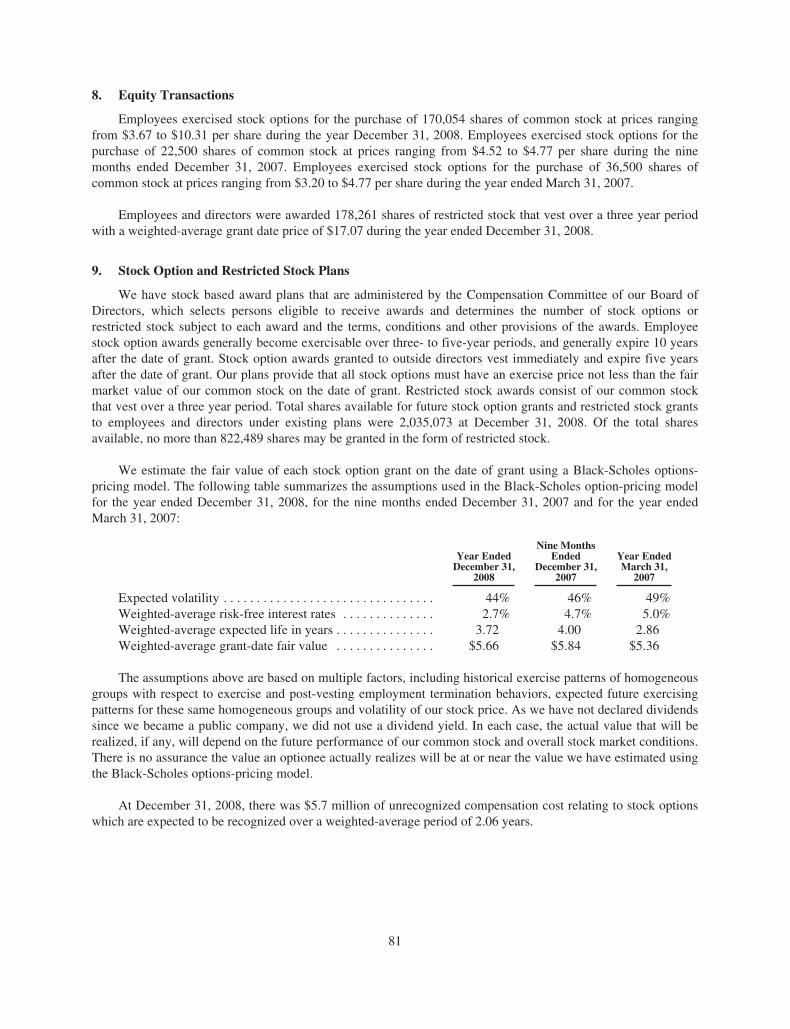
8. Equity Transactions
Employees exercised stock options for the purchase of 170,054 shares of common stock at prices rangingfrom $3.67 to $10.31 per share during the year December 31, 2008. Employees exercised stock options for thepurchase of 22,500 shares of common stock at prices ranging from $4.52 to $4.77 per share during the ninemonths ended December 31, 2007. Employees exercised stock options for the purchase of 36,500 shares ofcommon stock at prices ranging from $3.20 to $4.77 per share during the year ended March 31, 2007.
Employees and directors were awarded 178,261 shares of restricted stock that vest over a three year periodwith a weighted-average grant date price of $17.07 during the year ended December 31, 2008.
9. Stock Option and Restricted Stock Plans
We have stock based award plans that are administered by the Compensation Committee of our Board ofDirectors, which selects persons eligible to receive awards and determines the number of stock options orrestricted stock subject to each award and the terms, conditions and other provisions of the awards. Employeestock option awards generally become exercisable over three- to five-year periods, and generally expire 10 yearsafter the date of grant. Stock option awards granted to outside directors vest immediately and expire five yearsafter the date of grant. Our plans provide that all stock options must have an exercise price not less than the fairmarket value of our common stock on the date of grant. Restricted stock awards consist of our common stockthat vest over a three year period. Total shares available for future stock option grants and restricted stock grantsto employees and directors under existing plans were 2,035,073 at December 31, 2008. Of the total sharesavailable, no more than 822,489 shares may be granted in the form of restricted stock.
We estimate the fair value of each stock option grant on the date of grant using a Black-Scholes options-pricing model. The following table summarizes the assumptions used in the Black-Scholes option-pricing modelfor the year ended December 31, 2008, for the nine months ended December 31, 2007 and for the year endedMarch 31, 2007:
Year EndedDecember 31,
2008
Nine MonthsEnded
December 31,2007
Year EndedMarch 31,
2007
Expected volatility . . . . . . . . . . . . . . . . . . . . . . . . . . . . . . . . 44% 46% 49%Weighted-average risk-free interest rates . . . . . . . . . . . . . . 2.7% 4.7% 5.0%Weighted-average expected life in years . . . . . . . . . . . . . . . 3.72 4.00 2.86Weighted-average grant-date fair value . . . . . . . . . . . . . . . $5.66 $5.84 $5.36
The assumptions above are based on multiple factors, including historical exercise patterns of homogeneousgroups with respect to exercise and post-vesting employment termination behaviors, expected future exercisingpatterns for these same homogeneous groups and volatility of our stock price. As we have not declared dividendssince we became a public company, we did not use a dividend yield. In each case, the actual value that will berealized, if any, will depend on the future performance of our common stock and overall stock market conditions.There is no assurance the value an optionee actually realizes will be at or near the value we have estimated usingthe Black-Scholes options-pricing model.
At December 31, 2008, there was $5.7 million of unrecognized compensation cost relating to stock optionswhich are expected to be recognized over a weighted-average period of 2.06 years.
81

The following table represents stock option activity from March 31, 2007 through December 31, 2008:
Number ofShares
Weighted-AverageExercise Price
Weighted-AverageRemaining
Contract Life
Outstanding stock options as of March 31,2007 . . . . . . . . . . . . . . . . . . . . . . . . . . . . . . . . . . 1,946,500 $ 9.29
Granted . . . . . . . . . . . . . . . . . . . . . . . . . . . . . . 931,500 14.06Exercised . . . . . . . . . . . . . . . . . . . . . . . . . . . . (22,500) 4.74Canceled . . . . . . . . . . . . . . . . . . . . . . . . . . . . . — —Forfeited . . . . . . . . . . . . . . . . . . . . . . . . . . . . . (55,001) 11.73
Outstanding stock options as of December 31,2007 . . . . . . . . . . . . . . . . . . . . . . . . . . . . . . . . . . 2,800,499 $10.87
Granted . . . . . . . . . . . . . . . . . . . . . . . . . . . . . . 1,460,764 $15.89Exercised . . . . . . . . . . . . . . . . . . . . . . . . . . . . (170,054) 4.61Canceled . . . . . . . . . . . . . . . . . . . . . . . . . . . . . — —Forfeited . . . . . . . . . . . . . . . . . . . . . . . . . . . . . (321,514) 13.74
Outstanding stock options as of December 31,2008 . . . . . . . . . . . . . . . . . . . . . . . . . . . . . . . . . . 3,769,695 $12.85 7.70
Stock options exercisable as of December 31,2008 . . . . . . . . . . . . . . . . . . . . . . . . . . . . . . . . . . 1,741,932 $10.30 6.20
At December 31, 2008, the aggregate intrinsic value of stock options outstanding was $0.9 million and theaggregate intrinsic value of stock options exercisable was $0.9 million. Intrinsic value is the difference betweenthe exercise price of a stock option and the closing market price of our common stock, which was $5.57 onDecember 31, 2008.
The following table summarizes our nonvested stock option activity from March 31, 2007 throughDecember 31, 2008:
Number ofShares
Weighted-AverageGrant-DateFair Value
Nonvested stock options as of March 31, 2007 . . . . . . . . . . . . . . . . . . . 880,666 $5.48Granted . . . . . . . . . . . . . . . . . . . . . . . . . . . . . . . . . . . . . . . . . . . . . 931,500 5.84Vested . . . . . . . . . . . . . . . . . . . . . . . . . . . . . . . . . . . . . . . . . . . . . . (253,324) 5.49Forfeited . . . . . . . . . . . . . . . . . . . . . . . . . . . . . . . . . . . . . . . . . . . . . (55,001) 5.89
Nonvested stock options as of December 31, 2007 . . . . . . . . . . . . . . . . 1,503,841 $5.64Granted . . . . . . . . . . . . . . . . . . . . . . . . . . . . . . . . . . . . . . . . . . . . . 1,460,764 5.67Vested . . . . . . . . . . . . . . . . . . . . . . . . . . . . . . . . . . . . . . . . . . . . . . (627,993) 5.63Forfeited . . . . . . . . . . . . . . . . . . . . . . . . . . . . . . . . . . . . . . . . . . . . . (308,849) 5.17
Nonvested stock options as of December 31, 2008 . . . . . . . . . . . . . . . . 2,027,763 $5.74
82

The following table summarizes our restricted stock activity from December 31, 2007 throughDecember 31, 2008:
Numberof Shares
Weighted-AverageGrant-Date FairValue per Share
Nonvested restricted stock as of December 31, 2007 . . . . . . . . . . . . . . . . — $ —Granted . . . . . . . . . . . . . . . . . . . . . . . . . . . . . . . . . . . . . . . . . . . . . . . 178,261 17.07Vested . . . . . . . . . . . . . . . . . . . . . . . . . . . . . . . . . . . . . . . . . . . . . . . . (3,645) 17.07Forfeited . . . . . . . . . . . . . . . . . . . . . . . . . . . . . . . . . . . . . . . . . . . . . . (750) 17.07
Nonvested restricted stock as of December 31, 2008 . . . . . . . . . . . . . . . . 173,866 $17.07
The 178,261 restricted stock awards granted during the year ended December 31, 2008 were the firstrestricted stock awards granted under our stock based award plans. At December 31, 2008, there was $2.2 millionof unrecognized compensation cost relating to restricted stock awards which are expected to be recognized over aweighted-average period of 2.65 years.
10. Employee Benefit Plans and Insurance
We maintain a 401(k) retirement plan for our eligible employees. Under this plan, we may make a matchingcontribution, on a discretionary basis, equal to a percentage of each eligible employee’s annual contribution,which we determine annually. Our matching contributions for the year ended December 31, 2008, the ninemonths ended December 31, 2007 and the year ended March 31, 2007 were $1.8 million, $0.8 million and $1.0million, respectively.
We maintain a self-insurance program, for major medical, hospitalization and dental coverage foremployees and their dependents, which is partially funded by employee payroll deductions. We have providedfor both reported and incurred but not reported medical costs in the accompanying consolidated balance sheets.We have a maximum liability of $125,000 per employee/dependent per year except for individuals employed byour Production Services Division where we had no deductible during the period ended December 31, 2008.Amounts in excess of the stated maximum are covered under a separate policy provided by an insurancecompany. Accrued expenses—payroll and employee related costs at December 31, 2008 and December 31, 2007include $1.1 million and $0.8 million, respectively, for our estimate of incurred but unpaid costs related to theself-insurance portion of our health insurance.
We are self-insured for up to $500,000 per incident for all workers’ compensation claims submitted byemployees for on-the-job injuries, except in North Dakota where there is no deductible. Our deductible underworkers’ compensation insurance increased from $250,000 in October 2007. We have deductibles of $250,000and $100,000 per occurrence under our general liability insurance and auto liability insurance, respectively. Weaccrue our workers’ compensation claim cost estimates based on historical claims development data and weaccrue the cost of administrative services associated with claims processing. Accrued expenses—insurancepremiums and deductibles at December 31, 2008 and December 31, 2007 include $9.6 million and $8.6 million,respectively, for our estimate of costs relative to the self-insured portion of our workers’ compensation, generalliability and auto liability insurance. Based upon our past experience, management believes that we haveadequately provided for potential losses. However, future multiple occurrences of serious injuries to employeescould have a material adverse effect on our financial position and results of operations.
11. Segment Information
At December 31, 2008, we had two operating segments referred to as the Drilling Services Division and theProduction Services Division which is the basis management uses for making operating decisions and assessingperformance. Prior to our acquisitions of the production services businesses from WEDGE and Competition on
83

March 1, 2008, all our operations related to the Drilling Services Division and we reported these operations in asingle operating segment. The acquisitions of the production services businesses from WEDGE and Competitionresulted in the formation of our Production Services Division. See Note 2.
Drilling Services Division—Our Drilling Services Division provides contract land drilling services with itsfleet of 70 drilling rigs in the following locations:
Drilling Division Locations Rig Count
South Texas . . . . . . . . . . . . . . . . . . . . . . . . . . . . . . . . . . . . . . . . . . . . . . . . . . . . . . . 17East Texas . . . . . . . . . . . . . . . . . . . . . . . . . . . . . . . . . . . . . . . . . . . . . . . . . . . . . . . . 22North Texas . . . . . . . . . . . . . . . . . . . . . . . . . . . . . . . . . . . . . . . . . . . . . . . . . . . . . . . 9Utah . . . . . . . . . . . . . . . . . . . . . . . . . . . . . . . . . . . . . . . . . . . . . . . . . . . . . . . . . . . . . 6North Dakota . . . . . . . . . . . . . . . . . . . . . . . . . . . . . . . . . . . . . . . . . . . . . . . . . . . . . . 6Oklahoma . . . . . . . . . . . . . . . . . . . . . . . . . . . . . . . . . . . . . . . . . . . . . . . . . . . . . . . . 5Colombia . . . . . . . . . . . . . . . . . . . . . . . . . . . . . . . . . . . . . . . . . . . . . . . . . . . . . . . . . 5
Production Services Division—Our Production Services Division provides a broad range of well services tooil and gas drilling and producing companies, including workover services, wireline services, and fishing andrental services. Our production services operations are managed regionally and are concentrated in the majorUnited States onshore oil and gas producing regions in the Gulf Coast, Mid-Continent, and Rocky Mountainstates. We have a premium fleet of 74 workover rigs consisting of sixty-nine 550 horseposewer rigs, four 600horsepower rigs, and one 400 horsepower rig. We provide wireline services with a fleet of 59 wireline units andrental services with approximately $15 million of fishing and rental tools.
The following tables set forth certain financial information for our two operating segments and corporate asof and for the year ended December 31, 2008 (amounts in thousands):
As of and for the Year Ended December 31, 2008
DrillingServicesDivision
ProductionServicesDivision Corporate Total
Identifiable assets . . . . . . . . . . . . . . . . . . . . . . . . . . . $567,956 $232,063 $24,460 $824,479
Revenues . . . . . . . . . . . . . . . . . . . . . . . . . . . . . . . . . $456,890 $153,994 $ — $610,884Operating costs . . . . . . . . . . . . . . . . . . . . . . . . . . . . 269,846 80,097 — 349,943
Segment margin . . . . . . . . . . . . . . . . . . . . . . . . $187,044 $ 73,897 $ — $260,941
Depreciation and amortization . . . . . . . . . . . . . . . . . $ 66,270 $ 21,441 $ 434 $ 88,145Capital expenditures . . . . . . . . . . . . . . . . . . . . . . . . $107,344 $ 38,921 $ 1,831 $148,096
The following table reconciles the segment profits reported above to income from operations as reported onthe condensed consolidated statements of operations for the year ended December 31, 2008 (amounts inthousands):
Year EndedDecember 31, 2008
Segment margin . . . . . . . . . . . . . . . . . . . . . . . . . . . . . . . . . . . . . . . . . . . . . . $ 260,941Depreciation and amortization . . . . . . . . . . . . . . . . . . . . . . . . . . . . . . . . . . (88,145)Selling, general and administrative . . . . . . . . . . . . . . . . . . . . . . . . . . . . . . . (44,834)Bad debt (expense) recovery . . . . . . . . . . . . . . . . . . . . . . . . . . . . . . . . . . . . (423)Impairment of goodwill . . . . . . . . . . . . . . . . . . . . . . . . . . . . . . . . . . . . . . . . (118,646)Impairment of intangible assets . . . . . . . . . . . . . . . . . . . . . . . . . . . . . . . . . . (52,847)
Loss from operations . . . . . . . . . . . . . . . . . . . . . . . . . . . . . . . . . . . . . . $ (43,954)
84

The following table sets forth certain financial information for our international operations in Colombia asof and for the year ended December 31, 2008 which is included in our Drilling Services Division (amounts inthousands):
As of and for theYear Ended
December 31, 2008
Identifiable assets . . . . . . . . . . . . . . . . . . . . . . . . . . . . . . . . . . . . . . . . . . . . $107,927
Revenues . . . . . . . . . . . . . . . . . . . . . . . . . . . . . . . . . . . . . . . . . . . . . . . . . . . $ 51,414
12. Commitments and Contingencies
In connection with our expansion into international markets, our foreign subsidiaries have obtained bondsfor bidding on drilling contracts, performing under drilling contracts, and remitting customs and importationduties. We have guaranteed payments of $36.2 million relating to our performance under these bonds.
In addition, due to the nature of our business, we are, from time to time, involved in routine litigation orsubject to disputes or claims related to our business activities, including workers’ compensation claims andemployment-related disputes. Legal costs relating to these matters are expensed as incurred. In the opinion of ourmanagement, none of the pending litigation, disputes or claims against us will have a material adverse effect onour financial condition, results of operations or cash flow from operations and there is only a remote possibilitythat any such matter will require any additional loss accrual.
13. Quarterly Results of Operations (unaudited)
The following table summarizes quarterly financial data for the year ended December 31, 2008 and the ninemonths ended December 31, 2007 (in thousands, except per share data):
Year Ended December 31, 2008 (1) (2)First
QuarterSecondQuarter
ThirdQuarter
FourthQuarter Total
Revenues . . . . . . . . . . . . . . . . . . . . . . . . . . . . . . . . . . . $113,397 $152,547 $174,245 $ 170,695 $610,884Income (loss) from operations . . . . . . . . . . . . . . . . . . 17,995 33,716 42,073 (137,738) (43,954)Income tax (expense) benefit . . . . . . . . . . . . . . . . . . . (6,250) (9,609) (12,760) 22,562 (6,057)Net earnings (loss) . . . . . . . . . . . . . . . . . . . . . . . . . . . 11,848 19,117 24,194 (117,904) (62,745)Earnings (loss) per share:
Basic . . . . . . . . . . . . . . . . . . . . . . . . . . . . . . . . . . $ 0.24 $ 0.38 $ 0.49 $ (2.37) $ (1.26)Diluted (3) . . . . . . . . . . . . . . . . . . . . . . . . . . . . . . $ 0.24 $ 0.38 $ 0.48 $ (2.37) $ (1.26)
Nine Months Ended December 31, 2007
Revenues . . . . . . . . . . . . . . . . . . . . . . . . . . . . . . . . . . . $102,779 $106,516 $104,589 $ — $313,884Income from operations . . . . . . . . . . . . . . . . . . . . . . . 19,569 17,307 18,384 — 55,260Income tax expense . . . . . . . . . . . . . . . . . . . . . . . . . . . (7,362) (6,255) (4,512) — (18,129)Net earnings . . . . . . . . . . . . . . . . . . . . . . . . . . . . . . . . 13,088 11,780 14,777 — 39,645Earnings per share:
Basic . . . . . . . . . . . . . . . . . . . . . . . . . . . . . . . . . . $ 0.26 $ 0.24 $ 0.30 $ — $ 0.80Diluted (3) . . . . . . . . . . . . . . . . . . . . . . . . . . . . . . $ 0.26 $ 0.23 $ 0.29 $ — $ 0.79
(1) Our quarterly results of operations for the year ended December 31, 2008 include the results of operationsrelating to acquisitions of WEDGE and Competition, both of which occurred on March 1, 2008. See note 2.
(2) Our quarterly results of operations for the fourth quarter of the year ended December 31, 2008 reflect theimpact of a goodwill impairment charge of $118.6 million and an intangible asset impairment charge of$52.8 million. See note 1.
(3) Due to the effects of rounding, the sum of quarterly earnings per share does not equal total earnings pershare for the fiscal year.
85

Item 9. Changes in and Disagreements With Accountants on Accounting and Financial Disclosure
Not applicable.
Item 9A. Controls and Procedures
In accordance with Exchange Act Rules 13a-15 and 15d-15, we carried out an evaluation, under thesupervision and with the participation of management, including our Chief Executive Officer and Chief FinancialOfficer, of the effectiveness of our disclosure controls and procedures as of the end of the period covered by thisreport. Based upon that evaluation, our Chief Executive Officer and Chief Financial Officer concluded that ourdisclosure controls and procedures were effective as of December 31, 2008 to provide reasonable assurance thatinformation required to be disclosed in our reports filed or submitted under the Exchange Act is recorded,processed, summarized and reported within the time periods specified in the Securities and ExchangeCommission’s rules and forms.
There has been no change in our internal control over financial reporting that occurred during the threemonths ended December 31, 2008 that has materially affected, or is reasonably likely to materially affect, ourinternal control over financial reporting.
We completed the acquisitions of the production services businesses of WEDGE, Competition, Paltec andPettus during 2008. We are in the process of transferring accounting processes for the new acquisition to ourheadquarters and into our existing internal control processes. The integration will lead to changes in theseinternal controls in future fiscal periods, but we do not expect these changes to materially affect our internalcontrols over financial reporting. Consistent with published guidance of the SEC, our management excludedfrom its assessment of the effectiveness of Pioneer Drilling Company’s internal control over financial reportingas of December 31, 2008, the internal control over financial reporting for WEDGE, Competition, Paltec andPettus associated with total assets of $232.1 million and total revenues of $154.0 million included in theconsolidated financial statement amounts of Pioneer Drilling Company as of and for the year endedDecember 31, 2008. We will include these acquired companies in the scope of our assessment of internal controlover financial reporting for the year ending December 31, 2009.
Investigation by the Special Subcommittee of the Board of Directors
On May 12, 2008, the Company announced a delay in filing its Form 10-Q for the quarter ended March 31,2008 (the “Quarterly Report”), as a result of certain questions raised with respect to the effectiveness of theCompany’s internal control over financial reporting. On May 15, 2008, the Board of Directors formed a specialsubcommittee of the Board (the “Special Committee”) to investigate the questions raised regarding theCompany’s internal control over financial reporting and to determine whether such weaknesses, if any, havematerially affected the Company’s financial statements The Special Committee engaged Bracewell & GiulianiLLP (“Bracewell”), as independent legal counsel, and Deloitte & Touche LLP (“Deloitte”), as independentforensic accountants, to assist in the investigation.
In July 2008, after an extensive document review and interviewing relevant current and former employeesand vendors, Bracewell presented their report to the Special Committee. After consideration of the report, theSpecial Committee then met with the Board of Directors, at which meeting Bracewell also presented its report tothe Board of Directors, to discuss the report and present the Special Committee’s recommendations.
After reviewing the report, the Special Committee and the Board of Directors concluded that they were notaware of any facts that caused them to believe that there was any material misstatement of the Company’shistorical financial statements or in the financial statements proposed to be included in the Quarterly Report.
Furthermore, based on the Bracewell report, the Special Committee and the Board do not believe that thequestions raised constituted a material weakness in the Company’s internal control over financial reporting. TheBracewell report, however, did identify certain control deficiencies and made recommendations, that have beenadopted by the Board of Directors, to enhance the Company’s governance and control environment.
86

The Bracewell report noted some deficiencies in the Company’s manual process to record purchases andprocess expenditures, for both expense and capital expenditures. While there were certain compensating controlsthat mitigated the financial reporting risks associated with these deficiencies, the Bracewell report recommendedthat the Company implement a more effective systematic purchase order application integrated with the generalledger. Consistent with the recommendation in the Bracewell report, the Company intends to enhance its currentprocess by expanding, upgrading, better systematizing and making prospective its current purchase order system.
The Bracewell report and the Special Committee’s review also noted the desirability to improvecommunications and more clearly delineate roles and responsibilities within the Company. As recommended inthe Bracewell report, the Company has hired a general counsel and chief compliance officer, and intends tofurther define roles and responsibilities within the Company, and to undertake a series of training initiatives.
The Bracewell report also reviewed certain matters related to the Company’s Colombian operations. In lightof the recent commencement of these operations and cultural and other issues involved in integrating them intothe Company and its systems, including documentation procedures, the Bracewell report recommended, and theBoard has already begun to focus on, additional oversight of these operations as the Company continues theintended expansion in this market.
Finally, the Board has directed management to consider and report back to the Board with respect to theimplementation of additional controls and procedures. These include a disclosure committee comprised ofrepresentatives from operations, compliance and finance and accounting and a quarterly subcertification andmanagement representation process with signoff by segment and service line operating executives andcontrollers, corporate accounting managers and other personnel involved in the financial reporting process. Theseprocesses should enhance internal accountability for our financial statements.
Management’s Report on Internal Control Over Financial Reporting
The management of Pioneer Drilling Company is responsible for establishing and maintaining adequateinternal control over financial reporting. Pioneer Drilling Company’s internal control over financial reporting is aprocess designed to provide reasonable assurance regarding the reliability of financial reporting and thepreparation of financial statements for external purposes in accordance with generally accepted accountingprinciples. A company’s internal control over financial reporting includes those policies and procedures that:(1) pertain to the maintenance of records that, in reasonable detail, accurately and fairly reflect the transactionsand dispositions of the assets of the company; (2) provide reasonable assurance that transactions are recorded asnecessary to permit preparation of financial statements in accordance with generally accepted accountingprinciples, and that receipts and expenditures of the company are being made only in accordance withauthorizations of management and directors of the company; and (3) provide reasonable assurance regardingprevention or timely detection of unauthorized acquisition, use, or disposition of the company’s assets that couldhave a material effect on the financial statements. Because of its inherent limitations, internal control overfinancial reporting may not prevent or detect misstatements. Also, projections of any evaluation of effectivenessto future periods are subject to the risk that controls may become inadequate because of changes in conditions, orthat the degree of compliance with the policies or procedures may deteriorate.
Pioneer Drilling Company’s management assessed the effectiveness of Pioneer Drilling Company’s internalcontrol over financial reporting as of December 31, 2008. In making this assessment, it used the criteria set forthby the Committee of Sponsoring Organizations of the Treadway Commission (COSO) in Internal Control-Integrated Framework. Based on our assessment we have concluded that, as of December 31, 2008, PioneerDrilling Company’s internal control over financial reporting was effective based on those criteria.
KPMG LLP, the independent registered public accounting firm that audited the consolidated financialstatements of Pioneer Drilling Company included in this Annual Report on Form 10-K, has issued an attestationreport on the effectiveness of Pioneer Drilling Company’s internal control over financial reporting as ofDecember 31, 2008. This report appears on page 57.
87

Item 9B. Other Information
Not applicable.
PART III
In Items 10, 11, 12, 13 and 14 below, we are incorporating by reference the information we refer to in thoseItems from the definitive proxy statement for our 2009 Annual Meeting of Shareholders. We intend to file thatdefinitive proxy statement with the SEC by April 10, 2009.
Item 10. Directors, Executive Officers and Corporate Governance
Please see the information appearing under the headings “Proposal 1—Election of Directors,” “ExecutiveOfficers,” “Information Concerning Meetings and Committees of the Board of Directors,” “Code of Conduct andEthics” and “Section16(a) Beneficial Ownership Reporting Compliance” in the definitive proxy statement for our2009 Annual Meeting of Shareholders for the information this Item 10 requires.
Item 11. Executive Compensation
Please see the information appearing under the headings “Compensation Discussion and Analysis,”“Compensation of Directors,” “Compensation of Executive Officers,” “Compensation Committee Interlocks andInsider Participation” and “Compensation Committee Report” in the definitive proxy statement for our 2009Annual Meeting of Shareholders for the information this Item 11 requires.
Item 12. Security Ownership of Certain Beneficial Owners and Management and Related ShareholderMatters
Please see the information appearing (1) under the heading “Equity Compensation Plan Information” inItem 5 of Part II of this report and (2) under the heading “Security Ownership of Certain Beneficial Owners andManagement” in the definitive proxy statement for our 2009 Annual Meeting of Shareholders for the informationthis Item 12 requires.
Item 13. Certain Relationships and Related Transactions, and Director Independence
Please see the information appearing under the headings “Proposal 1—Election of Directors” and “CertainRelationships and Related Transactions” in the definitive proxy statement for our 2009 Annual Meeting ofShareholders for the information this Item 13 requires.
Item 14. Principal Accountant Fees and Services
Please see the information appearing under the heading “Proposal 2—Ratification of Appointment ofIndependent Auditors” in the definitive proxy statement for our 2009 Annual Meeting of Shareholders for theinformation this Item 14 requires.
88

PART IV
Item 15. Exhibits and Financial Statement Schedules
(1) Financial Statements.
See Index to Consolidated Financial Statements on page 55.
Financial Statement Schedules.
No financial statement schedules are submitted because either they are inapplicable or because the requiredinformation is included in the consolidated financial statements or notes thereto.
89

(3) Exhibits. The following exhibits are filed as part of this report:
ExhibitNumber Description
2.1* - Securities Purchase Agreement, dated January 31, 2008, by and among Pioneer DrillingCompany, WEDGE Group Incorporated, WEDGE Energy Holdings, L.L.C., WEDGE Oil & GasServices, L.L.C., Timothy Daley, John Patterson and Patrick Grissom (Form 8-K dated February1, 2008 (File No. 1-8182, Exhibit 2.1))
2.2* - Letter Agreement, dated February 29, 2008, amending the Securities Purchase Agreement, datedJanuary 31, 2008, by and among Pioneer Drilling Company, WEDGE Group Incorporated,WEDGE Energy Holdings, L.L.C., WEDGE Oil & Gas Services, L.L.C., Timothy Daley, JohnPatterson and Patrick Grissom (Form 8-K dated March 3, 2008 (File No. 1-8182, Exhibit 2.1))
3.1 - Restated Articles of Incorporation of Pioneer Drilling Company.
3.2* - Amended and Restated Bylaws of Pioneer Drilling Company (Form 8-K dated December 15,2008 (File No. 1-8182, Exhibit 3.1)).
4.1* - Form of Certificate representing Common Stock of Pioneer Drilling Company (Form S-8 filedNovember 18, 2003 (Reg. No. 333-110569, Exhibit 4.3)).
4.2* - Credit Agreement between Pioneer Drilling Services, Ltd. and Frost National Bank, asAdministrative Agent, Agent, Lead Arranger and Lender dated October 29, 2004 (Form 8-Kdated November 2, 2004 (File No. 1-8182, Exhibit 4.1)).
4.3* - Second Amendment, dated May 11, 2005, to Credit Agreement between Pioneer DrillingServices, Ltd. and Frost National Bank, as Administrative Agent, Lead Arranger and Lenderdated October 29, 2004 (Form 8-K dated May 13, 2005 (File No. 1-8182, Exhibit 4.1)).
4.4* - Third Amendment, dated October 25, 2005, to Credit Agreement between Pioneer DrillingServices, Ltd. and Frost National Bank, as Administrative Agent, Lead Arranger and Lenderdated October 29, 2004 (Form 8-K dated October 28, 2005 (File No. 1-8182, Exhibit 4.1)).
4.5* - Fourth Amendment, dated December 15, 2005, to Credit Agreement between Pioneer DrillingServices, Ltd. and Frost National Bank, as Administrative Agent, Lead Arranger and Lenderdated October 29, 2004 (Form 8-K dated December 16, 2005 (File No. 1-8182, Exhibit 4.1)).
4.6* - Fifth Amendment, dated October 30, 2006, to Credit Agreement between Pioneer DrillingServices, Ltd. and Frost National Bank, as Administrative Agent, Lead Arranger and Lenderdated October 29, 2004 (Form 8-K dated October 31, 2006 (File No. 1-8182, Exhibit 4.1)).
10.1+* - Pioneer Drilling Services, Ltd. Annual Incentive Compensation Plan dated August 5, 2005(Form 8-K dated August 5, 2005 (File No. 1-8182, Exhibit 10.1)).
10.2+* - Pioneer Drilling Company Amended and Restated Key Executive Severance Plan datedDecember 10, 2007 (Form 10-Q for the quarter ended March 31, 2008 (File No. 1-8182, Exhibit10.4)).
10.3+* - Pioneer Drilling Company’s 1995 Stock Plan and form of Stock Option Agreement (Form 10-Kfor the year ended March 31, 2001 (File No. 1-8182, Exhibit 10.5)).
10.4+* - Pioneer Drilling Company’s 1999 Stock Plan and form of Stock Option Agreement (Form 10-Kfor the year ended March 31, 2001 (File No. 1-8182, Exhibit 10.7)).
10.5+* - Pioneer Drilling Company 2003 Stock Plan (Form S-8 filed November 18, 2003 (File No.333-110569, Exhibit 4.4)).
10.6+* - Amended and Restated Pioneer Drilling Company 2007 Incentive Plan adopted May 16, 2008(Form 10-Q for the quarter ended March 31, 2008 (File No. 1-8182, Exhibit 10.5)).
90

ExhibitNumber Description
10.7+* - Joyce M. Schuldt Employment Letter, dated July 17, 2007 (Form 8-K dated July 18, 2007 (FileNo. 1-8182, Exhibit 10.1)).
10.8+* - William D. Hibbetts Reassignment Letter, dated July 17, 2007 (Form 8-K dated July 18, 2007(File No. 1-8182, Exhibit 10.2)).
10.9+* - Pioneer Drilling Company Form of Indemnification Agreement (Form 8-K dated August 8, 2007(File No. 1-8182, Exhibit 10.1)).
10.10+* - Pioneer Drilling Company Employee Relocation Policy Executive Officers—Package A(Form 8-K dated August 8, 2007 (File No. 1-8182, Exhibit 10.3)).
10.11* Credit Agreement, dated February 29, 2008, among Pioneer Drilling Company, as Borrower, andWells Fargo Bank, N.A., as administrative agent, issuing lender, swing line lender and co-leadarranger, Fortis Bank SA/NV, New York Branch, as co-lead arranger, and each of the otherparties listed therein (Form 8-K dated March 3, 2008 (File No. 1-8182, Exhibit 10.1)).
10.12* Waiver Agreement, dated as of June 9, 2008, among Pioneer Drilling Company, the guarantorsparty thereto, Wells Fargo Bank, N.A., as administrative agent, issuing lender and swing linelender, and each of the other financial institutions party thereto (Form 8-K dated June 11, 2008(File No. 1-8182, Exhibit 10.1)).
10.13+* Employment Letter, effective March 1, 2008, from Pioneer Drilling Company to Joseph B.Eustace (Form 8-K dated March 5, 2008 (File No. 1-8182, Exhibit 10.1)).
10.14+* Confidentiality and Non-Competition Agreement, dated February 29, 2008, by and betweenPioneer Drilling Company, Pioneer Production Services, Inc. and Joe Eustace (Form 8-K datedMarch 5, 2008 (File No. 1-8182, Exhibit 10.2)).
10.15+* Agreement between Joyce M. Schuldt and Pioneer Drilling Company, dated August 20, 2008(Form 8-K dated August 21, 2008 (File No. 1-8182, Exhibit 10.1)).
10.16* Pioneer Drilling Company 2007 Incentive Plan Form of Stock Option Agreement (Form 8-Kdated September 4, 2008 (File No. 1-8182, Exhibit 10.1)).
10.17* Pioneer Drilling Company 2007 Incentive Plan Form of Employee Restricted Stock AwardAgreement (Form 8-K dated September 4, 2008 (File No. 1-8182, Exhibit 10.2)).
10.18* Pioneer Drilling Company 2007 Incentive Plan Form of Non-Employee Director Restricted StockAward Agreement (Form 8-K dated September 4, 2008 (File No. 1-8182, Exhibit 10.3)).
10.19+* Employment Letter Agreement, effective January 7, 2009, from Pioneer Drilling Company toLorne E. Phillips (Form 8-K dated January 14, 2009 (File No. 1-8182, Exhibit 10.1)).
21.1 - Subsidiaries of Pioneer Drilling Company.
23.1 - Consent of Independent Registered Public Accounting Firm.
31.1 - Certification by Wm. Stacy Locke, President and Chief Executive Officer, pursuant toRule 13a-14(a) or Rule 15d-14(a) under the Securities Exchange Act of 1934.
31.2 - Certification by Lorne E. Phillips, Executive Vice President and Chief Financial Officer, pursuantto Rule 13a-14(a) or Rule 15d-14(a) under the Securities Exchange Act of 1934.
32.1 - Certification by Wm. Stacy Locke, President and Chief Executive Officer, pursuant to Section906 of the Sarbanes-Oxley Act of 2002 (Subsections (a) and (b) of Section 1350, Chapter 63 ofTitle 18, United States Code).
32.2 - Certification by Lorne E. Phillips, Executive Vice President and Chief Financial Officer, pursuantto Section 906 of the Sarbanes-Oxley Act of 2002 (Subsections (a) and (b) of Section 1350,Chapter 63 of Title 18, United States Code).
* Incorporated by reference to the filing indicated.
+ Management contract or compensatory plan or arrangement.
91

SIGNATURES
Pursuant to the requirements of Section 13 or 15(d) of the Securities Exchange Act of 1934, the registranthas duly caused this report to be signed on its behalf by the undersigned, thereunto duly authorized.
PIONEER DRILLING COMPANY
February 25, 2009 By: /s/ WM. STACY LOCKE
Wm. Stacy LockeChief Executive Officer and President
Pursuant to the requirements of the Securities Exchange Act of 1934, this report has been signed below bythe following persons on behalf of the registrant and in the capacities and on the dates indicated.
Signature Title Date
/s/ DEAN A. BURKHARDT Chairman February 25, 2009Dean A. Burkhardt
/s/ WM. STACY LOCKE President, Chief Executive Officer andDirector (Principal Executive Officer)
February 25, 2009Wm. Stacy Locke
/s/ LORNE E. PHILLIPS Executive Vice President and ChiefFinancial Officer February 25, 2009Lorne E. Phillips
/s/ C. JOHN THOMPSON Director February 25, 2009C. John Thompson
/s/ JOHN MICHAEL RAUH Director February 25, 2009John Michael Rauh
/s/ SCOTT D. URBAN Director February 25, 2009Scott D. Urban
92
MONTANA
UTAHKANSAS
OKLAHOMA
LOUISANA
COLOMBIA
TEXAS
COLORADO
NORTHDAKOTA
Areas of Operations
Drilling Services Division Offices:Corpus Christi, TexasHenderson, TexasParadise, TexasWoodward, Oklahoma
Corporate Office – San Antonio, Texas
Vernal, UtahWilliston, North DakotaBogotá, Colombia
Well Servicing> 74 newly built well-service
rigs in service> Average age 1.5 years
Wireline> 61 wireline trucks> Average age 3 years
Fishing and Rental Services> Fishing and rental services
and equipment
Year Ended Nine Months Ended(In thousands, except per share data) December 31, 2008(2) December 31, 2007(1) 2007 2006 2005
Revenues $610,884 $313,884 $416,178 $284,148 $185,246
Income (loss) before income taxes (56,688) 57,774 130,789 79,813 17,161
Net earnings (loss) (62,745) 39,645 84,180 50,567 10,812
Earnings (loss) per common share - diluted (1.26) 0.79 1.68 1.06 0.30
Total assets 824,479 560,212 501,495 400,678 276,009
Long-term debt and capital lease obligations, less current portion 262,115 — — — 13,445
Shareholders’ equity 414,118 471,072 428,109 340,676 221,615
Net cash provided by operating activities 186,391 115,455 131,530 97,084 33,665
(1) Effective December 31, 2007, Pioneer Drilling Company changed its fiscal year end from March 31 to December 31, resulting in a nine month reporting period from April 1, 2007 to December 31, 2007. (2) Includes goodwill and intangible asset impairment charges of $171.493 ($136,607 net of tax).
Selected Financial Data Years Ended March 31,
Production Services Division Offices:
DirectorsDean A. BurkhardtChairman of the Board Pioneer Drilling Company, Rancher, Investor and Consultant
Wm. Stacy LockePresident and Chief Executive OfficerPioneer Drilling Company
John Michael RauhRetired, Former Vice President and Corporate Controller Kerr-McGee Corporation
C. John ThompsonChairman and Chief Executive OfficerVentana Capital Advisors, Inc.
Scott D. UrbanPartner in Edgewater Energy Partners
OfficersWm. Stacy LockePresident and Chief Executive Officer
Lorne E. PhillipsExecutive Vice President and Chief Financial Officer
F.C. “Red” West Executive Vice President and President of Drilling Services Division
Joseph B. Eustace Executive Vice President and President of Production Services Division
Carlos R. PeñaVice President, General Counsel, Corporate Secretary, and Compliance Officer
Corporate InformationCorporate HeadquartersPioneer Drilling Company1250 N.E. Loop 410, Suite 1000San Antonio, Texas 78209210.828.7689Fax 210.828.8228
Stock ListingThe American Stock Exchange: PDC (NYSE Alternext US)
AuditorsKPMG LLP300 Convent, Suite 1200 San Antonio, Texas 78205
Shareholder ContactLorne E. PhillipsExecutive Vice President andChief Financial Officer210.828.7689Fax [email protected]
Investor RelationsKenneth S. DennardDennard Rupp Gray & Easterly, LLC713.529.6600Fax 713.529.9989
Certain information in this Annual Report, and other statements that express a belief, expectation or intention, as well as those that are not statements of historical fact, are forward-looking statements. Forward-looking statements are generally accompanied by words such as “estimate,” “project,” “predict,” “believe,” “expect,” “anticipate,” “plan,” “intend,” “seek,” “will,” “should,” “goal” or other words and phrases of similar import that convey the uncertainty of future events or outcomes. We disclaim any obligation to update any of these forward-looking statements, and we caution you not to rely on them unduly. We have based these forward-looking statements on our current expectations and assumptions about future events. While our management considers these expectations and assumptions to be reasonable, they are inherently subject to significant business, economic, competitive, regulatory and other risks, contingencies and uncertainties, most of which are difficult to predict and many of which are beyond our control. These risks, contingencies and uncertainties include, among other matters, the risks set forth in Item 1A—“Risk Factors” of our Form 10-K for the year ended December 31, 2008. These risks, contingencies and uncertainties could cause our actual results to differ materially from those expressed in a forward-looking statement contained in this Annual Report. Unpredictable or unknown factors we have not discussed in this Annual Report or elsewhere could also have material adverse effects on actual results of matters that are the subject of our forward-looking statements. We advise our shareholders to (1) be aware that important factors not referred to above could affect the accuracy of our forward-looking statements and (2) use caution and common sense when considering our forward-looking statements.
24148rrdD1R1.indd 2 4/1/09 4:29 PM

PIONEER DRILLING COMPANY2008 Annua l Repor t1250 N.E. Loop 410
Suite 1000San Antonio, Texas 78209www.pioneerdrlg.com
PIO
NE
ER
DR
ILLING
CO
MP
AN
Y 20
08 A
NN
UA
L RE
PO
RT
24148rrdD1R1.indd 1 4/1/09 4:29 PM


