
at SciVerse ScienceDirect
Renewable Energy 44 (2012) 463e468
Contents lists available
Renewable Energy
journal homepage: www.elsevier .com/locate/renene
Technical note
Pilot-scale anaerobic co-digestion of municipal biomass waste: Focusing on biogasproduction and GHG reduction
Xiao Liu a,*, Xingbao Gao a,b, Wei Wang a, Lei Zheng a, Yingjun Zhou c, Yifei Sun d
a School of Environment, Tsinghua University, Beijing 100084, ChinabChinese Research Academy of Environmental Sciences, Beijing 100012, ChinacDepartment of Urban and Environmental Engineering, Graduate School of Engineering, Kyoto University, Katsura, Nisikyo-ku, Kyoto 615-8540, Japand School of Chemistry and Environment, Beihang University, Beijing 100191, China
a r t i c l e i n f o
Article history:Received 12 April 2011Accepted 24 January 2012Available online 16 February 2012
Keywords:Municipal biomass wasteAnaerobic co-digestionBiogas productionGHG reduction
* Corresponding author. Tel.: þ86 1062772814; faxE-mail addresses: [email protected], liux
(X. Liu).
0960-1481/$ e see front matter � 2012 Elsevier Ltd.doi:10.1016/j.renene.2012.01.092
a b s t r a c t
A pilot-scale anaerobic co-digestion research study is presented to elucidate the feasibility of developinganaerobic digestion (AD) as an effective disposal method for municipal biomass waste (MBW) in China,focusing on biogas production and greenhouse gas (GHG) reduction. Food waste, fruitevegetable waste,and dewatered sewage sludge were co-digested in a continuous stirred-tank reactor for biogasproduction. Stable operation was achieved with a high biogas production rate of 4.25 m3 (m3 d)�1 atorganic loading rate of 6.0 kgVS (m3 d)�1 and hydraulic retention time of 20 d. A total of 16.5% of lipidscontent was beneficial to the biogas production of the feedstock without inhibition to anaerobicdigestion. Compared with the landfill baseline, GHG reduction is an important environmental benefitfrom MBW digestion. Therefore, anaerobic co-digestion is a promising alternative solution for MBWbecause it contributes significantly to the sound management of municipal solid waste in China.
� 2012 Elsevier Ltd. All rights reserved.
1. Introduction
With the rapid economic development and urbanization ofChina, almost all of its megacities are faced with the problem ofmunicipal solid waste (MSW) disposal. In 2009, a total of 157.4million tons of MSW was collected and transported nationwide. Ofthese, 89.0, 20.2, and 1.8 million tons were treated by landfill,incineration, and composting, respectively [1]. With increasingquantity, 50e60% of the MSW was biomass waste characterized byhigh water and biodegradable organic content. The municipalbiomass waste (MBW) has led to serious adverse effects in tradi-tional MSW treatment systems (i.e. landfill and incineration). Thehigh water content may cause abundant production of leachate forlandfill, and may cause unstable burning conditions and dioxinrelease from incineration. Also the high biodegradable organiccontent may cause the production and emission of greenhouse gas(GHG). From 2005 to 2010, the wastewater treatment capacity inChina has increased from 60 million tons to 125 million tons whichhas resulted in the rapid increase of sewage sludge and the disposalof sewage sludge has also been a big problem in almost all the cities
: þ86 [email protected]
All rights reserved.
in China. In some cities, the sewage sludge is simply deposited ontothe wasteland without any treatment, which has caused seriouspollution. Efficient MBW management technology is increasinglyrequired due to environmental and economical concerns, such asclimate change, eutrophication, and the diminishing resources offossil energy and raw materials.
Anaerobic digestion (AD) is considered as a sustainable optionfor the management of biomass wastes because the production ofrenewable energy and the recycling of nutrients [2]. Additionally,MBW separated from MSW and treated with AD can significantlyreduce the load of traditional disposal facilities, and subsequentlyprolong their service life. It also decreases the secondary pollutantsoriginated from the biodegradation of organic wastes duringlandfill, incineration and composting. AD has been employed inWestern Europe since the 1980s, while up to 2010 one-hundredand ninety-five facilities have been constructed with a total annualcapacity of 5.9 million tons [3]. De Baere concluded that AD facili-ties have captured themajor market of waste treatment in the EU inthe last decade, and will certainly continue developing in thefuture. AD is expected to become global utilised because of itsenvironmental contribution, and energy benefits [4e6]. Co-digestion of different types of MBW has been discussed in manyreferences due to its potential of increasing biogas output andimproving stability of anaerobic system [4,7e10]. Co-digestion alsomeans more feedstock supply, which is especially needed by large-

Table 1Characterization of raw materials.
FW FVW DSS Mixture (2:1:1)
Water content/% 83.4 93.8 84.5 88.7Total solid/g L�1 166.3� 26.7 62.2� 16.0 154.9� 18.1 142.1� 9.3Volatile solid/g L�1 149.0� 24.3 50.8� 11.2 101.9� 10.8 117.3� 7.8Suspended solid/g L�1 72.8� 14.3 35.7� 14.2 151.7� 21.4 91.7� 15.0Volatile suspended
solid/g L�168.8� 12.0 29.6� 11.2 98.5� 12.8 74.0� 12.2
VS/TS/% 89.6 81.6 65.8 82.5VSS/VS/% 46.2 58.3 96.6 63.1Lipids/%TS 21.8 2.9 10.3 16.5Protein/%TS 16.8 13.2 34.3 20.8Crude fiber/%TS 5.6 15.3 7.1 6.4C/% 48.2 42.0 37.2 45.4H/% 7.3 6.1 5.5 6.6N/% 2.8 2.4 5.9 3.5C/N 17.4 17.4 6.3 12.9
X. Liu et al. / Renewable Energy 44 (2012) 463e468464
scale plants where large quantities of MBW are required. Mata-Alvarez et al. summarized several cases of co-digestion of MBW,in both research and practical use [11].
Given that traditional technologies may cause severe environ-mental pollution for treating MBW, alternative environment-friendly treatment technologies of MBW are much needed inChina. Meanwhile, renewable energy recovered from the biomasswaste has become a global concern, and bioenergy has been listedin the Chinese New Energy Promotion Plan [12]. The AD of MBWcan reduce the GHG emission in two respects: reduction ascompared with the baseline management, and reduction throughproviding alternative resources in terms of non-renewable fossilenergy andmaterials. In 2009, 79% of treatedMSWwas contributedby the landfill, and landfill is considered as one of the main GHGemission sources in current China [1]. The development of AD canrestructure the traditional MBW treatment and disposal system inChina, and in turn achieve the reduction of GHG emissions. Alongwith other advantages mentioned earlier, AD has attracted muchattention of both government and enterprises in recent years, and itcan be expected that AD will be widely used in the near future inChina.
At present, the support policy from the central government hasmade every megacity receptive to building large-scale AD facilitiesin China. However, due to the differences of geographic locality anddietary habit, MBWs especially food waste in China has the typicalcharacteristics of high water content (>85%) and high lipidscontent (>20% of dry basis) which is different from other countries,and few reports have discussed the AD of Chinese MBWs. There-fore, whether the Chinese MBWs fit for AD, and what is the suitableoperation condition, these questions need to be answered beforethe construction and operation of the large-scale AD projects inChina. Thus, a systematic research of AD of Chinese MBWs isurgently needed to provide fundamental technology parametersand promote the commercialization of AD technology. Finally, asthe second biggest producer of carbon dioxide, China is facing greatpressure in reducing GHG emissions, so the specific GHG reductionwhich can be achieved during AD ofMBW is gaining interesting andneeds to be quantified. In this study, a pilot-scale anaerobic co-digestion research is presented to elucidate the feasibility ofdeveloping AD in China as an effective disposal method for MBW,focusing on the system performance and biogas production, andthen GHG reduction of AD was analyzed compared with landfill.
2. Methods
2.1. Raw materials
MBWused in this experiment comprised food waste (FW), fruit-vegetable waste (FVW), and dewatered sewage sludge (DSS). FWwas collected from a student canteen (capacity, over 1000 studentsfor a seated dinner) at Tsinghua University, FVW from a wholesalemarket, and DSS from a municipal wastewater treatment plant(WWTP) in Beijing (Qinghe WWTP; Northern Beijing; capacity,400,000 m3 d�1). The inert materials in FW and FVW were manu-ally separated (e.g., plastic, bone, wood, and others). FW and FVWwere crushed to less than 3 mm size firstly by a food wastepulverizer, and thenmixed with DSS at the ratio of 2:1:1. Themixedfeedstock was kept at 4 �C before use. During the experiment,a maximum of 80 kg d�1 mixture was fed to the AD reactor.
The characterization of raw materials is shown in Table 1 interms of solid content, organic composition, and elementalcomposition. Volatile solid (VS), standing for organic content,accounts for 65e90% of the total solid (TS). VS can be divided intovolatile dissolved solid (VDS) and volatile suspended solid (VSS).VSS/VS, representing the organic solid ratio in organic fraction,
accounts for 46.2%, 58.3% and 96.6% for FW, FVW, and DSS,respectively, indicating that organic solid plays an important role inthe AD process, which has been proven to be the essential rate-limiting factor [13,14]. The organic compositions of the three rawmaterials differ significantly. For FW, the lipids content is thehighest because of the Chinese traditional cooking style, whereasfor FVW, the crude fiber is most abundant because of the cellulosecontent in fruits and vegetables. For DSS, the protein content is thehighest compared with KW and VFR because of the high content ofmicroorganisms. The C/N ratio of FW and FVW is suitable for AD;however, the C/N ratio of DSS is too low for AD. In the traditional ADof sewage sludge, slow degradation (>20 days), loworganic loadingrate, and the relatively low VS removal (30e40%) are often thedisadvantages of the process because the digesters are operatedwith too low C/N ratios. Hence, in this study, DSS was co-digestedwith FW and FVW of higher C/N ratios to cover the adverseeffects caused by its low C/N ratio.
2.2. Pilot-scale reactor start-up and operation
Continuous stirred-tank reactor (CSTR) was used in the research.The reactor had a volume of 2 m3 (effective volume, 1.6 m3; height,2.7 m; and diameter, 1.0 m). The feedstock of the reactor wasa mixture of 50% of FW, 25% of FVW and 25% of DSS in thepercentage of weight.
Inoculums (digested sewage sludge) were collected fromanother municipal wastewater treatment plant (XiaohongmenWWTP, located in southern Beijing), where the excess sewagesludge was treated by AD. A 1.6 m3 volume of digested sludge wascollected and pumped into the reactor. The TS, SS, VS, and VSScontents of the inoculums were 27.0, 25.0, 10.4, and 9.7 g L�1,respectively.
The reactor was operated under mesophilic condition at35� 2 �C by a water jacket. The reactors were constantly mixedusing mechanical stirrers (100 rpm) with an agitation time of 15min per two hours, and were fed once a day using a screw pump.
2.3. Analytical techniques
The analysis of TS, VS, SS and VSS were based on the StandardAnalytic Methods promulgated by the National EnvironmentalProtection Agency of China (1989). The measurement of crude fiberand protein were according to ISO 6865:2000 and ISO1871:2009,respectively. Lipids content was determined using soxhlet extrac-tion method according to ISO 6492:1999. The samples were filteredthrough 0.45 mm filters before the measurement of volatile fattyacids (VFAs) using gas chromatography (SHIMADZU GC-2010) with

X. Liu et al. / Renewable Energy 44 (2012) 463e468 465
a flame ionization detector and GDX-102 column (inlet, 200 �C;oven, 170 �C; and detector, 220 �C). The various VFAs includedacetic, propionic, iso-butyric, butyric, iso-valeric, and valeric acids.The biogas volume was measured with a wet-test gas flow meter,and the composition of the biogas was monitored by gas chroma-tography (SHIMADZU GC-2010) with a thermal conductivitydetector and RT-Qplot column (column, 30 m� 0.53 mm; flameionization detector, 200 �C; oven, 50 �C; inlet, 200 �C; carrier gas,hydrogen 10 mlmin�1; split ratio, 35:1, and injection volume,100 ml). The C, H, and N were analyzed by an elemental analyzer(EAI CE-440).
Fig. 1. Chronological plot of biogas production and pH values in CSTR system.
2.4. Calculation of the GHG reduction
The GHG emission of MBW treatment was evaluated using theanalytical method of carbon footprint following the Guideline toPAS 2050 [15]. In this study, the carbon footprint of three scenarioswas assessed which were baseline scenario (scenario 1), AD withpower generation (scenario 2), and AD with bio natural gas (BNG)recovery (scenario 3).
In China more than 70% of treated MSW was disposed bylandfill, therefore, the baseline scenario was set as MBW landfill.The collection rate of landfill gas (LFG) is generally less than 60% inthe developed countries, whereas to achieve a 20% gas recovery inChina appears to be difficult [16]. In this study, an average LFGcollection rate of 50% was set as the ideal condition resulting fromthe strict standards and laws concerning with the national energysaving and emission reduction strategy. Analyses of currentlyoperating LFG-to-electricity projects in China show that powergenerated through LFG recovery and utilization is approximately30 kWh per ton of waste. There is an evident difference comparedwith the 250e300 kWh per ton of waste via incineration so, theenergy recovered from LFG is fairly limited. However, at present,power generation is a widely used method to obtain energy andreduce global warming potential of methane. Hence, LFG iscaptured to generate power in the baseline scenario.
The methane potential for MBW in a landfill site was calculatedfollowing the 2006 IPCC Guidelines for National Greenhouse GasInventories [17], which suggested 0.5 as the fraction of thedegradable organic carbon (DOCf) that can decompose underanaerobic condition of wet bulkwaste. According to Olivier et al., anaverage DOCf about 40.9% (181 and 107 Nl kgVS�1 for initial andaged waste, respectively) was observed in the BMP tests performedafter 2-year anaerobic incubation of MSW under conditions ofconfinement and leachate percolation that replicate those found inreal-scale bioreactor landfills [18]. As the total dry organic matterdecreased simultaneously during the 2-year anaerobic incubation,the DOCf should be higher than 40.9% if the calculation was basedon the same original organic matter. Therefore, 0.5 was used asDOCf to evaluate the methane potential from landfill sites in thisstudy. Decomposable degradable organic carbon (DDOC) can becalculated from the results of anaerobic digestion as 0.0376 for themixed feedstock. Hence, the averagemethane production in landfillfor the raw materials was calculated as 19.3 m3 t�1 according tofollowing equation.
DDOCm ¼ DDOC� DOCfCm � 22:412
¼ 0:0376� 0:5� 0:55� 22:412� 103
¼ 19:3 m3 t�1
where DDOCm is the methane production of DDOC, m3 t�1; Cm,methane concentration of biogas, using the default value of 55%.
Power generation and BNG recovery are considered as availablealternative technologies for the utilization of biogas from MBW
digestion, according to the mature technologies and productmarkets. From the experimental results, the methane production ofthe digested MBW was 46.6 m3 t�1. For BNG recovery, a pressureswing adsorption system was considered. The power consumptionfor the purification of biogas is a significant GHG source. Thecapacity of an AD facility is set at 500 t d�1 as a case study; thus, themethane production is 21,000 m3 d�1 (875 m3 h�1); this amountwas used to evaluate the power consumption. The default GHGemission factors for power generation are based on a governmentreport concerning low-carbon technologies with fossil fuel, whichwas released by the Department of Climate Change, NationalReform and Development Commission (NDRC) of China in 2009[19]. The GHG emission associated with power consumption forlandfill and AD operations varies with the technological and oper-ational conditions, and has a large uncertainty, so the ideal condi-tion of no GHG emission of power consumption was sat in thisstudy. Hence, the boundary of this evaluation included the directemission to atmosphere and utilization process of biogas or LFG.
3. Results and discussion
3.1. Reactor performance
The reactor was started at 15 Aug. 2009, and had been operatedfor more than 400 days with 4 different organic loading rates (OLR).Fig. 1 shows a time evolution of operational conditions of the CSTRin terms of daily biogas production, pH value, and OLRs. The reactorwas started with OLR of 2.4 kgVS (m3 d)�1 and hydraulic retentiontime (HRT) of 50 days (Phase I). Then, the OLR was increasedgradually to 3.6 (Phase II), 4.8 (Phase III), and 6.0 kgVS (m3 d)�1
(Phase IV) while HRT was decreased accordingly to 33, 25 and 20days, respectively. Finally, the reactor was operated stably at OLR of6.0 kgVS (m3 d)�1 formore than 200 days. During the operation, theVS removal rate kept stable at around 65%. The pH value was7.2e7.6, which is within the appropriate range for mesophilicdigestion.
Table 2 summarizes the operational conditions of the CSTRreactor. As can be seen that the pH value remains nearly constant,while the VFA concentrations increased slightly from 195 mg L�1 to500 mg L�1with the increase of OLR from 2.4 to 6.0 kgVS (m3 d)�1.Total alkalinities of the system were detected to be between 11.9and 13.0 gCaCO3 L�1, which has provided a high buffering capacityfor the system. Analyses of pH values, VFA, biogas yield andmethane yield showed that the OLR increasing procedure did notcause significant adverse effect on AD process. The VFA/alkalinity
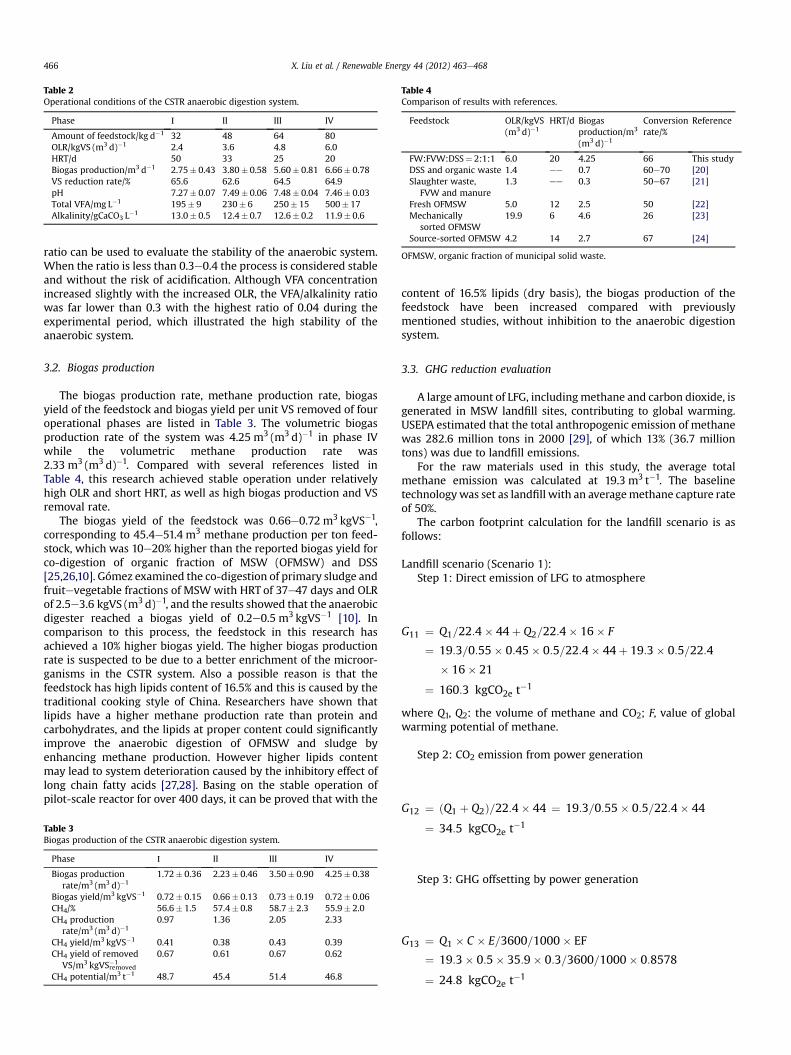
Table 2Operational conditions of the CSTR anaerobic digestion system.
Phase _ II III IV
Amount of feedstock/kg d�1 32 48 64 80OLR/kgVS (m3 d)�1 2.4 3.6 4.8 6.0HRT/d 50 33 25 20Biogas production/m3 d�1 2.75� 0.43 3.80� 0.58 5.60� 0.81 6.66� 0.78VS reduction rate/% 65.6 62.6 64.5 64.9pH 7.27� 0.07 7.49� 0.06 7.48� 0.04 7.46� 0.03Total VFA/mg L�1 195� 9 230� 6 250� 15 500� 17Alkalinity/gCaCO3 L�1 13.0� 0.5 12.4� 0.7 12.6� 0.2 11.9� 0.6
Table 4Comparison of results with references.
Feedstock OLR/kgVS(m3 d)�1
HRT/d Biogasproduction/m3
(m3 d)�1
Conversionrate/%
Reference
FW:FVW:DSS¼ 2:1:1 6.0 20 4.25 66 This studyDSS and organic waste 1.4 ee 0.7 60e70 [20]Slaughter waste,
FVW and manure1.3 ee 0.3 50e67 [21]
Fresh OFMSW 5.0 12 2.5 50 [22]Mechanically
sorted OFMSW19.9 6 4.6 26 [23]
Source-sorted OFMSW 4.2 14 2.7 67 [24]
OFMSW, organic fraction of municipal solid waste.
X. Liu et al. / Renewable Energy 44 (2012) 463e468466
ratio can be used to evaluate the stability of the anaerobic system.When the ratio is less than 0.3e0.4 the process is considered stableand without the risk of acidification. Although VFA concentrationincreased slightly with the increased OLR, the VFA/alkalinity ratiowas far lower than 0.3 with the highest ratio of 0.04 during theexperimental period, which illustrated the high stability of theanaerobic system.
3.2. Biogas production
The biogas production rate, methane production rate, biogasyield of the feedstock and biogas yield per unit VS removed of fouroperational phases are listed in Table 3. The volumetric biogasproduction rate of the system was 4.25 m3 (m3 d)�1 in phase IVwhile the volumetric methane production rate was2.33 m3 (m3 d)�1. Compared with several references listed inTable 4, this research achieved stable operation under relativelyhigh OLR and short HRT, as well as high biogas production and VSremoval rate.
The biogas yield of the feedstock was 0.66e0.72 m3 kgVS�1,corresponding to 45.4e51.4 m3 methane production per ton feed-stock, which was 10e20% higher than the reported biogas yield forco-digestion of organic fraction of MSW (OFMSW) and DSS[25,26,10]. Gómez examined the co-digestion of primary sludge andfruitevegetable fractions of MSW with HRT of 37e47 days and OLRof 2.5e3.6 kgVS (m3 d)�1, and the results showed that the anaerobicdigester reached a biogas yield of 0.2e0.5 m3 kgVS�1 [10]. Incomparison to this process, the feedstock in this research hasachieved a 10% higher biogas yield. The higher biogas productionrate is suspected to be due to a better enrichment of the microor-ganisms in the CSTR system. Also a possible reason is that thefeedstock has high lipids content of 16.5% and this is caused by thetraditional cooking style of China. Researchers have shown thatlipids have a higher methane production rate than protein andcarbohydrates, and the lipids at proper content could significantlyimprove the anaerobic digestion of OFMSW and sludge byenhancing methane production. However higher lipids contentmay lead to system deterioration caused by the inhibitory effect oflong chain fatty acids [27,28]. Basing on the stable operation ofpilot-scale reactor for over 400 days, it can be proved that with the
Table 3Biogas production of the CSTR anaerobic digestion system.
Phase _ II III IV
Biogas productionrate/m3 (m3 d)�1
1.72� 0.36 2.23� 0.46 3.50� 0.90 4.25� 0.38
Biogas yield/m3 kgVS�1 0.72� 0.15 0.66� 0.13 0.73� 0.19 0.72� 0.06CH4/% 56.6� 1.5 57.4� 0.8 58.7� 2.3 55.9� 2.0CH4 production
rate/m3 (m3 d)�10.97 1.36 2.05 2.33
CH4 yield/m3 kgVS�1 0.41 0.38 0.43 0.39CH4 yield of removed
VS/m3 kgVSremoved�1
0.67 0.61 0.67 0.62
CH4 potential/m3 t�1 48.7 45.4 51.4 46.8
content of 16.5% lipids (dry basis), the biogas production of thefeedstock have been increased compared with previouslymentioned studies, without inhibition to the anaerobic digestionsystem.
3.3. GHG reduction evaluation
A large amount of LFG, includingmethane and carbon dioxide, isgenerated in MSW landfill sites, contributing to global warming.USEPA estimated that the total anthropogenic emission of methanewas 282.6 million tons in 2000 [29], of which 13% (36.7 milliontons) was due to landfill emissions.
For the raw materials used in this study, the average totalmethane emission was calculated at 19.3 m3 t�1. The baselinetechnologywas set as landfill with an averagemethane capture rateof 50%.
The carbon footprint calculation for the landfill scenario is asfollows:
Landfill scenario (Scenario 1):Step 1: Direct emission of LFG to atmosphere
G11 ¼ Q1=22:4� 44þ Q2=22:4� 16� F
¼ 19:3=0:55� 0:45� 0:5=22:4� 44þ 19:3� 0:5=22:4
� 16� 21
¼ 160:3 kgCO2e t�1
where Q1, Q2: the volume of methane and CO2; F, value of globalwarming potential of methane.
Step 2: CO2 emission from power generation
G12 ¼ ðQ1 þ Q2Þ=22:4� 44 ¼ 19:3=0:55� 0:5=22:4� 44
¼ 34:5 kgCO2e t�1
Step 3: GHG offsetting by power generation
G13 ¼ Q1 � C � E=3600=1000� EF
¼ 19:3� 0:5� 35:9� 0:3=3600=1000� 0:8578
¼ 24:8 kgCO2e t�1
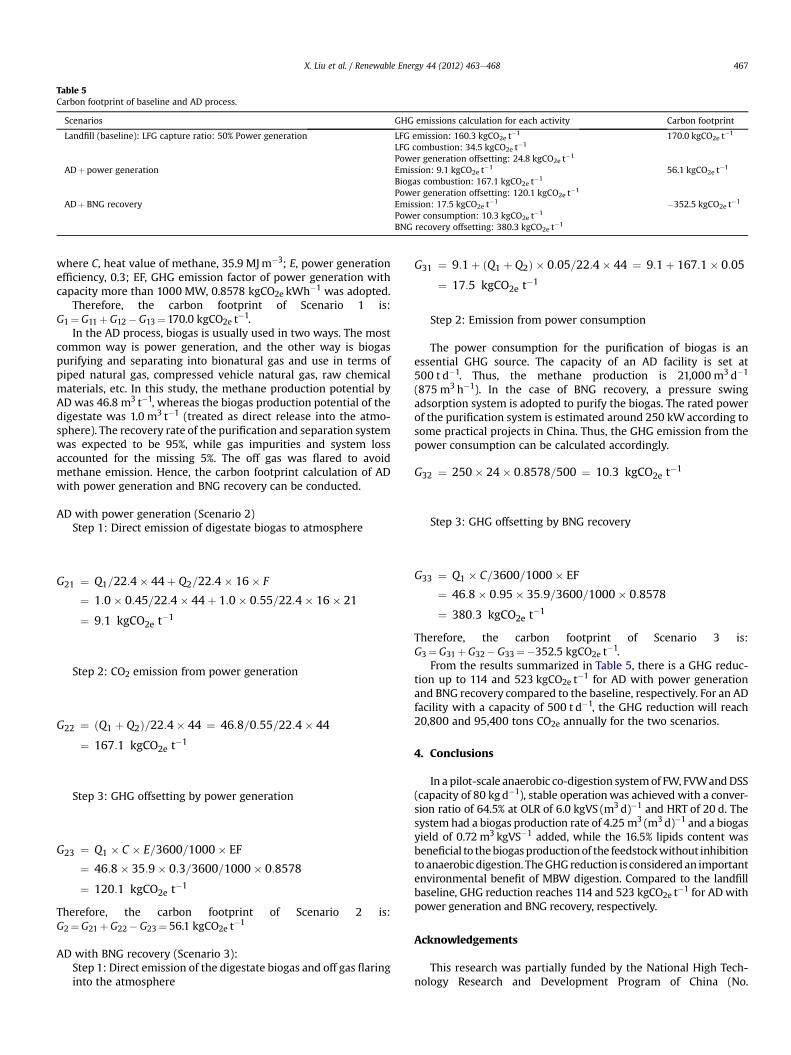
Table 5Carbon footprint of baseline and AD process.
Scenarios GHG emissions calculation for each activity Carbon footprint
Landfill (baseline): LFG capture ratio: 50% Power generation LFG emission: 160.3 kgCO2e t�1 170.0 kgCO2e t�1
LFG combustion: 34.5 kgCO2e t�1
Power generation offsetting: 24.8 kgCO2e t�1
ADþ power generation Emission: 9.1 kgCO2e t�1 56.1 kgCO2e t�1
Biogas combustion: 167.1 kgCO2e t�1
Power generation offsetting: 120.1 kgCO2e t�1
ADþ BNG recovery Emission: 17.5 kgCO2e t�1 �352.5 kgCO2e t�1
Power consumption: 10.3 kgCO2e t�1
BNG recovery offsetting: 380.3 kgCO2e t�1
X. Liu et al. / Renewable Energy 44 (2012) 463e468 467
where C, heat value of methane, 35.9 MJm�3; E, power generationefficiency, 0.3; EF, GHG emission factor of power generation withcapacity more than 1000 MW, 0.8578 kgCO2e kWh�1 was adopted.
Therefore, the carbon footprint of Scenario 1 is:G1¼G11þG12�G13¼170.0 kgCO2e t�1.
In the AD process, biogas is usually used in two ways. The mostcommon way is power generation, and the other way is biogaspurifying and separating into bionatural gas and use in terms ofpiped natural gas, compressed vehicle natural gas, raw chemicalmaterials, etc. In this study, the methane production potential byAD was 46.8 m3 t�1, whereas the biogas production potential of thedigestate was 1.0 m3 t�1 (treated as direct release into the atmo-sphere). The recovery rate of the purification and separation systemwas expected to be 95%, while gas impurities and system lossaccounted for the missing 5%. The off gas was flared to avoidmethane emission. Hence, the carbon footprint calculation of ADwith power generation and BNG recovery can be conducted.
AD with power generation (Scenario 2)Step 1: Direct emission of digestate biogas to atmosphere
G21 ¼ Q1=22:4� 44þ Q2=22:4� 16� F
¼ 1:0� 0:45=22:4� 44þ 1:0� 0:55=22:4� 16� 21
¼ 9:1 kgCO2e t�1
Step 2: CO2 emission from power generation
G22 ¼ ðQ1 þ Q2Þ=22:4� 44 ¼ 46:8=0:55=22:4� 44
¼ 167:1 kgCO2e t�1
Step 3: GHG offsetting by power generation
G23 ¼ Q1 � C � E=3600=1000� EF
¼ 46:8� 35:9� 0:3=3600=1000� 0:8578
¼ 120:1 kgCO2e t�1
Therefore, the carbon footprint of Scenario 2 is:G2¼G21þG22�G23¼ 56.1 kgCO2e t�1
AD with BNG recovery (Scenario 3):Step 1: Direct emission of the digestate biogas and off gas flaringinto the atmosphere
G31 ¼ 9:1þ ðQ1 þ Q2Þ � 0:05=22:4� 44 ¼ 9:1þ 167:1� 0:05
¼ 17:5 kgCO t�1
2eStep 2: Emission from power consumption
The power consumption for the purification of biogas is anessential GHG source. The capacity of an AD facility is set at500 t d�1. Thus, the methane production is 21,000 m3 d�1
(875 m3 h�1). In the case of BNG recovery, a pressure swingadsorption system is adopted to purify the biogas. The rated powerof the purification system is estimated around 250 kWaccording tosome practical projects in China. Thus, the GHG emission from thepower consumption can be calculated accordingly.
G32 ¼ 250� 24� 0:8578=500 ¼ 10:3 kgCO2e t�1
Step 3: GHG offsetting by BNG recovery
G33 ¼ Q1 � C=3600=1000� EF
¼ 46:8� 0:95� 35:9=3600=1000� 0:8578
¼ 380:3 kgCO2e t�1
Therefore, the carbon footprint of Scenario 3 is:G3¼G31þG32�G33¼�352.5 kgCO2e t�1.
From the results summarized in Table 5, there is a GHG reduc-tion up to 114 and 523 kgCO2e t�1 for AD with power generationand BNG recovery compared to the baseline, respectively. For an ADfacility with a capacity of 500 t d�1, the GHG reduction will reach20,800 and 95,400 tons CO2e annually for the two scenarios.
4. Conclusions
In a pilot-scale anaerobic co-digestion systemof FW, FVWandDSS(capacity of 80 kgd�1), stable operationwas achieved with a conver-sion ratio of 64.5% at OLR of 6.0 kgVS (m3 d)�1 and HRT of 20 d. Thesystem had a biogas production rate of 4.25 m3 (m3 d)�1 and a biogasyield of 0.72 m3 kgVS�1 added, while the 16.5% lipids content wasbeneficial to thebiogasproductionof the feedstockwithout inhibitionto anaerobic digestion. TheGHG reduction is consideredan importantenvironmental benefit of MBW digestion. Compared to the landfillbaseline, GHG reduction reaches 114 and 523 kgCO2e t�1 for AD withpower generation and BNG recovery, respectively.
Acknowledgements
This research was partially funded by the National High Tech-nology Research and Development Program of China (No.
X. Liu et al. / Renewable Energy 44 (2012) 463e468468
2008AA062401), Ministry of Science and Technology of China(2010DFA22770) and by China Postdoctoral Science Foundationfunded project (201003105).
References
[1] National Bureau of Statistics of China. China statistical yearbook. Availablefrom: http://www.stats.gov.cn/tjsj/ndsj/2010/indexch.htm; 2010.
[2] Luste S, Luostarinen S. Anaerobic co-digestion of meat-processing by-productsand sewage sludge e effect of hygienization and organic loading rate. Bio-resour Technol 2010;101:2657e64.
[3] Mattheeuws B. Anaerobic digestion state of the art 2010. NV: Organic WasteSystems. Available from: http://www.amb.cat/c/document_library/get_file?p_l_id¼5694&folderId¼264924&name¼DLFE-7047.pdf; 2010.
[4] Edelmann W, Schleiss K, Joss A. Ecological, energetic and economic compar-ison of anaerobic digestion with different competing technologies to treatbiogenic wastes. Water Sci Technol 2000;41:263e73.
[5] Di Stefano TD, Belenky LG. Life-cycle analysis of energy and greenhouse gasemissions from anaerobic biodegradation of municipal solid waste. J EnvironEng 2009;135:1097e105.
[6] De Baere L. Will anaerobic digestion of solid waste survive in the future?Water Sci Technol 2006;53:187e94.
[7] Hartmann H, Ahring BK. Anaerobic digestion of the organic fraction ofmunicipal solid waste: influence of co-digestion with manure. Water Res2005;39:1543e52.
[8] Bouallagui H, Lahdheb H, Romdan EB, Rachdi B, Hamdi M. Improvement offruit and vegetable waste anaerobic digestion performance and stability withco-substrates addition. J Environ Manage 2009;90:1844e9.
[9] Holm-Nielsen JB, Seadi TA, Oleskowicz-Popiel P. The future of anaerobicdigestion and biogas utilization. Bioresour Technol 2009;100:547e5484.
[10] Gómez X, Cuetos MJ, Cara J, Morán A, García AI. Anaerobic co-digestion ofprimary sludge and the fruit and vegetable fraction of the municipal solidwastes: conditions for mixing and evaluation of the organic loading rate.Renew Energy 2006;31:2017e24.
[11] Mata-Alvarez J, Mace S, Llabres P. Anaerobic digestion of organic solid wastes.An overview of research achievements and perspectives. Bioresour. Technol2000;74:3e16.
[12] Yao R, Li B, Steemers K. Energy policy and standard for built environment inChina. Renew Energy 2005;30:1973e88.
[13] Müller JA, Winter A, Strünkmann G. Investigation and assessment of sludgepre-treatment processes. Water Sci Technol 2004;49:97e104.
[14] Wang W, Hou H, Hu S, Gao X. Performance and stability improvement inanaerobic digestion of thermally hydrolyzed municipal biowaste by a biofilmsystem. Bioresour Technol 2010;101:1715e21.
[15] BSI. Guide to PAS 2050: how to assess the carbon footprint of goods andservices. London: British Standards; 2008.
[16] Raninger B. Renewable energy for rural areas in China e GTZ training; August2007. Shenyang, China.
[17] IPCC. 2006 IPCC guidelines for national greenhouse gas inventories. Preparedby the national greenhouse gas inventories programme. Japan: IGES; 2006.
[18] Olivier F, Gourc JP, Achour F, Morais J, Bayard R. Evolution of bio-physical andmechanical characteristics of MSW after 2 years incubation in a laboratory-scale bioreactor. Proc 10th international waste and landfill symposium, Sar-dinia, Cagliari, Italy; 2005.
[19] Department of Climate Change. National Reform and Development Commis-sion (NDRC) of China. Baseline emission factor of grid power generationprojects of low-carbon technology and fossil fuels. Available from: http://cdm.ccchina.gov.cn/WebSite/CDM/UpFile/File2537.pdf; 2009.
[20] Zupan�ci�c GD, Uranjek-�Zevart N, Ro�s M. Full-scale anaerobic co-digestion oforganic waste and municipal sludge. Biomass Bioenergy 2008;32:162e7.
[21] Alvarez R, Lidén G. Semi-continuous co-digestion of solid slaughterhousewaste, manure, and fruit and vegetable waste. Renew Energy 2008;33:726e34.
[22] Krzystek L, Ledakowicz S, Kahle HJ, Kaczorek K. Degradation of householdbiowaste in reactors. J Biotechnol 2001;92:103e12.
[23] Cecchi F, Mata-Alvarez J, Pavan P, Sans C, Merli C. Semidry anaerobic digestionof MSW e influence of process parameters on the substrate utilization model.Water Sci Technol 1992;25:83e92.
[24] Mata-Alvarez J, Cecchi F, Pavan P, Llabres P. The performance of digesterstreating the organic fraction of municipal solid wastes differently sorted.Biological Wastes 1990;33:181e99.
[25] Sosnowski P, Wieczorek A, Ledakowicz S. Anaerobic co-digestion of sewagesludge and organic fraction of municipal solid wastes. Adv Environ Res 2003;7:609e16.
[26] Capela I, Rodrigues A, Silva F, Nadais H, Arroja L. Impact of industrial sludgeand cattle manure on anaerobic digestion of the OFMSW under mesophilicconditions. Biomass Bioenergy 2008;32:245e51.
[27] Zhu Z, Hsueh MK, He Q. Enhancing biomethanation of municipal wastesludge with grease trap waste as a co-substrate. Renew Energy 2011;32:1802e7.
[28] Davidsson Å, Lövstedt C, Jansen JC, Gruvberger C, Aspegren H. Co-digestion ofgrease trap sludge and sewage sludge. Waste Manage 2008;28:986e92.
[29] USEPA. International analyses of methane emissions, www.epa.gov/methane/intlanalyses.html; 2002.


