1 Associate Engineer, Cornforth Consultants, Inc., 10250 SW Greenburg Road, Suite 111, Portland, Oregon 97223 2 President, Geosystems, L.P., P.O. Box 237, Venetia, PA 15367 3 Professor, Almsford House, Fulwith Mill Lane, Harrogate, North Yorkshire HG2 8HJ, U.K. 4 Staff Engineer, Cornforth Consultants, Inc., 10250 SW Greenburg Road, Suite 111, Portland, Oregon 97223
Performance of Aging Post-Tensioned Rock Anchors in Dams
G. Heslin1, D.A. Bruce2, G.S. Littlejohn3, T. Westover4
Abstract
Post-tensioned ground anchors have been utilized to improve the stability of dams since 1934. In recent years, significant advances have been made in anchor tendon fabrication, corrosion protection, and installation techniques. This paper examines the performance of anchors installed specifically for dam safety purposes. The performance evaluation is based on a database of over 400 dams where post-tensioned ground anchors were installed to improve stability. The objective of the evaluation is to determine if and when it is appropriate to stop relying on anchors for long-term contribution to stability. Specific attention is devoted to anchor tendon fabrication details and corrosion protection systems and their influence on anchor longevity. A case study is presented for high capacity anchors at John Day Dam and the performance of the anchors since they were installed in 1981. The paper discusses the results of 21 lift-off tests performed on 37-strand anchors at John Day Dam. The results of lift-off tests are compared with data from permanent load cells. The authors developed a lift-off testing procedure that enabled anchors with damaged tendons to be lift-off tested while minimizing the risk of further damaging the tendons. A detailed discussion of the John Day anchors is presented including load losses with time, corrosion considerations, and interpretation of lift-off test data and post lift-off behavior. A general discussion of risks and benefits involved with lift-off testing anchors with damaged tendons is presented. The paper concludes with a general discussion on the implications of aging post-tensioned anchors and their impact on dam stability.
Introduction
Permanent post-tensioned rock anchors have been used in North America for more than 40 years. Although there are early documented cases of dam anchoring in North Africa in the 1930’s, the first North American projects did not occur until the mid 1960’s when the practice was adopted by the U.S. Army Corps of Engineers and the Montana Power Company. Two notable early projects include John Hollis Bankhead Lock & Dam in 1965 and Little Goose Locks & Dam in 1968.
The evolution of the Post Tensioning Institute’s “Recommendation” documents has had a very strong influence on North American anchoring practice. Recognizing the need for some type of national guidance and uniformity, tentative recommendations of practice for pre-stressed rock and soil anchors were first issued by the Post-Tensioning Division of the Prestressed Concrete Institute (PCI) in 1974. The Post-Tensioning Division of PCI formed an independent organization known as the Post-Tensioning Institute in 1976. In 1980, the Post-
Tensioning Institute issued the First Edition of Recommendations for Prestressed Rock and Soil Anchors (PTI Recommendations) that were subsequently adopted and reprinted by the USACE. Successive editions of the PTI Recommendations were issued in 1986, 1996, and 2004. A review of the successive recommendation documents reveals a clear evolution from promotional literature documenting case studies of projects to detailed guidance and commentary information on the primary areas of anchoring practice: Materials, Design, Corrosion Protection, Construction, and Stressing/Testing. More detailed analysis of the evolution of the PTI Recommendations may be found in Bruce and Wolfhope (2007a).
The use of prestressed anchors in dams has also been well documented in over 230 published journal articles. No documented cases have been reported where a dam that has been anchored has failed. In general, the case histories indicate good performance of the anchor systems. There are isolated situations where dams have been anchored multiple times due to poor performance of the anchors; these cases are
2
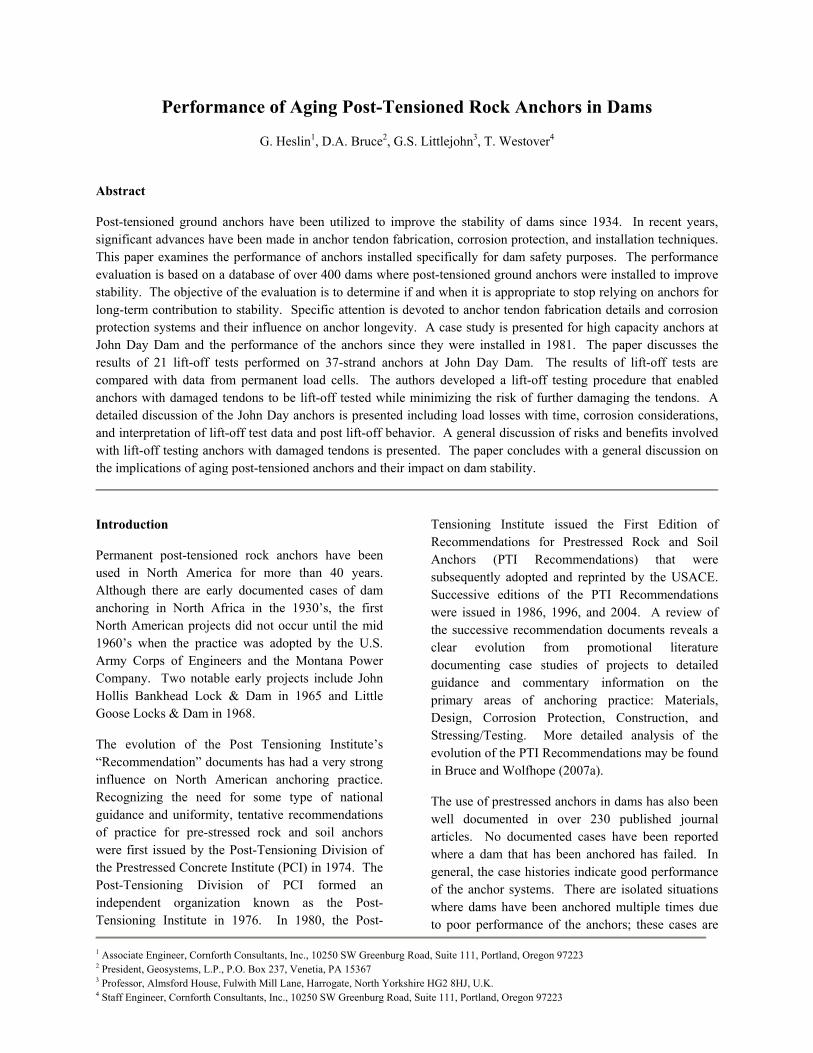
Histogram of Dams Anchored - North America (1962-2004)
1
0
1 1
0
1 1 1 1 1
2
3 3
4
0
1
6 6 6 6
7
4 4
11
7
14
20
23
18
17
16
17
9
17
10
7
12 12
8
11
18
7
6
0
5
10
15
20
25
1962
1964
1966
1968
1970
1972
1974
1976
1978
1980
1982
1984
1986
1988
1990
1992
1994
1996
1998
2000
2002
2004
Year
Num
ber o
f Dam
s
Notes: 1) Total Number of Dams Shown = 323 2) Does not include 70 anchor case studies where year anchored not reported or as yet ascertained.
undoubtedly attributable to inappropriate design approaches and construction techniques.
The third source of data on anchor practice in North America is the development of case studies, as part of the National Research Program on Anchors for Dams (Bruce and Wolfhope 2006, 2007b). Details have been assembled on over 400 dam anchoring projects conducted since the mid-1960’s. More than five anchoring dam projects have been successfully completed in each of over 25 U.S. states and three Canadian provinces, with only 10 states where prestressed tendon anchors have not been used in dam applications. The case studies have been compiled into a database repository for easy retrieval of information and analysis of statistical information. Although limited information exists on many of the older projects, the case studies for many of the projects from the last decade of practice include details on the anchor systems, corrosion protection, and the engineering aspects of the anchor design. The danger of losing remaining historical
information, the original driver for the National Research Program, remains a threat to the full understanding of the evolution of American anchoring practice and the opportunity to improve practice based on lessons learned.
To date, the database contains 239 projects whose details are essentially “complete,” a further 50 projects classified as “nearly complete”, and a further 104 case histories regarded as “incomplete”. Overall, a total of 323 dam anchor projects have sufficient data to allow year of construction to be tabulated until December 2004 (Figure 1).
Against this body of background information, the recent anchor assessment of 28-year-old anchors at John Day Lock and Dam, Washington provides an excellent illustration of the corrosion-related problems potentially affecting the majority of the 20,000 or so anchor tendons installed nationally prior to 1996. This paper firstly reviews the historical evolution of corrosion protection concepts and details before presenting the results of the John Day study.
Figure 1 – Histogram of Dams Anchored by Year (1962-2004)
3
Evolution of Corrosion Protection Concepts and Details – PTI “Recommendations” Documents
A chronological overview of the PTI recommendations evolution is summarized below.
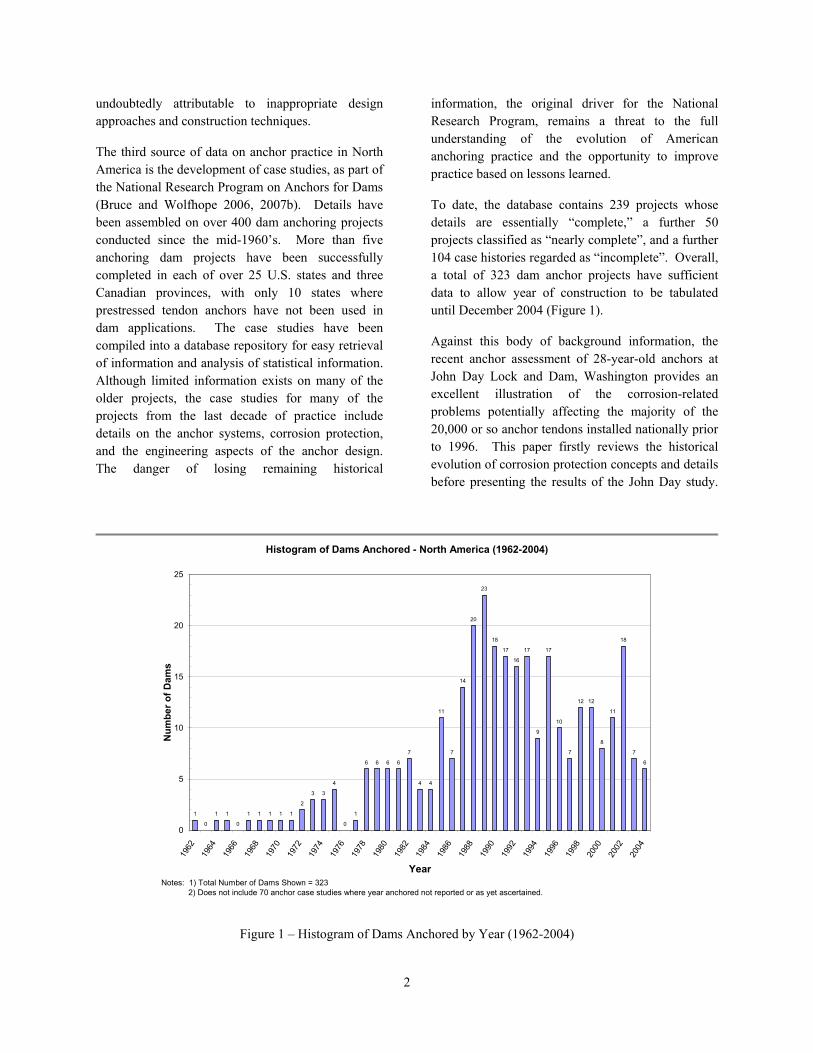
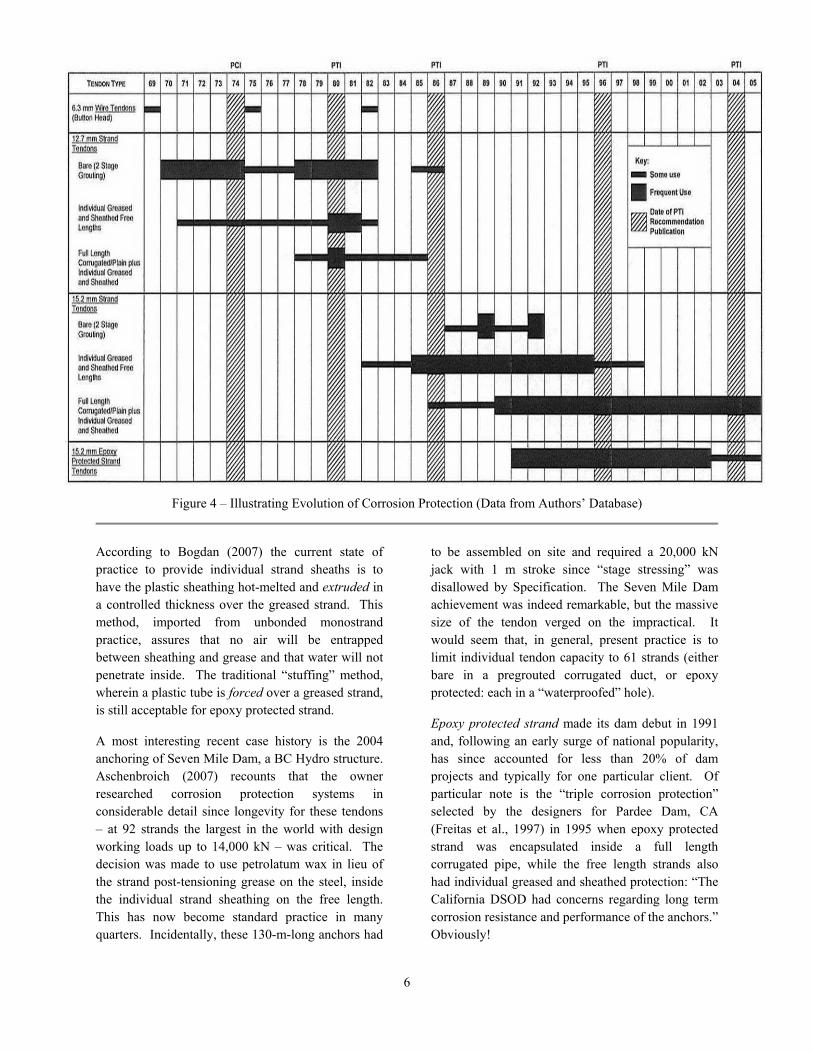
1974 - Figure 2 illustrates the original very simple approach to tendon protection, i.e., cement grout or nothing. “Permanent” is defined as “generally more than a 3-year service life.” Sheathing is only discussed as a debonding medium, not a corrosion protection barrier. For permanent anchors “protective corrosion seals over their entire length” are to be provided (but are not defined). For two stage grouted tendons, sheathing can be omitted, the implication being that cement grout alone would be acceptable.
1980 - The same Figure 2 is reproduced (as it was also in 1986). The term “permanent” is now reduced to 18 months or more, and growing attention is drawn to the requirements of permanent anchors: sheathing is for debonding “and/or to provide corrosion protection,” as is secondary cement grout. Corrugated protection, and epoxy coating for bars, are discussed.
The type and details of corrosion protection are to be based on longevity, anchor environment, consequences of future and in-hole conditions/length of time before grouting. For the bond length, cement grout is considered “the first level of corrosion protection,” and plastic corrugated sheathing (“for multiple corrosion protection schemes”) or epoxy are permitted. Such protection is to extend at least 2 feet into the free length. The free length is to have, as a minimum, a sheath with cement grout or grease infill. A full length outer sheath is regarded as “good practice.”
1986 - The emphasis is placed on first investigating the chemical aggressiveness of the soil and ground water: “Permanent anchors placed in environments where any one of these tests indicate critical values must be encapsulated over their full length.” Thus, even up until the next set of Recommendations (1996), it was considered acceptable to allow anchors for dams to be installed without any protection for the bond length other than cement grout, depending on
the results of laboratory tests on small samples. Encapsulation was not detailed.
1996 - Permanence is now defined as a minimum of 24 months in a completely revised set of Recommendations. A wider spectrum of issues than simple chemistry now have to be considered when selecting corrosion protection principles. A major breakthrough was to identify two classes of protection (Class I and II) for permanent anchors to replace the poorly defined and loosely used “double” and “single” corrosion protection systems offered by various tendon manufacturers. The details were summarized in tabular form and a “decision tree” was provided for the guidance of designers (Nierlich and Bruce, 1997).
Figure 2 – Rock Anchor Components (PCI, 1974) Note Lack of Steel Protection Other than Grout
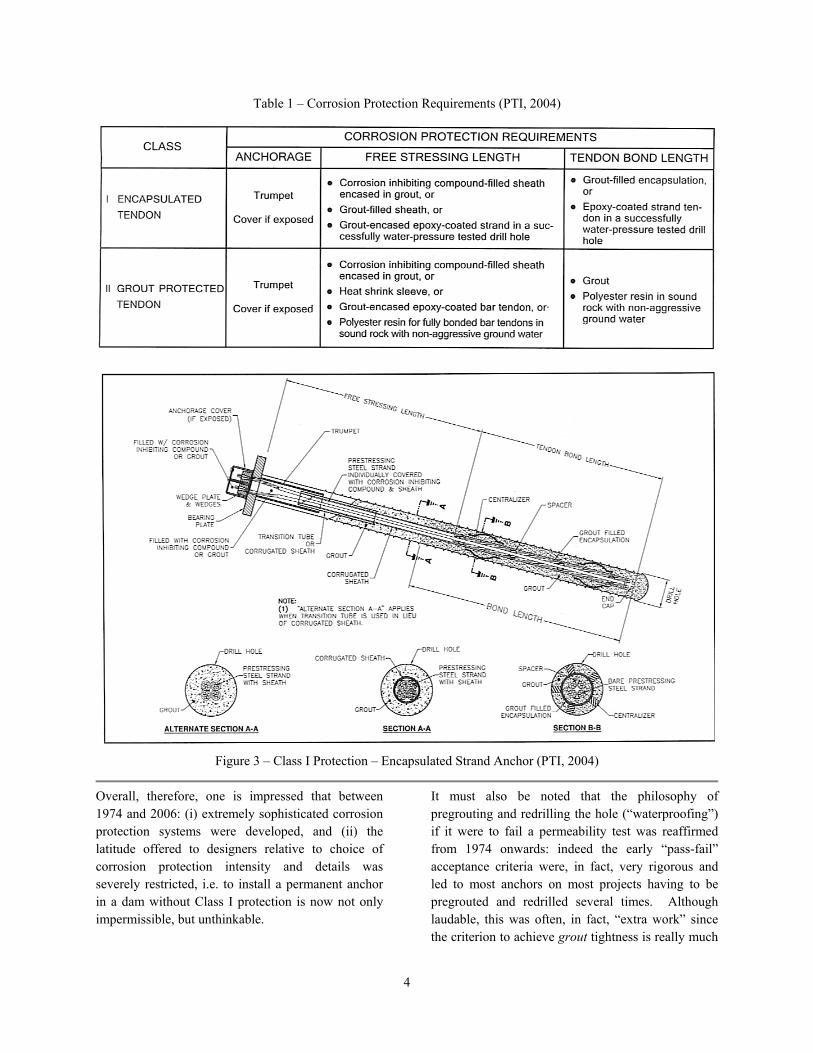
2004 - The 1996 Recommendations were revalidated while it is stated that, for permanent anchors, “aggressive conditions shall be assumed if the aggressivity of the ground has not been quantified by testing.” A revised Table 1 was presented mainly to clarify the acceptable Class I status of epoxy protected steel in a “water proofed hole.” The sophistication of contemporary tendons is shown in Figure 3. A long supplement is devoted to epoxy protected strand.
4
Table 1 – Corrosion Protection Requirements (PTI, 2004)
Figure 3 – Class I Protection – Encapsulated Strand Anchor (PTI, 2004)
Overall, therefore, one is impressed that between 1974 and 2006: (i) extremely sophisticated corrosion protection systems were developed, and (ii) the latitude offered to designers relative to choice of corrosion protection intensity and details was severely restricted, i.e. to install a permanent anchor in a dam without Class I protection is now not only impermissible, but unthinkable.
It must also be noted that the philosophy of pregrouting and redrilling the hole (“waterproofing”) if it were to fail a permeability test was reaffirmed from 1974 onwards: indeed the early “pass-fail” acceptance criteria were, in fact, very rigorous and led to most anchors on most projects having to be pregrouted and redrilled several times. Although laudable, this was often, in fact, “extra work” since the criterion to achieve grout tightness is really much
5
more lax than the criterion needed to provide the specified degree of water tightness. The saving grace of many of the early anchors was doubtless, therefore, the somewhat erroneous drill hole “waterproofing” criterion under which they were constructed
Evolution of Corrosion Protection Concepts and Details –Demonstrated by the Database
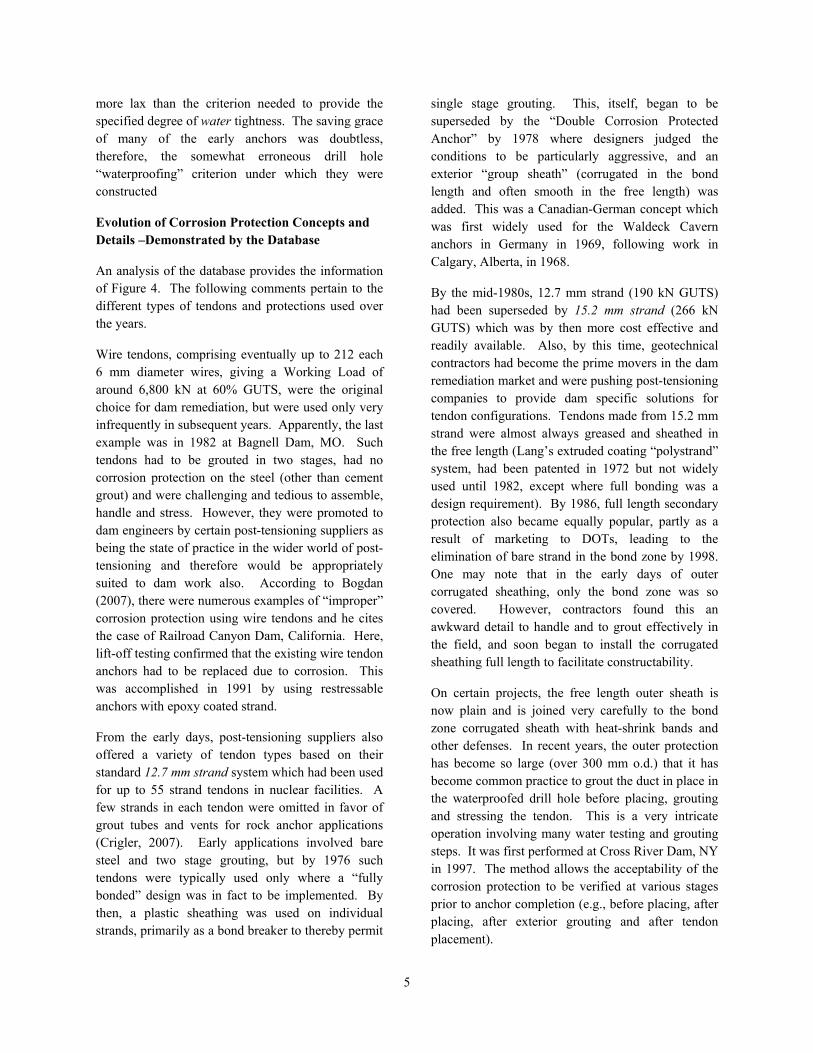
An analysis of the database provides the information of Figure 4. The following comments pertain to the different types of tendons and protections used over the years.
Wire tendons, comprising eventually up to 212 each 6 mm diameter wires, giving a Working Load of around 6,800 kN at 60% GUTS, were the original choice for dam remediation, but were used only very infrequently in subsequent years. Apparently, the last example was in 1982 at Bagnell Dam, MO. Such tendons had to be grouted in two stages, had no corrosion protection on the steel (other than cement grout) and were challenging and tedious to assemble, handle and stress. However, they were promoted to dam engineers by certain post-tensioning suppliers as being the state of practice in the wider world of post-tensioning and therefore would be appropriately suited to dam work also. According to Bogdan (2007), there were numerous examples of “improper” corrosion protection using wire tendons and he cites the case of Railroad Canyon Dam, California. Here, lift-off testing confirmed that the existing wire tendon anchors had to be replaced due to corrosion. This was accomplished in 1991 by using restressable anchors with epoxy coated strand.
From the early days, post-tensioning suppliers also offered a variety of tendon types based on their standard 12.7 mm strand system which had been used for up to 55 strand tendons in nuclear facilities. A few strands in each tendon were omitted in favor of grout tubes and vents for rock anchor applications (Crigler, 2007). Early applications involved bare steel and two stage grouting, but by 1976 such tendons were typically used only where a “fully bonded” design was in fact to be implemented. By then, a plastic sheathing was used on individual strands, primarily as a bond breaker to thereby permit
single stage grouting. This, itself, began to be superseded by the “Double Corrosion Protected Anchor” by 1978 where designers judged the conditions to be particularly aggressive, and an exterior “group sheath” (corrugated in the bond length and often smooth in the free length) was added. This was a Canadian-German concept which was first widely used for the Waldeck Cavern anchors in Germany in 1969, following work in Calgary, Alberta, in 1968.
By the mid-1980s, 12.7 mm strand (190 kN GUTS) had been superseded by 15.2 mm strand (266 kN GUTS) which was by then more cost effective and readily available. Also, by this time, geotechnical contractors had become the prime movers in the dam remediation market and were pushing post-tensioning companies to provide dam specific solutions for tendon configurations. Tendons made from 15.2 mm strand were almost always greased and sheathed in the free length (Lang’s extruded coating “polystrand” system, had been patented in 1972 but not widely used until 1982, except where full bonding was a design requirement). By 1986, full length secondary protection also became equally popular, partly as a result of marketing to DOTs, leading to the elimination of bare strand in the bond zone by 1998. One may note that in the early days of outer corrugated sheathing, only the bond zone was so covered. However, contractors found this an awkward detail to handle and to grout effectively in the field, and soon began to install the corrugated sheathing full length to facilitate constructability.
On certain projects, the free length outer sheath is now plain and is joined very carefully to the bond zone corrugated sheath with heat-shrink bands and other defenses. In recent years, the outer protection has become so large (over 300 mm o.d.) that it has become common practice to grout the duct in place in the waterproofed drill hole before placing, grouting and stressing the tendon. This is a very intricate operation involving many water testing and grouting steps. It was first performed at Cross River Dam, NY in 1997. The method allows the acceptability of the corrosion protection to be verified at various stages prior to anchor completion (e.g., before placing, after placing, after exterior grouting and after tendon placement).
6
Figure 4 – Illustrating Evolution of Corrosion Protection (Data from Authors’ Database)
According to Bogdan (2007) the current state of practice to provide individual strand sheaths is to have the plastic sheathing hot-melted and extruded in a controlled thickness over the greased strand. This method, imported from unbonded monostrand practice, assures that no air will be entrapped between sheathing and grease and that water will not penetrate inside. The traditional “stuffing” method, wherein a plastic tube is forced over a greased strand, is still acceptable for epoxy protected strand.
A most interesting recent case history is the 2004 anchoring of Seven Mile Dam, a BC Hydro structure. Aschenbroich (2007) recounts that the owner researched corrosion protection systems in considerable detail since longevity for these tendons – at 92 strands the largest in the world with design working loads up to 14,000 kN – was critical. The decision was made to use petrolatum wax in lieu of the strand post-tensioning grease on the steel, inside the individual strand sheathing on the free length. This has now become standard practice in many quarters. Incidentally, these 130-m-long anchors had
to be assembled on site and required a 20,000 kN jack with 1 m stroke since “stage stressing” was disallowed by Specification. The Seven Mile Dam achievement was indeed remarkable, but the massive size of the tendon verged on the impractical. It would seem that, in general, present practice is to limit individual tendon capacity to 61 strands (either bare in a pregrouted corrugated duct, or epoxy protected: each in a “waterproofed” hole).
Epoxy protected strand made its dam debut in 1991 and, following an early surge of national popularity, has since accounted for less than 20% of dam projects and typically for one particular client. Of particular note is the “triple corrosion protection” selected by the designers for Pardee Dam, CA (Freitas et al., 1997) in 1995 when epoxy protected strand was encapsulated inside a full length corrugated pipe, while the free length strands also had individual greased and sheathed protection: “The California DSOD had concerns regarding long term corrosion resistance and performance of the anchors.” Obviously!
7
Bars have been used as relatively low capacity tendons (up to 800 kN) since the mid-1970s especially on smaller Canadian dams, and invariably were installed in a protective corrugated sheath, which gave rise to the term “Double Corrosion Protection,” i.e., sheath plus grout, as noted above.
As a final point of detail, it is widely believed that the part of the tendon assembly at and just below the anchor head is most susceptible to corrosion. In accordance with PTI (2004), it is now common practice to provide a steel pipe trumpet that prevents water from penetrating behind the plate. The space inside the trumpet is usually filled with cementitious grout (“topping up”). Anchorages are placed inside blockouts and embedded in concrete. There are special cases when the owner requests some or all of the tendons to be retressable. In such cases, the trumpet will be filled with post-tensioning grease, and a restressable wedge plate and permanent load cell is added to the anchorage. This entire assembly is covered with a removable cover cap, also filled with grease. Such restressable systems are not recommended for anchors which may have to act in a submerged condition, e.g., in an active spillway or plunge pool: the corrosion risk is simply too high.
John Day Dam Case History
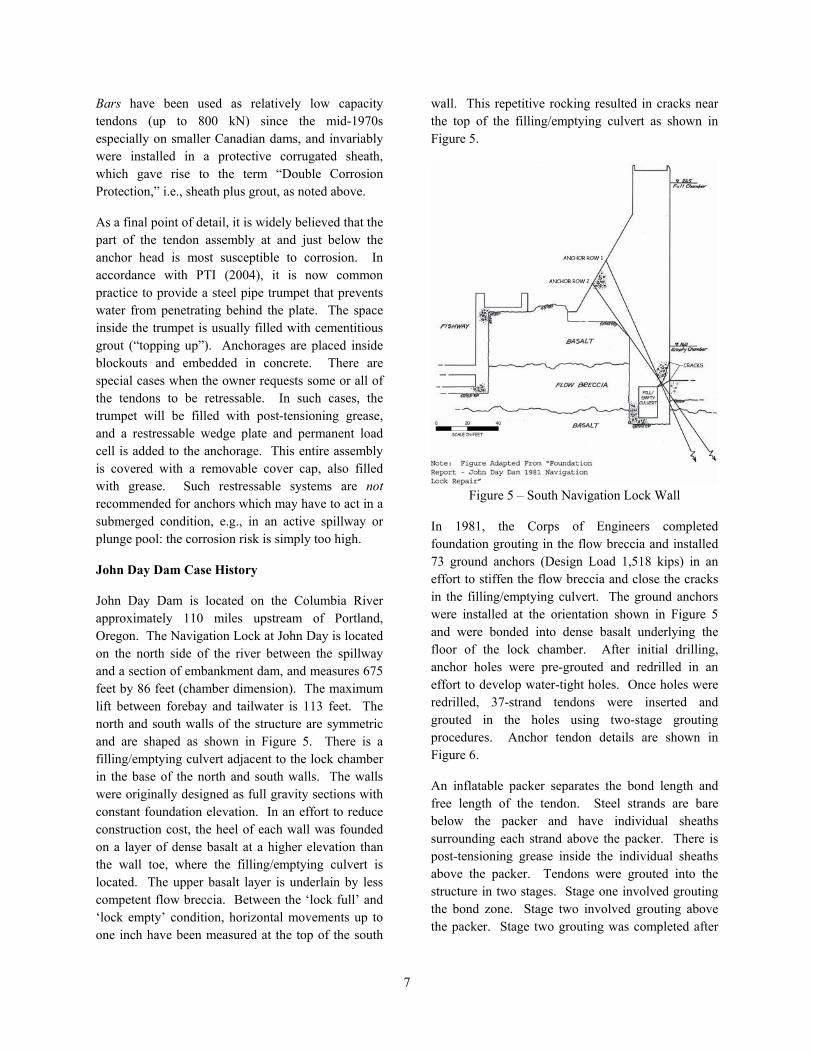
John Day Dam is located on the Columbia River approximately 110 miles upstream of Portland, Oregon. The Navigation Lock at John Day is located on the north side of the river between the spillway and a section of embankment dam, and measures 675 feet by 86 feet (chamber dimension). The maximum lift between forebay and tailwater is 113 feet. The north and south walls of the structure are symmetric and are shaped as shown in Figure 5. There is a filling/emptying culvert adjacent to the lock chamber in the base of the north and south walls. The walls were originally designed as full gravity sections with constant foundation elevation. In an effort to reduce construction cost, the heel of each wall was founded on a layer of dense basalt at a higher elevation than the wall toe, where the filling/emptying culvert is located. The upper basalt layer is underlain by less competent flow breccia. Between the ‘lock full’ and ‘lock empty’ condition, horizontal movements up to one inch have been measured at the top of the south
wall. This repetitive rocking resulted in cracks near the top of the filling/emptying culvert as shown in Figure 5.
Figure 5 – South Navigation Lock Wall
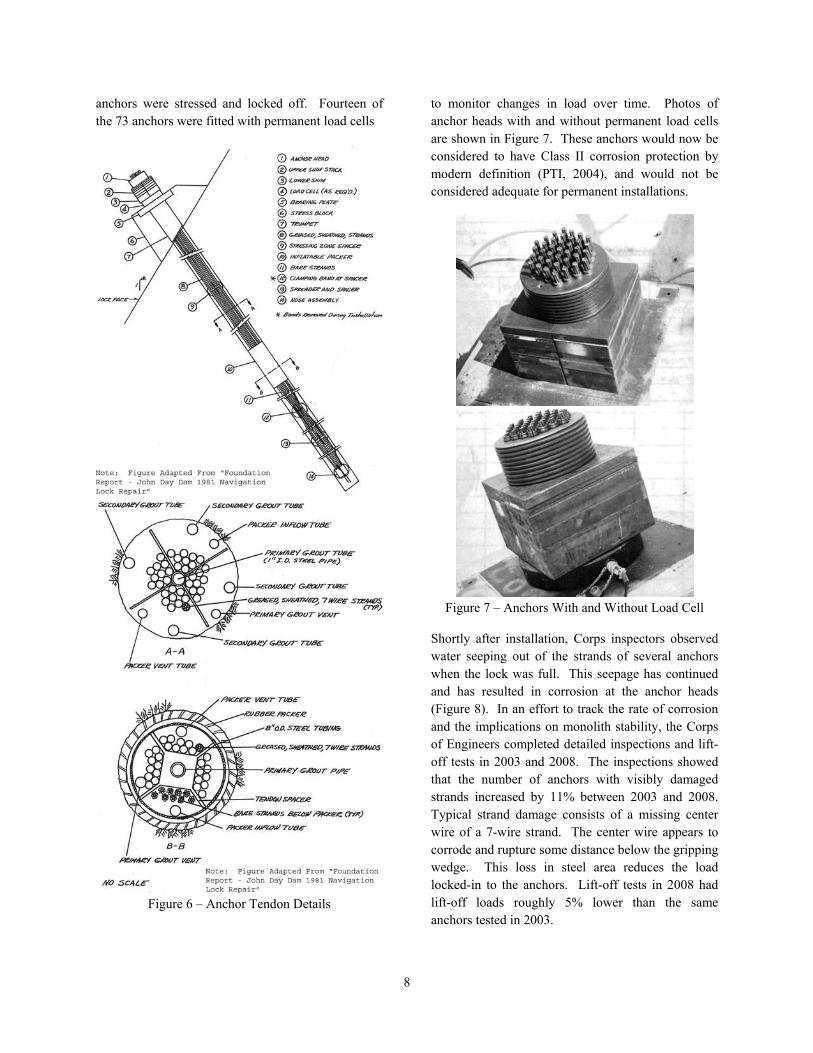
In 1981, the Corps of Engineers completed foundation grouting in the flow breccia and installed 73 ground anchors (Design Load 1,518 kips) in an effort to stiffen the flow breccia and close the cracks in the filling/emptying culvert. The ground anchors were installed at the orientation shown in Figure 5 and were bonded into dense basalt underlying the floor of the lock chamber. After initial drilling, anchor holes were pre-grouted and redrilled in an effort to develop water-tight holes. Once holes were redrilled, 37-strand tendons were inserted and grouted in the holes using two-stage grouting procedures. Anchor tendon details are shown in Figure 6.
An inflatable packer separates the bond length and free length of the tendon. Steel strands are bare below the packer and have individual sheaths surrounding each strand above the packer. There is post-tensioning grease inside the individual sheaths above the packer. Tendons were grouted into the structure in two stages. Stage one involved grouting the bond zone. Stage two involved grouting above the packer. Stage two grouting was completed after
8
anchors were stressed and locked off. Fourteen of the 73 anchors were fitted with permanent load cells
Figure 6 – Anchor Tendon Details
to monitor changes in load over time. Photos of anchor heads with and without permanent load cells are shown in Figure 7. These anchors would now be considered to have Class II corrosion protection by modern definition (PTI, 2004), and would not be considered adequate for permanent installations.
Figure 7 – Anchors With and Without Load Cell
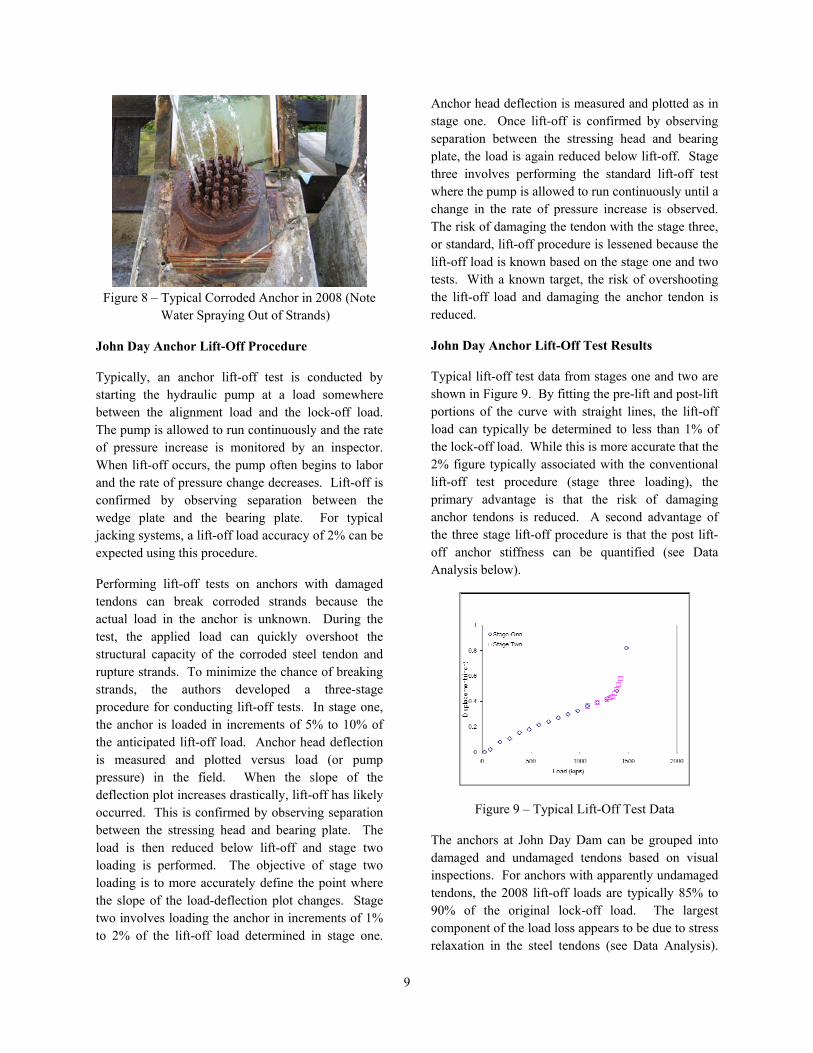
Shortly after installation, Corps inspectors observed water seeping out of the strands of several anchors when the lock was full. This seepage has continued and has resulted in corrosion at the anchor heads (Figure 8). In an effort to track the rate of corrosion and the implications on monolith stability, the Corps of Engineers completed detailed inspections and lift-off tests in 2003 and 2008. The inspections showed that the number of anchors with visibly damaged strands increased by 11% between 2003 and 2008. Typical strand damage consists of a missing center wire of a 7-wire strand. The center wire appears to corrode and rupture some distance below the gripping wedge. This loss in steel area reduces the load locked-in to the anchors. Lift-off tests in 2008 had lift-off loads roughly 5% lower than the same anchors tested in 2003.
9
Figure 8 – Typical Corroded Anchor in 2008 (Note
Water Spraying Out of Strands)
John Day Anchor Lift-Off Procedure
Typically, an anchor lift-off test is conducted by starting the hydraulic pump at a load somewhere between the alignment load and the lock-off load. The pump is allowed to run continuously and the rate of pressure increase is monitored by an inspector. When lift-off occurs, the pump often begins to labor and the rate of pressure change decreases. Lift-off is confirmed by observing separation between the wedge plate and the bearing plate. For typical jacking systems, a lift-off load accuracy of 2% can be expected using this procedure.
Performing lift-off tests on anchors with damaged tendons can break corroded strands because the actual load in the anchor is unknown. During the test, the applied load can quickly overshoot the structural capacity of the corroded steel tendon and rupture strands. To minimize the chance of breaking strands, the authors developed a three-stage procedure for conducting lift-off tests. In stage one, the anchor is loaded in increments of 5% to 10% of the anticipated lift-off load. Anchor head deflection is measured and plotted versus load (or pump pressure) in the field. When the slope of the deflection plot increases drastically, lift-off has likely occurred. This is confirmed by observing separation between the stressing head and bearing plate. The load is then reduced below lift-off and stage two loading is performed. The objective of stage two loading is to more accurately define the point where the slope of the load-deflection plot changes. Stage two involves loading the anchor in increments of 1% to 2% of the lift-off load determined in stage one.
Anchor head deflection is measured and plotted as in stage one. Once lift-off is confirmed by observing separation between the stressing head and bearing plate, the load is again reduced below lift-off. Stage three involves performing the standard lift-off test where the pump is allowed to run continuously until a change in the rate of pressure increase is observed. The risk of damaging the tendon with the stage three, or standard, lift-off procedure is lessened because the lift-off load is known based on the stage one and two tests. With a known target, the risk of overshooting the lift-off load and damaging the anchor tendon is reduced.
John Day Anchor Lift-Off Test Results
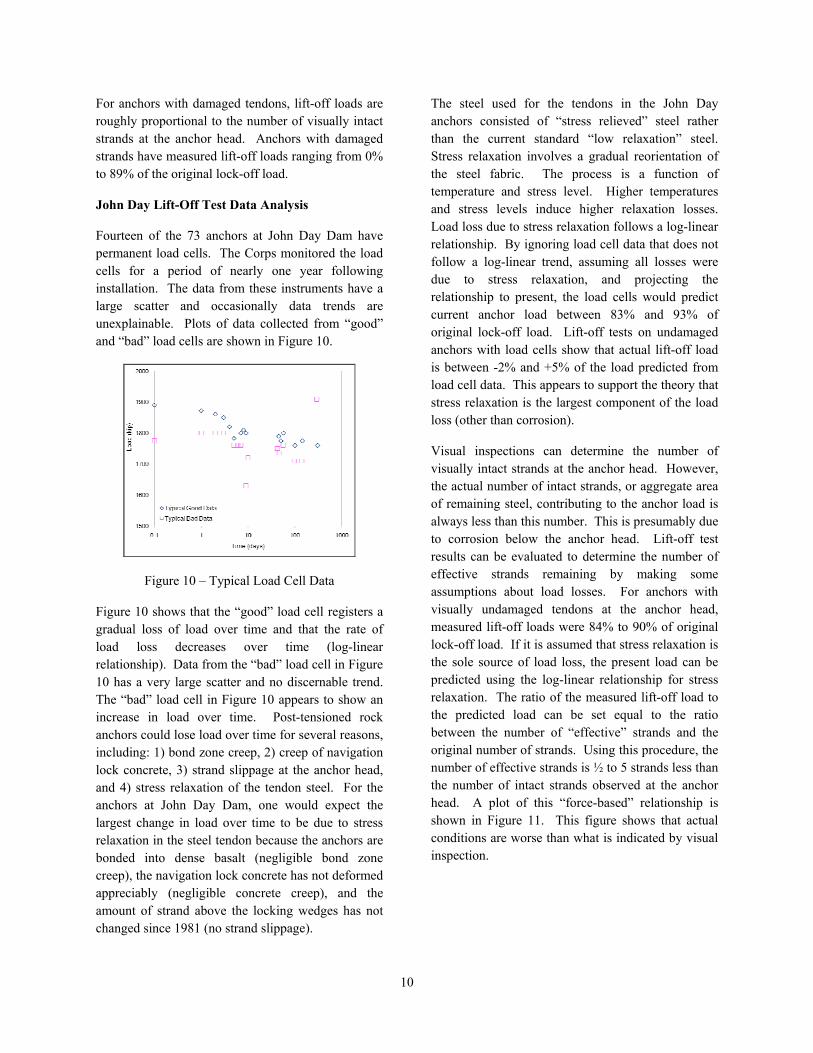
Typical lift-off test data from stages one and two are shown in Figure 9. By fitting the pre-lift and post-lift portions of the curve with straight lines, the lift-off load can typically be determined to less than 1% of the lock-off load. While this is more accurate that the 2% figure typically associated with the conventional lift-off test procedure (stage three loading), the primary advantage is that the risk of damaging anchor tendons is reduced. A second advantage of the three stage lift-off procedure is that the post lift-off anchor stiffness can be quantified (see Data Analysis below).
Figure 9 – Typical Lift-Off Test Data
The anchors at John Day Dam can be grouped into damaged and undamaged tendons based on visual inspections. For anchors with apparently undamaged tendons, the 2008 lift-off loads are typically 85% to 90% of the original lock-off load. The largest component of the load loss appears to be due to stress relaxation in the steel tendons (see Data Analysis).
10
For anchors with damaged tendons, lift-off loads are roughly proportional to the number of visually intact strands at the anchor head. Anchors with damaged strands have measured lift-off loads ranging from 0% to 89% of the original lock-off load.
John Day Lift-Off Test Data Analysis
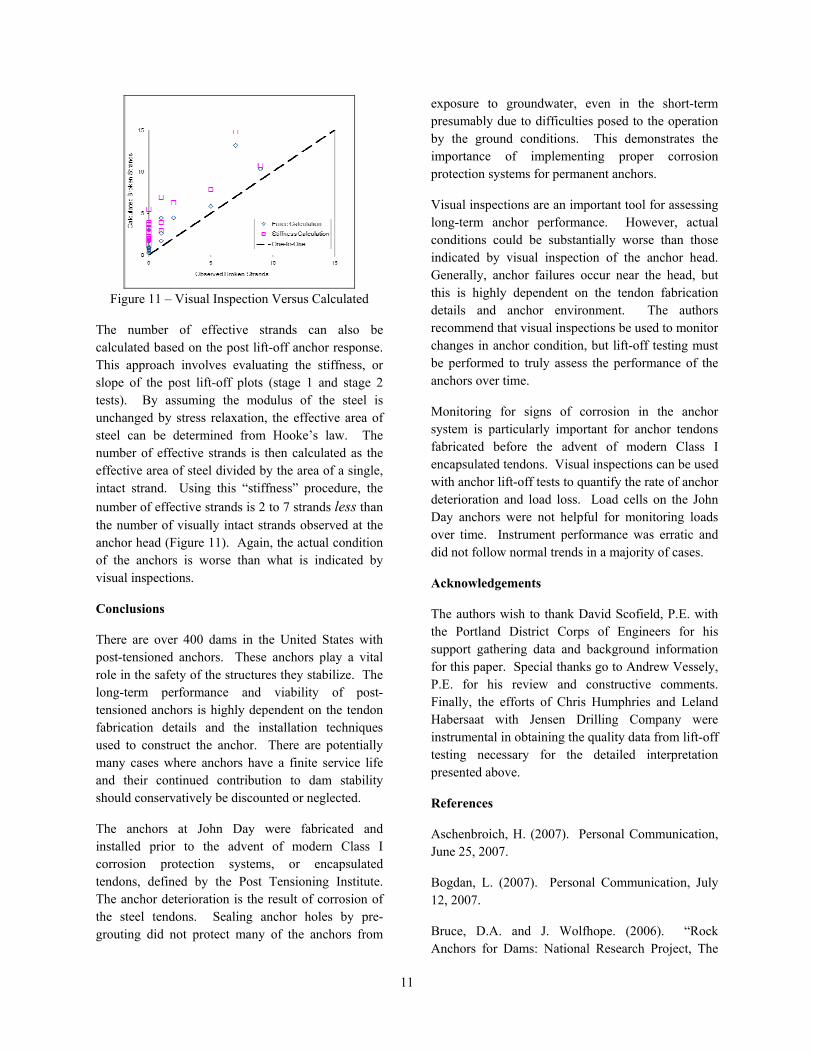
Fourteen of the 73 anchors at John Day Dam have permanent load cells. The Corps monitored the load cells for a period of nearly one year following installation. The data from these instruments have a large scatter and occasionally data trends are unexplainable. Plots of data collected from “good” and “bad” load cells are shown in Figure 10.
Figure 10 – Typical Load Cell Data
Figure 10 shows that the “good” load cell registers a gradual loss of load over time and that the rate of load loss decreases over time (log-linear relationship). Data from the “bad” load cell in Figure 10 has a very large scatter and no discernable trend. The “bad” load cell in Figure 10 appears to show an increase in load over time. Post-tensioned rock anchors could lose load over time for several reasons, including: 1) bond zone creep, 2) creep of navigation lock concrete, 3) strand slippage at the anchor head, and 4) stress relaxation of the tendon steel. For the anchors at John Day Dam, one would expect the largest change in load over time to be due to stress relaxation in the steel tendon because the anchors are bonded into dense basalt (negligible bond zone creep), the navigation lock concrete has not deformed appreciably (negligible concrete creep), and the amount of strand above the locking wedges has not changed since 1981 (no strand slippage).
The steel used for the tendons in the John Day anchors consisted of “stress relieved” steel rather than the current standard “low relaxation” steel. Stress relaxation involves a gradual reorientation of the steel fabric. The process is a function of temperature and stress level. Higher temperatures and stress levels induce higher relaxation losses. Load loss due to stress relaxation follows a log-linear relationship. By ignoring load cell data that does not follow a log-linear trend, assuming all losses were due to stress relaxation, and projecting the relationship to present, the load cells would predict current anchor load between 83% and 93% of original lock-off load. Lift-off tests on undamaged anchors with load cells show that actual lift-off load is between -2% and +5% of the load predicted from load cell data. This appears to support the theory that stress relaxation is the largest component of the load loss (other than corrosion).
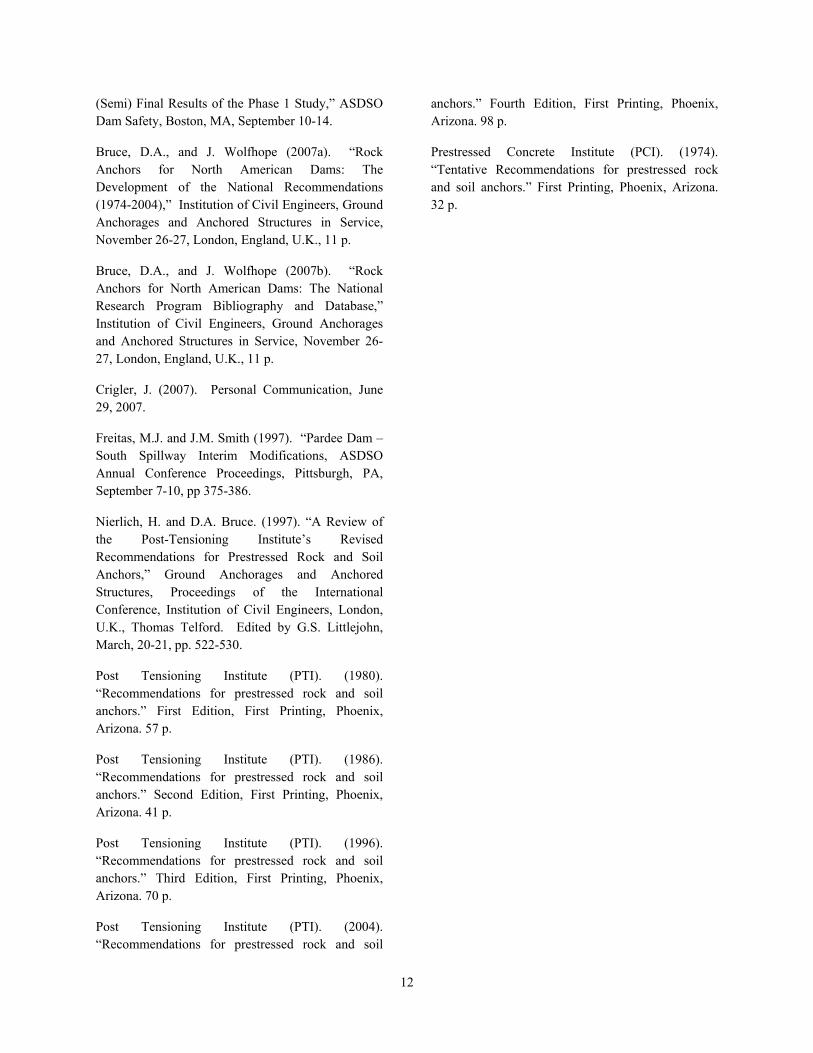
Visual inspections can determine the number of visually intact strands at the anchor head. However, the actual number of intact strands, or aggregate area of remaining steel, contributing to the anchor load is always less than this number. This is presumably due to corrosion below the anchor head. Lift-off test results can be evaluated to determine the number of effective strands remaining by making some assumptions about load losses. For anchors with visually undamaged tendons at the anchor head, measured lift-off loads were 84% to 90% of original lock-off load. If it is assumed that stress relaxation is the sole source of load loss, the present load can be predicted using the log-linear relationship for stress relaxation. The ratio of the measured lift-off load to the predicted load can be set equal to the ratio between the number of “effective” strands and the original number of strands. Using this procedure, the number of effective strands is ½ to 5 strands less than the number of intact strands observed at the anchor head. A plot of this “force-based” relationship is shown in Figure 11. This figure shows that actual conditions are worse than what is indicated by visual inspection.
11
Figure 11 – Visual Inspection Versus Calculated
The number of effective strands can also be calculated based on the post lift-off anchor response. This approach involves evaluating the stiffness, or slope of the post lift-off plots (stage 1 and stage 2 tests). By assuming the modulus of the steel is unchanged by stress relaxation, the effective area of steel can be determined from Hooke’s law. The number of effective strands is then calculated as the effective area of steel divided by the area of a single, intact strand. Using this “stiffness” procedure, the number of effective strands is 2 to 7 strands less than the number of visually intact strands observed at the anchor head (Figure 11). Again, the actual condition of the anchors is worse than what is indicated by visual inspections.
Conclusions
There are over 400 dams in the United States with post-tensioned anchors. These anchors play a vital role in the safety of the structures they stabilize. The long-term performance and viability of post-tensioned anchors is highly dependent on the tendon fabrication details and the installation techniques used to construct the anchor. There are potentially many cases where anchors have a finite service life and their continued contribution to dam stability should conservatively be discounted or neglected.
The anchors at John Day were fabricated and installed prior to the advent of modern Class I corrosion protection systems, or encapsulated tendons, defined by the Post Tensioning Institute. The anchor deterioration is the result of corrosion of the steel tendons. Sealing anchor holes by pre-grouting did not protect many of the anchors from
exposure to groundwater, even in the short-term presumably due to difficulties posed to the operation by the ground conditions. This demonstrates the importance of implementing proper corrosion protection systems for permanent anchors.
Visual inspections are an important tool for assessing long-term anchor performance. However, actual conditions could be substantially worse than those indicated by visual inspection of the anchor head. Generally, anchor failures occur near the head, but this is highly dependent on the tendon fabrication details and anchor environment. The authors recommend that visual inspections be used to monitor changes in anchor condition, but lift-off testing must be performed to truly assess the performance of the anchors over time.
Monitoring for signs of corrosion in the anchor system is particularly important for anchor tendons fabricated before the advent of modern Class I encapsulated tendons. Visual inspections can be used with anchor lift-off tests to quantify the rate of anchor deterioration and load loss. Load cells on the John Day anchors were not helpful for monitoring loads over time. Instrument performance was erratic and did not follow normal trends in a majority of cases.
Acknowledgements
The authors wish to thank David Scofield, P.E. with the Portland District Corps of Engineers for his support gathering data and background information for this paper. Special thanks go to Andrew Vessely, P.E. for his review and constructive comments. Finally, the efforts of Chris Humphries and Leland Habersaat with Jensen Drilling Company were instrumental in obtaining the quality data from lift-off testing necessary for the detailed interpretation presented above.
References
Aschenbroich, H. (2007). Personal Communication, June 25, 2007.
Bogdan, L. (2007). Personal Communication, July 12, 2007.
Bruce, D.A. and J. Wolfhope. (2006). “Rock Anchors for Dams: National Research Project, The
12
(Semi) Final Results of the Phase 1 Study,” ASDSO Dam Safety, Boston, MA, September 10-14.
Bruce, D.A., and J. Wolfhope (2007a). “Rock Anchors for North American Dams: The Development of the National Recommendations (1974-2004),” Institution of Civil Engineers, Ground Anchorages and Anchored Structures in Service, November 26-27, London, England, U.K., 11 p.
Bruce, D.A., and J. Wolfhope (2007b). “Rock Anchors for North American Dams: The National Research Program Bibliography and Database,” Institution of Civil Engineers, Ground Anchorages and Anchored Structures in Service, November 26-27, London, England, U.K., 11 p.
Crigler, J. (2007). Personal Communication, June 29, 2007.
Freitas, M.J. and J.M. Smith (1997). “Pardee Dam – South Spillway Interim Modifications, ASDSO Annual Conference Proceedings, Pittsburgh, PA, September 7-10, pp 375-386.
Nierlich, H. and D.A. Bruce. (1997). “A Review of the Post-Tensioning Institute’s Revised Recommendations for Prestressed Rock and Soil Anchors,” Ground Anchorages and Anchored Structures, Proceedings of the International Conference, Institution of Civil Engineers, London, U.K., Thomas Telford. Edited by G.S. Littlejohn, March, 20-21, pp. 522-530.
Post Tensioning Institute (PTI). (1980). “Recommendations for prestressed rock and soil anchors.” First Edition, First Printing, Phoenix, Arizona. 57 p.
Post Tensioning Institute (PTI). (1986). “Recommendations for prestressed rock and soil anchors.” Second Edition, First Printing, Phoenix, Arizona. 41 p.
Post Tensioning Institute (PTI). (1996). “Recommendations for prestressed rock and soil anchors.” Third Edition, First Printing, Phoenix, Arizona. 70 p.
Post Tensioning Institute (PTI). (2004). “Recommendations for prestressed rock and soil
anchors.” Fourth Edition, First Printing, Phoenix, Arizona. 98 p.
Prestressed Concrete Institute (PCI). (1974). “Tentative Recommendations for prestressed rock and soil anchors.” First Printing, Phoenix, Arizona. 32 p.


