
Oracle Insurance Revenue Management and Billing V2.4.0.1.0 Performance and Scalability Test on Exalogic X3-2 and Exadata X3-2
Healthcare Industry Benchmark
O R A C L E W H I T E P A P E R | F E B R U A R Y 2 0 1 6
ORACLE INSURANCE REVENUE MANAGEMENT AND BILLING V2.4.0.1.0 PERFORMANCE & SCALABILITY TEST ON EXALOGIC X3-2 AND EXADATA X3-2
Table of Contents
Executive Summary 1
Introduction 2
Oracle Insurance Revenue Management and Billing Overview 2
Test Scenarios 2
Small Business Scenario 2
Exchange Business Scenario 2
Process Flow 3
Methodology 4
Topology and Configuration 4
Batch Server Configuration 4
Database Server Configuration 5
Measuring Tools 5
Small Business Benchmarking 6
Batch Processing 6
Results 7
Exchange Business Benchmarking 11
Batch Processing 11
Results 12
Conclusions 15
1 | ORACLE INSURANCE REVENUE MANAGEMENT AND BILLING PERFORMANCE AND SCALABILITY TEST
Executive Summary
Objective
This white paper describes the performance and scalability capabilities of Oracle Insurance Revenue Management
and Billing Version 2.4 on Exadata X3-2 and Exalogic X3-2. This benchmarking exercise was undertaken to
determine whether health payers using Oracle Insurance Revenue Management and Billing can generate large
volumes of premium bills and billing transactions for two scenarios: small business billing and exchange business
(individual policy) billing.
Scope
Three process flows – pending bill generation, bill segment generation and bill completion – were tested under the
small business and exchange business scenarios. Under the small business scenario, each billing account was
associated with multiple plans (contracts or products) and multiple members. Under the exchange business
scenario, each billing account was associated with multiple plans, but only one subscriber.
The performance and scalability tests were executed on the Oracle Database Machine, Exadata X3-2 (half rack)
and Exalogic X3-2 (half rack).
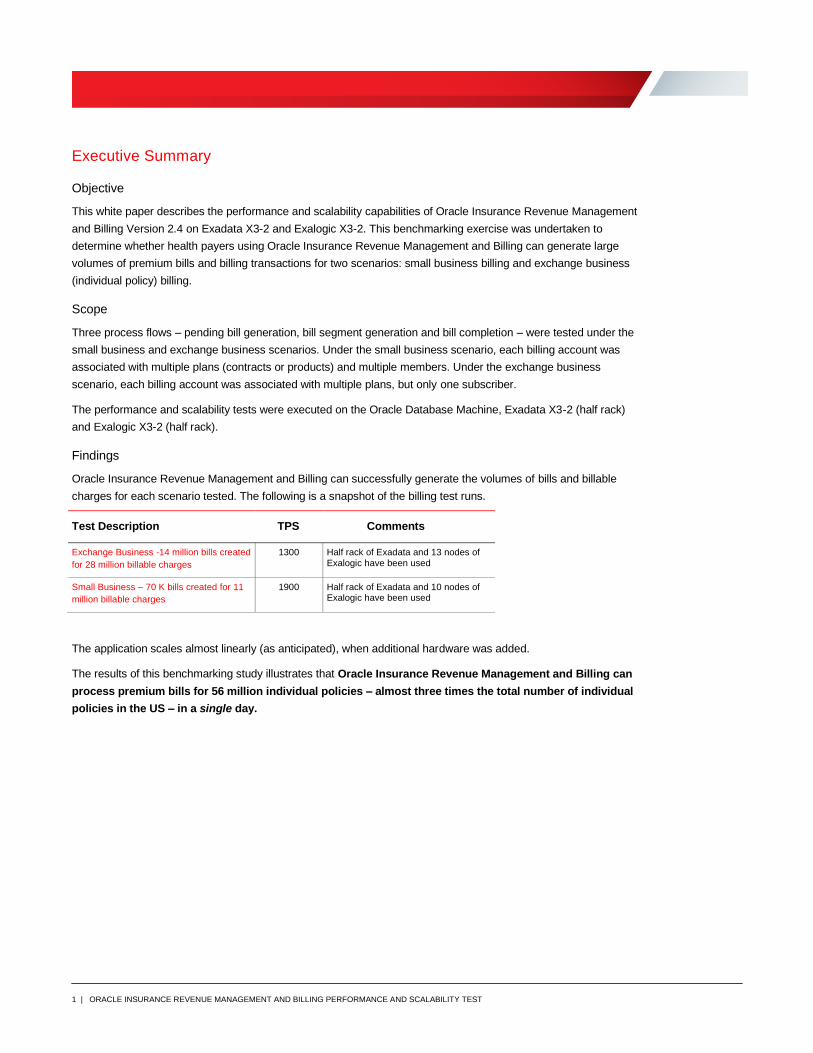
Findings
Oracle Insurance Revenue Management and Billing can successfully generate the volumes of bills and billable
charges for each scenario tested. The following is a snapshot of the billing test runs.
Test Description TPS Comments
Exchange Business -14 million bills created
for 28 million billable charges
1300 Half rack of Exadata and 13 nodes of Exalogic have been used
Small Business – 70 K bills created for 11
million billable charges
1900 Half rack of Exadata and 10 nodes of Exalogic have been used
The application scales almost linearly (as anticipated), when additional hardware was added.
The results of this benchmarking study illustrates that Oracle Insurance Revenue Management and Billing can
process premium bills for 56 million individual policies – almost three times the total number of individual
policies in the US – in a single day.

2 | ORACLE INSURANCE REVENUE MANAGEMENT AND BILLING PERFORMANCE AND SCALABILITY TEST
Introduction
This white paper describes the performance and scalability capabilities of Oracle Insurance Revenue
Management and Billing Version 2.4 on Exadata X3-2 and Exalogic X3-2. This benchmark was
designed to demonstrate that healthcare payers can successfully generate large volumes of bills and
billing transactions for two distinct premium billing scenarios: small business and exchange business.
The test also illustrates that the results scaled as expected when additional hardware was added.
Please note that the benchmark data in this white paper is intended for general information purposes
and not as a substitute for implementation-specific sizing or benchmarks
Oracle Insurance Revenue Management and Billing Overview
Oracle Insurance Revenue Management and Billing (ORMB) is a rules-based system for billing, payment, and
collections. Configurable business rules enable healthcare payers to change billing processes quickly and as often
as needed. Oracle Insurance Revenue Management and Billing supports group billing, list bill processing and
individual billing, and scales to support high-volume billing environments.
Test Scenarios
As part of the benchmarking exercise, the following health care scenarios were tested:
Small Business Scenario
Under the small business scenario, a billing account is associated with multiple plans (contracts or products) and
multiple members (subscribers and dependents). In this scenario, 34 million billable charges were created and
applied to 200,000 accounts as part of the data setup. The entity setup uses the following configuration:
» Contracts: each account has three contracts per subscriber
» Dependents: each subscriber has three dependents
» Subscribers: the number of subscribers varies from 10 to 100 per billing account
» Discounts: there is an additional segment for policy discounts on each billing account. A discount is calculated
based on the number of active members for the related policy.
Exchange Business Scenario
Under the exchange business scenario, a billing account is associated with multiple plans, but only one subscriber.
In this scenario, 140 million billable charges were created and applied to 70 million accounts as part of the data
setup. The entity setup uses the following configuration:
» Contracts: each account has two contracts per subscriber
» Dependents: each subscriber has three dependents
3 | ORACLE INSURANCE REVENUE MANAGEMENT AND BILLING PERFORMANCE AND SCALABILITY TEST
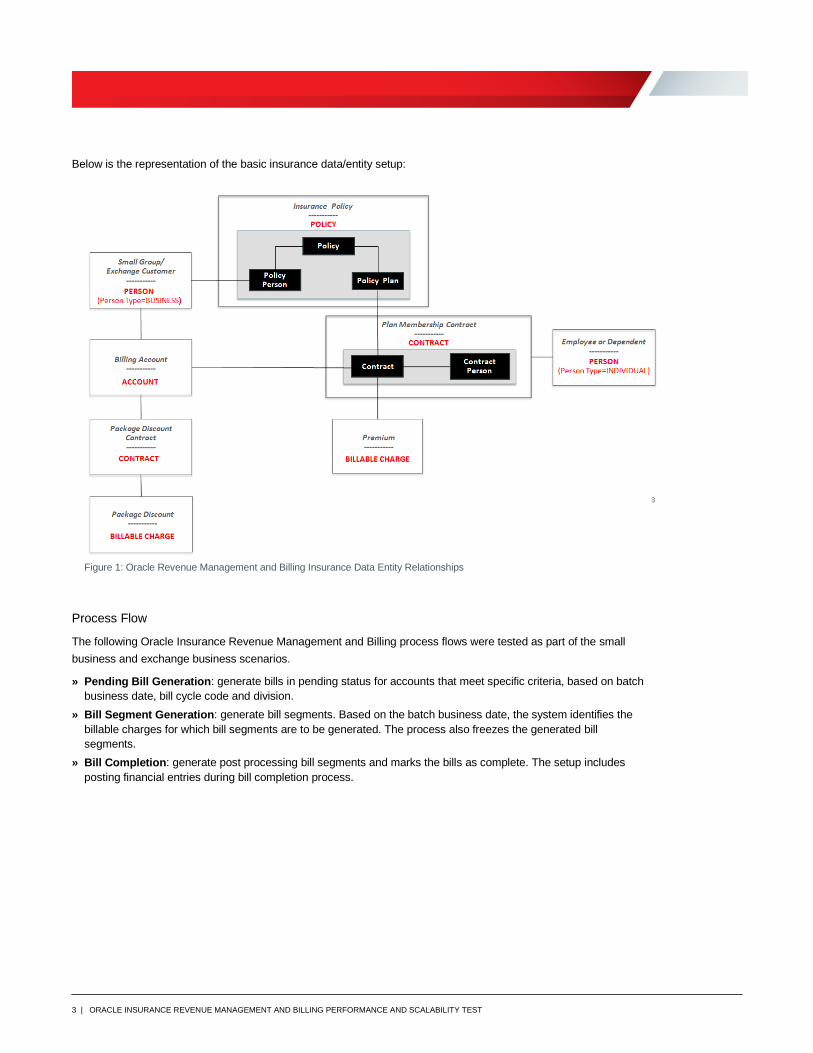
Below is the representation of the basic insurance data/entity setup:
Figure 1: Oracle Revenue Management and Billing Insurance Data Entity Relationships
Process Flow
The following Oracle Insurance Revenue Management and Billing process flows were tested as part of the small
business and exchange business scenarios.
» Pending Bill Generation: generate bills in pending status for accounts that meet specific criteria, based on batch
business date, bill cycle code and division.
» Bill Segment Generation: generate bill segments. Based on the batch business date, the system identifies the
billable charges for which bill segments are to be generated. The process also freezes the generated bill
segments.
» Bill Completion: generate post processing bill segments and marks the bills as complete. The setup includes
posting financial entries during bill completion process.

4 | ORACLE INSURANCE REVENUE MANAGEMENT AND BILLING PERFORMANCE AND SCALABILITY TEST
Methodology
The performance and scalability test described in this white paper comprised of system configuration for processing
data, loading the recurring billable charges for small business and exchange business scenarios, and processing the
billable charges to generate bills. For benchmarking purposes, data was built up to ensure none of the billable
charges went into an error state to test the peak loads conditions. A total of 70 million accounts were populated, with
two billable charges for exchange business; and 200,000 accounts were populated for small business with billable
charges varying from 10 to 100. Please refer to the entity set up section for details on data setup and configuration.
In this benchmarking exercise,
» 34 million billable charges, equally distributed across 3 billing cycles, were processed for the small business
scenario.
» 140 million billable charges, equally distributed equally across 5 billing cycles, were processed for the exchange
business scenario.
Each billable charge was processed through a complex rate schedule, which has multiple rate components and SQ
rules to calculate the premiums. Billing modules also invoked pricing crawl algorithm to derive discount rates for
each account to calculate policy discounts for small business accounts.
In Oracle Insurance Revenue Management and Billing, bills can be generated in two ways:
» Starting with the billing account and adding bill segments to the account. This is implemented in ORMB as
single job.
» Generating a blank bill and adding the bill segments to the bill. This is implemented with three jobs – pending
bill generation, bill segment generation and bill completion as described in the Process Flow section of this white
paper.
In this benchmarking exercise, the three jobs process was executed to process the recurring billable charges and
generate the bills. The bill segment generation job equally distributes the billable charges among the threads
irrespective of how billable charges are distributed across accounts and thus improves overall performance and
hardware utilization.
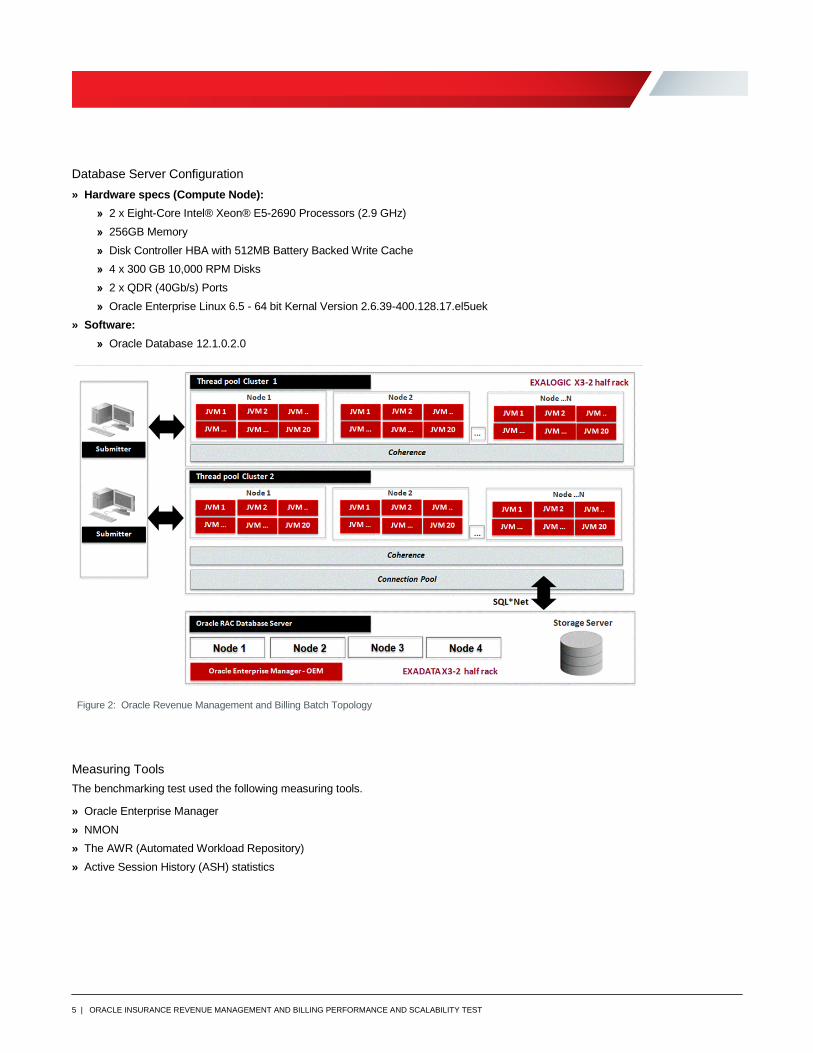
Topology and Configuration
This section describes the hardware topology of the systems used for the stress test, as well as the hardware and
software combinations used.
Batch Server Configuration
» Hardware specs (Compute Node):
» 2 x Eight-Core Intel® Xeon® E5-2690 Processors (2.9 GHz)
» 256GB Memory
» Oracle Enterprise Linux 6.5 - 64 bit Kernel Version 2.6.39-400.215.10.el6uek
» Software:
» Java 1.6.0_31
» Weblogic 10.3.6 (security update 10.3.6.0.8)
» OracleClient_11.2.0.1.0
» MicroFocusServer_WP7_Linux
» hibernate 4.1.0
5 | ORACLE INSURANCE REVENUE MANAGEMENT AND BILLING PERFORMANCE AND SCALABILITY TEST
Database Server Configuration
» Hardware specs (Compute Node):
» 2 x Eight-Core Intel® Xeon® E5-2690 Processors (2.9 GHz)
» 256GB Memory
» Disk Controller HBA with 512MB Battery Backed Write Cache
» 4 x 300 GB 10,000 RPM Disks
» 2 x QDR (40Gb/s) Ports
» Oracle Enterprise Linux 6.5 - 64 bit Kernal Version 2.6.39-400.128.17.el5uek
» Software:
» Oracle Database 12.1.0.2.0
Measuring Tools
The benchmarking test used the following measuring tools.
» Oracle Enterprise Manager
» NMON
» The AWR (Automated Workload Repository)
» Active Session History (ASH) statistics
Figure 2: Oracle Revenue Management and Billing Batch Topology

6 | ORACLE INSURANCE REVENUE MANAGEMENT AND BILLING PERFORMANCE AND SCALABILITY TEST
Small Business Benchmarking
The following data/entity setup was used for the small business benchmarking scenario.
DATA/ENTITY SETUP
Entity Volumes
Number of Accounts (Policies) 200 K
Number of Total Customers 46 million
Number of Policy Holders 11.5 million
Number of Dependents 34.5 million
Number of Contracts (Policy Plans) 600 K
Number of Bill Cycles 3
Batch Processing
11.5 million Billable charges processed with different number of threads to verify that the application is scaling with
additional hardware. Below is the combined total of time taken by the billing batches for small business:
BATCH PROCESSING TIMES
Batch Test
Executions
Number of
accounts
Number of Billable
charges
Number of
threads
Total Time
(seconds)
Combined TPS
Execution 1 70 K 11.5 million 431 6100 1900
Execution 2 70 K 11.5 million 383 6700 1730
Execution 3 70 K 11.5 million 319 8200 1410
Execution 4 70 K 11.5 million 210 10520 1100
The compute nodes of Exadata/EXALOGIC Server were used in the following manner:
COMPUTE NODES DETAILS
Sr. No. Purpose Compute Nodes Cores Comments
1 Presentation
Application
Server
1 16 1 Exalogic server used for the UI.
2 Batch Server 10 160 10 Exalogic nodes were used as batch servers
deployed in clustered mode.
3 Database Server 4 64 RAC implementation of 4 nodes of Exadata.
7 | ORACLE INSURANCE REVENUE MANAGEMENT AND BILLING PERFORMANCE AND SCALABILITY TEST
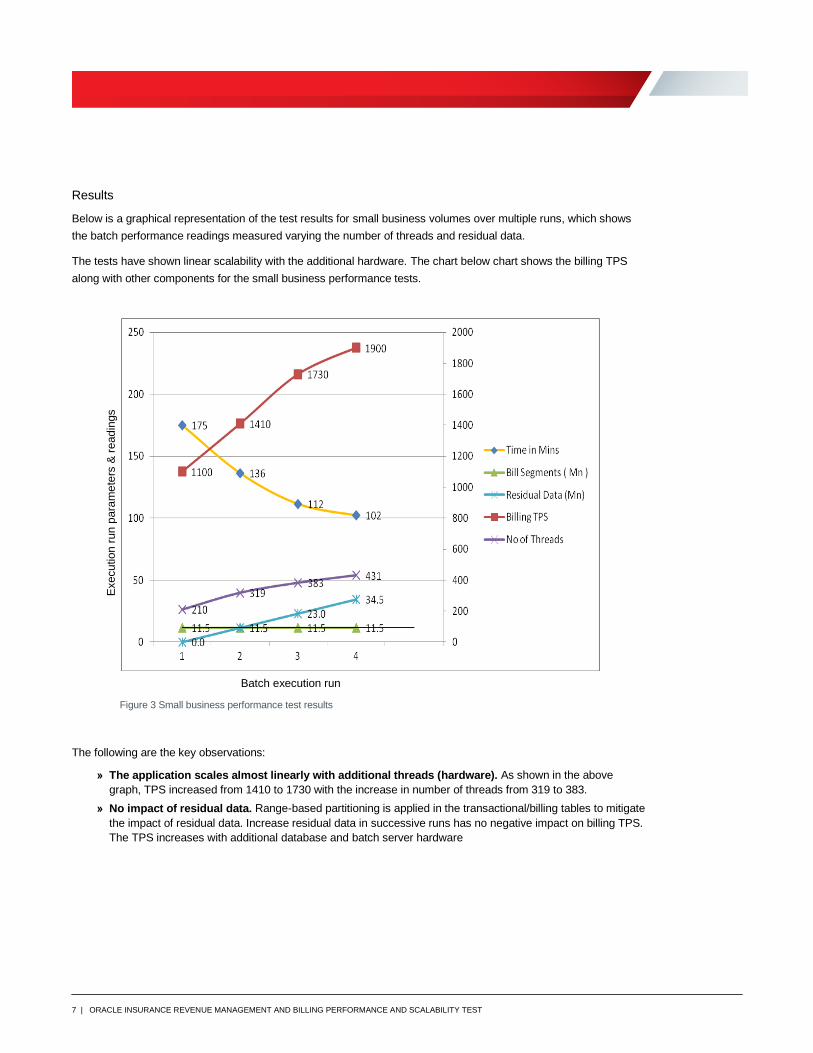
Results
Below is a graphical representation of the test results for small business volumes over multiple runs, which shows
the batch performance readings measured varying the number of threads and residual data.
The tests have shown linear scalability with the additional hardware. The chart below chart shows the billing TPS
along with other components for the small business performance tests.
Figure 3 Small business performance test results
The following are the key observations:
» The application scales almost linearly with additional threads (hardware). As shown in the above
graph, TPS increased from 1410 to 1730 with the increase in number of threads from 319 to 383.
» No impact of residual data. Range-based partitioning is applied in the transactional/billing tables to mitigate
the impact of residual data. Increase residual data in successive runs has no negative impact on billing TPS.
The TPS increases with additional database and batch server hardware
Batch execution run
Execu
tion
run
para
me
ters
& r
ead
ings

8 | ORACLE INSURANCE REVENUE MANAGEMENT AND BILLING PERFORMANCE AND SCALABILITY TEST
Figure 4 Small business performance test results with incremental hardware additions
The above graph depicts batch server and database server hardware utilization in each of the test runs and the
billing TPS achieved. The readings demonstrate that TPS is directly proportional with hardware utilization. TPS
increases with additional hardware.
BILLING TPS BREAKUP - BATCH WISE
Test Descriptions
Number of
bill/bill
segments
generated
Time taken
(in
seconds) TPS Comments
Pending Bill Generation (C1-PNDBL) 70000 (bills) 274 240 C1-PNDBL batch executed with 20
threads
Bill Segment Generation (C1-BLGEN) 11.5 million
(bill
segments)
5675 2040 C1-BLGEN batch executed with 431
threads
Bill Completion (C1-BLPPR) 66667 (bills) 197 340 C1-BLPPR executed with 200
threads
Combined TPS 6146 1900
Batch execution run
Execu
tion
run
para
me
ters
& r
ead
ings

9 | ORACLE INSURANCE REVENUE MANAGEMENT AND BILLING PERFORMANCE AND SCALABILITY TEST
CPU AND MEMORY UTILIZATION
Batch Server Database Server
Max CPU Utilization 87 % 82%
Avg. CPU Utilization 75% 72%
IOPS - 6217.38
RAM 1390 GB 381 GB
Throughput - 67.87 MB/Sec
AWR Report – Foreground Wait Classes - % of Total DB time
CLUSTER-WIDE TOTALS OF WAIT CLASS FOREGROUND WAIT TIMES AS A PERCENTAGE OF THE CLUSTER-WIDE DB
TIME
User I/O Sys I/O Other Applic Commit Network Concurrency Config Cluster DB CPU
3.10 0.00 0.26 0.17 0.00 0.69 0.30 0.56 4.26 93.38
Figure 5 Real time monitoring of database - top activity by wait class
Observations:
» Optimum DB CPU utilization
» No Contention
» Low cluster wait
» No network wait
10 | ORACLE INSURANCE REVENUE MANAGEMENT AND BILLING PERFORMANCE AND SCALABILITY TEST
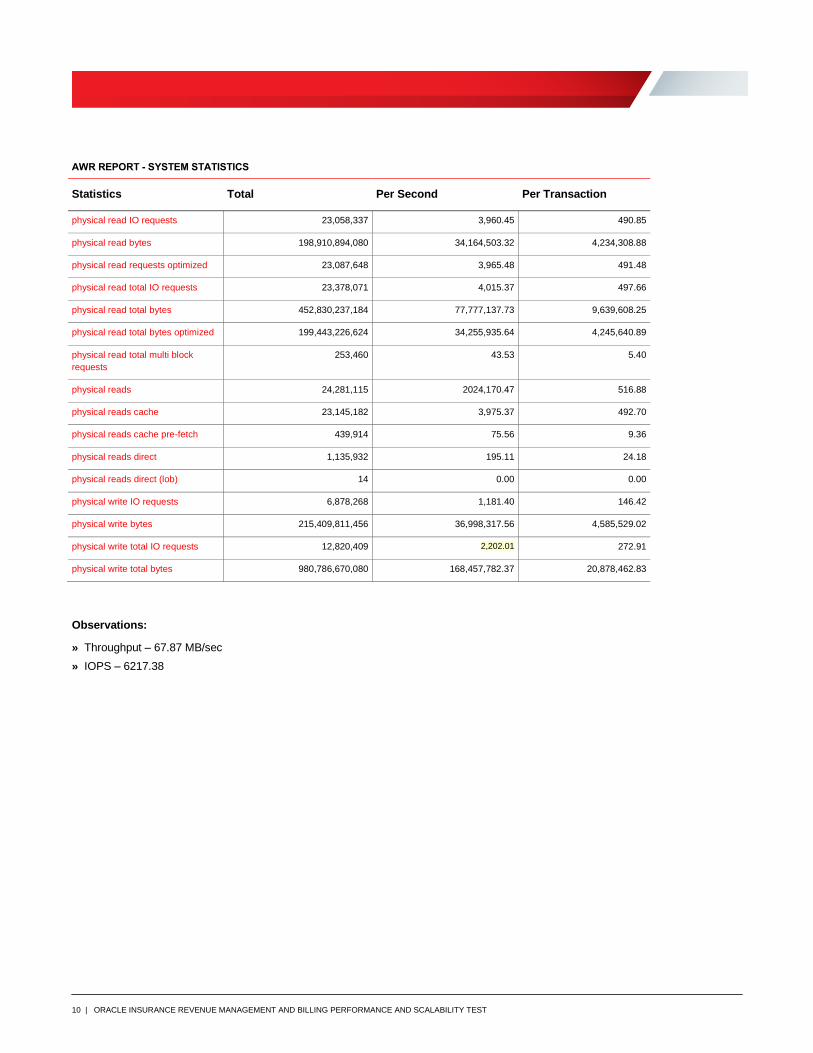
AWR REPORT - SYSTEM STATISTICS
Statistics Total Per Second Per Transaction
physical read IO requests 23,058,337 3,960.45 490.85
physical read bytes 198,910,894,080 34,164,503.32 4,234,308.88
physical read requests optimized 23,087,648 3,965.48 491.48
physical read total IO requests 23,378,071 4,015.37 497.66
physical read total bytes 452,830,237,184 77,777,137.73 9,639,608.25
physical read total bytes optimized 199,443,226,624 34,255,935.64 4,245,640.89
physical read total multi block
requests
253,460 43.53 5.40
physical reads 24,281,115 2024,170.47 516.88
physical reads cache 23,145,182 3,975.37 492.70
physical reads cache pre-fetch 439,914 75.56 9.36
physical reads direct 1,135,932 195.11 24.18
physical reads direct (lob) 14 0.00 0.00
physical write IO requests 6,878,268 1,181.40 146.42
physical write bytes 215,409,811,456 36,998,317.56 4,585,529.02
physical write total IO requests 12,820,409 2,202.01 272.91
physical write total bytes 980,786,670,080 168,457,782.37 20,878,462.83
Observations:
» Throughput – 67.87 MB/sec
» IOPS – 6217.38

11 | ORACLE INSURANCE REVENUE MANAGEMENT AND BILLING PERFORMANCE AND SCALABILITY TEST
Exchange Business Benchmarking
The following data/entity setup was used for the exchange business benchmarking scenario.
DATA/ENTITY SETUP
Entity Volumes
Number of Accounts (Policy) 70 million
Number of Total Customers 280 million
Number of Policy Holders 70 million
Number of Dependents 210 million
Number of Contracts (Policy Plans) 140 million
Number of Bill Cycles 5
Batch Processing
28 million billable charges processed with different number of threads to verify that the application is scaling with
additional hardware. Below is the combined total of time taken by the billing batches for the exchange business.
BATCH PROCESSING TIMES
Batch Test
Execution
Number of
accounts
Number of Billable
charges
Number of
threads
Total Time
(minutes)
Combined TPS
Execution 1 14 million 28 million 594 360 1300
Execution 2 14 million 28 million 486 380 1230
Execution 3 14 million 28 million 396 450 1040
Execution 4 14 million 28 million 321 515 910
Execution 5 14 million 28 million 242 625 750
The compute nodes of Exadata/EXALOGIC Server were used in the following manner.
COMPUTE NODES DETAILS
Sr. No. Purpose Compute Nodes Cores Comments
1 Presentation
Application
Server
1 16 1 Exalogic server used for the UI.
2 Batch Server 13 144 13 Exalogic nodes were used as batch servers
deployed in clustered mode.
3 Database Server 4 64 RAC implementation of 4 nodes of Exadata.

12 | ORACLE INSURANCE REVENUE MANAGEMENT AND BILLING PERFORMANCE AND SCALABILITY TEST
Results
Below is a graphical representation of the test results for exchange volumes over multiple runs, which shows the
batch performance readings measured, with varying number of threads and residual data.
Figure 6 Exchange business test results
The following are the key observations:
» The application scales almost linearly with additional threads (hardware). As shown in the graph, TPS
increased from 1040 to 1230 with the increase in number of threads from 396 to 486.
» No impact of residual data. Range-based partitioning is applied in the transactional/billing tables to mitigate
the impact of residual data. Increase residual data in successive runs has no negative impact on billing TPS.
The TPS increases with additional database and batch server hardware.
Batch execution run
Execu
tion
run
para
me
ters
& r
ead
ings
13 | ORACLE INSURANCE REVENUE MANAGEMENT AND BILLING PERFORMANCE AND SCALABILITY TEST
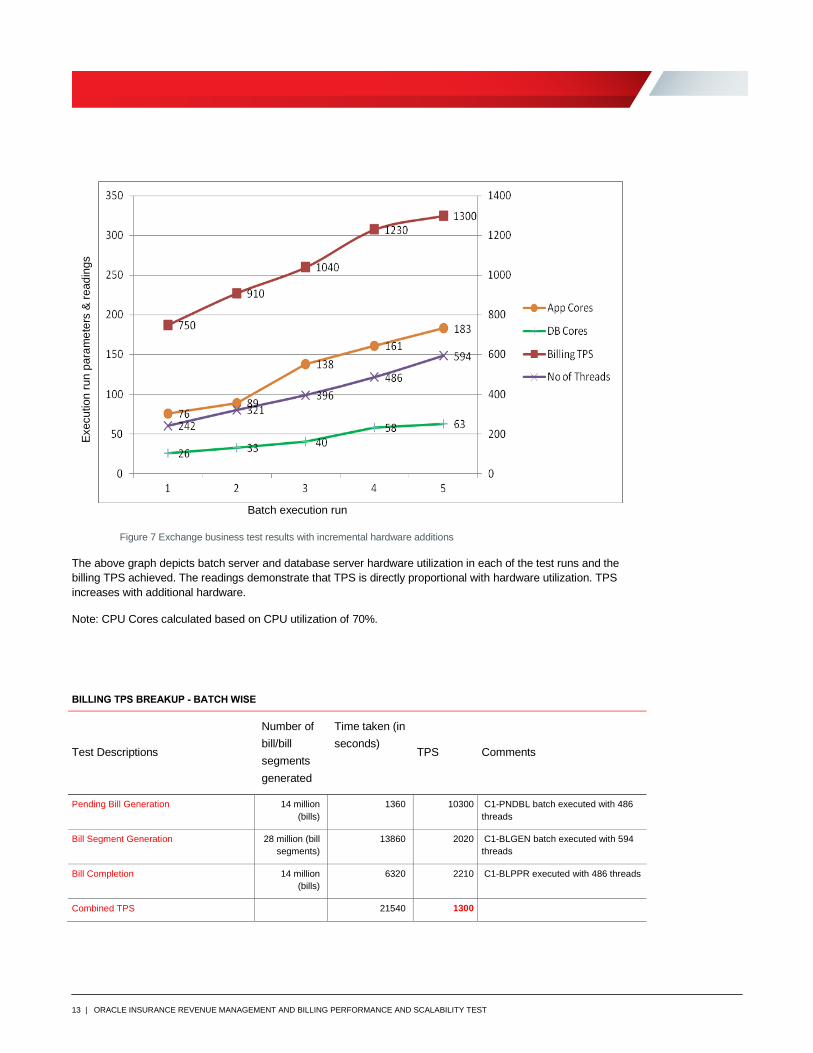
Figure 7 Exchange business test results with incremental hardware additions
The above graph depicts batch server and database server hardware utilization in each of the test runs and the
billing TPS achieved. The readings demonstrate that TPS is directly proportional with hardware utilization. TPS
increases with additional hardware.
Note: CPU Cores calculated based on CPU utilization of 70%.
BILLING TPS BREAKUP - BATCH WISE
Test Descriptions
Number of
bill/bill
segments
generated
Time taken (in
seconds) TPS Comments
Pending Bill Generation 14 million
(bills)
1360 10300 C1-PNDBL batch executed with 486
threads
Bill Segment Generation 28 million (bill
segments)
13860 2020 C1-BLGEN batch executed with 594
threads
Bill Completion 14 million
(bills)
6320 2210 C1-BLPPR executed with 486 threads
Combined TPS 21540 1300
Execu
tion
run
para
me
ters
& r
ead
ings
Batch execution run
14 | ORACLE INSURANCE REVENUE MANAGEMENT AND BILLING PERFORMANCE AND SCALABILITY TEST
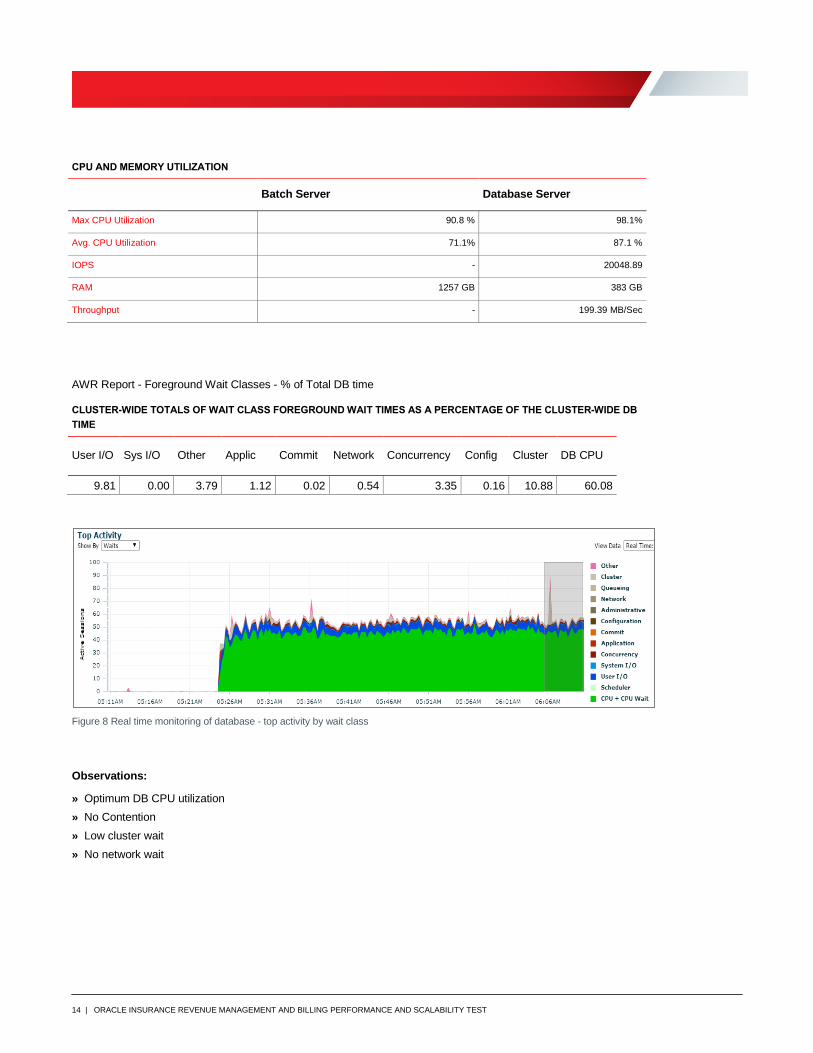
CPU AND MEMORY UTILIZATION
Batch Server Database Server
Max CPU Utilization 90.8 % 98.1%
Avg. CPU Utilization 71.1% 87.1 %
IOPS - 20048.89
RAM 1257 GB 383 GB
Throughput - 199.39 MB/Sec
AWR Report - Foreground Wait Classes - % of Total DB time
CLUSTER-WIDE TOTALS OF WAIT CLASS FOREGROUND WAIT TIMES AS A PERCENTAGE OF THE CLUSTER-WIDE DB
TIME
User I/O Sys I/O Other Applic Commit Network Concurrency Config Cluster DB CPU
9.81 0.00 3.79 1.12 0.02 0.54 3.35 0.16 10.88 60.08
Figure 8 Real time monitoring of database - top activity by wait class
Observations:
» Optimum DB CPU utilization
» No Contention
» Low cluster wait
» No network wait

15 | ORACLE INSURANCE REVENUE MANAGEMENT AND BILLING PERFORMANCE AND SCALABILITY TEST
AWR REPORT - SYSTEM STATISTICS
Statistics Total Per Second Per Transaction
physical read IO requests 238,138,426 16,936.97 2,133.47
physical read bytes 2,225,409,785,856 158,276,408.07 19,937,374.90
physical read requests optimized 236,993,131 16,855.51 2,123.21
physical read total IO requests 238,973,095 16,996.33 2,140.95
physical read total bytes 2,877,600,698,880 204,661,767.85 25,780,332.37
physical read total bytes optimized 2,217,525,993,472 157,715,694.11 19,866,744.25
physical read total multi block
requests
924,674 65.77 8.28
physical reads 271,656,468 19,320.85 2,433.76
physical reads cache 242,021,793 17,213.16 2,168.27
physical reads cache pre-fetch 5,527,776 393.15 49.52
physical reads direct 29,629,178 2,107.30 265.45
physical reads direct (lob) 80 0.01 0.00
physical write IO requests 35,651,098 2,535.59 319.4
physical write bytes 714,266,157,056 50,800,307.38 6,399,087.59
physical write total IO requests 42,919,796 3,052.56 384.52
physical write total bytes 3,124,526,112,768 222,223,697.40 27,992,529.23
Observations:
» Throughput – 199.39 MB/sec
» IOPS – 20048.89
Conclusions
The performance benchmark performed on Oracle Insurance Revenue Management and Billing V.2.4 demonstrates
that the application can meet the performance requirements of the healthcare industry for small group and exchange
business (individual) premium billing. In fact, this benchmark exercise showed that Oracle Insurance Revenue
Management and Billing can process premium bills for 56 million individual policies – almost three times
the total number of individual policies in the US – in a single day.
» The benchmarking exercise demonstrated that Oracle Insurance Revenue Management and Billing v2.4 is able to
process 11.5 million billable charges at a combined TPS of 1900 for small business and 28 million billable
charges at a combined TPS of 1300 for exchange business using compute nodes of Exalogic X3-2 as the
application tier and half rack of Exadata x3-2 server as the database tier.
» The Oracle Insurance Revenue Management and Billing v2.4 application’s ability to scale near- linearly was
proven both vertically and horizontally. The billing job shows near-linear scalability up to the point where
throughput becomes limited by hardware resources.

16 | ORACLE INSURANCE REVENUE MANAGEMENT AND BILLING PERFORMANCE AND SCALABILITY TEST
» Overall billing TPS is better for small business as the number of accounts is less. ‘Pending Bill Generation’ (C1-
PNDBL) and ‘Bill Completion’ (C1-BLPPR) are account based batches showing significantly better performance
for small business.
» The results from this Exadata X3-2 benchmark shows an improvement of a two times higher processing rate
relative to the prior baseline benchmark conducted. This improvement is determined to be primarily associated
with the architectural and design changes made in the software for better throughput and memory utilizations. A
few of the prominent contributors for this extreme performance are:
» By modeling the code coupling method using range-based partitioning strategies for distributed processing
across partitions (with isolation and data pruning), we were able to achieve negligible concurrency,
contentions and wait events on the database.
» Introduction of new indexes and change in the billable charge selection logic in Bill segment generation
batch.
» Software tuning and parameterization to suit the hardware resources to ensure optimum performance with
scalability
» Leveraging the various performance features of Exadata hardware.
Oracle Corporation, World Headquarters Worldwide Inquiries
500 Oracle Parkway Phone: +1.650.506.7000
Redwood Shores, CA 94065, USA Fax: +1.650.506.7200
Copyright © 2016, Oracle and/or its affiliates. All rights reserved. This document is provided for information purposes only, and the
contents hereof are subject to change without notice. This document is not warranted to be error-free, nor subject to any other warranties or conditions, whether expressed orally or implied in law, including implied warranties and conditions of merchantability or fitness for a particular purpose. We specifically disclaim any liability with respect to this document, and no contractual obligations are formed either directly or indirectly by this document. This document may not be reproduced or transmitted in any form or by any means, electronic or mechanical, for any purpose, without our prior written permission. Oracle and Java are registered trademarks of Oracle and/or its affiliates. Other names may be trademarks of their respective owners. Intel and Intel Xeon are trademarks or registered trademarks of Intel Corporation. All SPARC trademarks are used under license and are trademarks or registered trademarks of SPARC International, Inc. AMD, Opteron, the AMD logo, and the AMD Opteron logo are trademarks or registered trademarks of Advanced Micro Devices. UNIX is a registered trademark of The Open Group. 0216 White Paper Title: Oracle Insurance Revenue Management and Billing V2.4.0.1.0 Performance and Scalability Test on Exalogic X3-2 and Exadata X3-2: Healthcare Industry Benchmark February 2016
C O N N E C T W I T H U S
blogs.oracle.com/insurance
facebook.com/oracleinsurance
twitter.com/oracleinsurance
oracle.com/insurance


