Ocean Water Masses-T-S Diagramsand Upper Ocean Waters
C. Chen
General Physical OceanographyMAR 555
School for Marine Sciences and TechnologyUmass-Dartmouth
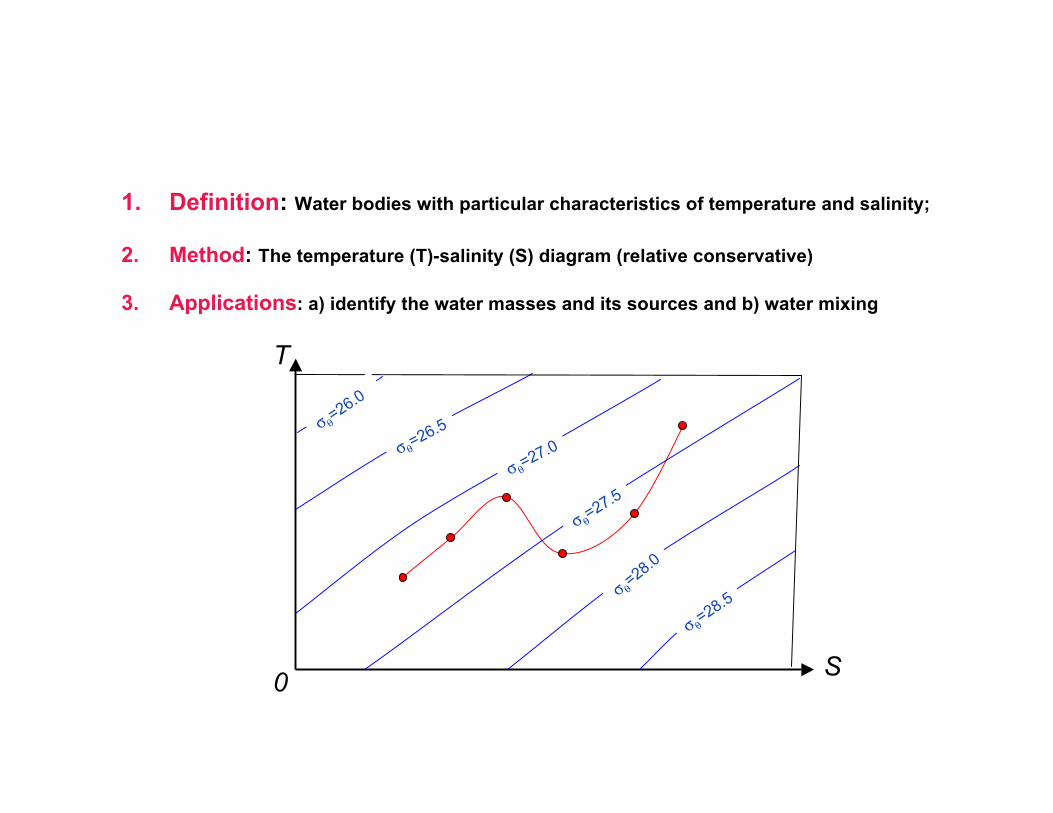
1. Definition: Water bodies with particular characteristics of temperature and salinity;
2. Method: The temperature (T)-salinity (S) diagram (relative conservative)
3. Applications: a) identify the water masses and its sources and b) water mixing
T
S0
σ θ=26.0
σθ=26.5
σθ=27.0
σ θ=27.5
σ θ=28.0
σ θ=28.5
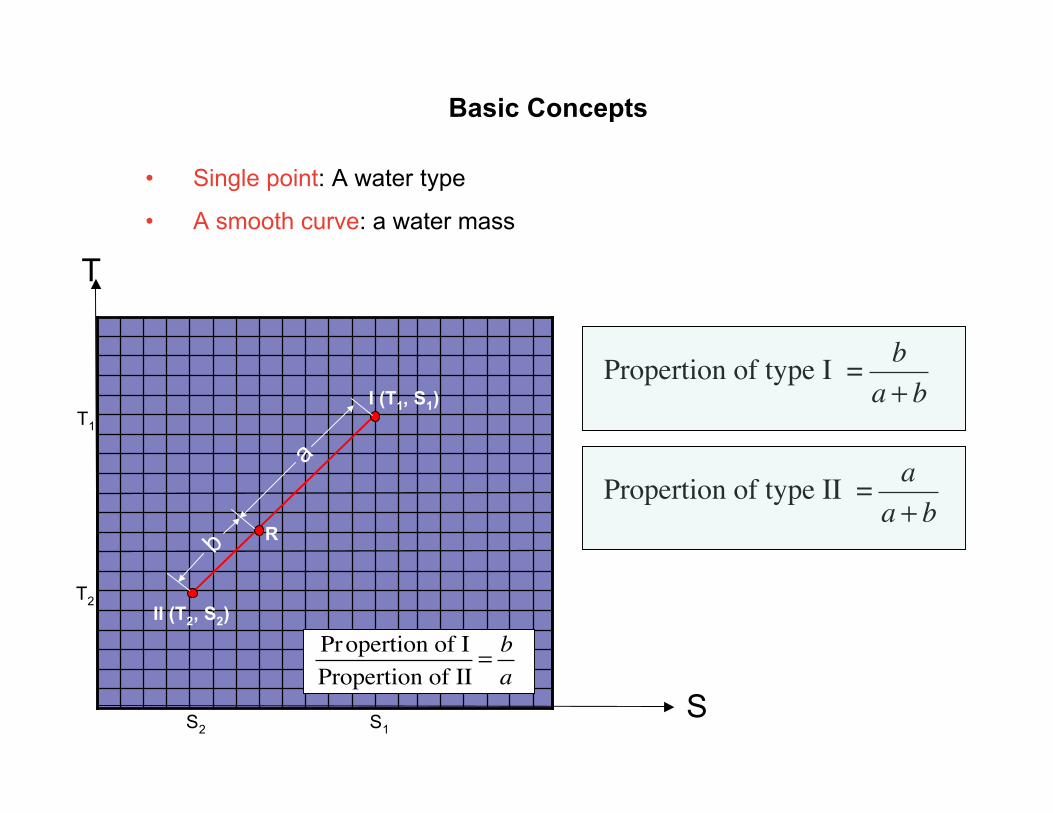
Basic Concepts
• Single point: A water type
• A smooth curve: a water mass
�
Propertion of I
Propertion of II=b
a
S
T
II (T2, S2)
I (T1, S1)
R
a
b
S2 S1
T2
T1
�
Propertion of type I =b
a + b
�
Propertion of type II =a
a + b
�
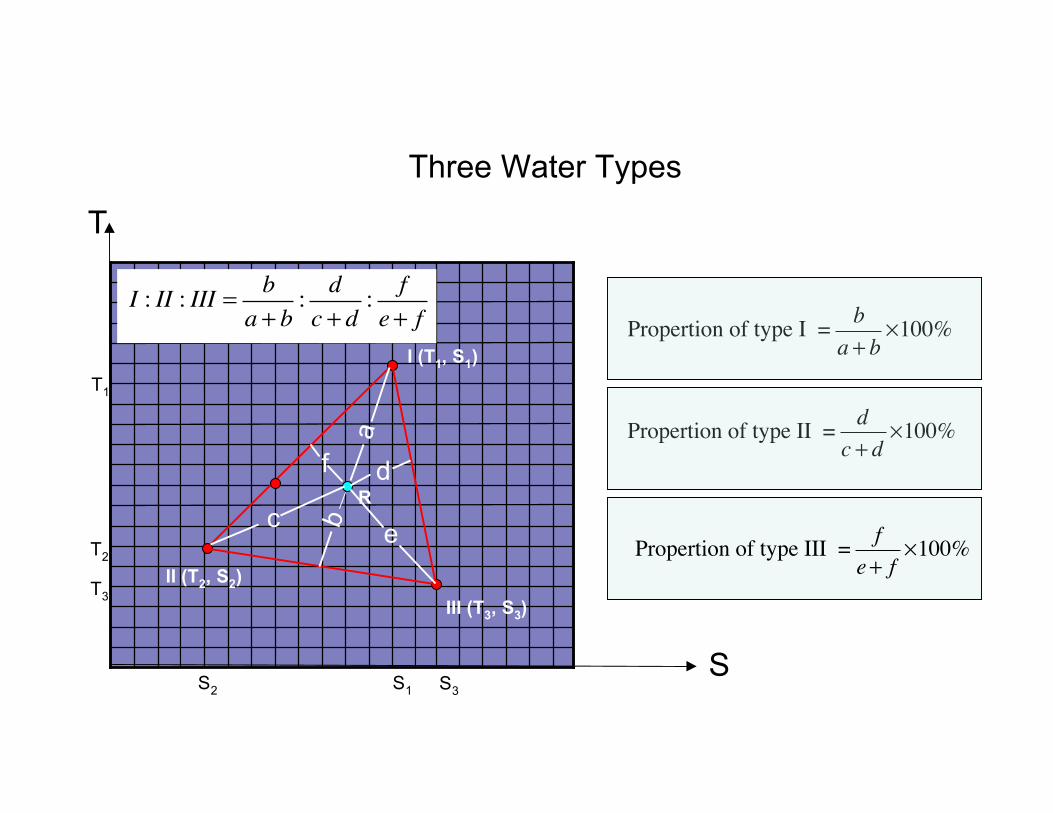
I : II : III =b
a + b:d
c + d:
f
e+ f
S
T
II (T2, S2)
I (T1, S1)
R
ab
S2 S1
T2
T1
III (T3, S3)
c
d
e
f
S3
T3
�
Propertion of type I =b
a + b!100%
�
Propertion of type II =d
c + d!100%
�
Propertion of type III =f
e+ f!100%
Three Water Types
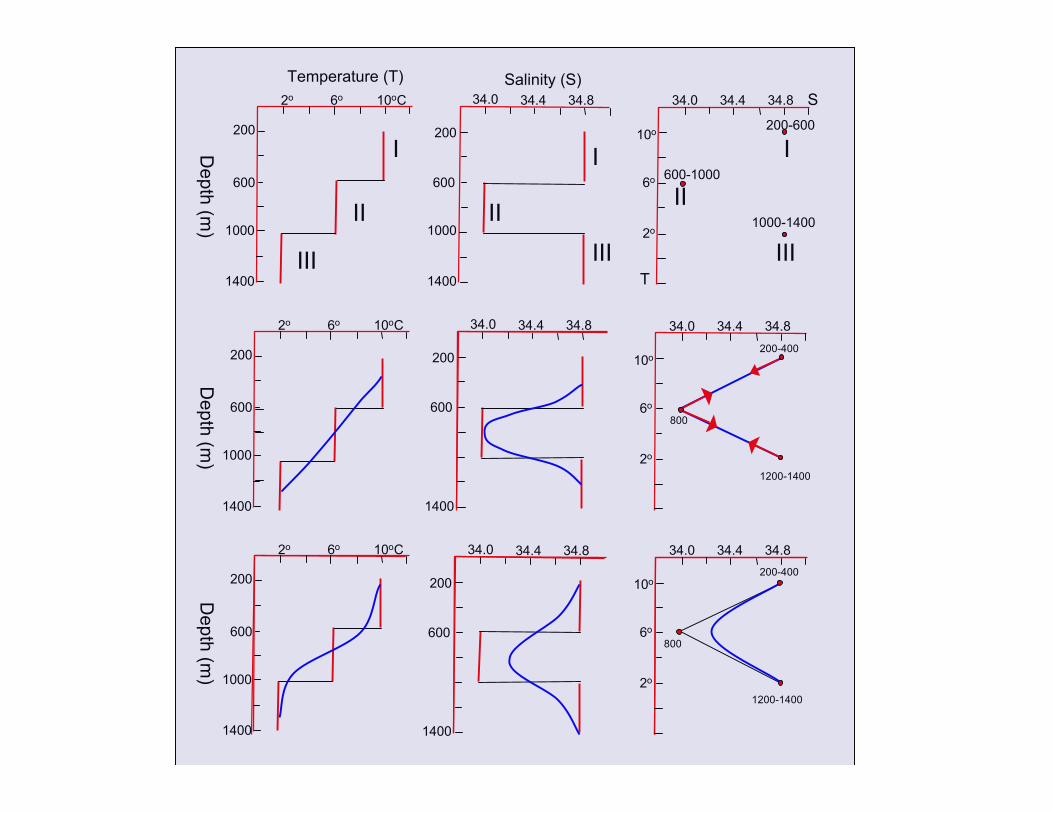
Temperature (T)
I
II
III
I
II
III
200-600
600-1000
1000-1400
I
II
III
2o
200
600
1000
1400
6o 10oC
2o
200
600
1000
1400
6o 10oC
2o
200
600
1000
1400
6o 10oC
1000
34.0 34.4 34.8
200
600
1400
34.0 34.4 34.8
200
600
1400
34.0 34.4 34.8
200
600
1400
34.0 34.4 34.8
10o
6o
2o
34.0 34.4 34.8
10o
6o
2o
34.0 34.4 34.8
10o
6o
2o
800
200-400
1200-1400
800
200-400
1200-1400
Depth (m
)D
epth (m)
Depth (m
)
Salinity (S) S
T
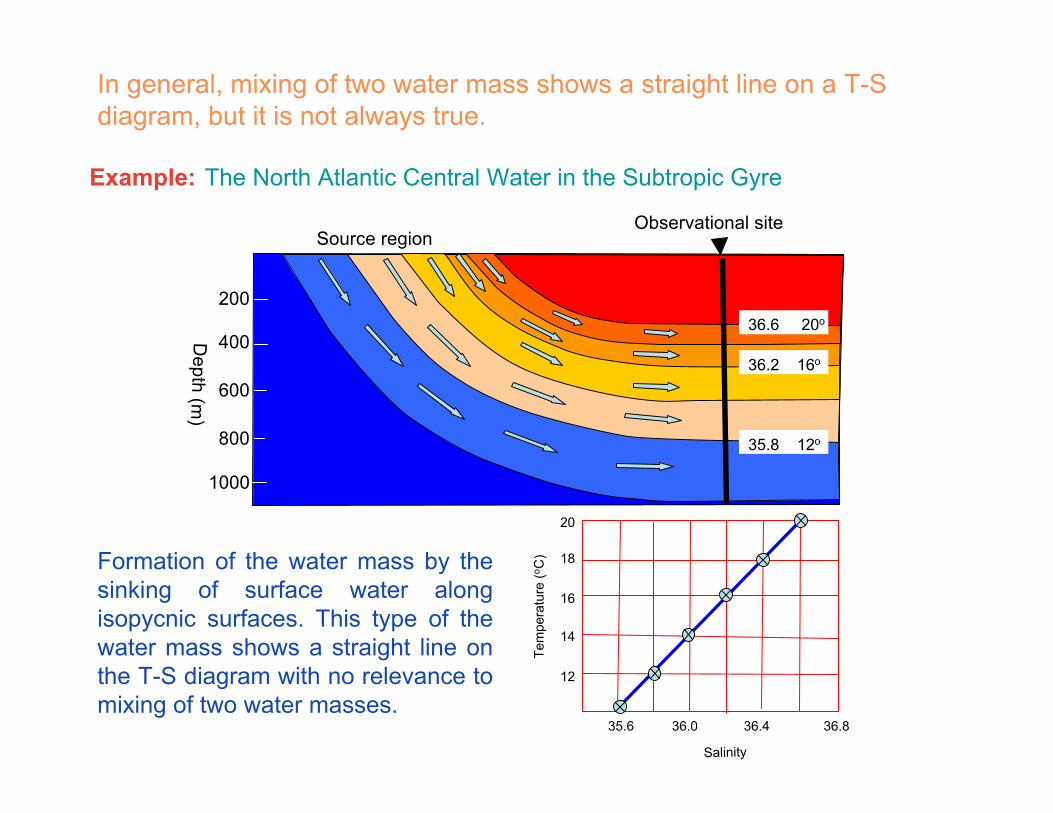
In general, mixing of two water mass shows a straight line on a T-Sdiagram, but it is not always true.
Example: The North Atlantic Central Water in the Subtropic Gyre
Observational site
200
400
600
800
1000
Depth (m
)
Source region
36.6 20o
36.2 16o
35.8 12o
35.6 36.0 36.4 36.8
20
16
12
18
14
Tem
pera
ture
(o C)
Salinity
Formation of the water mass by thesinking of surface water alongisopycnic surfaces. This type of thewater mass shows a straight line onthe T-S diagram with no relevance tomixing of two water masses.
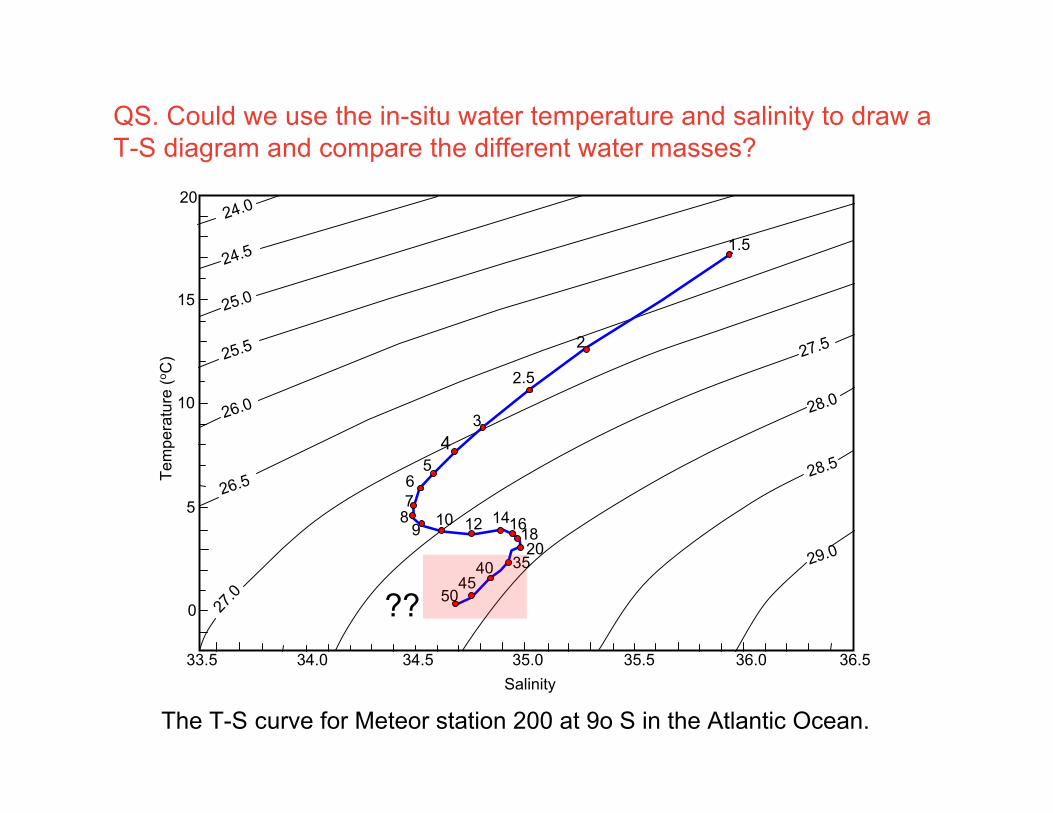
QS. Could we use the in-situ water temperature and salinity to draw aT-S diagram and compare the different water masses?
Salinity
24.0
24.5
25.0
25.5
26.5
26.0
27.0
27.5
28.0
28.5
29.0
1.5
2
2.5
34
6 5
7 8
9 10 12 16141820
354045
50
20
15
5
10
0
33.5 34.0 34.5 35.0 35.5 36.0 36.5
Tem
pera
ture
(o C)
??
The T-S curve for Meteor station 200 at 9o S in the Atlantic Ocean.
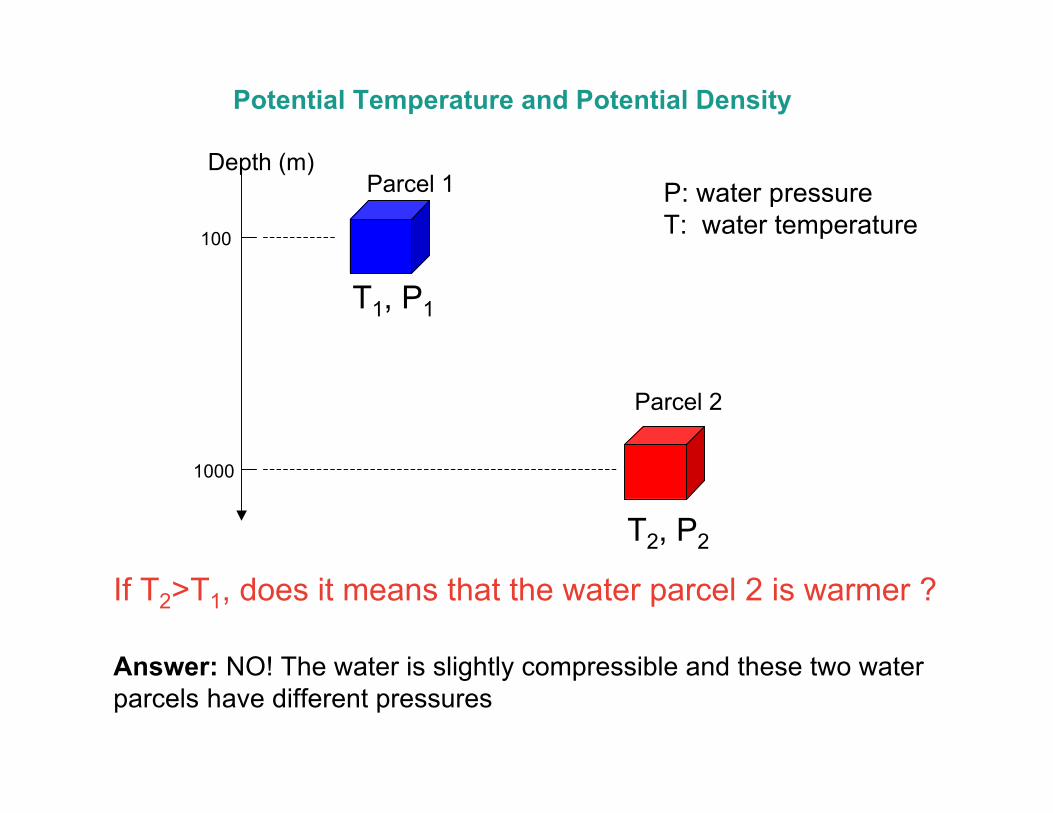
Potential Temperature and Potential Density
Depth (m)
100
1000
Parcel 1
Parcel 2
T1, P1
T2, P2
P: water pressureT: water temperature
If T2>T1, does it means that the water parcel 2 is warmer ?
Answer: NO! The water is slightly compressible and these two waterparcels have different pressures
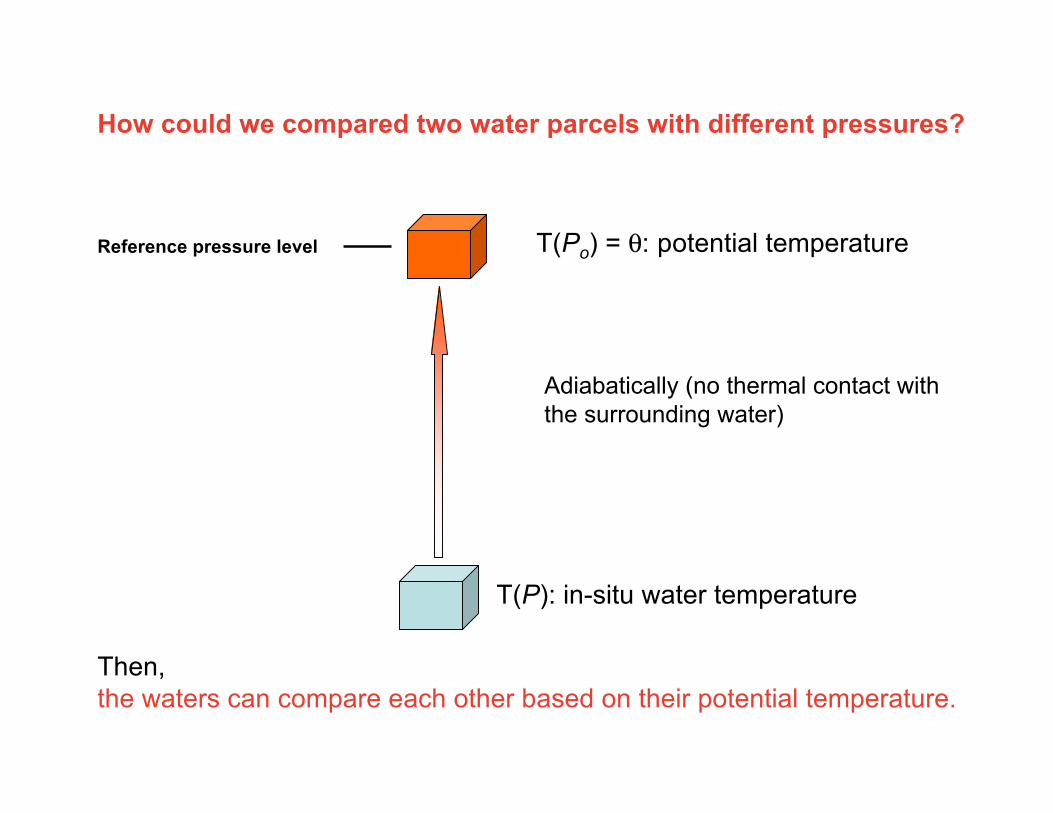
How could we compared two water parcels with different pressures?
T(P): in-situ water temperature
T(Po) = θ: potential temperature
Adiabatically (no thermal contact withthe surrounding water)
Reference pressure level
Then,the waters can compare each other based on their potential temperature.
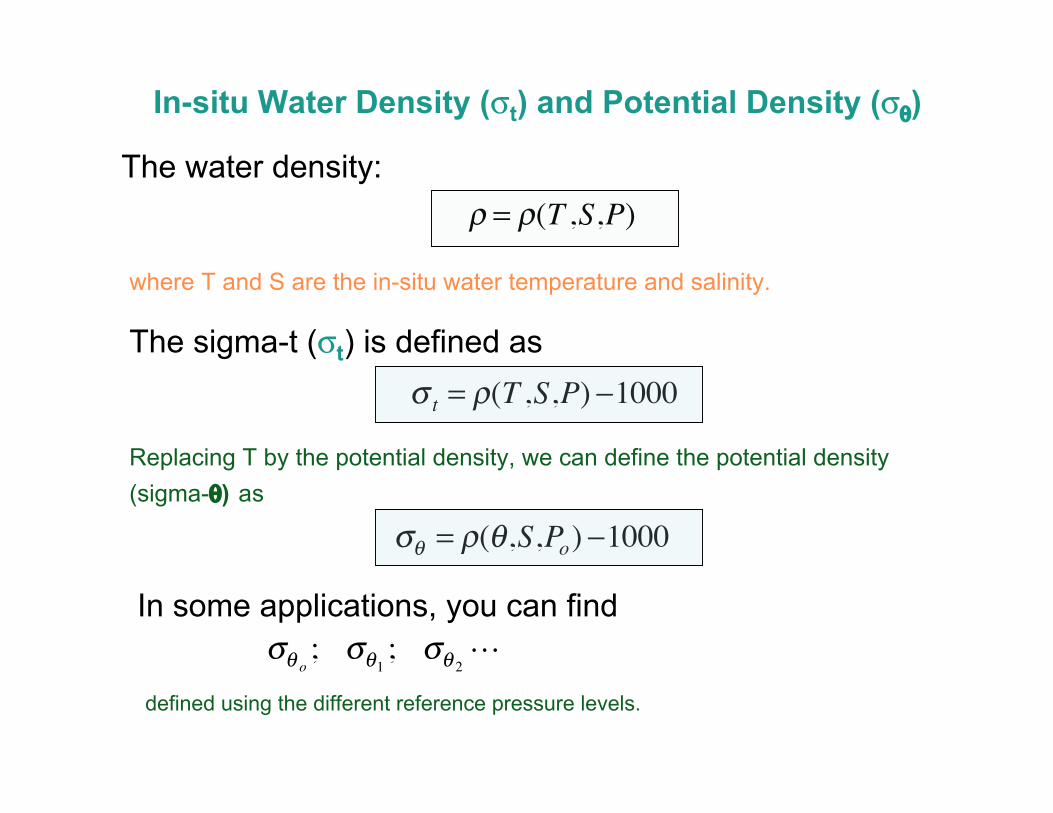
In-situ Water Density (σt) and Potential Density (σθ)
The water density:
�
! = !(T ,S,P)
where T and S are the in-situ water temperature and salinity.
The sigma-t (σt) is defined as
�
!t
= "(T ,S,P) #1000
Replacing T by the potential density, we can define the potential density(sigma-θ) as
�
!" = #(",S,Po) $1000
In some applications, you can find
�
!"o
; !"1; !
" 2!
defined using the different reference pressure levels.
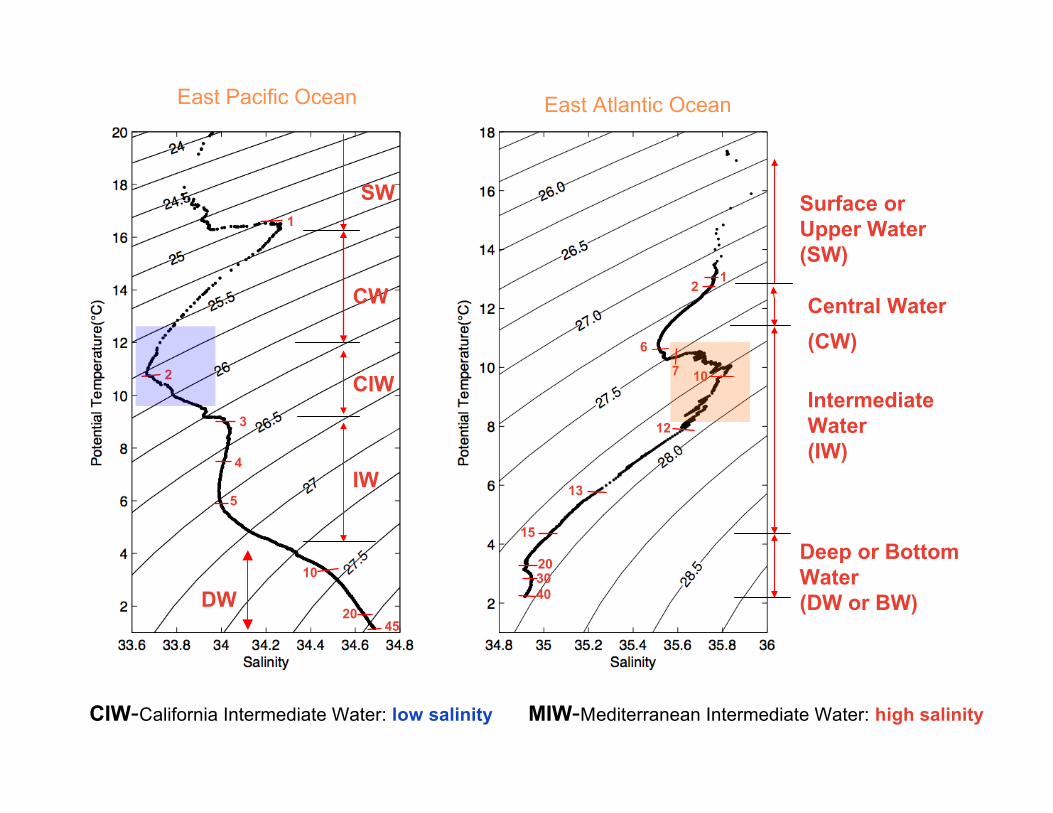
East Pacific Ocean East Atlantic Ocean
2
6
107
12
13
15
203040
1
2
3
4
5
10
2045
1
Surface or Upper Water(SW)
Central Water(CW)
IntermediateWater(IW)
Deep or BottomWater(DW or BW)
SW
CW
CIW
IW
DW
CIW-California Intermediate Water: low salinity MIW-Mediterranean Intermediate Water: high salinity
West N. PacificCentral Water
East N. PacificCentral Water
Pacific Equatorial Water
West S. PacificCentral Water East S. Pacific
Central Water
SubantarcticSurface Water
Subantarctic Surface Water
Pacific Subarctic Upper Water
West N.AtlanticCentralWater
East N.AtlanticCentralWater
Atlantic Equatorial Water
S AtlanticCentralWater
Subantarctic Surface Water
Subantarctic Surface
Water
Atlantic Subarctic
Upper Water
Indian EquatorialWater
S. Indian Central Water
Subantarctic Surface Water
Subantarctic Surface Water
Arab SeaWater
Bengal
Bay Water
Indonesia Upper Water
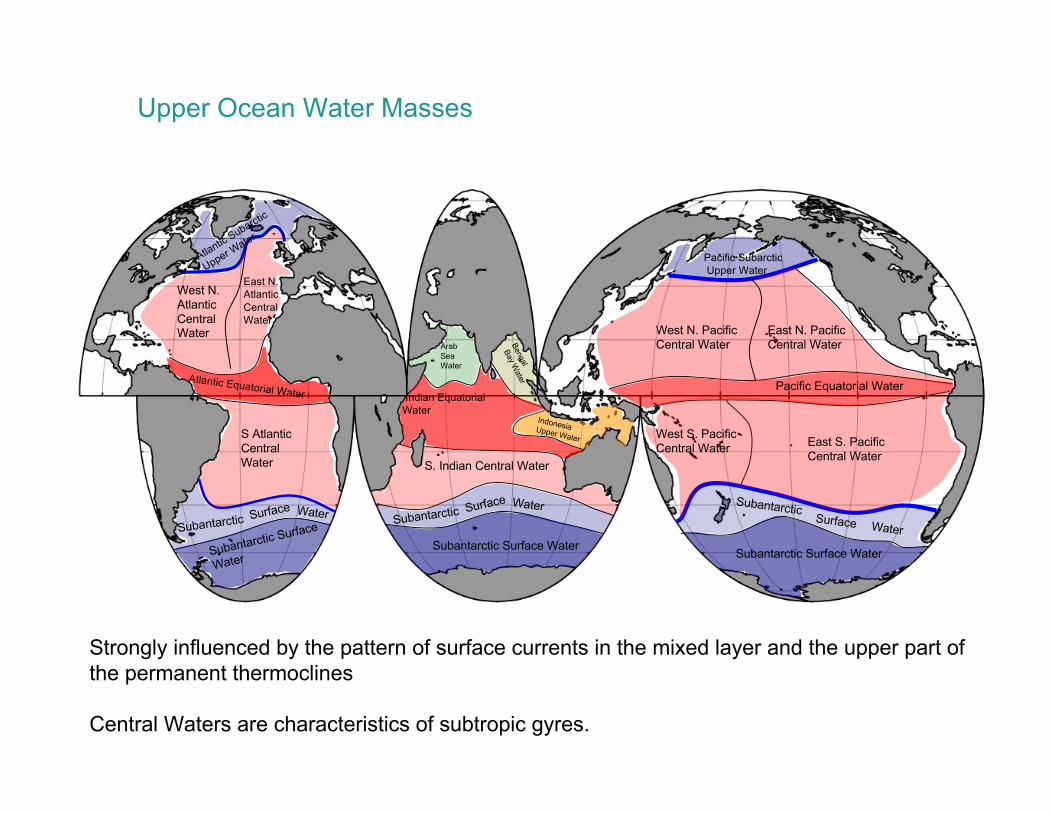
Upper Ocean Water Masses
Strongly influenced by the pattern of surface currents in the mixed layer and the upper part ofthe permanent thermoclines
Central Waters are characteristics of subtropic gyres.
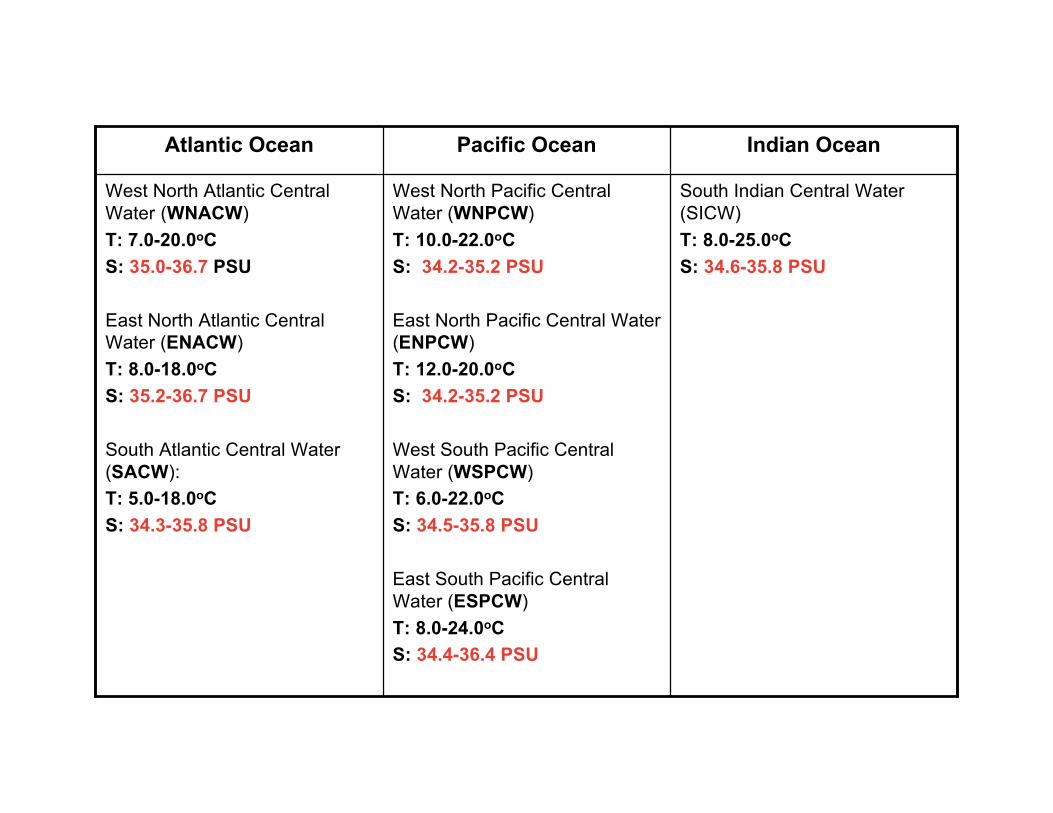
South Indian Central Water(SICW)T: 8.0-25.0oCS: 34.6-35.8 PSU
West North Pacific CentralWater (WNPCW)T: 10.0-22.0oCS: 34.2-35.2 PSU
East North Pacific Central Water(ENPCW)T: 12.0-20.0oCS: 34.2-35.2 PSU
West South Pacific CentralWater (WSPCW)T: 6.0-22.0oCS: 34.5-35.8 PSU
East South Pacific CentralWater (ESPCW)T: 8.0-24.0oCS: 34.4-36.4 PSU
West North Atlantic CentralWater (WNACW)T: 7.0-20.0oCS: 35.0-36.7 PSU
East North Atlantic CentralWater (ENACW)T: 8.0-18.0oCS: 35.2-36.7 PSU
South Atlantic Central Water(SACW):T: 5.0-18.0oCS: 34.3-35.8 PSU
Indian OceanPacific OceanAtlantic Ocean
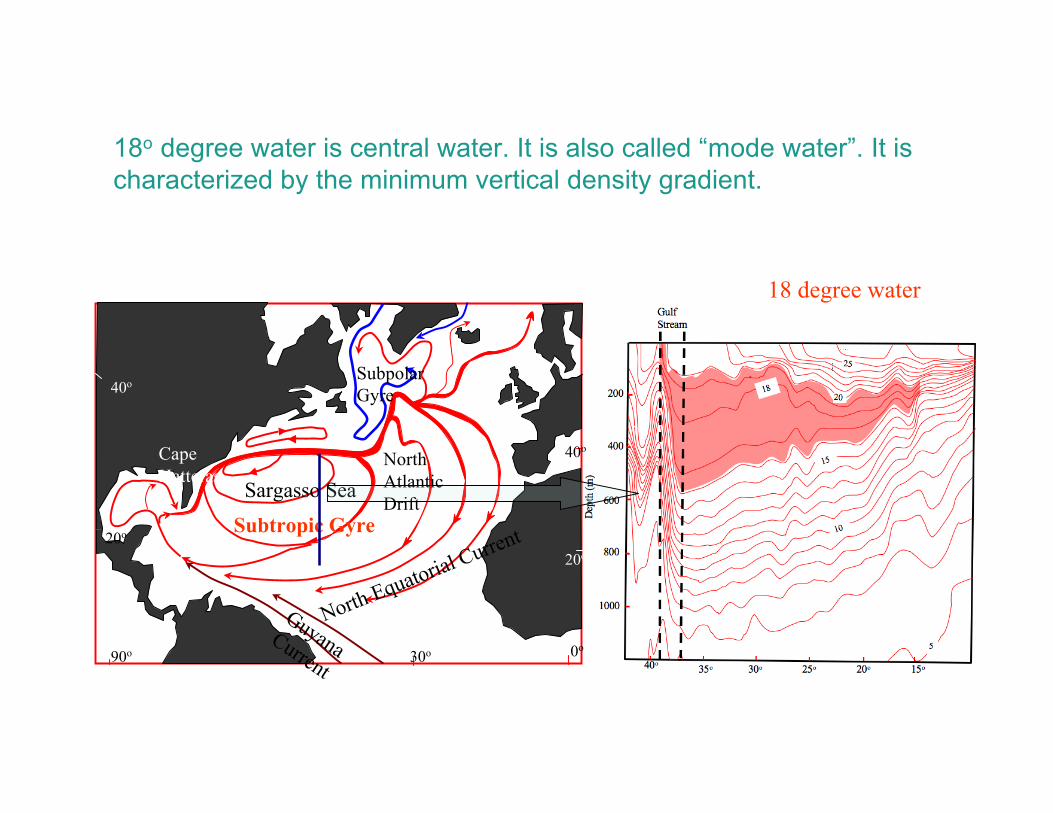
Sargasso SeaSubtropic Gyre
CapeHatteras
GuyanaCurrent
North Equatorial Current
North AtlanticDrift
Subpolar Gyre
90o 30o 0o
20o
40o
40o
20o
18 degree water
18o degree water is central water. It is also called “mode water”. It ischaracterized by the minimum vertical density gradient.
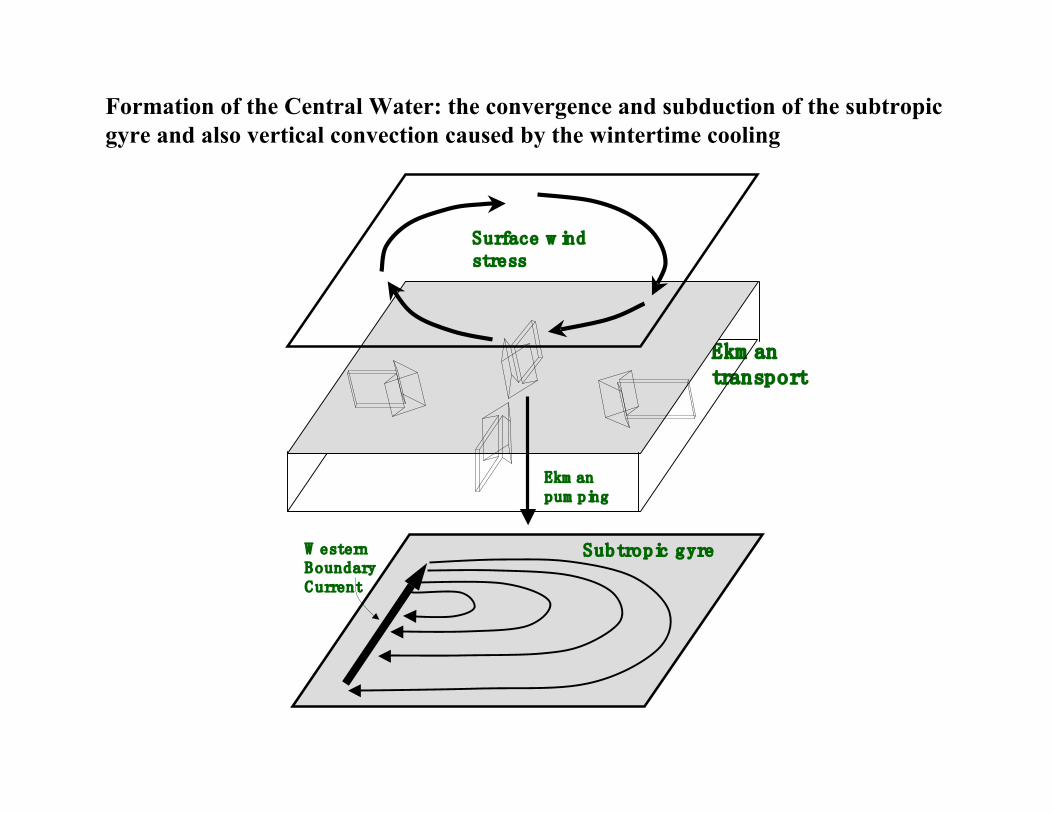
Ekm antransport
Surface w indstress
Ekm anpum ping
Subtropic gyreW esternBoundaryC urrent
Formation of the Central Water: the convergence and subduction of the subtropicgyre and also vertical convection caused by the wintertime cooling
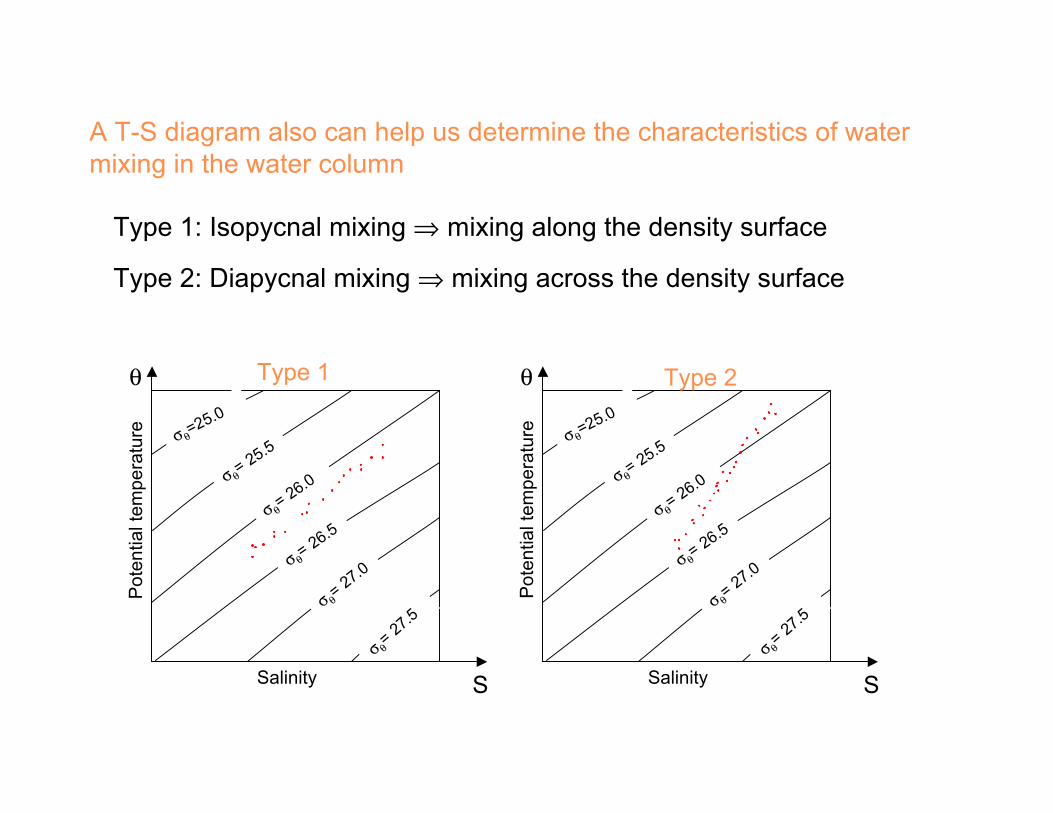
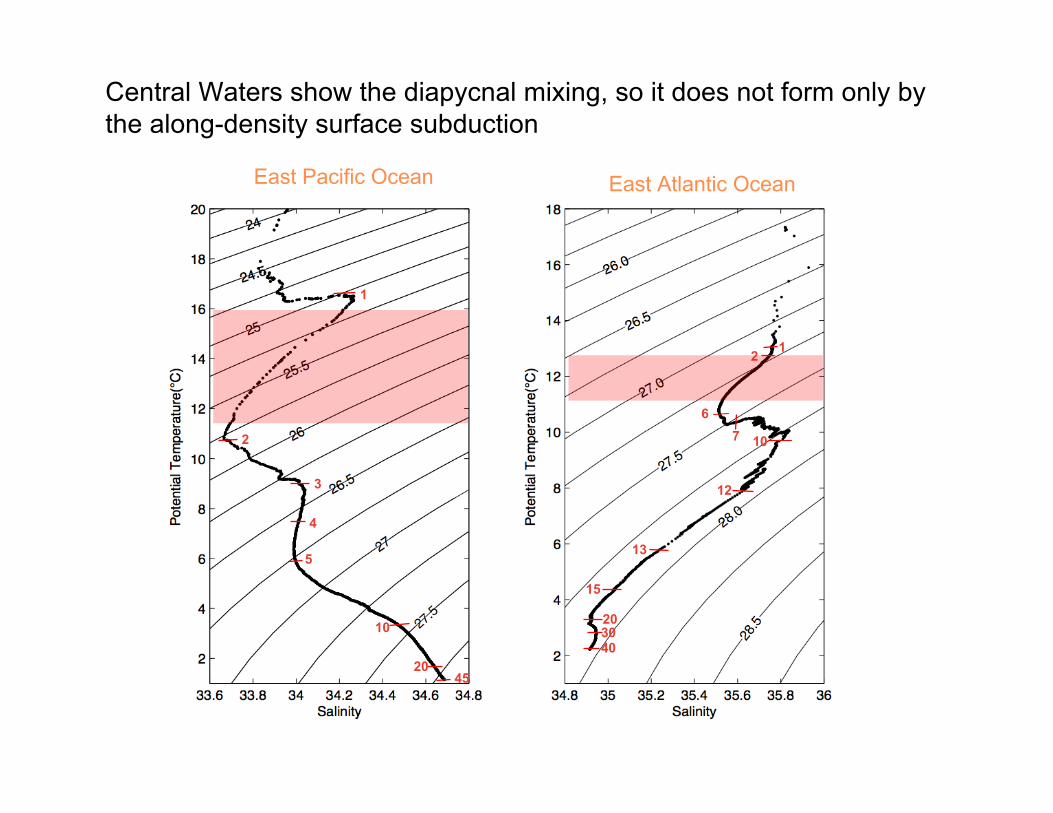
Type 1: Isopycnal mixing ⇒ mixing along the density surface
Type 2: Diapycnal mixing ⇒ mixing across the density surface
A T-S diagram also can help us determine the characteristics of watermixing in the water column
σθ=25.0
σ θ= 25.5
σ θ= 26.0
σ θ= 26.5
σ θ= 27.0
σ θ= 27.5
θ
S
Pot
entia
l tem
pera
ture
Salinity
σθ=25.0
σ θ= 25.5
σ θ= 26.0
σ θ= 26.5
σ θ= 27.0
σ θ= 27.5
θ
S
Pot
entia
l tem
pera
ture
Salinity
Type 1 Type 2
East Pacific Ocean East Atlantic Ocean
2
6
107
12
13
15
203040
1
2
3
4
5
10
2045
1
Central Waters show the diapycnal mixing, so it does not form only bythe along-density surface subduction
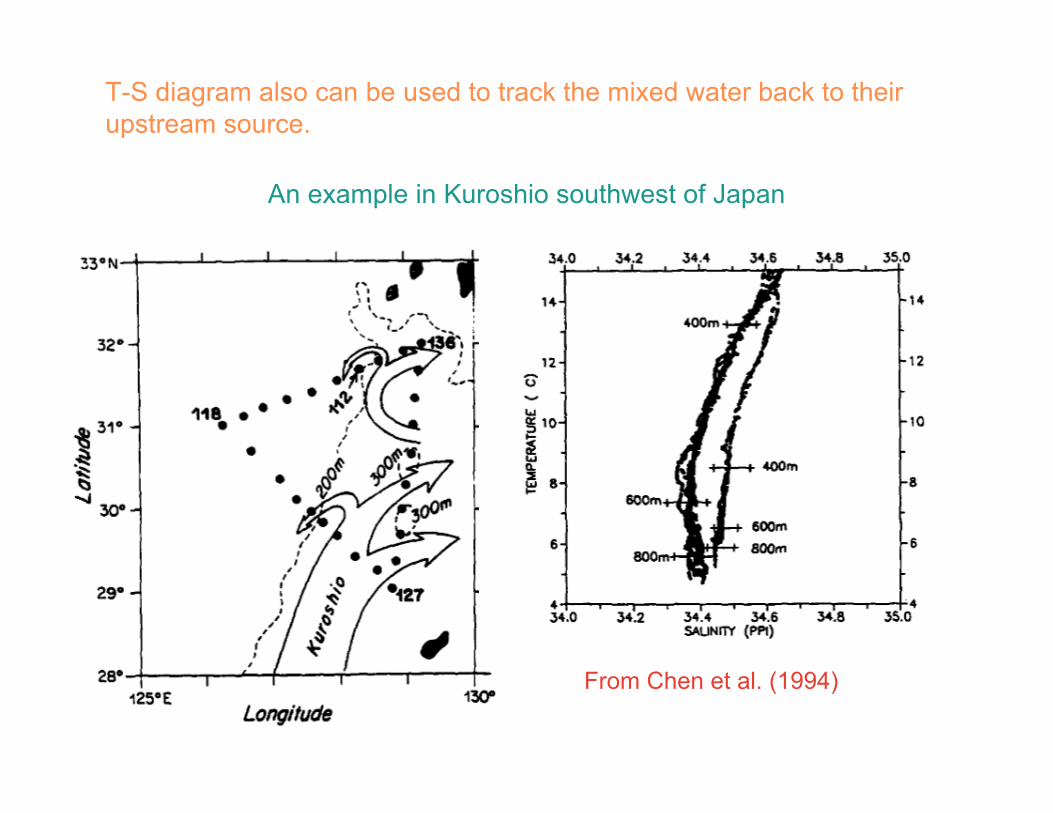
T-S diagram also can be used to track the mixed water back to theirupstream source.
An example in Kuroshio southwest of Japan
From Chen et al. (1994)


