NUREG-1715, Vol. 1
Component Performance Study - Turbine-Driven Pumps, 1987-1998
U.S. Nuclear Regulatory Commission Office of Nuclear Regulatory Research Washington, DC 20555-0001
ý' R ota ,4A g0
AVAILABILITY NOTICE
Availability of Reference Materials Cited in NRC Publications
NRC publications in the NUREG series, NRC regulations, and Title 10, Energy, of the Code of Federal Regulations, may be purchased from one of the following sources:
1. The Superintendent of Documents U.S. Government Printing Office PO. Box 37082 Washington, DC 20402-9328 <http://www.access.gpo.gov/sudocs> 202-512-1800
2. The National Technical Information Service Springfield, VA 22161-0002 <http://www.ntis.gov> 1-800-553-6847 or locally 703-605-6000
The NUREG series comprises (1) brochures (NUREG/BR-XXXX), (2) proceedings of conferences (NUREG/CP-X)OOX), (3) reports resulting from international agreements (NUREG/IA-XXXX), (4) technical and administrative reports and books [(NUREG-XXXX) or (NUREG/CR-XXXX)], and (5) compilations of legal decisions and orders of the Commission and Atomic and Safety Licensing Boards and of Office Directors' decisions under Section 2.206 of NRC's regulations (NUREGXXOXX.
A single copy of each NRC draft report for comment is available free, to the extent of supply, upon written request as follows:
Address: Office of the Chief Information Officer Reproduction and Distribution
Services Section U.S. Nuclear Regulatory Commission Washington, DC 20555-0001
E-mail: <[email protected]> Facsimile: 301-415-2289
A portion of NRC regulatory and technical information is available at NRC's World Wide Web site:
<http://www.nrc.gov>
After January 1, 2000, the public may electronically access NUREG-series publications and other NRC records in NRC's Agencywide Document Access and Management System (ADAMS), through the Public Electronic Reading Room (PERR), link. < http://www.nrc.gov/NRC/ADAMS/index.html>.
Publicly released documents include, to name a few, NUREG-series reports; Federal Register notices; applicant, licensee, and vendor documents and correspondence; NRC correspondence and internal memoranda; bulletins and information notices; inspection and investigation reports; licensee event reports; and Commission papers and their attachments.
Documents available from public and special technical libraries ihclude all open literature items, such as books, journal articles, and transactions, Federal Register notices, Federal and State legislation, and congressional reports. Such documents as theses, dissertations, foreign reports and translations, and non-NRC conference proceedings may be purchased from their sponsoring organization.
Copies of industry codes and standards used in a substantive manner in the NRC regulatory process are maintained at the NRC Library, Two White Flint North, 11545 Rockville Pike, Rockville, MD 20852-2738. These standards are available in the library for reference use by the public. Codes and standards are usually copyrighted and may be purchased from the originating organization or, if they are American National Standards, from
American National Standards Institute 11 West 42nd Street New York, NY 10036-8002 <http://www.ansi.org> 212-642-4900
NUREG-1715, Vol. 1
Component Peformance Study - Turbine-Driven Pumps, 1987-1998
Commercial Power Reactors
Date Completed: March 2000 Date Published: April 2000
Prepared By J. R. Houghton, H. G. Hamzehee
Division of Risk Analysis and Application Office of Nuclear Regulatory Research U.S. Nuclear Regulatory Commission
Washington, DC 20555-0001
ABSTRACT
This report documents an analysis of the performance of safety-related turbinedriven pump assemblies (turbine driver, pump, and governor subcomponents) used in the pressurized water reactor (PWR) auxiliary feedwater (AFW) system and in the boiling water reactor (BWR) reactor core isolation cooling (RCIC) and high pressure coolant injection (HPCI) systems in U.S. commercial power reactor plants.
A risk-based analysis of operating data and an engineering analysis of trends and patterns were performed to provide insights into the performance of turbine driven pump components on an industry basis and comparison of results with data used by plant-specific probabilistic risk assessments. The data used in this report was from the 1987-1995 period for engineering analysis of the PWR AFW system and the BWR RCIC and HPCI systems. Failure probability estimates used combined engineered safety features data (1987-1998) and surveillance test data (1987-1995) for the PWR AFW system and for the BWR RCIC and HPCI systems.
iii
CONTENTS ABSTRACT ......................................................... iii EXECUTIVE SUMMARY .............................................. vii ACKNOWLEDGMENTS ............................................... xii ACRONYMS ........................................................ xiii 1. INTRODUCTION ................................................ 1
1.1 P urpose .................................................. 1 1.2 Background ............................................... 1 1.3 Overall Study Structure ...................................... 2
2. SCOPE OF STUDY .............................................. 3 2.1 Risk-Important Systems and Components ....................... 3 2.2 TDP Assembly Description and Boundaries ...................... 4 2.3 Data C ollection ............................................ 4 2.4 Operational Data Analysis .................................... 8
3. RISK-BASED ANALYSIS ......................................... 9 3.1 Calculation Results ......................................... 9 3.2 Comparison With IPEs and Other Sources ...................... 11
4. ENGINEERING ANALYSIS ....................................... 13 4.1 Failure Trend Analysis ..................................... 13 4.2 Component Trends in Time .................................. 15 4.3 Failure Characteristics and Their Causes ....................... 21 4.4 Related Issues - Information Notices .......................... 26
5. SUMMARY OF RESULTS ........................................ 27 5.1 Failure Probabilities ........................................ 27 5.2 Engineering Insights ....................................... 27
6. REFERENCES ................................................ 28
V
CONTENTS (CONTINUED) FIGURES
1 NPRDS Database TDP Failures ............................... 6 2 SCSS Database TDP Failures .............................. 6 3 BWR HPCI System TDP Probability of Failure on Demand
Yearly Trend - 1987-1995 ................................... 11 4 PWR AFW System TDP Probability of Failure on Demand
Comparison with Values Used in IPEs .......................... 12 5 BWR RCIC System TDP Probability of Failure on Demand
Comparison with Values Used in IPEs ......................... 12 6 BWR HPCI System TDP Probability of Failure on Demand
Comparison with Values Used in IPEs ......................... 13 7 PWR and BWR TDP Failure Trends ........................... 14 8 PWR AFW System TDP Component Trends in Time .............. 19 9 BWR RCIC/HPCI Systems TDP Component Trends in Time ........ 20 10 TDP Subcomponent Failure Apportionment ..................... 22 11 PWR AFW System TDP Failure Causes ........................ 23 12 BWR RCIC System TDP Failure Causes ....................... 24 13 BWR HPCI System TDP Failure Causes ....................... 25
TABLES
A TDP Probability of Failure on Demand (1987-1998) ............... 10 B TDP Standby Failure Rate (1987-1995) ........................ 11 C NRC Information Notices Concerning TDP Assemblies (1986-1998) .. 26
APPENDICES
I Failure Probabilities -TDP Assembly II TDP Assembly - Component Trends in Time III TDP Assembly - Engineering Insights IV Data Source Inputs for Reported Failures and Estimated Demands
TDP Assemblies
vi
EXECUTIVE SUMMARY
This study provides the performance evaluation based on industry experience during the 1987 through 1998 period for turbine-driven pumps (TDPs) in the pressurized water reactor (PWR) auxiliary feedwater (AFW) system and in the boiling water reactor (BWR) reactor core isolation cooling (RCIC) and high pressure coolant injection (HPCI) systems. The objectives of component performance studies are (1) to determine the reliability of risk-important components and compare the results with estimates in probabilistic risk assessments (PRAs) and individual plant examinations (IPEs) and (2) to review the operational data from an engineering perspective to determine trends and patterns and gain insights into component performance:
TDP failure and estimated demand data was obtained from two databases. The Nuclear Plant Reliability Data System (NPRDS) provided data on component failures and surveillance test frequencies for the 1987-1995 period. The Sequence Coding and Search System (SCSS) provided engineering safety features (ESF) failure and demand data for the 1987-1998 period and some surveillance test failure data for the 1987-1995 period reported in Licensee Event Reports (LERs).
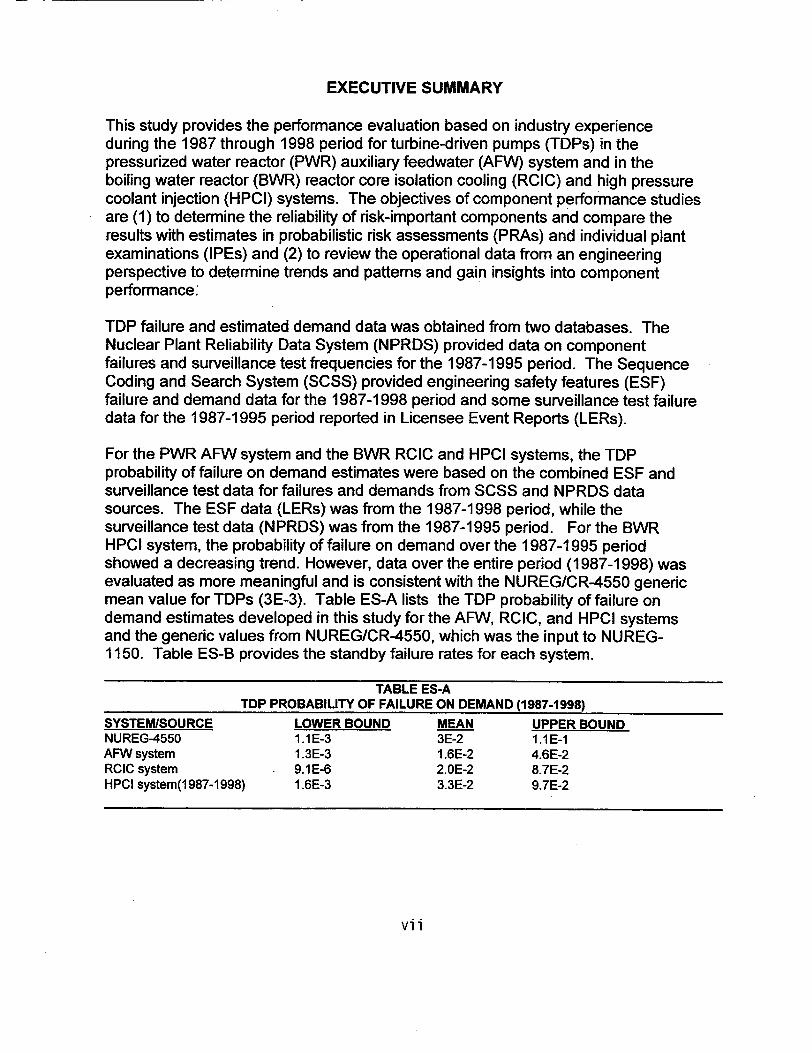
For the PWR AFW system and the BWR RCIC and HPCI systems, the TDP probability of failure on demand estimates were based on the combined ESF and surveillance test data for failures and demands from SCSS and NPRDS data sources. The ESF data (LERs) was from the 1987-1998 period, while the surveillance test data (NPRDS) was from the 1987-1995 period. For the BWR HPCI system, the probability of failure on demand over the 1987-1995 period showed a decreasing trend. However, data over the entire period (1987-1998) was evaluated as more meaningful and is consistent with the NUREG/CR-4550 generic mean value for TDPs (3E-3). Table ES-A lists the TDP probability of failure on demand estimates developed in this study for the AFW, RCIC, and HPCI systems and the generic values from NUREG/CR-4550, which was the input to NUREG1150. Table ES-B provides the standby failure rates for each system.
TABLE ES-A TDP PROBABILITY OF FAILURE ON DEMAND (1987-1998)
SYSTEM/SOURCE LOWER BOUND MEAN UPPER BOUND NUREG-4550 1.1E-3 3E-2 1.1E-1 AFW system 1.3E-3 1.6E-2 4.6E-2 RCIC system 9.1E-6 2.OE-2 8.7E-2 HPCI system(1 987-1998) 1.6E-3 3.3E-2 9.7E-2
vii
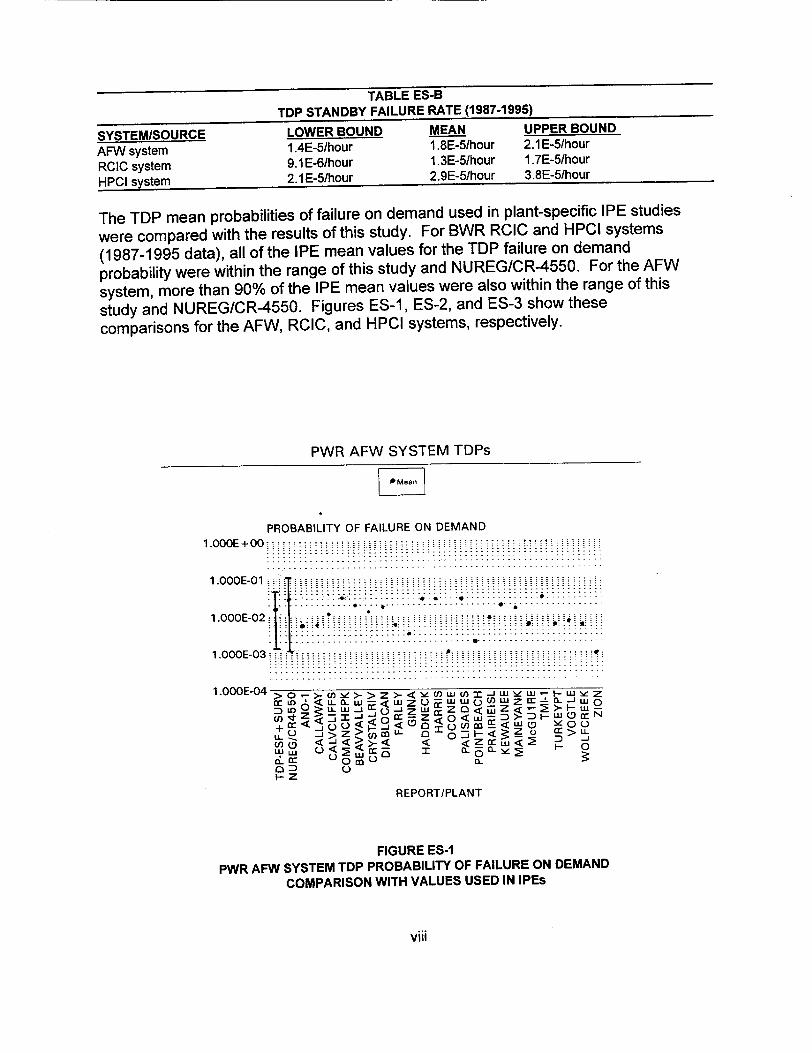
TABLE ES-B
TDP STANDBY FAILURE RATE (1987-1995)
SYSTEMISOURCE LOWER BOUND MEAN UPPER BOUND
AFW system 1 .4E-5/hour 1.8E-5/hour 2.1 E-5/hour
RCIC system 9.1E-6/hour 1.3E-5/hour 1.7E-5/hour
HPCI system 2.1E-5/hour 2.9E-5/hour 3.8E-5/hour
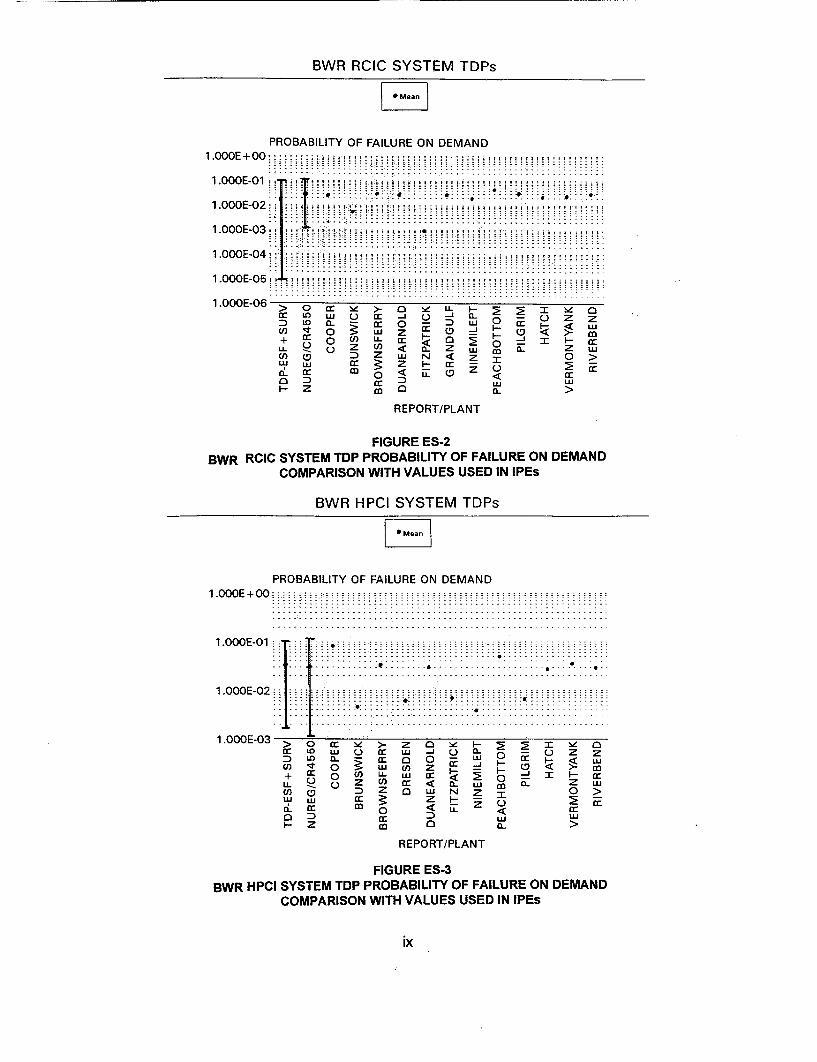
The TDP mean probabilities of failure on demand used in plant-specific IPE studies
were compared with the results of this study. For BWR RCIC and HPCI systems
(1987-1995 data), all of the IPE mean values for the TDP failure on demand
probability were within the range of this study and NUREG/CR-4550. For the AFW
system, more than 90% of the IPE mean values were also within the range of this
study and NUREG/CR-4550. Figures ES-1, ES-2, and ES-3 show these
comparisons for the AFW, RCIC, and HPCI systems, respectively.
PWR AFW SYSTEM TDPs
PROBABILITY OF FAILURE ON DEMAND
1.OOOE+00"----: "
1.OOOE-O1 . .. . . . . .. . . . . . . . . ..!!! !! !! !! !! !! !! !! !! !!
T.. .... 0....".. .......................... .... '-. ......... 1 . "E- 1 : : : ý - - : :::' : . :i ' ' : :: -: 4 -' - ' ' '' • !! ''::': : • : : :
-.. ... .. .. .................... ................
1.000E-02 .......
: .: :..........:................. .... ......
1.OOOE-03 : ... ....
1.000E-04 > 0 .- • M >- > z >- < se W ' ' .j (0 M "J W _.- ,- '" z •y•,,,3, ,,,6 •- . E u z <uwu! uz •_o
,, 0. ->z m-J z -o a-W Z > + -. <>-< <z M0
rn <-1 < < <Z < ~ oD O
Iz REPORT/PLANT
FIGURE ES-1
PWR AFW SYSTEM TDP PROBABILITY OF FAILURE ON DEMAND
COMPARISON WITH VALUES USED IN IPEs
viii
BWR RCIC SYSTEM TDPs
PROBABILITY OF FAILURE ON DEMAND
1 .OOOE+OQ ................ . .. .. .. .. .. .. . . . . . . . . . . . . . . . . . . . ..
1.OOOE-O1 !L : M,2 1!t" - !11 wE! ; ,s - ! ! ! ,z sZ : . . .. ...... . .
1.000E-02 j 1 .0 0 E - 3 . ... ... ... ... ............. ....................... ..........
1.OOOE-04-1.. ........ - - -- - - -- - - -. . . . . . ...........:: : : : : : : : : : : : : : : : : : : : :
1.0OOE-06 > o r N, >- 0 ,, ao
LL I- u U < - z mn
BW 'Rl SYTM D PRBAIL0 OFILR ON DEAN COMARSO WTHVAUE USE IN IPs
(n C N D< z 0 > LU LU cr : z I- cr - C
d. C o< 0 cr
z : : : : : : : : : : : : : : : : : .. .. .. a, 0.. > ,
REPORT/PLANT
FIGURE ES-2 BWR RCIC SYSTEM TDP PROBABILITY OF FAILURE ON DEMAND
COMPARISON WITH VALUES USED IN IPEs
BWR HPCI SYSTEM TDPs
PROBABILITY OF FAILURE ON DEMAND 1.OOOE+OO ::::::::::
1.00O...2.1 .. ......... ................... .. .. .... 1 .OOOE-02
1.000E-032:
0 0 x N - 0 > he , N Cr 0 C1Lu ) ir LU L) (L~ 0 U** Z C
aI ) m o 0 >< w w ) 0 D 0 LU N m ccoUn L LU m _j m C
d~ ~ Cr 0 I. <
0 : Cr L) L 0Z<0< it
REPORT/PLANT
FIGURE ES-3 BWR HPCI SYSTEM TDP PROBABILITY OF FAILURE ON DEMAND
COMPARISON WITH VALUES USED IN IPEs
ix
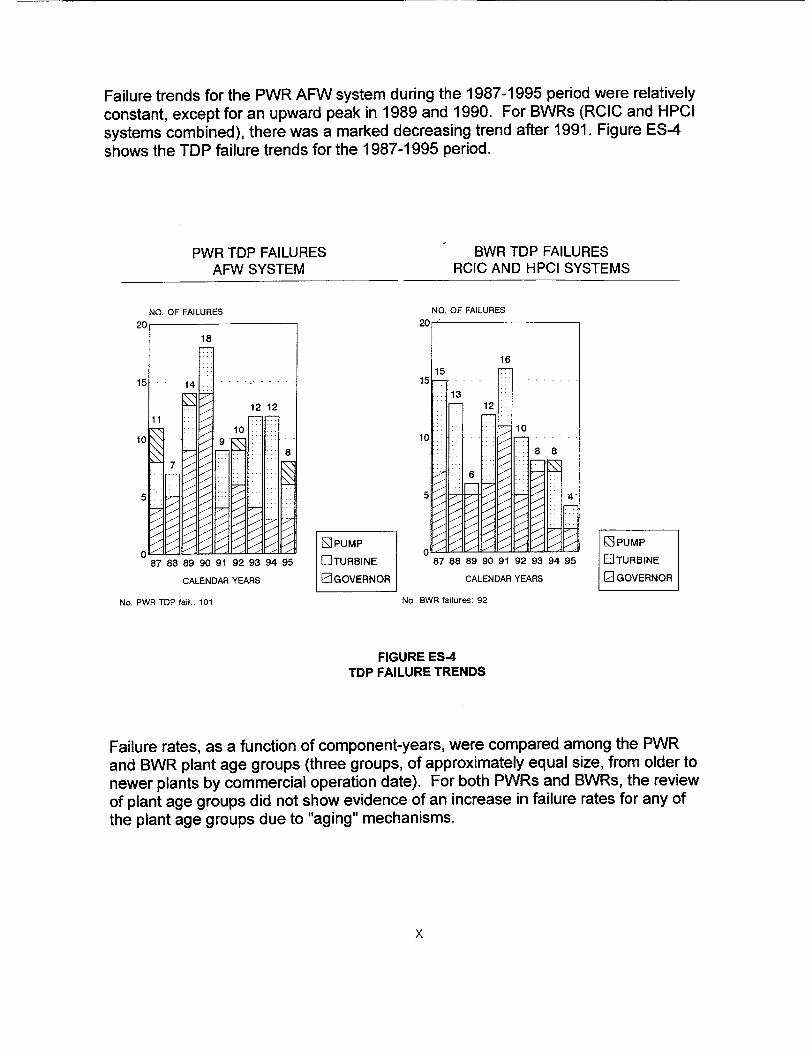
Failure trends for the PWR AFW system during the 1987-1995 period were relatively constant, except for an upward peak in 1989 and 1990. For BWRs (RCIC and HPCI systems combined), there was a marked decreasing trend after 1991. Figure ES-4 shows the TDP failure trends for the 1987-1995 period.
PWR TDP FAILURES AFW SYSTEM
BWR TDP FAILURES RCIC AND HPCI SYSTEMS
NO. OF FAILURES
18
" " 14 -i i . .
12
10 9
7
87 88 89 90 91 92 93
CALENDAR YEARS
No. PWR TDP fail.: 101
12
95
15
10
5
[]PUMP
EITURBINE El GOVERNOR
0
NO. OF FAILURES
15
U
16
13 -12
10
88
6
4
88 89 90 91 92 93 94 95
CALENDAR YEARS
No. BWR failures: 92
FIGURE ES-4 TDP FAILURE TRENDS
Failure rates, as a function of component-years, were compared among the PWR and BWR plant age groups (three groups, of approximately equal size, from older to newer plants by commercial operation date). For both PWRs and BWRs, the review of plant age groups did not show evidence of an increase in failure rates for any of the plant age groups due to "aging" mechanisms.
X
20
15
10
5
0
-PUMP
0ITURBINE
0l GOVERNOR
20,]
8
94
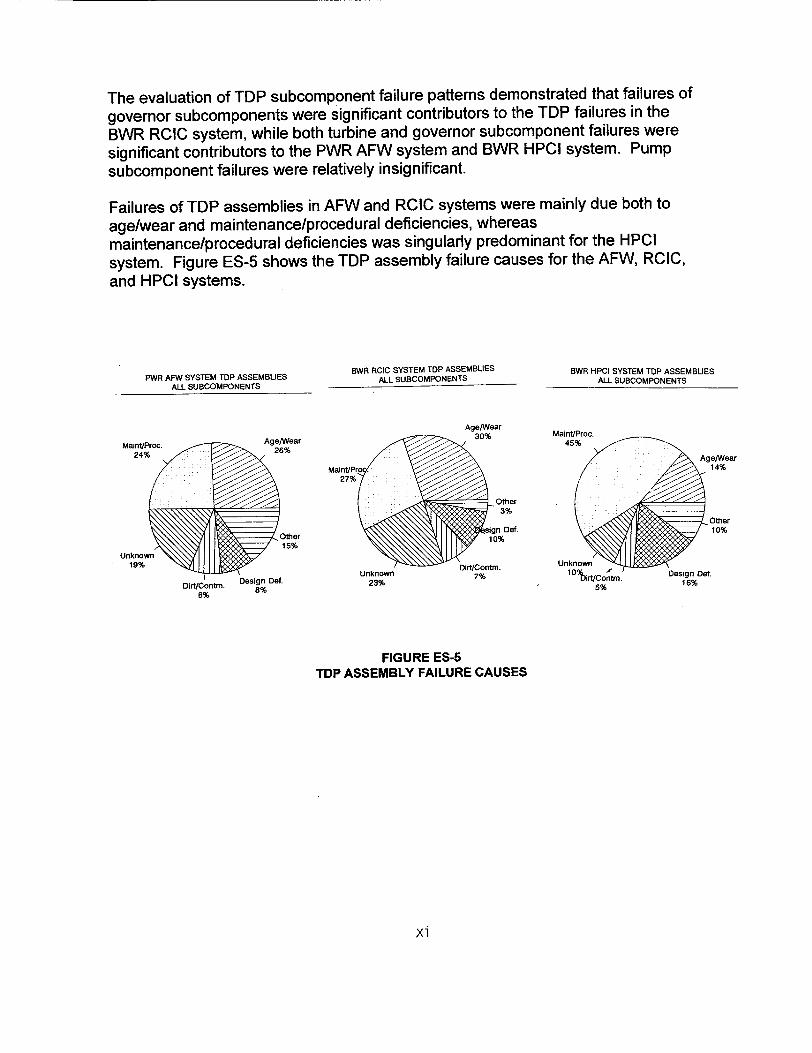
The evaluation of TDP subcomponent failure patterns demonstrated that failures of governor subcomponents were significant contributors to the TDP failures in the
BWR RCIC system, while both turbine and governor subcomponent failures were
significant contributors to the PWR AFW system and BWR HPCI system. Pump
subcomponent failures were relatively insignificant.
Failures of TDP assemblies in AFW and RClC systems were mainly due both to
age/wear and maintenance/procedural deficiencies, whereas maintenance/procedural deficiencies was singularly predominant for the HPCI
system. Figure ES-5 shows the TDP assembly failure causes for the AFW, RCIC, and HPCI systems.
PWR AFW SYSTEM TOP ASSEMBLIES ALL SUBCOMPONENTS
Maint/Proc. 24%
Unknown 19%
BWR RCIC SYSTEM TOP ASSEMBLIES ALL SUBCOMPONENTS
Age/Wear 30%
S Design Def. Dirt/Contm. 8% 8%
Unknown 23%
Dirt/Contm. 7%
BWR HPCI SYSTEM TDP ASSEMBUES ALL SUBCOMPONENTS
Maint/Proc. 45%
Unknown
Dirt/Cont% . 5%
Design Def. 16%
FIGURE ES-5 TDP ASSEMBLY FAILURE CAUSES
xi

ACKNOWLEDGMENTS
We thank our colleague Dr. Dale M. Rasmuson for his technical assistance in the review and presentation of the statistical data.
xii
ACRONYMS
AFW auxiliary feedwater system AOV air-operated valve ASME American Society of Mechanical Engineers BWR boiling water reactor EPIX Equipment Performance and Information Exchange ESF engineered safety features HPCI high pressure coolant injection system INEEL Idaho National Engineering and Environmental Laboratory INPO The Institute of Nuclear Power Operations IPE Individual plant examination LER Licensee Event Report MDP motor-driven pump MOV motor-operated valve NPRDS Nuclear Plant Reliability Data System NRC United States Nuclear Regulatory Commission ORNL Oak Ridge National Laboratory PRA probabilistic risk assessment PWR pressurized water reactor RCIC reactor core isolation cooling system RI risk-important SCSS Sequence Coding and Search System TDP turbine-driven pump
xiii
COMPONENT PERFORMANCE STUDY - TURBINE-DRIVEN PUMPS, 1987-1998
1. INTRODUCTION
1.1 Purpose
This study provides the performance evaluation of turbine-driven pump (TDP) assemblies in the pressurized water reactors (PWR) auxiliary feedwater system and in the boiling water reactors (BWR) reactor core isolation cooling (RCIC) and high pressure coolant injection systems during the period 1987 through 1998. The objectives of this study are (1) to determine the reliability of TDP assemblies and compare the results with estimates in probabilistic risk assessments (PRAs) and individual plant examinations (IPEs) and (2) to review the operational data from an engineering perspective to determine trends and patterns and gain insights into component performance.
An engineering analysis of the factors affecting TDP reliability was performed to determine trends and patterns in the TDP operating data for the 1987-1995 period. This study was based on the actual operating history of TDPs for these safety-related systems. The reliability parameters calculated in this study are the probability of failure to start on demand and failure rate per standby hours (standby failure rate). Supplemental failure and demand data for 1996-1998 from operational events (engineered safety features actuations reported in Licensee Event Reports) was added to the 1987-1995 data for estimating the TDP probabilities of failure on demand.
1.2 Background
The U.S. Nuclear Regulatory Commission (NRC) has undertaken to ensure that the stated NRC policy to expand the use of probabilistic risk assessment (PRA) within the agency is implemented in a consistent and predictable manner. As part of this effort, the Office of Nuclear Regulatory Research (RES), Division of Risk Analysis and Application (DRAA), has begun monitoring and reporting on the functional reliability of risk-important systems in commercial nuclear power plants. The approach is to compare estimates and associated assumptions in PRAs to actual operating experience. The first phase is identifying risk-important systems from a PRA perspective and doing a reliability and trending analysis of these systems. As a significant part of this effort, a risk-related performance study of the turbine-driven pumps for the AFW, RCIC, and HPCI systems was performed.
1
Over the past decade, the NRC has issued several studies applicable to TDP risk-important systems, TDP components or their subcomponent failures, failure on demand probabilities, and trends and patterns.
NUREG-1275, Vol. 10, "Operating Experience Feedback Report Reliability of Safety-Related Steam Turbine-Driven Standby Pumps," October 1994 (Ref. 1), documented a detailed analysis of failure initiators, causes, and design features for steam turbine assemblies (turbines and their related components such as governors and valves) that are used as drivers for standby pumps in the auxiliary feedwater systems of pressurized water reactor plants, and in the high pressure safety injection and reactor core isolation cooling systems of boiling water reactor plants (1974-1992).
NUREG/CR-5500, Vol.4, "Reliability Study: High Pressure Coolant Injection (HPCI) System Performance, 1987-1993," September 1999 (Ref. 2), documented an analysis of the performance of the BWR HPCI system during the period 1987-1993. A risk-based analysis and an engineering analysis of trends and patterns were performed from HPCI system operational events data (reported by LERs) to provide insights into the performance of the HPCI system throughout the industry and at a plant-specific level.
NUREG/CR-5500, Vol.7, Reliability Study: Reactor Core Isolation Cooling System, 1987-1993," September 1999 (Ref. 3), documented an analysis of the performance of the BWR RCIC system during the period 1987-1993. A risk-based analysis and an engineering analysis of trends and patterns were performed from RCIC system operational events data (reported by LERs) to provide insights into the performance of the RCIC system throughout the industry and at a plant-specific level.
NUREG/CR-5500, Vol. 1, "Reliability Study: Auxiliary/Emergency Feedwater System, 1987-1995," dated August 1998 (Ref. 4), documented an analysis of the performance of the PWR AFW system during the period 1987-1995. A risk-based analysis and an engineering analysis of trends and patterns were performed from AFW system operational events data (reported by LERs) to provide insights into the performance of the AFW system throughout the industry and at a plant-specific level
1.3 Overall Study Structure
This study is arranged in four sections.
2
Section 1 is the introduction.
(2) Section 2 describes the scope of the study, risk-important systems, the TDP assembly and its subcomponent boundaries, and the methodology used for operational data collection and analysis.
(3) Section 3 provides the risk-based analysis of operational data, the calculation results for estimating the TDP probabilities of failure on demand and the standby failure rate for TDPs, the contingency test analysis for the data population, the comparison of TDP probability values with those in IPEs and other sources, and the regulatory implications of this component performance study.
(4) Section 4 provides the engineering analyses (failure trend analysis, component trends in time, the failure characteristics and their causes, a brief discussion and listing of NRC regulatory initiatives related to TDPs, and engineering insights resulting from the various analyses).
The appendices provide related data used in this study and evaluation results. Appendix I provides the estimated probabilities of failure on demand and the calculated standby failure rates. Appendix II contains tables of data for the combined total and for each plant age group used to plot the component trends in time and an evaluation of aging effects on TDPs. Appendix III provides data used for engineering analysis and insights into failure trends and patterns. Appendix IV provides operational data inputs for reported failures and estimated demands from the NPRDS database and LERs (SCSS database).
2. SCOPE OF STUDY
2.1 Risk-Important Systems and Components
The PWR risk-important (RI) system that uses the TDP is the auxiliary/emergency feedwater (AFW) system (Westinghouse, Babcock & Wilcox, and Combustion Engineering reactor plants). The main safety function of the AFW system is to provide feedwater to the steam generators to maintain a heat sink in the event of a loss of main feedwater, a reactor trip, loss of offsite power, or a small break loss of coolant accident. The AFW system is typically a multi-train system, one train with a TDP and one or more trains with motor-driven pumps (MDPs). However, some plants have more TDP trains and a few plants have no TDP trains (motor-driven pump trains and/or diesel-driven pump trains).
3
(1)
The BWR RI systems that use TDPs are the reactor core isolation cooling (RCIC) and the high pressure coolant injection (HPCI) systems. The RCIC system is a single train system that supplies high pressure makeup water to the reactor vessel when the reactor is isolated from the main condenser and the condensate and feedwater system is not available. The HPCI system is a single train system that maintains adequate reactor vessel inventory for core cooling in the event of small break loss-of-coolant-accidents (LOCAs), and assists in the depressurization of the reactor vessel to allow the low pressure emergency core cooling systems (ECCS) to inject on intermediate break LOCAs. It also provides a backup function to the isolation condenser or the RCIC system under reactor isolation conditions.
2.2 TDP Assembly Description and Boundaries
For this study, a TDP assembly is comprised of a pump, a turbine driver, and a governor subcomponents. The pump is typically a horizontal, split-case, single stage centrifugal pump. Most plant designs use a single stage "Terry Turbine" (now supplied by Dresser-Rand), whose piece parts include a turbine trip and throttle valve, a mechanical overspeed trip mechanism, and a lubrication system. The various types of governors, used for turbine speed control in AFW, RCIC, and HPCI system TDPs, are mostly manufactured by the Woodward Corporation. For the AFW system TDPs, the governors are predominantly mechanical/hydraulic, pressure compensated, and have a pneumatic remote-speed setting capability. For the RCIC and HPCI systems, the TDPs typically have Woodward type EG-M electric/electronic governors and EGR actuators. Piece parts of all governors include a turbine stop valve and a governor valve, while the EG-M usually includes a ramp generator/signal converter and other electrical controls. The turbine and various type governor subcomponents are included in NUREG-1 275, Vol. 10 (Ref. 1).
The component boundaries are the TDP assembly, its subcomponents, and the piece parts described above, that are supplied as part of the TDP assembly. Other system components, such as steam inlet valves to the turbine, pump suction and discharge valves, flow instrumentation and controls, and remote electrical controls, are considered outside the component boundary in this study.
2.3 DATA COLLECTION
Data collection and reporting for the NPRDS were terminated at the end of 1996. Therefore, the NPRDS does not have any failure information for 1997 and later. Furthermore, the 1996 failure data reported in NPRDS was not as consistent as for the 1987-1995 period (the industry was transitioning for the
4
termination of NPRDS). The Institute for Nuclear Power Operations (INPO) has recently implemented a new component database called Equipment Performance and Information Exchange (EPIX). This system is intended to replace the NPRDS system that yields additional information, such as demands. In its present stage of development, the EPIX system was not considered to be sufficiently mature to provide a complete data source for the 1996-1998 period for this study. Where applicable in the development of probability of failure on demand estimates for this study, the SCSS database of ESF failure and demand data (reported in LERs) were used for the 19961998 period.
The NPRDS database was used to obtain the number of TDP assembly subcomponents and the estimated testing frequency for each subcomponent in each plant. The number and testing frequency of Application Coded pump subcomponents were compared with the number and testing frequency of Application Coded turbine driver and governor subcomponents for each TDP assembly. This was done for the AFW system in PWRs and for the RCIC and HPCI systems in BWRs for each plant. The comparison was made to assure that number of TDP assemblies was correct for each plant, since each assembly has one pump, one governor, and one turbine driver. The values developed in Appendix IV were also used in developing other appendices.
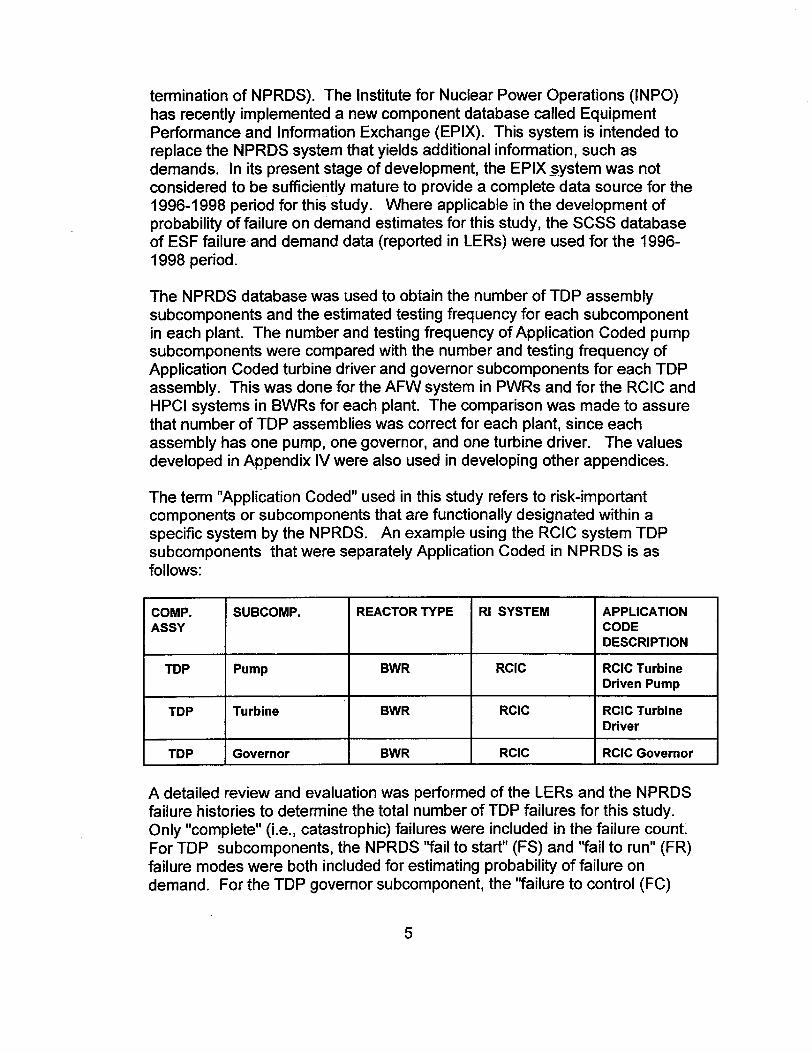
The term "Application Coded" used in this study refers to risk-important components or subcomponents that are functionally designated within a specific system by the NPRDS. An example using the RCIC system TDP subcomponents that were separately Application Coded in NPRDS is as follows:
COMP. SUBCOMP. REACTOR TYPE RI SYSTEM APPLICATION ASSY CODE
DESCRIPTION
TDP Pump BWR RCIC RCIC Turbine Driven Pump
TDP Turbine BWR RCIC RCIC Turbine Driver
TDP Governor BWR RCIC RCIC Governor
A detailed review and evaluation was performed of the LERs and the NPRDS failure histories to determine the total number of TDP failures for this study. Only "complete" (i.e., catastrophic) failures were included in the failure count. For TDP subcomponents, the NPRDS "fail to start" (FS) and "fail to run" (FR) failure modes were both included for estimating probability of failure on demand. For the TDP governor subcomponent, the "failure to control (FC)
5

and "failure to run" (FR) failure modes were used. Because these failure
modes occurred in a relatively short period, these various subcomponent
failure modes were considered as equivalent to "fail to start." Figure 1 shows
the relationship between various NPRDS database failure data subsets.
Al All TDP assembly subcomponent failures as "complete"/catastrophic
Ai failure category (1987-1995)
Bi Bi Subset - TDP failures for risk
important systems
C1 Subset - TDP failures occurring during 0 surveillance tests
FIGURE 1
NPRDS DATABASE TDP FAILURES
The SCSS database was used to determine the number of TDP failures,
reported in LERs, that occurred during surveillance tests or that were
associated with an engineered safety features (ESF) actuation. The NPRDS
database was used to obtain the number of surveillance test failures for each
TDP subcomponent. Surveillance test failures reported in LERs were
excluded from the NPRDS failure counts, but included in the LER failure
counts. This was done to prevent a "double count" of failures. Figure 2
shows the relationship between various SCSS database (reported by LERs)
failure data subsets.
A2 All TDP assembly failures (1987-1998)
Az B2 Subset - TDP failures for risk
important systems
Ba C2 Subset TDP failures associated with
ESFs or occurring during surveillance
tests
FIGURE 2
SCSS DATABASE TDP FAILURES
TDP failures that occurred during surveillance testing were directly linked with
surveillance test demands to assure that surveillance test probability of failure
on demand estimates were valid. Similarly, ESF failures were linked with
ESF demands to estimate ESF probability of failure on demand. For the few
6
plant AFW systems with more than one TDP (i.e, more than one train with a TDP), those TDPs that might have been actuated during pre-test or post-test system train alignment were not included in the surveillance test failure counts used in this study.
When it was analytically determined that the ESF failures and demands were in the same population as the surveillance test failures and demands, the total number of demands was the sum of the ESF demands and the surveillance test demands.
The first step in estimating ESF demands was to determine ESF actuations and then determine which component types and how many components of each type were actuated by this type of demand. Other demands that may have occurred during plant operation, startup, or shutdown but did not result in ESF actuations were not included in the ESF demand determination, nor were any associated failures included. However, inadvertent and spurious demands and manual actuations associated with an ESF (e.g., a reactor trip) were considered ESF demands. The SCSS database was used for the PWR AFW system and the BWR RCIC and HPCI systems for LERs that were coded with "ESF Actuations" and those coded as "SCRAMS and Shutdowns." The full text of each LER was reviewed to determine whether the selected systems were actuated, the number and type of trains (e.g., for AFW, the turbine-driven pump train(s) and/or the motor-driven pump train(s) actuated by the ESF), and the best estimate of the number of TDPs actuated, based on the plant-specific train configuration.
The second step in estimating the total number of demands was to use NPRDS testing frequencies as the basis for surveillance test demands. This was done for the NPRDS Application Coded, functionally designated TDP assembly subcomponents in the AFW, RCIC, and HPCI systems (see Section 2.1 for the description of the TDP assembly). The review of the NPRDS testing frequency was performed for each subcomponent of the TDP assembly (i.e., pump, turbine driver, and governor). When the NPRDS reported testing frequency differed among the subcomponents, an estimate was made for the TDP assembly testing frequency that included American Society of Mechanical Engineers (ASME) Boiler and Pressure Vessel Code, Section XI Inservice Testing interval requirements (as required by the Technical Specifications), the system, and the subcomponent function in the TDP assembly. When no frequency was provided by NPRDS, a minimum frequency of once per quarter was used. Demands associated with a surveillance test that occurred during train alignment and return to the "as found" condition of a system/train were not included in the total number of demands, nor were corollary failures included in the failure count. Although the Technical Specifications generally require a full flow test once per refueling cycle, no additional demands were included because the monthly
7
or quarterly surveillance test frequencies used in this study were assumed to envelope these refueling cycle demands.
The total number of demands for the TDPs in a specific system was the sum of ESF TDP demands and surveillance test demands, where the latter is the sum of the products of the TDPs and their estimated testing frequencies over the 9-year period (1987-1995) and the former (ESFs) covers the 12-year period (1987-1998).
The probability of failure on demand for TDPs was estimated by dividing total TDP failures by total TDP demands ( ESF failures + surveillance test failures - ESF demands + surveillance test demands) as long as the ESF data and the surveillance test data were analyzed to be in the same population.
2.4 Operational Data Analysis
A contingency test analysis was performed to reject or to not reject the hypothesis that failure and demand data from surveillance testing of Application Coded TDPs were in the same population as ESF failure and demand data. The analysis used surveillance test data for the TDPs in the PWR AFW system and in the BWR RCIC and HPCI systems during the 19871995 period and ESF data froml987-1998.
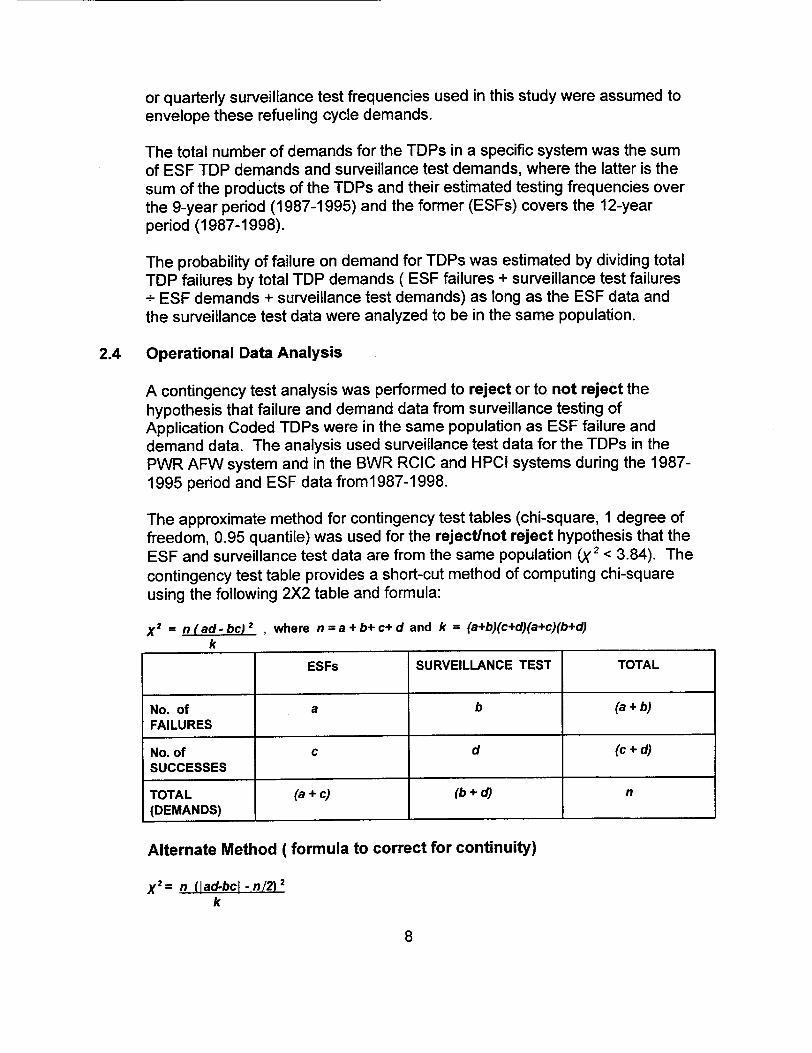
The approximate method for contingency test tables (chi-square, 1 degree of freedom, 0.95 quantile) was used for the reject/not reject hypothesis that the ESF and surveillance test data are from the same population (X2 < 3.84). The
contingency test table provides a short-cut method of computing chi-square using the following 2X2 table and formula:
X = n (ad- bc) 2 where n = a + b+ c+ d and k = (a+b)(c+d)(a+c)(b+d) k
ESFs SURVEILLANCE TEST TOTAL
No. of a b (a+b) FAILURES
No. of c d (c + d) SUCCESSES
TOTAL (a + c) (b + d) n
(DEMANDS)
Alternate Method (formula to correct for continuity)
X2 = n (lad-bcl -_n12) 2
k
8
Bayes Method
The Bayes method (Ref. 6), as applied to this study for TDPs by plant system, assumes that the probability of failure on demand varies from plant to plant according to a beta distribution. The parameters for this distribution were estimated from the pooled data by maximum likelihood. For each plant, this distribution was used as a Bayes prior distribution, and updated with the plant-specific failure data. This method was used in this study for the PWR AFW system and the BWR RCIC and HPCI systems. It is also used to evaluate the acceptability of combining data populations (ESF and surveillance test) when the simple contingency test rejects the hypothesis that the data are in the same population.
Standby Failure Rate
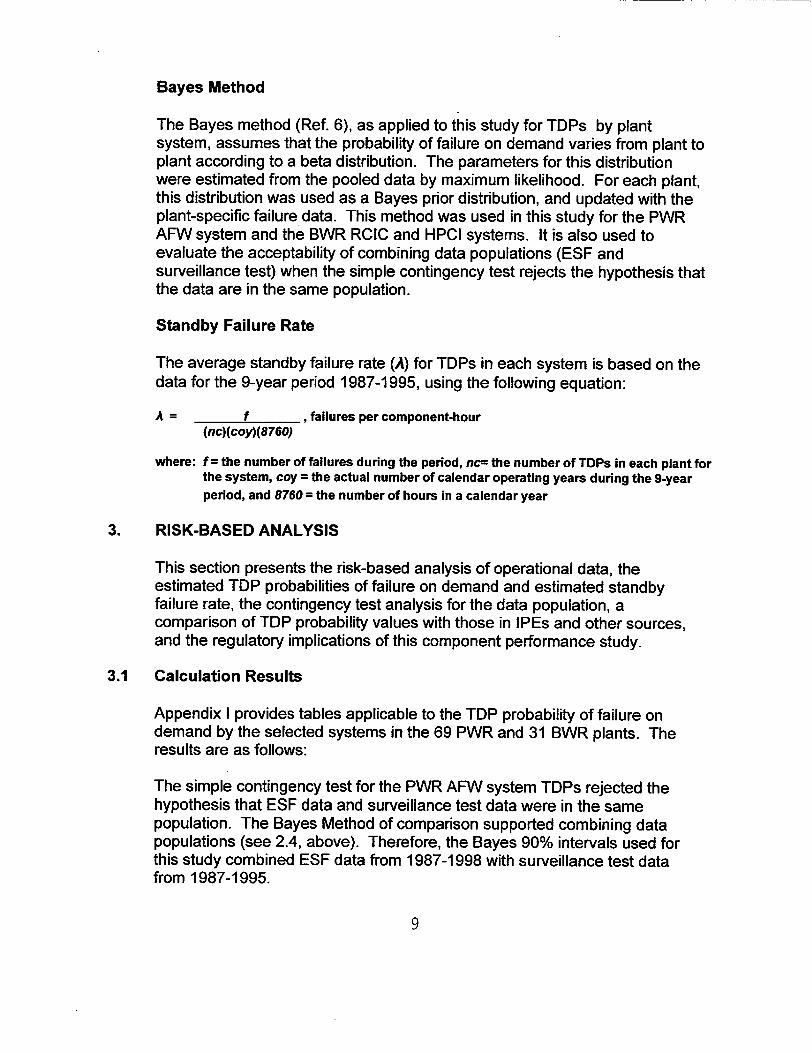
The average standby failure rate (A) for TDPs in each system is based on the data for the 9-year period 1987-1995, using the following equation:
A = f , failures per component-hour (nc)(coy)(8760)
where: f-- the number of failures during the period, nc= the number of TDPs in each plant for the system, coy = the actual number of calendar operating years during the 9-year period, and 8760 = the number of hours in a calendar year
3. RISK-BASED ANALYSIS
This section presents the risk-based analysis of operational data, the estimated TDP probabilities of failure on demand and estimated standby failure rate, the contingency test analysis for the data population, a comparison of TDP probability values with those in IPEs and other sources, and the regulatory implications of this component performance study.
3.1 Calculation Results
Appendix I provides tables applicable to the TDP probability of failure on demand by the selected systems in the 69 PWR and 31 BWR plants. The results are as follows:
The simple contingency test for the PWR AFW system TDPs rejected the hypothesis that ESF data and surveillance test data were in the same population. The Bayes Method of comparison supported combining data populations (see 2.4, above). Therefore, the Bayes 90% intervals used for this study combined ESF data from 1987-1998 with surveillance test data from 1987-1995.
9

For BWR RCIC and HPCI systems the contingency tests did not reject the hypothesis that the ESF failures and demands were in the same population as the surveillance test failures and demands (see Section 2.4). Therefore, the Bayes 90% intervals for ESF + surveillance test (1987-1995) + ESF (1996-1998) probability of failure on demand was used.
The generic failure probabilities used in PRAs are presently provided in terms of probability of failure on demand and probability of failure per operating hour. In this study, probability of failure on demand was used for TDPs because data was available to match failures to demands. Data on run times from LERs and NPRDS was not available to compare with generic failure to run data. The generic failure probability on demand ("failure to start") values used in this study are from NUREG/CR-4550 (Ref. 5), which was the input to NUREG-1 150.
Table A shows the TDP probability of failure on demand values for 1987-1998 for AFW, RCIC, and HPCI systems.
TABLE A TDP PROBABILITY OF FAILURE ON DEMAND (1987-1998)
SYSTEM/SOURCE LOWER BOUND MEAN UPPER BOUND NUREG/CR-4550 1.1E-3 3E-2 1.1E-1 AFW system 1.3E-3 1.6E-2 4.6E-2 RCIC system 9.1E-6 2.OE-2 8.7E-2 HPCI system 1.6E-3 3.3E-2 9.7E-2
The results shown in Table A indicated that the Bayes 90% interval probabilities of failure on demand were within the referenced NUREG/CR4550 value range for TDPs used in this study. For the PWR AFW and BWR RCIC systems, the probability of failure on demand over the 1987-1995 period showed a relatively constant trend. For the BWR HPCI system, the trend was decreasing (see Figure 3). The majority of the data for calculating the trends was surveillance test data. Since there was no new data for surveillance test failures and demands for the most recent three years (19961998) of the study, it is not certain whether these trends continued. The ESF data alone is sufficient to conclude that significant increases in the failure probability have not occurred, but is insufficient to determine whether the trends for 1996-1998 were constant or declining. Therefore, Table A uses the mean values over the entire period as the estimate for the probability of failure on demand.
10
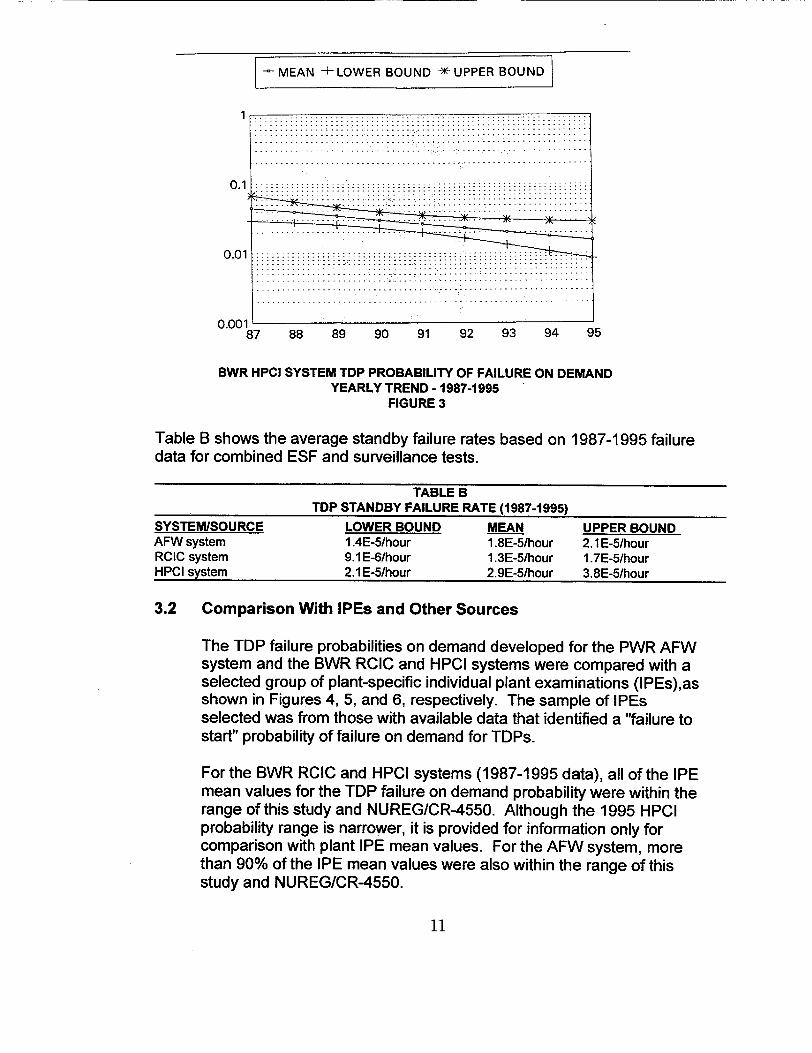
I MEAN ± LOWER BOUND - UPPER BOUND
0.
0.0
• t. . . . . . . . . . . . . . . . . . . . . . . . . . . . . . . . . . . . . . . . . . . . . . . . . . . . . . . . . . . . . . . . . .
87 88 89 90 91 92 93 94 95
BWR HPCI SYSTEM TDP PROBABILITY OF FAILURE ON DEMAND YEARLY TREND - 1987-1995
FIGURE 3
Table B shows the average standby failure rates based on 1987-1995 failure data for combined ESF and surveillance tests.
TABLE B TDP STANDBY FAILURE RATE (1987-1995)
SYSTEMISOURCE LOWER BOUND MEAN UPPER BOUND AFW system 1.4E-5/hour 1.8E-5/hour 2.1 E-5lhour RCIC system 9.1E-6/hour 1.3E-5/hour 1.7E-5/hour HPCI system 2.1E-5/hour 2.9E-5/hour 3.8E-5/hour
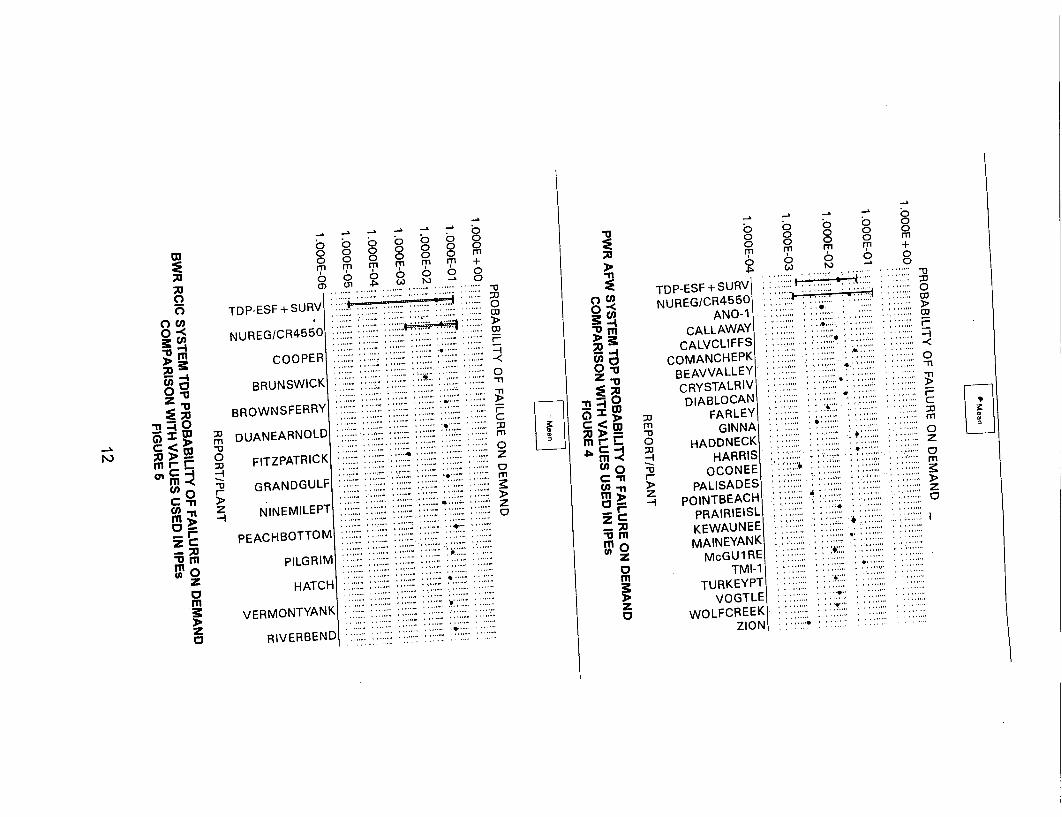
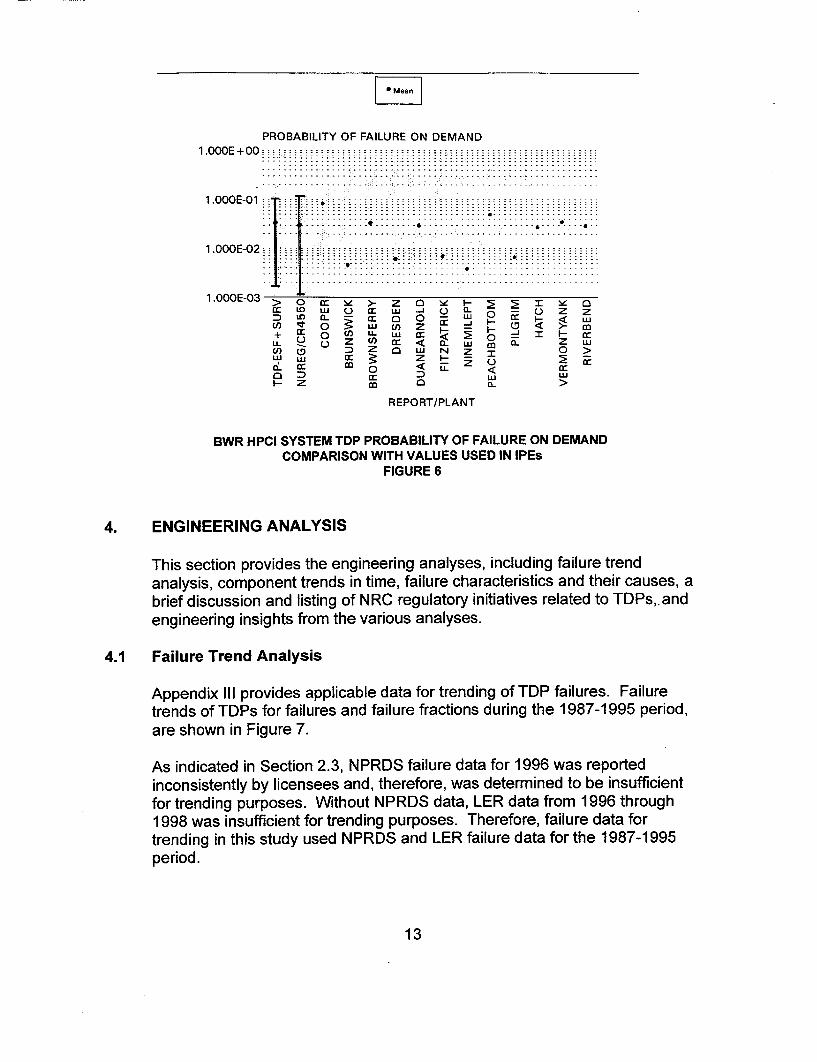
3.2 Comparison With IPEs and Other Sources
The TDP failure probabilities on demand developed for the PWR AFW system and the BWR RCIC and HPCI systems were compared with a selected group of plant-specific individual plant examinations (IPEs),as shown in Figures 4, 5, and 6, respectively. The sample of IPEs selected was from those with available data that identified a "failure to start" probability of failure on demand for TDPs.
For the BWR RCIC and HPCI systems (1987-1995 data), all of the IPE mean values for the TDP failure on demand probability were within the range of this study and NUREG/CR-4550. Although the 1995 HPCI probability range is narrower, it is provided for information only for comparison with plant IPE mean values. For the AFW system, more than 90% of the IPE mean values were also within the range of this study and NUREG/CR-4550.
11
SPIP,
o 0 0 0 ) 0 0
o00 0 0 0m
TDP-ESF +S R .........
NUREG/CR455 0
C O O P E R ....
BRUN SWIGCK
DUANEARNOLD
FITZPATRICK ...
GRANDGULF ..... ...ý
NINEMILEPT....
PEACHBOTTOM.....
PILGRIM
H ATCH
VERMONTYANK
RIVERBEND
n
m 0 z ci m
z ci
-0
"nI
Urn
0-0 z
-C n
mrn
CA0 rn
z ; M0
TDP-ESF +SUR NUREG/CR4.5
AND CALLAWi
CALVCLIFr COMANCHEI
B EAVVALLI C RYSTAILR DIABLOCJ
FARL GINI
HADIDNE HARI
oCO!N PALISAE
POINTBEA PRAIRIE KEWAUI MAINEY
McGU TI
TURKE VOG
WOLFCR
-v 0
-I
o 0 0
o 0
'K
EY
NA CK RIS
ES ,CH ISL
NJEE. ~NK 1RE ....
.MI-1..... YPT TLE EEK ... nIoN
X
0
ino CAn
0-0
-Ura
0
rnrn zn 0i
m -u 0
0 0 m
0 .-
u
0 co
I-
9
n1
0 n
m
z
PROBABILITY OF FAILURE ON DEMAND
. . ... ... .... . . . .. .. . ...• .. .. . .. .. . ... . . 1. .. . .. • ... . .. . . •.. 1.OOOE+O- - - . ..
1.0E3 6 :I - z o • I- >
~~ o ~ FIGURE -J6a -<
eniern &nihsfo thevarou analyses
I. ....... . .
4. ENGiNEreTrInG Analysis
ThispecindiI provides thepeninebern danalystesdincluf Din failures trendr arnalss, omTPsonen talrens indtme failure frcharacteurisgticsan their99 cauesoda
are shown in Figure 7.
As indicated in Section 2.3, NPRDS failure data for 1996 was reported inconsistently by licensees and, therefore, was determined to be insufficient for trending purposes. Without NPRDS data, LER data from 1996 through 1998 was insufficient for trending purposes. Therefore, failure data for trending in this study used NPRDS and LER failure data for the 1987-1995 period.
13
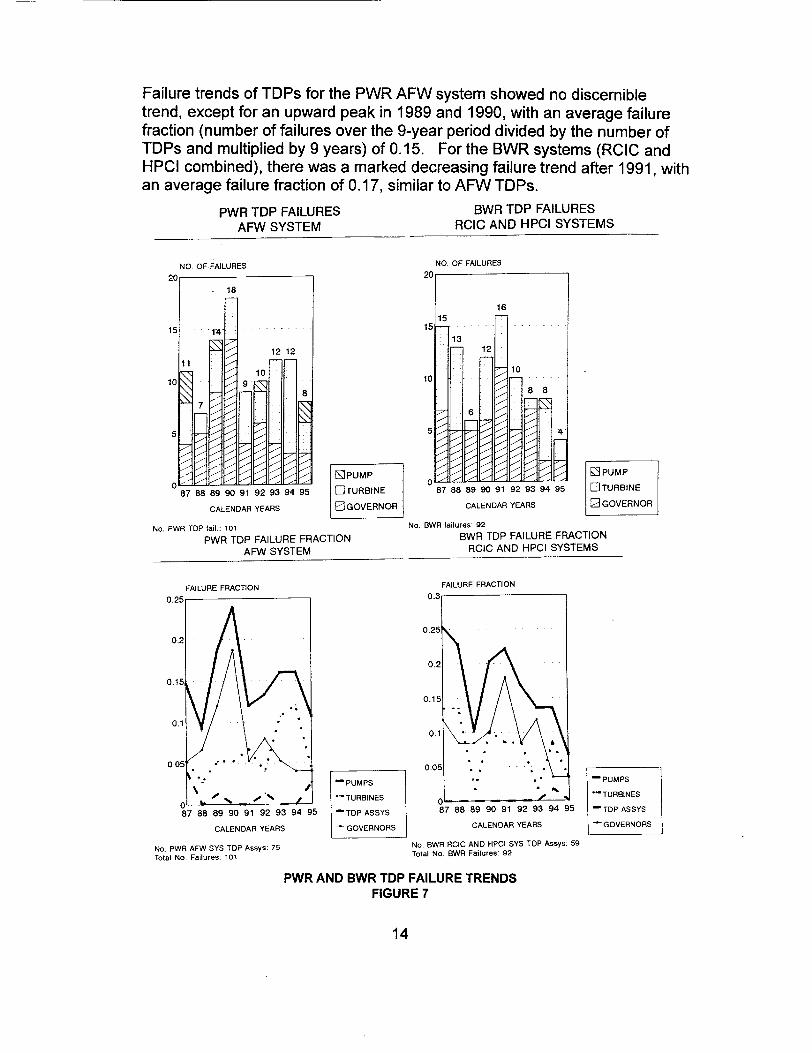
Failure trends of TDPs for the PWR AFW system showed no discernible trend, except for an upward peak in 1989 and 1990, with an average failure fraction (number of failures over the 9-year period divided by the number of TDPs and multiplied by 9 years) of 0.15. For the BWR systems (RCIC and HPCI combined), there was a marked decreasing failure trend after 1991, with an average failure fraction of 0.17, similar to AFW TDPs.
PWR TDP FAILURES BWR TDP FAILURES AFW SYSTEM RCIC AND HPCI SYSTEMS
NO. OF FAILURES
0IF 18
NO. OF FAILURES
20
15
10
0HHHHU PUMP
87 88 89 90 91 92 93 94 95 LITURBINE
CALENDAR YEARS LI GOVERNOR
No. PWR TDP fail.: 101
PWR TDP FAILURE FRACTION AFW SYSTEM
16
15
13 - 12
10
// 8 8
87 88 89 90 91 92 93 94 95
CALENDAR YEARS
R1 PUMP
EI TURBINE
0GOVERNOR
No. BWR failures: 92
BWR TDP FAILURE FRACTION RCIC AND HPCI SYSTEMS
FAILURE FRACTIONFAILURE FRACTION
CALENDAR YEARS
No. PWR AFW SYS TOP Assys: 75 Total No. Failures: 101
0.
0.2
0
0.1
0
-PUMPS
-TURBINES
- TDP ASSYS
-GOVERNORS
.3
:5
.2
5
05
87 88 89 90 91 92 93 94 95
CALENDAR YEARS
- PUMPS
TURBINES
TDP ASSYS
-GOVERNORS
No BWR RCIC AND HPCI SYS TOP Assys: 59 Total No. BWR Failures: 92
PWR AND BWR TDP FAILURE TRENDS FIGURE 7
14
5
0..
4.2 Component Trends in Time Methodology
The initial assumption made in this study is that the rate of failure events over time (A) is constant. Several evaluation methods were used to check this assumption. The reason for checking was to determine if any significant age- related increase in A occurred among older plants. In order to conclude that an increase in A due to "aging" occurred, it would be necessary for the following conditions to be present: 1. There was an increase in A over time (a nonconstant failure rate
that was increasing) and, 2. A was higher for the older plants and, 3. The dominant contributor to failure was due to age/wear
mechanisms.
When individual failure events are arranged in chronological order, a cumulative plot helps to show whether A is constant throughout the period.
This study used an average failure rate, AAVE., equal to the total number of TDP failures (ESF failure data and surveillance test failure data) for the 1987-1995 period, divided by the cumulative number of TDP component-years of operation during the period. Failure data from the 1996-1998 period was not included since it was for ESF failure and limited surveillance test data only.
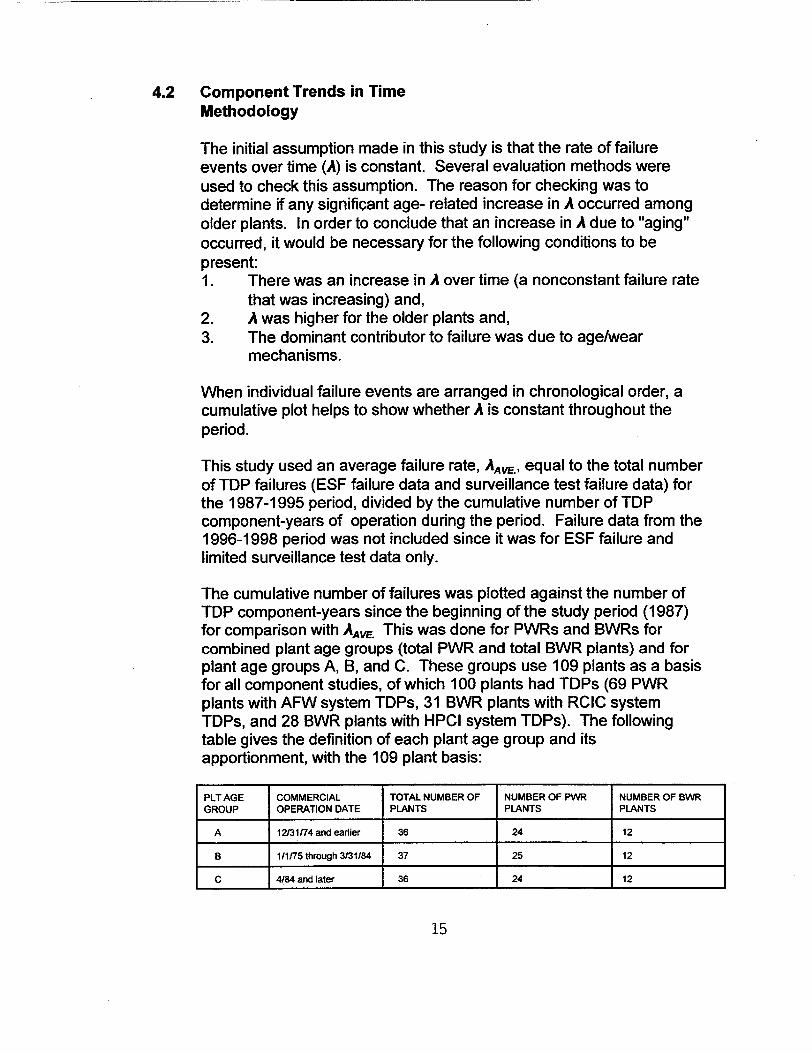
The cumulative number of failures was plotted against the number of TDP component-years since the beginning of the study period (1987) for comparison with AAVE. This was done for PWRs and BWRs for combined plant age groups (total PWR and total BWR plants) and for plant age groups A, B, and C. These groups use 109 plants as a basis for all component studies, of which 100 plants had TDPs (69 PWR plants with AFW system TDPs, 31 BWR plants with RCIC system TDPs, and 28 BWR plants with HPCI system TDPs). The following table gives the definition of each plant age group and its apportionment, with the 109 plant basis:
PLT AGE COMMERCIAL TOTAL NUMBER OF NUMBER OF PWR NUMBER OF BWR
GROUP OPERATION DATE PLANTS PLANTS PLANTS
A 12/31/74 and earlier 3W 24 12
B 1/1/75 through 3/31/84 37 25 12
C 4/84 and later 36 24 12
15
The assumption (i.e., null hypothesis) that AAVE. is constant during the study period for each plant age group and for the combined plant age groups was evaluated. The failure rates (AAvE.) are the slope of the plots for each plant age group. Comparison between plant age groups were made to determine whether there was any indication of plant aging (e.g., higher slope for the older plant age groups than for the newer plant age groups). A statistical test for the null hypothesis that the failure rate is constant is the Laplace test. For this test, L/2 is defined as the midpoint of the cumulative number of component-years during the 1987-1995 period. If A is constant, about half of the events should occur before L12 and half afterwards. The criteria for not rejecting the null hypothesis is that the statistic U is approximately normal for a number of failures > 3 (U is within + 1.645 for the 0.95th and 0.05th quantiles, respectively, of the standard distribution). For a nonconstant failure rate (rejected null hypothesis) that is increasing (U >+1.645), possible aging exists. The formula for the U statistic is:
U = T-L/2 where: n = no. of failures, Ti = interval between failures in component-years, Lx/ 1/12n T= 2Ti/n
The mean time between failures was provided for information, using the reciprocal of the AAvE. applicable to each PWR and BWR plant age group and the combined plant age groups.
Results
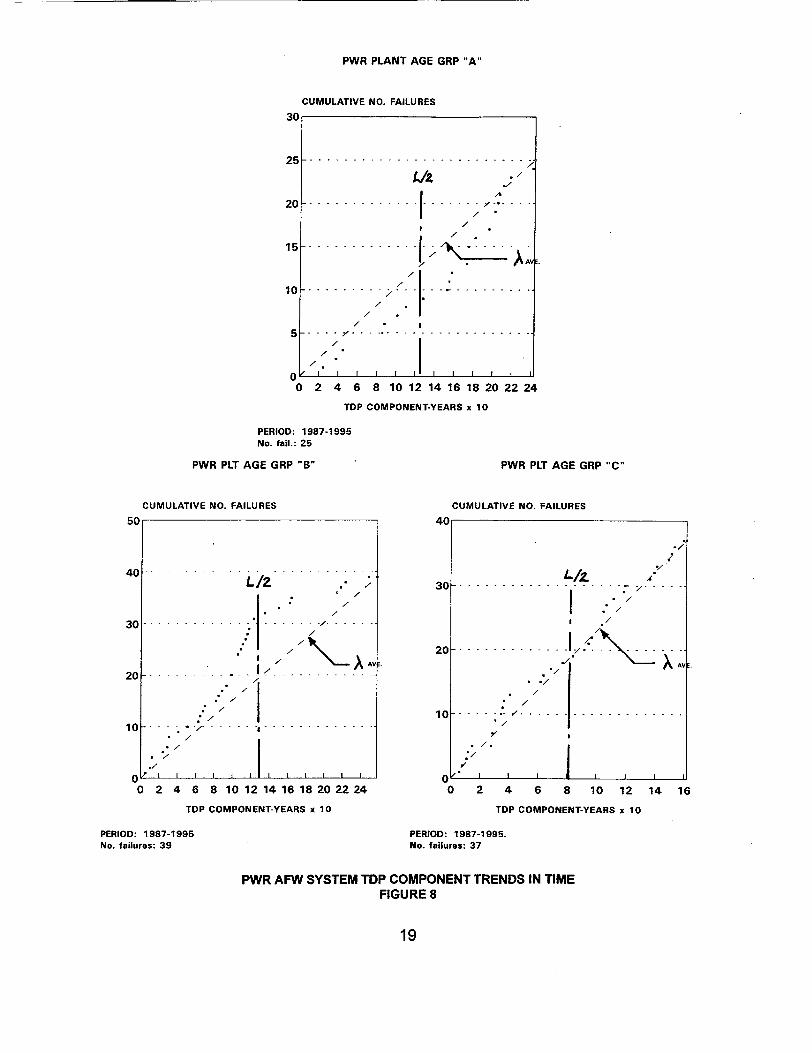
Appendix II provides tables applicable to component trends in time evaluations of TDPs. These analyses were performed to determine whether the failure rates were constant over time and whether the failure rates between older and newer plant age groups increased as an indication of possible "aging." The plots of cumulative TDP failures over time compared to the applicable average failure rate (AAVE.) plots for PWRs and BWRs indicated the following:
PWRs (see Figure 8) - For the AFW system, a review of plant age groups did not show evidence of an increase in A for any of the plant age groups due to an "aging" mechanism.
For plant age group A, the assumed hypothesis that the failure rate was constant was rejected. The value of U at the 10% significance level was +2.181 (>+1.645) and indicated a nonconstant failure rate (increasing) and possible "aging."
For plant age group B, the hypothesis of a constant failure rate was also rejected. The value of U at the 10% significance level was -2.618
16
(< -1.645 ). Although the failure rate was nonconstant, it was decreasing. Therefore, there is no evidence of "aging."
For plant age group C, the hypothesis of a constant failure rate was not rejected. The value of U was -0.27 (very close to zero) and did not provide any evidence of a nonconstant failure rate.
When the average failure rates were compared among the plant age groups, plant age effects were assumed to be reflected by highest average failure rates for the older plant age group A, ranging to the lowest average failure rate for plant age group C. However, the reverse order occurred, where AAVE. for A (0.10) was lower than B (0.15), and both were lower than C (0.22). Therefore, there was no evidence of increasingly higher failure rates as a function of plant age groups.
When the failure causes for PWR TDP assemblies were reviewed, age/wear causes (26%), maintenance/procedural deficiencies (24%) and "other" causes (24%) were found to be more significant (see Figure 11). Therefore, age/wear mechanisms were not the predominant cause of failure.
BWRs (see Figure 9) - For the combined RCIC and HPCI systems TDPs, the review of plant age groups did not show evidence of an increase in A for any of the plant age groups due to an "aging" mechanism.
For plant age group A, the hypothesis of a constant failure rate was not rejected. The value of U at the 10% significance level was -0.54 (>1.645) and did not provide any evidence of a nonconstant failure rate.
For plant age group B, the hypothesis of a constant failure rate was rejected. The value of Uat the 10% significance level was -0.1.81 (< -1.645). Although the failure rate was nonconstant, it was decreasing. Therefore, there is no evidence of "aging."
For plant age group C, the hypothesis was not rejected. The value of U was -1.60 (>-1.645) and did not provide evidence of a nonconstant failure rate.
When the average failure rates were compared among the plant age groups, plant age effects were assumed to be reflected by highest average failure rates for the older plant age group A, ranging to the lowest average failure rate for plant age group C. Both plant age groups A (0.20) and B (0.22) were higher than C (0.11), While plant
17
age group B was slightly higher than A. Therefore, there was no evidence of increasingly higher failure rates as a function of plant age groups.
The more significant failure causes for BWR RCIC TDP assemblies were age/wear (30%), maintenance/procedural deficiencies (27%) and "unknown" causes (23%), while for the BWR HPCI TDPs, maintenance/procedural deficiencies (45%) was the more significant (see Figures 12 and 13). Therefore, age/wear mechanisms were not the predominant cause of TDP failure.
18
PWR PLANT AGE GRP "A"
CUMULATIVE NO. FAILURES
2 4 6 8 10 12 14 16 18 20 22 24
TOP COMPONENT-YEARS x 10
PERIOD: 1987-1995 No. fail.: 25
PWR PLT AGE GRP "B"
CUMULATIVE NO. FAILURES
40F -
30 .....
20F .....
.. z ... .
A
* 7 ,�7.
.7 I :7 I
:7 7
I I� I I I I I I
PWR PLT AGE GRP "C"
CUMULATIVE NO. FAILURES
30
20
10
0 2 4 6 8 10 12 14 16 18 20 22 24
TOP COMPONENT-YEARS x 10
PERIOD: 1987-1995 No. failures: 39
0 2 4 6 8 10 12
TDP COMPONENT-YEARS x 10
PERIOD: 1987-1995. No. failures: 37
PWR AFW SYSTEM TDP COMPONENT TRENDS IN TIME FIGURE 8
19
0 v 0
10
* 7
S I I
/ -----------
S . f
S.7
/
'/
//
/ " I II I I I
E.
14 16
° .
J

BWR PLT AGE GRP "A"
CUMULATIVE NO. FAILURES
25
20
15
10
5
0 2 4 6 8 10 12 14
TDP COMPONENT-YEARS x 10
PERIOD: 1987-1995 No. failures: 29
BWR PLT AGE GRP "B" BWR
CUMULATIVE NO. FAILURES CUMULATIVE N(
40
30
20
10
0 2 4 6 8 10 12 14 16 18 20
TDP COMPONENT-YEARS x 10
PERIOD: 1987-1995 No. failures: 47
PLT AGE GRP "C"
0. FAILURES
0 2 4 6 8 10 12 14
TDP COMPONENT-YEARS x 10
PERIOD: 1987-1995 No. failures: 16
BWR RCIC/HPCI SYSTEMS TDP COMPONENT TRENDS IN TIME FIGURE 9
20
•/
.. . . . . . .. .. . . . . . . . . .. .. ...
°/ ...... .. .... . . . .... . .. ... ...... ............ ..
/1oA /
... . ..................
/ /
/
* / */
/
/ /
I-
/
/ • /
///
A"/
"/
.. . . . .. . . . . . .
. .. . . . .
-Anl
II t t i I i I t
9;n
11 ~ ~~~ II t
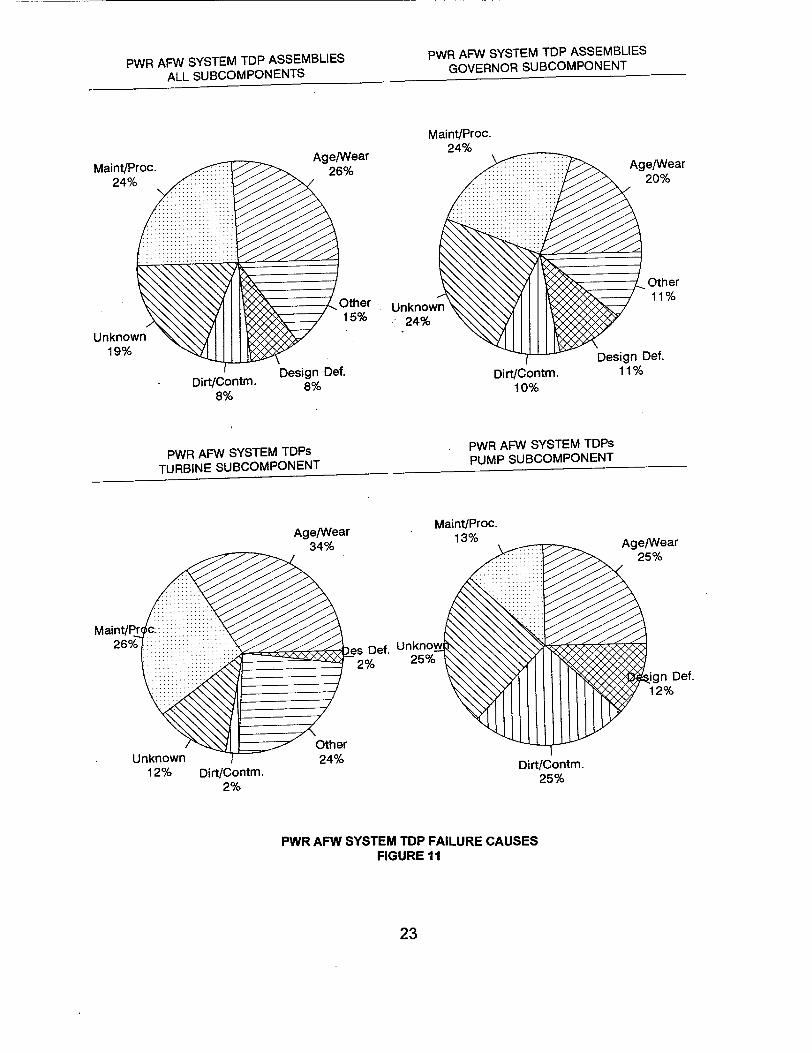
4.3 Failure Characteristics and Their Causes
Methodology
The TDP assembly failures and causes were identified at the subcomponent level in the NPRDS database. LER reported failures in the SCSS database provided sufficient information to identify failed subcomponents and causes within the LER narrative and to group these failures using the NPRDS cause categories. The apportionments were determined to provide insights into the predominant subcomponent failures and their causes by reactor type (PWR and BWR).
The subcomponent parts were also grouped by PWR and BWR, with the percentage of failure causes for the subcomponent calculated. The cause categories of failure used are similar to those defined in NPRDS.
The failure cause categories used in this study were as follows:
-Age/Wear (AW) -Dirt/Contamination/Corrosion (DC) -Design Deficiency (DD) -Manufacturing Defect (MF) -Unknown (UK) -Debris/Foreign Material (DF) -Out-of-Adjustment (OA) -Setpoint Drift (SD) -Other Devices (OD) -Maintenance/Procedural Deficiencies (MP)
Results
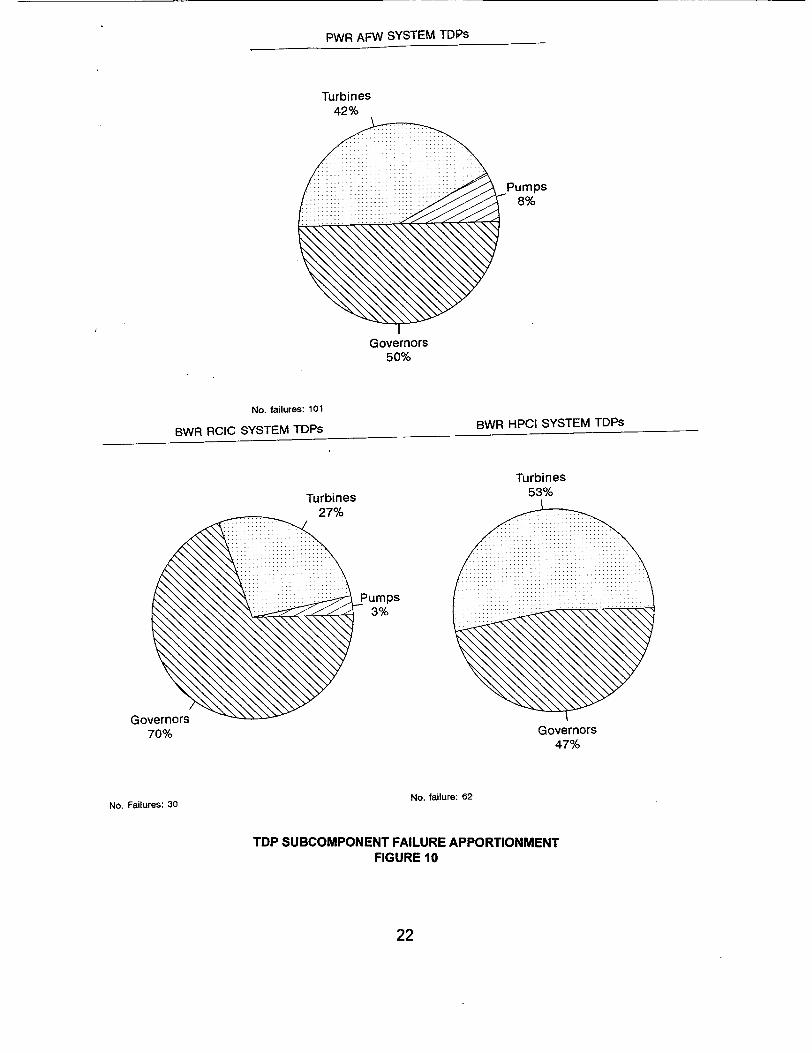
Figure 10 shows the TDP subcomponent failure apportionment for the PWR AFW system and the BWR RCIC and HPCI systems. For BWRs, the evaluation of TDP subcomponent failure patterns determined that governor failures (70%) were predominant in the RCIC system, while turbine failures (53%) and governor failures (47%) were approximately equal for the HPCI system. Pump subcomponent failures were relatively insignificant (3% for RCIC and no failures for HPCI). For PWRs, the evaluation of AFW system subcomponent failure patterns determined that governor failures (50%) and turbine failures (42%) were predominant, with few pump failures (8%).
Failure causes for all TDP assemblies are shown in Figures 11,12,and 13. For the PWR AFW system, the causes were mainly age/wear (26%) and maintenance/procedural deficiencies(24%). For the BWR RCIC system, the causes were also mainly age/wear (30%) and maintenance/procedural deficiencies (27%), while for the HPCI system the cause was predominantly maintenance/procedural deficiencies (45%).
21
PWR AFW SYSTEM TDPs
Turbines 42%
Pumps 8%
Governors 50%
No. failures: 101
BWR RCIC SYSTEM TDPs BWR HPCI SYSTEM TDPs
Turbines 53%
Turbines 27%
Governors 70%
No. Failures: 30
Governors 47%
No. failure: 62
TDP SUBCOMPONENT FAILURE APPORTIONMENT FIGURE 10
22
PWR AFW SYSTEM TDP ASSEMBLIES PWR AFW SYSTEM TDP ASSEMBLIES
ALL SUBCOMPONENTS GOVERNOR SUBCOMPONENT
Maint/Proc. 24%
Unknown 19%
Dirt/Contm. 8%
Age/Wear 26%
Other 15%
Maint/Proc. 24%
Age/Wear 20%
Unknown 24%
Design Def. 8%Dirt/Contm. 10%
Other 11%
Design Def. 11%
PWR AFW SYSTEM TDPs PWR AFW SYSTEM TDPs
TURBINE SUBCOMPONENT PUMP SUBCOMPONENT
Age/Wear Maint/Proc.
a 13%Age/Wear
es Def. Unkflow 2% 25%
2iin Def.
Unknown 12% ' =" '°Dirt/Contm. Dirt/Contm. 25%
2%
PWR AFW SYSTEM TDP FAILURE CAUSES FIGURE 11
23
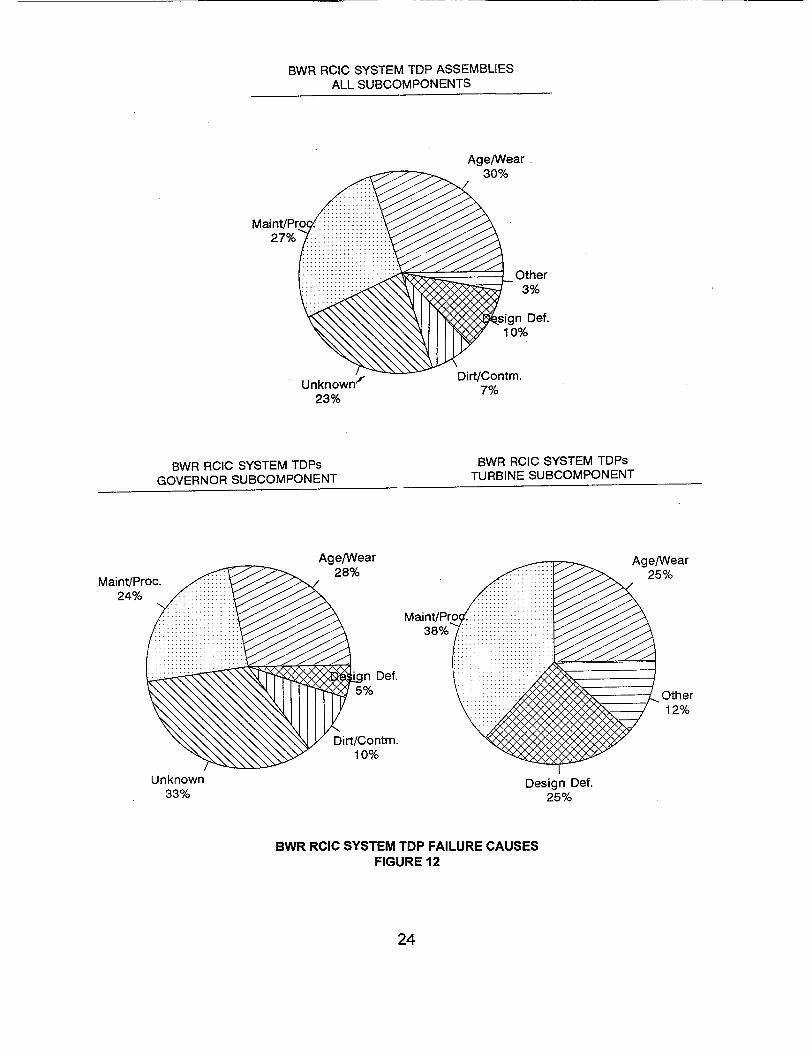
BWR RCIC SYSTEM TDP ASSEMBLIES ALL SUBCOMPONENTS
Age/Wear 30%
Other 3%
ign Def. 10%
23%
BWR RCIC SYSTEM TDPs BWR RCIC SYSTEM TDPs
GOVERNOR SUBCOMPONENT TURBINE SUBCOMPONENT
Age/Wear Age/Wear 28%..
Maint/Proc. 25%
2 4 % :::.. .. .......
Unknown Design Def. 33% 25%
BWR RCIC SYSTEM TDP FAILURE CAUSES FIGURE 12
24
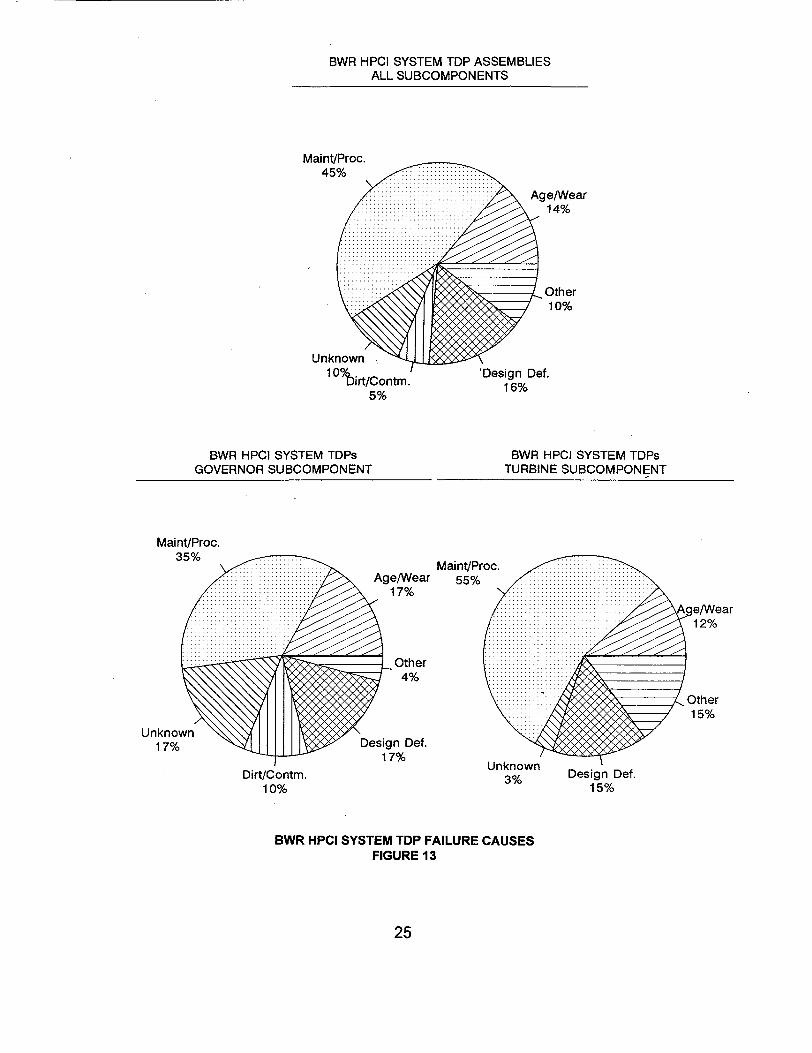
BWR HPCI SYSTEM TDP ASSEMBLIES ALL SUBCOMPONENTS
Maint/Proc. 45%
Age/Wear 14%
SOther 10%
Unknown 1 0/birt/Contm.
5%
'Design Def. 16%
BWR HPCI SYSTEM TDPs GOVERNOR SUBCOMPONENT
Maint/Proc. 35%
BWR HPCI SYSTEM TDPs TURBINE SUBCOMPONENT
Maint/Proc. 55%
Dirt/Contm. 10%
BWR HPCI SYSTEM TDP FAILURE CAUSES FIGURE 13
25
Unknown 17%
4.4 Related Issues - Information Notices
The review of NRC regulatory initiatives related to TDP assemblies and their subcomponents included Generic Letters, Circulars, Bulletins, and Information Notices (INs). This review determined that no regulatory initiatives, other than the 12 INs (some with supplements) listed in Table C, were applicable to TDP assemblies and their subcomponents during the 1987-1998 period. IN 8614 and its supplements were included in the review, since they were issued near the beginning of the study period and addressed overspeed trips in the AFW, RCIC, and HPCI systems. Other than overspeed trips, the INs were generally concerned with potential problems, rather than complete (i.e., catastrophic) failures that were a basis for this study. One complete failure, reported in LER 278-90010, was directly related to the overspeed trip failure described in IN 88-67. As a potential generic issue, IN 97-65 addressed preconditioning of PWR AFW system TDPs. However, no evidence of preconditioning was found in the LERs reviewed within the scope of this study.
TABLE C NRC INFORMATION NOTICES (INs) CONCERNING TDP ASSEMBLIES (1986-1998)
IN 86-14 IN 86-14 (Supp. 1) IN 86-14 (Supp. 2) IN 88-09 IN 88-67 IN 89-14
IN 89-58
IN 90-45 IN 90-51 IN 90-51 (Supp. 1) IN 90-76
IN 93-51 IN 94-66 IN 96-66 (Supp. 1) IN 94-84 IN 97-16
IN 98-24
PWR Auxiliary Feedwater Pump Turbine Control Problems Overspeed Trips of AFW, HPCI, and RCIC Turbines Overspeed Trips of AFW, HPCI, and RCIC Turbines Instability of Woodward PG-PL Type Governors PWR Auxiliary Feedwater Pump Turbine Overspeed Trip Failure Inadequate Dedication Process for Commercial Grade Components Which Lead to Common Mode Failure of a Safety System Turbine-Driven Auxiliary Feedwater Pump Disablement from Closure of One Parallel Steam Supply Valve Auxiliary Feedwater Pump Turbine Overspeed and System Overpressurization EGM Governor Voltage Dropping Resistor Failures EGM Governor Voltage Dropping Resistor Failures Failure of Turbine Overspeed Trip Mechanism Because of Inadequate Spring Tension Repetitive Overspeed Tripping of Turbine-Driven Auxiliary Feedwater Pumps Overspeed of Turbine-Driven Pumps Caused By Governor Valve Stem Binding Overspeed of Turbine-Driven Pumps Caused By Governor Valve Stem Binding Air Entrainment in Terry Turbine Lubricating System Preconditioning of Plant Structures, Systems, and Components Before ASME Code Inservice Testing or Technical Specification Surveillance Testing Stem Binding in Turbine Governor Valves in Reactor Core Isolation Cooling (RCIC) and Auxiliary Feedwater (AFW) Systems
26

5. SUMMARY OF RESULTS
5.1 Failure Probabilities
For the PWR AFW system, the TDP probability of failure on demand estimate was based on ESF failure and demand data from LERs for the period 1987-1998. The resulting mean probability estimate was 1.6E2. This value is generally consistent with the generic mean value for TDPs (13E-2) from NUREG/CR-4550, which was the input to NUREG1150.
For the BWR RCIC and HPCI systems, the TDP probability of failure on demand estimates were based on the combined ESF and surveillance test data for failures and demands from LER and NPRDS data sources. The ESF data (reported by LERs) was from the 1987-1998 period, and the surveillance test data (NPRDS) was from the 1987-1995 period. The resulting mean probability estimates for RCIC and HPCI systems TDPs were 2.2E-2 and 3.3E-2, respectively. These mean values were consistent with the generic mean value for TDPs (3E-2) from NUREG/CR-4550. For the BWR HPCI system, the probability of failure on demand over the 1987-1995 period showed a decreasing trend. However, data over the entire period (1987-1998) was evaluated as more meaningful and is consistent with the NUREG/CR-4550 generic mean value for TDPs (3E-3).
The TDP mean probabilities of failure on demand used in plant-specific IPE studies were compared with the results of this study. For the BWR RCIC and HPCI systems, all of the IPE mean values for the TDP failure on demand probability were within the range of this study and NUREG/CR-4550. For the AFW system, 90% of the IPE mean values were also within the probability of failure on demand range estimated in this study and NUREG/CR-4550.
5.2 Engineering Insights
The engineering insights gained from this study are as follows:
Failure trends for the PWR AFW system during the 1987-1995 period were relatively constant, except for an upward peak in 1989 and 1990. For BWRs (RCIC and HPCI systems combined), there was a marked decreasing trend after 1991.
27
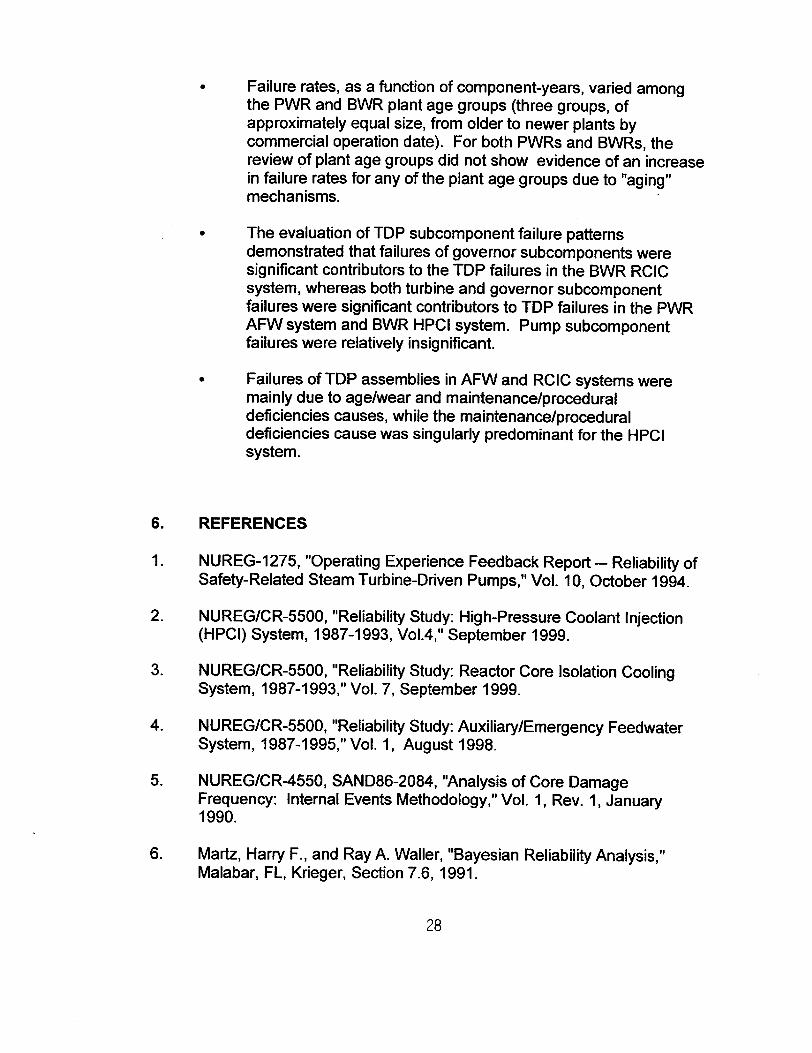
Failure rates, as a function of component-years, varied among the PWR and BWR plant age groups (three groups, of approximately equal size, from older to newer plants by commercial operation date). For both PWRs and BWRs, the review of plant age groups did not show evidence of an increase in failure rates for any of the plant age groups due to "aging" mechanisms.
The evaluation of TDP subcomponent failure patterns demonstrated that failures of governor subcomponents were significant contributors to the TDP failures in the BWR RCIC system, whereas both turbine and governor subcomponent failures were significant contributors to TDP failures in the PWR AFW system and BWR HPCI system. Pump subcomponent failures were relatively insignificant.
Failures of TDP assemblies in AFW and RCIC systems were mainly due to age/wear and maintenance/procedural deficiencies causes, while the maintenance/procedural deficiencies cause was singularly predominant for the HPCI system.
6. REFERENCES
1 . NUREG-1275, "Operating Experience Feedback Report - Reliability of Safety-Related Steam Turbine-Driven Pumps," Vol. 10, October 1994.
2. NUREG/CR-5500, "Reliability Study: High-Pressure Coolant Injection (HPCI) System, 1987-1993, Vol.4," September 1999.
3. NUREG/CR-5500, "Reliability Study: Reactor Core Isolation Cooling System, 1987-1993," Vol. 7, September 1999.
4. NUREG/CR-5500, "Reliability Study: Auxiliary/Emergency Feedwater System, 1987-1995," Vol. 1, August 1998.
5. NUREG/CR-4550, SAND86-2084, "Analysis of Core Damage Frequency: Internal Events Methodology," Vol. 1, Rev. 1, January 1990.
6. Martz, Harry F., and Ray A. Waller, "Bayesian Reliability Analysis," Malabar, FL, Krieger, Section 7.6, 1991.
28
APPENDIX I
FAILURE PROBABILITIES
TDP ASSEMBLY
TABLE NO.
I
IlI
APPENDIX I - TDP ASSEMBLY FAILURE PROBABILITIES
DESCRIPTION PAGE
AFW System TDP Assemblies - Probability of Failure on Dem and ........................................ 1-2
RCIC System TDP Assemblies - Probability of Failure on Dem and ........................................ 1-3
HPCI System TDP Assemblies - Probability of Failure on Dem and ........................................ 1-4
I-1
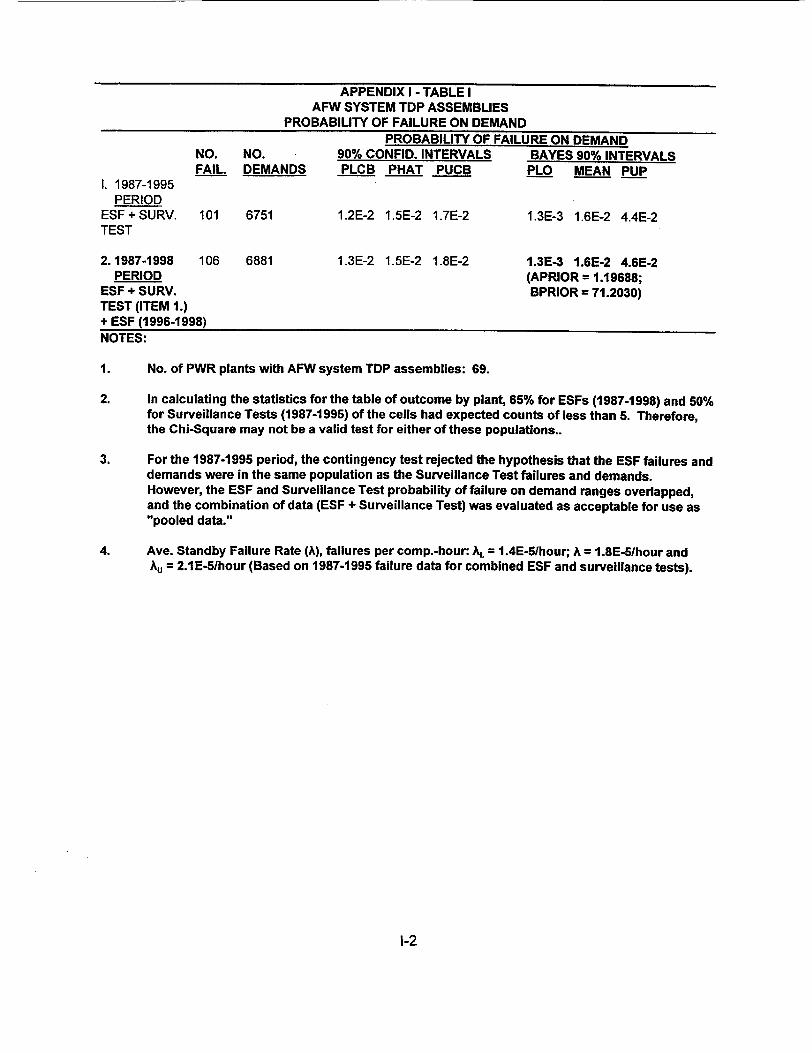
APPENDIX I - TABLE I AFW SYSTEM TDP ASSEMBLIES
PROBABILITY OF FAILURE ON DEMAND PROBABILITY OF FAILURE ON DEMAND
NO. NO. 90% CONFID. INTERVALS BAYES 90% INTERVALS FAIL. DEMANDS PLCB PHAT PUCB PLO MEAN PUP
I. 1987-1995 PERIOD
ESF + SURV. 101 6751 1.2E-2 1.5E-2 1.7E-2 1.3E-3 1.6E-2 4.4E-2 TEST
2.1987-1998 106 6881 1.3E-2 1.5E-2 1.8E-2 1.3E-3 1.6E-2 4.6E-2 PERIOD (APRIOR = 1.19688;
ESF + SURV. BPRIOR = 71.2030) TEST (ITEM 1.) + ESF (1996-1998) NOTES:
1. No. of PWR plants with AFW system TDP assemblies: 69.
2. In calculating the statistics for the table of outcome by plant, 65% for ESFs (1987-1998) and 50% for Surveillance Tests (1987-1995) of the cells had expected counts of less than 5. Therefore, the Chi-Square may not be a valid test for either of these populations..
3. For the 1987-1995 period, the contingency test rejected the hypothesis that the ESF failures and demands were in the same population as the Surveillance Test failures and demands. However, the ESF and Surveillance Test probability of failure on demand ranges overlapped, and the combination of data (ESF + Surveillance Test) was evaluated as acceptable for use as "pooled data."
4. Ave. Standby Failure Rate (A), failures per comp.-hour: AL = 1.4E-51hour; A = 1.8E-51hour and Au = 2.1 E-5/hour (Based on 1987-1995 failure data for combined ESF and surveillance tests).
1-2

APPENDIX I - TABLE II RCIC SYSTEM TDP ASSEMBLIES
PROBABILITY OF FAILURE ON DEMAND PROBABILITY OF FAILURE ON DEMAND
NO. NO. 90% CONFID. INTERVALS BAYES 90% INTERVALS FAIL. DEMANDS PLCB PHAT PUCB PLO MEAN PUP
I. 1987-1995 PERIOD
ESF + SURV. 30 1937 1.1E-2 1.6E-2 2.1E-2 9.7E-6 2.OE-2 8.6E-2 TEST
2.1987-1998 30 1955 1.1E-2 1.6E-2 2.1E-2 9.1E-6 2.OE-2 8.7E-2 PERIOD (APRIOR = 0.354231;
ESF + SURV. BPRIOR = 17.2357) TEST (ITEM 1.) + ESF (1996-1998)
NOTES: 1. No. BWR plants with RCIC system TDP assemblies: 31.
2. In calculating the statistics for the table of outcome by plant, 50% of the cells had expected counts of less than 5. Therefore, the Chi-Square may not be a valid test.
3. The contingency test did not reject the hypothesis that the ESF failures and demands were in the same population as the surveillance test failures and demands (1987-1995 data). In addition, another contingency test that compared the combined 1987-1995 data with the later ESF data (1996-1998) also did not reject the hypothesis that this data was in the same population. Therefore, the Bayes 90% intervals for ESF + Surveillance Test (1987-1995) + ESF (1996-1998) probability of failure on demand is recommended as the more useful values as "pooled data.".
4. Ave. Standby Failure Rate (h), failures per comp.-hour: AL = 9.1 E-61hour; A =- 1.3E-51hour and Au = 1.7E-5/hour.
1-3
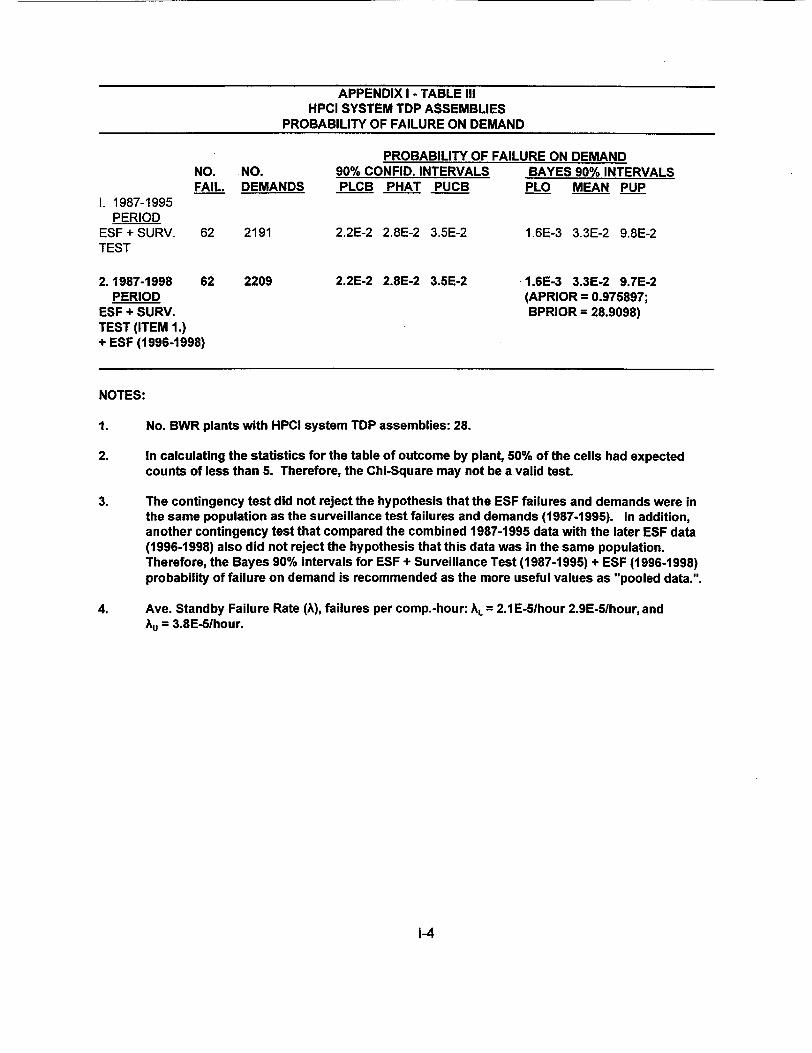
APPENDIX I - TABLE III HPCI SYSTEM TDP ASSEMBLIES
PROBABILITY OF FAILURE ON DEMAND
NO. NO. FAIL. DEMANDS
1. 1987-1995 PERIOD
ESF + SURV. 62 2191 TEST
2. 1987-1998 62 2209 PERIOD
ESF + SURV. TEST (ITEM 1.) + ESF (1996-1998)
PROBABILITY OF FAILURE ON DEMAND 90% CONFID. INTERVALS BAYES 90% INTERVALS PLCB PHAT PUCB PLO MEAN PUP
2.2E-2 2.8E-2 3.5E-2
2.2E-2 2.8E-2 3.5E-2
1.6E-3 3.3E-2 9.8E-2
1.6E-3 3.3E-2 9.7E-2 (APRIOR = 0.975897; BPRIOR = 28.9098)
NOTES:
1. No. BWR plants with HPCI system TDP assemblies: 28.
2. In calculating the statistics for the table of outcome by plant, 50% of the cells had expected counts of less than 5. Therefore, the Chi-Square may not be a valid test
3. The contingency test did not reject the hypothesis that the ESF failures and demands were in the same population as the surveillance test failures and demands (1987-1995). In addition, another contingency test that compared the combined 1987-1995 data with the later ESF data (1996-1998) also did not reject the hypothesis that this data was in the same population. Therefore, the Bayes 90% intervals for ESF + Surveillance Test (1987-1995) + ESF (1996-1998) probability of failure on demand is recommended as the more useful values as "pooled data.".
4. Ave. Standby Failure Rate (A), failures per comp.-hour: AL = 2.1 E-5/hour 2.9E-S/hour, and A, = 3.8E-5/hour.
1-4

APPENDIX II
TDP ASSEMBLY
COMPONENT TRENDS IN TIME
APPENDIX II TDP ASSEMBLY COMPONENT TRENDS IN TIME - TDP ASSEMBLIES
TABLE NO.
II
Ill
IV
V
VI
VII
VIII
DESCRIPTION
PWR AFW System TDP Assembly Failures Versus ComponentYears - All Plant Age Groups - ESF and Surveillance Test Fa ilures .. .... ... .......... ........ ... ... ... .... ... ..
PWR AFW System TDP Assembly Failures Versus ComponentYears - Plant Age Group "A" - ESF and Surveillance Test F a ilu re s . . .. . . .. . . ... . .. . . . .. . . ... . . . . . .. . .. . .. . .. . . .
PWR AFW System TDP Assembly Failures Versus ComponentYears - Plant Age Group "B" - ESF and Surveillance Test F a ilu re s . . .. . . .. . .. .. .. .. . ... .. ... . .. . . .. . . . .. . . .. . ..
PWR AFW System TDP Assembly Failures Versus ComponentYears - Plant Age Group "C" - ESF and Surveillance Test Failures Distribution From 01/01/87 ...............................
BWR RCIC and HPCI System TDP Assembly Failures Versus Component-Years - All Plant Age Groups - ESF and Surveillance Test Failures ................................
BWR RCIC and HPCI System TDP Assembly Failures Versus Component-Years - Plant Age Group "A" -ESF and Surveillance Test Failures ................................
BWR RCIC and HPCI System TDP Assembly Failures Versus Component-Years - Plant Age Group "B" -ESF and Surveillance Test Failures ................................
BWR RCIC and HPCI System TDP Assembly Failures Versus Component-Years - Plant Age Group "C" -ESF and Surveillance Test Failures ................................
PAGE
.... 11-2
.... 11-3
.... 11-4
... 11-5
... 11-6
... 11-7
... 11-8
... 11-9
I1-1
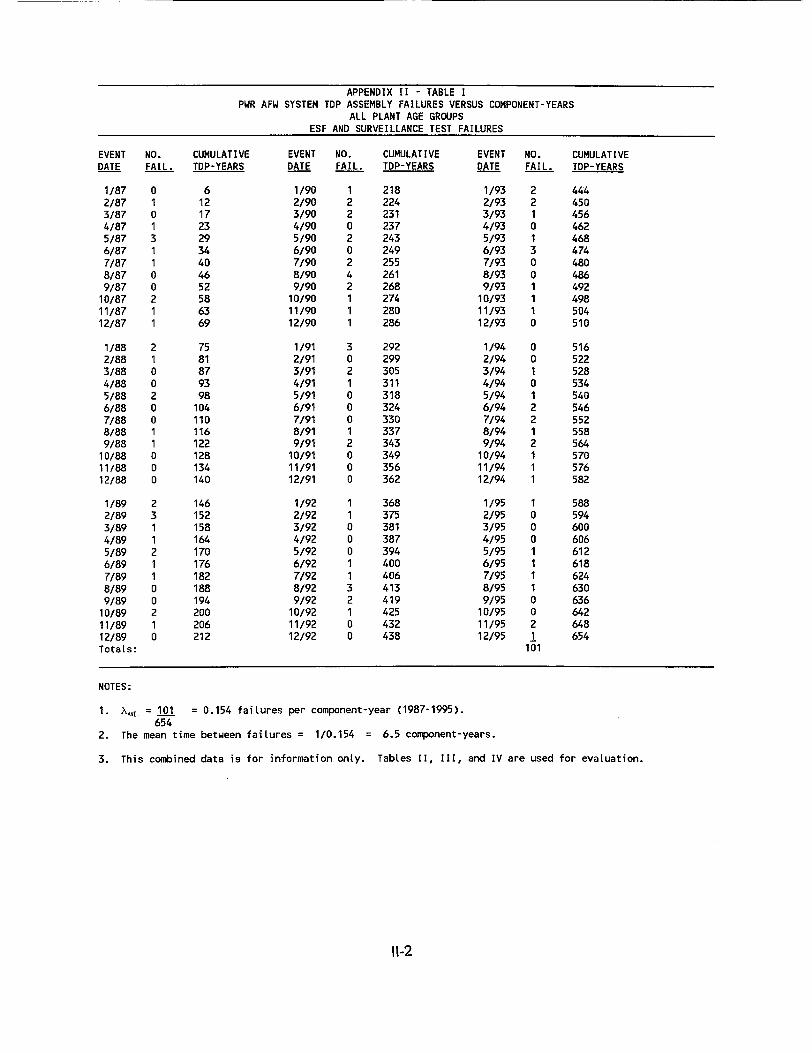
APPENDIX II - TABLE I PWR AFW SYSTEM TDP ASSEMBLY FAILURES VERSUS COMPONENT-YEARS
ALL PLANT AGE GROUPS ESF AND SURVEILLANCE TEST FAILURES
EVENT NO. CUMULATIVE EVENT NO. CUMULATIVE EVENT NO. CUMULATIVE DATE FAIL. TDP-YEARS DATE FAIL. TDP-YEARS DATE FAIL. TDP-YEARS
1/87 0 6 1/90 1 218 1/93 2 444 2/87 1 12 2/90 2 224 2/93 2 450 3/87 0 17 3/90 2 231 3/93 1 456 4/87 1 23 4/90 0 237 4/93 0 462 5/87 3 29 5/90 2 243 5/93 1 468 6/87 1 34 6/90 0 249 6/93 3 474 7/87 1 40 7/90 2 255 7/93 0 480 8/87 0 46 8/90 4 261 8/93 0 486 9/87 0 52 9/90 2 268 9/93 1 492
10/87 2 58 10/90 1 274 10/93 1 498 11/87 1 63 11/90 1 280 11/93 1 504 12/87 1 69 12/90 1 286 12/93 0 510
1/88 2 75 1/91 3 292 1/94 0 516 2/88 1 81 2/91 0 299 2/94 0 522 3/88 0 87 3/91 2 305 3/94 1 528 4/88 0 93 4/91 1 311 4/94 0 534 5/88 2 98 5/91 0 318 5/94 1 540 6/88 0 104 6/91 0 324 6/94 2 546 7/88 0 110 7/91 0 330 7/94 2 552 8/88 1 116 8/91 1 337 8/94 1 558 9/88 1 122 9/91 2 343 9/94 2 564
10/88 0 128 10/91 0 349 10/94 1 570 11/88 0 134 11/91 0 356 11/94 1 576 12/88 0 140 12/91 0 362 12/94 1 582
1/89 2 146 1/92 1 368 1/95 1 588 2/89 3 152 2/92 1 375 2/95 0 594 3/89 1 158 3/92 0 381 3/95 0 600 4/89 1 164 4/92 0 387 4/95 0 606 5/89 2 170 5/92 0 394 5/95 1 612 6/89 1 176 6/92 1 400 6/95 1 618 7/89 1 182 7/92 1 406 7/95 1 624 8/89 0 188 8/92 3 413 8/95 1 630 9/89 0 194 9/92 2 419 9/95 0 636
10/89 2 200 10/92 1 425 10/95 0 642 11/89 1 206 11/92 0 432 11/95 2 648 12/89 0 212 12/92 0 438 12/95 1 654 TotaLs: 101
NOTES:
1. XA E = 101 = 0.154 failures per component-year (1987-1995). 654
2. The mean time between failures = 1/0.154 = 6.5 component-years.
3. This combined data is for information only. Tables II, Il, and IV are used for evaluation.
11-2
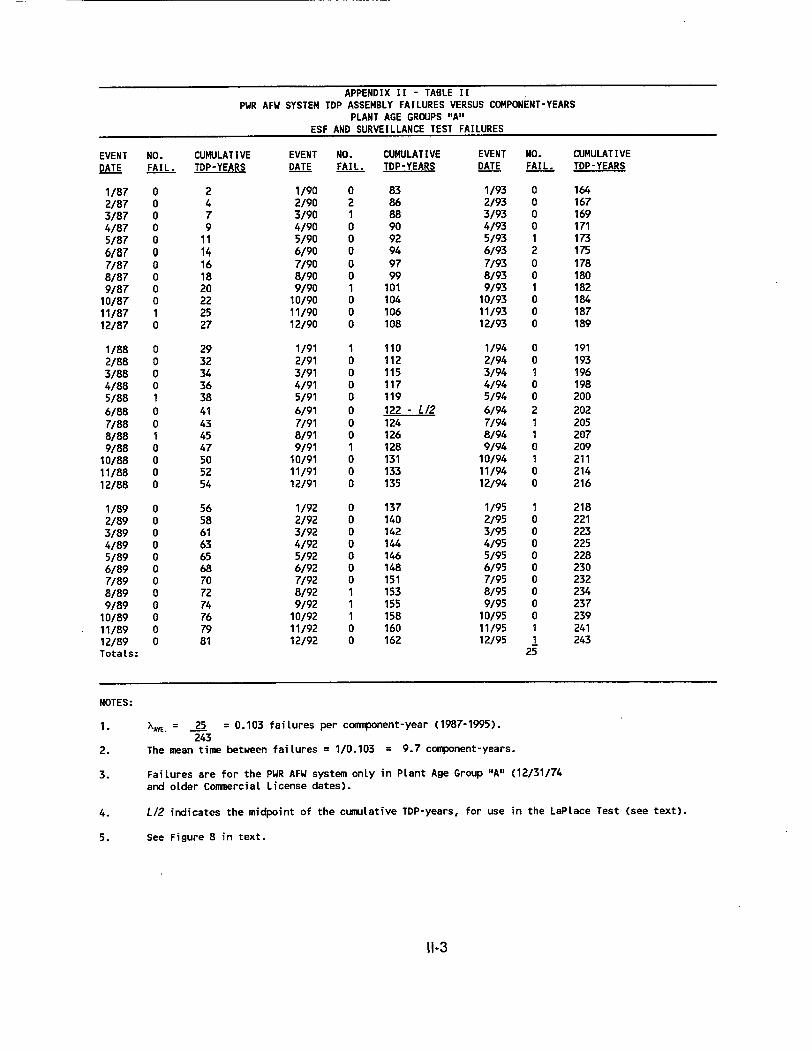
APPENDIX I1 - TABLE II PUR AFW SYSTEM TDP ASSEMBLY FAILURES VERSUS COMPONENT-YEARS
PLANT AGE GROUPS "All ESF AND SURVEILLANCE TEST FAILURES
EVENT NO. DATE FAIL.
1/87 0 2/87 0 3/87 0 4/87 0 5/87 0 6/87 0 7/87 0 8/87 0 9/87 0
10/87 0 11/87 1 12/87 0
1/88 0 2/88 0 3/88 0 4/88 0 5/88 1 6/88 0 7/88 0 8/88 1 9/88 0
10/88 0 11/88 0 12/88 0
1/89 0 2/89 0 3/89 0 4/89 0 5/89 0 6/89 0 7/89 0 8/89 0 9/89 0
10/89 0 11/89 0 12/89 0 Totals:
CUMULATIVE EVENT NO. TDP-YEARS DATE FAIL.
2 4 7 9
11
14 16 18 20 22 25 27
29 32 34 36 38 41 43 45 47 50 52 54
56 58 61 63 65 68 70 72 74 76 79 81
1/90 2/90 3/90 4/90 5/90 6/90 7/90 8/90 9/90
10/90 11/90 12/90
1/91 2/91 3/91 4/91 5/91 6/91 7/91 8/91 9/91
10/91 11/91 12/91
1/92 2/92 3/92 4/92 5/92 6/92 7/92 8/92 9/92
10/92 11/92 12/92
CUMULATIVE EVENT NO. CUMULATIVE TDP-YEARS DATE FAIL. TDP-YEARS
83 86 88 90 92 94 97 99
101 104 106 108
110 112 115 117 119 122 - L/2 124 126 128 131 133 135
137 140 142 144 146 148 151 153 155 158 160 162
1193 0 2/93 0 3/93 0 4/93 0 5/93 1 6/93 2 7/93 0 8/93 0 9/93 1
10/93 0 11/93 0 12/93 0
1/94 0 2/94 0 3/94 1 4/94 0 5/94 0 6/94 2 7/94 1 8/94 1 9/94 0
10/94 1 11/94 0 12/94 0
1/95 1 2/95 0 3/95 0 4/95 0 5/95 0 6/95 0 7/95 0 8/95 0 9/95 0
10/95 0 11/95 1 12/95 1
25
164 167 169 171 173 175 178 180 182 184 187 189
191 193 196 198 200 202 205 207 209 211 214 216
218 221 223 225 228 230 232 234 237 239 241 243
NOTES:
1. X\AV = 25 = 0.103 failures per commponent-year (1987-1995). 243
2. The mean time between failures = 1/0.103 = 9.7 component-years.
3. Failures are for the PWR AFW system only in Plant Age Group "A" (12/31/74 and older Commercial License dates).
4. L/2 indicates the midpoint of the cumulative TDP-years, for use in the LaPLace Test (see text).
5. See Figure 8 in text.
11-3
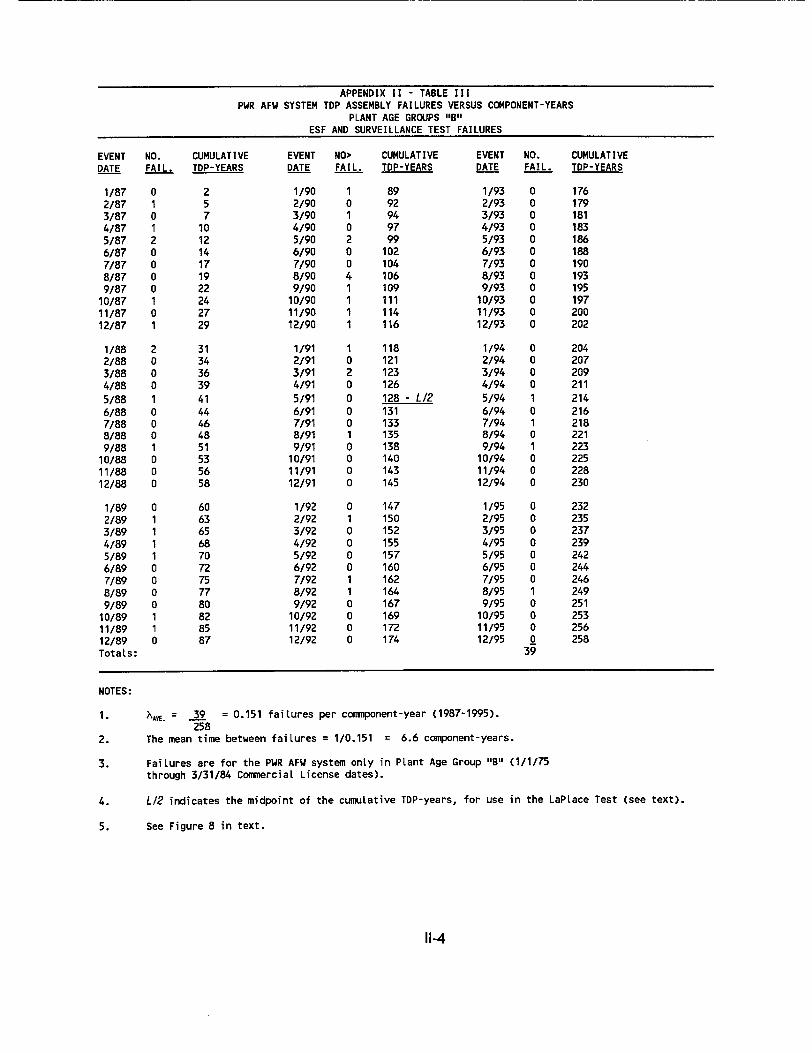
APPENDIX 11 - TABLE III PWR AFW SYSTEM TDP ASSEMBLY FAILURES VERSUS COM4PONENT-YEARS
PLANT AGE GROUPS "B" ESF AND SURVEILLANCE TEST FAILURES
EVENT NO. DATE FAIL.
1/87 0 2/87 1 3/87 0 4/87 1 5/87 2 6/87 0 7/87 0 8/87 0 9/87 0
10/87 1 11/87 0 12/87 1
1/88 2 2/88 0 3/88 0 4/88 0 5/88 1 6/88 0 7/88 0 8/88 0 9/88 1
10/88 0 11/88 0 12/88 0
1/89 0 2/89 1 3/89 1 4/89 1 5/89 1 6/89 0 7/89 0 8/89 0 9/89 0
10/89 1 11/89 1 12/89 0 Totals:
CUMULATIVE TDP-YEARS
2 5 7
10 12 14 17 19 22 24 27 29
31 34 36 39 41 44 46 48 51 53 56 58
60 63 65 68 70 72 75 77 80 82 85 87
EVENT NO> CUMULATIVE DATE FAIL. TDP-YEARS
1/90 2/90 3/90 4/90 5/90 6/90 7/90 8/90 9/90
10190 11/90 12/90
1/91 2/91 3/91 4/91 5/91 6/91 7/91 8/91 9/91
10/91 11/91 12/91
1/92 2/92 3/92 4/92 5/92 6/92 7/92 8/92 9/92
10/92 11/92 12/92
89 92 94 97 99
102 104 106 109 111 114 116
118 121 123 126 128 - L/2 131 133 135 138 140 143 145
147 150 152 155 157 160 162 164 167 169 172 174
EVENT NO. CUMULATIVE DATE FAIL. TDP-YEARS
1/93 0 2/93 0 3/93 0 4/93 0 5/93 0 6/93 0 7/93 0 8/93 0 9/93 0
10/93 0 11/93 0 12/93 0
1/94 0 2/94 0 3/94 0 4/94 0 5/94 1 6/94 0 7/94 1 8/94 0 9/94 1
10/94 0 11/94 0 12/94 0
1/95 0 2/95 0 3/95 0 4/95 0 5/95 0 6/95 0 7/95 0 8/95 1 9/95 0
10/95 0 11/95 0 12/95 0
39
176 179 181 183 186 188 190 193 195 197 200 202
204 207 209 211 214 216 218 221 223 225 228 230
232 235 237 239 242 244 246 249 251 253 256 258
NOTES:
1. XA. = 39 = 0.151 failures per comnponent-year (1987-1995). 258
2. The mean time between failures = 1/0.151 = 6.6 component-years.
3. Failures are for the PWR AFW system only in Plant Age Group "B" (1/1/75 through 3/31/84 Commercial License dates).
4. L/2 indicates the midpoint of the cumulative TDP-years, for use in the LaPLace Test (see text).
5. See Figure 8 in text.
11-4

APPENDIX II - TABLE IV FUR AFW SYSTEM TOP ASSEMBLY FAILURES VERSUS COMPONENT-YEARS
PLANT AGE GROUPS "C" ESF and SURVEILLANCE TEST FAILURES
EVENT NO. CUMULATIVE DATE FAIL. TDP-YEARS
1/87 0 2/87 0 3/87 0 4/87 0 5/87 0 6/87 1 7/87 1 8/87 0 9/87 0
10/87 1 11/87 1 12/87 0
1/88 0 2/88 1 3/88 0 4/88 0 5/88 0 6/88 0 7/88 0 8/88 0 9/88 0
10/88 0 11/88 0 12/88 0
1/89 2 2/89 2 3/89 0 4/89 0 5/89 1 6/89 1 7/89 1 8/89 0 9/89 0
10/89 1 11/89 0 12/89 0 Totals:
1 2 3 4 5 6 8 9
10 11 12 13
14 15 17 18 19 21 22 23 24 26 27 28
29 31 32 33 35 36 37 39 40 41 43 44
EVENT NO. DATE FAIL.
1/90 2/90 3/90 4/90 5/90 6/90 7/90 8/90 9/90
10/90 11/90 12/90
1/91 2/91 3/91 4/91 5/91 6/91 7/91 8/91 9/91
10/91 11/91 12/91
1/92 2/92 3/92 4/92 5/92 6/92 7/92 8/92 9/92
10/92 11/92 12/92
CUMULATIVE EVENT NO. TDP-YEARS DATE FAIL.
46 47 48 50 52 53 54 56 58 59 61 62
64 65 67 69 70 72 74 75 77 79 80 - L/2 82
84 85 87 89 90 92 94 95 97 99
100 102
1/93 2 2/93 2 3/93 1 4/93 0 5/93 0 6/93 1 7/93 0 8/93 0 9/93 0
10/93 1 11/93 1 12/93 0
1/94 0 2/94 0 3/94 0 4/94 0 5/94 0 6/94 0 7/94 0 8/94 0 9/94 1
10/94 0
11/94 1 12/94 1
1/95 0 2/95 0 3/95 0 4/95 0 5/95 1 6/95 1 7/95 1 8/95 0 9/95 0
10/95 0 11/95 1 12/95 0
37
NOTES:
1. XAVE. = 37 = 0.228 failures per commponent-year 1987-1995). 162
2. The mean time between failures = 1/0.228 = 4.4 component-years.
3. Failures are for the PWR AFW system only in Plant Age Group "C" (4/1/84 and later Commercial License dates).
4. L/2 indicates the midpoint of the cumuLative TDP-years, for use in the LaPLace Test (see text
5. See Figure 8 in text.
11-5
CUMULATIVE TDP-YEARS
104 105 107 109 110 112 114 115 117 119 120 122
124 125 127 129 130 132 134 135 137 139 140 142
144 145 147 149 150 152 154 155 157 159 160 162

APPENDIX II - TABLE V BWR RCIC AND HPCI SYSTEM TDP ASSEMBLY FAILURES VERSUS COMPONENT-YEARS
ALL PLANT AGE GROUPS ESF AND SURVEILLANCE TEST FAILURES
EVENT NO. CUMULATIVE DATE FAIL. TDP-YEARS
1/87 2 2/87 2 3/87 1 4/87 0 5/87 1 6/87 1 7/87 4 8/87 0 9/87 1
10/87 0 11/87 2 12/87 1
1/88 1 2/88 0 3/88 1 4/88 2 5/88 0 6/88 1 7/88 1 8/88 1 9/88 3
10/88 1 11/88 0 12/88 2
1/89 1 2/89 1 3/89 0 4/89 0 5/89 1 6/89 0 7/89 0 8/89 0 9/89 1 10/89 0
11/89 0 12/89 2 Totals:
4 8
12 17 21 25 29 33 38 42 46 50
54 59 64 68 73 78 82 87 91 96
101 105
110 114 119 123 128 132 137 142 146 151 156 160
EVENT NO> CUMULATIVE DATE FAIL. TDP-YEARS
1/90 2/90 3/90 4/90 5/90 6/90 7/90 8/90 9/90
10/90 11/90 12/90
1/91 2/91 3/91 4/91 5/91 6/91 7/91 8/91 9/91
10/91 11/91 12/91
1/92 2/92 3/92 4/92 5/92 6/92 7/92 8/92 9/92
10/92 11/92 12/92
165 169 174 179 184 188 193 198 203 208 212 217
222 226 231 236 241 246 250 255 260 265 269 274
279 283 288 293 298 302 307 312 317 322 326 331
EVENT NO. CUMULATIVE DATE FAIL. TDP-YEARS
1/93 2 2/93 1 3/93 0 4/93 0 5/93 1 6/93 0 7/93 1 8/93 1 9/93 0
10/93 1 11/93 0 12/93 1
1/94 2 2/94 1 3/94 1 4/94 0 5/94 0 6/94 0 7/94 0 8/94 1 9/94 1
10/94 0 11/94 2 12/94 0
1/95 1 2/95 0 3/95 1 4/95 0 5/95 0 6/95 0 7/95 0 8/95 0 9/95 0
10/95 0 11/95 0 12/95 2
92
336 341 345 350 355 360 364 369 374 379 383 388
393 398 402 407 412 417 421 426 431 436 "440 445
450 455 462 467 472 477 481 486 491 496 500 505
NOTES:
1. XAVE = 92 = 0.182 failures per component-year 1987-1995). 505
2. The mean time between failures = 1/0.182 = 5.5 component-years.
3. Thisý combined data is for information only. Tables VI, VII, and VIII are used for evaluation.
11-6
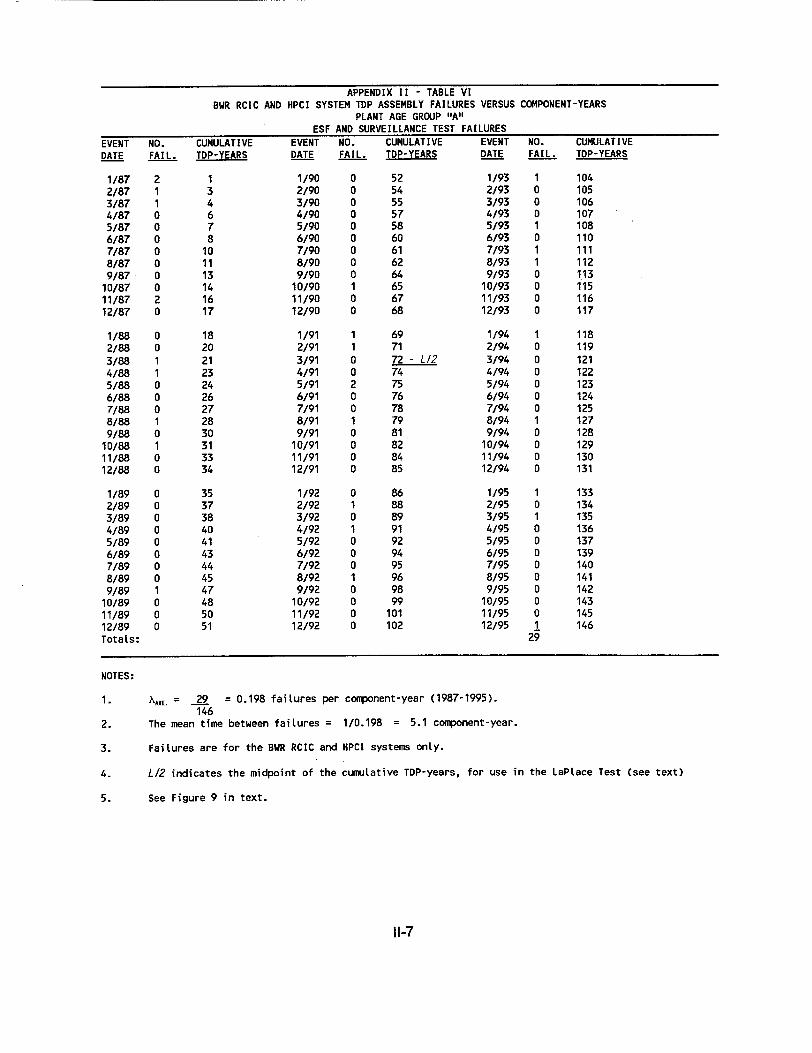
EVENT NO. CU, DATE FAIL. TDI
1/87 2 2/87 1 3/87 1 4/87 0 5/87 0 6/87 0 7/87 0 10 8/87 0 1 9/87 0 1
10/87 0 1' 11/87 2 1 12/87 0 1
1/88 0 1i 2/88 0 21 3/88 1 2 4/88 1 2: 5/88 0 2' 6/88 0 2 7/88 0 2 8/88 1 21 9/88 0 31
10/88 1 3 11/88 0 3: 12/88 0 34
1/89 0 35 2/89 0 3 3189 0 31 4/89 0 41 5/89 0 4 6/89 0 4: 7/89 0 4' 8/89 0 4 9/89 1 4
10/89 0 41 11/89 0 50 12/89 0 51 Totals:
APPENDIX II - TABLE VI BWR RCIC AND HPCI SYSTEM TDP ASSEMBLY FAILURES VERSUS COMPONENT-YEARS
PLANT AGE GROUP "A" ESF AND SURVEILLANCE TEST FAILURES
MULATIVE EVENT NO. CUMULATIVE EVENT NO. CUMULATIVE P-YEARS DATE FAIL. TDP-YEARS DATE FAIL. TDP-YEARS
1 1/90 0 52 1/93 1 104 3 2/90 0 54 2/93 0 105 4 3/90 0 55 3/93 0 106 6 4/90 0 57 4/93 0 107 7 5/90 0 58 5/93 1 108 8 6/90 0 60 6/93 0 110 0 7/90 0 61 7/93 1 111 1 8/90 0 62 8/93 1 112 3 9/90 0 64 9/93 0 113 4 10/90 1 65 10/93 0 115 6 11/90 0 67 11/93 0 116 7 12/90 0 68 12/93 0 117
8 1/91 1 69 1/94 1 118 0 2/91 1 71 2/94 0 119 1 3/91 0 72 -L/2 3/94 0 121 3 4/91 0 74 4/94 0 122 4 5/91 2 75 5/94 0 123 6 6/91 0 76 6/94 0 124 7 7191 0 78 7/94 0 125 8 8/91 1 79 8/94 1 127 0 9/91 0 81 9/94 0 128 1 10/91 0 82 10/94 0 129 3 11/91 0 84 11/94 0 130 4 12/91 0 85 12/94 0 131
5 7 8 0 1
3 4 5 7
8 0 1
1/92 0 2/92 1 3/92 0 4/92 1 5/92 0 6/92 0 7/92 0 8/92 1 9/92 0
10/92 0 11/92 0 12/92 0
86 88 89 91 92 94 95 96 98 99
101 102
1/95 1 2/95 0 3/95 1 4/95 0 5/95 0 6/95 0 7/95 0 8/95 0 9/95 0
10/95 0 11/95 0 12/95 1
29
133 134 135 136 137 139 140 141 142 143 145 146
NOTES:
1. XAVE = 29 = 0.198 failures per component-year (1987-1995). 146
2. The mean time between failures = 1/0.198 = 5.1 component-year.
3. Failures are for the BWR RCIC and NPCI systems only.
4. L/2 indicates the midpoint of the cumulative TDP-years, for use in the LaPLace Test (see text)
5. See Figure 9 in text.
11-7
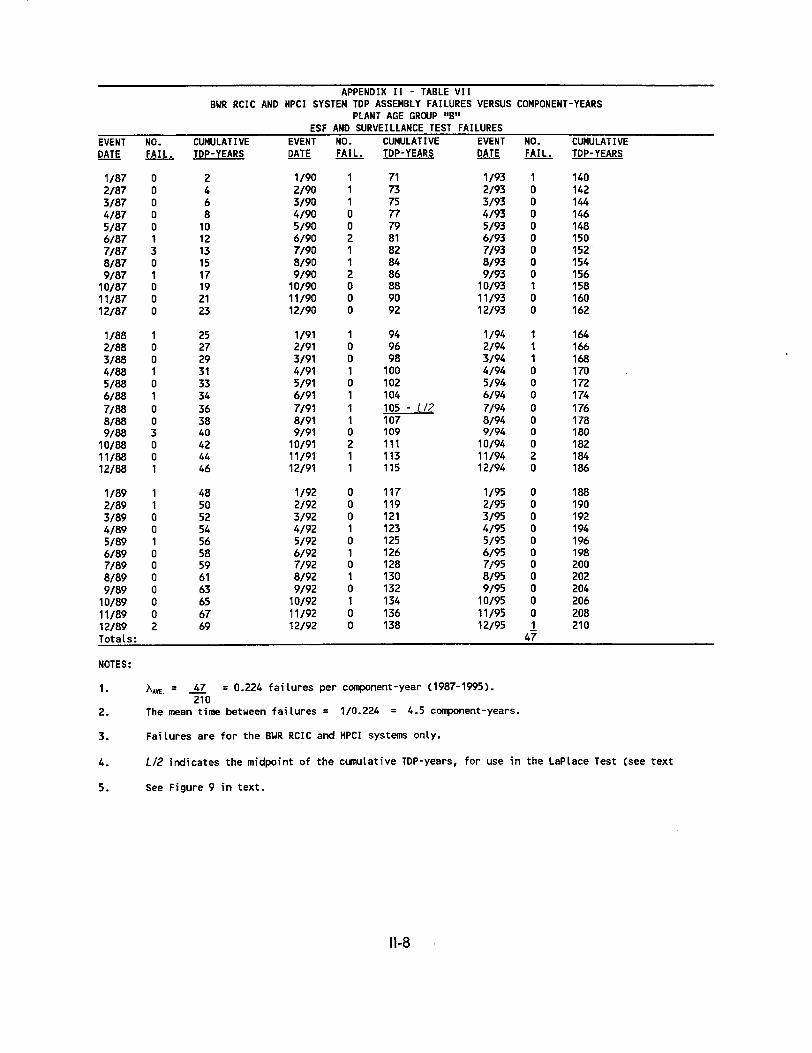
EVENT NO. CUP DATE FAIL. TDP
1/87 0 2/87 0 3/87 0 4/87 0 5/87 0 6187 1 7/87 3 8/87 0 9/87 1
10/87 0 11187 0 12/87 0
1/88 1 2/88 0 3/88 0 4/88 1 5/88 0 6/88 1 7/88 0 8/88 0 9/88 3
10/88 0 11/88 0 12/88 1
1/89 1 2/89 1 3/89 0 4/89 0 5/89 1 6189 0 7/89 0 8/89 0 9/89 0
10/89 0 11/89 0 12/89 2 Totals:
10
12
2'
3 31
23
41 4 40 42
48 50 5S 5;
56 58 59
61 63 65 67 69
APPENDIX II - TABLE VII BUR RCIC AND HPCI SYSTEM TDP ASSEMBLY FAILURES VERSUS COMPONENT-YEARS
PLANT AGE GROUP "B" ESF AND SURVEILLANCE TEST FAILURES
4ULATIVE EVENT NO. CUMULATIVE EVENT NO. CUMULATIVE P-YEARS DATE FAIL. TDP-YEARS DATE FAIL. TDP-YEARS
2 1/90 1 71 1/93 1 140 4 2/90 1 73 2/93 0 142 6 3/90 1 75 3/93 0 144 8 4/90 0 77 4/93 0 146 0 5/90 0 79 5/93 0 148 2 6/90 2 81 6/93 0 150 S 7/90 1 82 7/93 0 152
8/90 1 84 8/93 0 154 7 9/90 2 86 9/93 0 156 9 10/90 0 88 10/93 1 158 1 11/90 0 90 11/93 0 160
12/90 0 92 12/93 0 162
1/91 1 94 1/94 1 164 7 2/91 0 96 2/94 1 166 9 3/91 0 98 3/94 1 168 1 4/91 1 100 4/94 0 170 3 5/91 0 102 5/94 0 172 4 6/91 1 104 6/94 0 174 6 7/91 1 105 - LI2 7/94 0 176 8 8/91 1 107 8/94 0 178 0 9/91 0 109 9/94 0 180 2 10/91 2 111 10/94 0 182 4 11/91 1 113 11/94 2 184 6 12/91 1 115 12/94 0 186
8 1/92 0 117 1/95 0 188 0 2/92 0 119 2/95 0 190 2 3/92 0 121 3/95 0 192 4 4/92 1 123 4/95 0 194 6 5/92 0 125 5/95 0 196 8 6/92 1 126 6/95 0 198 9 7/92 0 128 7/95 0 200 1 8/92 1 130 8/95 0 202 3 9/92 0 132 9/95 0 204 5 10/92 1 134 10/95 0 206 7 11/92 0 136 11/95 0 208 9 12/92 0 138 12/95 1 210
47
NOTES:
1.
2.
XAVE. = 47 = 0.224 failures per component-year (1987-1995). 210
The mean time between failures = 1/0.224 = 4.5 component-years.
3. Failures are for the BWR RCIC and HPCI systems only.
4. L/2 indicates the midpoint of the cumulative TDP-years, for use in the LaPlace Test (see text
5. See Figure 9 in text.
11-8
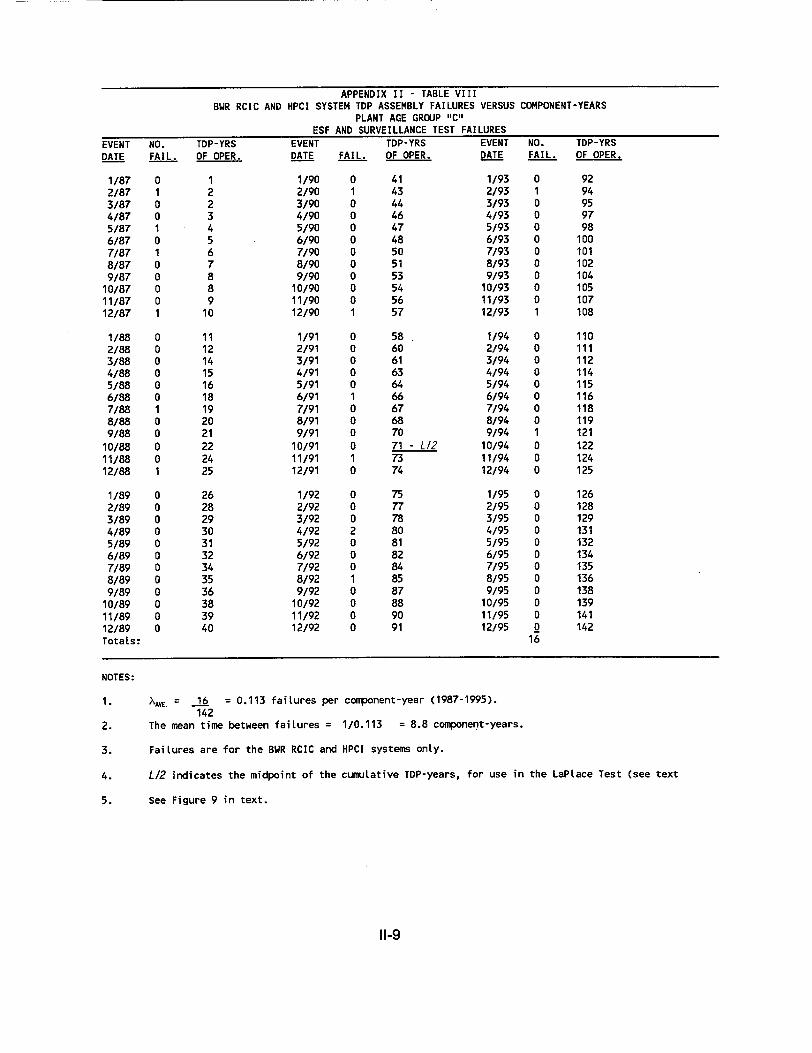
EVENT NO. TDF DATE FAIL. OF
1/87 0 2/87 1 3/87 0 4/87 0 5/87 1 6/87 0 7/87 1 8/87 0 9/87 0
10/87 0 11/87 0 12/87 1 1l
1/88 0 1 2/88 0 12 3/88 0 1 4188 0 1' 5188 0 1 6188 0 11 7/88 1 1' 8/88 0 21 9/88 0 2
10/88 0 2 11/88 0 2 12188 1 2
1/89 0 2 2/89 0 21 3/89 0 2' 4/89 0 3C 5/89 0 3 6/89 0 3; 7/89 0 3 8/89 0 35 9/89 0 3
10/89 0 31 11/89 0 3' 12/89 0 41 Totals:
APPENDIX II - TABLE VIII BWR RCIC AND HPCI SYSTEM TDP ASSEMBLY FAILURES VERSUS COMPONENT-YEARS
PLANT AGE GROUP "C" ESF AND SURVEILLANCE TEST FAILURES
P-YRS EVENT TDP-YRS EVENT NO. TDP-YRS OPER. DATE FAIL. OF OPER. DATE FAIL. OF OPER.
1 1/90 0 41 1/93 0 92 2 2/90 1 43 2/93 1 94 2 3/90 0 44 3/93 0 95 3 4/90 0 46 4/93 0 97 4 5/90 0 47 5/93 0 98 5 6/90 0 48 6/93 0 100 6 7/90 0 50 7/93 0 101 7 8/90 0 51 8/93 0 102 8 9/90 0 53 9/93 0 104 8 10/90 0 54 10/93 0 105 9 11/90 0 56 11/93 0 107 0 12/90 1 57 12/93 1 108
1 1/91 0 58 1/94 0 110 2 2/91 0 60 2/94 0 111 4 3/91 0 61 3/94 0 112 5 4/91 0 63 4/94 0 114 6 5/91 0 64 5/94 0 115 8 6/91 1 66 6/94 0 116 9 7/91 0 67 7/94 0 118 0 8/91 0 68 8/94 0 119 1 9/91 0 70 9/94 1 121 2 10/91 0 71 - L12 10/94 0 122 4 11/91 1 73 11/94 0 124 5 12/91 0 74 12/94 0 125
6 1/92 0 75 1/95 0 126 8 2/92 0 77 2/95 0 128 9 3/92 0 78 3/95 0 129 0 4/92 2 80 4/95 0 131 1 5/92 0 81 5/95 0 132 2 6/92 0 82 6/95 0 134 4 7/92 0 84 7/95 0 135 5 8/92 1 85 8/95 0 136 6 9/92 0 87 9/95 0 138 8 10/92 0 88 10/95 0 139 9 11/92 0 90 11/95 0 141 0 12/92 0 91 12/95 0 142
NOTES:
1. \Aw. = 16 = 0.113 failures per component-year (1987-1995). 142
2. The mean time between failures = 1/0.113 = 8.8 component-years.
3. Failures are for the BWR RCIC and HPCI systems only.
4. L/2 indicates the midpoint of the cumulative TDP-years, for use in the LaPlace Test (see text
5. See Figure 9 in text.
11-9
16
APPENDIX III
TDP ASSEMBLY
ENGINEERING INSIGHTS
APPENDIX III TDP ASSEMBLY - ENGINEERING INSIGHTS
TABLE NO. DESCRIPTION PAGE
PWR AFW System - Failures and Failure Fractions For TDP Assemblies and Subcomponents ........................ 111-2
II BWR RCIC, and HPCI Systems - Failures and Failure Fractions for TDP Assemblies and Subcomponents .................. 111-3
III PWR AFW System TDP Assembly and Subcomponents - Failure Cause Apportionment ................................. 111-4
IV BWR RCIC System TDP Assembly and Subcomponents - Failure Cause Apportionment ................................. 111-4
V BWR HPCI System TDP Assembly and Subcomponents - Failure Cause Apportionment ................................. 111-4
II1-1
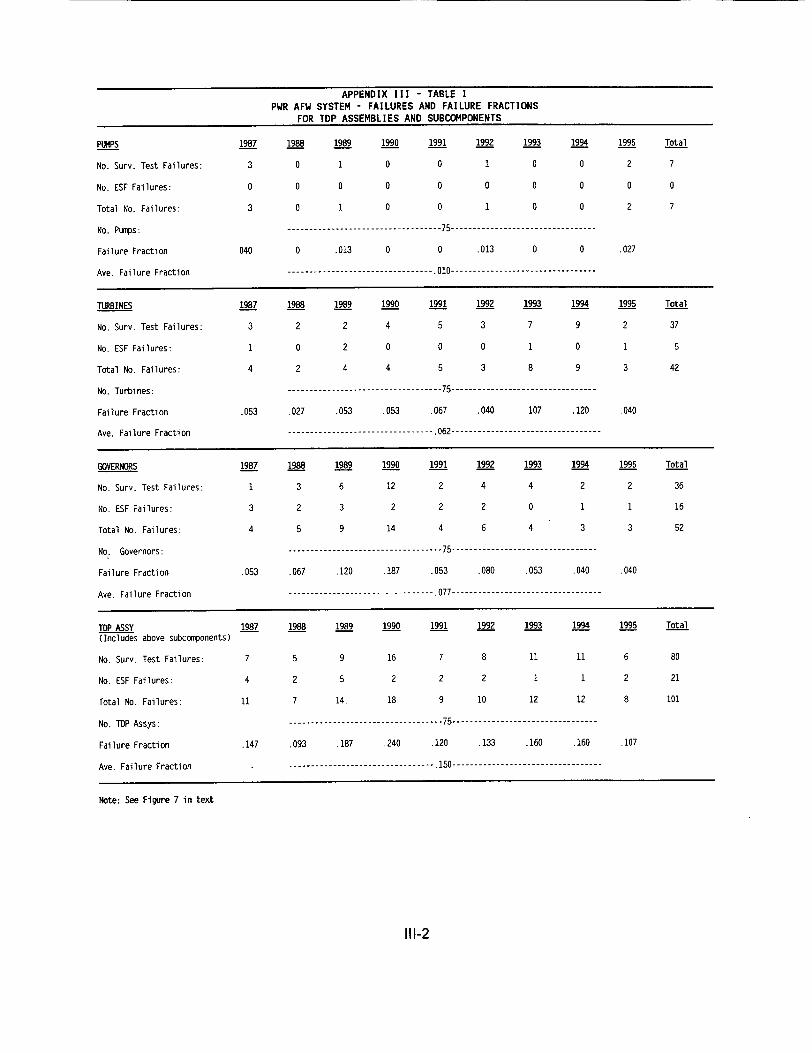
APPENDIX III - TABLE I PWR AFW SYSTEM - FAILURES AND FAILURE FRACTIONS
FOR TDP ASSEMBLIES AND SUBCOMPONENTS
PLH4PS 1987 1988 1989 1990 1991 1992 1993 1994 1995 Total
No. Surv. Test Failures: 3 0 1 0 0 1 0 0 2 7
No. ESF Failures: 0 0 0 0 0 0 0 0 0 0
Total No. Failures: 3 0 1 0 0 1 0 0 2 7
No . Pumps : ----------------------------------- 75.
Failure Fraction 040 0 .013 0 0 .013 0 0 .027
Ave. Failure Fraction ------------------------------------- - .010 -----------------------
TURBINES 1987 1988 1989 1990 1991 1992 1993 1994 1995 Total
No. Surv. Test Failures: 3 2 2 4 5 3 7 9 2 37
No. ESF Failures: 1 0 2 0 0 0 1 0 1 5
Total No. Failures: 4 2 4 4 5 3 8 9 3 42
No. Turbines: ---..------. 75--------------------------------
Failure Fraction .053 .027 .053 .053 .067 .040 .107 .120 .040
Ave. Failure Fraction ------------------------------------ - --.062 -----------------------
GOVERNORS 1987 1988 1989 1990 1991 1992 1993 1994 1995 Total
No. Surv. Test Failures: 1 3 6 12 2 4 4 2 2 36
No. ESF Failures: 3 2 3 2 2 2 0 1 1 16
Total No. Failures: 4 5 9 14 4 6 4 3 3 52
No. Governors: ----------------------------------- 75 .................................
Failure Fraction .053 .067 .120 .187 .053 .080 .053 .040 .040
Ave. Failure Fraction ----------------------------------.077 ------------------------........
TDP ASSY 1987 1988 1989 1990 1991 1992 1993 1994 1995 Total
(Includes above subcomponents)
No. Surv. Test Failures: 7 5 9 16 7 8 11 11 6 80
No. ESF Failures: 4 2 5 2 2 2 1 1 2 21
Total No. Failures: 11 7 14. 18 9 10 12 12 8 101
No . TDP Assys : ----------------------------------- 75 --------------------------------
Failure Fraction .147 .093 .187 .240 .120 .133 .160 .160 .107
Ave. Failure Fraction ...............................- 150 . .----------------------------------.
Note: See Figure 7 in text
111-2
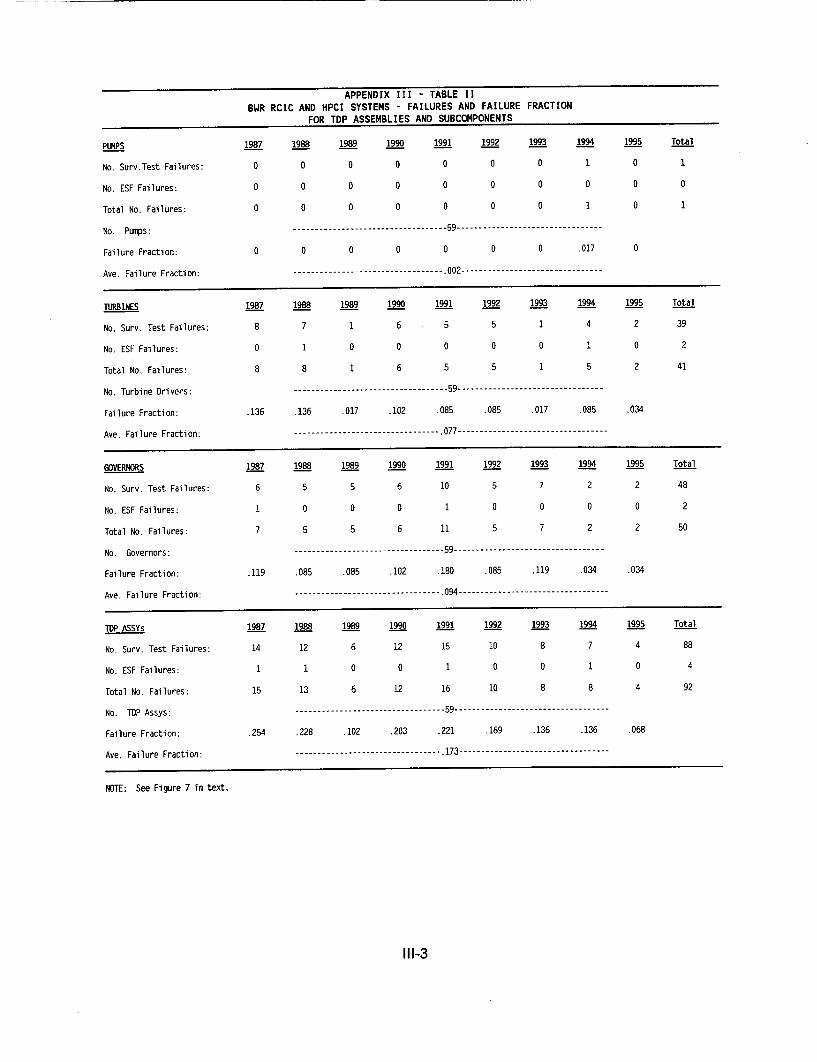
APPENDIX III - TABLE II BWR RCIC AND HPCI SYSTEMS - FAILURES AND FAILURE FRACTION
FOR TDP ASSEMBLIES AND SUBCOMPONENTS
PIN4PS 1987 1988 1989 1990 1991 1992 1993 1994 1995 Total
No. Surv.Test Failures: 0 0 0 0 0 0 0 1 0 1
No. ESF Failures: 0 0 0 0 0 0 0 0 0 0
Total No. Failures: 0 0 0 0 0 0 0 1 0 1
No. Pumps: ------------------------------------------ -59 - -----------------------
Failure Fraction: 0 0 0 0 0 0 0 .017 0
Ave. Failure Fraction: ............................... . 002 .--------------------------------.0
TURBINES 1987 1988 1989 1990 1991 1992 1993 1994 1995 Total
No. Surv. Test Failures: 8 7 1 6 5 5 1 4 2 39
No. ESF Failures: 0 1 0 0 0 0 0 1 0 2
Total No. Failures: 8 8 1 6 5 5 1 5 2 41
No. Turbine Drivers: ----------------------------------- 59 --------------------------------
Failure Fraction: .136 .136 .017 .102 .085 .085 .017 .085 .034
Ave. Failure Fraction: ............................. . .077 .----------------------------------.0
GOVERNORS 1987 1988 1989 1990 1991 1992 1993 1994 1995 Total
No. Surv. Test Failures: 6 5 5 6 10 5 7 2 2 48
No. ESF Failures: 1 0 0 0 1 0 0 0 0 2
Total No. Failures: 7 5 5 6 11 5 7 2 2 50
No . Governors : ---------------------------------- 59 ---------------------------------
Failure Fraction: .119 .085 .085 .102 .180 .085 .119 .034 .034
Ave. Failure Fraction: .............................. . .094 .----------------------------------.
TlP ASSYs 1987 1988 1989 1990 1991 1992 1993 1994 1995 Total
No. Surv. Test Failures: 14 12 6 12 15 10 8 7 4 88
No. ESF Failures: 1 1 0 0 1 0 0 1 0 4
Total No. Failures: 15 13 6 12 16 10 8 8 4 92
No . TD P Assys : ---------------------------------- 59 ----------------------------------
Failure Fraction: .254 .228 .102 .203 .221 .169 .136 .136 .068
Ave. Failure Fraction: .............................. . 173 .----------------------------------.1
NOTE: See Figure 7 in text.
111-3
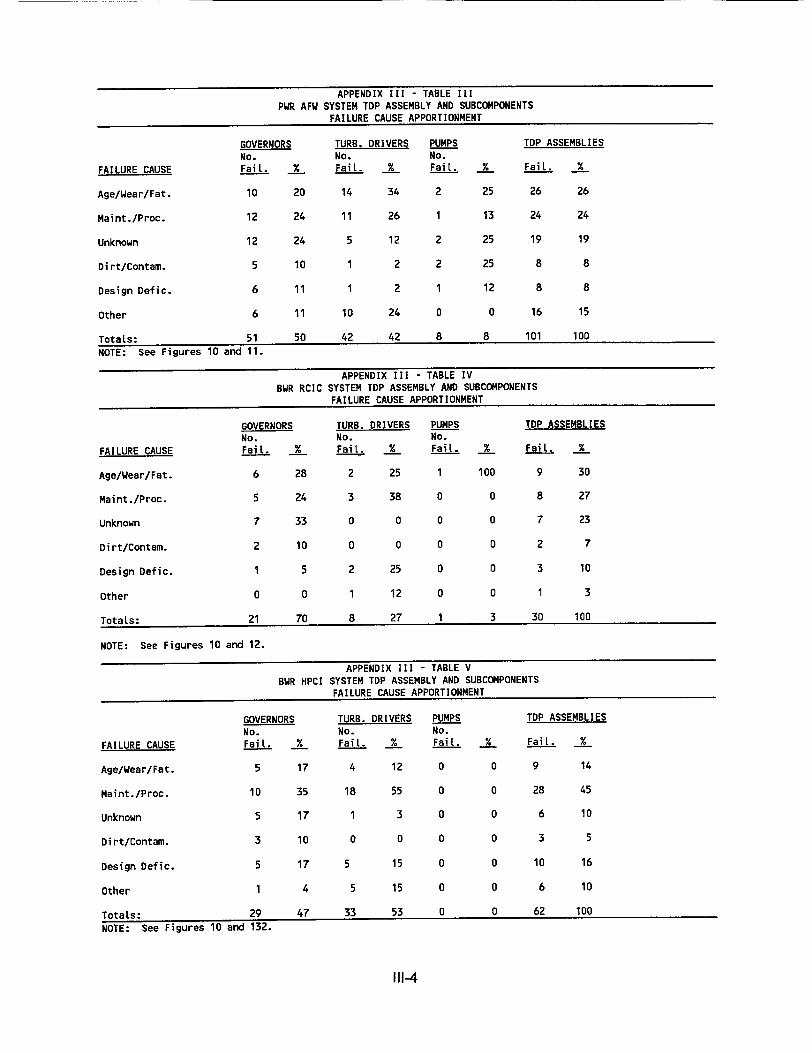
APPENDIX III - TABLE III PWR AFW SYSTEM TDP ASSEMBLY AND SUBCOMPONENTS
FAILURE CAUSE APPORTIONMENT
FAILURE CAUSE
Age/Wear/Fat.
Maint./Proc.
Unknown
Dirt/Contam.
Design Defic.
Other
Totals: NOTE: See Figures 10 an
GOVERNORS No. Fail. %
10 20
12 24
12 24
5 10
6 11
6 11
51 50
TURB. DRIVERS No. Fail. %
14 34
11 26
5 12
1 2
1 2
10 24
42 42
PUMPS No. Fail. %
2 25
1 13
2 25
2 25
1 12
0 0
8 8
TDP ASSEMBLIES
Fail. %
26 26
24 24
19 19
8 8
8 8
16 15
101 100
BWR RC
GOVERNORS No.
FAILURE CAUSE Fail. %
Age/Wear/Fat. 6 28
Maint./Proc. 5 24
Unknown 7 33
Dirt/Contam. 2 10
Design Defic. 1 5
Other 0 0
Totals: 21 70
NOTE: See Figures 10 and 12.
APPENDIX III - TABLE IV IC SYSTEM TDP ASSEMBLY AND SUBCOMPONENTS
FAILURE CAUSE APPORTIONMENT
TURB. DRIVERS PUMPS TDP No. No. FaiL. % Fail. % Fai
2 25 1 100 9
3 38 0 0 8
O 0 0 0 7
0 0 0 0 2
2 25 0 0 3
1 12 0 0 1
8 27 1 3 30
ASSEMBLIES
il. %
P 30
27
23
7
10
3
100
APPENDIX III - TABLE V BWR HPCI SYSTEM TDP ASSEMBLY AND SUBCOMPONENTS
FAILURE CAUSE APPORTIONMENT
GOVERNORS TURB. DRIVERS PUMPS TDP ASSEMBLIES No. No. No.
FAILURE CAUSE Fail. % Fail. % Fail. % Fail. %
Age/Wear/Fat. 5 17 4 12 0 0 9 14
Maint./Proc. 10 35 18 55 0 0 28 45
Unknown 5 17 1 3 0 0 6 10
Dirt/Contam. 3 10 0 0 0 0 3 5
Design Defic. 5 17 5 15 0 0 10 16
Other 1 4 5 15 0 0 6 10
Totals: 29 47 33 53 0 0 62 100
NOTE: See Figures 10 and 132.
111-4
dW 11.
APPENDIX IV
DATA SOURCE INPUTS FOR REPORTED FAILURES AND ESTIMATED DEMANDS
TDP ASSEMBLIES
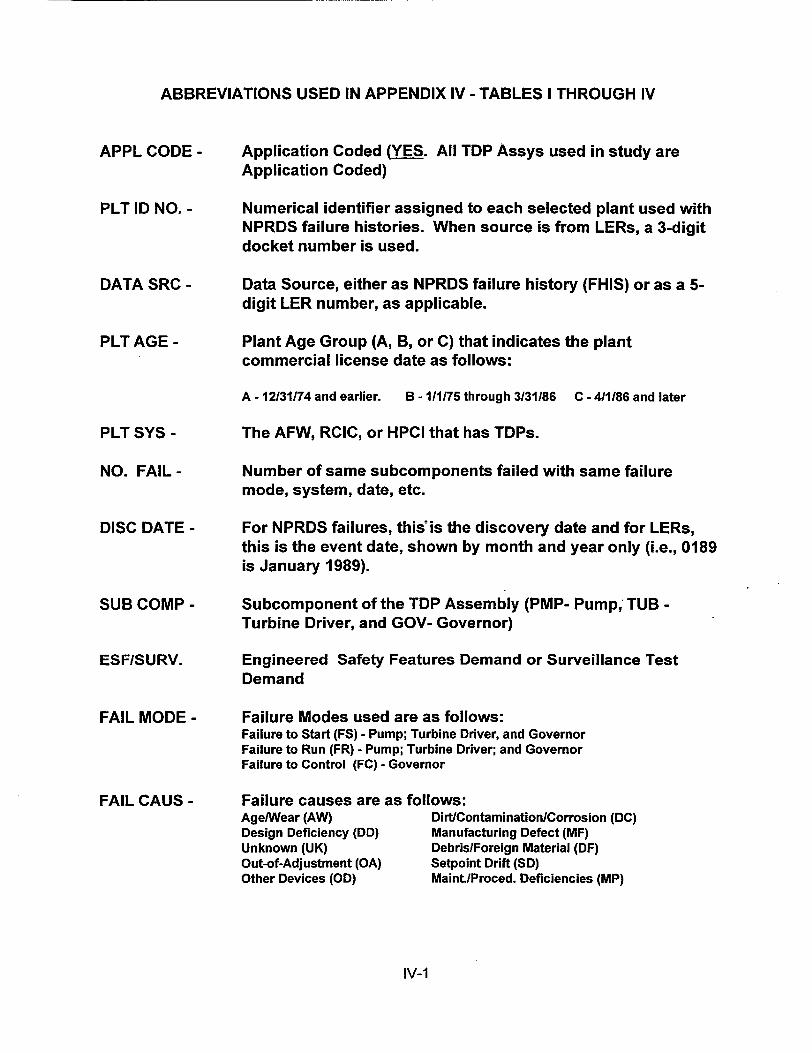
ABBREVIATIONS USED IN APPENDIX IV - TABLES I THROUGH IV
APPL CODE
PLT ID NO.
DATA SRC
PLT AGE -
Application Coded (YES. All TDP Assys used in study are Application Coded)
Numerical identifier assigned to each selected plant used with NPRDS failure histories. When source is from LERs, a 3-digit docket number is used.
Data Source, either as NPRDS failure history (FHIS) or as a 5digit LER number, as applicable.
Plant Age Group (A, B, or C) that indicates the plant commercial license date as follows:
A - 12131174 and earlier.
PLT SYS
NO. FAIL
DISC DATE
SUB COMP
ESF/SURV.
FAIL MODE
FAIL CAUS -
B - 111175 through 3131186 C - 411186 and later
The AFW, RCIC, or HPCI that has TDPs.
Number of same subcomponents failed with same failure mode, system, date, etc.
For NPRDS failures, this'is the discovery date and for LERs, this is the event date, shown by month and year only (i.e., 0189 is January 1989).
Subcomponent of the TDP Assembly (PMP- Pump; TUB Turbine Driver, and GOV- Governor)
Engineered Safety Features Demand or Surveillance Test Demand
Failure Modes used are as follows: Failure to Start (FS) -Pump; Turbine Driver, and Governor Failure to Run (FR) - Pump; Turbine Driver; and Governor Failure to Control (FC) - Governor
Failure causes are as follows: Age/Wear (AW) DirtlContamination/Corrosion (DC) Design Deficiency (DD) Manufacturing Defect (MF) Unknown (UK) Debris/Foreign Material (DF) Out-of-Adjustment (OA) Setpoint Drift (SD) Other Devices (OD) Maint./Proced. Deficiencies (MP)
IV-1
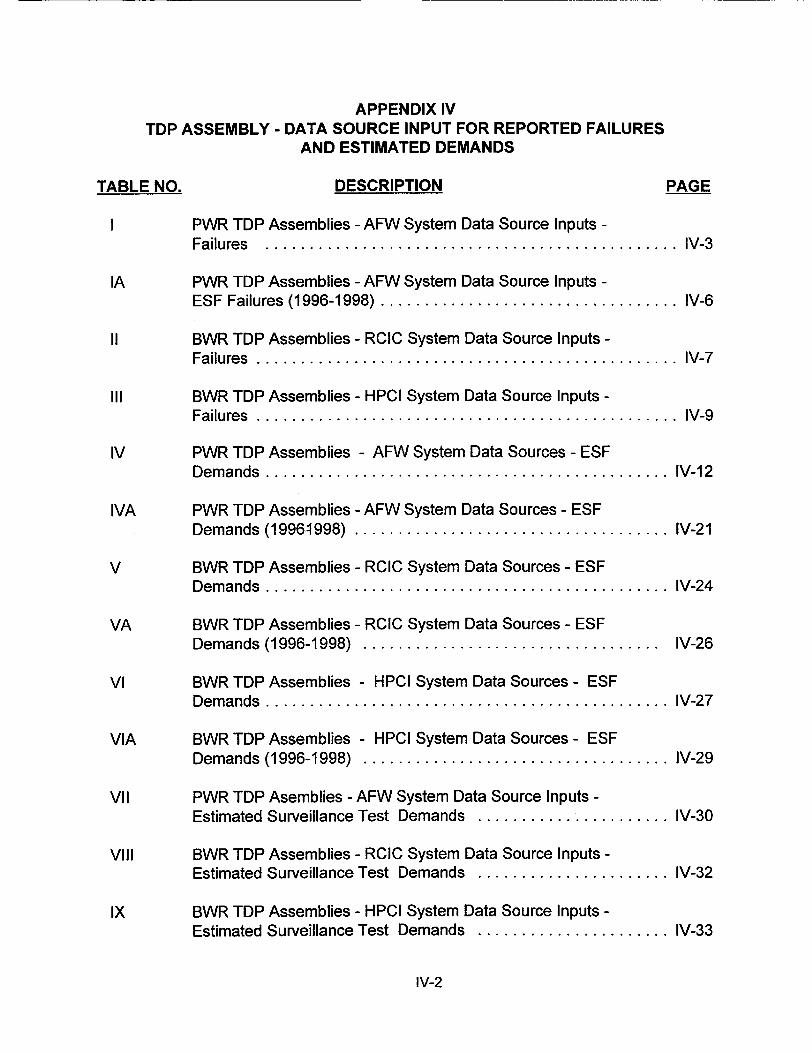
TABLE
I
IA
III
IV
IVA
V
VA
VI
VIA
VII
VIII
IX
IV-2
APPENDIX IV TDP ASSEMBLY - DATA SOURCE INPUT FOR REPORTED FAILURES
AND ESTIMATED DEMANDS
E NO. DESCRIPTION
PWR TDP Assemblies - AFW System Data Source Inputs F a ilu re s . . . ... . .. . .. .. .. .. . . .... . ... . .. . .. . .. ... . .... .
PWR TDP Assemblies - AFW System Data Source Inputs ESF Failures (1996-1998) .................................
BWR TDP Assemblies - RCIC System Data Source Inputs F a ilu re s . .. . ... . .. . .. .. .. .. . . .... . ... . .. . . .. .. ... . ... . .
BWR TDP Assemblies - HPCI System Data Source Inputs F a ilure s . .. . .. . . .. . ... . . .. . . .. ... .. .. . . . . ... . ... . . .. . ..
PWR TDP Assemblies - AFW System Data Sources - ESF D em ands ..............................................
PWR TDP Assemblies - AFW System Data Sources - ESF Demands (19961998) ....................................
BWR TDP Assemblies - RCIC System Data Sources - ESF D em ands ..............................................
BWR TDP Assemblies - RCIC System Data Sources - ESF Demands (1996-1998) ..................................
BWR TDP Assemblies - HPCI System Data Sources - ESF D em ands ..............................................
BWR TDP Assemblies - HPCI System Data Sources - ESF Dem ands (1996-1998) ...................................
PWR TDP Asemblies - AFW System Data Source Inputs Estimated Surveillance Test Demands ......................
BWR TDP Assemblies - RCIC System Data Source Inputs Estimated Surveillance Test Demands ......................
BWR TDP Assemblies - HPCI System Data Source Inputs Estimated Surveillance Test Demands ......................
PAGE
IV-3
. IV-6
. IV-7
. IV-9
IV-12
IV-21
IV-24
IV-26
IV-27
IV-29
IV-30
IV-32
IV-33
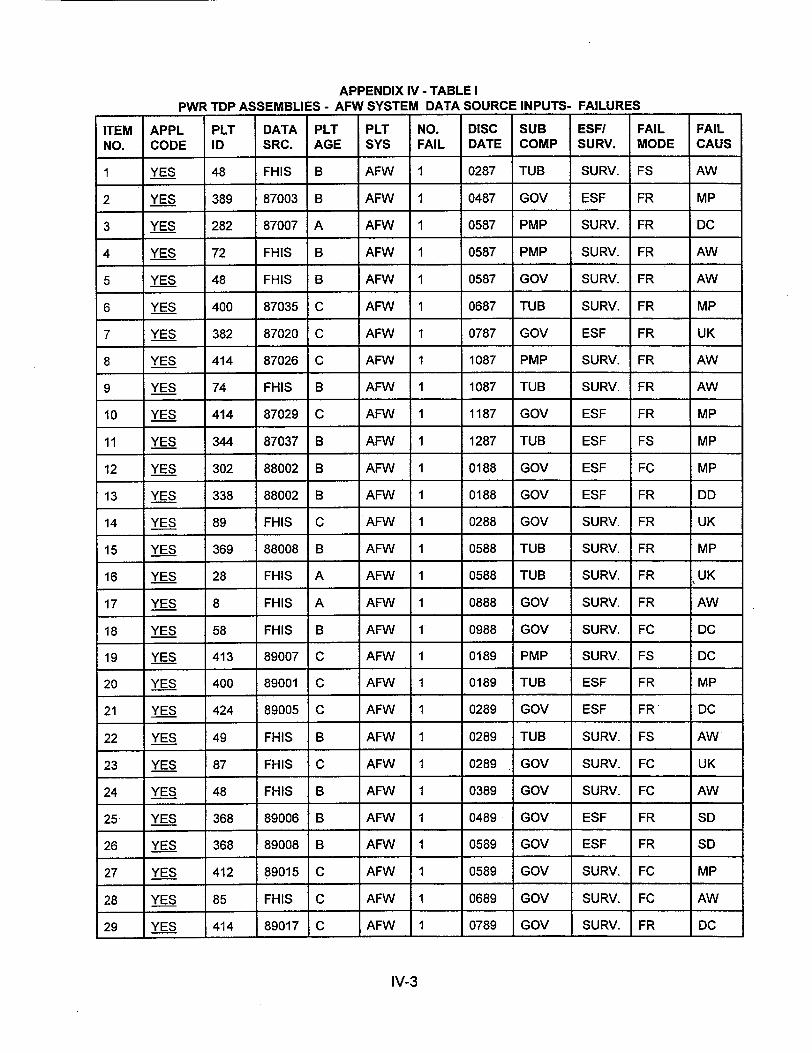
APPENDIX IV - TABLE I PWR TDP ASSEMBLIES - AFW SYSTEM DATA SOURCE INPUTS- FAILURES
ITEM APPL PLT DATA PLT PLT NO. DISC SUB ESF/ FAIL FAIL NO. CODE ID SRC. AGE SYS FAIL DATE COMP SURV. MODE CAUS
I YES 48 FHIS B AFW 1 0287 TUB SURV. FS AW
2 YES 389 87003 B AFW 1 0487 GOV ESF FR MP
3 YES 282 87007 A AFW 1 0587 PMP SURV. FR DC
4 YES 72 FHIS B AFW 1 0587 PMP SURV. FR AW
5 YES 48 FHIS B AFW 1 0587 GOV SURV. FR AW
6 YES 400 87035 C AFW 1 0687 TUB SURV. FR MP
7 YES 382 87020 C AFW 1 0787 GOV ESF FR UK
8 YES 414 87026 C AFW 1 1087 PMP SURV. FR AW
9 YES 74 FHIS B AFW 1 1087 TUB SURV. FR AW
10 YES 414 87029 C AFW 1 1187 GOV ESF FR MP
11 YES 344 87037 B AFW 1 1287 TUB ESF FS MP
12 YES 302 88002 B AFW 1 0188 GOV ESF FC MP
13 YES 338 88002 B AFW 1 0188 GOV ESF FR DD
14 YES 89 FHIS C AFW 1 0288 GOV SURV. FR UK
15 YES 369 88008 B AFW 1 0588 TUB SURV. FR MP
16 YES 28 FHIS A AFW 1 0588 TUB SURV. FR UK
17 YES 8 FHIS A AFW 1 0888 GOV SURV. FR AW
18 YES 58 FHIS B AFW 1 0988 GOV SURV. FC DC
19 YES 413 89007 C AFW 1 0189 PMP SURV. FS DC
20 YES 400 89001 C AFW 1 0189 TUB ESF FR MP
21 YES 424 89005 C AFW 1 0289 GOV ESF FR DC
22 YES 49 FHIS B AFW 1 0289 TUB SURV. FS AW
23 YES 87 FHIS C AFW 1 0289 GOV SURV. FC UK
24 YES 48 FHIS B AFW 1 0389 GOV SURV. FC AW
25 YES 368 89006 B AFW 1 0489 GOV ESF FR SD
26 YES 368 89008 B AFW 1 0589 GOV ESF FR SD
27 YES 412 89015 C AFW 1 0589 GOV SURV. FC MP
28 YES 85 FHIS C AFW 1 0689 GOV SURV. FC AW
29 YES 414 89017 C AFW 1 0789 GOV SURV. FR DC
IV-3
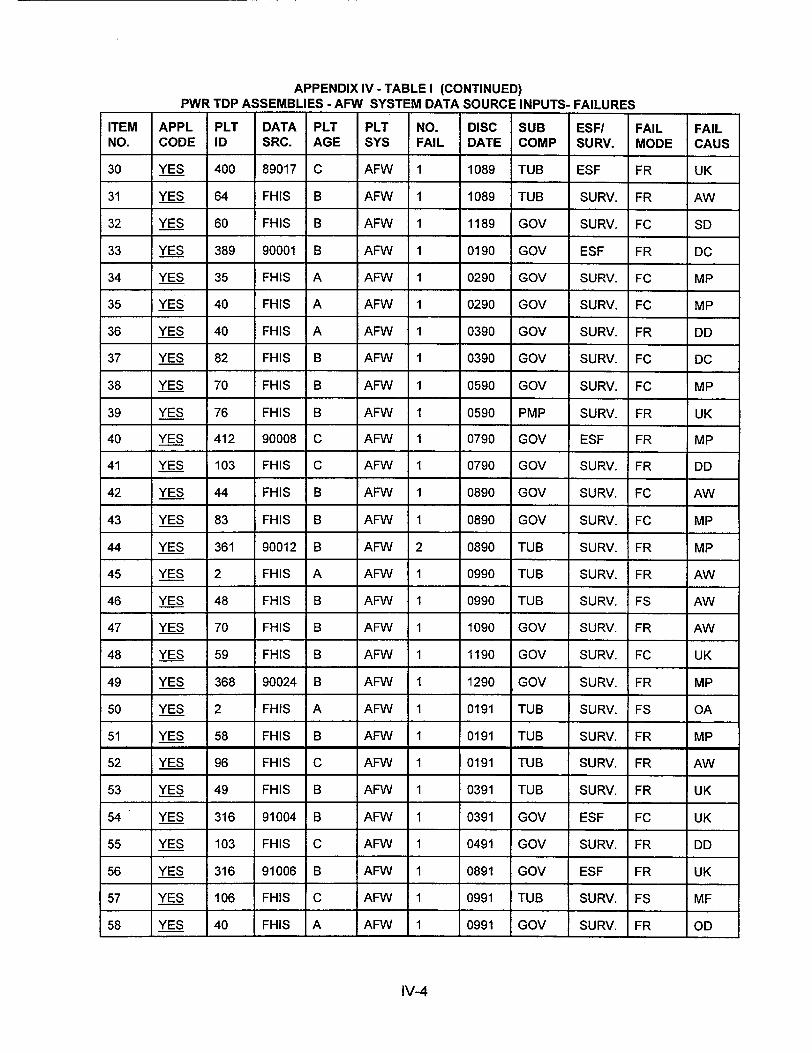
APPENDIX IV - TABLE I (CONTINUED) PWR TDP ASSEMBLIES - AFW SYSTEM DATA SOURCE INPUTS- FAILURES
ITEM APPL PLT DATA PLT PLT NO. DISC SUB ESF/ FAIL FAIL NO. CODE ID SRC. AGE SYS FAIL DATE COMP SURV. MODE CAUS
30 YES 400 89017 C AFW 1 1089 TUB ESF FR UK
31 YES 64 FHIS B AFW 1 1089 TUB SURV. FR AW
32 YES 60 FHIS B AFW 1 1189 GOV SURV. FC SD
33 YES 389 90001 B AFW 1 0190 GOV ESF FR DC
34 YES 35 FHIS A AFW 1 0290 GOV SURV. FC MP
35 YES 40 FHIS A AFW 1 0290 GOV SURV. FC MP
36 YES 40 FHIS A AFW 1 0390 GOV SURV. FR DD
37 YES 82 FHIS B AFW 1 0390 GOV SURV. FC DC
38 YES 70 FHIS B AFW 1 0590 GOV SURV. FC MP
39 YES 76 FHIS B AFW 1 0590 PMP SURV. FR UK
40 YES 412 90008 C AFW 1 0790 GOV ESF FR MP
41 YES 103 FHIS C AFW 1 0790 GOV SURV. FR DD
42 YES 44 FHIS B AFW 1 0890 GOV SURV. FC AW
43 YES 83 FHIS B AFW 1 0890 GOV SURV. FC MP
44 YES 361 90012 B AFW 2 0890 TUB SURV. FR MP
45 YES 2 FHIS A AFW 1 0990 TUB SURV. FR AW
46 YES 48 FHIS B AFW 1 0990 TUB SURV. FS AW
47 YES 70 FHIS B AFW 1 1090 GOV SURV. FR AW
48 YES 59 FHIS B AFW 1 1190 GOV SURV. FC UK
49 YES 368 90024 B AFW 1 1290 GOV SURV. FR MP
50 YES 2 FHIS A AFW 1 0191 TUB SURV. FS OA
51 YES 58 FHIS B AFW 1 0191 TUB SURV. FR MP
52 YES 96 FHIS C AFW 1 0191 TUB SURV. FR AW
53 YES 49 FHIS B AFW 1 0391 TUB SURV. FR UK
54 YES 316 91004 B AFW 1 0391 GOV ESF FC UK
55 YES 103 FHIS C AFW 1 0491 GOV SURV. FR DD
56 YES 316 91006 B AFW 1 0891 GOV ESF FR UK
57 YES 106 FHIS C AFW 1 0991 TUB SURV. FS MF
58 YES 40 FHIS A AFW 1 0991 GOV SURV. FR OD
IV-4
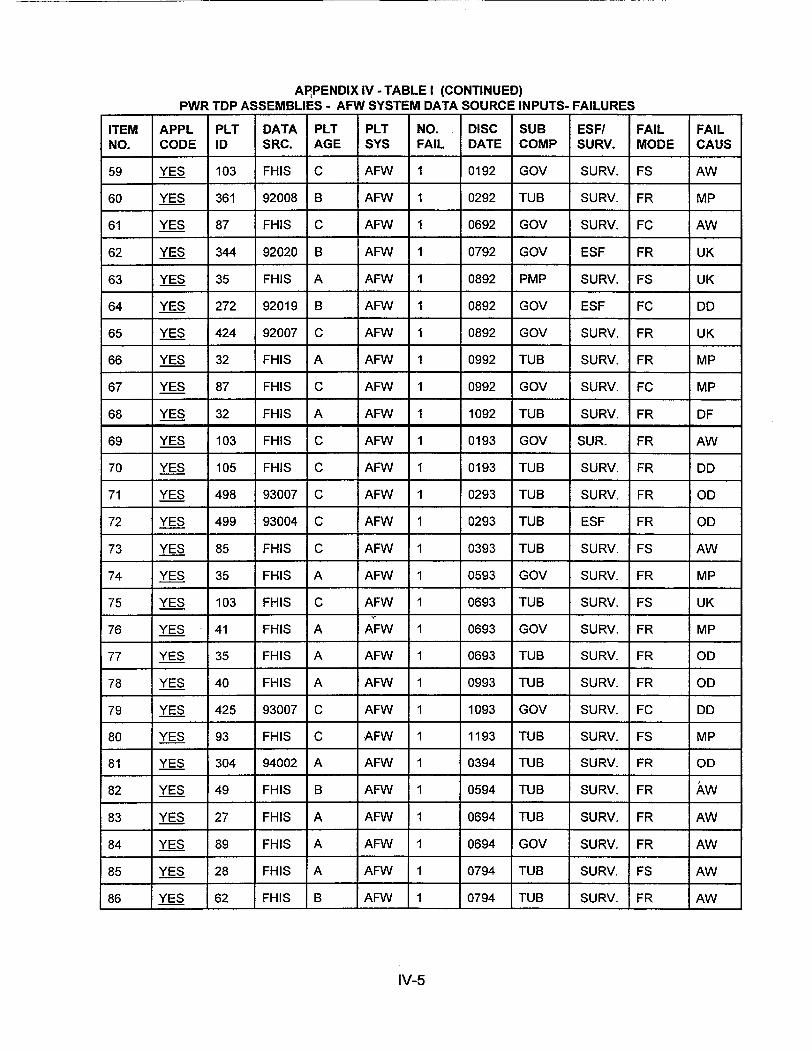
AFiPENDIX IV - TABLE I (CONTINUED) PWR TDP ASSEMBLIES - AFW SYSTEM DATA SOURCE INPUTS- FAILURES
ITEM APPL PLT DATA PLT PLT NO. DISC SUB ESF/ FAIL FAIL NO. CODE ID SRC. AGE SYS FAIL DATE COMP SURV. MODE CAUS
59 YES 103 FHIS C AFW 1 0192 GOV SURV. FS AW
60 YES 361 92008 B AFW 1 0292 TUB SURV. FR MP
61 YES 87 FHIS C AFW 1 0692 GOV SURV. FC AW
62 YES 344 92020 B AFW 1 0792 GOV ESF FR UK
63 YES 35 FHIS A AFW 1 0892 PMP SURV. FS UK
64 YES 272 92019 B AFW 1 0892 GOV ESF FC DD
65 YES 424 92007 C AFW 1 0892 GOV SURV. FR UK
66 YES 32 FHIS A AFW 1 0992 TUB SURV. FR MP
67 YES 87 FHIS C AFW 1 0992 GOV SURV. FC MP
68 YES 32 FHIS A AFW 1 1092 TUB SURV. FR DF
69 YES 103 FHIS C AFW 1 0193 GOV SUR. FR AW
70 YES 105 FHIS C AFW 1 0193 TUB SURV. FR DD
71 YES 498 93007 C AFW 1 0293 TUB SURV. FR OD
72 YES 499 93004 C AFW 1 0293 TUB ESF FR OD
73 YES 85 FHIS C AFW 1 0393 TUB SURV. FS AW
74 YES 35 FHIS A AFW 1 0593 GOV SURV. FR MP
75 YES 103 FHIS C AFW 1 0693 TUB SURV. FS UK
76 YES 41 FHIS A AFW 1 0693 GOV SURV. FR MP
77 YES 35 FHIS A AFW 1 0693 TUB SURV. FR OD
78 YES 40 FHIS A AFW 1 0993 TUB SURV. FR OD
79 YES 425 93007 C AFW 1 1093 GOV SURV. FC DD
80 YES 93 FHIS C AFW 1 1193 TUB SURV. FS MP
81 YES 304 94002 A AFW 1 0394 TUB SURV. FR OD
82 YES 49 FHIS B AFW 1 0594 TUB SURV. FR AW
83 YES 27 FHIS A AFW 1 0694 TUB SURV. FR AW
84 YES 89 FHIS A AFW 1 0694 GOV SURV. FR AW
85 YES 28 FHIS A AFW 1 0794 TUB SURV. FS AW
86 YES 62 FHIS B AFW 1 0794 TUB SURV. FR AW
IV-5
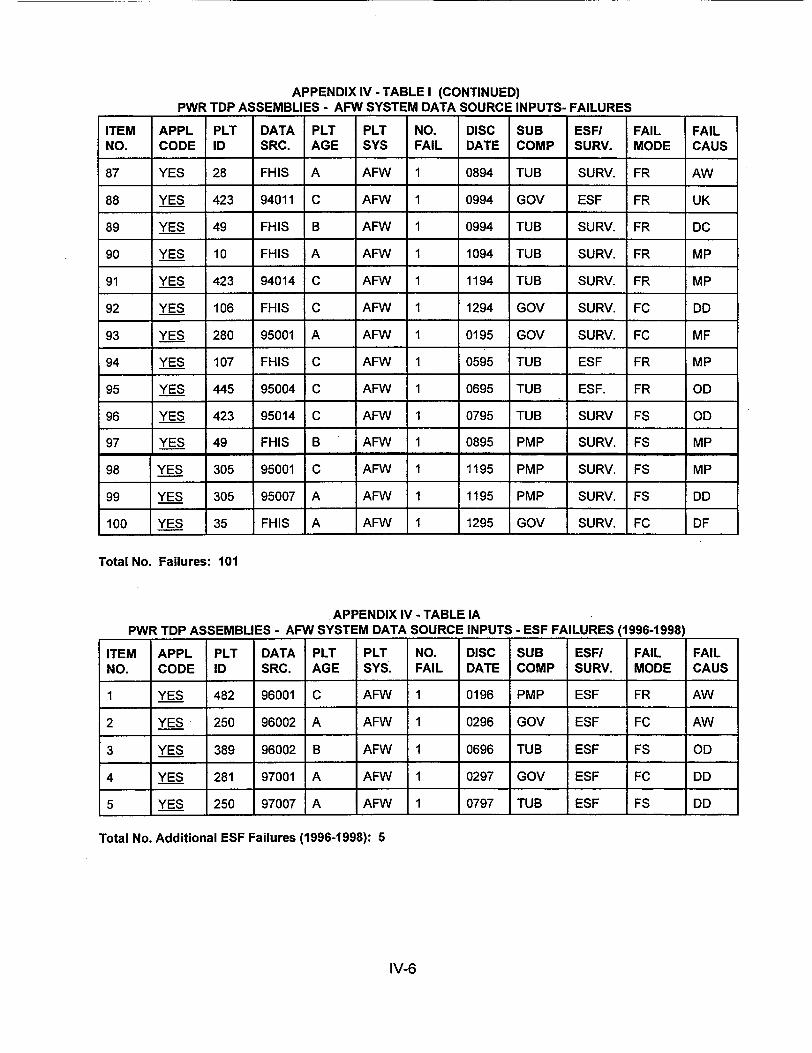
APPENDIX IV - TABLE I (CONTINUED) PWR TDP ASSEMBLIES - AFW SYSTEM DATA SOURCE INPUTS- FAILURES
ITEM APPL PLT DATA PLT PLT NO. DISC SUB ESFI FAIL FAIL NO. CODE ID SRC. AGE SYS FAIL DATE COMP SURV. MODE CAUS
87 YES 28 FHIS A AFW 1 0894 TUB SURV. FR AW
88 YES 423 94011 C AFW 1 0994 GOV ESF FR UK
89 YES 49 FHIS B AFW 1 0994 TUB SURV. FR DC
90 YES 10 FHIS A AFW 1 1094 TUB SURV. FR MP
91 YES 423 94014 C AFW 1 1194 TUB SURV. FR MP
92 YES 106 FHIS C AFW 1 1294 GOV SURV. FC DD
93 YES 280 95001 A AFW 1 0195 GOV SURV. FC MF
94 YES 107 FHIS C AFW 1 0595 TUB ESF FR MP
95 YES 445 95004 C AFW 1 0695 TUB ESF. FR' OD
96 YES 423 95014 C AFW 1 0795 TUB SURV FS OD
97 YES 49 FHIS B AFW 1 0895 PMP SURV. FS MP
98 YES 305 95001 C AFW 1 1195 PMP SURV. FS MP
99 YES 305 95007 A AFW 1 1195 PMP SURV. FS DD
100 YES 35 FHIS A AFW 1 1295 GOV SURV. FC DF
Total No. Failures: 101
APPENDIX IV - TABLE IA PWR TDP ASSEMBLIES - AFW SYSTEM DATA SOURCE INPUTS - ESF FAILURES (1996-1998)
ITEM APPL PLT DATA PLT PLT NO. DISC SUB ESFI FAIL FAIL NO. CODE ID SRC. AGE SYS. FAIL DATE COMP SURV. MODE CAUS
1 YES 482 96001 C AFW 1 0196 PMP ESF FR AW
2 YES 250 96002 A AFW 1 0296 GOV ESF FC AW
3 YES 389 96002 B AFW 1 0696 TUB ESF FS OD
4 YES 281 97001 A AFW 1 0297 GOV ESF FC DD
5 YES 250 97007 A AFW 1 0797 TUB ESF FS DD
Total No. Additional ESF Failures (1996-1998): 5
IV-6
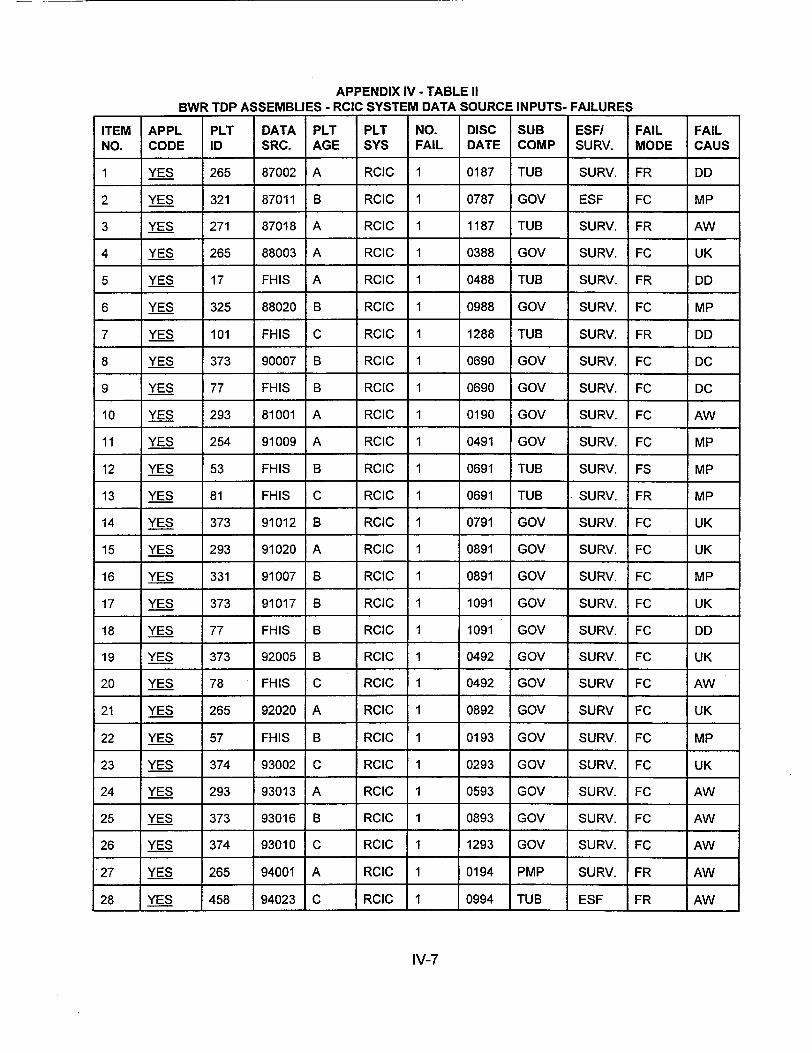
APPENDIX IV - TABLE II BWR TDP ASSEMBLIES - RCIC SYSTEM DATA SOURCE INPUTS- FAILURES
ITEM APPL PLT DATA PLT PLT NO. DISC SUB ESF/ FAIL FAIL NO. CODE ID SRC. AGE SYS FAIL DATE COMP SURV. MODE CAUS
1 YES 265 87002 A RCIC 1 0187 TUB SURV. FR DD
2 YES 321 87011 B RCIC 1 0787 GOV ESF FC MP
3 YES 271 87018 A RCIC 1 1187 TUB SURV. FR AW
4 YES 265 88003 A RCIC 1 0388 GOV SURV. FC UK
5 YES 17 FHIS A RCIC 1 0488 TUB SURV. FR DD
6 YES 325 88020 B RCIC 1 0988 GOV SURV. FC MP
7 YES 101 FHIS C RCIC 1 1288 TUB SURV. FR DD
8 YES 373 90007 B RCIC 1 0690 GOV SURV. FC DC
9 YES 77 FHIS B RCIC 1 0690 GOV SURV. FC DC
10 YES 293 81001 A RCIC 1 0190 GOV SURV. FC AW
11 YES 254 91009 A RCIC 1 0491 GOV SURV. FC MP
12 YES 53 FHIS B RCIC 1 0691 TUB SURV. FS MP
13 YES 81 FHIS C RCIC 1 0691 TUB SURV. FR MP
14 YES 373 91012 B RCIC 1 0791 GOV SURV. FC UK
15 YES 293 91020 A RCIC 1 0891 GOV SURV. FC UK
16 YES 331 91007 B RCIC 1 0891 GOV SURV. FC MP
17 YES 373 91017 B RCIC 1 1091 GOV SURV. FC UK
18 YES 77 FHIS B RCIC 1 1091 GOV SURV. FC DD
19 YES 373 92005 B RCIC 1 0492 GOV SURV. FC UK
20 YES 78 FHIS C RCIC 1 0492 GOV SURV FC AW
21 YES 265 92020 A RCIC 1 0892 GOV SURV FC UK
22 YES 57 FHIS B RCIC 1 0193 GOV SURV. FC MP
23 YES 374 93002 C RCIC 1 0293 GOV SURV. FC UK
24 YES 293 93013 A RCIC 1 0593 GOV SURV. FC AW
25 YES 373 93016 B RCIC 1 0893 GOV SURV. FC AW
26 YES 374 93010 C RCiC 1 1293 GOV SURV. FC AW
27 YES 265 94001 A RCIC 1 0194 PMP SURV. FR AW
28 YES 458 94023 C RCIC 1 0994 TUB ESF FR AW
IV-7
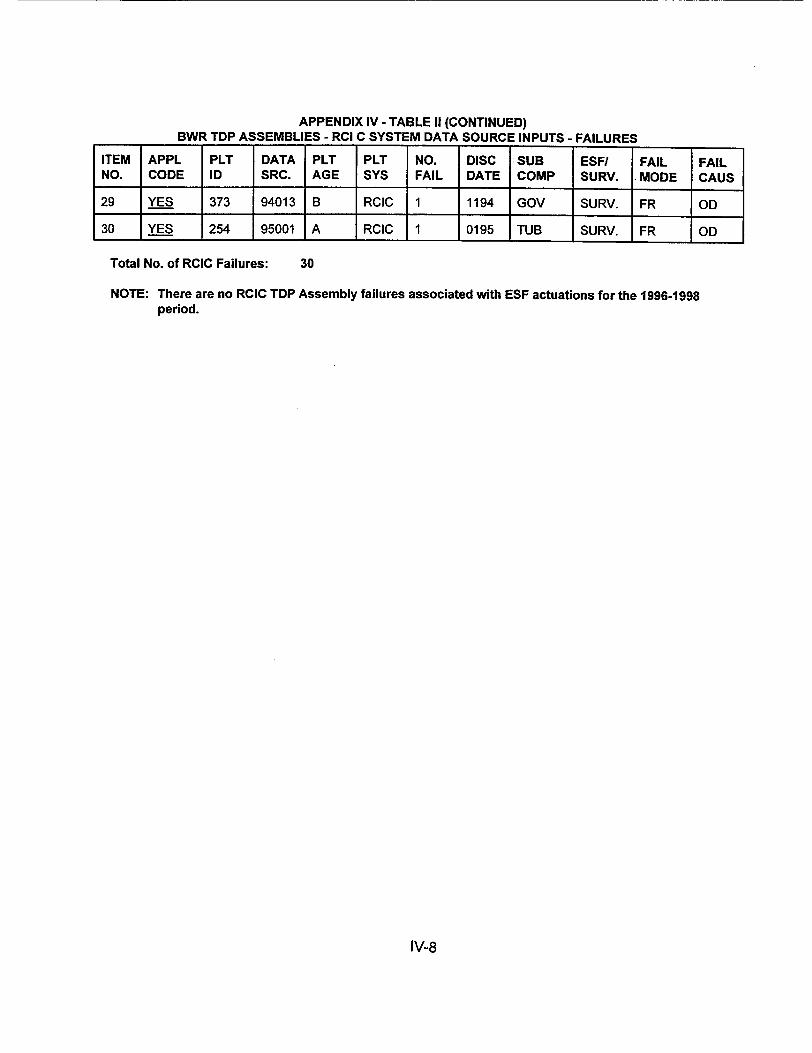
APPENDIX IV - TABLE II (CONTINUED) BWR TDP ASSEMBLIES - RCI C SYSTEM DATA SOURCE INPUTS - FAILURES
ITEM APPL PLT DATA PLT PLT NO. DISC -SUB ESFI FAIL FAIL NO. CODE ID SRC. AGE SYS FAIL DATE COMP SURV. MODE CAUS
29 YES 373 94013 B RCIC 1 1194 GOV SURV. FR OD
30 YES 254 95001 A RCIC 1 0195 TUB SURV. FR OD
Total No. of RCIC Failures: 30
NOTE: There are no RCIC TDP Assembly failures associated with ESF actuations for the 1996-1998 period.
IV-8
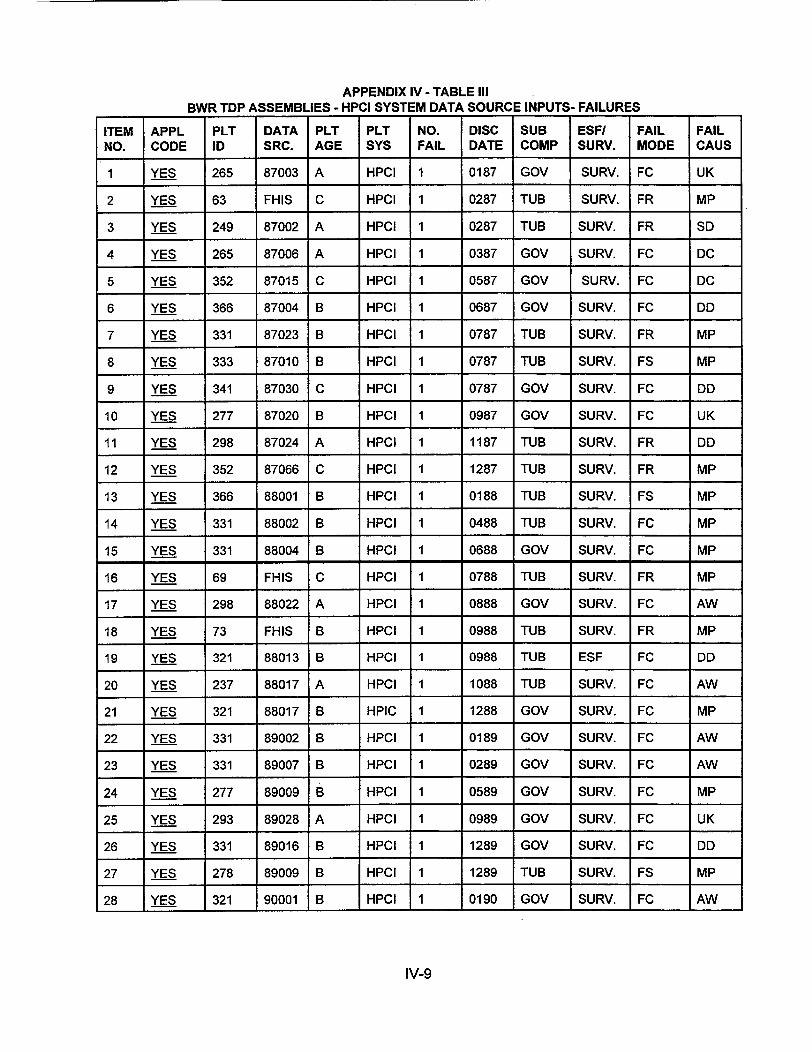
APPENDIX IV - TABLE III BWR TDP ASSEMBLIES - HPCI SYSTEM DATA SOURCE INPUTS- FAILURES
ITEM APPL PLT DATA PLT PLT NO. DISC SUB ESF/ FAIL FAIL NO. CODE ID SRC. AGE SYS FAIL DATE COMP SURV. MODE CAUS
1 YES 265 87003 A HPCI 1 0187 GOV SURV. FC UK
2 YES 63 FHIS C HPCI 1 0287 TUB SURV. FR MP
3 YES 249 87002 A HPCI 1 0287 TUB SURV. FR SD
4 YES 265 87006 A HPCI 1 0387 GOV SURV. FC DC
5 YES 352 87015 C HPCI 1 0587 GOV SURV. FC DC
6 YES 366 87004 B HPCI 1 0687 GOV SURV. FC DD
7 YES 331 87023 B HPCI 1 0787 TUB SURV. FR MP
8 YES 333 87010 B HPCI 1 0787 TUB SURV. FS MP
9 YES 341 87030 C HPCI 1 0787 GOV SURV. FC DD
10 YES 277 87020 B HPCI 1 0987 GOV SURV. FC UK
11 YES 298 87024 A HPCI 1 1187 TUB SURV. FR DD
12 YES 352 87066 C HPCI 1 1287 TUB SURV. FR MP
13 YES 366 88001 B HPCI 1 0188 TUB SURV. FS MP
14 YES 331 88002 B HPCI 1 0488 TUB SURV. FC MP
15 YES 331 88004 B HPCI 1 0688 GOV SURV. FC MP
16 YES 69 FHIS C HPCI 1 0788 TUB SURV. FR MP
17 YES 298 88022 A HPCI 1 0888 GOV SURV. FC AW
18 YES 73 FHIS B HPCI 1 0988 TUB SURV. FR MP
19 YES 321 88013 B HPCI 1 0988 TUB ESF FC DD
20 YES 237 88017 A HPCI 1 1088 TUB SURV. FC AW
21 YES 321 88017 B HPIC 1 1288 GOV SURV. FC MP
22 YES 331 89002 B HPCI 1 0189 GOV SURV. FC AW
23 YES 331 89007 B HPCI 1 0289 GOV SURV. FC AW
24 YES 277 89009 B HPCI 1 0589 GOV SURV. FC MP
25 YES 293 89028 A HPCI 1 0989 GOV SURV. FC UK
26 YES 331 89016 B HPCI 1 1289 GOV SURV. FC DD
27 YES 278 89009 B HPCI 1 1289 TUB SURV. FS MP
28 YES 321 90001 B HPCI 1 0190 GOV SURV. FC AW
IV-9

APPENDIX IV - TABLE III (CONTINUED) BWR TDP ASSEMBLIES - HPCI SYSTEM DATA SOURCE INPUTS- FAILURES
ITEM APPL PLT DATA PLT PLT NO. DISC SUB ESFI FAIL FAIL NO. CODE ID SRC. AGE SYS FAIL DATE COMP SURV. MODE CAUS
29 YES 388 90001 C HPCI 1 0290 GOV SURV. FC MP
30 YES 387 90007 B HPCI 1 0290 TUB SURV. FS DD
31 YES 333 90010 B HPCI 1 0390 GOV SURV. FC MP
32 YES 73 FHIS B HPCI 1 0790 TUB SURV. FS AW
33 YES 278 90010 B HPCI 1 0890 TUB SURV. FR DD
34 YES 324 90013 B HPCI 1 0990 GOV SURV. FC MP
35 YES 278 90011 B HPCI 1 0990 TUB SURV. FS MP
36 YES 293 90017 A HPCI 1 1090 TUB SURV. FS MP
37 YES 68 FHIS C HPCI 1 1290 TUB SURV. FR AW
38 YES 321 91001 B HPCI 1 0191 GOV ESF. FC UK
39 YES 265 91003 A HPCI 1 0191 GOV SURV. FC DD
40 YES 278 91005 B HPCI 1 0491 TUB SURV. FS OD
41 YES 254 91012 A HPCI 1 0591 TUB SURV. FS MP
42 YES 341 91020 C HPCI 1 1191 GOV SURV. FC MP
43 YES 387 91015 B HPCI 1 1191 TUB SURV. FC UK
44 YES 324 91020 B HPCI 1 1191 GOV SURV. FC MP
45 YES 254 92002 A HPCI 1 0292 TUB SURV. FC MP
46 YES 249 92011 A HPCI 1 0492 TUB SURV. FC MP
47 YES 388 92002 C HPCI 1 0492 TUB SURV. FC DD
48 YES 278 92004 B HPCI 1 0692 TUB SURV. FR AW
49 YES 352 92015 C HPCI 1 0792 TUB SURV. FC MP
50 YES 26 FHIS B HPCI 1 0892 GOV SURV. FC MP
51 YES 26 FHIS B HPCI 1 1092 GOV SURV. FC DD
52 YES 265 93002 A HPCI 1 0193 GOV SURV. FC DC
53 YES 254 93010 A HPCI 1 0793 GOV SURV. FC MP
54 YES 237 93016 A HPCI 1 0893 TUB SURV. FR MP
55 YES 278 94001 B HPCI 1 0194 GOV SURV. FC AW
56 YES 333 94001 B HPCI 1 0294 TUB SURV. FR OD
57 YES 366 94002 B HPCI 1 0394 TUB SURV. FR MF
IV-10

APPENDIX IV - TABLE III (CONTINUED) BWR TDP ASSEMBLIES - HPCI SYSTEM DATA SOURCE INPUTS- FAILURES
ITEM APPL PLT DATA PLT PLT NO. DISC SUB ESFI FAIL FAIL NO. CODE ID SRC. AGE SYS FAIL DATE COMP SURV. MODE CAUS
58 YES 237 94021 A HPCI 1 0894 TUB SURV. FR OD
59 YES 321 94013 B HPCI 1 1194 TUB SURV. FR MP
60 YES 254 95004 A HPCI 1 0395 GOV - FS MF
61 YES 254 95008 A HPCI 1 1295 TUB FS MP
62 YES 331 95012 B HPCI 1 1295 GOV FC UK
Total No. HPCI TDP Assembly Failures: 62
NOTE: There were no HPCI TDP Assembly failures associated with ESF actuations for the 1996-1998 period.
IV-11
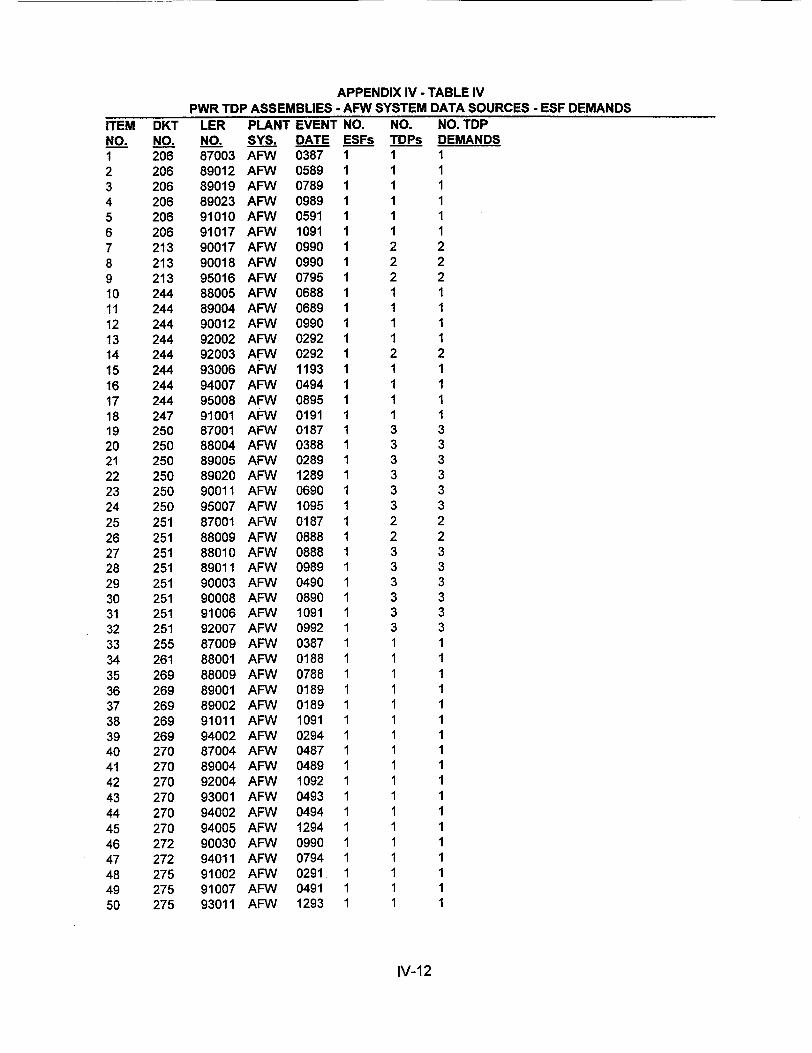
APPENDIX IV - TABLE IV PWR TDP ASSEMBLIES - AFW SYSTEM DATA SOURCES - ESF DEMANDS
ITEM DKT LER PLANT EVENT NO. NO. NO. TDP NO. NO. NO. SYS. DATE ESFs TDPs DEMANDS 1 206 87003 AFW 0387 1 1 1 2 206 89012 AFW 0589 1 1 1 3 206 89019 AFW 0789 1 1 1 4 206 89023 AFW 0989 1 1 1 5 206 91010 AFW 0591 1 1 1 6 206 91017 AFW 1091 1 1 1 7 213 90017 AFW 0990 1 2 2 8 213 90018 AFW 0990 1 2 2 9 213 95016 AFW 0795 1 2 2 10 244 88005 AFW 0688 1 1 1 11 244 89004 AFW 0689 1 1 1 12 244 90012 AFW 0990 1 1 1 13 244 92002 AFW 0292 1 1 1 14 244 92003 AFW 0292 1 2 2 15 244 93006 AFW 1193 1 1 1 16 244 94007 AFW 0494 1 1 1 17 244 95008 AFW 0895 1 1 1 18 247 91001 AFW 0191 1 1 1 19 250 87001 AFW 0187 1 3 3 20 250 88004 AFW 0388 1 3 3 21 250 89005 AFW 0289 1 3 3 22 250 89020 AFW 1289 1 3 3 23 250 90011 AFW 0690 1 3 3 24 250 95007 AFW 1095 1 3 3 25 251 87001 AFW 0187 1 2 2 26 251 88009 AFW 0888 1 2 2 27 251 88010 AFW 0888 1 3 3 28 251 89011 AFW 0989 1 3 3 29 251 90003 AFW 0490 1 3 3 30 251 90008 AFW 0890 1 3 3 31 251 91006 AFW 1091 1 3 3 32 251 92007 AFW 0992 1 3 3 33 255 87009 AFW 0387 1 1 1 34 261 88001 AFW 0188 1 1 1 35 269 88009 AFW 0788 1 1 1 36 269 89001 AFW 0189 1 1 1 37 269 89002 AFW 0189 1 1 1 38 269 91011 AFW 1091 1 1 1 39 269 94002 AFW 0294 1 1 1 40 270 87004 AFW 0487 1 1 1 41 270 89004 AFW 0489 1 1 1 42 270 92004 AFW 1092 1 1 1 43 270 93001 AFW 0493 1 1 1 44 270 94002 AFW 0494 1 1 1 45 270 94005 AFW 1294 1 1 1 46 272 90030 AFW 0990 1 1 1 47 272 94011 AFW 0794 1 1 1 48 275 91002 AFW 0291 1 1 1 49 275 91007 AFW 0491 1 1 1 50 275 93011 AFW 1293 1 1 1
IV-12
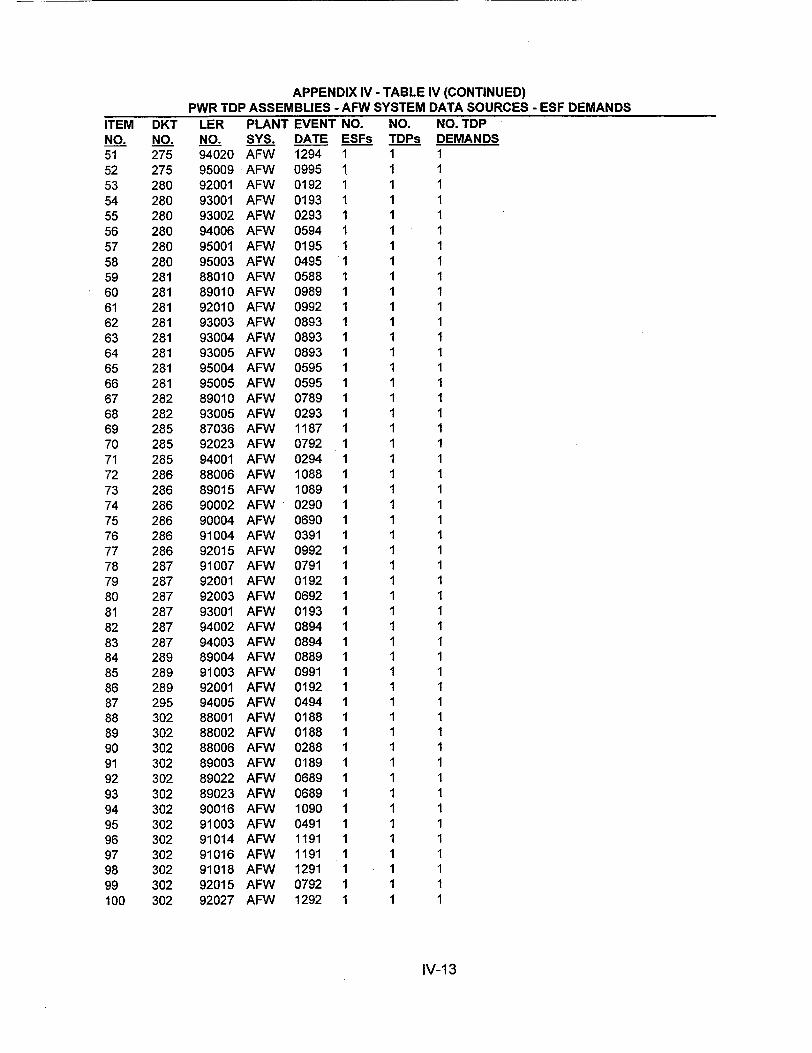
APPENDIX IV - TABLE IV (CONTINUED) PWR TDP ASSEMBLIES - AFW SYSTEM DATA SOURCES - ESF DEMANDS
ITEM DKT NO. NO. 51 275 52 275 53 280 54 280 55 280 56 280 57 280 58 280 59 281 60 281 61 281 62 281 63 281 64 281 65 281 66 281 67 282 68 282 69 285 70 285 71 285 72 286 73 286 74 286 75 286 76 286 77 286 78 287 79 287 80 287 81 287 82 287 83 287 84 289 85 289 86 289 87 295 88 302 89 302 90 302 91 302 92 302 93 302 94 302 95 302 96 302 97 302 98 302 99 302 100 302
LER PLANT EVENT NO. NO. NO. TDP NO. SYS. DATE ESFs TDPs DEMANDS 94020 AFW 1294 1 1 1 95009 AFW 0995 1 1 1 92001 AFW 0192 1 1 1 93001 AFW 0193 1 1 1 93002 AFW 0293 1 1 1 94006 AFW 0594 1 1 1 95001 AFW 0195 1 1 1 95003 AFW 0495 1 1 1 88010 AFW 0588 1 1 1 89010 AFW 0989 1 1 1 92010 AFW 0992 1 1 1 93003 AFW 0893 1 1 1 93004 AFW 0893 1 1 1 93005 AFW 0893 1 1 1 95004 AFW 0595 1 1 1 95005 AFW 0595 1 1 1 89010 AFW 0789 1 1 1 93005 AFW 0293 1 1 1 87036 AFW 1187 1 1 1 92023 AFW 0792 1 1 1 94001 AFW 0294 1 1 1 88006 AFW 1088 1 1 1 89015 AFW 1089 1 1 1 90002 AFW 0290 1 1 1 90004 AFW 0690 1 1 1 91004 AFW 0391 1 1 1 92015 AFW 0992 1 1 1 91007 AFW 0791 1 1 1 92001 AFW 0192 1 1 1 92003 AFW 0692 1 1 1 93001 AFW 0193 1 1 1 94002 AFW 0894 1 1 1 94003 AFW 0894 1 1 1 89004 AFW 0889 1 1 1 91003 AFW 0991 1 1 1 92001 AFW 0192 1 1 1 94005 AFW 0494 1 1 1 88001 AFW 0188 1 1 1 88002 AFW 0188 1 1 1 88006 AFW 0288 1 1 1 89003 AFW 0189 1 1 1 89022 AFW 0689 1 1 1 89023 AFW 0689 1 1 1 90016 AFW 1090 1 1 1 91003 AFW 0491 1 1 1 91014 AFW 1191 1 1 1 91016 AFW 1191 1 1 1 91018 AFW 1291 1 1 1 92015 AFW 0792 1 1 1 92027 AFW 1292 1 1 1
IV-13
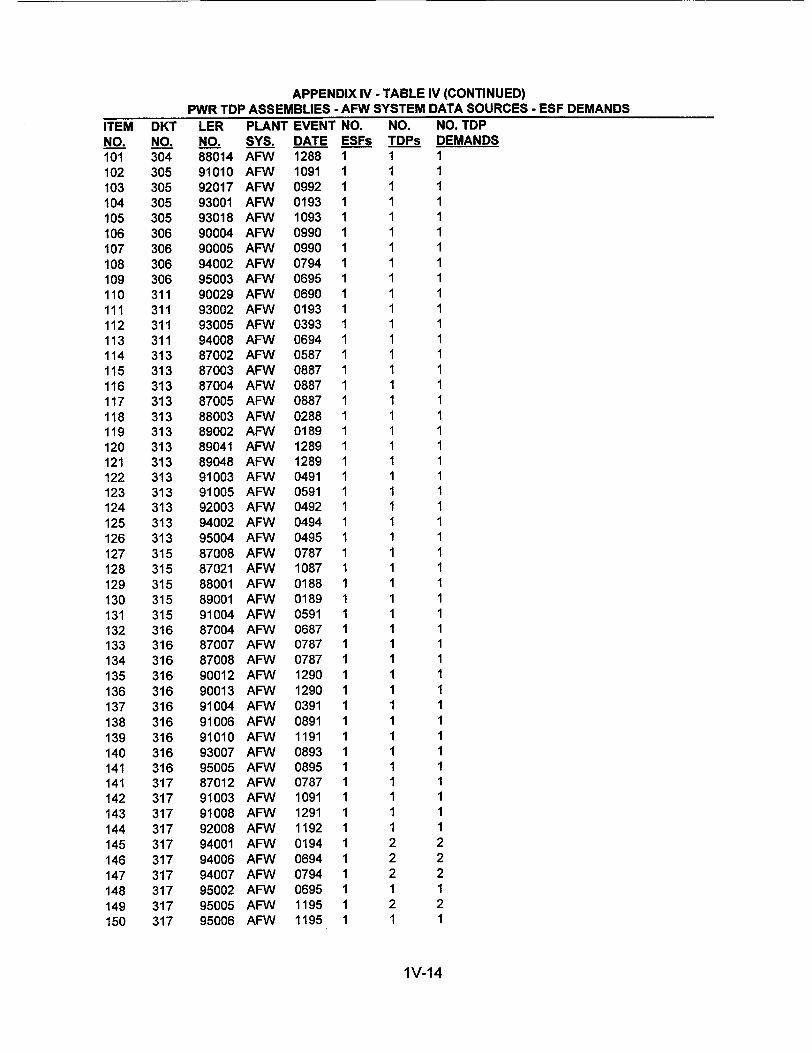
APPENDIX IV - TABLE IV (CONTINUED) PWR TDP ASSEMBLIES - AFW SYSTEM DATA SOURCES - ESF DEMANDS
ITEM DKT LER PLANT EVENT NO. NO. NO. TDP NO. NO. NO. SYS. DATE ESFs TDPs DEMANDS 101 304 88014 AFW 1288 1 1 1 102 305 91010 AFW 1091 1 1 1 103 305 92017 AFW 0992 1 1 1 104 305 93001 AFW 0193 1 1 1 105 305 93018 AFW 1093 1 1 1 106 306 90004 AFW 0990 1 1 1 107 306 90005 AFW 0990 1 1 1 108 306 94002 AFW 0794 1 1 1 109 306 95003 AFW 0695 1 1 1 110 311 90029 AFW 0690 1 1 1 111 311 93002 AFW 0193 1 1 1 112 311 93005 AFW 0393 1 1 1 113 311 94008 AFW 0694 1 1 1 114 313 87002 AFW 0587 1 1 1 115 313 87003 AFW 0887 1 1 1 116 313 87004 AFW 0887 1 1 1 117 313 87005 AFW 0887 1 1 1 118 313 88003 AFW 0288 1 1 1 119 313 89002 AFW 0189 1 1 1 120 313 89041 AFW 1289 1 1 1 121 313 89048 AFW 1289 1 1 1 122 313 91003 AFW 0491 1 1 1 123 313 91005 AFW 0591 1 1 1 124 313 92003 AFW 0492 1 1 1 125 313 94002 AFW 0494 1 1 1 126 313 95004 AFW 0495 1 1 1 127 315 87008 AFW 0787 1 1 1 128 315 87021 AFW 1087 1 1 1 129 315 88001 AFW 0188 1 1 1 130 315 89001 AFW 0189 1 1 1 131 315 91004 AFW 0591 1 1 1 132 316 87004 AFW 0687 1 1 1 133 316 87007 AFW 0787 1 1 1 134 316 87008 AFW 0787 1 1 1 135 316 90012 AFW 1290 1 1 1 136 316 90013 AFW 1290 1 1 1 137 316 91004 AFW 0391 1 1 1 138 316 91006 AFW 0891 1 1 1 139 316 91010 AFW 1191 1 1 1 140 316 93007 AFW 0893 1 1 1 141 316 95005 AFW 0895 1 1 1 141 317 87012 AFW 0787 1 1 1 142 317 91003 AFW 1091 1 1 1 143 317 91008 AFW 1291 1 1 1 144 317 92008 AFW 1192 1 1 1 145 317 94001 AFW 0194 1 2 2 146 317 94006 AFW 0694 1 2 2 147 317 94007 AFW 0794 1 2 2 148 317 95002 AFW 0695 1 1 1 149 317 95005 AFW 1195 1 2 2 150 317 95006 AFW 1195 1 1 1
1V-14

APPENDIX IV - TABLE IV (CONTINUED) PWR TDP ASSEMBLIES - AFW SYSTEM DATA SOURCES - ESF DEMANDS
ITEM DKT NO. NO. 151 318 152 318 153 318 154 318 155 318 156 318 157 318 158 318 159 318 160 318 161 318 162 327 163 327 164 327 165 327 166 327 167 327 168 327 169 327 170 327 171 327 172 327 173 327 174 328 175 328 176 328 177 328 178 328 179 328 180 328 181 328 182 328 183 328 184 328 185 334 186 334 187 334 188 334 189 334 190 334 191 334 192 334 193 334 194 334 195 334 196 334 197 334 198 334 199 335 200 335
LER PLANT EVENT NO. NO. NO. TDP NO. SYS. DATE ESFs TDPs DEMANDS 87002 AFW 0587 1 1 1 87007 AFW 1187 1 1 1 87008 AFW 1287 1 1 1 88002 AFW 0188 1 1 1 88002 AFW 0188 1 1 1 88004 AFW 0488 1 1 1 92005 AFW 0891 1 1 1 93002 AFW 0693 1 2 2 94001 AFW 0194 1 1 1 94007 AFW 0994 1 1 1 95002 AFW 0195 1 2 2 88044 AFW 1188 1 1 1 88045 AFW 1188 1 1 1 88047 AFW 1288 1 1 1 89005 AFW 0289 1 1 1 90009 AFW 0590 1 1 1 90012 AFW 0690 1 1 1 90022 AFW 0990 1 1 1 90030 AFW 1190 1 1 1 92027 AFW 1292 1 1 1 94011 AFW 0794 1 1 1 94014 AFW 1194 1 1 1 95008 AFW 0695 1 1 1 88014 AFW 0388 1 1 1 88023 AFW 0588 1 1 1 88024 AFW 0588 1 1 1 88027 AFW 0688 1 1 1 88028 AFW 0688 2 1 2 89008 AFW 0789 1 1 1 91001 AFW 0191 1 1 1 91006 AFW 1191 2 1 2 92001 AFW 0292 1 1 1 92012 AFW 0992 1 1 1 95007 AFW 1295 1 1 1 88007 AFW 0688 1 1 1 88008 AFW 0688 1 1 1 88009 AFW 0688 1 1 1 88014 AFW 0988 1 1 1 89001 AFW 0189 1 1 1 89002 AFW 0289 1 1 1 90007 AFW 0390 1 1 1 91006 AFW 0291 1 1 1 91022 AFW 0791 1 1 1 91023 AFW 0791 1 1 1 91029 AFW 1191 1 .1 1 92009 AFW 1092 1 1 1 93013 AFW 1093 1 1 1 94005 AFW 0694 1 1 1 87011 AFW 0587 1 1 1 87017 AFW 1287 1 1 1
1V-15
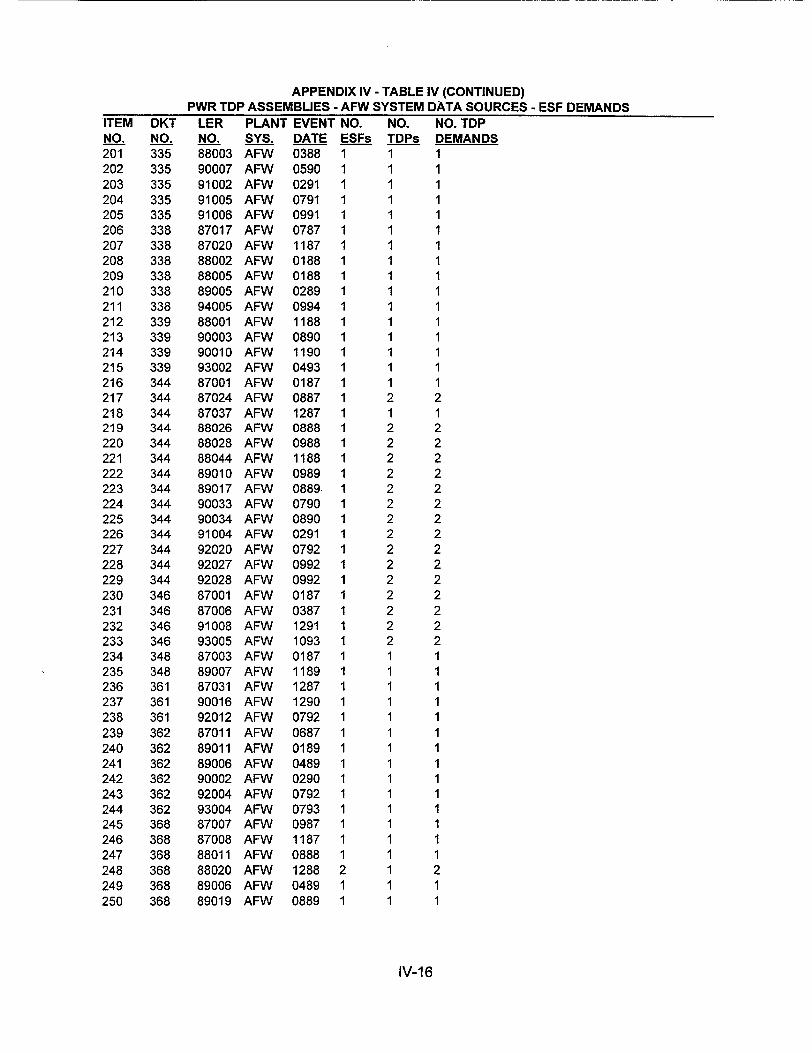
APPENDIX IV - TABLE IV (CONTINUED) PWR TDP ASSEMBLIES - AFW SYSTEM DATA SOURCES - ESF DEMANDS
ITEM DKT NO. NO. 201 335 202 335 203 335 204 335 205 335 206 338 207 338 208 338 209 338 210 338 211 338 212 339 213 339 214 339 215 339 216 344 217 344 218 344 219 344 220 344 221 344 222 344 223 344 224 344 225 344 226 344 227 344 228 344 229 344 230 346 231 346 232 346 233 346 234 348 235 348 236 361 237 361 238 361 239 362 240 362 241 362 242 362 243 362 244 362 245 368 246 368 247 368 248 368 249 368 250 368
IV-16
LER PLANT EVENT NO. NO. NO. TDP NO. SYS. DATE ESFs TDPs DEMANDS 88003 AFW 0388 1 1 1 90007 AFW 0590 1 1 1 91002 AFW 0291 1 1 1 91005 AFW 0791 1 1 1 91006 AFW 0991 1 1 1 87017 AFW 0787 1 1 1 87020 AFW 1187 1 1 1 88002 AFW 0188 1 1 1 88005 AFW 0188 1 1 1 89005 AFW 0289 1 1 1 94005 AFW 0994 1 1 1 88001 AFW 1188 1 1 1 90003 AFW 0890 1 1 1 90010 AFW 1190 1 1 1 93002 AFW 0493 1 1 1 87001 AFW 0187 1 1 1 87024 AFW 0887 1 2 2 87037 AFW 1287 1 1 1 88026 AFW 0888 1 2 2 88028 AFW 0988 1 2 2 88044 AFW 1188 1 2 2 89010 AFW 0989 1 2 2 89017 AFW 0889 1 2 2 90033 AFW 0790 1 2 2 90034 AFW 0890 1 2 2 91004 AFW 0291 1 2 2 92020 AFW 0792 1 2 2 92027 AFW 0992 1 2 2 92028 AFW 0992 1 2 2 87001 AFW 0187 1 2 2 87006 AFW 0387 1 2 2 91008 AFW 1291 1 2 2 93005 AFW 1093 1 2 2 87003 AFW 0187 1 1 1 89007 AFW 1189 1 1 1 87031 AFW 1287 1 1 1 90016 AFW 1290 1 1 1 92012 AFW 0792 1 1 1 87011 AFW 0687 1 1 1 89011 AFW 0189 1 1 1 89006 AFW 0489 1 1 1 90002 AFW 0290 1 1 1 92004 AFW 0792 1 1 1 93004 AFW 0793 1 1 1 87007 AFW 0987 1 1 1 87008 AFW 1187 1 1 1 88011 AFW 0888 1 1 1 88020 AFW 1288 2 1 2 89006 AFW 0489 1 1 1 89019 AFW 0889 1 1 1
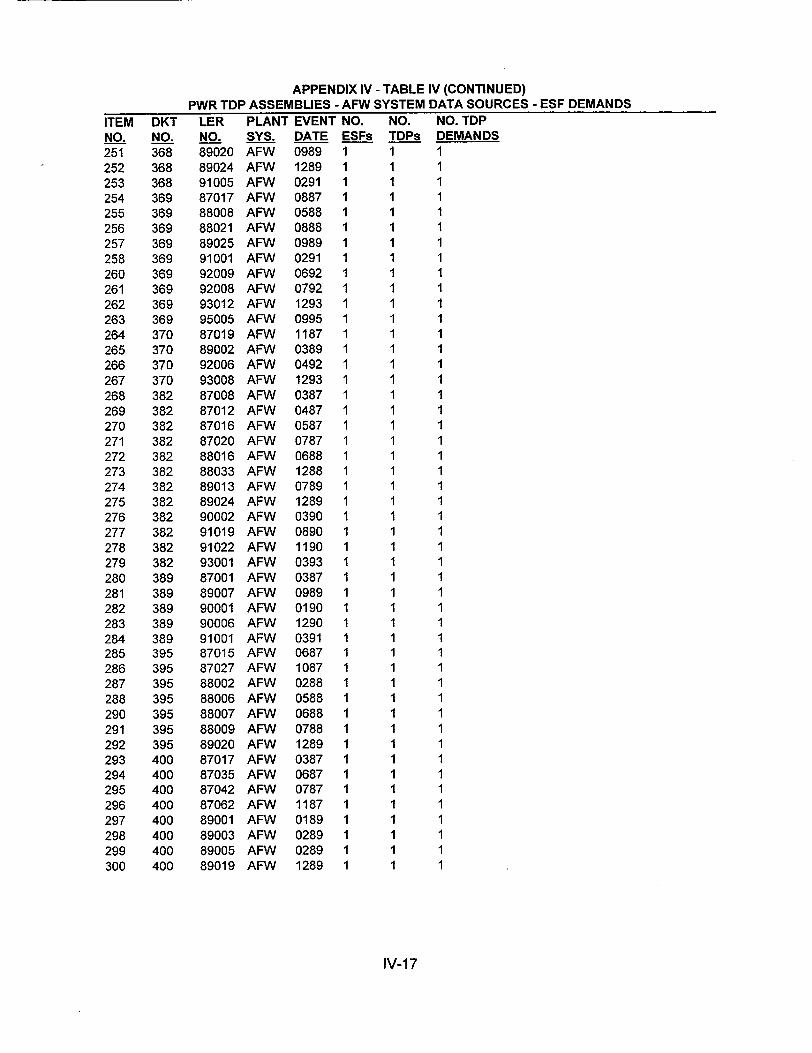
APPENDIX IV - TABLE IV (CONTINUED) PWR TDP ASSEMBLIES - AFW SYSTEM DATA SOURCES - ESF DEMANDS
ITEM DKT LER PLANT EVENT NO. NO. NO. TDP NO. NO. NO. SYS. DATE ESFs TDPs DEMANDS 251 368 89020 AFW 0989 1 1 1 252 368 89024 AFW 1289 1 1 1 253 368 91005 AFW 0291 1 1 1 254 369 87017 AFW 0887 1 1 1 255 369 88008 AFW 0588 1 1 1 256 369 88021 AFW 0888 1 1 1 257 369 89025 AFW 0989 1 1 1 258 369 91001 AFW 0291 1 1 1 260 369 92009 AFW 0692 1 1 1 261 369 92008 AFW 0792 1 1 1 262 369 93012 AFW 1293 1 1 1 263 369 95005 AFW 0995 1 1 1 264 370 87019 AFW 1187 1 1 1 265 370 89002 AFW 0389 1 1 1 266 370 92006 AFW 0492 1 1 1 267 370 93008 AFW 1293 1 1 1 268 382 87008 AFW 0387 1 1 1 269 382 87012 AFW 0487 1 1 1 270 382 87016 AFW 0587 1 1 1 271 382 87020 AFW 0787 1 1 1 272 382 88016 AFW 0688 1 1 1 273 382 88033 AFW 1288 1 1 1 274 382 89013 AFW 0789 1 1 1 275 382 89024 AFW 1289 1 1 1 276 382 90002 AFW 0390 1 1 1 277 382 91019 AFW 0890 1 1 1 278 382 91022 AFW 1190 1 1 1 279 382 93001 AFW 0393 1 1 1 280 389 87001 AFW 0387 1 1 1 281 389 89007 AFW 0989 1 1 1 282 389 90001 AFW 0190 1 1 1 283 389 90006 AFW 1290 1 1 1 284 389 91001 AFW 0391 1 1 1 285 395 87015 AFW 0687 1 1 1 286 395 87027 AFW 1087 1 1 1 287 395 88002 AFW 0288 1 1 1 288 395 88006 AFW 0588 1 1 1 290 395 88007 AFW 0688 1 1 1 291 395 88009 AFW 0788 1 1 1 292 395 89020 AFW 1289 1 1 1 293 400 87017 AFW 0387 1 1 1 294 400 87035 AFW 0687 1 1 1 295 400 87042 AFW 0787 1 1 1 296 400 87062 AFW 1187 1 1 1 297 400 89001 AFW 0189 1 1 1 298 400 89003 AFW 0289 1 1 1 299 400 89005 AFW 0289 1 1 1 300 400 89019 AFW 1289 1 1 1
IV-17
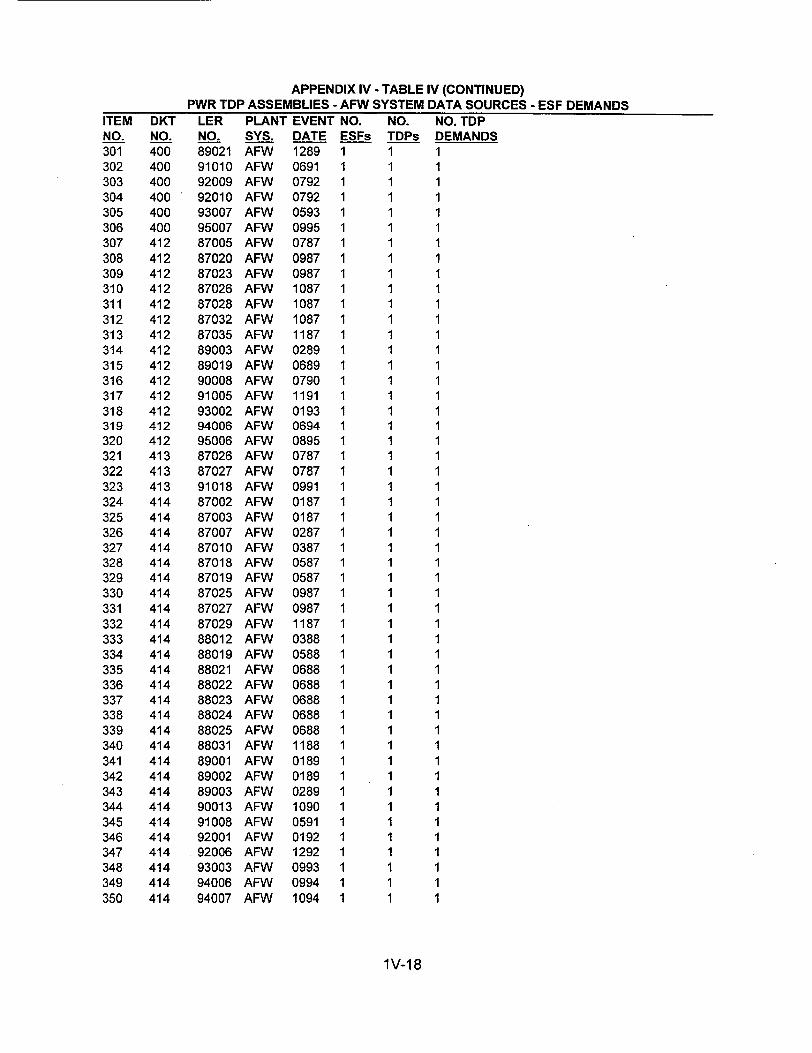
APPENDIX IV - TABLE IV (CONTINUED) PWR TDP ASSEMBLIES - AFW SYSTEM DATA SOURCES - ESF DEMANDS
ITEM DKT NO. NO. 301 400 302 400 303 400 304 400 305 400 306 400 307 412 308 412 309 412 310 412 311 412 312 412 313 412 314 412 315 412 316 412 317 412 318 412 319 412 320 412 321 413 322 413 323 413 324 414 325 414 326 414 327 414 328 414 329 414 330 414 331 414 332 414 333 414 334 414 335 414 336 414 337 414 338 414 339 414 340 414 341 414 342 414 343 414 344 414 345 414 346 414 347 414 348 414 349 414 350 414
1V-18
LER PLANT EVENT NO. NO. NO. TDP NO. SYS. DATE ESFs TDPs DEMANDS 89021 AFW 1289 1 1 1 91010 AFW 0691 1 1 1 92009 AFW 0792 1 1 1 92010 AFW 0792 1 1 1 93007 AFW 0593 1 1 1 95007 AFW 0995 1 1 1 87005 AFW 0787 1 1 1 87020 AFW 0987 1 1 1 87023 AFW 0987 1 1 1 87026 AFW 1087 1 1 1 87028 AFW 1087 1 1 1 87032 AFW 1087 1 1 1 87035 AFW 1187 1 1 1 89003 AFW 0289 1 1 1 89019 AFW 0689 1 1 1 90008 AFW 0790 1 1 1 91005 AFW 1191 1 1 1 93002 AFW 0193 1 1 1 94006 AFW 0694 1 1 1 95006 AFW 0895 1 1 1 87026 AFW 0787 1 1 1 87027 AFW 0787 1 1 1 91018 AFW 0991 1 1 1 87002 AFW 0187 1 1 1 87003 AFW 0187 1 1 1 87007 AFW 0287 1 1 1 87010 AFW 0387 1 1 1 87018 AFW 0587 1 1 1 87019 AFW 0587 1 1 1 87025 AFW 0987 1 1 1 87027 AFW 0987 1 1 1 87029 AFW 1187 1 1 1 88012 AFW 0388 1 1 1 88019 AFW 0588 1 1 1 88021 AFW 0688 1 1 1 88022 AFW 0688 1 1 1 88023 AFW 0688 1 1 1 88024 AFW 0688 1 1 1 88025 AFW 0688 1 1 1 88031 AFW 1188 1 1 1 89001 AFW 0189 1 1 1 89002 AFW 0189 1 1 1 89003 AFW 0289 1 1 1 90013 AFW 1090 1 1 1 91008 AFW 0591 1 1 1 92001 AFW 0192 1 1 1 92006 AFW 1292 1 1 1 93003 AFW 0993 1 1 1 94006 AFW 0994 1 1 1 94007 AFW 1094 1 1 1
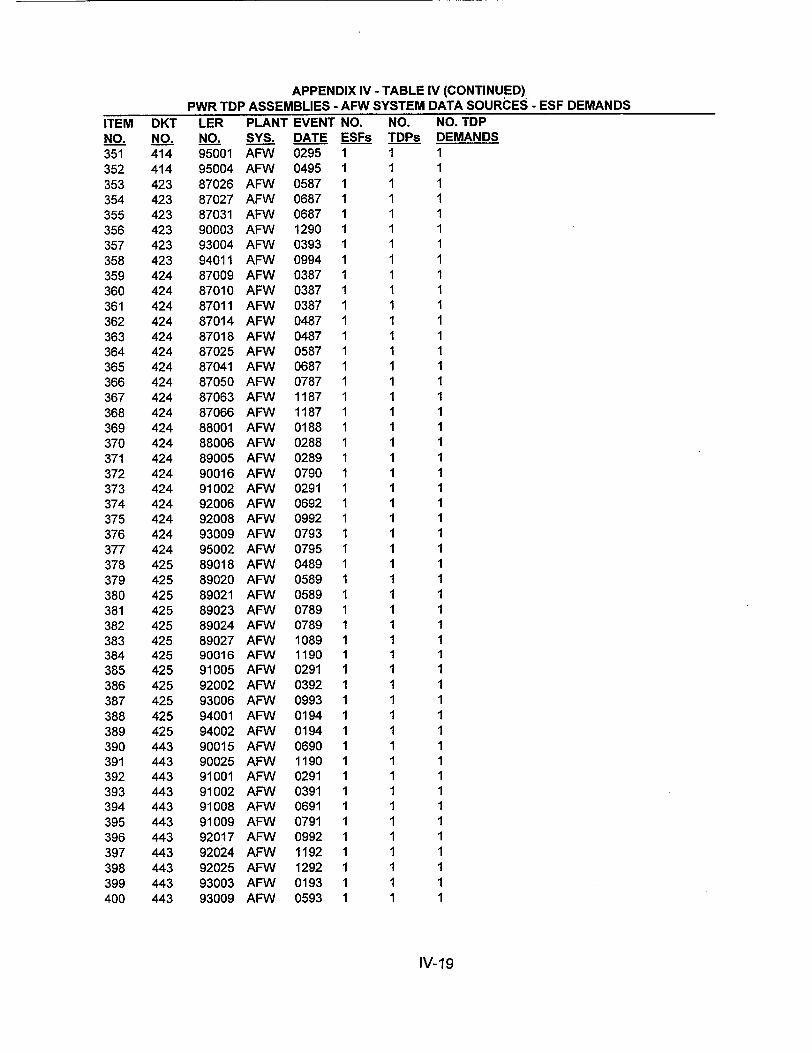
APPENDIX IV - TABLE IV (CONTINUED) PWR TDP ASSEMBLIES - AFW SYSTEM DATA SOURCES - ESF DEMANDS
ITEM DKT LER PLANT EVENT NO. NO. NO. TDP NO. NO. NO. SYS. DATE ESFs TDPs DEMANDS 351 414 95001 AFW 0295 1 1 1 352 414 95004 AFW 0495 1 1 1 353 423 87026 AFW 0587 1 1 1 354 423 87027 AFW 0687 1 1 1 355 423 87031 AFW 0687 1 1 1 356 423 90003 AFW 1290 1 1 1 357 423 93004 AFW 0393 1 1 1 358 423 94011 AFW 0994 1 1 1 359 424 87009 AFW 0387 1 1 1 360 424 87010 AFW 0387 1 1 1 361 424 87011 AFW 0387 1 1 1 362 424 87014 AFW 0487 1 1 1 363 424 87018 AFW 0487 1 1 1 364 424 87025 AFW 0587 1 1 1 365 424 87041 AFW 0687 1 1 1 366 424 87050 AFW 0787 1 1 1 367 424 87063 AFW 1187 1 1 1 368 424 87066 AFW 1187 1 1 1 369 424 88001 AFW 0188 1 1 1 370 424 88006 AFW 0288 1 1 1 371 424 89005 AFW 0289 1 1 1 372 424 90016 AFW 0790 1 1 1 373 424 91002 AFW 0291 1 1 1 374 424 92006 AFW 0692 1 1 1 375 424 92008 AFW 0992 1 1 1 376 424 93009 AFW 0793 1 1 1 377 424 95002 AFW 0795 1 1 1 378 425 89018 AFW 0489 1 1 1 379 425 89020 AFW 0589 1 1 1 380 425 89021 AFW 0589 1 1 1 381 425 89023 AFW 0789 1 1 1 382 425 89024 AFW 0789 1 1 1 383 425 89027 AFW 1089 1 1 1 384 425 90016 AFW 1190 1 1 1 385 425 91005 AFW 0291 1 1 1 386 425 92002 AFW 0392 1 1 1 387 425 93006 AFW 0993 1 1 1 388 425 94001 AFW 0194 1 1 1 389 425 94002 AFW 0194 1 1 1 390 443 90015 AFW 0690 1 1 1 391 443 90025 AFW 1190 1 1 1 392 443 91001 AFW 0291 1 1 1 393 443 91002 AFW 0391 1 1 1 394 443 91008 AFW 0691 1 1 1 395 443 91009 AFW 0791 1 1 1 396 443 92017 AFW 0992 1 1 1 397 443 92024 AFW 1192 1 1 1 398 443 92025 AFW 1292 1 1 1 399 443 93003 AFW 0193 1 1 1 400 443 93009 AFW 0593 1 1 1
IV-19
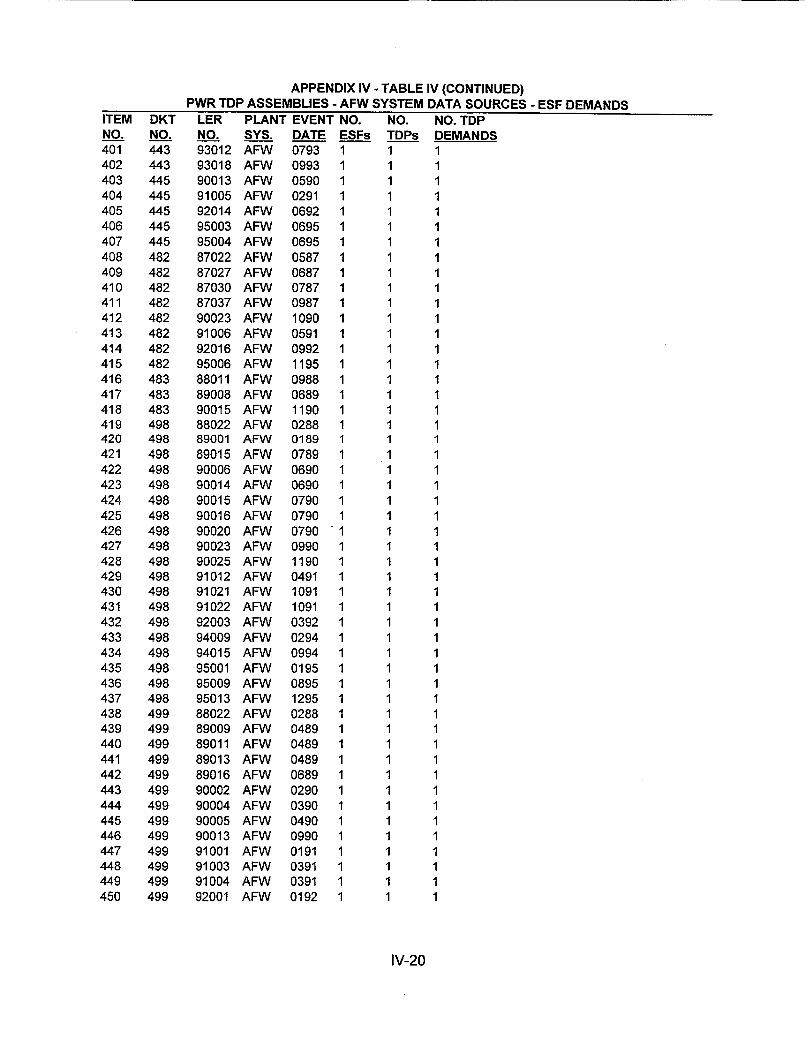
APPENDIX IV - TABLE IV (CONTINUED) PWR TDP ASSEMBLIES - AFW SYSTEM DATA SOURCES - ESF DEMANDS
ITEM DKT NO. NO. 401 443 402 443 403 445 404 445 405 445 406 445 407 445 408 482 409 482 410 482 411 482 412 482 413 482 414 482 415 482 416 483 417 483 418 483 419 498 420 498 421 498 422 498 423 498 424 498 425 498 426 498 427 498 428 498 429 498 430 498 431 498 432 498 433 498 434 498 435 498 436 498 437 498 438 499 439 499 440 499 441 499 442 499 443 499 444 499 445 499 446 499 447 499 448 499 449 499 450 499
IV-20
LER PLANT EVENT NO. NO. NO. TDP NO. SYS. DATE ESFs TDPs DEMANDS 93012 AFW 0793 1 1 1 93018 AFW 0993 1 1 1 90013 AFW 0590 1 1 1 91005 AFW 0291 1 1 1 92014 AFW 0692 1 1 1 95003 AFW 0695 1 1 1 95004 AFW 0695 1 1 1 87022 AFW 0587 1 1 1 87027 AFW 0687 1 1 1 87030 AFW 0787 1 1 1 87037 AFW 0987 1 1 1 90023 AFW 1090 1 1 1 91006 AFW 0591 1 1 1 92016 AFW 0992 1 1 1 95006 AFW 1195 1 1 1 88011 AFW 0988 1 1 1 89008 AFW 0689 1 1 1 90015 AFW 1190 1 1 1 88022 AFW 0288 1 1 1 89001 AFW 0189 1 1 1 89015 AFW 0789 1 1 1 90006 AFW 0690 1 1 1 90014 AFW 0690 1 1 1 90015 AFW 0790 1 1 1 90016 AFW 0790 1 1 1 90020 AFW 0790 1 1 1 90023 AFW 0990 1 1 1 90025 AFW 1190 1 1 1 91012 AFW 0491 1 1 1 91021 AFW 1091 1 1 1 91022 AFW 1091 1 1 1 92003 AFW 0392 1 1 1 94009 AFW 0294 1 1 1 94015 AFW 0994 1 1 1 95001 AFW 0195 1 1 1 95009 AFW 0895 1 1 1 95013 AFW 1295 1 1 1 88022 AFW 0288 1 1 1 89009 AFW 0489 1 1 1 89011 AFW 0489 1 1 1 89013 AFW 0489 1 1 1 89016 AFW 0689 1 1 1 90002 AFW 0290 1 1 1 90004 AFW 0390 1 1 1 90005 AFW 0490 1 1 1 90013 AFW 0990 1 1 1 91001 AFW 0191 1 1 1 91003 AFW 0391 1 1 1 91004 AFW 0391 1 1 1 92001 AFW 0192 1 1 1
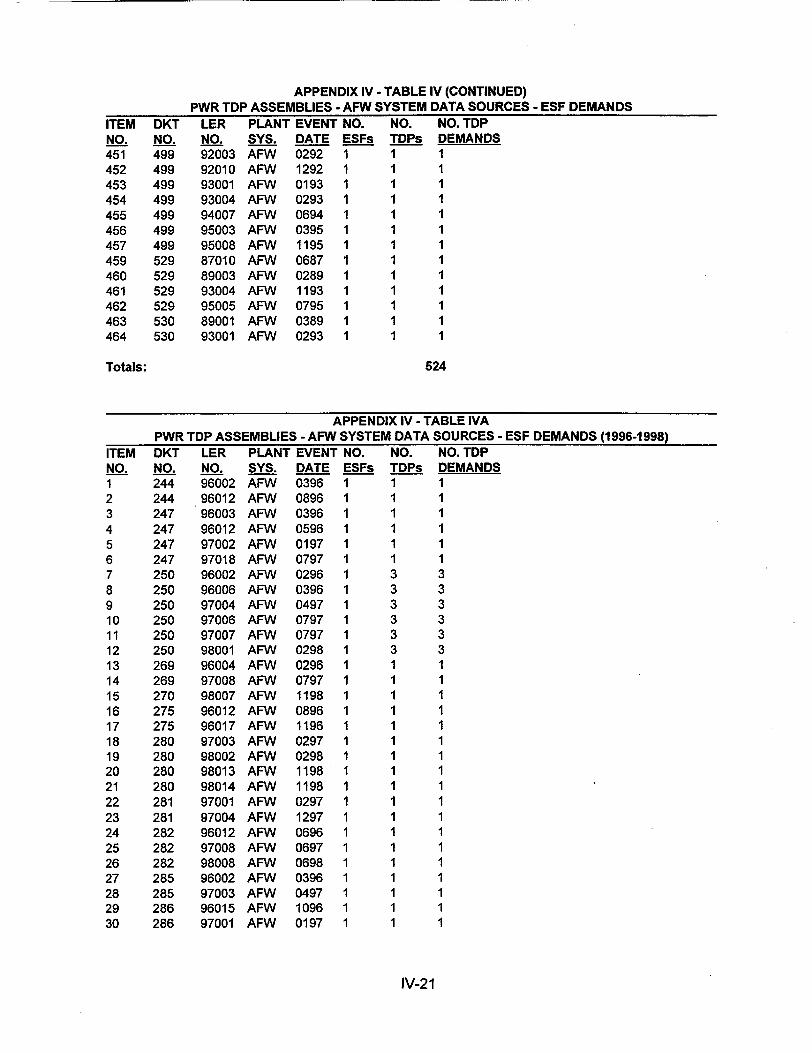
APPENDIX IV - TABLE IV (CONTINUED) PWR TDP ASSEMBLIES - AFW SYSTEM DATA SOURCES - ESF DEMANDS
ITEM DKT LER PLANT EVENT NO. NO. NO. TDP NO. NO. NO. SYS. DATE ESFs TDPs DEMANDS 451 499 92003 AFW 0292 1 1 1 452 499 92010 AFW 1292 1 1 1 453 499 93001 AFW 0193 1 1 1 454 499 93004 AFW 0293 1 1 1 455 499 94007 AFW 0694 1 1 1 456 499 95003 AFW 0395 1 1 1 457 499 95008 AFW 1195 1 1 1 459 529 87010 AFW 0687 1 1 1 460 529 89003 AFW 0289 1 1 1 461 529 93004 AFW 1193 1 1 1 462 529 95005 AFW 0795 1 1 1 463 530 89001 AFW 0389 1 1 1 464 530 93001 AFW 0293 1 1 1
Totals: 624
APPENDIX IV - TABLE IVA PWR TDP ASSEMBLIES -AFW SYSTEM DATA SOURCES - ESF DEMANDS (1996-1998)
ITEM DKT LER PLANT EVENT NO. NO. NO. TDP NO. NO. NO. SYS. DATE ESFs TDPs DEMANDS 1 244 96002 AFW 0396 1 1 1 2 244 96012 AFW 0896 1 1 1 3 247 96003 AFW 0396 1 1 1 4 247 96012 AFW 0596 1 1 1 5 247 97002 AFW 0197 1 1 1 6 247 97018 AFW 0797 1 1 1 7 250 96002 AFW 0296 1 3 3 8 250 96006 AFW 0396 1 3 3 9 250 97004 AFW 0497 1 3 3 10 250 97006 AFW 0797 1 3 3 11 250 97007 AFW 0797 1 3 3 12 250 98001 AFW 0298 1 3 3 13 269 96004 AFW 0296 1 1 1 14 269 97008 AFW 0797 1 1 1 15 270 98007 AFW 1198 1 1 1 16 275 96012 AFW 0896 1 1 1 17 275 96017 AFW 1196 1 1 1 18 280 97003 AFW 0297 1 1 1 19 280 98002 AFW 0298 1 1 1 20 280 98013 AFW 1198 1 1 1 21 280 98014 AFW 1198 1 1 1 22 281 97001 AFW 0297 1 1 1 23 281 97004 AFW 1297 1 1 1 24 282 96012 AFW 0696 1 1 1 25 282 97008 AFW 0697 1 1 1 26 282 98008 AFW 0698 1 1 1 27 285 96002 AFW 0396 1 1 1 28 285 97003 AFW 0497 1 1 1 29 286 96015 AFW 1096 1 1 1 30 286 97001 AFW 0197 1 1 1
IV-21

APPENDIX IV - TABLE IVA (CONTINUED) PWR TDP ASSEMBLIES -AFW SYSTEM DATA SOURCES - ESF DEMANDS(1996-1998)
ITEM DKT NO. NO. 31 286 32 286 33 286 34 286 35 287 36 289 37 302 38 302 39 302 40 305 41 305 42 306 43 306 44 306 45 306 46 313 47 313 48 313 49 315 50 315 51 316 52 317 53 318 54 318 55 318 56 323 57 323 58 323 59 327 60 327 61 327 62 328 63 328 64 328 65 328 66 328 67 334 68 334 69 334 70 338 71 339 72 346 73 346 74 346 75 368 76 369 77 369 78 370 79 370 80 382 81 382 82 389
IV-22
LER PLANT EVENT NO. NO. NO. TDP NO. SYS. DATE ESFs TDPs DEMANDS 97023 AFW 0997 1 1 1 97025 AFW 0997 1 1 1 98003 AFW 0598 1 1 1 98006 AFW 0898 1 1 1 96001 AFW 0396 1 1 1 97007 AFW 0697 1 1 1 96017 AFW 0596 1 1 1 98003 AFW 0298 1 1 1 98009 AFW 0898 1 1 1 96003 AFW 0496 1 1 1 98005 AFW 0298 1 1 1 96001 AFW 0396 1 1 1 96002 AFW 0496 1 1 1 97003 AFW 0597 1 1 1 98005 AFW 1198 1 1 1 96005 AFW 0596 1 1 1 96007 AFW 0996 1 1 1 98005 AFW 1298 1 1 1 96002 AFW 0396 1 1 1 96004 AFW 0996 1 1 1 97001 AFW 0397 2 1 2 97009 AFW 1097 1 1 1 96001 AFW 0296 1 1 1 96005 AFW 1196 1 1 1 98004 AFW 0298 1 1 1 97002 AFW 0397 1 1 1 97003 AFW 0797 1 1 1 97005 AFW 1097 1 1 1 96010 AFW 1196 1 1 1 97012 AFW 0897 1 1 1 98001 AFW 0598 1 1 1 96005 AFW 1096 1 1 1 96006 AFW 1296 1 1 1 96007 AFW 1296 1 1 1 98001 AFW 0898 1 1 1 98002 AFW 1098 1 1 1 96008 AFW 0596 1 1 1 97005 AFW 0397 1 1 1 97025 AFW 0897 1 1 1 96005 AFW 0896 1 1 1 96003 AFW 1196 1 1 1 97010 AFW 0597 1 2 2 98006 AFW 0698 1 2 2 98011 AFW 1098 1 2 2 98002 AFW 0598 1 1 1 97009 AFW 0997 1 1 1 98002 AFW 0298 1 1 1 97001 AFW 0597 1 1 1 98001. AFW 0298 1 1 1 96006 AFW 0596 1 1 1 98014 AFW 0798 1 1 1 96001 AFW 0196 1 1 1
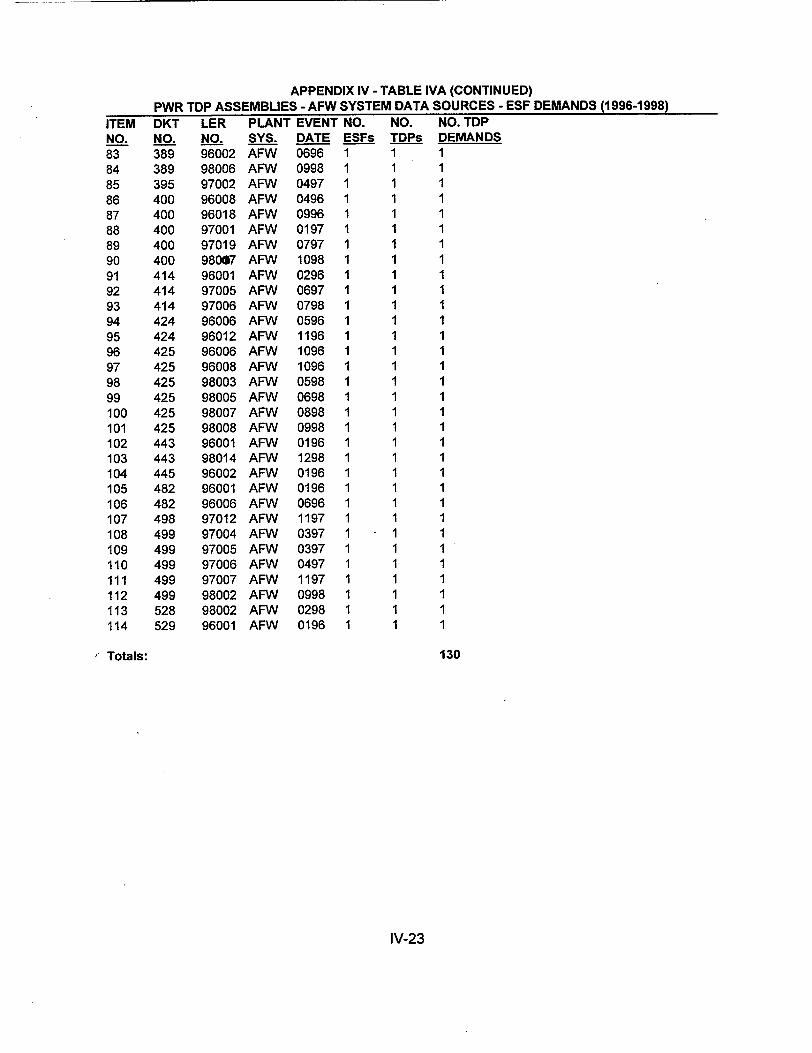
APPENDIX IV - TABLE IVA (CONTINUED) PWR TDP ASSEMBLIES - AFW SYSTEM DATA SOURCES - ESF DEMANDS (1996-1998)
ITEM DKT NO. NO. 83 389 84 389 85 395 86 400 87 400 88 400 89 400 90 400 91 414 92 414 93 414 94 424 95 424 96 425 97 425 98 425 99 425 100 425 101 425 102 443 103 443 104 445 105 482 106 482 107 498 108 499 109 499 110 499 111 499 112 499 113 528 114 529
Totals:
LER PLANT EVENT NO. NO. NO. TDP NO. SYS. DATE ESFs TDPs DEMANDS 96002 AFW 0696 1 1 1 98006 AFW 0998 1 1 1 97002 AFW 0497 1 1 1 96008 AFW 0496 1 1 1 96018 AFW 0996 1 1 1 97001 AFW 0197 1 1 1 97019 AFW 0797 1 1 1 98007 AFW 1098 1 1 1 96001 AFW 0296 1 1 1 97005 AFW 0697 1 1 1 97006 AFW 0798 1 1 1 96006 AFW 0596 1 1 1 96012 AFW 1196 1 1 1 96006 AFW 1096 1 1 1 96008 AFW 1096 1 1 1 98003 AFW 0598 1 1 1 98005 AFW 0698 1 1 1 98007 AFW 0898 1 1 1 98008 AFW 0998 1 1 1 96001 AFW 0196 1 1 1 98014 AFW 1298 1 1 1 96002 AFW 0196 1 1 1 96001 AFW 0196 1 1 1 96006 AFW 0696 1 1 1 97012 AFW 1197 1 1 1 97004 AFW 0397 1 - 1 1 97005 AFW 0397 1 1 1 97006 AFW 0497 1 1 1 97007 AFW 1197 1 1 1 98002 AFW 0998 1 1 1 98002 AFW 0298 1 1 1 96001 AFW 0196 1 1 1
130
IV-23
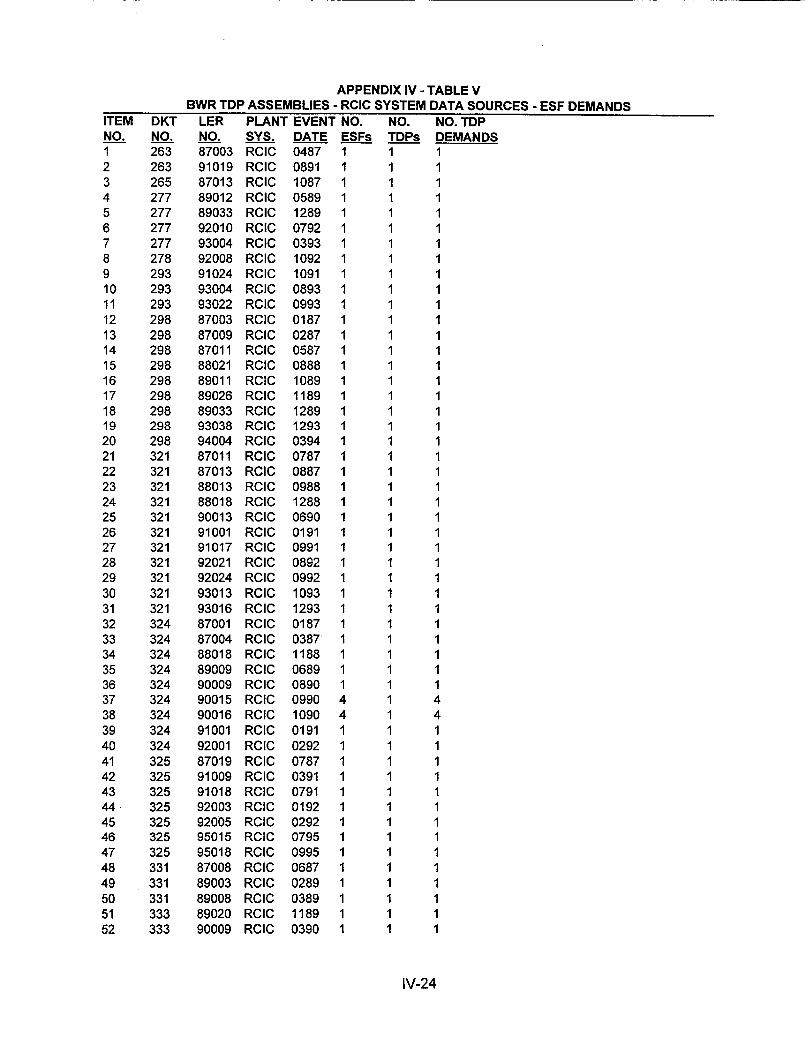
APPENDIX IV - TABLE V BWR TDP ASSEMBLIES - RCIC SYSTEM DATA SOURCES - ESF DEMANDS
ITEM DKT LER PLANT EVENT NO. NO. NO. TDP NO. NO. NO. SYS. DATE ESFs TDPs DEMANDS 1 263 87003 RCIC 0487 1 1 1 2 263 91019 RCIC 0891 1 1 1 3 265 87013 RCIC 1087 1 1 1 4 277 89012 RCIC 0589 1 1 1 5 277 89033 RCIC 1289 1 1 1 6 277 92010 RCIC 0792 1 1 1 7 277 93004 RCIC 0393 1 1 1 8 278 92008 RCIC 1092 1 1 1 9 293 91024 RCIC 1091 1 1 1 10 293 93004 RCIC 0893 1 1 1 11 293 93022 RCIC 0993 1 1 1 12 298 87003 RCIC 0187 1 1 1 13 298 87009 RCIC 0287 1 1 1 14 298 87011 RCIC 0587 1 1 1 15 298 88021 RCIC 0888 1 1 1 16 298 89011 RCIC 1089 1 1 1 17 298 89026 RCIC 1189 1 1 1 18 298 89033 RCIC 1289 1 1 1 19 298 93038 RCIC 1293 1 1 1 20 298 94004 RCIC 0394 1 1 1 21 321 87011 RCIC 0787 1 1 1 22 321 87013 RCIC 0887 1 1 1 23 321 88013 RCIC 0988 1 1 1 24 321 88018 RCIC 1288 1 1 1 25 321 90013 RCIC 0690 1 1 1 26 321 91001 RCIC 0191 1 1 1 27 321 91017 RCIC 0991 1 1 1 28 321 92021 RCIC 0892 1 1 1 29 321 92024 RCIC 0992 1 1 1 30 321 93013 RCIC 1093 1 1 1 31 321 93016 RCIC 1293 1 1 1 32 324 87001 RCIC 0187 1 1 1 33 324 87004 RCIC 0387 1 1 1 34 324 88018 RCIC 1188 1 1 1 35 324 89009 RCIC 0689 1 1 1 36 324 90009 RCIC 0890 1 1 1 37 324 90015 RCIC 0990 4 1 4 38 324 90016 RCIC 1090 4 1 4 39 324 91001 RCIC 0191 1 1 1 40 324 92001 RCIC 0292 1 1 1 41 325 87019 RCIC 0787 1 1 1 42 325 91009 RCIC 0391 1 1 1 43 325 91018 RCIC 0791 1 1 1 44- 325 92003 RCIC 0192 1 1 1 45 325 92005 RCIC 0292 1 1 1 46 325 95015 RCIC 0795 1 1 1 47 325 95018 RCIC 0995 1 1 1 48 331 87008 RCIC 0687 1 1 1 49 331 89003 RCIC 0289 1 1 1 50 331 89008 RCIC 0389 1 1 1 51 333 89020 RCIC 1189 1 1 1 52 333 90009 RCIC 0390 1 1 1
IV-24
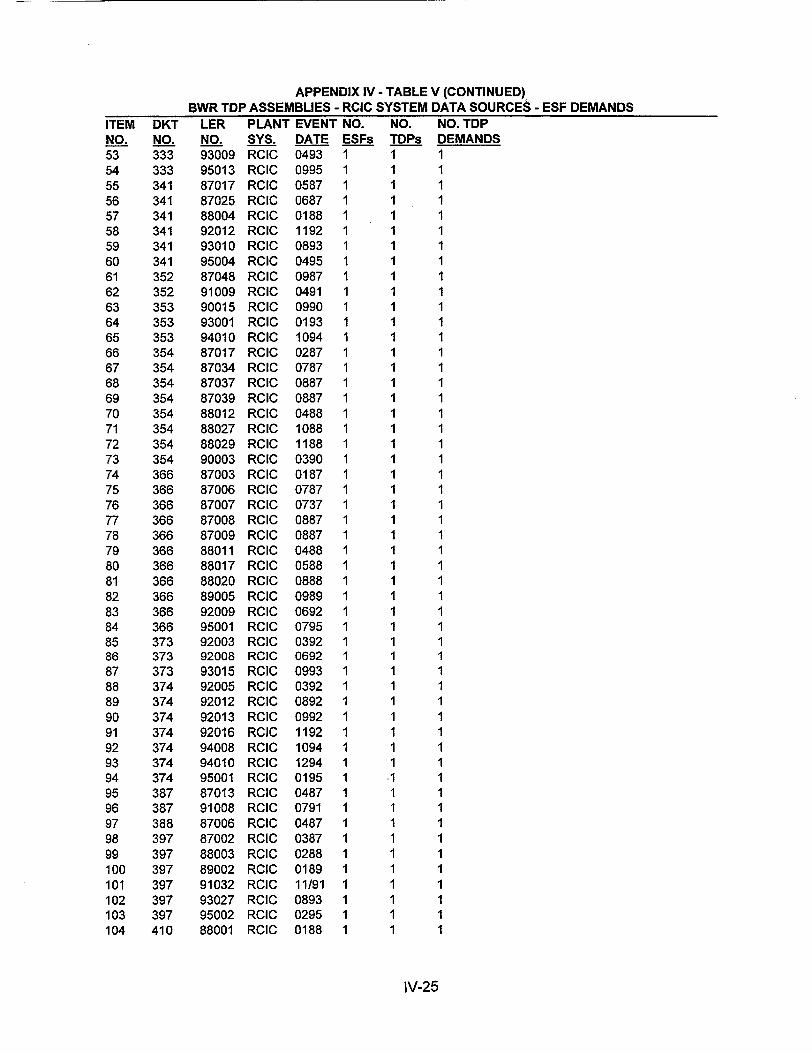
APPENDIX IV - TABLE V (CONTINUED) BWR TDP ASSEMBLIES - RCIC SYSTEM DATA SOURCES - ESF DEMANDS
ITEM DKT LER PLANT EVENT NO. NO. NO. TDP NO. NO. NO. SYS. DATE ESFs TDPs DEMANDS 53 333 93009 RCIC 0493 1 1 1 54 333 95013 RCIC 0995 1 1 1 55 341 87017 RCIC 0587 1 1 1 56 341 87025 RCIC 0687 1 1 1 57 341 88004 RCIC 0188 1 1 1 58 341 92012 RCIC 1192 1 1 1 59 341 93010 RCIC 0893 1 1 1 60 341 95004 RCIC 0495 1 1 1 61 352 87048 RCIC 0987 1 1 1 62 352 91009 RCIC 0491 1 1 1 63 353 90015 RCIC 0990 1 1 1 64 353 93001 RCIC 0193 1 1 1 65 353 94010 RCIC 1094 1 1 1 66 354 87017 RCIC 0287 1 1 1 67 354 87034 RCIC 0787 1 1 1 68 354 87037 RCIC 0887 1 1 1 69 354 87039 RCIC 0887 1 1 1 70 354 88012 RCIC 0488 1 1 1 71 354 88027 RCIC 1088 1 1 1 72 354 88029 RCIC 1188 1 1 1 73 354 90003 RCIC 0390 1 1 1 74 366 87003 RCIC 0187 1 1 1 75 366 87006 RCIC 0787 1 1 1 76 366 87007 RCIC 0737 1 1 1 77 366 87008 RCIC 0887 1 1 1 78 366 87009 RCIC 0887 1 1 1 79 366 88011 RCIC 0488 1 1 1 80 366 88017 RCIC 0588 1 1 1 81 366 88020 RCIC 0888 1 1 1 82 366 89005 RCIC 0989 1 1 1 83 366 92009 RCIC 0692 1 1 1 84 366 95001 RCIC 0795 1 1 1 85 373 92003 RCIC 0392 1 1 1 86 373 92008 RCIC 0692 1 1 1 87 373 93015 RCIC 0993 1 1 1 88 374 92005 RCIC 0392 1 1 1 89 374 92012 RCIC 0892 1 1 1 90 374 92013 RCIC 0992 1 1 1 91 374 92016 RCIC 1192 1 1 1 92 374 94008 RCIC 1094 1 1 1 93 374 94010 RCIC 1294 1 1 1 94 374 95001 RCIC 0195 1 -1 1 95 387 87013 RCIC 0487 1 1 1 96 387 91008 RCIC 0791 1 1 1 97 388 87006 RCIC 0487 1 1 1 98 397 87002 RCIC 0387 1 1 1 99 397 88003 RCIC 0288 1 1 1 100 397 89002 RCIC 0189 1 1 1 101 397 91032 RCIC 11/91 1 1 1 102 397 93027 RCIC 0893 1 1 1 103 397 95002 RCIC 0295 1 1 1 104 410 88001 RCIC 0188 1 1 1
IV-25

APPENDIX IV - TABLE V (CONTINUED) BWR TDP ASSEMBLIES - RCIC SYSTEM DATA SOURCES - ESF DEMANDS
ITEM DKT LER PLANT EVENT NO. NO. NO. TDP NO. NO. NO. SYS. DATE ESFs TDPs DEMANDS 105 410 88012 RCIC 0388 1 1 1 106 410 88014 RCIC 0388 1 1 1 107 410 89014 RCIC 0489 1 1 1 108 410 91023 RCIC 1291 1 1 1 109 416 89010 RCIC 0789 1 1 1 110 416 89016 RCIC 1189 1 1 1 111 416 90028 RCIC 1290 1 1 1 112 416 91007 RCIC 0791 1 1 1 113 416 95007 RCIC 0795 1 1 1 114 416 95008 RCIC 0795 1 1 1 115 440 87012 RCIC 0387 1 1 1 116 440 87064 RCIC 0987 1 1 1 117 440 87072 RCIC 1087 1 1 1 118 440 88012 RCIC 0488 1 1 1 119 440 90001 RCIC 0190 1 1 1 120 440 92017 RCIC 0992 1 1 1 121 440 95006 RCIC 0895 1 1 1 122 440 95006 RCIC 0995 1 1 1 123 440 95008 RCIC 0995 1 1 1 124 458 88018 RCIC 0888 1 1 1 125 458 88021 RCIC 0988 1 1 1 126 458 89004 RCIC 0289 1 1 1 127 458 89008 RCIC 0289 1 1 1 128 461 87001 RCIC 0187 1 1 1
APPENDIX IV - TABLE VA BWR TDP ASSEMBLIES - RCIC SYSTEM DATA SOURCES - ESF DEMANDS (1996-1998)
ITEM DKT LER PLANT EVENT NO. NO. NO. TDP NO. NO. NO. SYS. DATE ESFs TDPs DEMANDS 1 260 97001 RCIC 0497 1 1 1 2 271 98016 RCIC 0698 1 1 1 3 296 96002 RCIC 0496 1 1 1 4 296 96003 RCIC 0596 1 1 1 5 333 96003 RCIC 0296 1 1 1 6 333 99010 RCIC 0996 1 1 1 7 333 98004 RCIC 0598 1 1 1 8 333 98008 RCIC 0898 1 1 1 9 366 97007 RCIC 0497 1 1 1 10 366 97010 RCIC 1197 1 1 1 11 388 96004 RCIC 0796 1 1 1 12 397 98002 RCIC 0398 1 1 1 13 397 98003 RCIC 0398 1 1 1 14 416 98001 RCIC 0198 1 3 3 15 440 97001 RCIC 0197 1 1 1 16 440 98002 RCIC 0798 1 1 1
IV-26
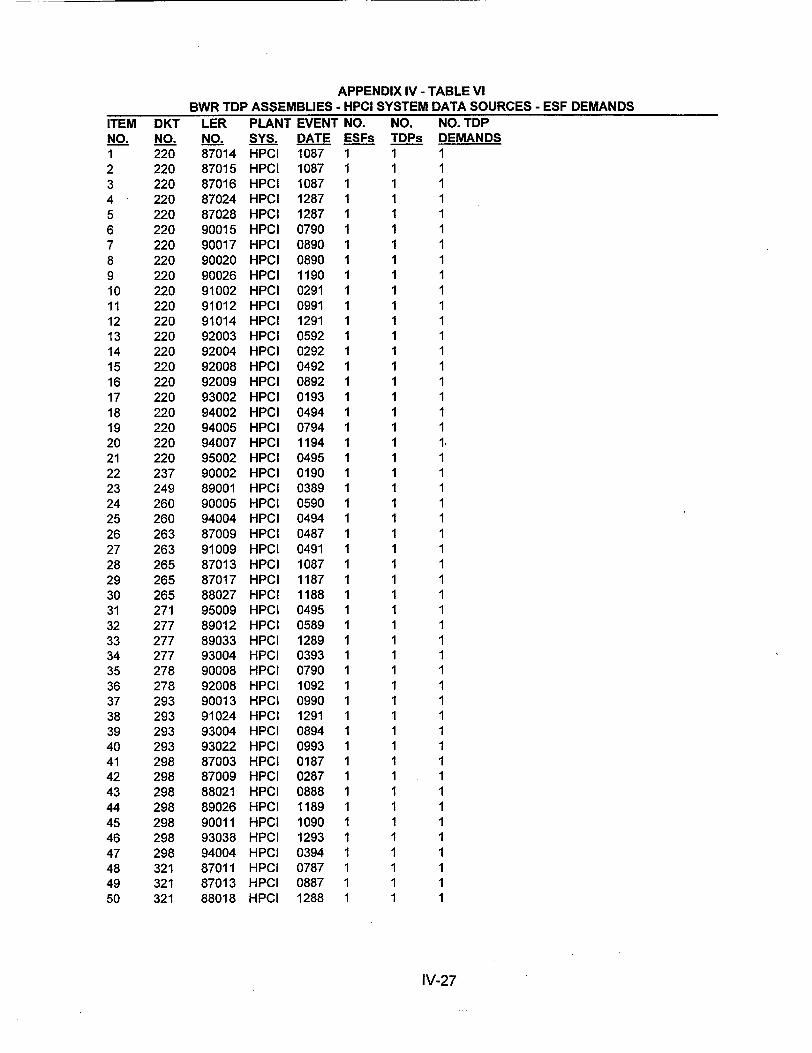
APPENDIX IV - TABLE VI BWR TDP ASSEMBLIES - HPCI SYSTEM DATA SOURCES - ESF DEMANDS
LER PLANT EVENT NO.ITEM NO. 1 2 3 4 5 6 7 8 9 10 11 12 13 14 15 16 17 18 19 20 21 22 23 24 25 26 27 28 29 30 31 32 33 34 35 36 37 38 39 40 41 42 43 44 45 46 47 48 49 50
DKT NO. 220 220 220 220 220 220 220 220 220 220 220 220 220 220 220 220 220 220 220 220 220 237 249 260 260 263 263 265 265 265 271 277 277 277 278 278 293 293 293 293 298 298 298 298 298 298 298 321 321 321
NO. NO. TDPNO. SYS. 87014 HPC1 87015 HPCI 87016 HPCI 87024 HPCI 87028 HPCI 90015 HPCI 90017 HPCI 90020 HPCI 90026 HPCI 91002 HPCI 91012 HPCI 91014 HPCI 92003 HPCI 92004 HPCI 92008 HPCI 92009 HPCI 93002 HPCI 94002 HPCI 94005 HPCI 94007 HPCI 95002 HPCI 90002 HPCI 89001 HPCI 90005 HPCI 94004 HPCI 87009 HPCI 91009 HPCI 87013 HPCI 87017 HPCI 88027 HPCI 95009 HPCI 89012 HPCI 89033 HPCI 93004 HPCI 90008 HPCI 92008 HPCI 90013 HPCI 91024 HPCI 93004 HPCI 93022 HPCI 87003 HPCI 87009 HPCI 88021 HPCI 89026 HPCI 90011 HPCI 93038 HPCI 94004 HPCI 87011 HPCI 87013 HPCI 88018 HPCI
DATE ESFs 1087 1 1087 1 1087 1 1287 1 1287 1 0790 1 0890 1 0890 1 1190 1 0291 1 0991 1 1291 1 0592 1 0292 1 0492 1 0892 1 0193 1 0494 1 0794 1 1194 1 0495 1 0190 1 0389 1 0590 1 0494 1 0487 1 0491 1 1087 1 1187 1 1188 1 0495 1 0589 1 1289 1 0393 1 0790 1 1092 1 0990 1 1291 1 0894 1 0993 1 0187 1 0287 1 0888 1 1189 1 1090 1 1293 1 0394 1 0787 1 0887 1 1288 1
IV-27
TDPs 1 1 1 1 1 1 1 1 1 1 1 1 1 1 1 1 1 1 1 1 1 1 1 1 1 1 1 1 1 1 I 1 1 1 1 1 1 1 1 1 1 1 1 1 1 1 1 1 1 1
DEMANDS 1 1 1 1 1 1 1 1 1 1 1 1 1 1 1 1 1 1 1 11 1 1 1 1 1 1 1 1 1 1 1 1 1 1 1 1 1 1 1 1 1 1 1 1 1 1 1 1 1

APPENDIX IV - TABLE VI BWR TDP ASSEMBLIES - HPCI SYSTEM DATA SOURCES - ESF DEMANDS
ITEM DKT LER PLANT EVENT NO. NO. NO. TDP NO. NO. NO. SYS. DATE ESFs TDPs DEMANDS 51 321 89013 HPCI 0988 1 1 1 52 321 90013 HPCI 0690 1 1 1 53 321 91001 HPCI 0191 1 1 1 54 321 91007 HPCI 0291 1 1 1 55 321 91017 HPCI 0991 1 1 1 56 321 92021 HPCI 0892 1 1 1 57 321 92024 HPCI 0992 1 1 1 58 321 93013 HPCI 1093 1 1 1 59 321 93016 HPCI 1293 1 1 1 60 324 87001 HPCI 0187 1 1 1 61 324 87004 HPCI 0387 1 1 1 62 324 88018 HPCI 1188 1 1 1 63 324 89001 HPCI 0289 1 1 1 64 324 89009 HPCI 0689 1 1 1 65 324 90009 HPCI 0890 1 1 1 66 324 90015 HPCI 0990 1 1 1 67 324 90016 HPCI 1090 1 1 1 68 324 91001 HPCI 0191 1 1 1 69 324 91017 HPCI 0991 1 1 1 70 324 91021 HPCI 1291 1 1 1 71 324 92001 HPCI 0292 1 1 1 72 325 87017 HPCI 0687 1 1 1 73 325 87019 HPCI 0787 1 1 1 74 325 91009 HPCI 0391 1 1 1 75 325 91018 HPCI 0791 1 1 1 76 325 92003 HPCI 0192 1 1 1 77 325 94015 HPCI 1294 1 1 1 78 325 95015 HPCI 0795 1 1 1 79 325 95018 HPCI 0995 1 1 1 80 331 89003 HPCI 0289 1 1 1 81 331 89011 HPCI 0889 1 1 1 82 333 90009 HPCI 0390 1 1 1 83 333 93009 HPCI 0493 1 1 1 84 333 95013 HPCI 0995 1 1 1 85 341 88004 HPCI 0188 1 1 1 86 341 92012 HPCI 1192 1 1 1 87 341 93010 HPCI 0893 1 1 1 88 341 95004 HPCI 0495 1 1 1 89 352 87042 HPCI 0687 1 1 1 90 352 87048 HPCI 0987 1 1 1 91 352 91018 HPCI 0791 1 1 1 92 353 89013 HPCI 1189 1 1 1 93 353 90006 HPCI 0390 1 1 1 94 353 93005 HPCI 0393 1 1 1 95 353 94010 HPCI 1094 1 1 1 96 353 95006 HPCI 0395 1 1 1 97 354 87017 HPCI 0287 1 1 1 98 354 87030 HPCI 0787 1 1 1 99 354 87034 HPCI 0787 1 1 1 100 354 87037 HPCI 0887 1 1 1 101 354 87039 HPCI 0887 1 1 1
IV-28
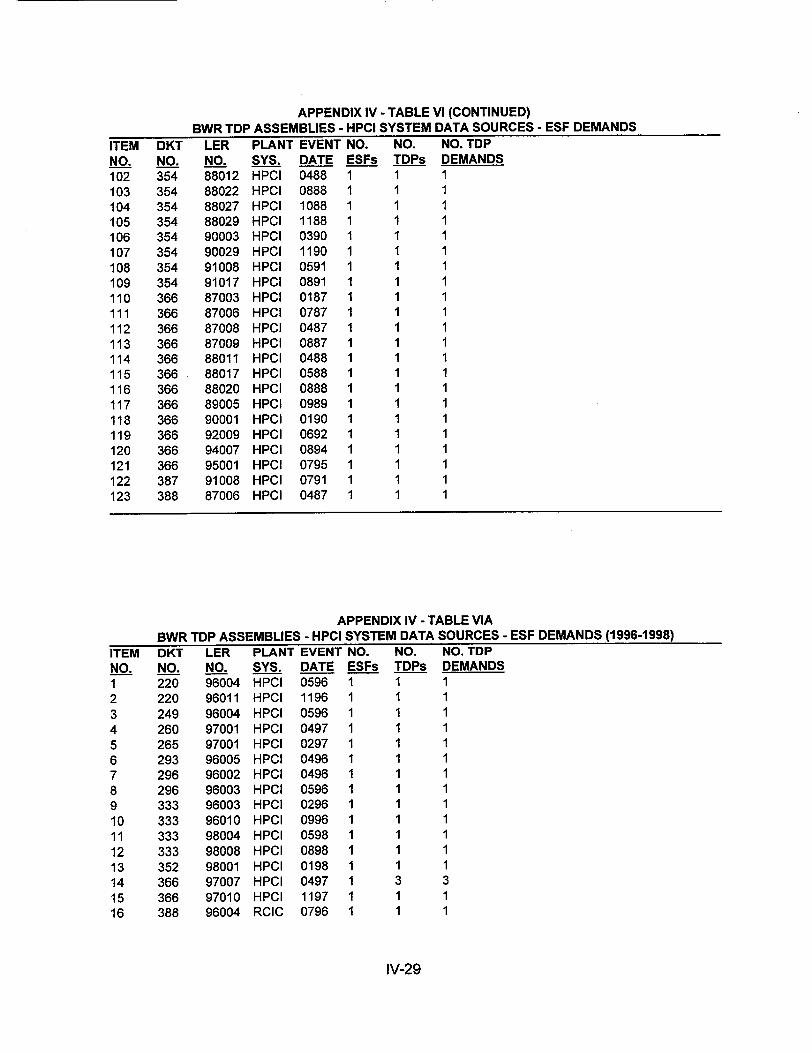
APPENDIX IV - TABLE VI (CONTINUED) BWR TDP ASSEMBLIES - HPCI SYSTEM DATA SOURCES - ESF DEMANDS
ITEM DKT NO. NO. 102 354 103 354 104 354 105 354 106 354 107 354 108 354 109 354 110 366 111 366 112 366 113 366 114 366 115 366 116 366 117 366 118 366 119 366 120 366 121 366 122 387 123 388
LER PLANT EVENT NO. NO. NO. TDP NO. SYS. DATE ESFs TDPs DEMANDS 88012 HPCI 0488 1 1 1 88022 HPCI 0888 1 1 1 88027 HPCI 1088 1 1 1 88029 HPCI 1188 1 1 1 90003 HPCI 0390 1 1 1 90029 HPCI 1190 1 1 1 91008 HPCI 0591 1 1 1 91017 HPCI 0891 1 1 1 87003 HPCI 0187 1 1 1 87006 HPCI 0787 1 1 1 87008 HPCI 0487 1 1 1 87009 HPCI 0887 1 1 1 88011 HPCI 0488 1 1 1 88017 HPCI 0588 1 1 1 88020 HPCI 0888 1 1 1 89005 HPCI 0989 1 1 1 90001 HPCI 0190 1 1 1 92009 HPCI 0692 1 1 1 94007 HPCI 0894 1 1 1 95001 HPCI 0795 1 1 1 91008 HPCI 0791 1 1 1 87006 HPCI 0487 1 1 1
APPENDIX IV - TABLE VIA BWR TDP ASSEMBLIES - HPCI SYSTEM DATA SOURCES - ESF DEMANDS (1996-1998)
ITEM DKT LER PLANT EVENT NO. NO. NO. TDP NO. NO. NO. SYS. DATE ESFs TDPs DEMANDS 1 220 96004 HPCI 0596 1 1 1 2 220 96011 HPCI 1196 1 1 1 3 249 96004 HPCI 0596 1 1 1 4 260 97001 HPCI 0497 1 1 1 5 265 97001 HPCI 0297 1 1 1 6 293 96005 HPCI 0496 1 1 1 7 296 96002 HPCI 0496 1 1 1 8 296 96003 HPCI 0596 1 1 1 9 333 96003 HPCI 0296 1 1 1 10 333 96010 HPCI 0996 1 1 1 11 333 98004 HPCI 0598 1 1 1 12 333 98008 HPCI 0898 1 1 1 13 352 98001 HPCI 0198 1 1 1 14 366 97007 HPCI 0497 1 3 3 15 366 97010 HPCI 1197 1 1 1 16 388 96004 RCIC 0796 1 1 1
IV-29
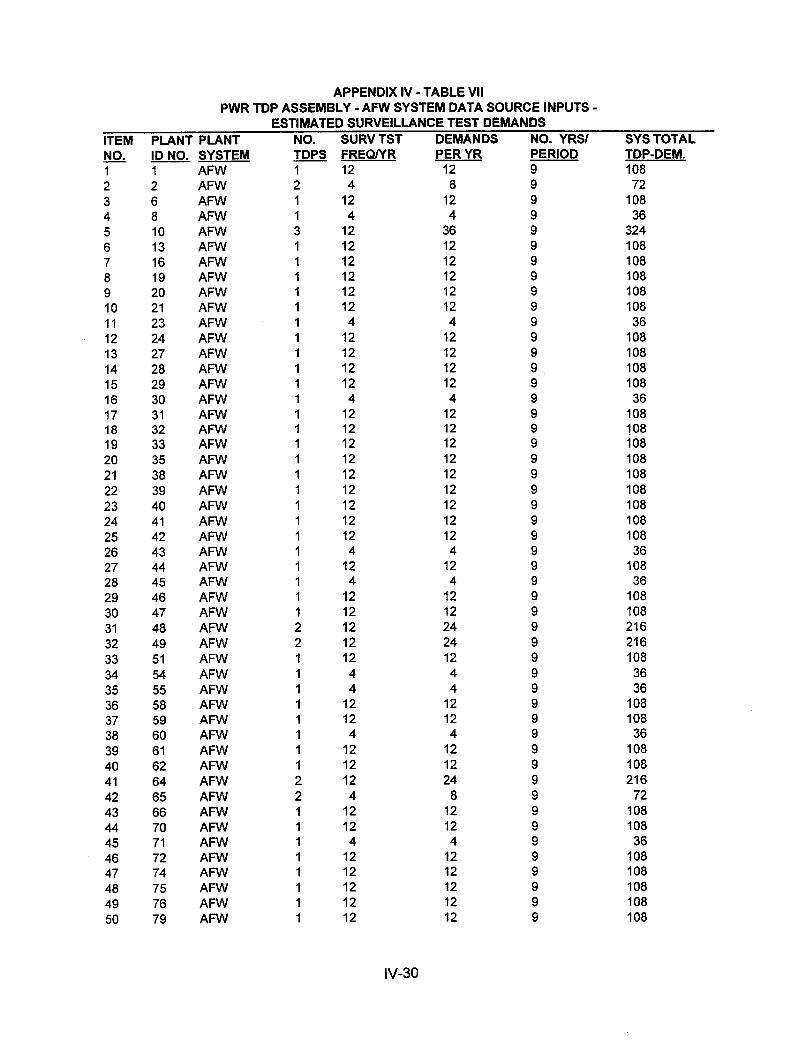
ITEM NO. 1 2 3 4 5 6 7 8 9 10 11 12 13 14 15 16 17 18 19 20 21 22 23 24 25 26 27 28 29 30 31 32 33 34 35 36 37 38 39 40 41 42 43 44 45 46 47 48 49 50
PLANT PI. ID NO. SY, I AF 2 AF/ 6 AFV 8 AF10 AF 13 AF• 16 AF 19 AF• 20 AF• 21 AF• 23 AF• 24 AF• 27 AF• 28 AF 29 AF 30 Af 31 AF 32 AF 33 AF• 35 AP 38 AF 39 AF 40 AP 41 AP 42 AP 43 AF 44 AP 45 AP 46 AF 47 AF 48 AP 49 AF 51 AF 54 AF 55 AF1
58 AF 59 AF 60 AF 61 AF 62 AF 64 AF 65 AF 66 AF 70 AF 71 AF 72 AF 74 AF 75 AF 76 AF 79 AF
IV-30
APPENDIX IV - TABLE VII PWR TDP ASSEMBLY - AFW SYSTEM DATA SOURCE INPUTS
ESTIMATED SURVEILLANCE TEST DEMANDS ANT NO. SURV TST DEMANDS NO. YRS/
STEM TDPS FREQ/YR PER YR PERIOD N 1 12 12 9 N 2 4 8 9 N 1 12 12 9 N 1 4 4 9 N 3 12 36 9 N 1 12 12 9 N 1 12 12 9 N 1 12 12 9 N 1 12 12 9 N 1 12 12 9 N 1 4 4 9 N 1 12 12 9 N 1 12 12 9 N 1 12 12 9 N 1 12 12 9 N 1 4 4 9 W 1 12 12 9 W 1 12 12 9 W 1 12 12 9 N 1 12 12 9 N 1 12 12 9 N 1 12 12 9 N 1 12 12 9 W 1 12 12 9 N 1 12 12 9 N 1 4 4 9 N 1 12 12 9 N 1 4 4 9 W 1 12 12 9 N 1 12 12 9 N 2 12 24 9 W 2 12 24 9 W 1 12 12 9 N 1 4 4 9 W 1 4 4 9 N 1 12 12 9 N 1 12 12 9 W 1 4 4 9 W 1 12 12 9 W 1 12 12 9 N 2 12 24 9 N 2 4 8 9 W 1 12 12 9 W 1 12 12 9 V 1 4 4 9
W 1 12 12 9 W 1 12 12 9 W 1 12 12 9 W 1 12 12 9 W 1 12 12 9
SYS TOTAL TDP-DEM. 108 72
108 36
324 108 108 108 108 108
36 108 108 108 108
36 108 108 108 108 108 108 108 108 108
36 108
36 108 108 216 216 108 36 36
108 108 36
108 108 216
72 108 108
36 108 108 108 108 108
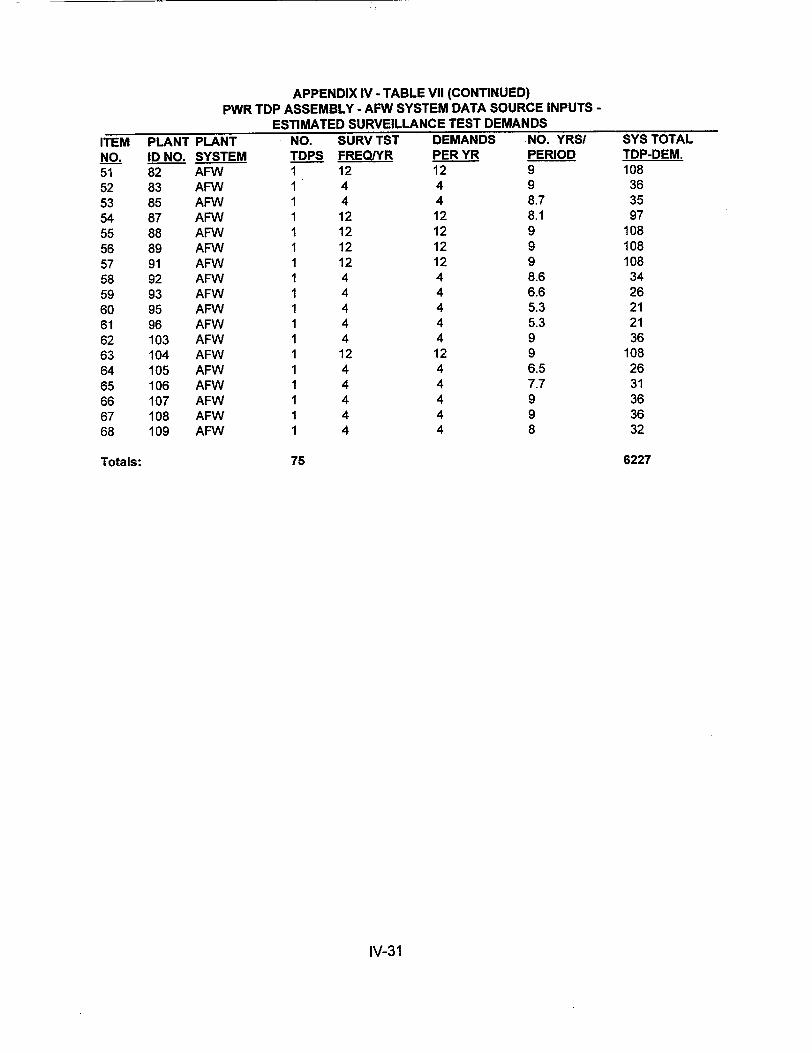
APPENDIX IV - TABLE VII (CONTINUED) PWR TDP ASSEMBLY - AFW SYSTEM DATA SOURCE INPUTS
ESTIMATED SURVEILLANCE TEST DEMANDS
TEM PLANT PLANT NO. SURV TST DEMANDS NO. YRS/ SYS TOTAL 10. ID NO. SYSTEM TDPS FREQIYR PER YR PERIOD TDP-DEM. i1 82 AFW 1 12 12 9 108 52 83 AFW 1 4 4 9 36
53 85 AFW 54 87 AFW 55 88 AFW 56 89 AFW 57 91 AFW 58 92 AFW 59 93 AFW 60 95 AFW 61 96 AFW 62 103 AFW 63 104 AFW 64 105 AFW 65 106 AFW 66 107 AFW 67 108 AFW 68 109 AFW
Totals:
1 1 1 1 1 1 1 1 1 1 1 1 1 1
4 12 12 12 12 4 4 4 4 4 12 4 4 4
1 4 1 4
4 12 12 12 12 4 4 4 4 4 12 4 4 4 4 4
8.7 8.1 9 9 9 8.6 6.6 5.3 5.3 9 9 6.5 7.7 9 9 8
75
35 97
108 108 108
34 26 21 21 36
108 26 31 36 36 32
6227
IV-31
I1 _N 5 5
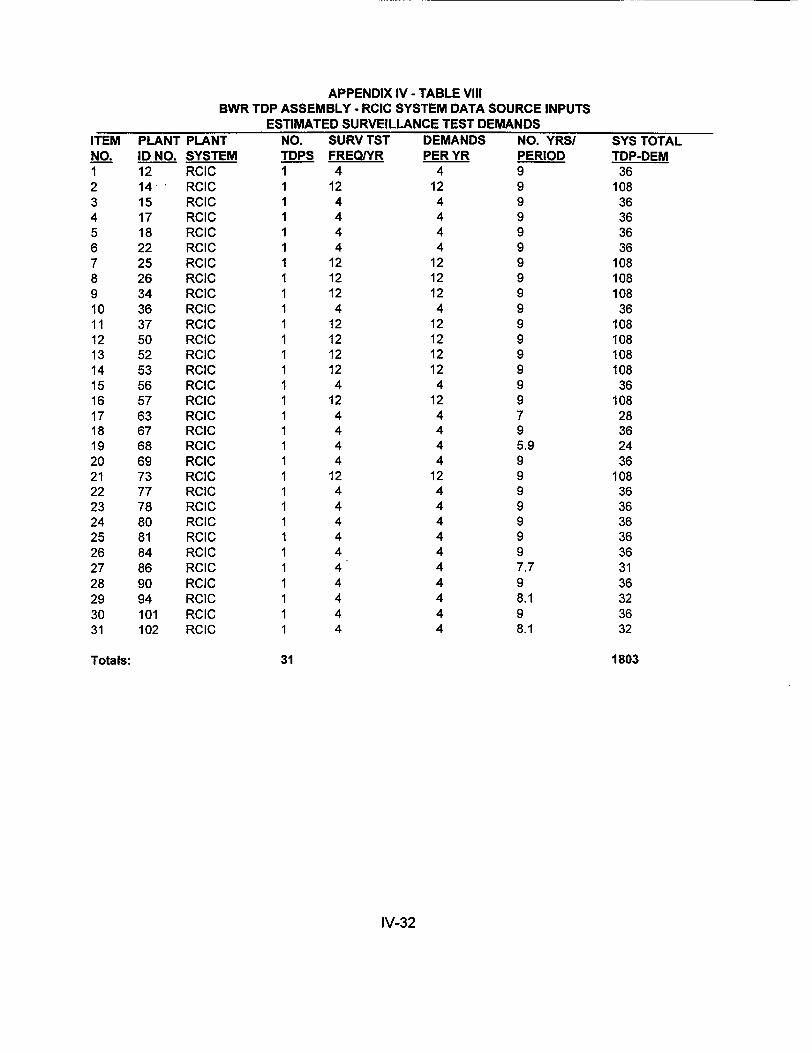
APPENDIX IV - TABLE VIII BWR TDP ASSEMBLY - RCIC SYSTEM DATA SOURCE INPUTS
ITEM PLANT PLANT NO. ID NO. SYSTEM 1 12 RCIC 2 14 RCIC 3 15 RCIC 4 17 RCIC 5 18 RCIC 6 22 RCIC 7 25 RCIC 8 26 RCIC 9 34 RCIC 10 36 RCIC 11 37 RCIC 12 50 RCIC 13 52 RCIC 14 53 RCIC 15 56 RCIC 16 57 RCIC 17 63 RCIC 18 67 RCIC 19 68 RCIC 20 69 RCIC 21 73 RCIC 22 77 RCIC 23 78 RCIC 24 80 RCIC 25 81 RCIC 26 84 RCIC 27 86 RCIC 28 90 RCIC 29 94 RCIC 30 101 RCIC 31 102 RCIC
Totals: 31 1803
IV-32
ESTIMATED SURVEILLANCE TEST DEMANDS NO. SURV TST DEMANDS NO. YRS/ SYS TOTAL TDPS FREQOYR PER YR PERIOD TDP-DEM 1 4 4 9 36 1 12 12 9 108 1 4 4 9 36 1 4 4 9 36 1 4 4 9 36 1 4 4 9 36 1 12 12 9 108 1 12 12 9 108 1 12 12 9 108 1 4 4 9 36 1 12 12 9 108 1 12 12 9 108 1 12 12 9 108 1 12 12 9 108 1 4 4 9 36 1 12 12 9 108 1 4 4 7 28 1 4 4 9 36 1 4 4 5.9 24 1 4 4 9 36 1 12 12 9 108 1 4 4 9 36 1 4 4 9 36 1 4 4 9 36 1 4 4 9 36 1 4 4 9 36 1 4 4 7.7 31 1 4 4 9 36 1 4 4 8.1 32 1 4 4 9 36 1 4 4 8.1 32
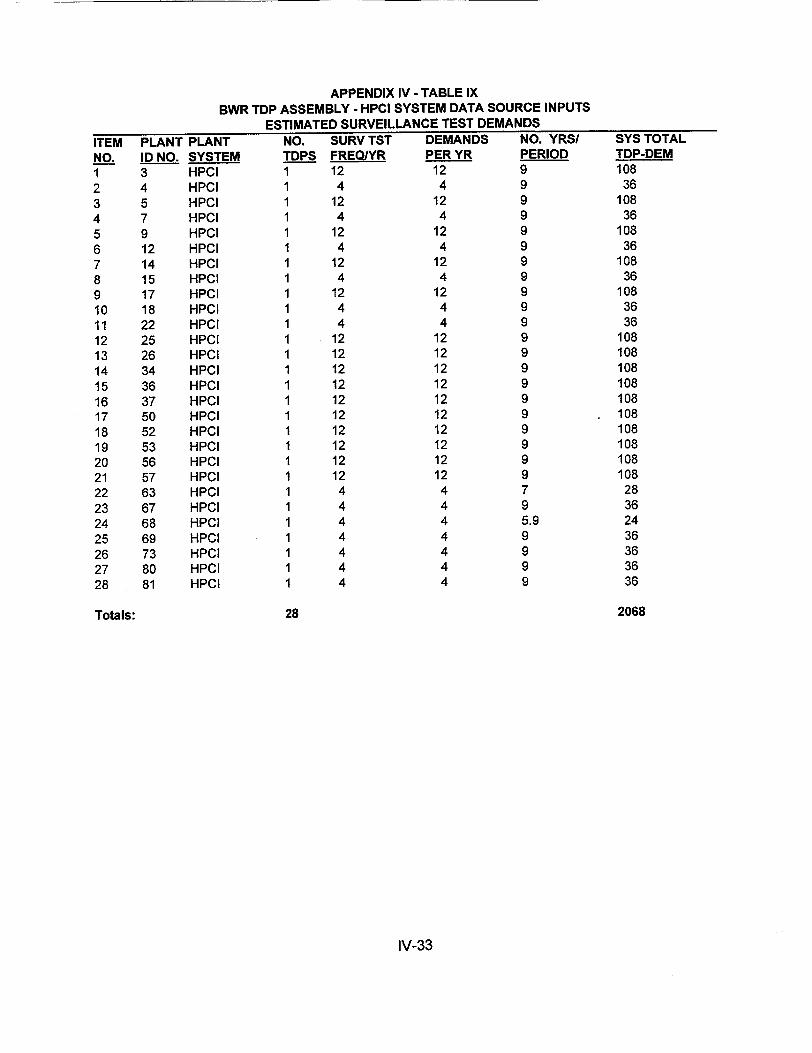
ITEM PLANT PLAI NO. ID NO. SYSI 1 3 HPCI 2 4 HPCI 3 5 HPCI 4 7 HPCI 5 9 HPCI 6 12 HPCI 7 14 HPCI 8 15 HPCI 9 17 HPC 10 18 HPC 11 22 HPC 12 25 HPC 13 26 HPC 14 34 HPC 15 36 HPC 16 37 HPC 17 50 HPC 18 52 HPC 19 53 HPC 20 56 HPC 21 57 HPC 22 63 HPC 23 67 HPC 24 68 HPC 25 69 HPC 26 73 HPC 27 80 HPC 28 81 HPC
Totals:
APPENDIX IV - TABLE IX BWR TDP ASSEMBLY - HPCI SYSTEM DATA SOURCE INPUTS
ESTIMATED SURVEILLANCE TEST DEMANDS 4T NO. SURV TST DEMANDS NO. YRSI TEM TDPS FREQ/YR PER YR PERIOD
1 12 12 9 1 4 4 9 1 12 12 9 1 4 4 9 1 12 12 9
1 1 4 4 9 1 1 12 12 9 1 1 4 4 9 1 1 12 12 9
1 4 4 9 1 4 4 9
1 1 12 12 9 1 1 12 12 9 1 1 12 12 9 1 1 12 12 9 1 1 12 12 9 1 1 12 12 9 1 1 12 12 9 I 1 12 12 9 1 1 12 12 9 1 1 12 12 9 1 1 4 4 7 1 1 4 4 9 1 1 4 4 5.9 1 1 4 4 9 1 1 4 4 9 1 1 4 4 9
1 4 4 9
28
IV-33
2068
SYS TOTAL TDP-DEM 108
36 108
36 108
36 108
36 108
36 36
108 108 108 108 108 108 108 108 108 108
28 36 24 36 36 36 36
I
NRC FORM 335 U.S. NUCLEAR REGULATORY COMMISSION 1. REPORT NUMBER
(2-89) (Assigned by NRC, Add Vol., Supp., Rev..
NRCM 1102, BIBLIOGRAPHIC DATA SHEET and Addendum Numbers, if any.)
3201, 3202 BBIGAHCDT HE 3201 3202E ANDSUBTITLE(see instructions on the reverse) NUREG-715, Vol. 1
2. TITLE AND SUBTITLE
Component Performance Study - Turbine-Driven Pumps, 1987-1998 3. DATE REPORT PUBLISHED
MONTH F YEAR
April 2000 4. FIN OR GRANT NUMBER
5. AUTHOR(S) 6. TYPE OF REPORT
Technical
J.R. Houghton, H.G. Hamzehee Tcncl 7. PERIOD COVERED (Inclusive Dates)
January 1987 - December 1998
8. PERFORMING ORGANIZATION - NAME AND ADDRESS (If NRC, provide Division, Office or Region, U.S. Nuclear Regulatory Commission, and mailing address; if contractor,
provide name and mailing address.)
Division of Risk Analysis and Applicaiton
Office of Nuclear Regulatory Research U.S. Nuclear Regulatory Commission Washington, DC 20555-0001
9. SPONSORING ORGANIZATION - NAME AND ADDRESS (If NRC, type "Same as above; if contractor, provioe fI4R uivision, fvrine or -Y_", - .o. u y .
and mailing address.)
Same as above
10. SUPPLEMENTARY NOTES
11. ABSTRACT (200 words or less)
This report documents an analysis of the performance of safety-related turbine-driven pump assemblies (turbine-driver, pump,
and governor subcomponents) used in the pressurized water reactor (PWR) auxiliary feedwater (AFW) system and in the
boiling water reactor (BWR) reactor core isolation cooling (RCIC) and high pressure coolant injection (HPCI) systems in U.S.
commercial power reactor plants.
A risk-based analysis of operating data and an engineering analysis of trends and patterns was performed to provide insights
into the performance of turbine-driven pump components on an industry basis and comparison of results with data used by
plant-specific probabilistic risk assessments. The data used in this report was from the 1987-1995 period for engineering
analysis of the PWR AFW system and BWR RCIC and HPCl systems. Failure probability estimates used combined
engineered safety features data (1987-1998) and surveillance test data (1987-1995).
12. KEY WORDS/DESCRIPTORS (List words or phrases that will assist researchers in locating the report.) 13. AVAILABILITY STATEMENT
unlimited Turbine Driven Pump 14 SECURITY CLASSIFICATION Probability of Failure (.is PESe)
Failure unclassified
Demand Surveillance Test (This Report)
Licensee Event Report/LER unclassified
15. NUMBER OF PAGES
16. PRICE
NRC FORM 335 (2-89)
Federal Recycling Program
NUREG-1715, Vol. 1ArtL 2101COMPONENT PERFORMANCE STUDY - "UKBt4-u1v Lfl ruivtwa, 1?5/-ItW8
UNITED STATES NUCLEAR REGULATORY COMMISSION
WASHINGTON, D.C. 20555-0001
SPECIAL STANDARD MAIL POSTAGE AND FEES PAID
USNRC PERMIT NO. G-67


