
www.elsevier.com/locate/asr
Advances in Space Research 37 (2006) 359–365
NRLEUV 2: A new model of solar EUV irradiance variability
Harry P. Warren
E.O. Hulburt Center for Space Research, Code 7670, Naval Research Laboratory, Washington, DC 20375, USA
Received 15 February 2005; received in revised form 27 September 2005; accepted 19 October 2005
Abstract
NRLEUV represents an independent approach to modeling the Sun�s EUV irradiance and its variability. Instead of relying on exist-ing irradiance observations, our model utilizes differential emission measure distributions derived from spatially and spectrally resolvedsolar observations, full-disk solar images, and a database of atomic physics parameters to calculate the solar EUV irradiance. Recentupdates to the model include the calculation of a new quiet Sun differential emission measure distribution using data from the CDSand SUMER spectrometers on SOHO and the use of a more extensive database of atomic physics parameters. Here, we present com-parisons between the NRLEUV quiet Sun reference spectrum and solar minimum irradiance observations. Although there are manyareas of agreement between the modeled spectrum and the observations, there are some major disagreements. The computed spectracannot reproduce the observed irradiances at wavelengths below about 160 A. The observed irradiances appear to overstate the magni-tude of the EUV continua. We also present some initial comparisons between the NRLEUV irradiance variability model and TIMED/SEE data. We find that the NRLEUV model tends to overpredict the absolute magnitude of the irradiance at many wavelengths. Themodel also appears to underpredict the magnitude of the solar-cycle and solar rotational variation in transition region emission lines.� 2006 Published by Elsevier Ltd on behalf of COSPAR.
Keywords: Solar cycles; EUV irradiance
1. Introduction
Despite the importance of solar radiation at extremeultraviolet (EUV) wavelengths (50–1200 A) and soft X-ray (SXR) wavelengths (1–50 A) to many physical process-es in the Earth�s upper atmosphere and ionosphere, themagnitude and variability of the solar irradiance at thesewavelengths is not well understood. During the past severalsolar cycles routine irradiance monitoring in the EUV hasbeen carried out very rarely. Most of our knowledge onEUV irradiance variability has been derived from theAtmospheric Explorer E (AE-E) observations takenbetween 1976 and 1980 (e.g., Hinteregger et al., 1981).Since February 2002 routine EUV irradiance measure-ments have been taken by the Solar EUV Experiment(SEE) on the TIMED spacecraft (e.g., Woods et al.,1998a). In the absence of routine monitoring several empir-
0273-1177/$30 � 2006 Published by Elsevier Ltd on behalf of COSPAR.
doi:10.1016/j.asr.2005.10.028
E-mail address: [email protected]
ical models have been developed which use the existingirradiance observations and proxies for solar activity topredict the solar irradiance on days when observationsare not available (e.g., Hinteregger et al., 1981; Richardset al., 1994; Tobiska and Eparvier, 1998).
To complement existing solar irradiance measurementsand the empirical models derived from them, we havedeveloped a new approach to modeling solar EUV irradi-ance variability. Our model, which we refer to asNRLEUV, is based on intensities derived from emissionmeasure distributions and full-disk solar images. The emis-sion measure distributions, which attempt to describe thetemperature and density structure of the solar atmosphere,are determined from spatially and spectrally resolvedobservations of the Sun. In our model emission measuredistributions for the quiet Sun, coronal holes, and activeregions are used to compute synthetic spectra for thesesolar features. The synthetic spectra are then combinedwith limb-brightening curves and areas derived from thefull-disk solar images to compute the irradiance for a given

4.5 5.0 5.5 6.0Log T (K)
1019
1020
1021
1022
1023
1024
Log
DE
M (
cm–5
K–1
)
NRLEUV v2
NRLEUV v1
Fig. 1. The quiet Sun differential emission measure. Distributions derivedfrom both Harvard Skylab (dotted line) and SOHO (solid line) observa-tions are shown. From Warren (2005).
360 H.P. Warren / Advances in Space Research 37 (2006) 359–365
day. A detailed description of the NRLEUV model is givenby Warren et al. (1998a) and Warren et al. (2001). Compar-isons between our modeled irradiances and observationsand empirical models are given by Warren et al. (1996),Warren et al. (1998b), and Lean et al. (2003).
Recently, Warren (2005) updated the NRLEUV quietSun irradiance spectrum to consider solar spectra takenwith the Coronal Diagnostic Spectrometer (CDS) and theSolar Ultraviolet Measurements of Emitted Radiation(SUMER) spectrometers flown on the Solar and Helio-
spheric Observatory (SOHO). These spectrometers havehigh spectral resolution, which allows us to better observemany more emission lines than were available with earlierinstruments. Furthermore, the SOHO spectrometers havetaken extensive observations, which allows us to constructcomposite spectra that are more representative of the quietSun. Finally, in computing the latest NRLEUV quiet Sunirradiance spectrum we have utilized the newest version(4.2) of the CHIANTI atomic database Young et al.(2003). The new version of CHIANTI contains emissivitiesfor about 50,000 lines, compared with only about 2000 forthe database used in computing the earlier version of themodel.
In this paper, we present a brief overview of the modeland a review of the similarities and differences between cal-culations from NRLEUV and irradiance observations ofthe quiet Sun. We have found that the CDS and SUMERquiet Sun observations are generally consistent with theearlier Harvard Skylab measurements. One area of dis-agreement is at the highest temperatures. The differentialemission measure distribution derived from the SOHO
observations is significantly lower than the Harvard SkylabDEM at the highest temperatures. We also present someinitial comparisons between the NRLEUV irradiance var-iability model and the TIMED/SEE data. We find somesignificant differences between our calculated irradiancetime series and the observed irradiances.
2. The NRLEUV model
2.1. Emission measure formalism
In our calculations the observed radiance for an optical-ly thin emission line depends both on the atomic transitionsinvolved and on the conditions in the solar atmosphere,
IðkulÞ ¼Z
TGulðT ÞnðT Þ dT . ð1Þ
The quantity nðT Þ ¼ n2e ds=dT is the differential emission
measure, ne is the electron density, ds is the differential dis-tance along the line of sight, and T is the electron temper-ature. The quantity Gul (T) is the radiant power density,which is often referred to as the contribution function,and contains all of the factors which are known (or as-sumed to be known) about the transition, such as the rateof collisional excitation and the elemental abundance of theemitting atom. The power density is typically a strongly
peaked function of temperature and observations of manydifferent lines are required to determine the differentialemission measure distribution.
In the earlier version of the irradiance model we usedobservations of EUV emission lines from the Harvardspectrometer on Skylab (Vernazza and Reeves, 1978).For our new survey of the quiet Sun we have used 20CDS spectral atlas observations taken between Marchand June 1996. Each CDS spectral atlas covers an area2000 · 24000. Approximately 20,000 individual spectra wereaveraged together to construct a composite spectrum fromwhich the line intensities were derived. The CDS observa-tions cover the upper transition region and corona. Toextend the emission measure to lower temperatures weuse SUMER observations taken February 9 and 22 1997.During these observations the SUMER slit was movedalong the central meridian from south pole to north pole.As many as 9500 individual spectra were used to computeintensities for each spectral line. For both the CDS andSUMER observations we have only used data within40000 of disk center so that limb-brightening does not effectthe observed intensities.
The intensities derived from our new survey of quiet Sunintensities observed with the CDS and SUMER spectrom-eters are generally in good agreement with those derivedfrom the Harvard instrument. For example, the intensitiesof the three emission lines that were observed by all threeinstruments, He I 584 A, Mg X 625 A, and O V 630 A, allagree to within ±25% of each other. Furthermore, we alsofind generally good agreement when we compare theobserved and theoretical ratios for many emission lines.For example, the various ratios for all 10 of the O III emis-sion lines observed with SUMER and CDS lie within±25% of theoretical calculations.
The differential emission measure derived from our newsurvey of quiet Sun intensities is shown in Fig. 1. For this

H.P. Warren / Advances in Space Research 37 (2006) 359–365 361
work the emission measure is represented as a series ofspline knots. The values of the emission measure at thespline knots are varied to minimize the differences betweenthe observed and computed intensities. The most signifi-cant change in the new emission measure is at temperaturesabove about 1 MK. This difference is driven by the smallradiance of the Si XII 520.68 A line in the CDS spectra rel-ative to previous observations. Vernazza and Reeves (1978)report 25.44 erg cm�2 s�1 sr�1 for this line while we mea-sure 4.98 ± 0.06. Emission lines from other ions formedat high temperatures such as Fe XII, Si X, Si X, and FeXIV, are consistent with the lower values for the emissionmeasure.
The differential emission measure distribution allows usto compute the disk center intensities of optically thin emis-sion lines at any wavelength. The disk-integrated flux (theirradiance) is related to the disk center radiance by therelation
F k ¼pR2�
R2hIki; ð2Þ
where Rx is the solar radius, R is the Earth–Sun distance,and ÆIkæ is the disk-averaged radiance:
hIki � 2Ik
Z 1
0
RkðlÞl dl. ð3Þ
106
107
108
109
1010
1011
Irra
dian
ce (
phot
ons
cm–2
s–1
) NRLEUV v2NCAR November 3, 1994
0 200 400Wave
0.1
1.0
10.0
100.0
Rat
io
NCAR/NRLEUV v2
Fig. 2. Quiet Sun irradiances from NRLEUV and Woods et al. (1998b). Thefunction of wavelength. From Warren (2005).
In this expression Ik is the specific radiance at disk-center,Rk (l) ” Ik (l)/Ik (l = 1) parameterizes the center-to-limbvariation of the radiance, and l = cosh, where h is theheliographic latitude. For optically thin emission the radi-ance at the limb increases with the path length through thesolar atmosphere, which indicates Rk (l) = 1/l. The inten-sities of optically thick emission lines are generally ob-served to be independent of l (see Warren et al., 1998a),corresponding to Rk (l) = 1.
2.2. Calculated irradiances
Model irradiances are computed by convolving theDEM with the emissivity for each line computed with CHI-ANTI and applying the simple limb-brightening curve (Eq.(3)). The contribution of optically thin free–free thermalbremsstrahlung is also included. The irradiances for theoptically thick EUV emission lines and continua are deter-mined from the observed values. The intensities for theoptically thick lines and continua determined from thepresent CDS and SUMER observations are also very closeto the intensities used in our previous model. The irradi-ances for these lines are computed assuming no limbbrightening.
The computed solar EUV irradiance spectrum for thequiet Sun is shown in Fig. 2. For comparison, irradiances
600 800 1000 1200length (Å)
bottom panel shows the ratio of the new model to the observations as a
362 H.P. Warren / Advances in Space Research 37 (2006) 359–365
from the 1994 Woods et al. (1998b) rocket flight are alsoshown. There are two significant areas of disagreementbetween the NRLEUV irradiance spectrum and the obser-vations. First, it is clear that the continuum irradiancesmeasured during the rocket flight are systematically higherthan those in the NRLEUV model. The differences are par-ticularly large in regions where the irradiances are relativelysmall, such as the regions near 600 and 900 A. The intensi-ties observed with SUMER in these wavelength ranges gen-erally agree with those from the Harvard spectrometer,although it appears that the NRLEUV model is missingsome relatively weak optically thick emission linesKretzschmar et al. (2004). The inclusion of these lines isnot enough to account for this discrepancy, suggesting thatinstrumental effects in the rocket data lead to an overesti-mate of the irradiance at these wavelengths.
The second obvious problem is the fluxes at wavelengthsbelow about 160 A. The observed irradiances at thesewavelengths are about a factor of 4 greater than thoseinferred from the model. The SC21REFW fluxes Hintereg-ger et al. (1981) at these wavelengths, however, are general-ly close to those we have calculated. Terrestrialphotoelectron observations have suggested that the solarirradiances at these wavelengths given in SC21REFW aretoo small by factors of 2–3 (e.g., Richards et al., 1994).
0
5.0•105
1.0•106
1.5•106
2.0•106
Irra
dian
ce (
ph c
m–2
s–1
)
Sun November 3, 1965 (Manson 197NRLEUV V2
0
5.0•105
1.0•106
1.5•106
2.0•106
Irra
dian
ce (
ph c
m–2
s–1
)
Sun November 3, 1965SC21REFW
60 80Wav
0
5.0•105
1.0•106
1.5•106
2.0•106
Irra
dian
ce (
ph c
m–2
s–1
)
Sun November 3, 1965α Centauri A (Chandra LETG Raass
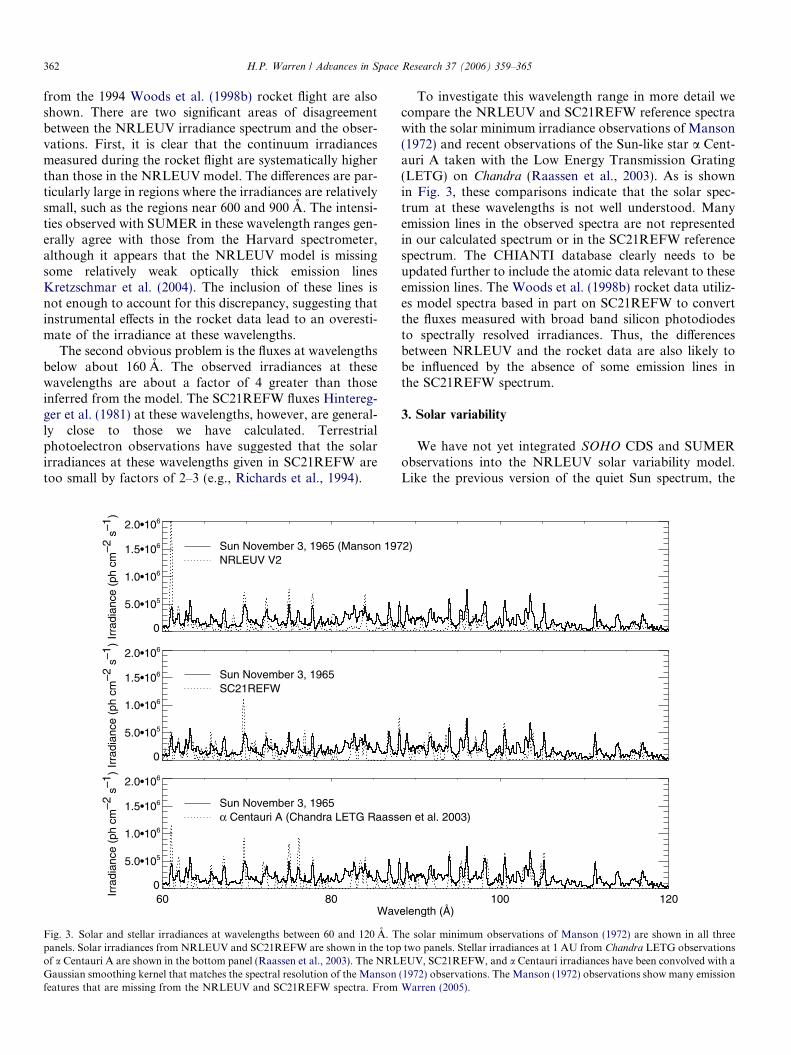
Fig. 3. Solar and stellar irradiances at wavelengths between 60 and 120 A. Tpanels. Solar irradiances from NRLEUV and SC21REFW are shown in the topof a Centauri A are shown in the bottom panel (Raassen et al., 2003). The NRLGaussian smoothing kernel that matches the spectral resolution of the Mansonfeatures that are missing from the NRLEUV and SC21REFW spectra. From
To investigate this wavelength range in more detail wecompare the NRLEUV and SC21REFW reference spectrawith the solar minimum irradiance observations of Manson(1972) and recent observations of the Sun-like star a Cent-auri A taken with the Low Energy Transmission Grating(LETG) on Chandra (Raassen et al., 2003). As is shownin Fig. 3, these comparisons indicate that the solar spec-trum at these wavelengths is not well understood. Manyemission lines in the observed spectra are not representedin our calculated spectrum or in the SC21REFW referencespectrum. The CHIANTI database clearly needs to beupdated further to include the atomic data relevant to theseemission lines. The Woods et al. (1998b) rocket data utiliz-es model spectra based in part on SC21REFW to convertthe fluxes measured with broad band silicon photodiodesto spectrally resolved irradiances. Thus, the differencesbetween NRLEUV and the rocket data are also likely tobe influenced by the absence of some emission lines inthe SC21REFW spectrum.
3. Solar variability
We have not yet integrated SOHO CDS and SUMERobservations into the NRLEUV solar variability model.Like the previous version of the quiet Sun spectrum, the
2)
100 120elength (Å)
en et al. 2003)
he solar minimum observations of Manson (1972) are shown in all threetwo panels. Stellar irradiances at 1 AU from Chandra LETG observations
EUV, SC21REFW, and a Centauri irradiances have been convolved with a(1972) observations. The Manson (1972) observations show many emissionWarren (2005).

H.P. Warren / Advances in Space Research 37 (2006) 359–365 363
first version of the NRLEUV solar variability model wasbased on active region observations from the Harvard Sky-
lab spectrometer published by Vernazza and Reeves (1978).The reliance on a single active region spectra is likely to bea significant limitation of the current model. Our expecta-tion is that intensities averaged over an active region arelikely to differ greatly from region to region and any oneregion is unlikely to be representative. We are currentlyanalyzing a large number of CDS active region spectra toevaluate the range of active region intensities.
Comparisons between the NRLEUV model and exist-ing EUV irradiance models have been carried out byLean et al. (2003). These comparisons showed that theNRLEUV model tended to predict both lower absoluteirradiances and small solar cycle-variability than theother models. For example, between 50 and 1050 ANRLEUV predicts an average total EUV energy of2.9 mW m�2. This is smaller than the total EUV energiesof 3.7–5.6 mW m�2 predicted by the empirical models.Similarly, the NRLEUV predicts a solar cycle variationof 1.9 in the total EUV energy, compared with variationsof 2.3–2.9 predicted by the empirical models. Lean et al.(2003) concluded that the NRLEUV reproduced theobserved solar rotational modulations as well or betterthan other models.
280 290 300 310 320 330Wavelength (Å)
106
107
108
109
1010
Irra
dian
ce (
phot
ons
cm–2
s–1
) Date = 20030414 NRLEUV v1SEE v7
2002.0 2002.5 2003.0 2003.5 2004.0 2004.5 2005.0Year
Irra
dian
ce (
phot
ons
cm–2
s–1
)
SEE v7NRLEUV v1 (× 0.8)He II 304 Å
Irra
dian
ce (
phot
ons
cm–2
s–1
)
2•109
3•109
4•109
5•109
6•109
7•109
8•109
9•109
Fig. 4. Solar irradiances from SEE and the NRLEUV model. (Top panels) Spdotted vertical lines indicate the wavelength range used to compute the irradspectra. (Bottom panels) Observed and modeled irradiance time series for thesehave been scaled to match the average value of the SEE observations. The sca
We have made some preliminary comparisons betweenthe latest release of the SEE observations (data version7) and calculated NRLEUV irradiances. In theNRLEUV model we have used image data from the peri-od between 1991 and 1996 to calculate irradiance timeseries. These time series have been correlated with prox-ies for solar activity (the F10.7 cm radio flux and the MgII core-to-wing ratio) to extend the irradiance model totimes outside of this period. The correlation coefficientfor the irradiances computed from the images and theproxies for solar activity are generally very high(�0.95), suggesting that the use of the proxies does notintroduce significant errors into time series computedfrom the model. This assumption, however, has yet tobe thoroughly tested.
For these comparisons we convolve the NRLEUV spec-tra calculated for each day with a triangular window 1.67 AFWHM. We then select a narrow wavelength range aroundeach line from both the SEE observations and the modelcalculations. Spectra and irradiance time series for 4 wave-length ranges are shown in Figs. 4 and 5. These compari-sons show both areas of agreement and significantdifferences. The absolute irradiances are generally within±30% of each other. If we scale the NRLEUV irradiancesto match the average values observed with SEE, both the
610 620 630 640 650Wavelength (Å)
106
107
108
109
Irra
dian
ce (
phot
ons
cm–2
s–1
) Date = 20030414 NRLEUV v1SEE v7
2002.0 2002.5 2003.0 2003.5 2004.0 2004.5 2005.0Year
SEE v7NRLEUV v1 (× 1.0)O V 630 Å
4.0•108
6.0•108
8.0•108
1.0•109
1.2•109
1.4•109
1.6•109
ectra for the wavelength ranges near 304 A (He II) and 630 A (O V). Theiances. No scalings have been applied to either the observed or modeledwavelength ranges. To facilitate comparisons the NRLEUV model spectraling factor is indicated in the figure.

760 770 780 790 800Wavelength (Å)
107
108
109
Irra
dian
ce (
phot
ons
cm–2
s–1
) Date = 20030414 NRLEUV v1SEE v7
2002.0 2002.5 2003.0 2003.5 2004.0 2004.5 2005.0Year
1•108
2•108
3•108
4•108
5•108
Irra
dian
ce (
phot
ons
cm–2
s–1
)
SEE v7NRLEUV v1 (× 0.7)Ne VIII 780 Å
340 350 360 370 380 390Wavelength (Å)
106
107
108
109
Irra
dian
ce (
phot
ons
cm–2
s–1
) Date = 20030414 NRLEUV v1SEE v7
2002.0 2002.5 2003.0 2003.5 2004.0 2004.5 2005.0Year
2.0•108
4.0•108
6.0•108
8.0•108
1.0•109
1.2•109
Irra
dian
ce (
phot
ons
cm–2
s–1
)
SEE v7NRLEUV v1 (× 1.0)Mg IX 368 Å
Fig. 5. Observed and modeled solar irradiances for the wavelength ranges near 780 A (Ne VIII) and 368 A (Mg IX).
364 H.P. Warren / Advances in Space Research 37 (2006) 359–365
rotational modulation and solar cycle variability are alsoclose for some lines. The irradiances for the O V line arean obvious exception to this. The NRLEUV model clearlyunderestimates both the rotational modulation and thesolar-cycle variability by a significant amount. Compari-sons for O II/O III 835 A, O IV 554 A, and O VI 1032 A alsoshow similar discrepancies. The low levels of solar cycleand rotational modulation result from the relatively lowquiet Sun to active region contrasts indicated in the Vern-azza and Reeves (1978) spectra. The observed contrast forO V 630 A, for example, is only a factor of 4. Interestingly,the observed contrasts for the optically thick emission linesare somewhat greater, about 13 for He I 584, 522, and517 A, and about 10 for He II 304 A. The observed varia-tions for these lines are more closely reproduced by themodel, suggesting that the typical active region intensitiesfor the optically thin transition region emission lines muchlarger than what is suggested by the Vernazza and Reeves(1978) data.
The comparisons between SEE and NRLEUV alsoshow significant differences between the modeled andobserved values for the underlying continua. The irradianc-es near the peaks of the strong emission lines are generallyclose. In the regions where the fluxes are weak, however,there are differences of an order of magnitude or more.These differences are also evident in many of the otherwavelength ranges we have examined.
4. Summary
We have presented an overview of recent updates to theNRLEUV irradiance model. The comparison of the SOHO
CDS and SUMER quiet Sun data with similar observa-tions from the Harvard Skylab instrument Vernazza andReeves (1978) and the results from an irradiance rocketflight Woods et al. (1998b) indicate that the solar EUVspectrum in the quiet Sun is reasonably well understoodat wavelengths above 160 A. These comparisons also indi-cate that there are some processes that the differential emis-sion measure formalism cannot account for.
The comparisons between SEE observations andNRLEUV irradiance model indicate some significant dif-ferences, particularly for emission formed in the transitionregion.
Future work will focus on using observations from CDSand SUMER to model active region emission. The primarylimitation of our previous work is the reliance on a singleactive region spectrum to define the active region differen-tial emission measure. Also note that the intensities fromthe active region DEM were mapped to Ca II k-line inten-sities by assuming a linear relationship between the two(see Lean et al., 1998). Since Ca II images are not availablefor the specific active region in the Vernazza and Reeves(1978) active region spectrum, this linear relationship isnot well constrained by the observations. As is illustrated

PSPT Ca II k 27–Jun–2001 17:23:19 CDS O V 630 Å 27–Jun–2001 13:14:51
Fig. 6. A precision Solar photometric telescope (PSPT) Ca II k-line image and CDS O V 630 A raster of an active region. Although there are many featuresin common, the variations in intensity across the active region are clearly different for the two images.
H.P. Warren / Advances in Space Research 37 (2006) 359–365 365
by the PSPT and CDS observations of an active regionshown in Fig. 6, there are significant differences betweenthe Ca II k-line and transition region emission.
Despite these differences it still may be possible to usethe Ca II k-line images to accurately infer the distributionof intensities in the transition region. Studies have shownthat the total intensity in an EUV emission line from anactive region is well correlated with the total unsigned mag-netic flux from that active region (e.g., Fludra and Ireland,2003; Schrijver, 1987). Unfortunately, the magnetic flux isdifficult to measure near the limb, making it difficult touse magnetograms as the basis for irradiance modeling.The Ca II k-line intensity and the unsigned magnetic fluxare well correlated Schrijver et al. (1985), thus it shouldbe possible to correlate k-line intensities with EUV lineintensities. There is a wealth of high quality Ca imagesand CDS active region spectrum available for the descend-ing phase of the current solar cycle.
Acknowledgments
The SEE experiment on the TIMED mission was spon-sored by NASA�s Office of Space Science. The PSPT Caimage is courtesy of HAO PSPT project team. HAO is adivision of the National Center for Atmospheric Researchwhich is supported by the National Science Foundation.
References
Fludra, A., Ireland, J. The magnetic field and euv line intensities in solaractive regions, in: Brown, A., Harper, G.M., Ayres, T.R. (Eds.). TheFuture of Cool-Star Astrophysics: 12th Cambridge Workshop on CoolStars, Stellar Systems, and the Sun 2001 July 30–August 3. Universityof Colorado, pp. 220–229, 2003.
Hinteregger, H.E., Fukui, K., Gilson, B.R. Observational, reference, andmodel data on solar EUV from measurements on AE-E. Geophys.Res. Lett. 8, 1147–1150, 1981.
Kretzschmar, M., Lilensten, J., Aboudarham, J. Variability of the EUVquiet Sun emission and reference spectrum using SUMER. A&A 419,345–356, 2004.
Lean, J.L., Cook, J., Marquette, W., Johannesson, A. Magnetic sources ofthe solar irradiance cycle. ApJ 492, 390–401, 1998.
Lean, J.L., Warren, H.P., Mariska, J.T., Bishop, J. A new model of solarEUV irradiance variability 2. Comparisons with empirical models andobservations and implications for space weather. J. Geophys. Res.(Space Physics), 1059, 2003.
Manson, J.E. Measurements of the solar spectrum between 30 and 128 A.Sol. Phys. 27, 107–129, 1972.
Raassen, A.J.J., Ness, J.-U., Mewe, R., van der Meer, R.L.J., Burwitz, V.,Kaastra, J.S. Chandra-LETGS X-ray observation of alpha Centauri:A nearby (G2V + K1V) binary system. A&A 400, 671–678, 2003.
Richards, P.G., Fennelly, J.A., Torr, D.G. EUVAC: a solar EUV fluxmodel for aeronomic calculations. J. Geophys. Res. 99, 8981–8992,1994.
Schrijver, C.J. Solar active regions – radiative intensities and large-scaleparameters of the magnetic field. A&A 180, 241–252, 1987.
Schrijver, C.J., Zwaan, C., Maxson, C.W., Noyes, R.W. A study ofultraviolet and X-ray emissions of selected solar regions. A&A 149,123–134, 1985.
Tobiska, W.K., Eparvier, F.G. EUV97: improvements to EUV irradiancemodeling in the soft X-rays and FUV. Sol. Phys. 177, 147–159, 1998.
Vernazza, J.E., Reeves, E.M. Extreme ultraviolet composite spectra ofrepresentative solar features. ApJS 37, 485–513, 1978.
Warren, H.P. A solar minimum irradiance spectrum for wavelengthsbelow 1200 A. ApJS, 2005.
Warren, H.P., Mariska, J.T., Lean, J., Marquette, W., Johannesson, A.Modeling solar extreme ultraviolet irradiance variability usingemission measure distributions. Geophys. Res. Lett. 23, 2207–2210,1996.
Warren, H.P., Mariska, J.T., Lean, J.L. A new reference spectrum for theEUV irradiance of the quiet sun, 1, emission measure calculations andreference spectrum. J. Geophys. Res. 103, 12077–12089, 1998a.
Warren, H.P., Mariska, J.T., Lean, J.L. A new reference spectrum forthe EUV irradiance of the quiet sun, 2, Comparisons withobservations and previous models. J. Geophys. Res. 103, 12091–12102, 1998b.
Warren, H.P., Mariska, J.T., Lean, J.L. A new model of solar EUVirradiance variability. 1. Model formulation. J. Geophys. Res. 106,15745–15757, 2001.
Woods, T.N., Bailey, S.M., Eparvier, F.G., Lawrence, G.M., Lean, J.,McClintock, W.E., Roble, R.G., Rottman, G.J., Solomon, S.C.,Tobiska, W.K., Ucker, G.J., White, O.R., TIMED solar EUVexperiment. in: Clarence M. Korendyke (Ed.), Missions to the SunII, Proceeding of SPIE, vol. 3442, pp. 180–191, 1998a.
Woods, T.N., Rottman, G.J., Bailey, S.M., Solomon, S.C., Worden, J.R.Solar extreme ultraviolet irradiance measurements during solar cycle22. Sol. Phys. 177, 133–146, 1998b.
Young, P.R., Del Zanna, G., Landi, E., Dere, K.P., Mason, H.E.,Landini, M. CHIANTI – an atomic database for emission lines. VI.Proton rates and other improvements. ApJS 144, 135–152, 2003.


