
Nitrogen and Phosphorus Releasefrom Mixed Litter Layers is Lower thanPredicted from Single Species Decay
Becky A. Ball,1,2* Mark A. Bradford,2 and Mark D. Hunter3
1Environmental Studies Program, Dartmouth College, 6182 Steele Hall, Hanover, New Hampshire 03755, USA; 2Odum School of
Ecology, University of Georgia, Athens, Georgia 30602, USA; 3School of Natural Resources and Environment and Department of
Ecology and Evolutionary Biology, University of Michigan, Ann Arbor, Michigan 48109, USA
ABSTRACT
Ecosystem-level nutrient dynamics during decom-
position are often estimated from litter monocul-
tures. If species effects are additive, we can
statistically predict nutrient dynamics in multi-
species systems from monoculture work, and po-
tential consequences of species loss. However, if
species effects are dependent on interactions with
other litter species (that is, non-additive), predic-
tions based on monoculture data will likely be
inaccurate. We conducted a 3-year, full-factorial,
mixed-litter decomposition study of four dominant
tree species in a temperate forest and measured
nitrogen and phosphorus dynamics to explore
whether nutrient dynamics in mixtures were
additive or non-additive. Following common ap-
proaches, we used litterfall data to predict nutrient
dynamics at the ecosystem-level. In mixtures, we
observed non-additive effects of litter mixing on
nutrient dynamics: the presence of nutrient-rich
species in mixture facilitated nutrient release,
whereas nutrient-poor species facilitated nutrient
retention. Fewer nutrients were released from
mixtures containing high-quality litter, and more
immobilized from mixtures containing low-quality
litter, than predicted from monocultures, creating a
difference in overall nutrient release between pre-
dicted and actual dynamics in litter mixtures.
Nutrient release at the ecosystem-level was greatly
overestimated when based on monocultures be-
cause the effect of species interactions on nutrient
immobilization was not accounted for. Our data
illustrate that the identity of species in mixtures is
key to their role in non-additive interactions, with
repercussions for mineral nutrient availability and
storage. These results suggest that predictions of
ecosystem-level nutrient dynamics using litter
monoculture data likely do not accurately repre-
sent actual dynamics because the effects of litter
species interactions are not incorporated.
Key words: ecosystem function; decomposition;
nutrient dynamics; litter nitrogen; litter phospho-
rus; litter mixtures; species diversity; species com-
position; species loss; biodiversity.
INTRODUCTION
Decomposition of leaf litter is a fundamental source
of energy and nutrients in forested ecosystems
(Swift and others 1979) and is historically investi-
gated for its role in nutrient cycling. Much is
known about the dynamics and controls of nutrient
immobilization and mineralization from decom-
posing litter (for example, Blair 1988; Melillo and
Received 26 May 2008; accepted 15 September 2008; published online
28 October 2008
Electronic supplementary material: The online version of this article
(doi:10.1007/s10021-008-9208-2) contains supplementary material,
which is available to authorized users.
*Corresponding author; e-mail: [email protected]
Ecosystems (2009) 12: 87–100DOI: 10.1007/s10021-008-9208-2
� 2008 Springer Science+Business Media, LLC
87

others 1989; Prescott 2005). For nitrogen (N), there
is typically a triphasic pattern in which N is initially
leached from the litter, and then immobilized by
the microbes that colonize it. Immobilization is
followed by a period of release (mineralization)
that usually begins when the litter carbon:nitrogen
(C:N) ratio has decreased to approximately 30
(Moore and others 2006). Phosphorus (P) dynam-
ics are more variable, but also often demonstrate a
similar triphasic pattern (Prescott 2005). Controls
over nutrient dynamics are those that regulate the
biotic community processing those nutrients: tem-
perature, moisture, and the chemical quality of the
litter (for example, the amount and complexity of C
molecules), although it is often difficult to associate
nutrient dynamics with one particular measure of
quality (Singh and others 1999; Kwabiah and
others 2001; Prescott 2005; Moore and others
2006).
Most of our understanding of nutrient dynamics
comes from studies of individual species of litter
(for example, Lovett and others 2004; Moore and
others 2006; Parton and others 2007), although
most forested ecosystems consist of multiple tree
species. Recent studies have attempted to deter-
mine whether nutrient dynamics differ under
multi-species mixtures (reviewed by Gartner and
Cardon 2004) or are affected by litter diversity
(reviewed by Hattenschwiler and others 2005).
Effects of mixing could be additive, where nutrient
dynamics would result from the independent
influence of individual species, with diverse litter
mixes showing greater (or lower) nutrient release
due to the increased probability of including spe-
cies with greater (or lesser) nutrient release
(Johnson and others 2006). If decay dynamics in
mixtures are the sum of their parts, nutrient
dynamics of single litters can be used to predict
statistically nutrient dynamics in multi-species lit-
ter layers. Alternatively, nutrient dynamics in
mixtures could be dependent on other litter spe-
cies, giving rise to non-additive dynamics. Litter-
mixing studies have focused on detecting these
non-additive effects, both in terms of nutrient
content of litter (Blair and others 1990; Klem-
medson 1992; Rustad 1994; Wardle and others
1997; Salamanca and others 1998; Kaneko and
Salamanca 1999; Conn and Dighton 2000; Mad-
ritch and Cardinale 2007) and its release from the
litter (Chapman and others 1988; Williams and
Alexander 1991; Fyles and Fyles 1993; Briones and
Ineson 1996; McTiernan and others 1997;
Brandtberg and Lundkvist 2004). Non-additive
dynamics have been observed by some (Chapman
and others 1988; Blair and others 1990; McTiernan
and others 1997; Wardle and others 1997; Sal-
amanca and others 1998; Kaneko and Salamanca
1999; Madritch and Cardinale 2007) and not by
others (Klemmedson 1992; Rustad 1994; Brandt-
berg and Lundkvist 2004), even with the obser-
vation of both non-additive and additive effects in
the same experiment (Fyles and Fyles 1993;
Gartner and Cardon 2006). Although non-addi-
tivity is often observed, there is little evidence in
the literature for any effect of species richness per
se on nutrient dynamics, so it is likely species
composition (identity) that drives these effects
(Hattenschwiler and others 2005).
Projected exogenous drivers of global change,
such as climate, land use, and nitrogen deposition,
will likely result in the loss of dominant species
from many systems (Vitousek and others 1997;
Grime 1998; Loreau and others 2001; Ellison and
others 2005). Under scenarios of species loss, either
additive or non-additive effects of a component
species imply that ecosystem functioning will be
altered with a shift in community composition.
These differential effects reflect either an indepen-
dent influence of species on ecosystem functioning
(additivity) or emergent dynamics that arise be-
cause species effects are dependent on the presence
of other species (non-additivity). The pressing need
to understand how ecosystems will function as
species are lost requires experimental designs that
remove vulnerable species (for example, Smith and
Knapp 2003; Larsen and others 2005; Schlapfer and
others 2005) and/or statistical models that can
identify both additive and non-additive effects of
component species (for example, Kominoski and
others 2007; Ball and others 2008).
Nutrient dynamics in litter experiments have
frequently been scaled to the ecosystem-level,
where knowledge about the amount of total lit-
terfall for a system can be applied to that of the
nutrient concentration and dynamics of the litter to
calculate the nutrient dynamics of an entire sys-
tem. From these types of studies, we are able to
determine the net concentration of nutrients
available in the soil and the timing of their avail-
ability (for example, Cromack and Monk 1975;
Lisanework and Michelsen 1994; Dutta and Agra-
wal 2001; Yang and others 2004; Pandey and oth-
ers 2007). However, there is a lack of information
on how decay dynamics in mixed litter layers scale
to ecosystem-level nutrient cycling (but see Chap-
man and others 1988; Blair and others 1990). Al-
though large-scale ecosystem data of individual
species, including cross-site comparisons of nutri-
ent dynamics (Moore and others 2006; Parton and
others 2007), reveal much information about the
88 B. A. Ball and others

drivers of nutrient dynamics, it is necessary to
consider the role of species interactions and how
they might alter patterns at the ecosystem scale.
Given that non-additive effects of litter mixing on
nutrient dynamics appear common (reviewed by
Gartner and Cardon 2004; Hattenschwiler and
others 2005), it would follow that the dynamics of
nutrients in mixtures measured for a system will
likely differ from those predicted from data on
individual species.
To investigate whether N and P dynamics at the
ecosystem-level are predictable from monoculture
data, we utilized a 3-year, full-factorial litter-mix
study in a southeastern US temperate forest. We
used leaf litter from four dominant tree species
within our study system, which differed in initial
nutrient concentrations. We used a statistical
model that sequentially tests for additive effects of
each component species, then whether any of the
remaining variance is explained by interactions
among the main factors (that is, the presence/ab-
sence of each species). Significant interactions
indicate non-additivity, which was explored using
post hoc analyses to determine whether the non-
additivity was explained by species richness and/or
composition (Mikola and others 2002; Drake
2003). The strength of the approach is that we can
first ask whether a species is functionally redun-
dant or unique (that is, whether there is an influ-
ence of its presence or absence on net ecosystem
function). A significant effect of a species signifies
an influence of that species on nutrient dynamics;
thus, we can infer that there will be consequences
of that species’ loss on the ecosystem (Ball and
others 2008). We can then ask whether a species’
effects are likely to be statistically predictable (that
is, arising through additive mechanisms) or whe-
ther its effects are dependent on the presence of
some or all of the other species in the community
(that is, non-additivity). We hypothesized that, gi-
ven the gradient in initial nutrient content, we
would see non-additive effects on nutrient
dynamics, as hypothesized by Seastedt (1984).
Specifically, we hypothesized that litter species
with high nutrient content would stimulate
decomposition and subsequent nutrient release
from lower quality litter, giving rise to higher net
release of nutrients from mixtures than predicted
from monocultures (Chapman and others 1988).
Alternatively, we hypothesized that the potential
for translocation of nutrients from litter species
with higher nutrient contents to those with lower
(Schimel and Hattenschwiler 2007) might mean
that the presence of low nutrient litter species
would lead to higher immobilization than predicted
from monocultures. We expected non-additive ef-
fects to be due to composition, rather than richness,
because of the lack of evidence for richness effects
on nutrient dynamics in the literature (for exam-
ple, Wardle and others 1997). To determine whe-
ther ecosystem-level nutrient dynamics are likely
predictable from monoculture data, we applied the
results from our single- and mixed-species litterbag
study with additional litterfall data to estimate
nutrient release across 3 years from the litter layer.
MATERIALS AND METHODS
Study Site
This experiment was conducted at Coweeta
Hydrologic Lab (US Forest Service) in the southern
Appalachians, Macon County, North Carolina
(35�00’N, 83�30’W; elevation 1300 m). This is a
deciduous hardwood forest with an abundant
evergreen understory comprised mainly of Rhodo-
dendron maximum (rhododendron) and Kalmia lati-
folia (mountain laurel). Soils in the Coweeta basin
are classified as immature Inceptisol or older
developed Ultisol. Mean annual rainfall is approx-
imately 1700 mm and mean annual temperature is
13�C (Heneghan and others 1999). The study was
conducted in Watershed 20 on Ball Creek, which
drains into Coweeta Creek, a tributary of the Little
Tennessee River. Four replicate blocks were estab-
lished along a 30 m reach of Ball Creek, with two
blocks on each side of the stream. Blocks were
approximately 5 m from the stream edge and 10 m
from the neighboring block. Surface soil (0–5 cm)
C and N contents were consistent across the blocks
(6.52%C and 0.24%N).
Decomposition Experiment and LitterfallAssessment
The litters used were collected from four co-domi-
nant tree species at Coweeta: Liriodendron tulipifera
L. (tulip poplar, L), Acer rubrum L. (red maple, A),
Quercus prinus L. (chestnut oak, Q), and Rhododen-
dron maximum L. (rhododendron, R). These four
species co-occur across the four blocks. Senesced
leaves of each species were collected in October
2003 and air-dried at room temperature in paper
bags in the lab for 1 week. Leaves were placed in
litterbags in each of the possible 15 combinations of
the four species. Litterbags (15 cm 9 15 cm) were
constructed from 1-mm nylon mesh and heat-
sealed at the edges. Each litterbag contained 5 g of
leaves, and each species in any one combination
was equally represented in mass. On November 17,
2003, one set of all 15 combinations was placed in
Litter Diversity and Nutrient Dynamics 89

each of the four replicate blocks for each of 9 col-
lection dates across 3 years: 0, 92, 181, 273, 365,
546, 730, 911, and 1065 days. At each collection
date, one set from each replicate plot was randomly
chosen for processing and litterbags were trans-
ported back to the laboratory on ice.
Litter was dried, ground using a Spex CertiPrep
8000-D Mixer Mill (Spex CertiPrep, Metuchen,
USA), and the ash-free dry mass (AFDM) remain-
ing for each litterbag was determined by incinera-
tion at 550�C for 1 h. Total C and N contents were
determined by combustion in a Carlo Erba Ele-
mental Analyzer (Carlo Erba, Milan, Italy) and re-
ported as % content of litter dry mass. Total
phosphorus content was measured using dry ash
extraction in aqua regia acid followed by colori-
metric analysis on an Alpkem Rapid Flow Analyzer
(300 Series, Alpkem, Clackamas, USA) and re-
ported in the same manner (Grimshaw and others
1989; Jones Jr. and others 1991).
Nutrient content at each sampling period was
calculated as:
Nutrient Mass ¼ % Nutrient Contentð Þ * Dry Massð Þ
This represents the total amount (g) of a nutrient
present in the litterbag, and was calculated for each
sample at each sampling period. Nutrient mass at
any given time period was subtracted from initial
mass to calculate net nutrient movement to or from
the litterbags, where positive values represent net
nutrient release (mineralization), and negative
values represent net immobilization.
To estimate ecosystem nutrient dynamics, we
first determined the total mass of litterfall that was
comprised of these four species. Ten litter traps
were arranged around the four replicate blocks in
randomly selected locations along a circle sur-
rounding the plots and along a transect through
the center. Traps were placed in the field on May
16, 2004. For two and a half years covering three
autumnal litterfalls, litter was collected approxi-
mately every month and sorted into species, dried,
and then weighed. A one-way analysis of variance
(ANOVA) was conducted to identify if there were
significant differences among species for total lit-
terfall (g), followed by a post hoc Tukey test to
group species of similar litterfall. To compare the
ability of single- and mixed-species litterbags to
predict ecosystem-level nutrient dynamics, the
nutrient contents of the monoculture and the
four-species mixtures were each used to calculate
nutrient release from the litter layer over 3 years.
For the four species used in the decomposition
experiment, the litter mass for each was multiplied
by experimental values for nutrient content
throughout decomposition to estimate nutrient
dynamics of the entire ecosystem using the cal-
culations described above.
Statistical Analyses
All statistical analyses were conducted in S-Plus 7.0
(Insightful Corp., Seattle, USA) using 0.05 as the
critical level of alpha. Following the approach of
Ball and others (2008), an ANOVA, using Type I
Sums of Squares (SS), was performed to test for
additivity and non-additivity of species effects.
Block, time, and the presence/absence of each of
the four species were added sequentially as terms to
the model. Block had four levels and time eight or
nine levels (nine for nutrient mass, but eight for
nutrient release as there was no day 0 in this case).
The term representing each species had two levels:
present or absent. A species interaction term
(SpInt) was then included to test for non-additivity.
This term had 11 levels, each representing one of
the specific litterbag multi-species combinations.
Lastly, interactions between time and block, the
species, and SpInt terms were included. Time
(days) was analyzed as a discrete, rather than
continuous, factor to test whether the relative ef-
fects of litter species composition were consistent
across time. Nutrient mass data were loge-trans-
formed to meet the assumptions of normality. All
other data were analyzed untransformed.
A significant SpInt term (and/or its interaction
with time) indicates a significant non-additive
interaction among species, due to richness and/or
composition. To explore these possible drivers we
replaced the SpInt term with a Richness term,
composed of four levels (1–4 species). In the ab-
sence of a significant effect of Richness or its
interaction with time, a significant SpInt term must
arise through non-additive composition effects. If a
Richness term is significant, a Composition term,
with 11 possible levels and thereby equivalent to
the SpInt term, can be added to the model, while
retaining Richness, to evaluate if both richness and
non-additive composition effects manifest (Ball and
others 2008).
Non-additive composition effects can then be
further explored to determine which of the species
are interacting. To detect which species were con-
tributing to non-additive interactions, we com-
pared the observed value for all mixtures involving
each species with those that would be expected
based on the average of that species in monocul-
ture and the treatment that contained the other
species. For example, to explore possible non-
90 B. A. Ball and others

additivity of L. tulipifera, we compared the observed
and expected values for LA, LQ, LR, LAQ, LAR,
LQR, and LAQR (where each of these is the mix-
ture treatment consisting of the species each letter
represents). The expected values were the average
of the observed values for treatments L and A, Q, R,
AQ, AR, QR, and AQR, respectively. Observed and
expected values were compared with a paired t-test
to identify if a species was significantly driving non-
additive interactions. If so, observed minus ex-
pected values were plotted, and species whose 95%
confidence intervals did not cross the x-axis were
considered to contribute significantly to non-addi-
tivity.
RESULTS
The four litter species covered a gradient of initial
litter nutrient content (Table 1). Q. prinus con-
tained the highest concentration of both N and P,
followed by L. tulipifera. A. rubrum contained fairly
low levels of N, but moderately high levels of P
(comparable to P levels of L. tulipifera). R. maximum
was always the lowest for both nutrients. C:Nutri-
ent ratios reveal that Q. prinus and L. tulipifera both
contained similarly high amounts of N and P with
respect to C, followed by A. rubrum; R. maximum
had the lowest nutrient content in relation to C.
Nutrient Dynamics from Single Species
For A. rubrum and R. maximum, there was a tri-
phasic pattern of N release, immobilization, and re-
release from litter. The fraction of N remaining
initially dropped (net mineralization), then in-
creased as N was immobilized, and finally de-
creased again as more N was mineralized and
released from the litter (Figure 1A). The immobi-
lization phase was related to the initial N concen-
tration. The two species with low initial N
concentrations, A. rubrum and R. maximum, both
immobilized more N, reaching a higher fraction of
initial N, than did species with high initial con-
centrations (Figure 1A). L. tulipifera and Q. prinus,
the two species with high initial N concentrations,
immobilized very little N, causing a dampening of
the second phase of their dynamics. In other words,
the second phase (immobilization) was largely ab-
sent. The final release phase began when approxi-
mately 35–65% of mass had been lost and occurred
with greater %AFDM remaining for L. tulipifera and
Q. prinus. This final release phase began when the
litter C:N ratio reached between 25 and 40 (Ta-
ble 1), which occurred sooner for litter with higher
N content. Litter N content was used to calculate
net release/immobilization dynamics from the litter
over time. L. tulipifera and Q. prinus released more N
than the other species with lower initial N, and
these other species (A. rubrum and R. maximum)
were the only two species to show net immobili-
zation of N. Overall, however, none of the species
had high net N immobilization rates (that is, neg-
ative values of release) or prolonged periods where
net immobilization occurred (Figure 2A).
The fraction of remaining P in litter was triphasic
only for R. maximum (Figure 1B). A. rubrum and Q.
prinus both immobilized P after the initial release
phase, whereas P content in L. tulipifera remained
fairly constant after the initial release phase. Litter
P content with respect to %AFDM did not neces-
sarily correspond with initial concentration. For
example, A. rubrum had fairly low initial P (Table 1)
but released more compared to its initial content
than species with greater initial P concentrations
(L. tulipifera and Q. prinus). However, the net
amount of P released or immobilized over time
from the litter species did correspond to initial P, as
would be expected, where L. tulipifera and Q. prinus
released more P than the other species with lower
initial P (Figure 2B). R. maximum and A. rubrum
Table 1. Nutrient Properties of Initial and Decomposing Leaf Litter and Litterfall
Initial litter Litter fall (g m-2 y-1) Nutrient release
%N %P %C C:N:P Litter N P C C:N C:P
L. tulipifera 0.95 ± 0.04 0.04 ± 0.00 47.87 ± 0.60 1197:24:1 48.66 ± 2.84 0.46 0.02 23.29 30.08 ± 2.26 550 ± 64
A. rubrum 0.70 ± 0.06 0.03 ± 0.01 49.75 ± 0.95 1658:23:1 23.24 ± 0.55 0.16 0.01 11.56 27.67 ± 1.97 435 ± 58
Q. prinus 1.25 ± 0.09 0.05 ± 0.00 50.06 ± 1.15 1001:25:1 28.86 ± 1.51 0.36 0.01 14.45 24.12 ± 0.69 650 ± 36
R. maximum 0.55 ± 0.08 0.02 ± 0.00 48.88 ± 1.08 2444:28:1 51.85 ± 11.63 0.28 0.01 25.34 41.24 ± 1.71 976 ± 94
For initial litter, concentration of nitrogen, phosphorus, and carbon are listed, as well as the ratio of these three nutrients (n = 4). For litterfall, data include mass of litter(n = 10) and the estimated total mass of each nutrient that these species contribute to the system, calculated as the mass of litterfall multiplied by each nutrient’s initialconcentration (see Methods). Finally, the ratios at which net nutrient release (3rd phase) begins during decomposition are listed (n = 4).Values are means (±1 SE when applicable).
Litter Diversity and Nutrient Dynamics 91

both showed significant long-term immobilization
of P (although there was no net immobilization for
A. rubrum in comparison to its initial content; Fig-
ure 1B).
With litter traps, we measured the total mass of
litterfall for each of the four species (Table 1). Our
values were similar to those found at Coweeta by
Cromack and Monk (1975). A post hoc Tukey test
revealed that, although there was some variation in
the mass of litter that each of the four study species
produced, there were no significant differences
among them (P > 0.05). All four species reached
their peak of litterfall at the same time (October,
tapering off in November, Appendix 1). From
information gathered about the total input of litter
to the system from our four focal species and the
initial nutrient content of that litter, we calculated
the total mass of nutrient input provided by those
species through litterfall (Table 1). L. tulipifera
contributed the greatest total amount of N and P to
the litter layer, even though it did not have the
highest initial N and P concentrations or total lit-
terfall mass (Table 1). Although R. maximum con-
stituted a large amount of litter input (and the most
C), it provided low amounts of nutrients. Similarly,
we calculated the nutrient release based on initial
nutrient content and its rate of release from
monoculture litterbags (Appendix 2). Based on
0.5
0.6
0.7
0.8
0.9
1.0
1.1
1.2
20406080100
Fra
ctio
n of
initi
al N
AFDM remaining (%)
L. tulipifera
A. rubrum
Q. prinus
R. maximum
0.0
0.5
1.0
1.5
2.0
20406080100
Fra
ctio
n of
initi
al P
AFDM Remaining (%)
L. tulipifera
A. rubrum
Q. prinus
R. maximum
B
A
Figure 1. Fraction of initial (A) nitrogen and (B) phos-
phorus remaining over decreasing % Ash-Free Dry Mass
remaining throughout 3 years of decomposition of four
species of leaf litter in monoculture. Values are means at
each sampling date ± 1 SE; n = 4. Points above the y = 1
line indicate net immobilization of nutrients, whereas
points below it indicate net release (mineralization) from
the litter. Third order polynomial trendlines were in-
cluded to aid in the visualization of the triphasic pattern
of nutrient dynamics.
Figure 2. Net mass of (A) nitrogen and (B) phosphorus
released from litterbags containing monocultures of four
leaf litter species throughout 3 years of decomposition.
Values are means ± 1 SE; n = 4. Positive values dem-
onstrate net release (mineralization), whereas negative
values demonstrate net immobilization. Positive slopes
indicate ongoing release, whereas negative slopes indi-
cate ongoing immobilization (although the net result
may still be release).
92 B. A. Ball and others

these monocultures, R. maximum is responsible for
most of the ecosystem immobilization, whereas
mineralization of each nutrient is largely due to L.
tulipifera and Q. prinus (as well as A. rubrum for P).
Nutrient Dynamics from Litter Mixtures
For both N and P, litter mixing generated signifi-
cant, non-additive effects on nutrient content of
litter (Table 2). Replacing the SpInt term with
Richness identified no significant effect of richness
for either nutrient (F2,442 = 0.12, P = 0.093 and
F2,439 = 8.8*10-7, P = 0.115 for N and P, respec-
tively), so this non-additive interaction must be
due to composition. As the composition effect did
not interact with time, data were pooled across all
sampling dates. R. maximum emerged as the only
significant driver of non-additive effects on nutri-
ent mass (Table 3), and its presence increased the
retention of both nutrients for many of the litter
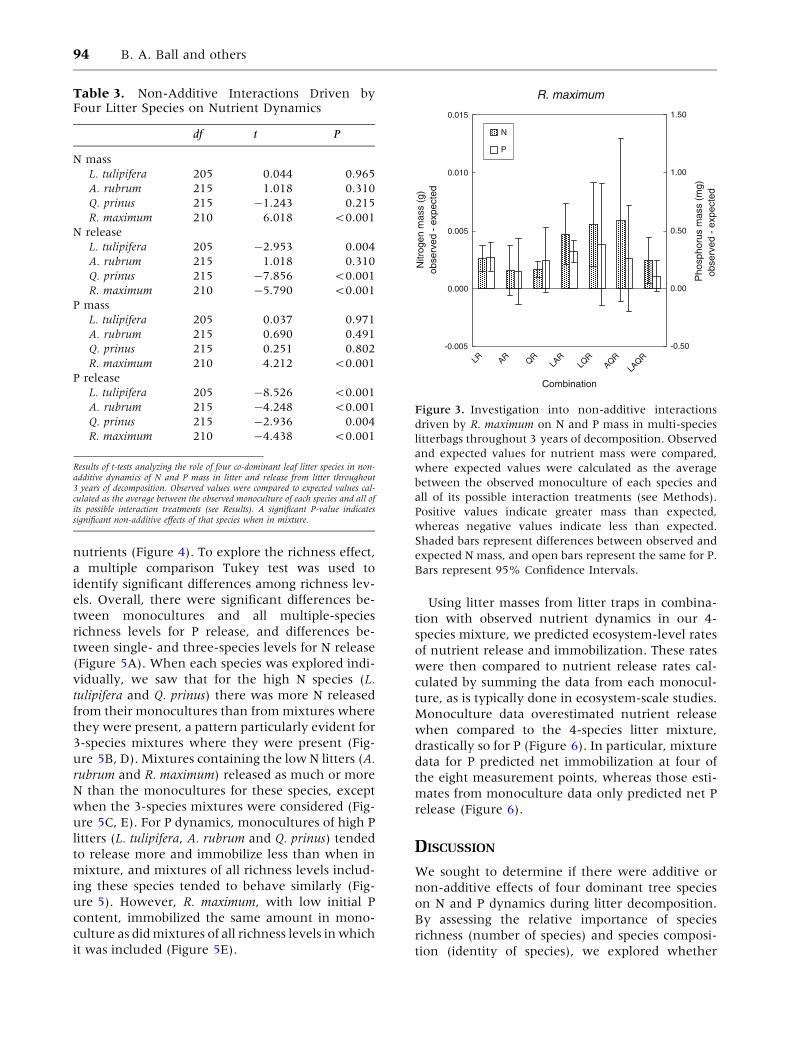
mixtures (Figure 3).
There were significant, non-additive effects on
nutrient release and immobilization dynamics
throughout decomposition (Table 4). In contrast to
nutrient mass, the post hoc test identified both rich-
ness and composition effects contributing to non-
additivity. To explore the composition effects, a
paired t-test between observed and expected values
showed that there were significant non-additive
interactions caused by all species on P dynamics, and
all but A. rubrum on N. The direction and strength of
that effect varied, even within species, but the ten-
dency was for each species to increase immobiliza-
tion (causing less-than-expected release) for both
Table 2. Effects of Litter Mixing on Nutrient Mass in Litter
df SS MS F P
Nitrogen
Block 3 1.35 0.449 10.42 <0.001
Day 8 2.52 0.315 7.31 <0.001
A. rubrum 1 0.421 0.421 9.77 0.002
L. tulipifera 1 0.872 0.872 20.25 <0.001
Q. prinus 1 3.28 3.28 76.19 <0.001
R. maximum 1 0.719 0.719 16.70 <0.001
SpInt 10 2.80 0.280 6.50 <0.001
Block*Day 24 4.83 0.201 4.68 <0.001
Day*A. rubrum 8 1.02 0.128 2.96 0.003
Day*L. tulipifera 8 0.439 0.055 1.27 0.256
Day*Q. prinus 8 1.99 0.249 5.78 <0.001
Day*R. maximum 8 1.31 0.163 3.79 <0.001
Day*SpInt 80 3.87 0.048 1.12 0.237
Residuals 370 15.93 0.043
Total 531 41.35 7.22
Phosphorus
Block 3 3.1 9 10-05 1.0 9 10-05 25.69 <0.001
Day 8 5.9 9 10-05 7.4 9 10-06 18.50 <0.001
A. rubrum 1 2.2 9 10-06 2.2 9 10-06 5.65 0.018
L. tulipifera 1 4.0 9 10-06 4.0 9 10-06 10.04 0.002
Q. prinus 1 2.7 9 10-06 2.7 9 10-06 6.69 0.010
R. maximum 1 1.4 9 10-06 1.4 9 10-06 3.44 0.065
SpInt 10 9.6 9 10-06 9.6 9 10-07 2.41 0.009
Block*Day 24 6.4 9 10-05 2.7 9 10-06 6.68 <0.001
Day*A. rubrum 8 4.8 9 10-06 6.0 9 10-07 1.51 0.153
Day*L. tulipifera 8 6.1 9 10-06 7.7 9 10-07 1.92 0.055
Day*Q. prinus 8 8.2 9 10-06 1.0 9 10-06 2.57 0.010
Day*R. maximum 8 5.3 9 10-06 6.6 9 10-07 1.66 0.106
Day*SpInt 80 3.1 9 10-05 3.9 9 10-07 0.989 0.511
Residuals 367 1.5 9 10-04 4.0 9 10-07
Total 528 3.8 9 10-04 3.5 9 10-05
Results of the ANOVA analyzing potential additive and non-additive effects of four co-dominant leaf litter species on N and P mass in litter throughout 3 years ofdecomposition. A significant SpInt term indicates non-additive interactions, and in the absence of richness effects (as is true for these two nutrients, data not shown), this non-additivity is due to composition (see Methods).
Litter Diversity and Nutrient Dynamics 93
nutrients (Figure 4). To explore the richness effect,
a multiple comparison Tukey test was used to
identify significant differences among richness lev-
els. Overall, there were significant differences be-
tween monocultures and all multiple-species
richness levels for P release, and differences be-
tween single- and three-species levels for N release
(Figure 5A). When each species was explored indi-
vidually, we saw that for the high N species (L.
tulipifera and Q. prinus) there was more N released
from their monocultures than from mixtures where
they were present, a pattern particularly evident for
3-species mixtures where they were present (Fig-
ure 5B, D). Mixtures containing the low N litters (A.
rubrum and R. maximum) released as much or more
N than the monocultures for these species, except
when the 3-species mixtures were considered (Fig-
ure 5C, E). For P dynamics, monocultures of high P
litters (L. tulipifera, A. rubrum and Q. prinus) tended
to release more and immobilize less than when in
mixture, and mixtures of all richness levels includ-
ing these species tended to behave similarly (Fig-
ure 5). However, R. maximum, with low initial P
content, immobilized the same amount in mono-
culture as did mixtures of all richness levels in which
it was included (Figure 5E).
Using litter masses from litter traps in combina-
tion with observed nutrient dynamics in our 4-
species mixture, we predicted ecosystem-level rates
of nutrient release and immobilization. These rates
were then compared to nutrient release rates cal-
culated by summing the data from each monocul-
ture, as is typically done in ecosystem-scale studies.
Monoculture data overestimated nutrient release
when compared to the 4-species litter mixture,
drastically so for P (Figure 6). In particular, mixture
data for P predicted net immobilization at four of
the eight measurement points, whereas those esti-
mates from monoculture data only predicted net P
release (Figure 6).
DISCUSSION
We sought to determine if there were additive or
non-additive effects of four dominant tree species
on N and P dynamics during litter decomposition.
By assessing the relative importance of species
richness (number of species) and species composi-
tion (identity of species), we explored whether
Table 3. Non-Additive Interactions Driven byFour Litter Species on Nutrient Dynamics
df t P
N mass
L. tulipifera 205 0.044 0.965
A. rubrum 215 1.018 0.310
Q. prinus 215 -1.243 0.215
R. maximum 210 6.018 <0.001
N release
L. tulipifera 205 -2.953 0.004
A. rubrum 215 1.018 0.310
Q. prinus 215 -7.856 <0.001
R. maximum 210 -5.790 <0.001
P mass
L. tulipifera 205 0.037 0.971
A. rubrum 215 0.690 0.491
Q. prinus 215 0.251 0.802
R. maximum 210 4.212 <0.001
P release
L. tulipifera 205 -8.526 <0.001
A. rubrum 215 -4.248 <0.001
Q. prinus 215 -2.936 0.004
R. maximum 210 -4.438 <0.001
Results of t-tests analyzing the role of four co-dominant leaf litter species in non-additive dynamics of N and P mass in litter and release from litter throughout3 years of decomposition. Observed values were compared to expected values cal-culated as the average between the observed monoculture of each species and all ofits possible interaction treatments (see Results). A significant P-value indicatessignificant non-additive effects of that species when in mixture.
-0.005
0.000
0.005
0.010
0.015
LR AR QRLA
RLQ
RAQR
LAQR
Combination
Nitr
ogen
mas
s (g
)ob
serv
ed -
exp
ecte
d
-0.50
0.00
0.50
1.00
1.50
Pho
spho
rus
mas
s (m
g)ob
serv
ed -
exp
ecte
d
N
P
R. maximum
Figure 3. Investigation into non-additive interactions
driven by R. maximum on N and P mass in multi-species
litterbags throughout 3 years of decomposition. Observed
and expected values for nutrient mass were compared,
where expected values were calculated as the average
between the observed monoculture of each species and
all of its possible interaction treatments (see Methods).
Positive values indicate greater mass than expected,
whereas negative values indicate less than expected.
Shaded bars represent differences between observed and
expected N mass, and open bars represent the same for P.
Bars represent 95% Confidence Intervals.
94 B. A. Ball and others

nutrient dynamics in a multi-species system, and
hence potential effects of species loss, can be reli-
ably estimated from monoculture data (Gross and
Cardinale 2005; Schlapfer and others 2005; Ball
and others 2008). We observed non-additive effects
of species composition on litter N content (Table 2),
and non-additive effects of both species richness
and composition on the release and immobilization
of N and P (Table 4). When flux rates from litter
mixtures were applied to litter inputs at the eco-
system-level, predicted rates of nutrient release
were much lower than those expected from litter
monocultures (Figure 6). In other words, non-
additive effects promoted nutrient retention in the
litter layer of this ecosystem.
In monocultures, nutrients were released from
litter as C:N ratio declined, with release rates
dependent upon initial nutrient concentrations
(Figure 2). In comparison with the monocultures,
less nutrients were released from litter mixtures
(Figure 5). A possible mechanism for this pattern is
that nutrients mineralized from high-quality litter
were immediately immobilized on low quality litter
presumably by microbial activity (reviewed by
Hattenschwiler and others 2005), which has been
found experimentally in other studies (Klemmedson
Table 4. Effects of Litter Mixing on Nutrient Mineralization and Immobilization
df SS MS F P
Nitrogen
Block 3 0.0026 0.0009 14.31 <0.001
Day 7 0.0041 0.0006 9.52 <0.001
A. rubrum 1 0.0000 0.0000 0.263 0.608
L. tulipifera 1 0.0001 0.0001 0.982 0.322
Q. prinus 1 0.0000 0.0000 0.366 0.546
R. maximum 1 0.0046 0.0046 74.43 <0.001
Richness 2 0.0007 0.0003 5.50 0.004
Composition 8 0.0033 0.0004 6.73 <0.001
Block*Day 21 0.0088 0.0004 6.86 <0.001
Day*A. rubrum 7 0.0006 0.0001 1.33 0.237
Day*L. tulipifera 7 0.0005 0.0001 1.24 0.279
Day*Q. prinus 7 0.0004 0.0001 0.982 0.444
Day*R. maximum 7 0.0002 0.0000 0.519 0.820
Day*Richness 14 0.0005 0.0000 0.632 0.838
Day*Composition 56 0.0024 0.0000 0.695 0.951
Residuals 328 0.0201 0.0001
Total 471 0.0489 0.0077
Phosphorus
Block 3 2.3 9 10-05 7.7 9 10-06 23.07 <0.001
Day 7 5.0 9 10-05 7.1 9 10-06 21.11 <0.001
A. rubrum 1 3.1 9 10-06 3.1 9 10-06 9.14 0.003
L. tulipifera 1 1.4 9 10-05 1.4 9 10-05 41.95 <0.001
Q. prinus 1 6.5 9 10-06 6.5 9 10-06 19.23 <0.001
R. maximum 1 8.2 9 10-05 8.2 9 10-05 244.06 <0.001
Richness 2 2.8 9 10-05 1.4 9 10-05 42.21 <0.001
Composition 8 8.1 9 10-05 1.0 9 10-05 30.03 <0.001
Block*Day 21 5.9 9 10-05 2.8 9 10-06 8.37 <0.001
Day*A. rubrum 7 2.4 9 10-06 3.5 9 10-07 1.04 0.404
Day*L. tulipifera 7 7.8 9 10-06 1.1 9 10-06 3.31 0.002
Day*Q. prinus 7 4.3 9 10-06 6.2 9 10-07 1.84 0.079
Day*R. maximum 7 1.1 9 10-06 1.6 9 10-07 0.48 0.849
Day*Richness 14 3.4 9 10-06 2.4 9 10-07 0.72 0.755
Day*Composition 56 1.8 9 10-05 3.2 9 10-07 0.94 0.590
Residuals 325 1.1 9 10-04 3.4 9 10-07
Total 468 4.9 9 10-04 1.5 9 10-04
Results of the ANOVA analyzing potential additive and non-additive effects of four co-dominant leaf litter species on N and P release (mineralization) and immobilization inlitter throughout 3 years of decomposition. For both nutrients, significant non-additive interactions were identified, so richness and composition were added to the model toidentify the driver of these interactions.
Litter Diversity and Nutrient Dynamics 95

1992; Schimel and Hattenschwiler 2007). Thus, the
richness effects can be explained by the fact that, in
mixture, lower-quality species are present to
immobilize any nutrients made available by a high-
er-quality species. For species with low nutrient
content (that is, R. maximum, Figure 5E), richness
had little effect on nutrient release, as all nutrients
were retained, either in monoculture or in mixture.
An increase in overall nutrients associated with
mixtures containing low-quality litter presumably
reflected uptake of nutrients from higher-quality
species in the mixture. The presence of these non-
additive effects of richness and composition suggest
that mineralized plant-available nutrients will al-
ways be at lower concentrations than those calcu-
lated from monocultures. As a result, the loss of plant
-0.012
-0.008
-0.004
0.000
0.004
0.008
LA LQ LR LAQ
LAR
LQR
LAQR
Nitr
ogen
rel
ease
(g)
obse
rved
- e
xpec
ted
-1.80
-1.30
-0.80
-0.30
0.20
0.70
1.20
N
P
L. tulipifera
-0.015
-0.010
-0.005
0.000
0.005
0.010
LA AQ ARLA
QLA
RAQR
LAQR
-1.50
-1.00
-0.50
0.00
0.50
1.00
N
P
A. rubrum
Pho
spho
rus
rele
ase
(mg)
obse
rved
- e
xpec
ted
-0.020
-0.015
-0.010
-0.005
0.000
0.005
0.010
LQ AQ QRLA
QLQ
RAQR
LAQR
Combination
Nitr
ogen
rel
ease
(g)
obse
rved
- e
xpec
ted
-1.60
-1.20
-0.80
-0.40
0.00
0.40
0.80
N
P
Q. prinus
-0.015
-0.010
-0.005
0.000
LR AR
QR
LAR
LQR
AQRLA
QR
Combination
-1.20
-0.90
-0.60
-0.30
0.00
0.30
N
P
R. maximum
Pho
spho
rus
rele
ase
(mg)
obse
rved
- e
xpec
ted
A B
DC
Figure 4. Investigation into non-additive interactions for N and P release (mineralization) and immobilization within
litter driven by each of four co-dominant species of leaf litter. Observed and expected values for nutrient release were
compared, where expected values were calculated as the average between the observed monoculture of each species and
all of its possible interaction treatments (see Results). Positive values indicate greater release than expected, whereas
negative values indicate less than expected. Shaded bars represent the difference between observed and expected N
release, and open bars represent the same for P. Bars represent 95% confidence intervals.
96 B. A. Ball and others

species from ecosystems may increase nutrient ex-
port. An increase in nutrient retention with in-
creased species richness has been demonstrated for
other systems (Hooper and Vitousek 1998; Engel-
hardt and Ritchie 2001; Spehn and others 2002),
although in these cases retention is due to increased
live plant uptake, rather than microbial activity
during decomposition. If the same plant uptake
mechanism also applies in our study system, then as
species diversity declines a decrease in plant uptake
with a concomitant decrease in nutrient storage in
the litter layer (which our results suggest) would
exacerbate nutrient loss.
The magnitude of non-additive effects driven by
each species corresponded to initial nutrient con-
centration, and therefore so did the amount of
nutrients released from or immobilized within the
litter. Species with very high or low nutrient con-
tents had the greatest non-additive effects, poten-
tially due to their tendency to either release (if high
in nutrient content) or retain (if low in nutrient
content) nutrients. In our system, the significant
richness and composition effects of L. tulipifera and
Q. prinus on nutrient dynamics resulted from their
high initial N concentrations that promoted initial
N release for possible subsequent immobilization by
lower N litters (Figure 5B, D). L. tulipifera and Q.
prinus, as well as A. rubrum, contained sufficient
levels of P to drive similar effects on P release
(Figure 5B–D). R. maximum had very low initial
concentrations of both nutrients, and when present
in mixtures drove large non-additive effects on
nutrient immobilization (Figure 5E). Our results
suggest that species that produce low-quality litter
may play a key functional role in ecosystems by
promoting nutrient retention.
A. rubrum
-0.006
-0.003
0.000
0.003
0.006
0.009
-0.40
-0.20
0.00
0.20
0.40
0.60
Ave
rage
P r
elea
se (
mg)
Total
-0.010
-0.005
0.000
0.005
0.010
mono-culture
2 spp
Ave
rage
N r
elea
se (
g)
-0.50
-0.25
0.00
0.25
0.50
N
P
ab
b
aba
dd
d
c
L. tulipifera
-0.0045
-0.0015
0.0015
0.0045
0.0075
0.0105
0.0135
-0.40
0.00
0.40
0.80
1.20
Q. prinus
-0.010
-0.005
0.000
0.005
0.010
0.015
0.020
Species richness
Ave
rage
N r
elea
se (
g)
-0.40
-0.20
0.00
0.20
0.40
0.60
0.80
R. maximum
-0.018
-0.012
-0.006
0.000
0.006
0.012
Species richness
-0.60
-0.40
-0.20
0.00
0.20
0.40
Ave
rage
P r
elea
se (
mg)
4 spp3 spp mono-culture
2 spp 4 spp3 spp mono-culture
2 spp 4 spp3 spp
mono-culture
2 spp 4 spp3 sppmono-culture
2 spp 4 spp3 spp
A B C
D E
Figure 5. Investigation into richness effects on nutrient release from monocultures of four species of leaf litter and all
possible mixtures throughout 3 years of decomposition. Bars represent average nutrient release, where positive values
indicate net release (mineralization) and negative values indicate net immobilization. Shaded bars demonstrate N release
and open bars P. Values are means ± 1 SE. In (A), bars represent the average release from each richness level covering all
15 mixtures. Letters above bars indicate Tukey’s HSD multiple comparisons, where bars with the same letter are not
significantly different from one another at P = 0.05. To investigate the richness effect further, each of the four species were
individually graphed (B–E). Bars represent average nutrient release for each species in monoculture versus the average of
all compositions involving that species at each richness level. Given B–E do not represent a full-factorial design, it was not
appropriate to statistically analyze the data for each species individually. Therefore, individual Tukey tests were not
performed. Instead, B–E graphically represent the identity effects that drive the richness effect seen in A, demonstrating
that nutrients released from nutrient-rich species in monoculture are retained when in mixture and overall less nutrients
are released from nutrient-poor species, regardless of richness level.
Litter Diversity and Nutrient Dynamics 97

Information on nutrient dynamics from litter can
be scaled to the ecosystem-level (Cromack and
Monk 1975; Lisanework and Michelsen 1994; Du-
tta and Agrawal 2001; Pandey and others 2007).
This is usually done with hesitation, in part because
litterbags tend to falsely represent equally the
abundance of each species (Blair and others 1990).
However, we selected co-dominants, whose repre-
sentation in litterfall was statistically equivalent
(see Results). Due to the non-additive effects of
composition and richness on nutrient fluxes, esti-
mates of nutrient dynamics based on litter mono-
cultures greatly overestimated nutrient release
when compared with estimates based on litter
mixes (Figure 6). Using monoculture data alone,
we would overestimate net P mineralization by 2-
fold, and predict no net immobilization during the
first 3 years of decomposition. In contrast, when
litter mixture data were scaled for ecosystem-level
litterfall, we observed net immobilization of P
during the second phase of nutrient dynamics (the
immobilization phase; Prescott 2005). Net N release
was not overestimated as severely as was P release
by using monoculture data, but data from litter
mixtures still revealed lower rates of net minerali-
zation. It is interesting to note that the magnitude
of the non-additive effects driving the overestima-
tion varies between N and P, possibly due to
nutrient limitations or differing capacities of the
microbial community to take up each nutrient (for
example, Hobbie and Vitousek 2000). Our data
suggest that low-quality litter species may exert
significant effects on the length of time that nutri-
ents are stored in the litter layer (for example,
Figure 4D), keeping mineral nutrients unavailable
to plants or preventing their leaching. Specifically,
in mixed litter layers, nutrients remain in the litter
layer for longer periods of time, potentially pro-
viding a nutrient resource for further along the
decay continuum. It is important to note that, al-
though our calculations were made easier by the
near-equal abundance of our dominant trees, spe-
cies do not have to be equally represented in lit-
terfall to exhibit non-additive effects on
decomposition processes (King and others 2002).
Given that we detected non-additive effects of
species on litter nutrient content and dynamics,
loss of any of the four species studied will likely
alter nutrient dynamics in this system. The conse-
quences of species loss will be difficult to predict
based on our knowledge of individual species, as it
is the interaction among species that drives effects.
From our study, we know that there are potential
consequences of loss of all four dominant species;
loss of the higher-quality litter species will lead to
less available nutrients and loss of lower-quality
litter species will lead to less immobilization, and
therefore less long-term storage of nutrients in the
litter layer. This is valuable information given the
predicted changes in abundances of dominant
species in our study area. For example, disease
dynamics are predicted to potentially increase L.
tulipifera or R. maximum abundance (Orwig and
Foster 1998; Ellison and others 2005) or decrease Q.
Figure 6. Estimates of total ecosystem (A) N and (B) P
release (mineralization) and immobilization throughout
3 years of decomposition in the litter layer of a southern
Appalachian forest. Filled circles represent the sum of the
calculations based on the monoculture treatments of four
leaf litter species, whereas open circles represent calcu-
lations based on non-additive dynamics observed in
mixture. Positive values demonstrate net release,
whereas negative values demonstrate net immobiliza-
tion. Positive slopes indicate ongoing release, whereas
negative slopes indicate ongoing immobilization (al-
though the net result may still be release).
98 B. A. Ball and others

prinus and R. maximum abundance (Rizzo and
others 2002). In addition, A. rubrum is predicted to
generally increase (Fei and Steiner 2007). Changes
in the abundance of these dominant species may
greatly alter nutrient dynamics in the litter layer
due to each species’ effects in mixture. Increases in
L. tulipifera and A. rubrum will increase the amount
of N and P that become available, whereas loss of Q.
prinus will decrease available N and P. Decreases in
R. maximum abundance could lead to reduced N
and P immobilization (and vice versa) in the litter
layer, altering the long-term storage of nutrients
that become available later in the decay contin-
uum.
CONCLUSION
Our data reveal non-additive effects of each of four
dominant tree species on the timing and magnitude
of N and P release and immobilization. These ef-
fects, given that they were mediated via both
composition and richness of litter mixtures, were
not accurately predicted from nutrient dynamics in
litter monocultures. The way in which the four
species drove non-additive interactions, either
through increased nutrient release (for species high
in initial nutrient content) or immobilization of
nutrients (for low-quality species), was dependent
on the chemical characteristics and amount of lit-
terfall of each species. Our results suggest that the
loss of species that produce high or low quality
litter will decrease nutrient release and immobili-
zation, respectively, changing litter layer nutrient
dynamics. In our study system, loss of any of the
four species studied will alter nutrient dynamics,
changing the amount of mineral nutrients available
in the soil for plant production and the length of
time in which they are stored in the litter layer.
ACKNOWLEDGMENTS
We thank Jimmy Blackmon, Rose Cannon, and
Ryan Malloy for their help in the field and labo-
ratory. We thank Tom Maddox in the Analytical
Chemistry Laboratory of the Odum School of
Ecology for elemental analyses. This research was
supported by National Science Foundation grants
DEB-9632854 and DEB-0218001 to the Coweeta
LTER Program.
REFERENCES
Ball BA, Hunter MD, Kominoski JS, Swan CM, Bradford MA.
2008. Consequences of non-random species loss for decom-
position dynamics: experimental evidence for additive and
non-additive effects. J Ecol 96:303–13.
Blair JM. 1988. Nitrogen, sulfur and phosphorus dynamics in
decomposing deciduous leaf litter in the southern Appala-
chians. Soil Biol Biochem 20:693–701.
Blair JM, Parmelee RW, Beare MH. 1990. Decay-rates, nitrogen
fluxes, and decomposer communities of single-species and
mixed-species foliar litter. Ecology 71:1976–85.
Brandtberg PO, Lundkvist H. 2004. Does an admixture of Betula
species in Picea abies stands increase organic matter quality and
nitrogen release? Scand J For Res 19:127–41.
Briones MJI, Ineson P. 1996. Decomposition of eucalyptus
leaves in litter mixtures. Soil Biol Biochem 28:1381–8.
Chapman K, Whittaker JB, Heal OW. 1988. Metabolic and
faunal activity in litters of tree mixtures compared with pure
stands. Agric Ecosyst Environ 24:33–40.
Conn C, Dighton J. 2000. Litter quality influences on decom-
position, ectomycorrhizal community structure and mycor-
rhizal root surface acid phosphatase activity. Soil Biol
Biochem 32:489–96.
Cromack K, Monk CD. 1975. Litter production, decomposition,
and nutrient cycling in a mixed hardwood watershed and a
white pine watershed. In: Howell FG, Gentry JB, Smith MH,
Eds. Mineral cycling in southeastern ecosystems. Springfield
(VA): National Technical Information Service. p 609–24.
Drake JM. 2003. Why does grassland productivity increase with
species richness? Disentangling species richness and compo-
sition with tests for overyielding and superyielding in biodi-
versity experiments. Proc R Soc Lond B Biol Sci 270:1713–9.
Dutta RK, Agrawal M. 2001. Litterfall, litter decomposition and
nutrient release in five exotic plant species planted on coal
mine spoils. Pedobiologia 45:298–312.
Ellison AM, Bank MS, Clinton BD, Colburn EA, Elliott K, Ford
CR, Foster DR, Kloeppel BD, Knoepp JD, Lovett GM, Mohan
J, Orwig DA, Rodenhouse NL, Sobczak WV, Stinson KA,
Stone JK, Swan CM, Thompson J, Von Holle B, Webster JR.
2005. Loss of foundation species: consequences for the
structure and dynamics of forested ecosystems. Front Ecol
Environ 3:479–86.
Engelhardt KAM, Ritchie ME. 2001. Effects of macrophyte
species richness on wetland ecosystem functioning and ser-
vices. Nature 411:687–9.
Fei SL, Steiner KC. 2007. Evidence for increasing red maple
abundance in the eastern United States. Forest Sci 53:473–7.
Fyles JW, Fyles IH. 1993. Interaction of douglas-fir with red
alder and salal foliage litter during decomposition. Can J For
Res 23:358–61.
Gartner TB, Cardon ZG. 2004. Decomposition dynamics in
mixed-species leaf litter. Oikos 104:230–46.
Gartner TB, Cardon ZG. 2006. Site of leaf origin affects how
mixed litter decomposes. Soil Biol Biochem 38:2307–17.
Grime JP. 1998. Benefits of plant diversity to ecosystems:
immediate, filter and founder effects. J Ecol 86:902–10.
Grimshaw HM, Allen SE, Parkinson JA. 1989. Nutrient ele-
ments. In: Allen SE, Ed. Chemical analysis of ecological
materials. Boston: Blackwell Scientific Publications. p 81–159.
Gross K, Cardinale BJ. 2005. The functional consequences of
random vs. ordered species extinctions. Ecol Lett 8:409–18.
Hattenschwiler S, Tiunov AV, Scheu S. 2005. Biodiversity and
litter decomposition in terrestrial ecosystems. Annu Rev Ecol
Evol Syst 36:191–218.
Heneghan L, Coleman DC, Crossley DA, Zou XM. 1999. Nitrogen
dynamics in decomposing chestnut oak (Quercus prinus L.) in
mesic temperate and tropical forest. Appl Soil Ecol 13:169–75.
Litter Diversity and Nutrient Dynamics 99

Hobbie SE, Vitousek PM. 2000. Nutrient limitation of decom-
position in Hawaiian forests. Ecology 81:1867–77.
Hooper DU, Vitousek PM. 1998. Effects of plant composition and
diversity on nutrient cycling. Ecol Monogr 68:121–49.
Johnson MTJ, Lajeunesse MJ, Agrawal AA. 2006. Additive and
interactive effects of plant genotypic diversity on arthropod
communities and plant fitness. Ecol Lett 9:24–34.
Jones JB Jr, Wolf B, Mills HA. 1991. Organic matter destruction
procedures. Plant analysis handbook: a practical sampling,
preparation, analysis, and interpretation guide. Athens (GA):
Micro-Macro Publishing, p 195–6.
Kaneko N, Salamanca EF. 1999. Mixed leaf litter effects on
decomposition rates and soil microarthropod communities in
an oak-pine stand in Japan. Ecol Res 14:131–8.
King RF, Dromph KM, Bardgett RD. 2002. Changes in species
evenness of litter have no effect on decomposition processes.
Soil Biol Biochem 34:1959–63.
Klemmedson JO. 1992. Decomposition and nutrient release
from mixtures of gambel oak and ponderosa pine leaf litter.
For Ecol Manage 47:349–61.
Kominoski JS, Pringle CM, Ball BA, Bradford MA, Coleman DC,
Hall DB, Hunter MD. 2007. Nonadditive effects of leaf litter
species diversity on breakdown dynamics in a detritus-based
stream. Ecology 88:1167–76.
Kwabiah AB, Stoskopf NC, Voroney RP, Palm CA. 2001. Nitro-
gen and phosphorus release from decomposing leaves under
sub-humid tropical conditions. Biotropica 33:229–40.
Larsen TH, Williams NM, Kremen C. 2005. Extinction order and
altered community structure rapidly disrupt ecosystem func-
tioning. Ecol Lett 8:538–47.
Lisanework N, Michelsen A. 1994. Litterfall and nutrient release
by decomposition in 3 plantations compared with a natural
forest in the Ethiopian Highland. For Ecol Manage 65:149–64.
Loreau M, Naeem S, Inchausti P, Bengtsson J, Grime JP, Hector
A, Hooper DU, Huston MA, Raffaelli D, Schmid B, Tilman D,
Wardle DA. 2001. Biodiversity and ecosystem functioning:
current knowledge and future challenges. Science 294:804–8.
Lovett GM, Weathers KC, Arthur MA, Schultz JC. 2004. Nitro-
gen cycling in a northern hardwood forest: do species matter?
Biogeochemistry 67:289–8.
Madritch MD, Cardinale BJ. 2007. Impacts of tree species
diversity on litter decomposition in northern temperate forests
of Wisconsin, USA: a multi-site experiment along a latitudinal
gradient. Plant Soil 292:147–59.
McTiernan KB, Ineson P, Coward PA. 1997. Respiration and
nutrient release from tree leaf litter mixtures. Oikos 78:527–
38.
Melillo JM, Aber JD, Linkins AE, Ricca A, Fry B, Nadelhoffer KJ.
1989. Carbon and nitrogen dynamics along the decay con-
tinuum—plant litter to soil organic-matter. Plant Soil
115:189–98.
Mikola J, Salonen V, Setala H. 2002. Studying the effects of plant
species richness on ecosystem functioning: does the choice of
experimental design matter? Oecologia 133:594–8.
Moore TR, Trofymow JA, Prescott CE, Fyles J, Titus BD. 2006.
Patterns of carbon, nitrogen and phosphorus dynamics in
decomposing foliar litter in Canadian forests. Ecosystems
9:46–62.
Orwig DA, Foster DR. 1998. Forest response to the introduced
hemlock woolly adelgid in southern New England, USA. J
Torrey Bot Soc 125:60–73.
Pandey RR, Sharma G, Tripathi SK, Singh AK. 2007. Litterfall,
litter decomposition and nutrient dynamics in a subtropical
natural oak forest and managed plantation in northeastern
India. For Ecol Manage 240:96–104.
Parton W, Silver WL, Burke IC, Grassens L, Harmon ME, Currie
WS, King JY, Adair EC, Brandt LA, Hart SC, Fasth B. 2007.
Global-scale similarities in nitrogen release patterns during
long-term decomposition. Science 315:361–4.
Prescott CE. 2005. Decomposition and mineralization of nutrients
from litter and humus. In: BassiriRad H, Ed. Nutrient acquisi-
tion by plants. Berlin Heidelberg: Springer-Verlag. p 15–41.
Rizzo DM, Garbelotto M, Davidson JM, Slaughter GW, Koike ST.
2002. Phytophthora ramorum as the cause of extensive
mortality of Quercus spp. and Lithocarpus densiflorus in
California. Plant Dis 86:205–14.
Rustad LE. 1994. Element dynamics along a decay continuum in
a red spruce ecosystem in Maine, USA. Ecology 75:867–79.
Salamanca EF, Kaneko N, Katagiri S. 1998. Effects of leaf litter
mixtures on the decomposition of Quercus serrata and Pinus
densiflora using field and laboratory microcosm methods. Ecol
Eng 10:53–73.
Schimel JP, Hattenschwiler S. 2007. Nitrogen transfer between
decomposing leaves of different N status. Soil Biol Biochem
39:1428–36.
Schlapfer F, Pfisterer AB, Schmid B. 2005. Non-random species
extinction and plant production: implications for ecosystem
functioning. J Appl Ecol 42:13–24.
Seastedt TR. 1984. The role of microarthropods in decomposition
and mineralization processes. Annu Rev Entomol 29:25–46.
Singh KP, Singh PK, Tripathi SK. 1999. Litterfall, litter decom-
position and nutrient release patterns in four native tree
species raised on coal mine spoil at Singrauli, India. Biol Fertil
Soils 29:371–8.
Smith MD, Knapp AK. 2003. Dominant species maintain eco-
system function with non-random species loss. Ecol Lett
6:509–17.
Spehn EM, Scherer-Lorenzen M, Schmid B, Hector A, Caldeira
MC, Dimitrakopoulos PG, Finn JA, Jumpponen A, O’Don-
novan G, Pereira JS, Schulze ED, Troumbis AY, Korner C.
2002. The role of legumes as a component of biodiversity in a
cross-European study of grassland biomass nitrogen. Oikos
98:205–18.
Swift, MJ, Heal, OW, Anderson, JM. 1979. Decomposition in
terrestrial ecosystems. Los Angeles: University of California
Press. 361p.
Vitousek PM, Aber JD, Howarth RW, Likens GE, Matson PA,
Schindler DW, Schlesinger WH, Tilman DG. 1997. Human
alteration of the global nitrogen cycle: sources and conse-
quences. Ecol Appl 7:737–50.
Wardle DA, Bonner KI, Nicholson KS. 1997. Biodiversity and
plant litter: experimental evidence which does not support the
view that enhanced species richness improves ecosystem
function. Oikos 79:247–58.
Williams BL, Alexander CE. 1991. Interactions on mixing litters
from beneath Sitka spruce and Scots pine and the effects on
microbial activity and N-mineralization. Soil Biol Biochem
23:71–5.
Yang YS, Guo JF, Chen GS, Xie JS, Cai LP, Lin P. 2004. Litterfall,
nutrient return, and leaf-litter decomposition in four planta-
tions compared with a natural forest in subtropical China.
Ann For Sci 61:465–76.
100 B. A. Ball and others


