© 2006 International Monetary Fund May 2006
IMF Country Report No. 06/173
Nicaragua: Selected Issues
This Selected Issues paper for Nicaragua was prepared by a staff team of the International Monetary Fund as background documentation for the periodic consultation with the member country. It is based on the information available at the time it was completed on December 27, 2005. The views expressed in this document are those of the staff team and do not necessarily reflect the views of the government of Nicaragua or the Executive Board of the IMF. The policy of publication of staff reports and other documents by the IMF allows for the deletion of market-sensitive information.
To assist the IMF in evaluating the publication policy, reader comments are invited and may be sent by e-mail to [email protected].
Copies of this report are available to the public from
International Monetary Fund ● Publication Services 700 19th Street, N.W. ● Washington, D.C. 20431
Telephone: (202) 623 7430 ● Telefax: (202) 623 7201 E-mail: [email protected] ● Internet: http://www.imf.org
Price: $15.00 a copy
International Monetary Fund
Washington, D.C.


INTERNATIONAL MONETARY FUND
NICARAGUA
Selected Issues
Prepared by S. Martin, J. Prat (both WHD), J.F. Dauphin (PDR), and A. Simone (FAD)
Approved by Western Hemisphere Department
December 27, 2005
Contents Page I. The Impact of CAFTA-DR on the Nicaraguan Economy .............................................2 A. What is CAFTA-DR? ..............................................................................................2 B. Main Features of Nicaragua Trade ..........................................................................3 C. Trade, Growth, and Business Cycles .......................................................................7 D. Fiscal Impact............................................................................................................8 E. Conclusions............................................................................................................10 II. Public Sector Employment and Compensation in Nicaragua ......................................12 A. Recent Trends ........................................................................................................12 B. Structure of the Public Sector and Institutional Features of Compensation and Employment Policies ......................................................................................14 C. Issues for Discussion..............................................................................................18 D. Conclusions............................................................................................................22 III. Nicaragua—Perspectives on the Monetary Framework ..............................................27 A. Introduction............................................................................................................27 B. Historical Context ..................................................................................................27 C. Recent Design and Conduct of Monetary Policy...................................................31 D. Medium-term Policy Challenges ...........................................................................33 Appendices II. Table 1. Number of Government Employees by Government Bodies ........................23 Table 2. Progress in Job Classification in Affected Institutions as a Share of the Total Number of Positions.................................................................................25 Table 3. Number of Positions and Employment for a Subset of Public Institutions ...26

- 2 -
I. THE IMPACT OF CAFTA-DR ON THE NICARAGUAN ECONOMY1
1. Expected to promote new development opportunities to its members, the Central America–Dominican Republic-United States Free Trade Agreement (CAFTA-DR) represents a significant change in the macro-economic environment of Central America. This chapter provides an overview of what recent studies say about the expected macroeconomic impact of the Agreement. Section A presents its main features. Section B describes Nicaragua’s trade and economic relations with the other members of CAFTA-DR. Section C reviews the expected impact on trade, growth, and business cycles. Finally, section D analyzes the fiscal impact.
A. What is CAFTA-DR?
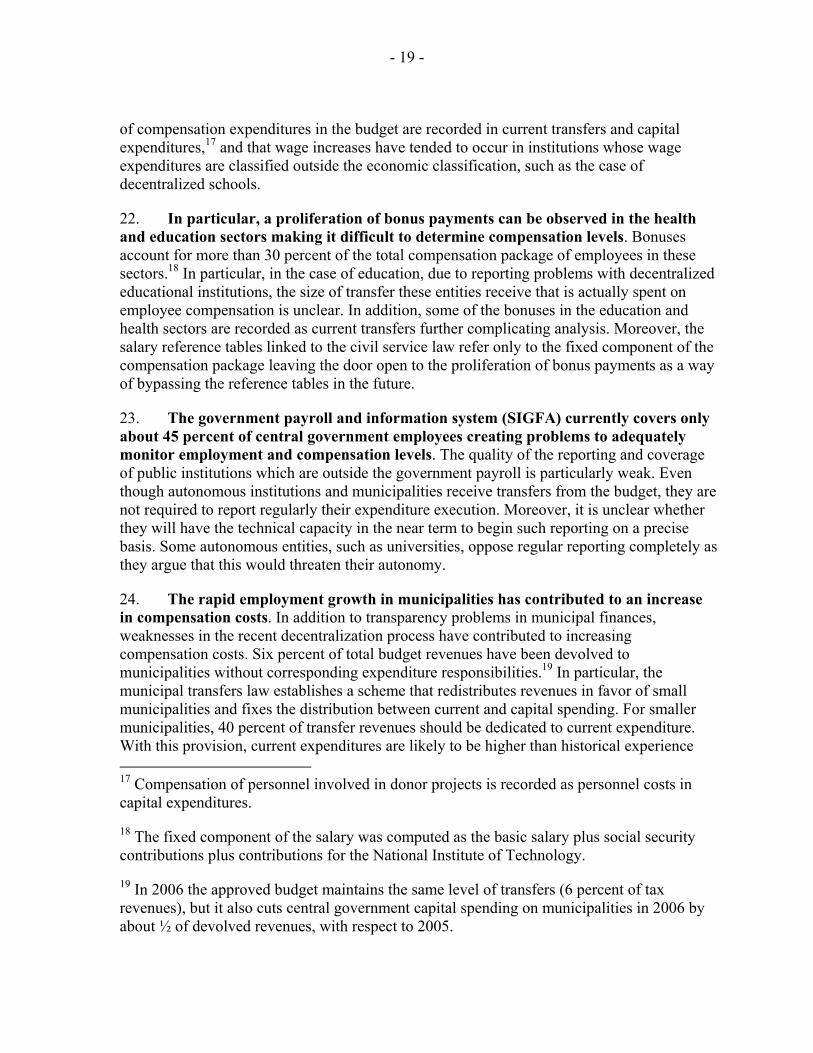
2. CAFTA-DR was signed on May 28, 2004 between the United States and Costa Rica, El Salvador, Guatemala, Honduras, and Nicaragua; the Dominican Republic joined on August 5, 2004.2 Its stated objectives are to (i) encourage expansion and diversification of trade between signatories; (ii) eliminate barriers to trade; (iii) promote conditions for fair competition; (iv) increase investment opportunities; (v) protect and enforce intellectual property rights; (vi) create procedures for the resolution of disputes; and (vii) establish a framework for further integration. As of December 2005, all countries except Costa Rica had ratified the Treaty, whose implementation is scheduled to start in early 2006.3
3. The scope of the agreement is wide and goes beyond only trade in goods. In addition to the phased liberalization of trade in goods, CAFTA-DR provides broad market access for services and includes provisions in areas such as intellectual property rights, investment, government procurement, and competition policies. Labor provisions are slightly tighter than under other similar agreements by offering a platform to examine the quality of existing legislation, rather than only ensuring its implementation. However, the investment provisions do not appear to contain mechanisms to offset the potential impact on the balance of payments of transfers related to a wide range of financial and direct investments. The Treaty also provides dispute resolution procedures. CAFTA-DR comes with a commitment from the United States to provide technical assistance in the areas of sanitary and technical standards, regulation, and financial sector supervision.
1 Prepared by Jean-François Dauphin.
2 In addition, on February 18, 2005, members signed an Environmental Cooperation Agreement and an Understanding Regarding the Establishment of a Secretariat for Environmental Matters under the CAFTA-DR, with a view to establishing a framework for cooperation in environmental protection.
3 Nicaragua’s National Assembly approved the Treaty on October 10, 2005.

- 3 -
4. CAFTA-DR provides a general framework for country specific bilateral agreements. While CAFTA-DR is a regional agreement under which all parties will be subject to the same set of obligations and commitments, specific provisions and, in particular, tariff elimination schedules, were negotiated on a bilateral basis between the U.S. and each country. CAFTA-DR does not incorporate provisions for intra-Central American integration.
5. The tariff elimination schedule depends on the countries and products. CAFTA-DR classifies each traded good into one of eight categories (labeled A though H), which define the period over which duties will be eliminated and the schedule of tariff reductions. Many goods will be zero rated immediately (schedule A), while the tariffs on others will be phased out over 5 to 20 years. On the U.S. side, all nonagricultural and nontextile goods will enter the U.S. duty free from day one of the implementation of the Treaty. On the Central American side, each country has a different allocation of goods to the eight categories, and hence a different time profile of tariff reduction. In the case of Nicaragua, only 4.4 percent of total imports and 16.7 percent of imports from the U.S. fall into the schedule A category. This is the lowest share in the region. In the case of Costa Rica, for instance, 99.5 percent of imports from the U.S. are schedule A imports.
6. Enhanced market access to the U.S. for Central American agriculture and textile products is somewhat more limited than for other products. The agreement comprises long transition periods (up to 20 years) for several agricultural goods, and maintains import tariffs on sensitive items (such as sugar and corn), while increasing related import quotas. For textiles, the main changes will be the permanent nature of the existing preferences under the Caribbean Basin Initiative (CBI) and an easing of the rules of origin.
B. Main Features of Nicaragua Trade
7. For Nicaragua, CAFTA-DR represents one more step along the path of trade liberalization, regional integration, and increasing linkages to the U.S. that started more than a decade ago. By any standard, Nicaragua’s economy is now largely open. Exports and imports of goods and services represented 36 percent and 63 percent of GDP respectively in 2004.
8. Nicaragua’s trade openness reflects the country’s participation in several regional and bilateral trade agreements. Nicaragua is a member of the Central American Common Market (CACM, since 1960), the System of Central American Integration (SICA, 1993), the Free Trade Area of the Americas (FTAA, 1995), and the Caribbean Basin Trade Partnership Act (CBTPA, 2000). It also signed a bilateral agreement with Mexico (1998) and the CACM has a trade agreement with Chile. As a result of these agreements, Nicaragua is strongly
30
40
50
60
70
80
90
100
110
94 95 96 97 98 99 00 01 02 03 04
Figure 1. (Exports+Imports)/GDP, 1994-2004 (percent)
- 4 -
integrated with other countries in Central America. The region as a whole has an open trade regime and, to a large extent, a common external tariff. In addition, Central America has been benefiting from preferential access to the U.S. market in the context of the CBI since 1984.
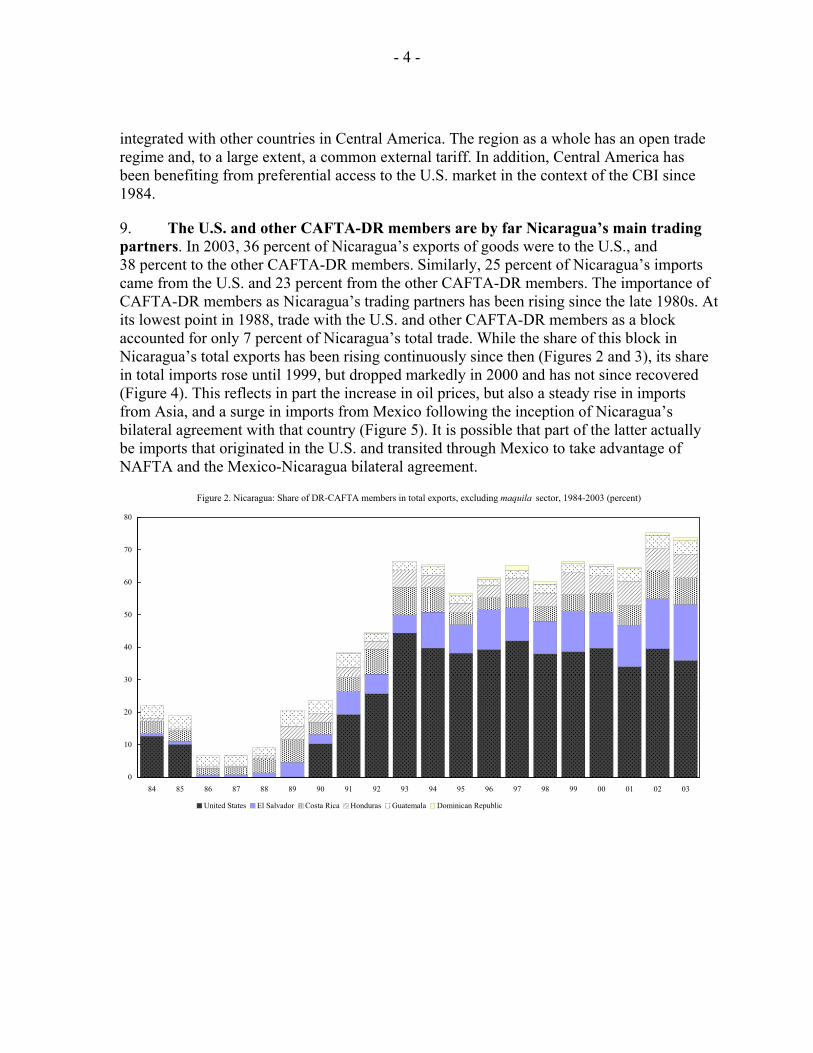
9. The U.S. and other CAFTA-DR members are by far Nicaragua’s main trading partners. In 2003, 36 percent of Nicaragua’s exports of goods were to the U.S., and 38 percent to the other CAFTA-DR members. Similarly, 25 percent of Nicaragua’s imports came from the U.S. and 23 percent from the other CAFTA-DR members. The importance of CAFTA-DR members as Nicaragua’s trading partners has been rising since the late 1980s. At its lowest point in 1988, trade with the U.S. and other CAFTA-DR members as a block accounted for only 7 percent of Nicaragua’s total trade. While the share of this block in Nicaragua’s total exports has been rising continuously since then (Figures 2 and 3), its share in total imports rose until 1999, but dropped markedly in 2000 and has not since recovered (Figure 4). This reflects in part the increase in oil prices, but also a steady rise in imports from Asia, and a surge in imports from Mexico following the inception of Nicaragua’s bilateral agreement with that country (Figure 5). It is possible that part of the latter actually be imports that originated in the U.S. and transited through Mexico to take advantage of NAFTA and the Mexico-Nicaragua bilateral agreement.
Figure 2. Nicaragua: Share of DR-CAFTA members in total exports, excluding maquila sector, 1984-2003 (percent)
0
10
20
30
40
50
60
70
80
84 85 86 87 88 89 90 91 92 93 94 95 96 97 98 99 00 01 02 03
United States El Salvador Costa Rica Honduras Guatemala Dominican Republic

- 5 -
Figure 3. Nicaragua: Share of main trading partners in total exports, excluding maquila sector, 1984-2003 (percent)
0
10
20
30
40
50
60
70
80
84 85 86 87 88 89 90 91 92 93 94 95 96 97 98 99 00 01 02 030
10
20
30
40
50
60
70
80
European Union Mexico Canada CAFTA-DR (right scale)
Figure 4. Nicaragua: Share of DR-CAFTA members in total imports, excluding maquila sector, 1984-2003 (percent)
0
10
20
30
40
50
60
70
84 85 86 87 88 89 90 91 92 93 94 95 96 97 98 99 00 01 02 03
United States Costa Rica Guatemala El Salvador Honduras Dominican Republic

- 6 -
Figure 5. Nicaragua: Share of main trading partners in non-oil imports, excluding maquila sector, 1984-2003 (percent)
0
5
10
15
20
25
30
35
40
45
84 85 86 87 88 89 90 91 92 93 94 95 96 97 98 99 00 01 02 030
10
20
30
40
50
60
70
80
Asia Japan Mexico European Union CAFTA-DR (right scale)
10. Outside of the maquila sector, Nicaragua exports mainly food products (Figure 6). Raw agriculture products, livestock, meat, seafood, and processed food account for three-fourth of total exports of goods (excluding maquilas). 4 Coffee and meat are the main export products (17 percent and 15 percent of exports respectively in 2004), followed by shrimp and lobsters (11 percent). Manufactured products, including processed food other than meat, account for a third of total exports. In addition, net inflows from the maquila sector amount to 22 percent of receipts of exports of goods.
11. By contrast, Nicaragua imports mainly manufactured goods and oil products. In 2004, the latter accounted for 19 percent of all imports of goods, while consumer goods accounted for 33 percent, intermediate non-oil goods 29 percent, and capital goods 18 percent.
4 Maquilas are factories where imported inputs are assembled into final or semi-final goods that are themselves exported.
1/ Excluding maquilas
Figure 6. Nicaragua: Exports by sectors, 2004 1/
Mineral6%
Processed food16%
Seafood12%
Nonfood manufactured
products15%
Raw agriculture products
32%
Livestock and meat19%
Source: BCN

- 7 -
12. Foreign direct investment (FDI) to Nicaragua has increased significantly in recent years. While it was almost nil in the 1980s, FDI rose to an estimated 4 percent of GDP in 2004. FDI inflows from the U.S. doubled from 1999 to 2002 to US$242 million.5 The scarcity of reliable data prevents a comprehensive analysis of financial capital flows between Nicaragua and other members of CAFTA-DR.
C. Trade, Growth, and Business Cycles 6
13. CAFTA-DR is likely to have substantial macroeconomic implications for Nicaragua, but the extent of these implications is difficult to assess ex ante. While the overall macroeconomic impact is expected to be positive, the literature and empirical studies are often inconclusive regarding the size, and sometimes even the sign, of detailed impacts through the various transmission channels. This section discusses the potential impacts on trade flows, foreign direct investment, economic growth, and the business cycle. The section following examines the fiscal impact.
14. Trade flows between Nicaragua and the United States could increase rapidly as a result of CAFTA-DR. Simulations using a multi-country general equilibrium model estimate that the exports of Central American countries to the U.S. could increase by 28 percent after the inception of CAFTA-DR, mainly spearheaded by textile, clothing, and processed agricultural exports. This is consistent with Mexico’s experience under the North America Free Trade Agreement (NAFTA). Mexico’s exports to the U.S. rose by more than 50 percent in U.S. dollar terms in the two years following the inception of NAFTA. Other studies argue that growth in trade flows could be even larger because of the impact of CAFTA-DR on productivity and specialization patterns, resulting from the various provisions of the agreement with regards flows of investment, financial services, and intellectual property.
15. CAFTA-DR could also contribute to an increased diversification of Nicaragua’s trade base. Evidence for this is again provided by the experience of Mexico under NAFTA. After the inception of NAFTA, Mexico’s pace of export diversification accelerated. Vertical integration increased, with member countries of NAFTA increasingly specializing in particular stages of the production process, in particular in the context of the maquilas. Intra-industry and intra-firm trade also rose significantly and contributed to trade diversification. CAFTA-DR is likely to have a similar effect on Nicaragua, which has already started to diversify its trade base.
5 Source: U.S. Department of Commerce, Bureau of Economic Analysis, in Kose, Rebucci, and Schipke (2005). Data is not reconciled with the balance of payment data from the Central Bank of Nicaragua.
6 Kose, Rebucci, and Schipke (2005) is the main source for this section. References to studies cited here can be found at the end of the section.

- 8 -
16. FDI flows to Nicaragua are also likely to be boosted by CAFTA-DR. Recent studies show that NAFTA significantly increased the volume of FDI to Mexico, partly because of the increased vertical specialization, as well as the agreement’s effect on Mexico’s commitment to liberalization and reform programs. CAFTA-DR is expected to have a similar effect. In addition, it could help attract foreign multinational corporations to Central American countries, as NAFTA did to Mexico.
17. CAFTA-DR is expected to enhance the growth performance of Central American. Some estimates suggest that GDP in the region could be higher by 1.5 percent as a result of the impact on exports. Other studies argue that the impact could be larger, owing to the dynamic effects of higher capital accumulation resulting from increased FDI, changes in specialization patterns, and stronger productivity. However, for the full growth potential to materialize, the agreement needs to go along with sustained structural reforms, including a strengthening of the institutional framework.
18. CAFTA-DR is also likely to reduce macroeconomic volatility in the Central American region. While the comovement of business cycles between the U.S. and Central America has substantially increased on average over the past 10 years, CAFTA-DR is likely to lead to further cyclical interdependence through increased trade and financial flows. This implies that shocks originating in the U.S. would play a more prominent role in driving macroeconomic fluctuations in Central America. Since these shocks are generally less volatile than shocks specific to the region, CAFTA-DR is expected to contribute to a more stable macroeconomic environment. Also, an increase in the importance of shocks from the U.S. implies that Central American countries would be faced with more common shocks, which would facilitate the regional coordination of macroeconomic policies.
D. Fiscal Impact7
19. Over the years, Nicaragua’s reliance on trade taxes has been decreasing, thereby reducing the country’s vulnerability to the fiscal impact of CAFTA-DR. Nicaragua’s overall tax performance has been improving gradually since the mid-1900s. The ratio of tax revenue to GDP reached 16 percent in 2004. At the same time, Nicaragua diversified its sources of revenue. While customs duties accounted for some 20 percent of total tax revenues in the early 1990s, their share had fallen to 6 percent by 2004 (1 percent of GDP). Given the share and specialization of
7 This section’s main source is Bronchi and Keen (2005).
Source: Nicaraguan authorities and staff estimates.
Figure 7. Nicaragua: Tax Revenues and Custom Duties
10
12
14
16
18
20
95 96 97 98 99 00 01 02 03 045
10
15
20
Tax revenue (in percent of GDP, left scale)
Custom duties (in percent of tax revenues, right scale)

- 9 -
imports from the U.S., customs duties on U.S. imports accounted for 1.8 percent of total tax revenue (27 percent of import duties) in 2003, equivalent to 0.4 percent of GDP.
20. The magnitude of the fiscal impact will depend on various factors, including trade diversion, import price elasticities, and the overall response of economic activity. The direct effect results from the simple application of the new tariffs to the unchanged import volumes and prices (before custom duties). It arises not only from the impact on tariff revenues, but also on the domestic taxes imposed on tariff-inclusive import values (e.g., VAT and ad valorem excises). Indirect effects result from changes in volume or prices (before tariffs) induced by the implementation of the new tariffs. In particular, CAFTA-DR may lead to trade diversion, with imports from the U.S. replacing those from third countries whose tariffs are not reduced. This, in turn, may have various effects depending on the intensity of the competition between import suppliers. For example, third country exporters may react by cutting their pre-tariff prices by enough to leave their prices after tariffs at the same level as the now tariff-free price of imports from the U.S. In both cases, revenues from customs duties would be lower than that resulting only from the direct effect. On the other hand, the tariff cuts by themselves are expected to increase the demand for imports, which should result in higher volume that would mitigate somewhat the other effects.
21. Of all the signatory countries, Nicaragua is expected to face the smallest fiscal impact.8 Bronchi and Keen (2005) have carried out simulations of the immediate (i.e., first year) fiscal impact of CAFTA-DR, under various scenarios: direct effect only, or combined direct and indirect effects, the latter being assessed under different assumptions regarding the degree of substitutions and intensity of competition. In all cases, because of its low share of schedule A imports, and relatively lower share of U.S. imports, Nicaragua would be the least affected in terms of fiscal impact. The immediate direct impact would range between 0.05 percent and 0.20 percent of GDP, equivalent to 0.23 percent and 0.99 percent of total revenue respectively (Table 1). By contrast, the immediate direct impact could be almost 0.4 percent of GDP in Guatemala, equivalent to 3.6 percent of total revenue.
8 While there have not yet been comprehensive ex ante assessments of the poverty and social impact of CAFTA-DR, Monge-Gonzalez, Castro-Leal and Saavedra Gutiérrez (2005) provides some insights on the possible impact on rural households in the case of Nicaragua.

- 10 -
Table 1. Nicaragua: Revenue Impact of CAFTA-DR First Year
Percent of tax revenue
Percent of GDP
Percent of total revenue
loss
Direct impact only 0.23 0.05 12.71Indirect impact
With no trade diversion 0.28 0.06 ...With 20 percent trade diversion 0.42 0.08 ...With 100 percent trade diversion 0.99 0.20 ...
Source: Bronchi and Keen (2005) 22. Indirect taxes (excises and VAT) have a key role to play in responding to any revenue loss due to the implementation of CAFTA-DR. In Nicaragua, the VAT rate adjustment required to offset the custom duties loss would be quite small in the first year, but would reach almost two percentage points once full liberalization is achieved. This estimate could be reduced to the extent that the VAT efficiency is improved through measures to broaden its base and enhance its administration.
23. CAFTA-DR also strengthens the case for increased tax coordination among participant countries. In particular, the pressure to attract or retain foreign companies that seek to take advantage of the opportunities offered by the Treaty will increase further, and so will the risk to see further corporate tax reduction (direct or indirect through tax holidays and ad hoc exemptions). At a minimum, the adoption of a non-binding code of conduct, the loosest form of corporate tax coordination, would be a useful starting point for discussions.
E. Conclusions
24. CAFTA-DR will have substantial macroeconomic implications for Nicaragua. Though the extent of these implications is difficult to assess ex ante, the overall macroeconomic impact is expected to be positive; CAFTA-DR will enhance the growth performance of the Central American region. The main effects for Nicaragua are likely to be a rapid increase in trade flows with the United States, an increased diversification of the trade base, a boost of FDI inflows, and reduced macroeconomic volatility. Of all the signatory countries, Nicaragua is expected to face the smallest fiscal impact, mainly owing to a favorable schedule of tariff reductions. Sustained structural reforms, including a strengthening of the institutional framework, would ensure that Nicaragua reaps the full benefits of the agreement.

- 11 -
References Bronchi, C. and Keen, M., 2005, “Trade liberalization and tax coordination,” in Central America: Global Integration and Regional Cooperation (Chapter III), IMF occasional paper 243, edited by Markus Rodlauer and Alfred Schipke. CAFTA-DR: the full text, including tariff schedules, is accessible on line at: http://www.ustr.gov/Trade_Agreements/Bilateral/CAFTA/CAFTA-DR_Final_Texts/Section_Index.html Kose, A., Rebucci, A. and Schipke, A., 2005, “Macroeconomic implications of CAFTA,” in Central America: Global Integration and Regional Cooperation (Chapter II), IMF occasional paper 243, edited by Markus Rodlauer and Alfred Schipke. Monge-Gonzalez, R., Castro-Leal, F. and Saavedra Gutiérrez, D., 2005, “Nicaraguan Agriculture and CAFTA,” document to be Published by the Nicaraguan Ministry of the Economy, with technical support by the World Bank and Cosude.

- 12 -
II. PUBLIC SECTOR EMPLOYMENT AND COMPENSATION IN NICARAGUA1
1. Public sector employment and compensation in Nicaragua have grown rapidly in recent years. This reflects a multitude of factors, but as such, compensation spending is consuming a growing share of primary spending and raises concerns for macroeconomic stability, competitiveness, and the flexibility and poverty-orientation of Nicaragua’s budget. Moreover, the magnitude and trend of compensation costs in the public sector are not fully and readily apparent in the budget. Also, growing budget rigidities could constrain the capacity of the government to absorb shocks going forward.
2. The paper examines a number of issues related to public sector employment and compensation in Nicaragua. Section A of the paper looks at recent trends in public compensation in Nicaragua. Section B describes the structure of the public sector in terms of employment and compensation and the institutional features underlying wage and employment policies. Section C discusses the main reasons underlying the high and increasing wage costs, why these developments have not been captured adequately in the economic classification and the implications for the flexibility and poverty-orientation of the budget, and competitiveness. Section D presents some conclusions.
A. Recent Trends
3. The public sector accounts for a large share of formal sector employment. About 40 percent of Nicaragua’s economically active population is engaged in formal sector employment. The rest of the labor force is engaged in small enterprises and other low-skilled activities in the informal sector. Formal sector employment is more concentrated amongst larger firms and the public sector. Indeed, about 20 percent of the formal labor force is hired by the public sector. Hence, public compensation policies are likely to influence employment dynamics, wage setting, and competitiveness in the formal private sector.
4. Total compensation to public sector employees in Nicaragua has been growing in recent years, increasing beyond private sector wages. Compensation expenditures to public employees at the central government level2 are estimated to have grown from about 7.6 percent of GDP in 2000 to about 8.6 percent of GDP in 2005. The 2005 level for the central government wage bill in Nicaragua is about 3 percentage points of GDP higher than the average in Latin America and the Caribbean (LAC).3 Meanwhile, average real wages for
1 Prepared by Jordi Prat and Alejandro Simone.
2 Defined as the sum of compensation expenditures in the main government bodies and autonomous entities. See section B.
3 While cross country comparisons are always fraught with difficulties, an attempt is made here to discuss broadly comparable central government wage bill definitions in the region.

- 13 -
7.5
8.0
8.5
9.0
2001 2002 2003 2004 2005 20063.5
4.0
4.5
5.0
Gross remuneration (LHS)
Economic classification (RHS)
Wage Bill, 2001-2005(in percent of GDP)
the central government grew by 27 percent in the period from 2001–2005, as compared to a drop of 3 percent in the average real wage of the formal private sector.4
5. The growth in total compensation to public sector employees has not been reflected in the economic classification of the budget. The economic classification of the budget shows compensation expenditures at a level of 4 percent of GDP for 2005, slightly below the level of 2001. The discrepancy between total compensation and the economic classification seems to have increased in recent years, reflecting the increased importance of bonuses in public employee compensation. In particular, while the economic classification would have suggested a slight decline in compensation expenditures between 2004 and 2005, compensation expenditures increased by about 0.4 percent of GDP mainly due to a large wage increase approved by the National Assembly for health workers and teachers in 2005 that was paid out in the form of a bonus.
4 Both wage series are derived from the social security institute database and are based on the same definition of compensation. Even though compensation could be defined more broadly, there is no evidence to conclude that these elements have systematically behaved differently in the last years. Furthermore, this appears to be the most comprehensive data series available. For example, the ministry of labor’s database includes private sector firms with more than 20 employees, while INSS’s database includes every private sector employee that contributes to social security.
2.9
3.2
3.5
3.8
Jan-01 Jul-01 Jan-02 Jul-02 Jan-03 Jul-03 Jan-04 Jul-04 Jan-052.9
3.2
3.5
3.8
Public Sector
Private Sector
Evolution of Public and Private Average Real Wages, Mar. 01-May 05(2004 C$ thousand per month)
7.0
7.4
7.8
8.2
8.6
9.0
2000 2001 2002 2003 2004 2005 20067.0
7.4
7.8
8.2
8.6
9.0Gross compensation of Public Sector, 2001-2005(in percent of GDP)

- 14 -
B. Structure of the Public Sector and Institutional Features of Compensation and Employment Policies
Size and Structure of Public Employment
6. The public sector in Nicaragua is estimated to account for more than 1/5 of formal sector employment in 2005. Within this overall level of employment, the general government5 is estimated to comprise about 9 percent of total non-agricultural employment. While the latter does not seem large with respect to the LAC average of about 21 percent, it is more than 20 percent of formal sector employment. As such, the public sector is a significant player in the formal labor market.
7. The central government comprises a variety of entities. The definition of central government used in this paper is composed of the Presidency and Vice-Presidency, 12 central line ministries of the executive branch6 which are in charge of designing and defining policies, 29 decentralized institutions7 that are in charge of assisting policy implementation, public universities8 and five institutions pertaining to other government powers.9
5 Public sector employment is defined as the sum of employment in the main bodies of government, autonomous institutions, public sector financial institutions and local governments as defined in Appendix Table 1 (about 123,000 employees) plus employment in public enterprises estimated at 18,662 in the employment survey of November 2004. Most of the data in Appendix Table 1 was obtained from the social security agency (INSS) and the Central Bank of Nicaragua. Some potential discrepancies between sources remain in employment in decentralized entities and local governments.
6 Given the magnitude in terms of employment, Appendix Table 1 also shows decentralized schools separately and not in the figures of the Ministry of Education. Law 290 on the organization of the executive branch gives these institutions technical autonomy to provide educational services, but they are not considered independent legal entities. They are directly subordinated to the Ministry of Education and receive transfers from the budget.
7 Unlike decentralized institutions, according to Law 290, autonomous institutions have technical and administrative autonomy. This means that they are considered independent legal entities, and in particular, can determine their own level of wages. The level of employment legally must be within the ceiling of the number of positions determined by the budget. They report either to a parent line ministry or to the president of the republic. These institutions also receive transfers from the budget.
8 Universities are also decentralized entities and are mostly funded by the budget. The specific share of financing from the budget to universities dedicated to compensation is not available as no financial information is available on these institutions.

- 15 -
8. The central government accounts for 77 percent of public sector employment, reflecting a fairly centralized structure of government.10 The central government hires most public employees and undertakes most investment projects. The local governments are composed of regional governments, councils and municipalities––altogether accounting for 9 percent of total public employment in 2005. Municipalities employ about 96 percent of total local government employees. Public employees in government financial institutions and public enterprises account for the rest of public sector employment.
9. There have been significant differences in employment growth between the central government and local governments. Central government employment grew about 7 percent in the period 2000-05 maintaining a roughly constant ratio as a share of the population of about 2 percent, similar to the LAC average of about 2.5 percent. However, employment in regional governments and municipalities grew by 46 percent in the same period mainly driven by increases in employment in municipalities. The growth in employment in municipalities can in part be attributed to increases in government transfers as part of Nicaragua’s decentralization process. However, an important weakness of the decentralization framework is that revenue transfers have not been explicitly linked to expenditure responsibilities.
Structure of compensation across and within institutions in the public sector
10. There are significant differences in average compensation levels across public institutions. Autonomous entities and institutions of other powers of state11 have compensation levels that differ significantly from the line ministries, which are under direct payroll control by the Ministry of Finance (MOF). The former entities have significantly more discretion to set their compensation levels. More specifically, autonomous entities and the powers of the state have average compensation levels that are more than twice as high as in line ministries.
9 These include the National Assembly, the Supreme Court, the Supreme Electoral Council, the Comptroller office of the Republic of Nicaragua and the Attorney General Office of the Republic of Nicaragua.
10 Caution needs to be exercised when interpreting local government data. Data on local governments was obtained indirectly from the INSS database since direct information from the local governments was not available.
11 Other powers of the state include the Supreme Court, the Presidency and Vice-presidency of the Republic, the National Assembly, the Electoral Council, and Comptroller General of the Republic, and the Office of the Attorney General.
Average Wage
2003 2004 2005Powers of the State 10,479 10,358 11,367Line Ministries 3,940 4,140 4,584Autonomous Entities 10,734 9,260 10,215State Financial Institutions 11,227 12,253 13,497Local Governments 5,220 5,409 5,926Source: INSS and CBN
(in cordobas per month excluding social contributions and 13th month salary)

- 16 -
11. The presence of donor projects in specific institutions also contributes to observed disparities in compensation levels. In certain institutions with significant donor projects, salaries for both technical and high level positions are indexed to the dollar and tend to be relatively high. A significant part of the wage bill in autonomous entities is financed by donors. In 2005, more than half of the budgeted compensation expenditures in these institutions were related to donor projects.
12. The differences in compensation are also important within public institutions. A recent study commissioned by the World Bank Civil service reform project in Nicaragua covering 12 public sector institutions12 argues that public sector institutions in Nicaragua tend to have competitive salaries at lower-level positions, while technical and managerial positions are underpaid with respect to the formal private sector.13 In addition, the study shows that it is common for positions that require similar skill levels to be paid differently, especially at high levels of complexity. Further, it is not atypical that positions at lower levels of complexity be paid more than more complex ones.
Institutional Features of Compensation and Employment Policies
13. Nicaragua does not have a consistent employment and compensation policy in the public sector. Before 2003, the determination of wages and employment in public institutions was based exclusively on the availability of funds and discretionary decisions on how to allocate these. In addition, anecdotal evidence suggests that significant staffing changes normally occur after elections at all levels of government. This lack of consistent compensation and employment policies has been reflected in significant differences within and across institutions, and in the evolution in the levels of employment at the central and local government level.
14. In 2003, the government passed a civil service law to modernize and formalize compensation and employment policies. The law establishes the government entities that are in charge of civil service issues and their responsibilities led by the MOF, employment eligibility criteria for the civil service, rights, obligations and a disciplinary regime for civil servants, a system of job classification, and a compensation system which should reflect the principles of equity (same pay for same job) and competitiveness of remuneration with 12 These institutions are the following ministries: Health, Finance, Labor, Agriculture and Forestry, Family, Environment and Natural Resources, Transportation and Infrastructure, and Industry and Commerce; and these autonomous entities: Nicaraguan Institute for Women, Institute for Youth and Sports, Nicaraguan Institute for Territorial Studies and Nicaraguan Institute for Culture. These institutions represent about 24 percent of central government employment.
13 In fact, there is a possibility for lower level positions to be overpaid with respect to the private sector. The study clarifies that the analysis only focuses only on fixed remuneration and does not include variable remuneration which, unlike in the private sector, seems to be quite prevalent at lower level positions in the public sector.

- 17 -
respect to other public sector institutions and the private sector. In addition, the law creates career paths for civil servants on the basis of merit and requires the creation and maintenance of an up to date database on civil service personnel for adequate human resource management.
15. In 2004, there were policy efforts to create a compensation system in line with the principles laid out in the civil service law. According to the job classification system laid out in the civil service law, positions should be classified according to their level of complexity. On the basis of a comparison of basic salaries within public sector institutions and within the private sector for jobs with the same level of complexity,14 a base reference salary table for 2005 and a target salary reference table to be implemented in the medium term were established. The base reference salary table for 2005 was designed to make salaries more equitable within and across public sector institutions. The target wage reference table was set at 70 percent of the median of comparable formal private sector salaries. Specifically, in order to reduce inequities and advance toward the structure of the target reference salary table, the nominal salaries of employees whose salaries were above the reference salary would be frozen for as long as they remained above the reference, while the salaries of those employees with salaries below the reference would be adjusted by a fixed percentage in line with an overall resource constraints.
16. However, the methodology outlined in the civil service law does not apply to the main sectors of public employment. The reference table is not applied to health, education, the police or the army, which together represent about 80 percent of total central government employment.15 Some of these sectors (such as police, army personnel and teachers) have their own employment policies, pay scales, or their own job classification has proceeded slowly (Appendix Table 3). Wages in these key sectors continue to be determined by individual negotiations with the government and/or the Assembly.
17. The MOF has the responsibility to control the level of employment in most of the general government, but in practice this is limited. Control is likely to be limited to a subset of institutions for which the MOF has information on the number of positions, employment and where it has the capacity to monitor execution of the budget on a real time basis.16 Information is limited on temporary workers not funded through donor projects and on the number of political appointees. Donor project employment information remains limited (especially in projects executed by autonomous agencies), although a census on this topic is ongoing.
14 The reference table is based on information gathered from the same 12 public sector institutions described in footnote 12.
15 In addition, the reference table is still not applied in many autonomous institutions as positions have not been classified yet.
16 Appendix Table 3 suggests that the number of employees covered may include less than 50 percent of the total employees.

- 18 -
18. A rigid labor code makes adjustments in public employment and compensation policies difficult. In particular, the Law of Acquired Rights establishes than any benefit, including pay, given to any employee in the past cannot be eliminated or reduced, thereby becoming an “acquired right” for the worker. This law gives the worker the right to sue the government if it attempts to reduce compensation levels even if the conditions that underlay the original agreement are no longer realistic or relevant. This law also applies to donor financed consultants whose contracts have been renewed more than twice, creating a significant contingent liability for the government.
C. Issues for Discussion
Main reasons underlying the high and increasing remuneration costs
19. The key difficulties in implementing consistent employment and compensation policies relate to broader issues of executive control. There are three main problems. First, the constitution gives the Assembly discretionary powers to change the overall budget ceiling and the composition of spending that is proposed by the executive. Second, the MOF cannot scrutinize the budgets of autonomous entities and therefore is not able to constrain their employment and compensation proposals. Third, the judiciary and public universities are funded by fixed, constitutionally mandated, transfers from the budget (defined as percentages of total government expenditures), which limits the ability of the government to spend on poverty reduction. These entities cannot be controlled by the MOF, which allows them to increase employment and wages on a discretionary basis.
20. Limited executive control entails significant risks for the budget. The highly politicized negotiations of wage increases results in situations where a compromise is agreed upon without careful consideration of costs and implications for the macroeconomic framework. This has resulted in large wage increases, as well organized groups of public employees lobby the Assembly for higher wages while bypassing the MOF. For example, during negotiations of the 2005 budget, the Assembly approved significant salary increases for health workers and teachers, implying a 0.4 percent of GDP increase in remuneration expenditures.
21. The limited coverage of the economic classification makes it more difficult to quantify these risks. In spite of growth in compensation expenditures to public employees by 1.1 percent of GDP since 2000 to a level of 8.5 percent of GDP in 2006, the economic classification of the budget shows compensation expenditures at a level of 4 percent of GDP for 2005, slightly below the level of 2001. These discrepancies reflect that more than 50 percent
0
3
6
9
0
3
6
9
2005 Budget Decomposition(in percent of GDP)
1
2
3
4
1: Wages and salaries in economic classification (4.0)2: Other compensaiton in current expenditures (1.8)3: Other compensaiton in capital expenditures (0.8)4: Wages and salaries in current transfers (2.0)
- 19 -
of compensation expenditures in the budget are recorded in current transfers and capital expenditures,17 and that wage increases have tended to occur in institutions whose wage expenditures are classified outside the economic classification, such as the case of decentralized schools.
22. In particular, a proliferation of bonus payments can be observed in the health and education sectors making it difficult to determine compensation levels. Bonuses account for more than 30 percent of the total compensation package of employees in these sectors.18 In particular, in the case of education, due to reporting problems with decentralized educational institutions, the size of transfer these entities receive that is actually spent on employee compensation is unclear. In addition, some of the bonuses in the education and health sectors are recorded as current transfers further complicating analysis. Moreover, the salary reference tables linked to the civil service law refer only to the fixed component of the compensation package leaving the door open to the proliferation of bonus payments as a way of bypassing the reference tables in the future.
23. The government payroll and information system (SIGFA) currently covers only about 45 percent of central government employees creating problems to adequately monitor employment and compensation levels. The quality of the reporting and coverage of public institutions which are outside the government payroll is particularly weak. Even though autonomous institutions and municipalities receive transfers from the budget, they are not required to report regularly their expenditure execution. Moreover, it is unclear whether they will have the technical capacity in the near term to begin such reporting on a precise basis. Some autonomous entities, such as universities, oppose regular reporting completely as they argue that this would threaten their autonomy.
24. The rapid employment growth in municipalities has contributed to an increase in compensation costs. In addition to transparency problems in municipal finances, weaknesses in the recent decentralization process have contributed to increasing compensation costs. Six percent of total budget revenues have been devolved to municipalities without corresponding expenditure responsibilities.19 In particular, the municipal transfers law establishes a scheme that redistributes revenues in favor of small municipalities and fixes the distribution between current and capital spending. For smaller municipalities, 40 percent of transfer revenues should be dedicated to current expenditure. With this provision, current expenditures are likely to be higher than historical experience 17 Compensation of personnel involved in donor projects is recorded as personnel costs in capital expenditures.
18 The fixed component of the salary was computed as the basic salary plus social security contributions plus contributions for the National Institute of Technology.
19 In 2006 the approved budget maintains the same level of transfers (6 percent of tax revenues), but it also cuts central government capital spending on municipalities in 2006 by about ½ of devolved revenues, with respect to 2005.

- 20 -
may suggest. Without additional well defined expenditure responsibilities, it is likely that the recent trend increase in employment and salaries at the municipal level will continue.
25. The current labor code has forced the authorities to implement the civil service law only gradually. The Law of Acquired Rights directly implies that compensation levels of workers, paid more than would be implied by the base reference table, cannot be reduced. On top of improving equity, lowering high salaries could help finance improved salary levels of underpaid workers. Further, it is difficult to reduce employment or hire less costly temporary workers. The labor code sets very stringent conditions on the justification for firing an employees at a relatively low cost. If a temporary worker’s contract is renewed more than twice, the worker automatically acquires the rights of a permanent worker.
26. Additionally, donor projects create particular challenges for containing compensation costs. Donor projects, which are by nature temporary, have been used to finance permanent government positions. As a result, this creates problems when the projects finish and personnel need to be absorbed back into the permanent government staff or separated. Since the salaries paid in donor projects tend to be significantly higher than the ones allowed by the reference salary tables linked to the civil service law, the Law of Acquired Rights implies that their salary cannot fall if they are incorporated into the government. Moreover, severance payments can still be significant.20
Implications for the budget’s flexibility and poverty focus, macroeconomic stability and competitiveness.
27. Increasing remuneration costs could imply reduced budget flexibility and spending efficiency. The overall size of public employee compensation is estimated to be about 8½ percent of GDP in 2005 and 2006. As the share of government spending on compensation increases, it reduces the ability of the government to adjust in response to shocks, given that the rigid labor code essentially impedes any rapid short term adjustment of compensation in a low-inflation environment. As such, adjustments would probably occur in areas such as reductions in multiyear capital spending projects or cuts in maintenance, which could adversely affect the efficiency of overall public spending.
28. Earmarking and other budget rigidities also hamper the government’s ability to cope with shocks. Preliminary calculations by the staff show that about 2/3 of total expenditures in 2005 are non-discretionary. Interest payments, wages and salaries, transfers to municipalities, public universities, and the judiciary; as well as social security expenditures are difficult to change. These rigidities in the budget would force the government, in case of a negative shock, to cut productive investment or increase taxes. The 20 Preliminary results from a census of personnel involved in donor projects suggest that there are about 1,500 consultants (but anecdotal evidence suggests the number could be as high as 3,000) that could imply contingent liabilities of 0.8 percent of GDP in terms of financing their positions permanently and paying separation payments if donor financing were not to materialize.

- 21 -
latter has been a common policy response by the government in the last years. For example, the authorities introduced a tax reform in 2003 that yielded around 1.0 percent of GDP and in 2005 revenue measures amounted to ½ percent of GDP in order to compensate for expenditure overruns approved by the Assembly.
29. Compensation spending in the budget does not appear to benefit the poorest households. The 2001 living standards household survey shows that government wages represent less than 9 percent of the income of the poor and of total government wages only 14 percent are paid to the poor.21 There is evidence that indicates that the poorest have generally low levels of education and work in the informal sector. As such, government compensation spending benefits, disproportionately, the richest households. Increasing expenditures on wages and salaries could therefore imply reducing the poverty reduction focus of budget.
30. Rapid public sector wage growth risks putting pressure on private wages and inflation. The private sector is not as strongly unionized as the public sector. Anecdotal evidence suggests strong unions represent public sector workers in collective bargaining negotiations, but the same cannot be said for private sector employees. However, as the difference between average public sector wages and average private sector wages in the formal sector increases, the risk of demonstration effects driving higher private sector wage demands and setting off a wage-price spiral loom larger.
31. As such, increasing public sector compensation risks having a negative effect on competitiveness. Most foreign direct investment (FDI) is attracted to the formal sector, including the operations of major exporting firms. As the government remains an important formal sector employer, growth in real public sector compensation far in excess of the private sector risks eventually putting pressure on labor costs in the formal sector. This would pose risks to the competitiveness of the formal export sector, and undermine Nicaragua’s attractiveness as an investment location, with respect to neighboring countries.
21 Poor individuals are defined here to be those in quartile 1 and 2 of the income distribution, corresponding roughly to the definition of those below the poverty line in the household survey data.
100
110
120
130
140
150
160
170
180
Jan-01 Jul-01 Jan-02 Jul-02 Jan-03 Jul-03 Jan-04 Jul-04 Jan-05100
110
120
130
140
150
160
170
180
CPI Index
Public Wage Index
Nominal Average Public Sector Wage Index and the CPI, Jan. 2001-May 2005(January 2001=100)
4% 10%
10%
26%
50%
1 2 3 4 5
Share of Total Government Earnings Accruing to each Quintile of Total Income Distribution, 2005(1 = Poorest Income Quintile)
Highest Income Quintile
- 22 -
D. Conclusions
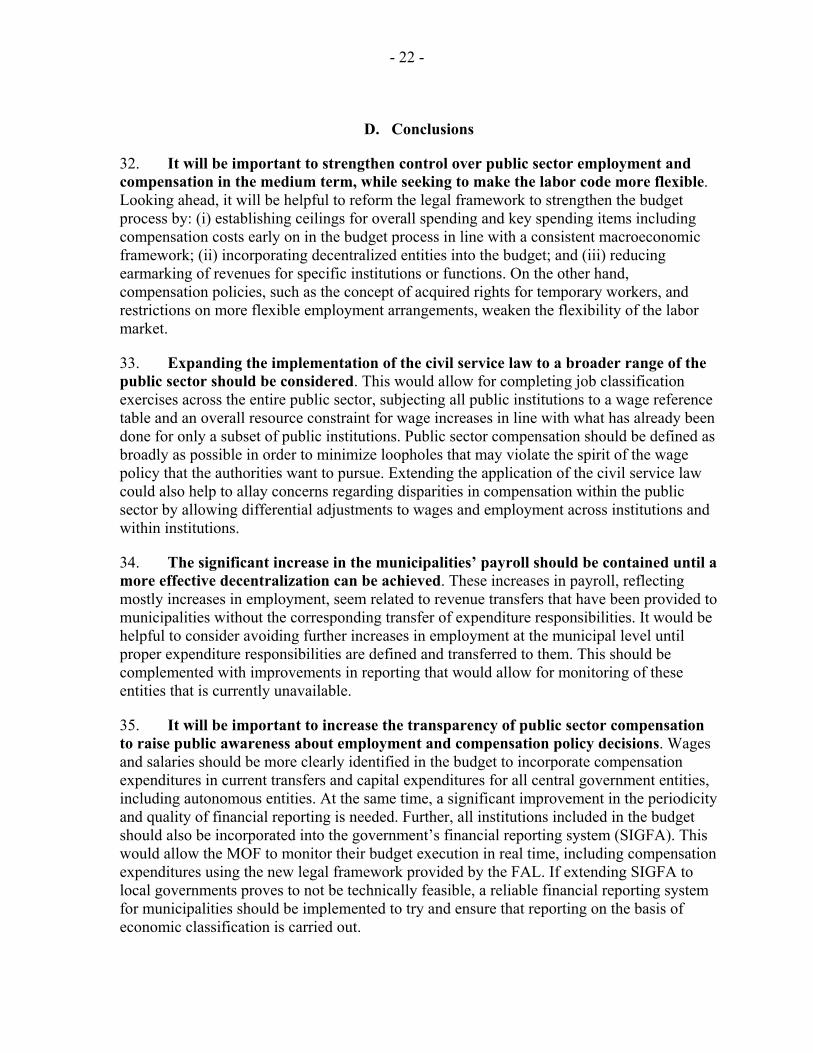
32. It will be important to strengthen control over public sector employment and compensation in the medium term, while seeking to make the labor code more flexible. Looking ahead, it will be helpful to reform the legal framework to strengthen the budget process by: (i) establishing ceilings for overall spending and key spending items including compensation costs early on in the budget process in line with a consistent macroeconomic framework; (ii) incorporating decentralized entities into the budget; and (iii) reducing earmarking of revenues for specific institutions or functions. On the other hand, compensation policies, such as the concept of acquired rights for temporary workers, and restrictions on more flexible employment arrangements, weaken the flexibility of the labor market.
33. Expanding the implementation of the civil service law to a broader range of the public sector should be considered. This would allow for completing job classification exercises across the entire public sector, subjecting all public institutions to a wage reference table and an overall resource constraint for wage increases in line with what has already been done for only a subset of public institutions. Public sector compensation should be defined as broadly as possible in order to minimize loopholes that may violate the spirit of the wage policy that the authorities want to pursue. Extending the application of the civil service law could also help to allay concerns regarding disparities in compensation within the public sector by allowing differential adjustments to wages and employment across institutions and within institutions.
34. The significant increase in the municipalities’ payroll should be contained until a more effective decentralization can be achieved. These increases in payroll, reflecting mostly increases in employment, seem related to revenue transfers that have been provided to municipalities without the corresponding transfer of expenditure responsibilities. It would be helpful to consider avoiding further increases in employment at the municipal level until proper expenditure responsibilities are defined and transferred to them. This should be complemented with improvements in reporting that would allow for monitoring of these entities that is currently unavailable.
35. It will be important to increase the transparency of public sector compensation to raise public awareness about employment and compensation policy decisions. Wages and salaries should be more clearly identified in the budget to incorporate compensation expenditures in current transfers and capital expenditures for all central government entities, including autonomous entities. At the same time, a significant improvement in the periodicity and quality of financial reporting is needed. Further, all institutions included in the budget should also be incorporated into the government’s financial reporting system (SIGFA). This would allow the MOF to monitor their budget execution in real time, including compensation expenditures using the new legal framework provided by the FAL. If extending SIGFA to local governments proves to not be technically feasible, a reliable financial reporting system for municipalities should be implemented to try and ensure that reporting on the basis of economic classification is carried out.
APPENDIX
- 23 -
2000 2001 2002 2003 2004 2005 1/
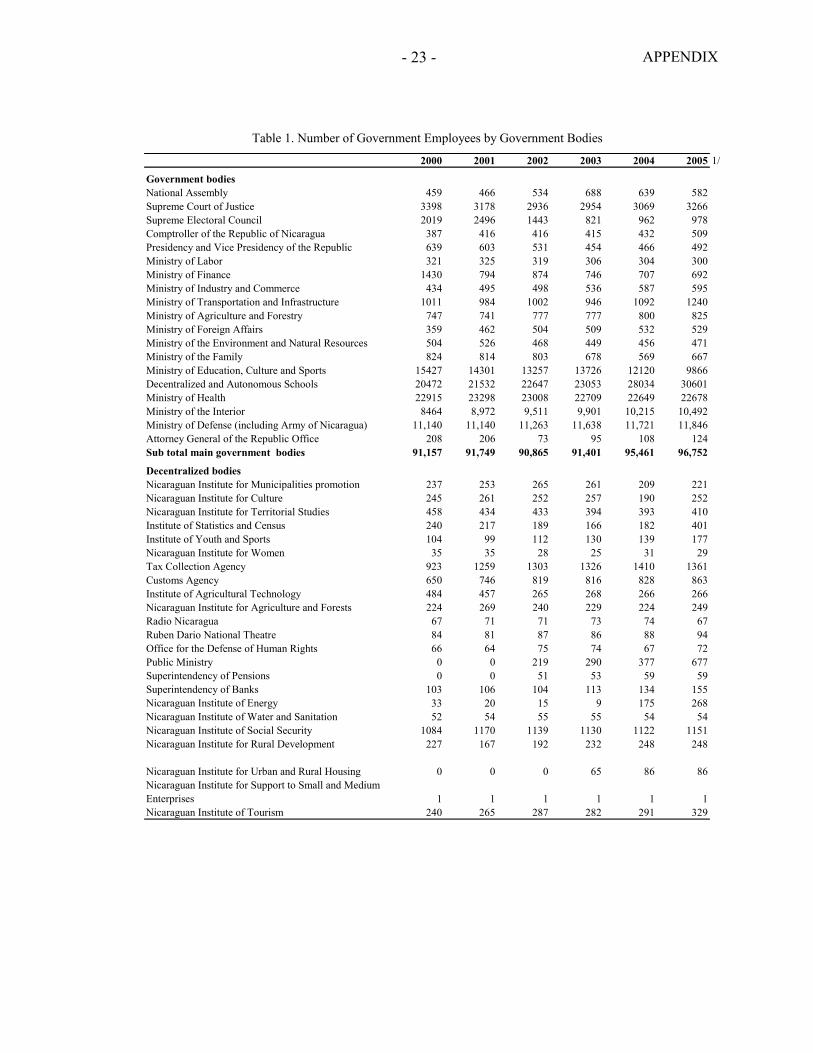
Government bodiesNational Assembly 459 466 534 688 639 582Supreme Court of Justice 3398 3178 2936 2954 3069 3266Supreme Electoral Council 2019 2496 1443 821 962 978Comptroller of the Republic of Nicaragua 387 416 416 415 432 509Presidency and Vice Presidency of the Republic 639 603 531 454 466 492Ministry of Labor 321 325 319 306 304 300Ministry of Finance 1430 794 874 746 707 692Ministry of Industry and Commerce 434 495 498 536 587 595Ministry of Transportation and Infrastructure 1011 984 1002 946 1092 1240Ministry of Agriculture and Forestry 747 741 777 777 800 825Ministry of Foreign Affairs 359 462 504 509 532 529Ministry of the Environment and Natural Resources 504 526 468 449 456 471Ministry of the Family 824 814 803 678 569 667Ministry of Education, Culture and Sports 15427 14301 13257 13726 12120 9866Decentralized and Autonomous Schools 20472 21532 22647 23053 28034 30601Ministry of Health 22915 23298 23008 22709 22649 22678Ministry of the Interior 8464 8,972 9,511 9,901 10,215 10,492Ministry of Defense (including Army of Nicaragua) 11,140 11,140 11,263 11,638 11,721 11,846Attorney General of the Republic Office 208 206 73 95 108 124Sub total main government bodies 91,157 91,749 90,865 91,401 95,461 96,752
Decentralized bodiesNicaraguan Institute for Municipalities promotion 237 253 265 261 209 221Nicaraguan Institute for Culture 245 261 252 257 190 252Nicaraguan Institute for Territorial Studies 458 434 433 394 393 410Institute of Statistics and Census 240 217 189 166 182 401Institute of Youth and Sports 104 99 112 130 139 177Nicaraguan Institute for Women 35 35 28 25 31 29Tax Collection Agency 923 1259 1303 1326 1410 1361Customs Agency 650 746 819 816 828 863Institute of Agricultural Technology 484 457 265 268 266 266Nicaraguan Institute for Agriculture and Forests 224 269 240 229 224 249Radio Nicaragua 67 71 71 73 74 67Ruben Dario National Theatre 84 81 87 86 88 94Office for the Defense of Human Rights 66 64 75 74 67 72Public Ministry 0 0 219 290 377 677Superintendency of Pensions 0 0 51 53 59 59Superintendency of Banks 103 106 104 113 134 155Nicaraguan Institute of Energy 33 20 15 9 175 268Nicaraguan Institute of Water and Sanitation 52 54 55 55 54 54Nicaraguan Institute of Social Security 1084 1170 1139 1130 1122 1151Nicaraguan Institute for Rural Development 227 167 192 232 248 248
Nicaraguan Institute for Urban and Rural Housing 0 0 0 65 86 86Nicaraguan Institute for Support to Small and Medium Enterprises 1 1 1 1 1 1Nicaraguan Institute of Tourism 240 265 287 282 291 329
Table 1. Number of Government Employees by Government Bodies

- 24 - APPENDIX
2000 2001 2002 2003 2004 2005
Corporation of Free Zones 34 42 76 75 79 97Emergency Social Fund 427 440 418 398 415 441Road Maintenance Fund 0 0 0 13 21 22Universities 3275 3229 3452 3798 3993 4053Sub total decentralized bodies 11,291 9,740 10,147 10,615 11,158 12,101Total central government 102,447 101,489 101,012 102,016 106,619 108,853
State financial institutionsCentral Bank of Nicaragua 784 814 862 788 807 870Nicaraguan Institute of Insurance 21 22 25 25 26 25Rural Credit Fund 0 0 11 33 35 34Nicaraguan Financial Institution for Investment 54 61 61 63 63 72Sub total state financial institutions 859 896 958 908 930 1,000Local governmentsMunicipalities 8446 8713 9330 9995 10799 12103Regional Government of the North Atlantic 52 152 170 266 313 302Regional Government of the South Atlantic 79 97 57 74 85 87Regional Council of the North Atlantic 42 53 59 73 76 75Regional Council of the South Atlantic 59 53 40 60 70 76Sub total local governments 8,677 9,068 9,656 10,469 11,343 12,643Total general government 111,984 111,453 111,626 113,393 118,892 122,497
Source: INSS and CBN
1/ On the basis of INSS data for the first 4 months of 2005. Data for the ministry of the interior, the ministry of defense,the ministry of education, and the decentralized and autonomous schools are on the basis of processing of ministryof finance information by the Central Bank of Nicaragua.
Table 1. Number of Government Employees by Government Bodies (continued)

- 25 - APPENDIX
November 2002 November 2003 November 2004
National Assembly 38.0 10.8 23.3Supreme Court of Justice 3.4 7.5 12.8Supreme Electoral Council 0.6 0.6 4.0Comptroller of the Republic of Nicaragua 7.2 20.4 22.3Presidency of the Republic 2.9 46.8 46.5Ministry of the Interior 0.0 0.0 0.0Ministry of Foreign Affairs 8.1 11.8 16.8Ministry of Defense 0.0 1.0 1.0Ministry of Finance 93.2 91.1 94.7Ministry of Industry and Commerce 98.9 98.9 98.9Ministry of Education,Culture and Sports 4.7 0.9 1.8Ministry of Agriculture and Forestry 0.5 0.6 99.2Ministry of Transportation and Infrastructure 99.1 99.1 99.1Ministry of Health 0.0 0.0 0.0Ministry of Labor 0.0 99.0 99.0Ministry of the Environment and Natural Resources 97.9 97.8 97.8Ministry of the Family 91.0 92.0 99.2Nicaraguan Institute for Women 0.0 9.1 91.7Attorney General of the Republic of Nicaragua 0.0 11.5 97.9Nicaraguan Institute for Municipalities Promotion 0.0 9.2 98.2Institute of Statistics and Census 0.0 0.0 97.6Nicaraguan Institute of Territorial Studies 100.0 100.0 100.0National commission for Energy 0.0 0.0 0.0Nicaraguan Institute of Culture 0.0 99.5 99.5Institute of Youth and Sports 98.8 97.6 98.8
Total 5.5 5.7 7.9
Sources: Ministry of Finance and Central Bank of Nicaragua.
Institutions
Percent of Implementation
Table 2. Progress in Job Classification in Affected Institutions as a Share of the Total Number of Positions

APPENDIX
- 26 -
Number of Positions Employment
National Assembly 429 419Supreme Court of Justice 2,971 2,841Supreme Electoral Council 231 185Comptroller of the Republic of Nicaragua 414 406Presidency of the Republic 412 375Ministry of Labor 309 302Ministry of Finance 606 579Ministry of Industry and Commerce 284 274Ministry of Transportation and Industry 333 318Ministry of Agriculture and Forestry 364 358Ministry of Foreign Affairs 315 312Ministry of the Environment and Natural Resources 145 140Ministry of the Family 437 418Attorney General of the Republic of Nicaragua 113 107Nicaraguan Institute for Municipalities promotion 57 49Nicaraguan Institute for Culture 336 312Nicaraguan Institute of Territorial Studies 261 259Institute of Statistics and Census 46 43Institute of Youth and Sports 89 86Nicaraguan Institute for Women 24 21National Commission for Energy 7 7Subtotal 8,182 7,812Ministry of Education, Culture and Sports 10,214 9,866Ministry of Health 21,595 20,685Ministry of the Interior 10,667 10,492Defense (sum of Ministry of Defense and Army) 12,149 11,846Total 62,807 60,701
Ministry of Defense 3,039 2,736Army 9,110 9,110
1/ Annual average; for 2005 average January-June in Central Government.
Source: Ministry of Finance and Central Bank of Nicaragua.
2005
Table 3. Number of Positions and Employment for a Subset of Public Institutions
Institutions

- 27 -
III. NICARAGUA––PERSPECTIVES ON THE MONETARY FRAMEWORK1
A. Introduction
1. Strengthening the monetary framework has been an important element of macroeconomic policy in Nicaragua since the 1990s. Broadly appropriate economic policies prior to the 1980s resulted in a stable macroeconomic environment with gains in real income per capita, low inflation, and exchange rate stability. By contrast, the civil strife together with loose monetary policies adopted during the 1980s resulted in massive devaluations, hyperinflation, debt overhang, and financial repression. Beginning in the 1990s the authorities have been gradually implementing stabilization policies including using the exchange rate as an anchor for inflation. The adopted crawling peg regime has facilitated a substantial fall in inflation but risks are posed by the highly dollarized financial system and potential political instability, highlighting the need to further strengthen policy credibility.
2. Sustained implementation of sound macro-policies and further financial sector reforms will be important prerequisites for moving to a more flexible exchange rate regime. It will be important to maintain a medium term track record of sound policies to strengthen credibility while pushing ahead with the structural reform agenda to bolster the financial sector and further strengthen the central bank.
3. This chapter reviews the historical context and current operation of monetary policy with a view to discussing prospects for medium term reforms. Section B provides a historical context by describing the decline in macroeconomic performance and confidence observed during 1978–93 and the turn around since then. Section C contains a brief analysis of the design of the monetary framework in recent years. Section D looks forward to some medium term policy challenges.
B. Historical Context
4. Nicaragua implemented a fixed exchange rate regime until the early 1980’s. This regime, combined with a supportive fiscal policy stance, helped to maintain a relatively stable macroeconomic framework. Inflation remained low, averaging 5.3 percent during 1961–77, while economic growth was high, averaging 6.7 percent per annum during this period (Figure 1). The new government that assumed office in 1979, after a step exchange rate adjustment of 40 percent, fixed the exchange rate until 1985. However, the civil war and interventionist economic policies in this period disrupted economic activity, and price and currency stability.
5. Pressures mounted during 1980-85 and finally the exchange rate collapsed, triggering hyperinflation.2 During 1980–85, a progressive deterioration of political and
1 Prepared by Sergio Martin.
2 In Nicaragua, given the historically high levels of inflation, the exchange rate pass-through has been very large. Choudhri and Hakura (2001) find in a cross-country study that in
(continued)

- 28 -
economic conditions set the stage for a series of massive devaluations setting off a hyperinflation (Figure 1). As an illustration, in 1988 alone, the inflation rate surpassed 10,000 percent. As economic conditions worsened, growth slumped, averaging -2.6 percent during 1978–93.3 Net international reserves also declined markedly in this period. After averaging 2.3 months of imports during 1960–77, NIR turned negative, declining to an average of -4.5 months of imports in 1978–93. It was not surprising that in these circumstances the only possible price of reference was with respect to foreign currencies, which played the store-of-value role that the domestic currency could not fulfill.
6. Beginning in the 1990s, a gradual process of economic stabilization ensued in the context of a strengthening of macroeconomic policies. Eventually, a crawling peg regime was put in place in 1993 to help rebuild the credibility of monetary policy as well to preserve some room to absorb shocks as the economy gradually stabilized. This effort was supported by a fiscal consolidation program and substantial financial support from the international community. During 1994–2004, as the improvement in macroeconomic management took hold, economic activity recovered, with annual real GDP growth averaging 4.7 percent. Inflation moderated and international reserves were gradually rebuilt.
7. The crawling peg exchange regime has served well to stabilize inflation expectations. The central bank law explicitly establishes price stability as the primary objective of monetary policy and the pegged regime has contributed to achieving this goal in the last decade. In recent years, a key policy objective has been to gradually slow the rate of crawl to reduce inflation, given the high pass through (Figure 2).
8. However, the economy remains highly dollarized.4 The ratio of dollar to total deposits in the financial system increased from 28 percent in 1990 to about 70 percent in 2005. Moreover, most loans, government bond issuances, real estate valuations, and other major transactional operations are fully indexed to the U.S. dollar. This high level of dollarization reflects a lack of investor confidence resulting from the history of high inflation and currency instability.
general, the higher the inflation rate, the larger the exchange rate pass-through. Urcuyo and Rodriguez (2003) in a study of the Nicaraguan economy report a complete pass-through of the exchange rate to prices with a speed of adjustment of 50 percent within two months and the rest within almost a year. As a consequence, the authors conclude that movements in the nominal exchange rate have little impact on the real exchange rate.
3 Real GDP grew at annual average rate of 2.7 percent during 1960-04—roughly the same as population growth.
4 See De Nicolo, Honohan, and Ize (2005) for a further discussion of dollarization.

- 29 -
Figure 1. Nicaragua: Historical Perspective, 1960-04
Source: Minister of Finance, BCN and Fund staff transformations
Devaluation and Inflation (In logarithmic scale)
1
10
100
1,000
10,000
100,000
7980818283848586878889909192939495969798990001020304
Devaluation
Averageinflation
1960-1977Average inflation= 3 percent per year(excluding 1973-1974)No devaluation with fixed exchange rate =7
Stabilizationperiod,1994-2004Averageinflation= 9.1Averagedevaluation=9.1
Civil war andpost war period,1978-1993
Net International Reserves in Months of Imports of Goods
-21
-19
-17
-15
-13
-11
-9
-7
-5
-3
-1
1
3
5
60 63 66 69 72 75 78 81 84 87 90 93 96 99 02
1960-1977NIR/Imports
= 2.6
1978-1993NIR/
Imports=-5.5
1994-2004NIR/
Imports=1.9
Real GDP Growth Rate(in percent)
-30
-25
-20
-15
-10
-5
0
5
10
15
61 64 67 70 73 76 79 82 85 88 91 94 97 00 034
4.2
4.4
4.6
4.8
5
5.2
5.4
5.6
5.8
60 64 68 72 76 80 84 88 92 96 00 044
9
14
19
24
29
34Inflation
(RHS)
GDP(LHS)
1960-1977Relative stableinflation withhigh economicgrowth
1978-1993Increasinginflationwith lower economicgrowth
1994-2004Declining inflation with moderate recovery of economic growth
Hodrick-Prescott Filtered CPI and Real GDP Growth(Index 1960=100 in natural logarithms)

- 30 -
Figure 2. Nicaragua: Monetary Framework, 2003-05
Source: Central bank
Inflation and Depreciation Rates
0
5
10
15
20
25
30
1993 1995 1997 1999 2001 2003 20050
5
10
15
20
25
30
inflation
depreciation
-300
-200
-100
0
100
200
300
400
500
2000 2001 2002 2003 2004-200
-100
0
100
200CB debt(LHS) NIR
(RHS)
Changes in Central Bank Debt and NIR (US$ Millions)
-60
-50
-40
-30
-20
-10
0
10
20
Jan-02 Sep-02 May-03 Jan-04 Sep-04 May-05-60
-50
-40
-30
-20
-10
0
10
20
Central Bank purchases (+) or sales (-) to foreign exchange market (US$ Millions)
Central Bank Bond Repayments (US$ Millions)
-30
-20
-10
0
10
20
30
40
50
Jul-03 Mar-04 Nov-04 Jul-05-30
-20
-10
0
10
20
30
40
50
Bank recapitalization bonds
Other

- 31 -
Full dollarization Crawling peg FloatCosta Rica XEl Salvador XGuatemala XHonduras XNicaragua XPanama X
C. Recent Design and Conduct of Monetary Policy
9. The history of macroeconomic instability during the 1980s has constrained the current design and conduct of monetary policy in Nicaragua. Nicaragua, like most other Central American economies, maintains an exchange rate system linked to the dollar.5 Nicaragua’s choice of the crawling peg regime6 reflects its position as a small open economy, susceptible to confidence and other shocks. Moreover, monetary policy has been conducted in the context of large fiscal imbalances, low international reserves, and under the burden of heavy external and domestic debt. Further, the efficiency of monetary instruments is hampered by the relatively small size of the financial sector, resulting shallow markets, and dollarized financial system.
10. A key policy objective has been to strengthen net international reserves and the central bank financial position. A supportive fiscal policy stance has been key to reducing any tension between these two objectives. Towards this goal, the authorities’ monetary program has targeted building international reserves while reducing high levels of expensive central bank debt, a large part of which was issued to recapitalize banks following the financial crisis of 2000–01 (Figure 2). Adjusted NIR levels have been built up from US$16 million in 2001 to US$200 million in 2005, but key coverage ratios remains relatively low highlighting the need for a continued focus on further reserve accumulation. Meanwhile the central bank has reduced its outstanding debt by over US$300 million in the last three years.
5 A study by Papaioannou (2003) finds that exchange rate regime choices in Central America are related to long-run determinants that are relatively stable over time, such as openness, size of the economy, degree of economic development and geographical concentration of trade. In general, the Central American economies are small, very open, with a low level of economic development, and high concentration of trade with the United States.
6 The nominal anchor is the exchange rate of the córdoba with respect to the U.S. dollar reflecting in part the role of the U.S. as Nicaragua’s most important trading partner and source of large remittance and other capital inflows. The exchange rate system operates on the announcement of some percentage of nominal depreciation at the beginning of the year, which is applied proportionally on a daily basis. At the given daily exchange rate, the central bank sells or buys any amount of foreign currency with a fee of 1 percent.

- 32 -
11. Fiscal policy has played a key role in supporting reserve accumulation given the central bank’s domestic debt reduction target. In this context, tightening the stance of fiscal policy by increasing government deposits at the central bank has been a key driver of reserve accumulation. A large part of international reserves accumulation reflects increases in government deposits at the central bank in turn funded by foreign grants and loans, as opposed to market purchases. Net foreign currency market operations at the central bank have generally involved sales of foreign exchange to the public (Figure 2).
12. The central bank’s debt reduction goal has in practice meant that net open market operations have been expansionary in recent years. The net change in the central banks’ bond operations has mostly implied liquidity injections reflecting the repayment of bank recapitalization bonds and other central bank debt (Figure 2). In the absence of off-setting fiscal policy support, achieving reserve accumulation goals would have required net contractionary open market operations or further increases in already high levels of reserve requirements.7 Increasing public sector deposits and/or shifting public sector deposits from commercial banks to the central bank has been an option for liquidity management, though this requires very close coordination between the central bank and the central government.
13. Shallow financial markets hamper the conduct of open market operations. This reflects in part a perception of high costs arising from the lack of competition in the financial system.8 The use of short-term interest rates, as an intermediate operating target, is severely hampered by the lack of depth of the primary debt market and the technical problems to measure daily liquidity. The bond market is underdeveloped, with low volumes of operations
7 Reserve requirements are set at 16.25 percent on both domestic and foreign currency deposits. In recent years, banks have maintained excess reserves at the central bank of about 1–2 percentage points of deposits, despite the fact that reserve requirements are not remunerated. Banks had chosen not to transfer the funds abroad because the fees and commissions involved were higher than the interest rate they could earn abroad. However, this situation could reverse with rising international interest rates.
8 The banking system is small and highly concentrated with the largest bank accounting for ¼ of system assets.
Nicaragua: Gross International Reserves Adequacy, 2000-2005
2000 2001 2002 2003 2004 2005Foreign currency deposits/GIR 38.0 42.8 41.6 42.5 37.2 45.0GIR/GDP 12.6 9.3 11.3 12.2 14.7 12.9GIR/M3 25.9 25.9 28.6 29.3 35.0 30.3GIR in months of imports of G&S 2.1 2.1 2.8 2.1 2.8 2.3
Source: Central Bank of Nicaragua and Fund staff estimates/projections.

- 33 -
in the secondary market and low usage of repo operations. Government bond auctions are irregular and market bids are frequently not accepted.
14. Moreover, the financial position of the central bank needs to be strengthened. The central bank has a high external and domestic debt burden, reflecting past quasi-fiscal operations, that constrains its ability to implement monetary policy. At end-2004, central bank external debt stood at 42.3 percent of GDP, and domestic debt at 8.8 percent of GDP. The service of this debt explains in part the central banks significant quasi-fiscal losses that have averaged about 1½ percent of GDP in recent years. The government is mandated to absorb the central bank’s losses but this has been in the form of very long-term, relatively low-yielding government bonds.
D. Medium-term Policy Challenges
15. The crawling peg regime limits the flexibility of the economy to respond to shocks and dollarization poses a key additional risk. While participation in CAFTA-DR should help reduce macroeconomic volatility, developing a more independent monetary policy regime would provide important additional insurance to help smooth shocks. Moreover, high dollarization increases the vulnerability of the economy to shocks. In a mixed-currency economy, the rationale for flight out of domestic currency is more compelling given the possibility of conversion into dollars.9 Moreover, any shock leading to sudden pressure on the exchange rate could adversely affect the balance sheets of the banking system to the extent that resulting credit risks are transformed into significant currency mismatches. 16. However, medium term reforms will be required for moving to a more flexible regime and reducing dollarization. It will be crucial to continue to strengthen the fiscal position, lower debt levels, buttress the cushion of international reserves and consistently achieve low levels of inflation to further strengthen the credibility of the policy framework. This is key for reversing the dollarization hysteresis currently observed. 17. Further strengthening the financial sector and developing the domestic capital markets are also crucial components of this strategy. Stronger banks will go hand in hand with deeper capital markets in creating a more resilient economy. Key requirements for the former will be effective implementation of the recently strengthened legislative framework for the financial sector including by continuing to strengthen bank supervision. This would need to be supported by judicial reforms. Capital market development could receive a boost from a market-based solution to the problems of the pension system. Combined, these will also provide the central bank the opportunity to develop a wider range of instruments to conduct market-based monetary operations. Further strengthening the financial position of the central bank will be another important part of this policy agenda. 9 See Ize, Kiguel, and Levy-Yeyati (2005) for a discussion.

- 34 -
References Choudhri, Ehsan U. and Dalia S. Hakura, (2001), “Exchange Rate Pass-Through to Domestic Prices: Does the Inflationary Environment Matter?” IMF, Working Paper 01/194.
De Nicolo, G., Honohan, P., and Ize, A., (2005) “ Dollarization of Bank Deposits: Causes and Consequences” Journal of Banking and Finance 29, 1697-1727. Ize, A., Kiguel, M., and Levy–Yeyati, 2005, “Managing Systemic Liquidity Risk in Financially Dollarized Economies” IMF Working Paper No.05/188 Papaioannou, M., (2003) “Determinants of the Choice of Exchange Rate Regimes in Six Central American Countries: An Empirical Analysis”, IMF Working Paper 03/59 Urcuyo, A.R. and J. Rodriguez. 2003, “Los determinantes de largo y corto plazo del tipo de cambio real en Nicaragua” BCN, Boletin Trimestral, Abril-Junio 2003.


