Modeling microbial diversity in anaerobic digestion
I. Ramirez and J. P. Steyer
ABSTRACT
I. Ramirez
J. P. Steyer
INRA, Laboratoire de Biotechnologie de
l’Environnement,
UR050, Avenue des Etangs,
Narbonne, F-11100,
France
E-mail: [email protected];
The aim of this study is to develop a modeling approach able to handle microbial diversity both in
normal and abnormal situations. Normal situations are defined as changing input characteristics
that do not imply process imbalance while abnormal situations are illustrated by the presence of
toxicant into the reactor. In both cases, modeling is performed by adding a stochastic term on
top of a well defined and well structured model such as the IWA Anaerobic Digestion Model No1.
Experimental data from a 1 m3 pilot scale anaerobic digester treating wine distillery wastewater
are provided to demonstrate the applicability of this approach. Discussion also highlights that
monitoring of digesters might receive a renewed consideration in the near future in order to
handle explicitly microbial diversity within the control objectives.
Key words | ADM1, anaerobic digestion, microbial diversity, modeling
INTRODUCTION
Several advantages are recognized to anaerobic digestion
(AD) processes: high capacity to treat slowly degradable
substrates at high concentrations, very low sludge pro-
duction, potentiality for valuable intermediate metabolites
production, low energy requirements, reduction of odors
and pathogens and possibility for energy recovery through
methane combustion or even hydrogen production. How-
ever, AD processes also have drawbacks: (i) the low sludge
production is closely linked to the slow growth of micro-
organisms, (ii) AD microorganisms are highly sensitive to
overloads of the process and disturbances of several causes
and (iii) AD is a complex process involving many different
microorganisms which is still not completely understood.
These drawbacks probably explain why AD processes
are not more widely used at the industrial scale. In the past,
the lack of knowledge concerning AD processes led to
breakdowns, ranging from minor to catastrophic, mainly due
to organic overloads of various origins. In general, anaerobic
reactors are indeed affected by changes in external factors,
but the severity of the effect is dependent upon the type,
magnitude, duration and frequency of the imposed changes
(Leitao et al. 2006). The typical responses include a decrease
in performance, accumulation of volatile fatty acids (VFAs),
drop in pH and alkalinity, change in biogas production rate
and composition, sludge washout and shifts in microbial
community structure. The accumulation of VFAs during
anaerobic digester overload is particularly well documented
(see for example Ahring et al. 1995). Without adequate levels
of populations that can remove hydrogen and other
intermediates, VFAs continue to accumulate, inhibiting
methanogenesis and causing further imbalance. Since the
microorganisms responsible for VFA consumption (i.e.
proton-reducing acetogens) are very sensitive to the accumu-
lation of their own metabolites (hydrogen, formate and
acetate–see for example Stams 1994), the inhibition of
methanogenesis by these products causes further VFAs
build-up. Therefore, the rapid acidification of an overload
digester can bring VFA oxidation and methanogenesis to a
complete halt, preventing digester recovery (Zinder 1993). A
successful recovery from overload would require adequate
levels of VFA-degrading microbes to metabolize the surplus
intermediates, sufficient quantities of methanogens to
consume the hydrogen and acetate produced during VFAs
oxidation, and environmental conditions to encourage their
doi: 10.2166/wst.2008.055
265 Q IWA Publishing 2008 Water Science & Technology—WST | 57.2 | 2008
close association. However, until now, very few studies
have linked microbial community structures with reactor
performances. Such an analysis is indeed difficult due to
the lack of adequate tools to study microbes directly in
their natural habitat. Cultured-base methods have been
especially difficult to use in anaerobic systems because
syntrophic interactions, low growth rates, unknown growth
requirements and obligate anaerobic conditions make
microorganisms difficult to isolate and to identify from
digesters. However, these last two decades, molecular tools
based on sequence comparison of small sub-units (SSU)
ribosomal RNA (rRNA) molecules have made it possible
to study complex microbial communities without the need
to culture microorganisms, thereby reducing the widely
acknowledge biases associated with culturing (Ward et al.
1992). Oligonucleotide probes targeting SSU rDNAs of
phylogenetically defined groups of microbes (methanogens,
sulfate-reducing bacteria, fiber digesting microbes) have
been already used for the quantification of population
abundance in bioreactors (Hansen et al. 1999). Griffin et al.
(1998) used oligonucleotide probe hybridization to evaluate
methanogen population dynamics in anaerobic digester and
they demonstrated how this technology could be used to
link microbial community structure and digester perform-
ance. But changes in microbial community structure may
also occur without detectable changes in performance
(Fernandez et al. 2000). As a consequence, there is nowa-
days strong evidences that the performance of an anaerobic
digestion processes can be closely related to the struc-
ture and diversity of its microbial community (McMahon
et al. 2001).
Strictly speaking, microbial diversity is the number of
different species in a particular area (i.e. microbial richness)
weighted by some measure of abundance such as the
number of individuals or biomass. However, it is common
to speak of species diversity even when it actually refers to
species richness which is simply not rich enough. The
definition of biological diversity that we have adopted in
this work is simply “the variety and abundance of species in
a defined unit of study” (Magurran 2005).
The objective of this paper is to present an approach
able to handle microbial diversity in complex models such
as the IWA anaerobic digestion model No1 (ADM1)
(Batstone et al. 2002). Experimental results will be used to
compare classical models such as ADM1 with an increased
complexity model and further simulations will show that
microbial diversity can lead to different results and different
conclusions about some experimental results.
MATERIALS AND METHODS
The effluents used are raw industrial wine distillery
wastewaters obtained from local wineries in the area of
Narbonne, France. The process is an up-flow anaerobic
fixed bed reactor made of a 0.948 m3 circular column. The
following measurements are available on-line: input and
recirculation liquid flow rates, pH in the reactor and in the
input wastewater, temperature, biogas output flow rate,
CO2, CH4 and H2 composition in the gas phase, total
organic carbon, soluble chemical oxygen demand, VFAs
and bicarbonate concentrations and total and partial
alkalinity in the liquid phase. More details on the process
can be found in (Steyer et al. 2002).
As already said, the model used for simulation is the
ADM1 model that has been implemented under the
Matlabw software environment. Only few parameters
(mainly km and KS related to acetate and propionate
degraders) were modified to simulate experimental data
available from the process (See Table 1). The difference
between hydraulic and solid retention times (i.e. HRT and
SRT) due to biofilm present in the reactor was modeled by
adding an extra term (i.e. tres,X) in the biomass equation as
recommended in the ADM1 report.
In the ADM1 model, one microbial population is
associated to each reaction and seven main groups of bacteria
are represented: sugar, amino acids, LCFA, valerate and
butyrate, propionate, acetate and hydrogen degraders, each
of them having specific kinetic parameters. In order to
account for microbial diversity, it was decided to increase the
number of species and 10 different species were associated to
each reaction. For each specie, the associated kinetic
Table 1 | Main parameters estimated to fit the experimental data
Parameter Acetate Propionate
km (kgCOD/KgCOD·day) 1.93 (8)p 1.41 (0.15)
KS (kgCOD/m3) 2.51 (13) 1.41 (0.10)
pValues in parenthesis are the reference values recommended in the ADM1 report.
266 I. Ramirez and J. P. Steyer | Modeling microbial diversity in anaerobic digestion Water Science & Technology—WST | 57.2 | 2008
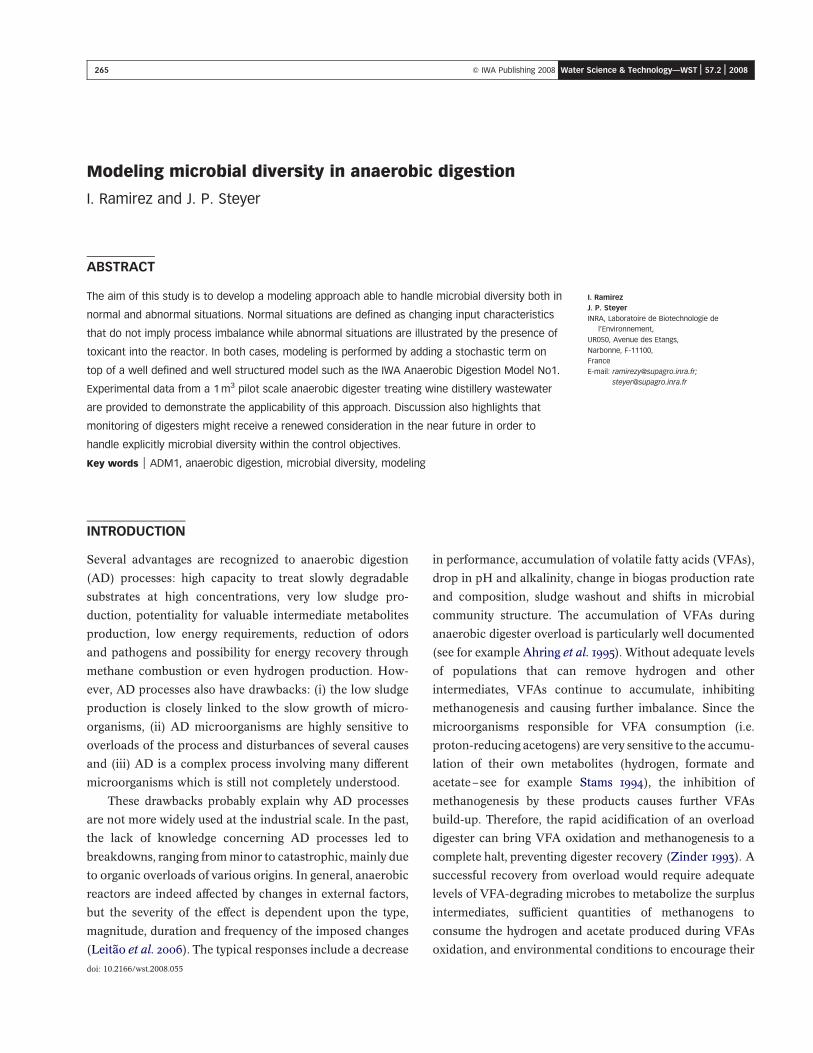
parameters were randomly chosen among 2 sets normally
distributed on each side of the kinetic parameters used to
simulate ADM1 (see Figure 1). These sets were arbitrarily
centred on 0.6 and 1.4 times the values used in ADM1
(^10%) in order to simulate two distinct populations of each
reaction. In the following, this augmented ADM1 model will
be called ADM1_10 and in order to obtain similar conditions
for simulations, each initial biomass concentrations in
ADM1 will be divided by 10 and distributed equally among
each microbial population in ADM1_10.
RESULTS AND DISCUSSION
ADM1 vs ADM1_10 when facing dynamic inputs
The wine distillery wastewater used as influent during the
experiments consisted of carbohydrates, sugars, VFAs,
inorganic carbon and nitrogen. The concentrations of these
individual components used in ADM1 and ADM1_10 as
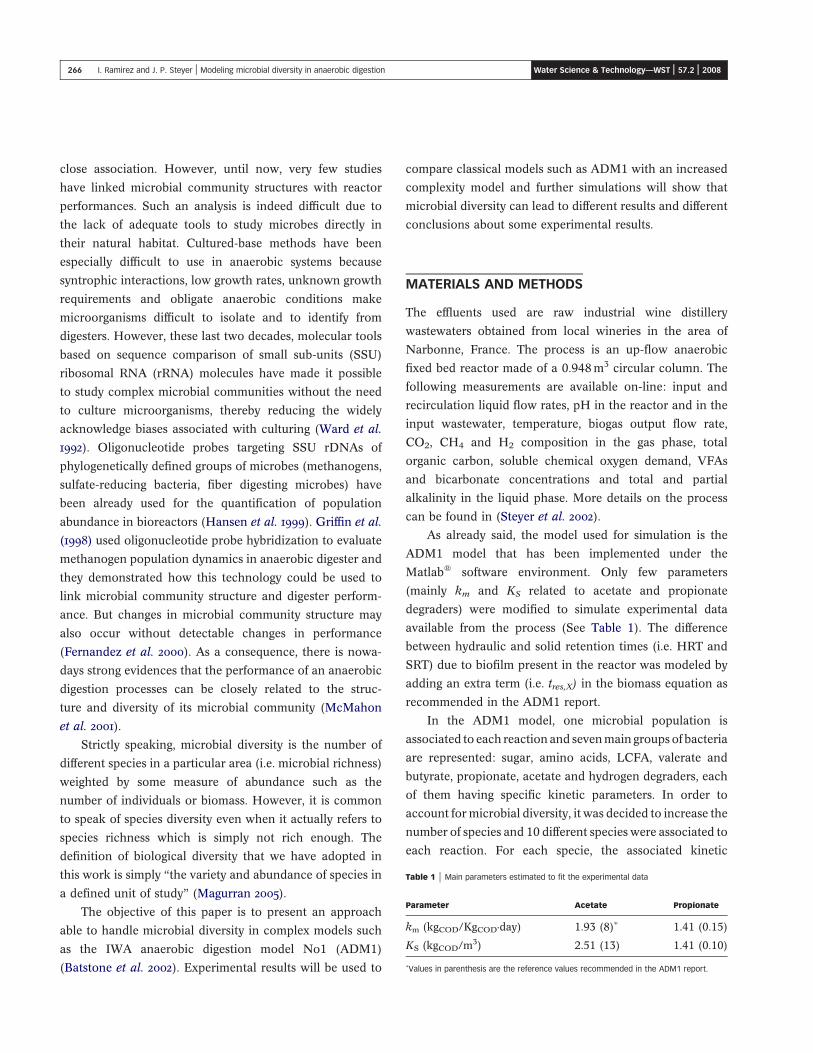
process inputs are shown in Table 2. The experimental
data over one month are presented in Figure 2, together
with the varying input feed flow and simulations of ADM1
and ADM1_10.
As it can be seen, both models can simulate very nicely
the dynamic evolutions of the main variables, in the liquid
and also in the gas phases. Even the pH can be quite
accurately simulated. As a consequence, assessing the most
appropriate model among ADM1 and ADM1_10 is a
tedious, not to say impossible, task. Of course, it could be
said that better fit could have been obtained but the main
purpose of this study was not to fit these data perfectly but
to evaluate the ability of both models to adequately predict
the behavior of this particular digestion process.
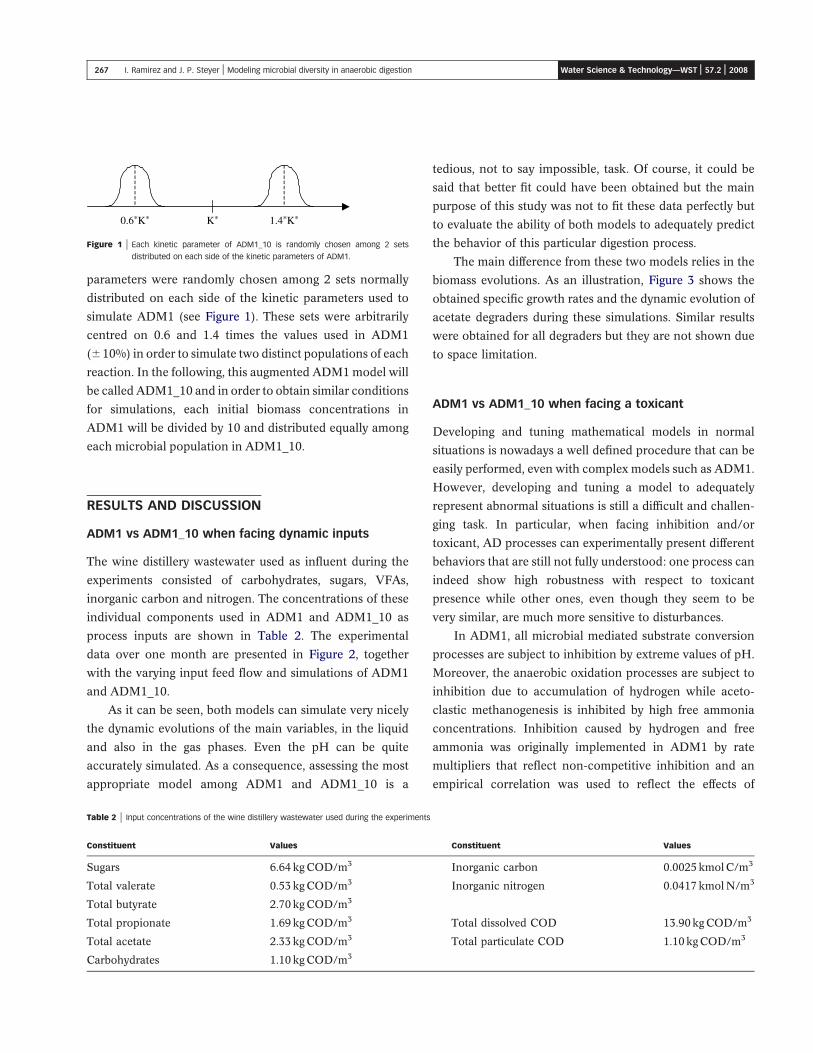
The main difference from these two models relies in the
biomass evolutions. As an illustration, Figure 3 shows the
obtained specific growth rates and the dynamic evolution of
acetate degraders during these simulations. Similar results
were obtained for all degraders but they are not shown due
to space limitation.
ADM1 vs ADM1_10 when facing a toxicant
Developing and tuning mathematical models in normal
situations is nowadays a well defined procedure that can be
easily performed, even with complex models such as ADM1.
However, developing and tuning a model to adequately
represent abnormal situations is still a difficult and challen-
ging task. In particular, when facing inhibition and/or
toxicant, AD processes can experimentally present different
behaviors that are still not fully understood: one process can
indeed show high robustness with respect to toxicant
presence while other ones, even though they seem to be
very similar, are much more sensitive to disturbances.
In ADM1, all microbial mediated substrate conversion
processes are subject to inhibition by extreme values of pH.
Moreover, the anaerobic oxidation processes are subject to
inhibition due to accumulation of hydrogen while aceto-
clastic methanogenesis is inhibited by high free ammonia
concentrations. Inhibition caused by hydrogen and free
ammonia was originally implemented in ADM1 by rate
multipliers that reflect non-competitive inhibition and an
empirical correlation was used to reflect the effects of
Figure 1 | Each kinetic parameter of ADM1_10 is randomly chosen among 2 sets
distributed on each side of the kinetic parameters of ADM1.
Table 2 | Input concentrations of the wine distillery wastewater used during the experiments
Constituent Values Constituent Values
Sugars 6.64 kg COD/m3 Inorganic carbon 0.0025 kmol C/m3
Total valerate 0.53 kg COD/m3 Inorganic nitrogen 0.0417 kmol N/m3
Total butyrate 2.70 kg COD/m3
Total propionate 1.69 kg COD/m3 Total dissolved COD 13.90 kg COD/m3
Total acetate 2.33 kg COD/m3 Total particulate COD 1.10 kg COD/m3
Carbohydrates 1.10 kg COD/m3
267 I. Ramirez and J. P. Steyer | Modeling microbial diversity in anaerobic digestion Water Science & Technology—WST | 57.2 | 2008
extreme pH. These different inhibitions were kept in both
models but an additional specific toxicant inhibition was
added. No precise definition was here chosen for the
toxicant: it was assumed to affect all microbial populations
and modeled as a non-competitive inhibition factor added
to all substrate uptake rates:
Itox ¼1
1 þ SIKI
where SI is the toxicant concentration and KI the inhibition
parameter. In the following, SI was simulated as a pulse
signal and KI value was arbitrarily chosen equal to
2.5 kgCOD/m3 for ADM1. In line with the choice of the
kinetic parameters of ADM1_10, the values of the inhibition
factors were randomly chosen for each biomass from a
uniform distribution within two sets: 1 and 4 kgCOD/m3
(to represent the fact that some microbial populations can
be more tolerant than the global biomass represented in
ADM1) and between 10 and 13 kgCOD/m3 (in this last case,
it is assumed that microbial populations are much more
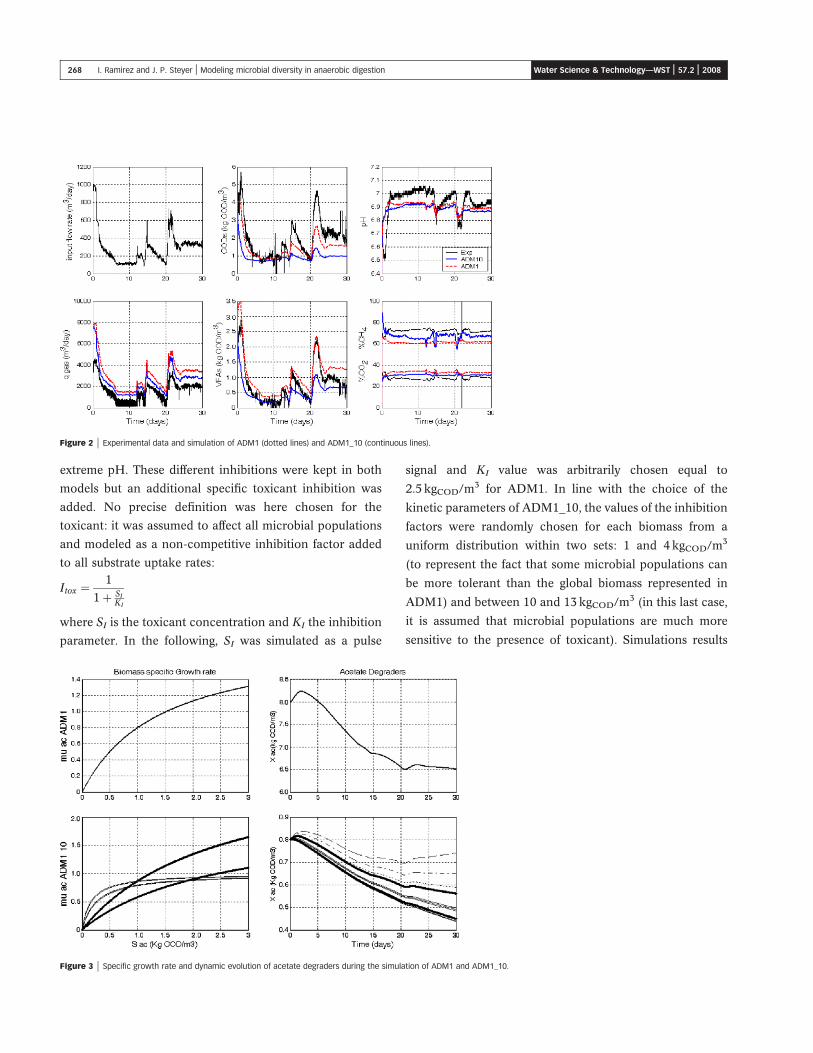
sensitive to the presence of toxicant). Simulations results
Figure 2 | Experimental data and simulation of ADM1 (dotted lines) and ADM1_10 (continuous lines).
Figure 3 | Specific growth rate and dynamic evolution of acetate degraders during the simulation of ADM1 and ADM1_10.
268 I. Ramirez and J. P. Steyer | Modeling microbial diversity in anaerobic digestion Water Science & Technology—WST | 57.2 | 2008
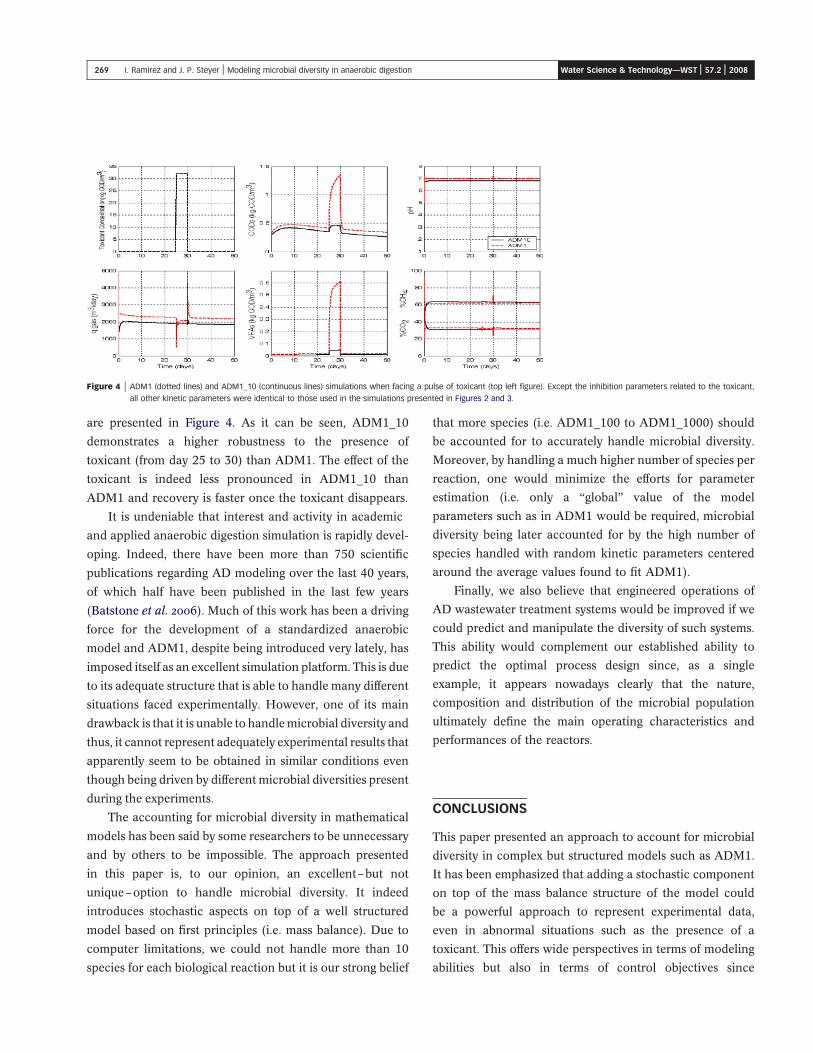
are presented in Figure 4. As it can be seen, ADM1_10
demonstrates a higher robustness to the presence of
toxicant (from day 25 to 30) than ADM1. The effect of the
toxicant is indeed less pronounced in ADM1_10 than
ADM1 and recovery is faster once the toxicant disappears.
It is undeniable that interest and activity in academic
and applied anaerobic digestion simulation is rapidly devel-
oping. Indeed, there have been more than 750 scientific
publications regarding AD modeling over the last 40 years,
of which half have been published in the last few years
(Batstone et al. 2006). Much of this work has been a driving
force for the development of a standardized anaerobic
model and ADM1, despite being introduced very lately, has
imposed itself as an excellent simulation platform. This is due
to its adequate structure that is able to handle many different
situations faced experimentally. However, one of its main
drawback is that it is unable to handle microbial diversity and
thus, it cannot represent adequately experimental results that
apparently seem to be obtained in similar conditions even
though being driven by different microbial diversities present
during the experiments.
The accounting for microbial diversity in mathematical
models has been said by some researchers to be unnecessary
and by others to be impossible. The approach presented
in this paper is, to our opinion, an excellent–but not
unique–option to handle microbial diversity. It indeed
introduces stochastic aspects on top of a well structured
model based on first principles (i.e. mass balance). Due to
computer limitations, we could not handle more than 10
species for each biological reaction but it is our strong belief
that more species (i.e. ADM1_100 to ADM1_1000) should
be accounted for to accurately handle microbial diversity.
Moreover, by handling a much higher number of species per
reaction, one would minimize the efforts for parameter
estimation (i.e. only a “global” value of the model
parameters such as in ADM1 would be required, microbial
diversity being later accounted for by the high number of
species handled with random kinetic parameters centered
around the average values found to fit ADM1).
Finally, we also believe that engineered operations of
AD wastewater treatment systems would be improved if we
could predict and manipulate the diversity of such systems.
This ability would complement our established ability to
predict the optimal process design since, as a single
example, it appears nowadays clearly that the nature,
composition and distribution of the microbial population
ultimately define the main operating characteristics and
performances of the reactors.
CONCLUSIONS
This paper presented an approach to account for microbial
diversity in complex but structured models such as ADM1.
It has been emphasized that adding a stochastic component
on top of the mass balance structure of the model could
be a powerful approach to represent experimental data,
even in abnormal situations such as the presence of a
toxicant. This offers wide perspectives in terms of modeling
abilities but also in terms of control objectives since
Figure 4 | ADM1 (dotted lines) and ADM1_10 (continuous lines) simulations when facing a pulse of toxicant (top left figure). Except the inhibition parameters related to the toxicant,
all other kinetic parameters were identical to those used in the simulations presented in Figures 2 and 3.
269 I. Ramirez and J. P. Steyer | Modeling microbial diversity in anaerobic digestion Water Science & Technology—WST | 57.2 | 2008
microbial population appears nowadays to be a major
component that drives anaerobic digesters performances.
ACKNOWLEDGEMENTS
The authors wish to sincerely thank Dr. Damien Batstone
from University of Queensland, Australia, for helping us to
appreciate the subtleties of the ADM1 model and Dr. Ulf
Jeppsson and Dr. Christian Rosen from the University
of Lund, Sweden, for providing us with their Matlab
implementation.
REFERENCES
Ahring, B. K., Sandberg, M. & Angelidaki, I. 1995 Volatile fatty
acids as indicators of process imbalance in anaerobic digesters.
Appl. Microbiol. Biotechnol. 43, 559–565.
Batstone, D. J., Keller, J., Angelidaki, I., Kalyuzhnyi, S. V.,
Pavlostathis, S. G., Rozzi, A., Sanders, W. T. M., Siegrist, H. &
Vavilin, V. A. 2002 Anaerobic Digestion Model No 1. Scientific
and technical report 13, International Water Association
(IWA), London.
Batstone, D. J., Keller, J. & Steyer, J-Ph. 2006 A review of ADM1
extensions, applications, and analysis: 2002–2005. Water Sci.
Technol. 54(4), 1–10.
Fernandez, A. S., Hasham, S. A., Dollhope, S. L., Raskin, L.,
Glagoleva, O., Dazzo, F. B., Hickey, R. F., Criddle, C. S. &
Tiejed, J. M. 2000 Flexible community structure correlates with
stable community function in methanogenic bioreactor
communities perturbed by glucose. Appl. Environ. Microbiol.
66(9), 4058–4067.
Griffin, M. E., McMahon, K. D., Mackie, R. I. & Raskin, L. 1998
Methanogenic population dynamics during startup of
anaerobic digester treating municipal solid waste and
biosolids. Biotechnol. Bioeng. 57, 342–355.
Hansen, K. H., Ahring, B. K. & Raskin, L. 1999 Quantification of
syntrophic fatty acid -b-oxidizing bacteria in a mesophilic
biogas reactor using oligonucleotide probe hybridizations.
Appl. Environ. Microbiol. 65, 4767–4774.
Leitao, R. C., Van Haandel, A. C., Zeeman, G. & Lettinga, G. 2006
The effects of operational variations on anaerobic wastewater
treatment systems: a review. Bioresour. Technol. 97,
1105–1118.
Magurran, A. E. 2005 Measuring Biological Diversity. Blackwell
Publishing, Australia.
McMahon, K. D., Stroot, P. G., Mackie, R. I. & Raskin, L. 2001
Anaerobic co-digestion of municipal solid waste and biosolids
under various mixing conditions - II. Microbial population
dynamics. Water Res. 35(7), 1817–1827.
Stams, A. J. M. 1994 Metabolic interactions between anaerobic
bacteria in methanogenic environments. Antonie van
Leeuwenhoek 66, 271–294.
Steyer, J. P., Bouvier, J. C., Conte, T., Gras, P. & Sousbie, P. 2002
Evaluation of a four year experience with a fully instrumented
anaerobic digestion process. Wat. Sci. Technol. 45(4–5),
495–502.
Ward, D. M., Bateson, M. M., Weller, R. & Ruff-Roberts, A. L. 1992
Ribosomal RNA analysis of microorganisms as they occur in
the nature. In: Marshall, K. C. (ed.) Advances in Microbial
ecology. Plenum Press, NY, USA, pp. 219–286.
Zinder, S. H. 1993 Physiological ecology of methanogens. In: Ferry,
J. G. (ed.) Methanogenesis. Ecology, Physiology, Biochemistry,
and Genetic. Chapman & Hall, New York, pp. 128–206.
270 I. Ramirez and J. P. Steyer | Modeling microbial diversity in anaerobic digestion Water Science & Technology—WST | 57.2 | 2008


