Middle SchoolMathematics Assessments
The Charles A. Dana Centerat The University of Texas at Austin
With funding fromthe Texas Education Agency andthe National Science Foundation
Proportional Reasoning

iii
About the Charles A. Dana Center’s Work in Mathematics and Science
The Charles A. Dana Center at The University of Texas at Austin works to support education leaders and policymakers in strengthening Texas education. As a research unit of UT Austin�’s College of Natural Sciences, the Dana Center maintains a special emphasis on mathematics and science education. We offer professional development institutes and produce research-based mathematics and science resources for educators to use in helping all students achieve academic success. For more information, visit the Dana Center website at www.utdanacenter.org.
The development of this work was supported in part by the Texas Education Agency, the National Science Foundation under cooperative agreement #ESR-9712001, and the Charles A. Dana Center at The University of Texas at Austin. Any opinions, ndings, conclusions, or recommendations expressed in this material are those of the author(s) and do not necessarily re ect the views of the Texas Education Agency, the National Science Foundation, or The University of Texas at Austin.
Permission is given to any person, group, or organization to copy and distribute this publication, Middle School Mathematics Assessments: Proportional Reasoning, for noncommercial educational purposes only, so long as the appropriate credit is given. This permission is granted by the Charles A. Dana Center, a unit of the College of Natural Sciences at The University of Texas at Austin.
First printing February 2004
2004, The University of Texas at Austin. All rights reserved.
iv
Authors
Brenda DeBorde, Independent Mathematics ConsultantMary Alice Hatchett, Independent Mathematics ConsultantGena Silvas Lopez, Corpus Christi Independent School DistrictVicki Veigel Massey, Austin Independent School DistrictMaggie Myers, Charles A. Dana CenterPatricia A. Rossman, Austin Independent School DistrictTeresa Salas, Corpus Christi Independent School DistrictCarmen Whitman, Charles A. Dana Center
Charles A. Dana Center Production Team
Carmen Whitman, EditorDiane McGowan, Co-EditorBonnie McNemar, Co-EditorSusan Hudson Hull, Co-EditorAmy Dolejs, Production EditorPhil Swann, DesignerGeoff Potter, Graphics Assistant
Content EditorEva Gates, Independent Mathematics Consultant
Advisory TeamAmy L. Anding, Bryan Independent School DistrictCatherine Banks, Texas Woman�’s UniversityLisa C. Brown, Austin Independent School DistrictShirl Chapman, Region 7 Education Service CenterSusan B. Empson, University of Texas at AustinYvonne Grant, Michigan State UniversityLynn Granzin, Region 15 Education Service CenterJulia Hankin, Austin Independent School DistrictSusan Hudson Hull, Charles A. Dana Center Ted H. Hull, Charles A. Dana CenterCarl Juenke, Charles A. Dana CenterGarland Linkenhoger, McAllen Independent School DistrictLaurie Mathis, Charles A. Dana CenterDiane McGowan, Charles A. Dana CenterTerri McLaughlin, Spring Branch Independent School DistrictBonnie McNemar, Charles A. Dana CenterBarbara J. Montalto, Texas Education AgencyLois G. Moseley, Mathematics EducatorMaggie Myers, Charles A. Dana Center
v
Rebecca Ontiveros, Region 19 Education Service CenterErika Pierce, Charles A. Dana CenterJoyce Schaeffer, North Lamar Independent School DistrictCathy L. Seeley, University of Texas at AustinCaren Sorrells, Birdville Independent School DistrictVanessa Spiegel, Port Neches-Grove Independent School DistrictPam Summers, Lubbock Independent School DistrictFrances M. Thompson, Texas Woman�’s UniversityEmma Treviño, Charles A. Dana CenterLuAnn Weynand, North East Independent School District
With Special Thanks To:Brian Sargent, Charles A. Dana CenterHee-Joon Kim, Charles A. Dana CenterMountain Creek Neighborhood Kids, P ugerville, TexasMartin Middle School Students, Corpus Christi, TexasBaker Middle School Students, Corpus Christi, TexasBedichek Middle School Students, Austin, Texas
vi
TEKS and TAKS Resources
The mathematics Texas Essential Knowledge and Skills (TEKS) were developed by the state of Texas to clarify what all students should know and be able to do in mathematics in kindergarten through grade 12. Districts are required to provide instruction that is aligned with the mathematics TEKS, which were adopted by the State Board of Education in 1997 and implemented statewide in 1998. The mathematics TEKS also form the objectives and student expectations for the mathematics portion of the Texas Assessment of Knowledge and Skills (TAKS) for grades 3 through 10 and for the Grade 11 Exit Level assessment.
The mathematics TEKS can be downloaded in printable format, free of charge, from the Texas Education Agency website (www.tea.state.tx.us/teks). Bound versions of the mathematics and science TEKS are available for a fee from the Charles A. Dana Center at The University of Texas at Austin (www.utdanacenter.org).
Resources for implementing the mathematics TEKS, including professional development opportunities, are available through the Texas Education Agency and the Charles A. Dana Center, formerly the state-designated Mathematics Center for Educator Development. Online resources can be found in the Mathematics TEKS Toolkit at www.mathtekstoolkit.org.
Additional products and services that may be of interest are available from the Dana Center at www.utdanacenter.org. These include the following:
• TEKS, TAAS, and TAKS: What�’s Tested at Grades 3�–8? charts
• Mathematics Abridged TEKS charts
• Mathematics TEKS �“Big Picture�” posters
• Mathematics Standards in the Classroom; Resources for Grades 3�–5
• Mathematics Standards in the Classroom; Resources for Grades 6�–8
• Algebra I Assessments and the corresponding professional development
• Geometry Assessments and the corresponding professional development
• Algebra II Assessments and the corresponding professional development
• TEXTEAMS professional development mathematics institutes
• TEKS for Leaders professional development modules for principals and other administrators
vii
CONTENTS
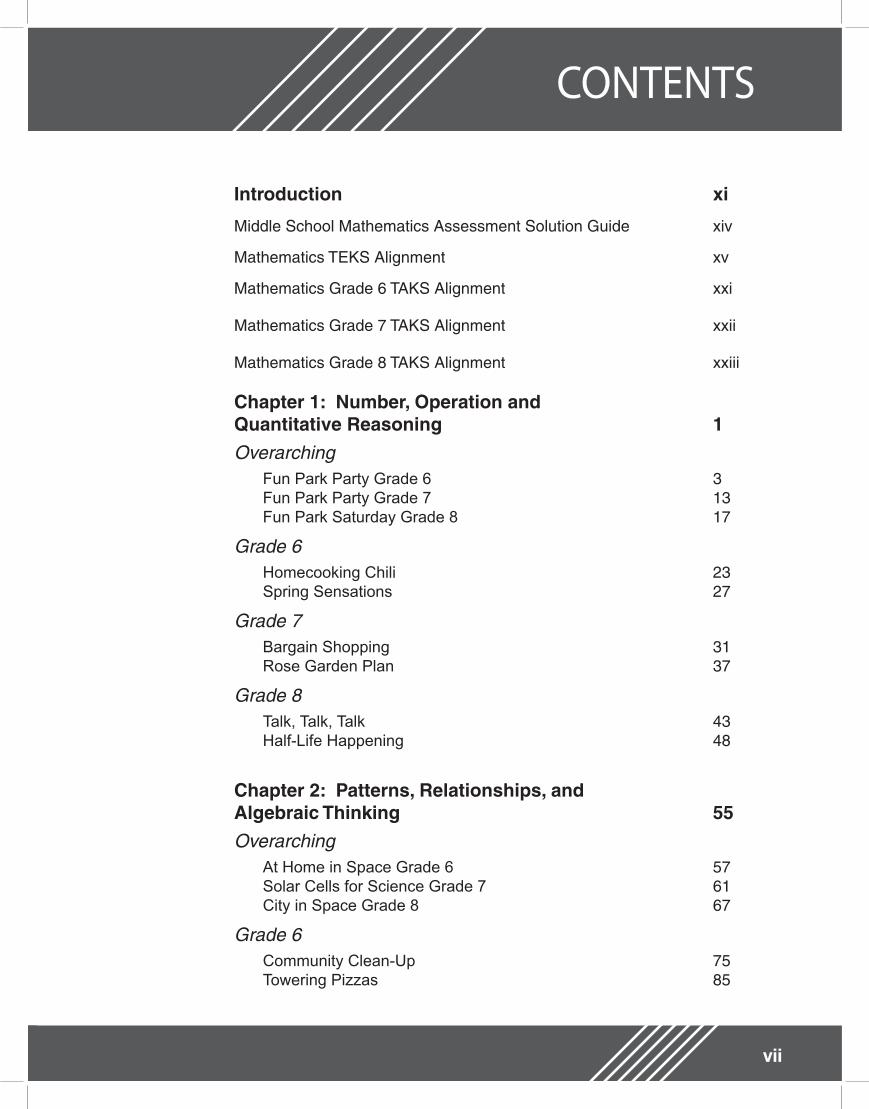
Introduction xi
Middle School Mathematics Assessment Solution Guide xiv
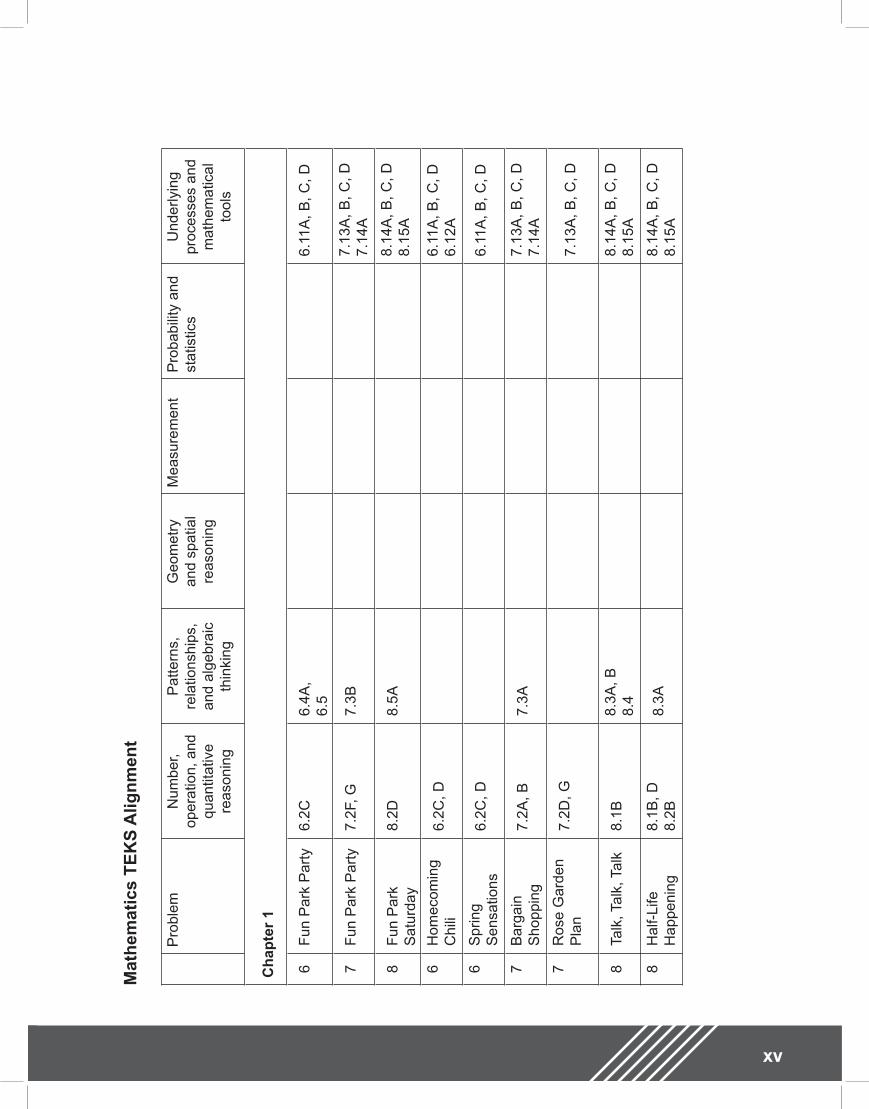
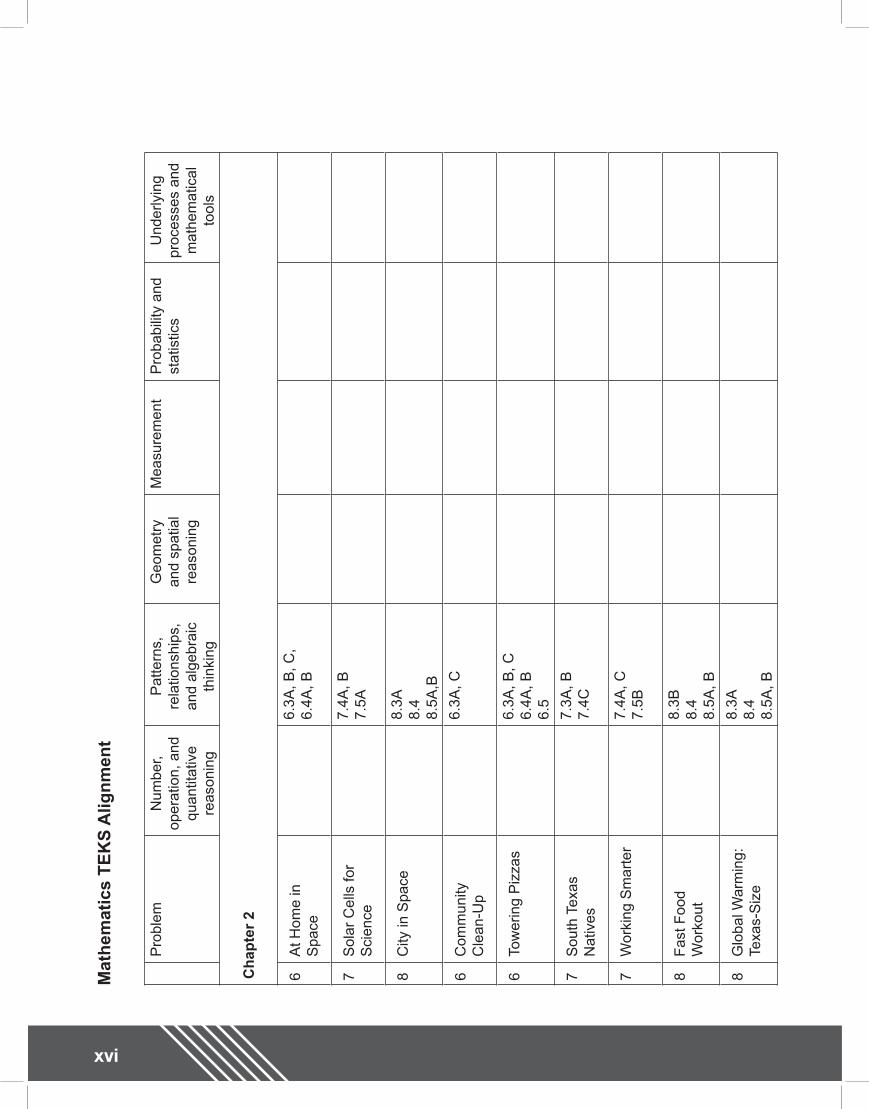
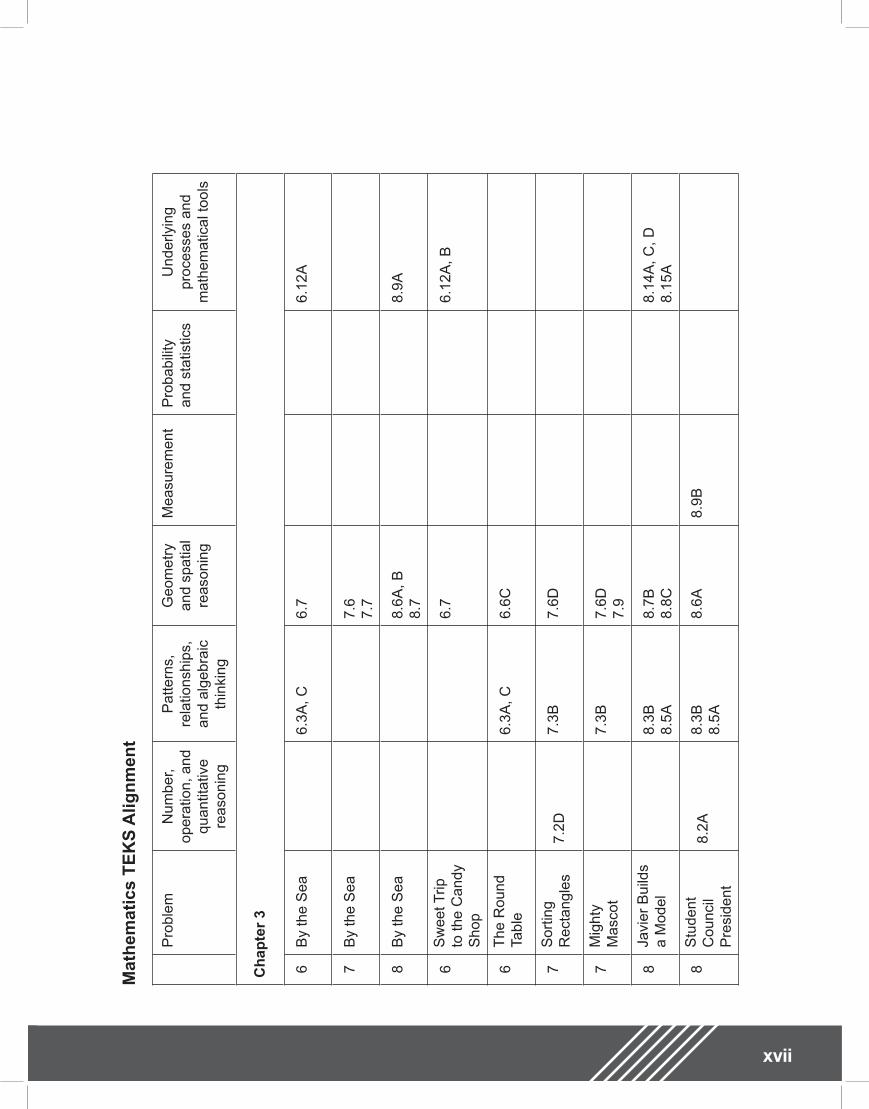
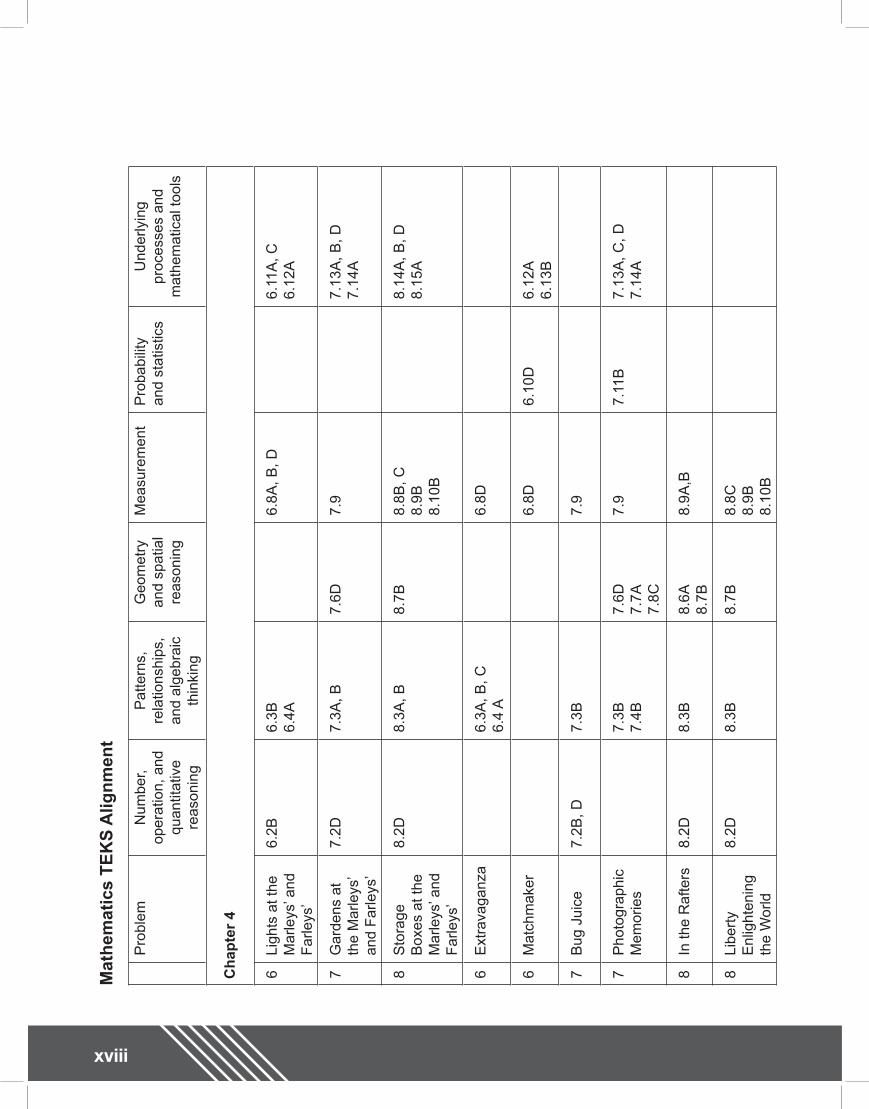
Mathematics TEKS Alignment xv
Mathematics Grade 6 TAKS Alignment xxi
Mathematics Grade 7 TAKS Alignment xxii
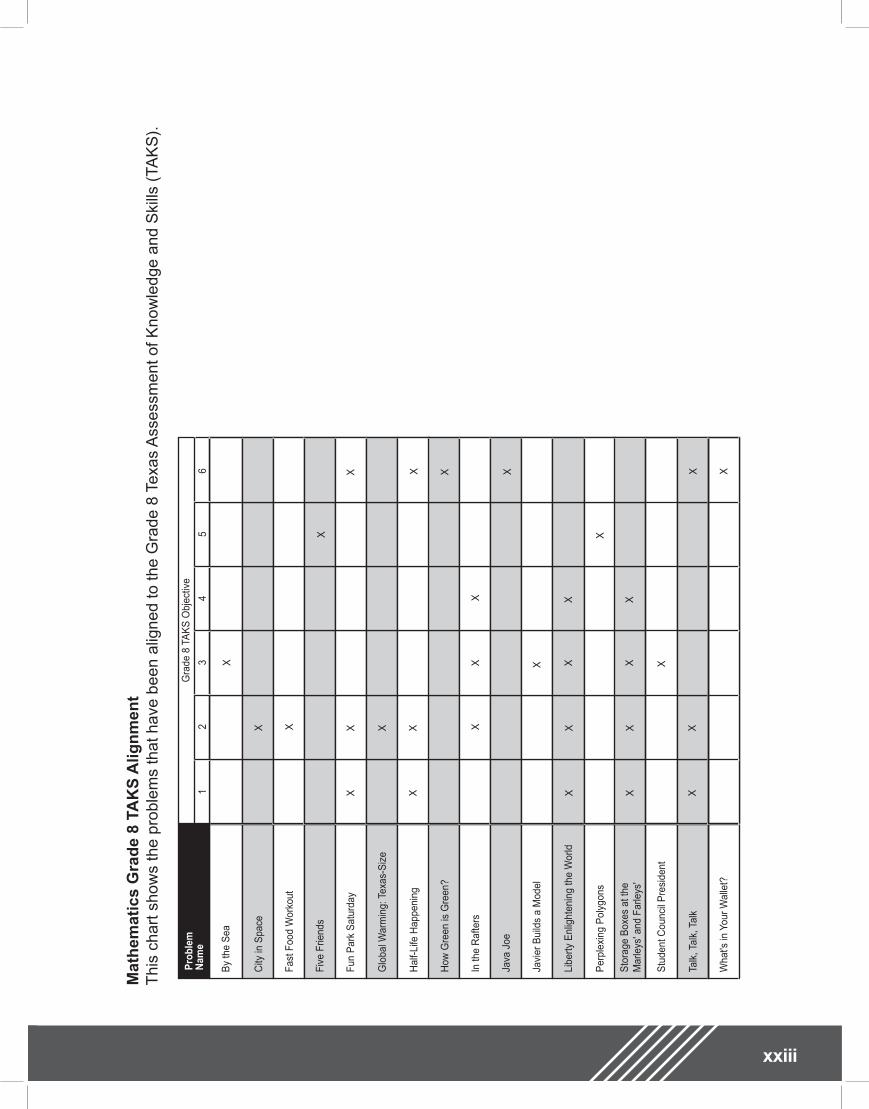
Mathematics Grade 8 TAKS Alignment xxiii
Chapter 1: Number, Operation andQuantitative Reasoning 1Overarching Fun Park Party Grade 6 3 Fun Park Party Grade 7 13 Fun Park Saturday Grade 8 17
Grade 6 Homecooking Chili 23 Spring Sensations 27
Grade 7 Bargain Shopping 31 Rose Garden Plan 37
Grade 8 Talk, Talk, Talk 43 Half-Life Happening 48
Chapter 2: Patterns, Relationships, andAlgebraic Thinking 55Overarching At Home in Space Grade 6 57 Solar Cells for Science Grade 7 61 City in Space Grade 8 67
Grade 6 Community Clean-Up 75 Towering Pizzas 85
viii
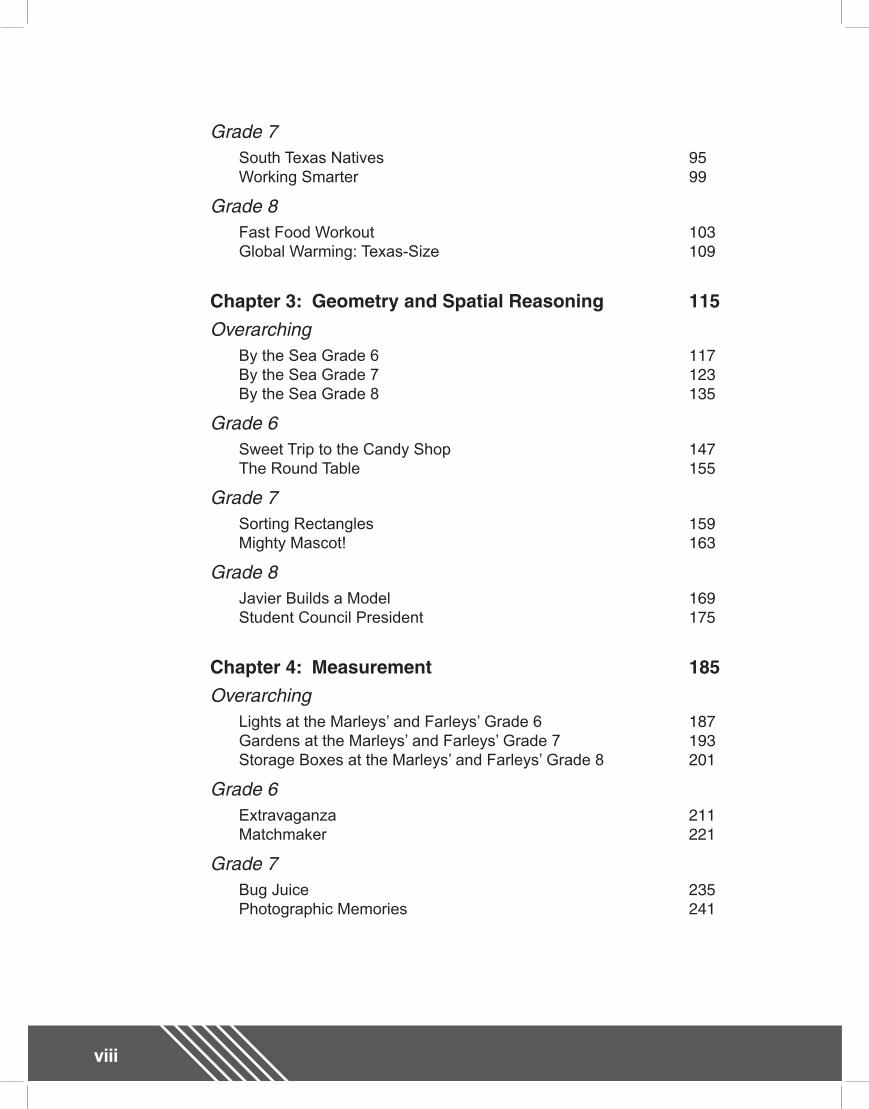
Grade 7 South Texas Natives 95 Working Smarter 99
Grade 8 Fast Food Workout 103 Global Warming: Texas-Size 109
Chapter 3: Geometry and Spatial Reasoning 115Overarching By the Sea Grade 6 117 By the Sea Grade 7 123 By the Sea Grade 8 135
Grade 6 Sweet Trip to the Candy Shop 147 The Round Table 155
Grade 7 Sorting Rectangles 159 Mighty Mascot! 163
Grade 8 Javier Builds a Model 169 Student Council President 175
Chapter 4: Measurement 185Overarching Lights at the Marleys�’ and Farleys�’ Grade 6 187 Gardens at the Marleys�’ and Farleys�’ Grade 7 193 Storage Boxes at the Marleys�’ and Farleys�’ Grade 8 201
Grade 6 Extravaganza 211 Matchmaker 221
Grade 7 Bug Juice 235 Photographic Memories 241
ix
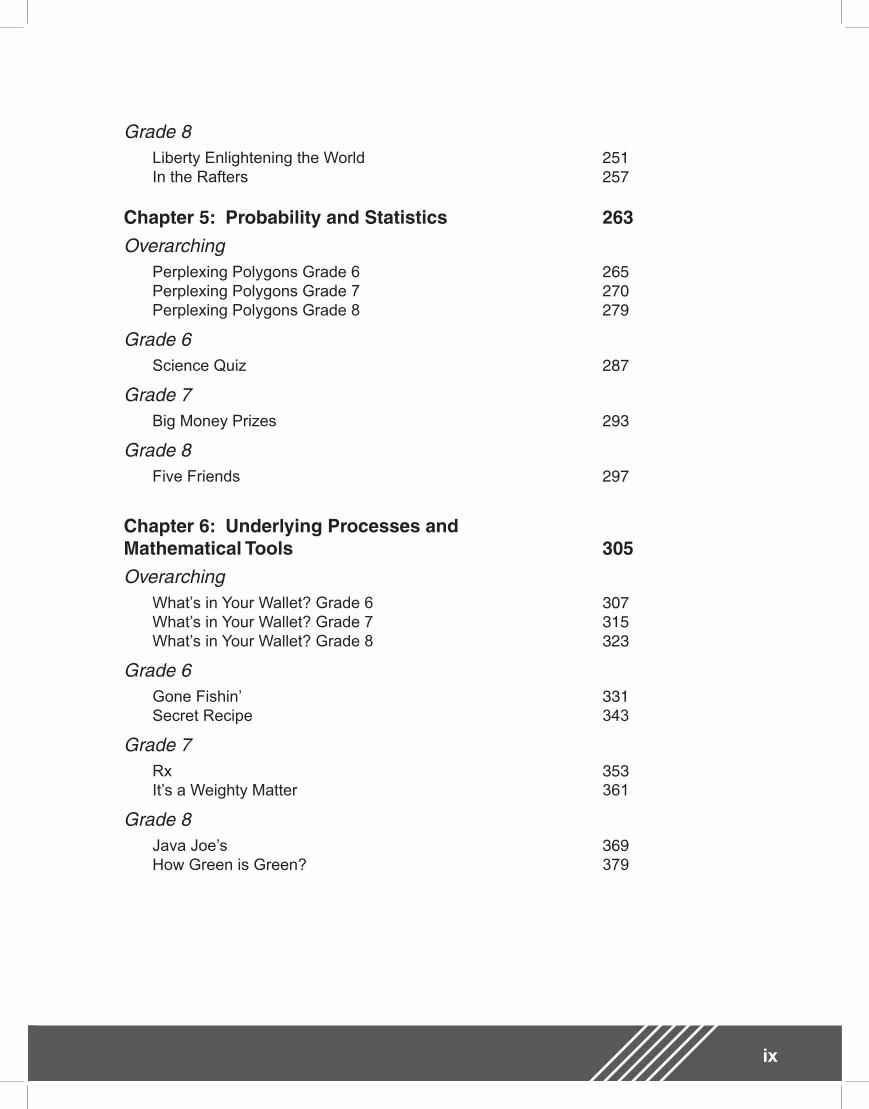
Grade 8 Liberty Enlightening the World 251 In the Rafters 257
Chapter 5: Probability and Statistics 263Overarching Perplexing Polygons Grade 6 265 Perplexing Polygons Grade 7 270 Perplexing Polygons Grade 8 279
Grade 6 Science Quiz 287
Grade 7 Big Money Prizes 293
Grade 8 Five Friends 297
Chapter 6: Underlying Processes andMathematical Tools 305Overarching What�’s in Your Wallet? Grade 6 307 What�’s in Your Wallet? Grade 7 315 What�’s in Your Wallet? Grade 8 323
Grade 6 Gone Fishin�’ 331 Secret Recipe 343
Grade 7 Rx 353 It�’s a Weighty Matter 361
Grade 8 Java Joe�’s 369 How Green is Green? 379

x
xi
1 National Council of Teachers of Mathematics. 2000. Principles and Standards for School Mathematics.
Reston, VA: National Council of Teachers of Mathematics.
Introduction
The Dana Center developed Middle School Mathematics Assessments: Proportional Reasoning as a resource for teachers to use to provide ongoing assessment integrated with middle school mathematics instruction.
Principles and Standards for School Mathematics (National Council of Teachers of Mathematics, 2000) states: �“Assessment should support the learning of important mathematics and furnish useful information to both teachers and students.�” 1 Further, NCTM (1995) identi ed the following six standards to guide classroom assessment: 2
Standard 1: Assessment should re ect the mathematics that all students needto know and be able to do.
Standard 2: Assessment should enhance mathematics learning.
Standard 3: Assessment should promote equity.
Standard 4: Assessment should be an open process.
Standard 5: Assessment should promote valid inferences about mathematics learning.
Standard 6: Assessment should be a coherent process.
Implementing these assessment standards may require signi cant changes in how teachers view and use assessment in the mathematics classroom. Teachers should assess frequently to monitor individual performance and guide instruction.
What is Middle School Mathematics Assessments:Proportional Reasoning?
Middle School Mathematics Assessments: Proportional Reasoning contains problems that re ect what all students need to know and be able to do in sixth-, seventh-, and eighth-grade mathematics. The resource focuses on exploring proportionality through the content and process strands. These assessments may be formative, summative, or ongoing. The problems focus on students�’ conceptual understanding as well as their procedural knowledge. The tasks require more than right or wrong answers; they focus on how students are thinking about a situation.
Why focus on proportional reasoning?
The �“big idea�” of proportionality, including proportional relationships and proportional reasoning, is central to an understanding of middle and high school mathematics, and
2 National Council of Teachers of Mathematics. 1995. Assessment Standards for School Mathematics. Reston, VA:
National Council of Teachers of Mathematics.
xii
provides a critical foundation for formal algebra study. The concept of proportionality operates as a single thread running through and connecting each of the content and process strands of middle school mathematics.
Proportionality involves recognizing quantities that are related by multiplication. Numbers, tables, graphs, words, and equations are used to think about the quantities and their relationships. Fluency with proportionality develops through problem solving and reasoning in many areas, including ratio and proportion, percent, similarity, scaling, linear equations, slope, and probability.
What is the purpose of Middle School Mathematics Assessments: Proportional Reasoning?
The purpose of these assessments is to make clear to teachers, students, and parents what is being taught and learned about proportionality throughout middle school mathematics. Teachers should use evidence of student insight, student misconceptions, and student problem-solving strategies to guide their instruction. Teachers may also use the questions included with the assessments to guide learning and to assess student understanding. The use of these assessments should help teachers enhance student learning and provide them with a source of evidence on which they may base their instructional decisions.
What is the format of Middle School Mathematics Assessments: Proportional Reasoning?
This book contains 51 problems divided by chapter according to their TEKS strand. The problems address how proportionality can be used to show understanding of the TEKS.
The problems have been divided into six categories:
Number, Operation, and Quantitative Reasoning
Patterns, Relationships, and Algebraic Thinking
Geometry and Spatial Reasoning
Measurement
Probability and Statistics
Underlying Processes and Mathematical Tools
Each problem
• includes a mathematics task,• is aligned with the Grades 6, 7, and 8 mathematics Texas Essential Knowledge and
Skills (TEKS) student expectations,• is aligned with the Texas Assessment of Knowledge and Skills (TAKS) objectives,• includes �“scaffolding�” questions that the teacher may use to help the student to
analyze the problem,
xiii
• provides a sample solution,* and• includes extension questions to bring out additional mathematical concepts in a
summative discussion of solutions to the problem.
*The sample solution is only one way that a problem may be approached and is not necessarily the �“best�” solution. For many of the problems there are other approaches that will also provide a correct analysis of the problem. The authors have attempted to illustrate a variety of methods in the different problem solutions. Several of the problems include samples of anonymous student work.
Following this introduction are alignments of all the problems to the TEKS and to the grade-level TAKS objectives.
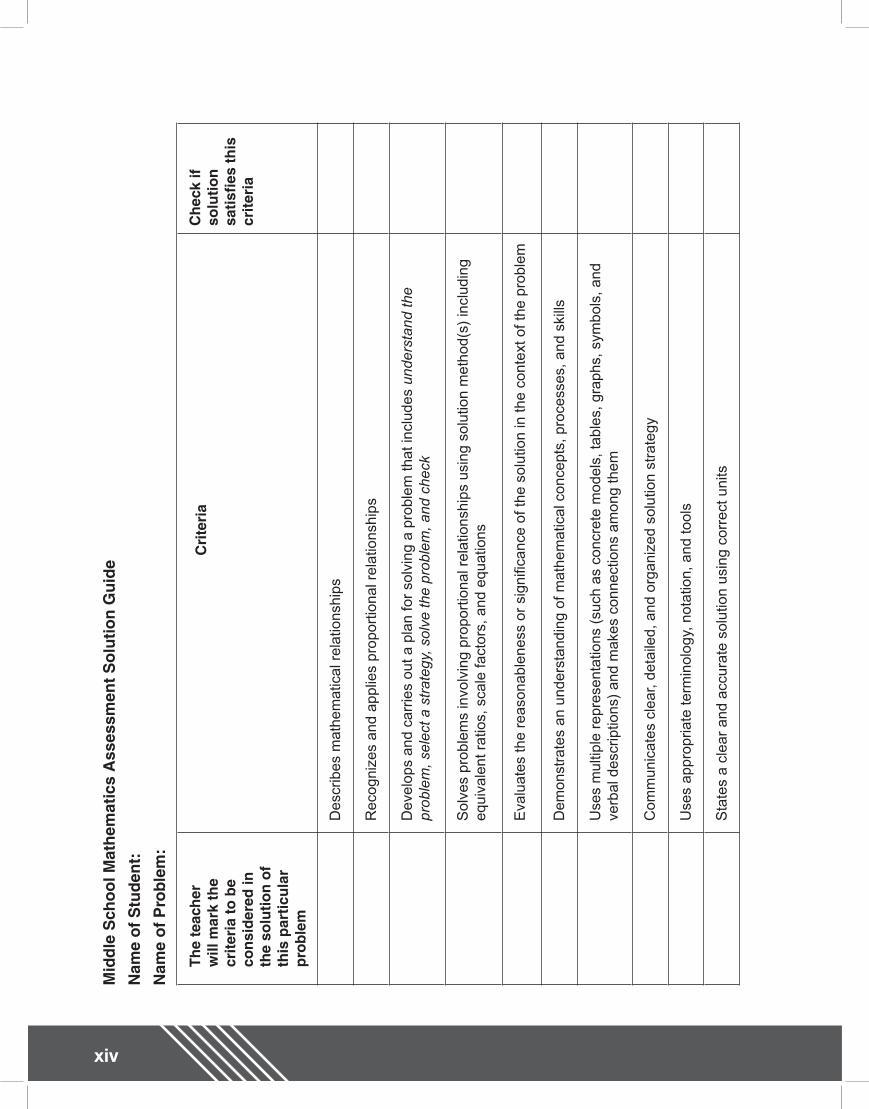
What is the solution guide?
The solution guide is a problem-solving checklist that may be used to understand what is necessary for a complete problem solution. When assigning the problem, the teacher will give the students the solution guide and will indicate which of the criteria should be considered in the problem analysis. In most problems all of the criteria are important, but initially the teacher may want to focus on only two or three criteria. On the page before a student work sample in this book, comments on some of the criteria that are evident from the student�’s solution are given. The professional development experience described below will help the teacher use this tool in the classroom and will also help guide the teacher to use other assessment evaluation tools.
TEXTEAMS Practice-Based Professional Development�—Middle School Mathematics Assessments: Proportional Reasoning
The Dana Center has developed a three-day TEXTEAMS institute in which participants experience selected assessments, examine the assessments for alignment with the TEKS and TAKS, analyze student work to evaluate student understanding, consider methods for evaluating student work, view a video of students working on the assessments, develop strategies for classroom implementation, and consider how the assessments support the TAKS. Teachers should contact their local school district or regional service center to determine when this institute is offered.
xiv
Mid
dle
Sch
ool M
athe
mat
ics
Ass
essm
ent S
olut
ion
Gui
de
Nam
e of
Stu
dent
:
Nam
e of
Pro
blem
:
The
teac
her
will
mar
k th
e cr
iteri
a to
be
cons
ider
ed in
th
e so
lutio
n of
th
is p
artic
ular
pr
oble
m
Cri
teri
a C
heck
if
solu
tion
satis
fi es
this
cr
iteri
a
Des
crib
es m
athe
mat
ical
rel
atio
nshi
ps
Rec
ogni
zes
and
appl
ies
prop
ortio
nal r
elat
ions
hips
Dev
elop
s an
d ca
rrie
s ou
t a p
lan
for
solv
ing
a pr
oble
m th
at in
clud
es u
nder
stan
d th
e pr
oble
m, s
elec
t a s
trat
egy,
sol
ve th
e pr
oble
m, a
nd c
heck
Sol
ves
prob
lem
s in
volv
ing
prop
ortio
nal r
elat
ions
hips
usi
ng s
olut
ion
met
hod(
s) in
clud
ing
equi
vale
nt r
atio
s, s
cale
fact
ors,
and
equ
atio
ns
Eva
luat
es th
e re
ason
able
ness
or
sign
i ca
nce
of th
e so
lutio
n in
the
cont
ext o
f the
pro
blem
Dem
onst
rate
s an
und
erst
andi
ng o
f mat
hem
atic
al c
once
pts,
pro
cess
es, a
nd s
kills
Use
s m
ultip
le r
epre
sent
atio
ns (
such
as
conc
rete
mod
els,
tabl
es, g
raph
s, s
ymbo
ls, a
nd
verb
al d
escr
iptio
ns)
and
mak
es c
onne
ctio
ns a
mon
g th
em
Com
mun
icat
es c
lear
, det
aile
d, a
nd o
rgan
ized
sol
utio
n st
rate
gy
Use
s ap
prop
riate
term
inol
ogy,
not
atio
n, a
nd to
ols
Sta
tes
a cl
ear
and
accu
rate
sol
utio
n us
ing
corr
ect u
nits
xv
Mat
hem
atic
s T
EK
S A
lign
men
t
Pro
blem
Num
ber,
oper
atio
n, a
nd
quan
titat
ive
reas
onin
g
Pat
tern
s,
rela
tions
hips
, an
d al
gebr
aic
thin
king
Geo
met
ry
and
spat
ial
reas
onin
g
Mea
sure
men
tP
roba
bilit
y an
d st
atis
tics
Und
erly
ing
proc
esse
s an
d m
athe
mat
ical
to
ols
Ch
apte
r 1
6F
un P
ark
Par
ty
6.2C
6.4A
,6.
56.
11A
, B, C
, D
7F
un P
ark
Par
ty
7.2F
, G7.
3B7.
13A
, B, C
, D
7.14
A
8F
un P
ark
Sat
urda
y 8.
2D8.
5A8.
14A
, B, C
, D8.
15A
6H
omec
omin
g C
hili
6.2C
, D6.
11A
, B, C
, D6.
12A
6S
prin
g S
ensa
tions
6.2C
, D6.
11A
, B, C
, D
7B
arga
in
Sho
ppin
g7.
2A, B
7.3A
7.13
A, B
, C, D
7.14
A
7R
ose
Gar
den
Pla
n7.
2D, G
7.13
A, B
, C, D
8Ta
lk, T
alk,
Tal
k8.
1B8.
3A, B
8.
48.
14A
, B, C
, D8.
15A
8H
alf-
Life
H
appe
ning
8.1B
, D
8.2B
8.3A
8.14
A, B
, C, D
8.15
A
xvi
Pro
blem
Num
ber,
oper
atio
n, a
nd
quan
titat
ive
reas
onin
g
Pat
tern
s,
rela
tions
hips
, an
d al
gebr
aic
thin
king
Geo
met
ry
and
spat
ial
reas
onin
g
Mea
sure
men
tP
roba
bilit
y an
d st
atis
tics
Und
erly
ing
proc
esse
s an
d m
athe
mat
ical
to
ols
Ch
apte
r 2
6A
t Hom
e in
S
pace
6.3A
, B, C
, 6.
4A, B
7S
olar
Cel
ls fo
r S
cien
ce
7.4A
, B7.
5A
8C
ity in
Spa
ce
8.3A
8.4
8.5A
,B
6C
omm
unity
C
lean
-Up
6.3A
, C
6To
wer
ing
Piz
zas
6.3A
, B, C
6.
4A, B
6.5
7S
outh
Tex
as
Nat
ives
7.3A
, B7.
4C
7W
orki
ng S
mar
ter
7.4A
, C7.
5B
8F
ast F
ood
Wor
kout
8.3B
8.4
8.5A
, B
8G
loba
l War
min
g:Te
xas-
Siz
e
8.3A
8.4
8.5A
, B
Mat
hem
atic
s T
EK
S A
lign
men
t
xvii
Pro
blem
Num
ber,
oper
atio
n, a
nd
quan
titat
ive
reas
onin
g
Pat
tern
s,
rela
tions
hips
, an
d al
gebr
aic
thin
king
Geo
met
ry
and
spat
ial
reas
onin
g
Mea
sure
men
tP
roba
bilit
y an
d st
atis
tics
Und
erly
ing
proc
esse
s an
d m
athe
mat
ical
tool
s
Ch
apte
r 3
6B
y th
e S
ea
6.3A
, C6.
76.
12A
7B
y th
e S
ea
7.6
7.7
8B
y th
e S
ea
8.6A
, B8.
78.
9A
6S
wee
t Trip
to
the
Can
dy
Sho
p
6.7
6.12
A, B
6T
he R
ound
Ta
ble
6.3A
, C6.
6C
7S
ortin
g R
ecta
ngle
s7.
2D7.
3B7.
6D
7M
ight
y M
asco
t7.
3B7.
6D7.
9
8Ja
vier
Bui
lds
a M
odel
8.3B
8.5A
8.7B
8.8C
8.14
A, C
, D8.
15A
8S
tude
nt
Cou
ncil
Pre
side
nt
8.2A
8.3B
8.5A
8.6A
8.9B
Mat
hem
atic
s T
EK
S A
lign
men
t
xviii
Pro
blem
Num
ber,
oper
atio
n, a
nd
quan
titat
ive
reas
onin
g
Pat
tern
s,
rela
tions
hips
, an
d al
gebr
aic
thin
king
Geo
met
ry
and
spat
ial
reas
onin
g
Mea
sure
men
tP
roba
bilit
y an
d st
atis
tics
Und
erly
ing
proc
esse
s an
d m
athe
mat
ical
tool
s
Ch
apte
r 4
6Li
ghts
at t
he
Mar
leys
�’ and
F
arle
ys�’
6.2B
6.3B
6.4A
6.8A
, B, D
6.11
A, C
6.
12A
7G
arde
ns a
t th
e M
arle
ys�’
and
Far
leys
�’
7.2D
7.3A
, B7.
6D7.
97.
13A
, B, D
7.14
A
8S
tora
ge
Box
es a
t the
M
arle
ys�’ a
nd
Far
leys
�’
8.2D
8.3A
, B8.
7B8.
8B, C
8.9B
8.10
B
8.14
A, B
, D8.
15A
6E
xtra
vaga
nza
6.3A
, B, C
6.4
A6.
8D
6M
atch
mak
er6.
8D6.
10D
6.12
A6.
13B
7B
ug J
uice
7.2B
, D7.
3B7.
9
7P
hoto
grap
hic
Mem
orie
s7.
3B7.
4B7.
6D7.
7A7.
8C
7.9
7.11
B7.
13A
, C, D
7.14
A
8In
the
Raf
ters
8.
2D8.
3B8.
6A8.
7B8.
9A,B
8Li
bert
y E
nlig
hten
ing
the
Wor
ld
8.2D
8.3B
8.7B
8.8C
8.9B
8.10
B
Mat
hem
atic
s T
EK
S A
lign
men
t
xix
Pro
blem
Num
ber,
oper
atio
n, a
nd
quan
titat
ive
reas
onin
g
Pat
tern
s,
rela
tions
hips
, an
d al
gebr
aic
thin
king
Geo
met
ry
and
spat
ial
reas
onin
g
Mea
sure
men
tP
roba
bilit
y an
d st
atis
tics
Und
erly
ing
proc
esse
s an
d m
athe
mat
ical
to
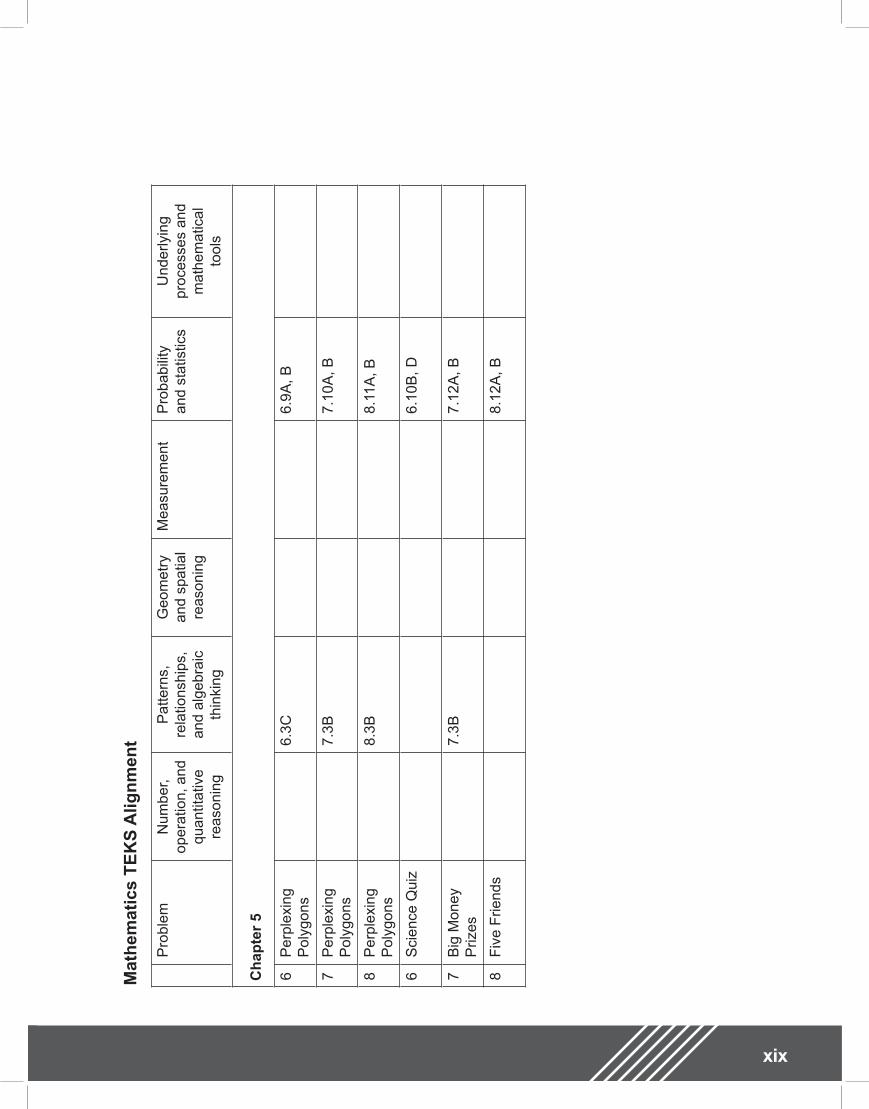
ols
Ch
apte
r 5
6P
erpl
exin
g P
olyg
ons
6.3C
6.9A
, B
7P
erpl
exin
g P
olyg
ons
7.3B
7.10
A, B
8P
erpl
exin
g P
olyg
ons
8.3B
8.11
A, B
6S
cien
ce Q
uiz
6.10
B, D
7B
ig M
oney
P
rizes
7.3B
7.12
A, B
8F
ive
Frie
nds
8.12
A, B
Mat
hem
atic
s T
EK
S A
lign
men
t
xx
Pro
blem
Num
ber,
oper
atio
n, a
nd
quan
titat
ive
reas
onin
g
Pat
tern
s,
rela
tions
hips
, an
d al
gebr
aic
thin
king
Geo
met
ry
and
spat
ial
reas
onin
g
Mea
sure
men
tP
roba
bilit
y an
d st
atis
tics
Und
erly
ing
proc
esse
s an
d m
athe
mat
ical
to
ols
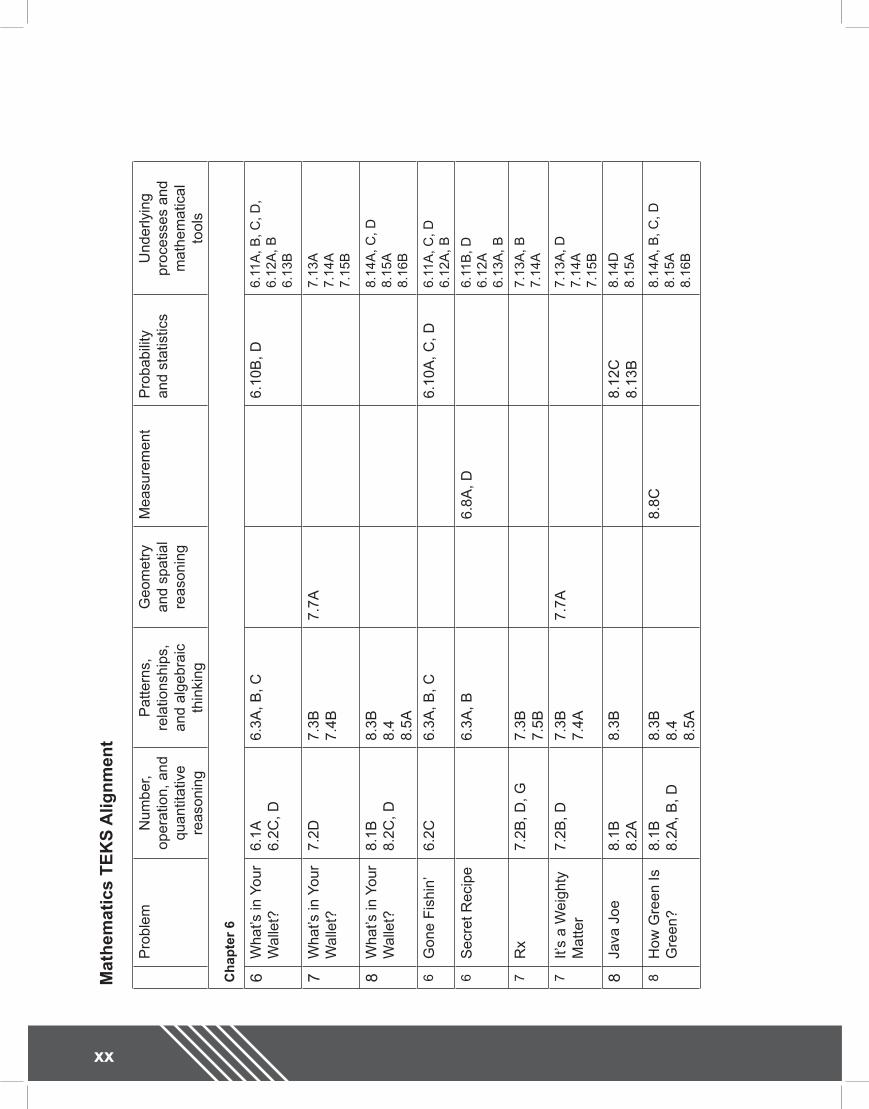
Ch
apte
r 6
6W
hat�’s
in Y
our
Wal
let?
6.1A
6.2C
, D6.
3A, B
, C6.
10B
, D6.
11A
, B, C
, D,
6.12
A, B
6.13
B
7W
hat�’s
in Y
our
Wal
let?
7.2D
7.3B
7.4B
7.7A
7.13
A7.
14A
7.15
B
8W
hat�’s
in Y
our
Wal
let?
8.1B
8.2C
, D8.
3B8.
48.
5A
8.14
A, C
, D8.
15A
8.16
B
6G
one
Fis
hin�’
6.2C
6.3A
, B, C
6.10
A, C
, D6.
11A
, C, D
6.12
A, B
6S
ecre
t Rec
ipe
6.3A
, B6.
8A, D
6.11
B, D
6.12
A6.
13A
, B
7R
x7.
2B, D
, G7.
3B7.
5B7.
13A
, B7.
14A
7It�’
s a
Wei
ghty
M
atte
r7.
2B, D
7.3B
7.4A
7.7A
7.13
A, D
7.14
A7.
15B
8Ja
va J
oe8.
1B8.
2A8.
3B8.
12C
8.13
B8.
14D
8.15
A
8H
ow G
reen
Is
Gre
en?
8.1B
8.2A
, B, D
8.3B
8.4
8.5A
8.8C
8.14
A, B
, C, D
8.
15A
8.16
B
Mat
hem
atic
s T
EK
S A
lign
men
t
xxi
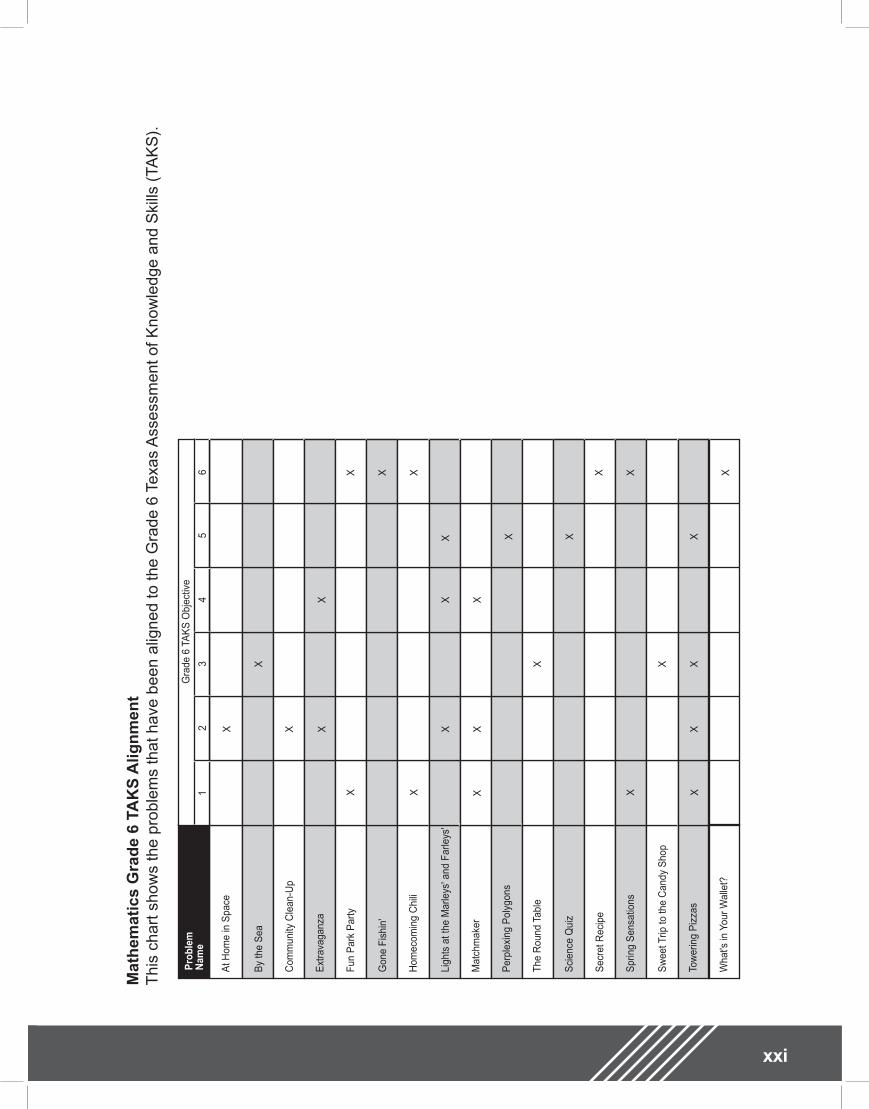
At H
ome
in S
pace
By
the
Sea
Com
mun
ity C
lean
-Up
Ext
rava
ganz
a
Fun
Par
k P
arty
Gon
e Fi
shin
'
Hom
ecom
ing
Chi
li
Ligh
ts a
t the
Mar
leys
' and
Far
leys
'
Mat
chm
aker
Per
plex
ing
Pol
ygon
s
The
Rou
nd T
able
Sci
ence
Qui
z
Sec
ret R
ecip
e
Spr
ing
Sen
satio
ns
Sw
eet T
rip to
the
Can
dy S
hop
Tow
erin
g P
izza
s
Wha
t's in
You
r Wal
let?
Pro
blem
Nam
e
X X X
X X
X X
X X X X X X
X X
X
XX
X
XX
X
X
XX
XX
12
34
56
X
Mat
hem
atic
s G
rad
e 6
TAK
S A
lign
men
tT
his
char
t sho
ws
the
prob
lem
s th
at h
ave
been
alig
ned
to th
e G
rade
6 T
exas
Ass
essm
ent o
f Kno
wle
dge
and
Ski
lls (
TAK
S).
Gra
de 6
TA
KS
Obj
ectiv
e
xxii
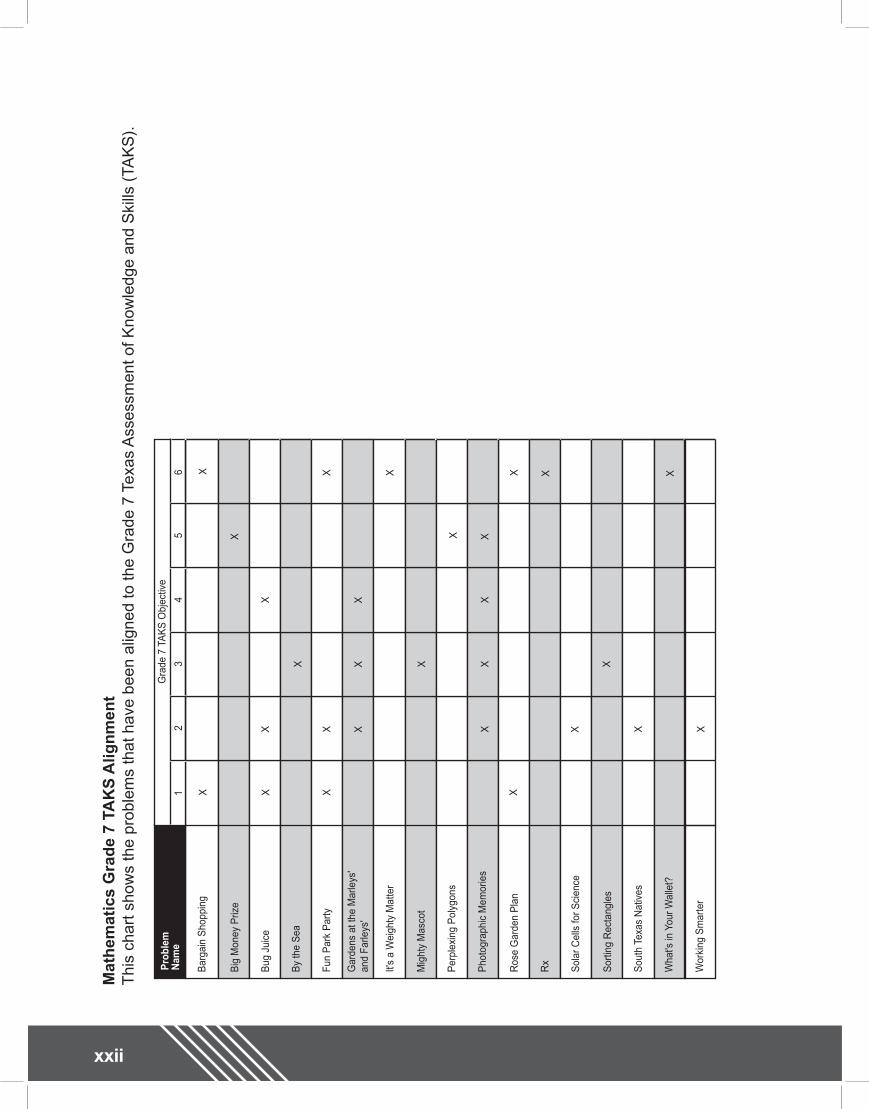
Bar
gain
Sho
ppin
g
Big
Mon
ey P
rize
Bug
Jui
ce
By
the
Sea
Fun
Par
k P
arty
It's
a W
eigh
ty M
atte
r
Gar
dens
at t
he M
arle
ys'
and
Farle
ys'
Mig
hty
Mas
cot
Per
plex
ing
Pol
ygon
s
Pho
togr
aphi
c M
emor
ies
Ros
e G
arde
n P
lan
Rx
Sol
ar C
ells
for S
cien
ce
Sor
ting
Rec
tang
les
Sou
th T
exas
Nat
ives
Wha
t's in
You
r Wal
let?
Pro
blem
Nam
e
X
X
X
XX
X
XX
X
X
XX
X
X
X
X
X
X
X
X
XX
X
X
Wor
king
Sm
arte
rX
X
12
34
56
XX
Mat
hem
atic
s G
rad
e 7
TAK
S A
lign
men
tT
his
char
t sho
ws
the
prob
lem
s th
at h
ave
been
alig
ned
to th
e G
rade
7 T
exas
Ass
essm
ent o
f Kno
wle
dge
and
Ski
lls (
TAK
S).
Gra
de 7
TA
KS
Obj
ectiv
e
xxiii
By
the
Sea
City
in S
pace
Fast
Foo
d W
orko
ut
Five
Frie
nds
Fun
Par
k S
atur
day
Hal
f-Life
Hap
peni
ng
Glo
bal W
arm
ing:
Tex
as-S
ize
Pro
blem
Nam
e
XX
X
X
XXX
X
X X
12
34
56
X
How
Gre
en is
Gre
en?
In th
e R
afte
rs
Java
Joe
Javi
er B
uild
s a
Mod
el
Per
plex
ing
Pol
ygon
s
Libe
rty E
nlig
hten
ing
the
Wor
ld
X
X
XX
XX
XX
X
X
X
Sto
rage
Box
es a
t the
Mar
leys
' and
Far
leys
'
Talk
, Tal
k, T
alk
Stu
dent
Cou
ncil
Pre
side
nt
XX
XX
X
X
Wha
t's in
You
r Wal
let?
X
Mat
hem
atic
s G
rad
e 8
TAK
S A
lign
men
tT
his
char
t sho
ws
the
prob
lem
s th
at h
ave
been
alig
ned
to th
e G
rade
8 T
exas
Ass
essm
ent o
f Kno
wle
dge
and
Ski
lls (
TAK
S).
Gra
de 8
TA
KS
Obj
ectiv
e
XX
Middle SchooIAssessments
Chapter 1:Number, Operation, andQuantitative Reasoning

2 Chapter 1: Number, Operation, and Quantitative Reasoning
3Chapter 1: Number, Operation, and Quantitative Reasoning
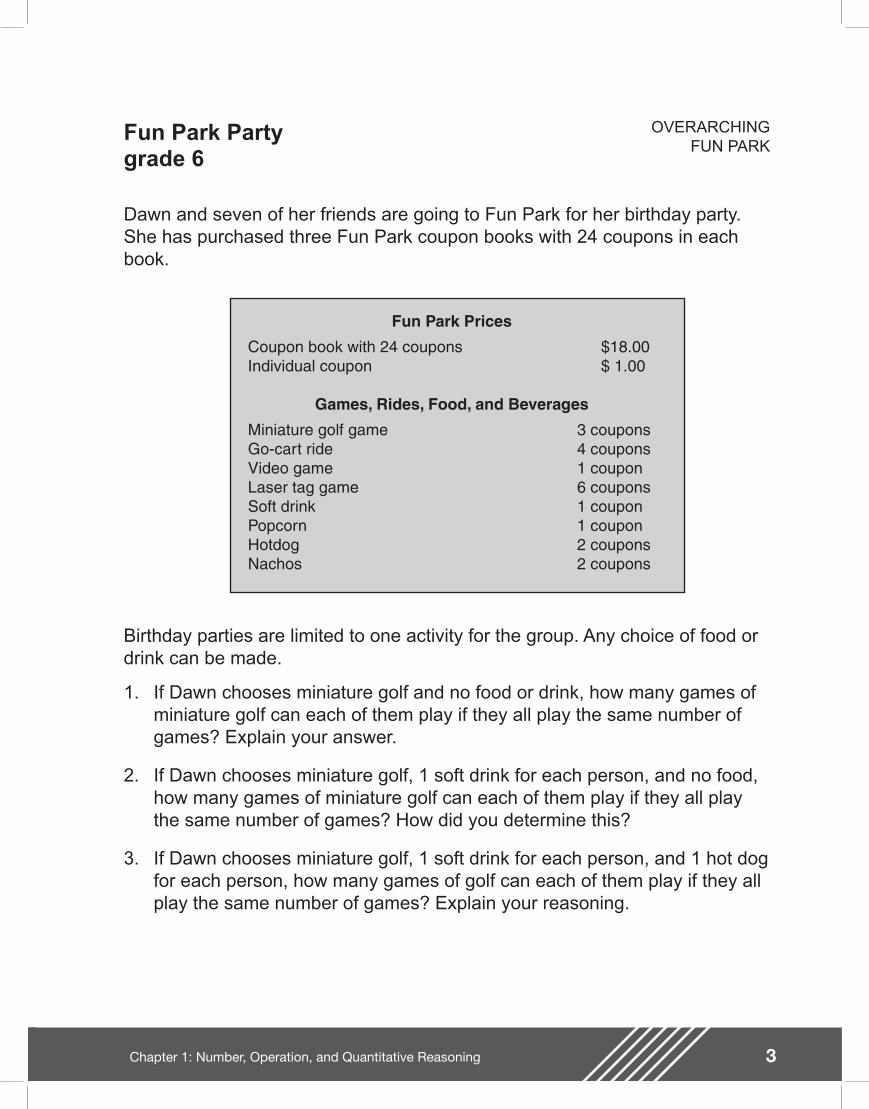
Fun Park Party
Dawn and seven of her friends are going to Fun Park for her birthday party. She has purchased three Fun Park coupon books with 24 coupons in each book.
Birthday parties are limited to one activity for the group. Any choice of food or drink can be made.
1. If Dawn chooses miniature golf and no food or drink, how many games of miniature golf can each of them play if they all play the same number of games? Explain your answer.
2. If Dawn chooses miniature golf, 1 soft drink for each person, and no food, how many games of miniature golf can each of them play if they all play the same number of games? How did you determine this?
3. If Dawn chooses miniature golf, 1 soft drink for each person, and 1 hot dog for each person, how many games of golf can each of them play if they all play the same number of games? Explain your reasoning.
Fun Park Prices
Coupon book with 24 coupons $18.00Individual coupon $ 1.00
Games, Rides, Food, and Beverages
Miniature golf game 3 couponsGo-cart ride 4 couponsVideo game 1 couponLaser tag game 6 couponsSoft drink 1 couponPopcorn 1 couponHotdog 2 couponsNachos 2 coupons
OVERARCHINGFUN PARK
grade 6
4 Chapter 1: Number, Operation, and Quantitative Reasoning
Teacher Notes
Materials
Graphing calculator
Connections to Middle School TEKS
(6.2) Number, operation, and quantitative reasoning. The student adds, subtracts, multiplies, and divides to solve problems and justify solutions. The student is expected to:
(C) use multiplication and division of whole numbers to solve problems including situations involving equivalent ratios and rates
(6.4) Patterns, relationships, and algebraic thinking. The student uses letters as variables in mathematical expressions to describe how one quantity changes when a related quantity changes. The student is expected to:
(A) use tables and symbols to represent and describe proportional and other relationships involving conversions, sequences, perimeter, area, etc.
(6.5) Patterns, relationships, and algebraic thinking. The student uses letters to represent an unknown in an equation. The student is expected to formulate an equation from a problem situation.
Scaffolding Questions
�• How many coupons will it take for everyone at the party to play one game of miniature golf?
�• How many games of golf can be played by everyone at the party with one book of coupons? Two books of coupons? Three books of coupons?
�• What is the relationship between the number of coupons and the number of games of golf?
�• How can you determine how many coupons will be left for miniature golf after everyone has a soft drink?
�• How can you nd the number of coupons that will be left for miniature golf after everyone has a soft drink and hot dog?
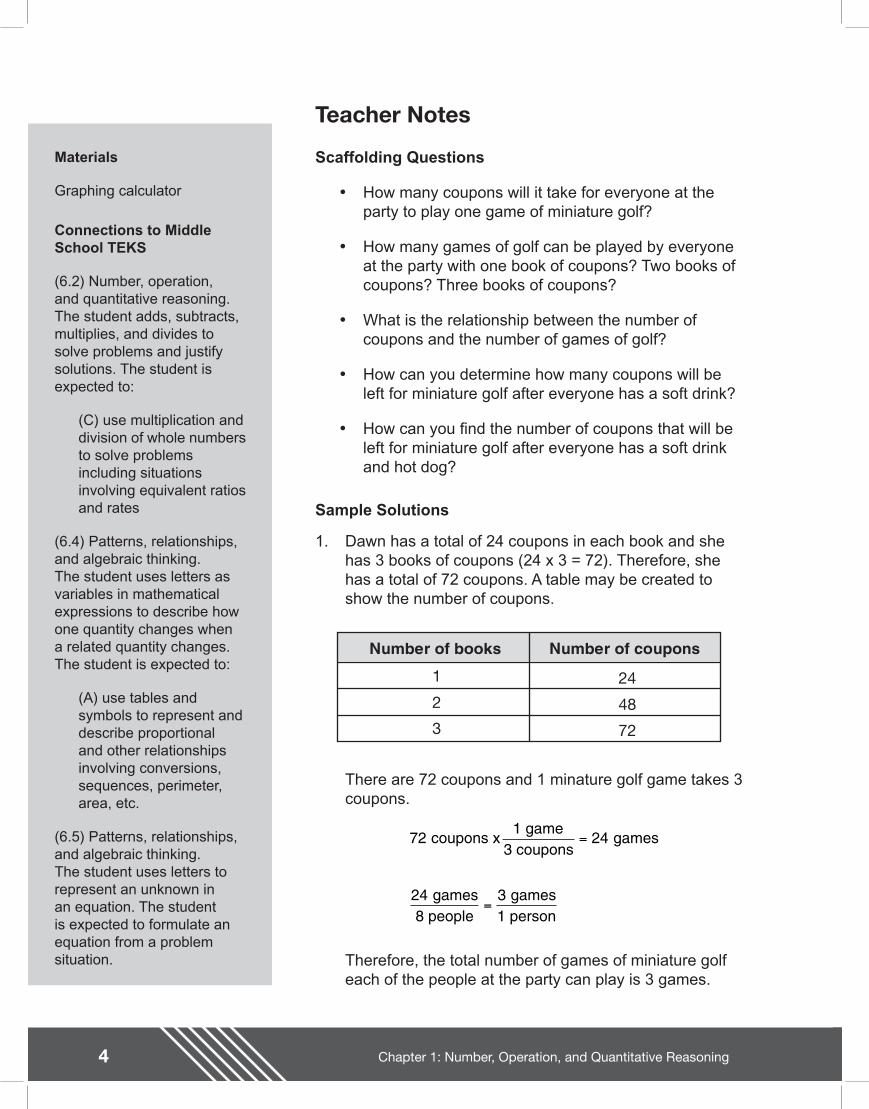
Sample Solutions
1. Dawn has a total of 24 coupons in each book and she has 3 books of coupons (24 x 3 = 72). Therefore, she has a total of 72 coupons. A table may be created to show the number of coupons.
Number of books Number of coupons
1
2
3
24
48
72
There are 72 coupons and 1 minature golf game takes 3 coupons.
72 24
24 3
coupons x1 game
3 coupons games
games8 people
games1 person
=
=
Therefore, the total number of games of miniature golf each of the people at the party can play is 3 games.
5Chapter 1: Number, Operation, and Quantitative Reasoning
(6.11) Underlying processes and mathematical tools. The student applies Grade 6 mathematics to solve problems connected to everyday experiences, investigations in other disciplines, and activities in and outside of school. The student is expected to:
(A) identify and apply mathematics to everyday experiences, to activities in and outside of school, with other disciplines, and with other mathematical topics
(B) use a problem-solving model that incorporates understanding the problem, making a plan, carrying out the plan, and evaluating the solution for reasonableness
(C) select or develop an appropriate problem-solving strategy from a variety of different types, including drawing a picture, looking for a pattern, systematic guessing and checking, acting it out, making a table, working a simpler problem, or working backwards to solve a problem
(D) select tools such as real objects, manipulatives, paper/pencil, and technology
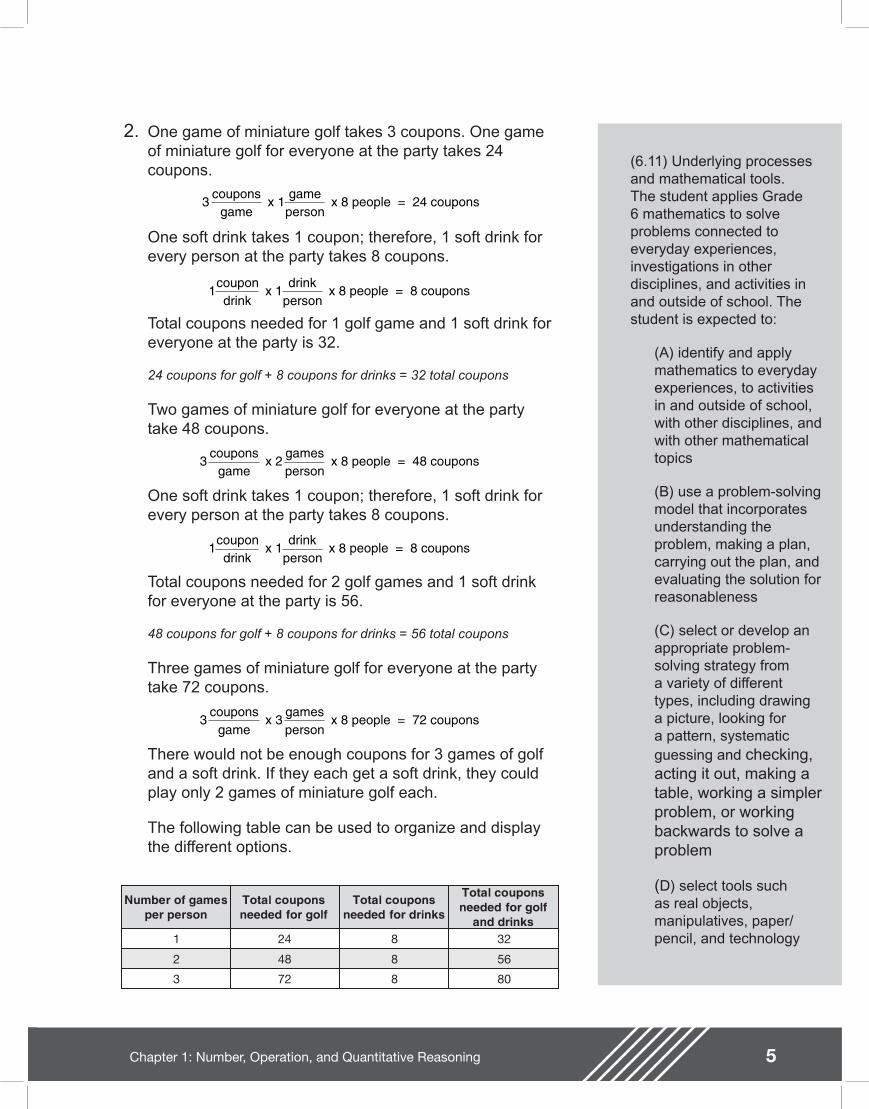
2. One game of miniature golf takes 3 coupons. One game of miniature golf for everyone at the party takes 24 coupons.
One soft drink takes 1 coupon; therefore, 1 soft drink for every person at the party takes 8 coupons.
Total coupons needed for 1 golf game and 1 soft drink for everyone at the party is 32.
24 coupons for golf + 8 coupons for drinks = 32 total coupons
Two games of miniature golf for everyone at the party take 48 coupons.
One soft drink takes 1 coupon; therefore, 1 soft drink for every person at the party takes 8 coupons.
Total coupons needed for 2 golf games and 1 soft drink for everyone at the party is 56.
48 coupons for golf + 8 coupons for drinks = 56 total coupons
Three games of miniature golf for everyone at the party take 72 coupons.
There would not be enough coupons for 3 games of golf and a soft drink. If they each get a soft drink, they could play only 2 games of miniature golf each.
The following table can be used to organize and display the different options.
Number of gamesper person
Total couponsneeded for golf
Total couponsneeded for drinks
Total couponsneeded for golf
and drinks1
2
3
24
48
72
8
8
8
32
56
80
3coupons
game x 1
gameperson
x 8 people = 24 coupons
1coupondrink
x 1drink
person x 8 people = 8 coupons
3coupons
game x 2
gamesperson
x 8 people = 48 coupons
1coupondrink
x 1drink
person x 8 people = 8 coupons
3coupons
game x 3
gamesperson
x 8 people = 72 coupons
6 Chapter 1: Number, Operation, and Quantitative Reasoning
Teacher Notes
or techniques such as mental math, estimation, and number sense to solve problems
Texas Assessment of Knowledge and Skills
Objective 1: The student will demonstrate an understanding of numbers, operations, and quantitative reasoning.
Objective 6: The student will demonstrate an understanding of the mathematical processes and tools used in problem solving.
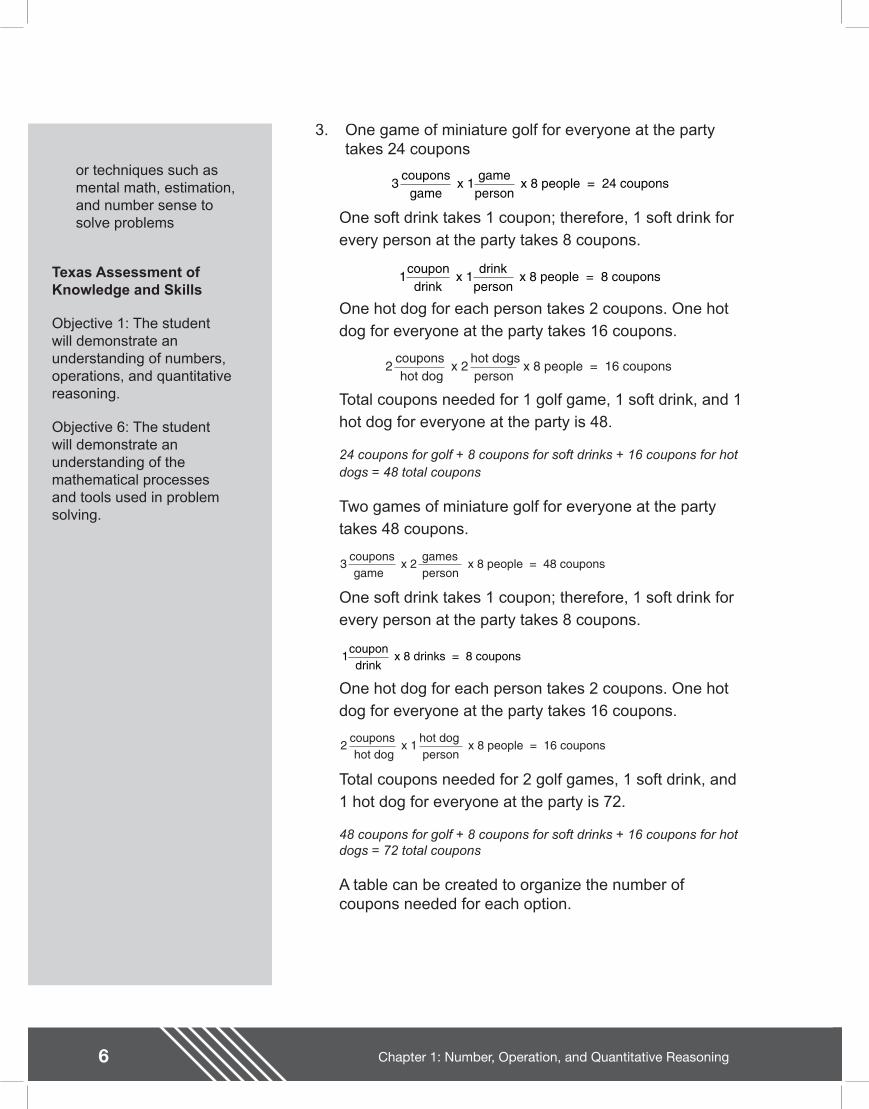
3. One game of miniature golf for everyone at the party takes 24 coupons
One soft drink takes 1 coupon; therefore, 1 soft drink for every person at the party takes 8 coupons.
One hot dog for each person takes 2 coupons. One hot dog for everyone at the party takes 16 coupons.
Total coupons needed for 1 golf game, 1 soft drink, and 1 hot dog for everyone at the party is 48.
24 coupons for golf + 8 coupons for soft drinks + 16 coupons for hot dogs = 48 total coupons
Two games of miniature golf for everyone at the party takes 48 coupons.
One soft drink takes 1 coupon; therefore, 1 soft drink for every person at the party takes 8 coupons.
One hot dog for each person takes 2 coupons. One hot dog for everyone at the party takes 16 coupons.
Total coupons needed for 2 golf games, 1 soft drink, and 1 hot dog for everyone at the party is 72.
48 coupons for golf + 8 coupons for soft drinks + 16 coupons for hot dogs = 72 total coupons
A table can be created to organize the number of coupons needed for each option.
3coupons
game x 1
gameperson
x 8 people = 24 coupons
1coupondrink
x 1drink
person x 8 people = 8 coupons
2couponshot dog
x 2hot dogsperson
x 8 people = 16 coupons
1coupondrink
x 8 drinks = 8 coupons
2couponshot dog
x 1hot dogperson
x 8 people = 16 coupons
3couponsgame
x 2gamesperson
x 8 people = 48 coupons
7Chapter 1: Number, Operation, and Quantitative Reasoning
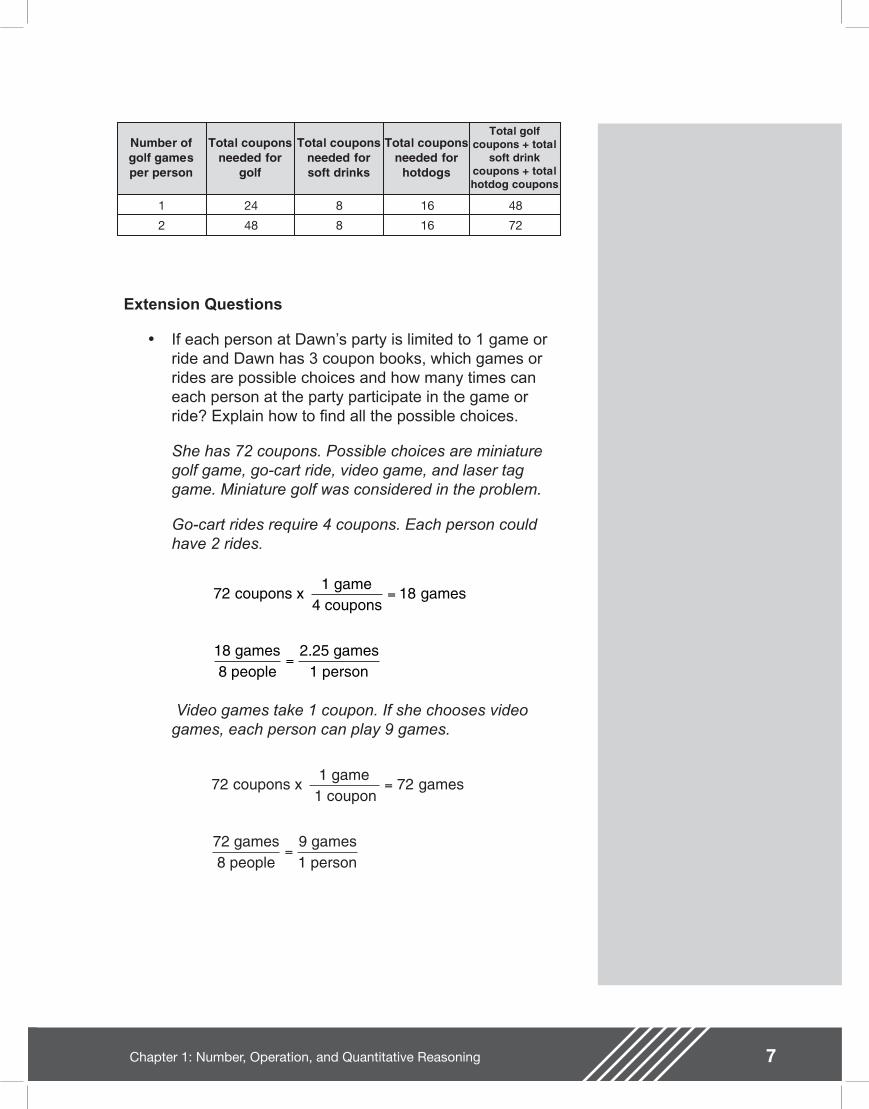
Number ofgolf gamesper person
Total couponsneeded for
golf
Total couponsneeded forsoft drinks
Total couponsneeded for
hotdogs
Total golfcoupons + total
soft drinkcoupons + totalhotdog coupons
1
2
24
48
8
8
16
16
48
72
Extension Questions
�• If each person at Dawn�’s party is limited to 1 game or ride and Dawn has 3 coupon books, which games or rides are possible choices and how many times can each person at the party participate in the game or ride? Explain how to nd all the possible choices.
She has 72 coupons. Possible choices are miniature golf game, go-cart ride, video game, and laser tag game. Miniature golf was considered in the problem.
Go-cart rides require 4 coupons. Each person could have 2 rides.
Video games take 1 coupon. If she chooses video games, each person can play 9 games.
72 18 coupons x 1 game
4 coupons games
18 games8 people
2.25 games1 person
=
=
72 72 coupons x 1 game
1 coupon games
72 games8 people
9 games1 person
=
=
8 Chapter 1: Number, Operation, and Quantitative Reasoning
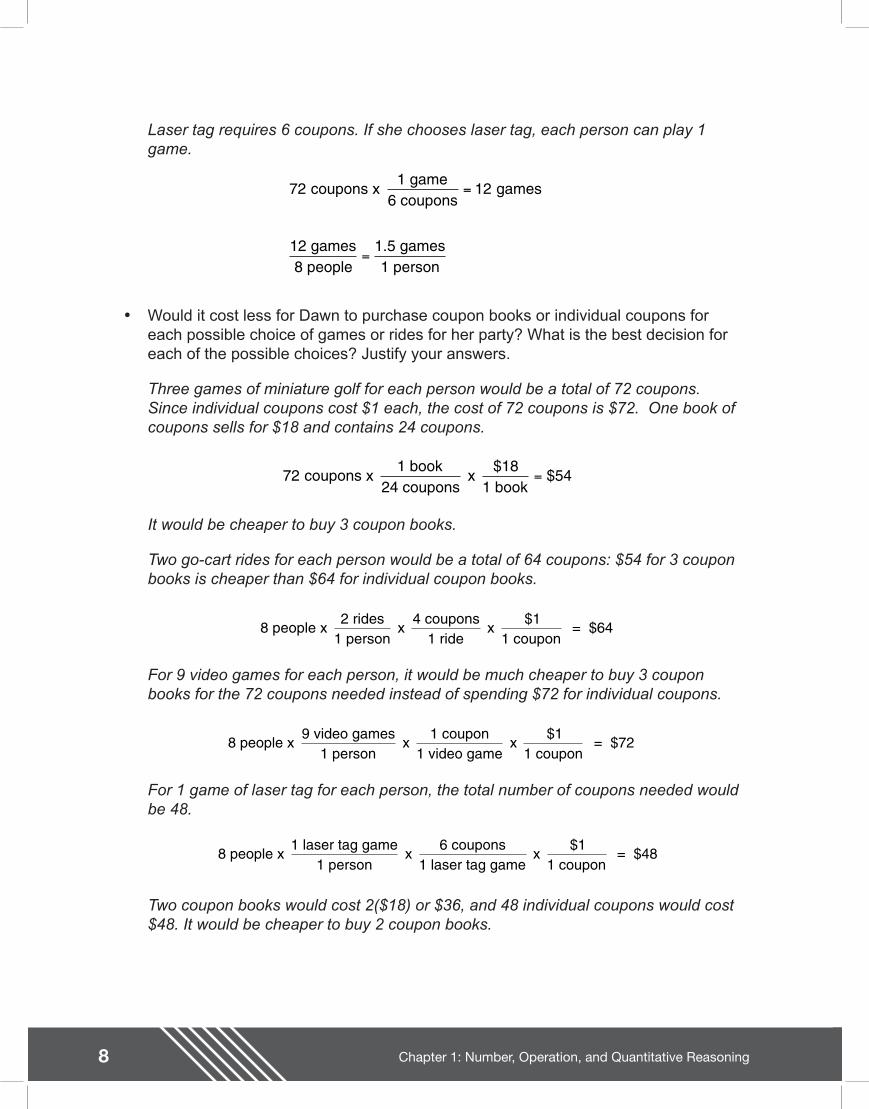
Laser tag requires 6 coupons. If she chooses laser tag, each person can play 1 game.
�• Would it cost less for Dawn to purchase coupon books or individual coupons for each possible choice of games or rides for her party? What is the best decision for each of the possible choices? Justify your answers.
Three games of miniature golf for each person would be a total of 72 coupons. Since individual coupons cost $1 each, the cost of 72 coupons is $72. One book of coupons sells for $18 and contains 24 coupons.
It would be cheaper to buy 3 coupon books.
Two go-cart rides for each person would be a total of 64 coupons: $54 for 3 coupon books is cheaper than $64 for individual coupon books.
For 9 video games for each person, it would be much cheaper to buy 3 coupon books for the 72 coupons needed instead of spending $72 for individual coupons.
For 1 game of laser tag for each person, the total number of coupons needed would be 48.
Two coupon books would cost 2($18) or $36, and 48 individual coupons would cost $48. It would be cheaper to buy 2 coupon books.
72 12 coupons x 1 game
6 coupons games
12 games8 people
1.5 games1 person
=
=
72 54 coupons x 1 book
24 coupons x
$181 book
= $
8 people x 2 rides
1 person x
4 coupons1 ride
x $1
1 coupon = $64
8 people x 9 video games
1 person x
1 coupon1 video game
x $1
1 coupon = $72
8 people x 1 laser tag game
1 person x
6 coupons1 laser tag game
x $1
1 coupon = $48
9Chapter 1: Number, Operation, and Quantitative Reasoning
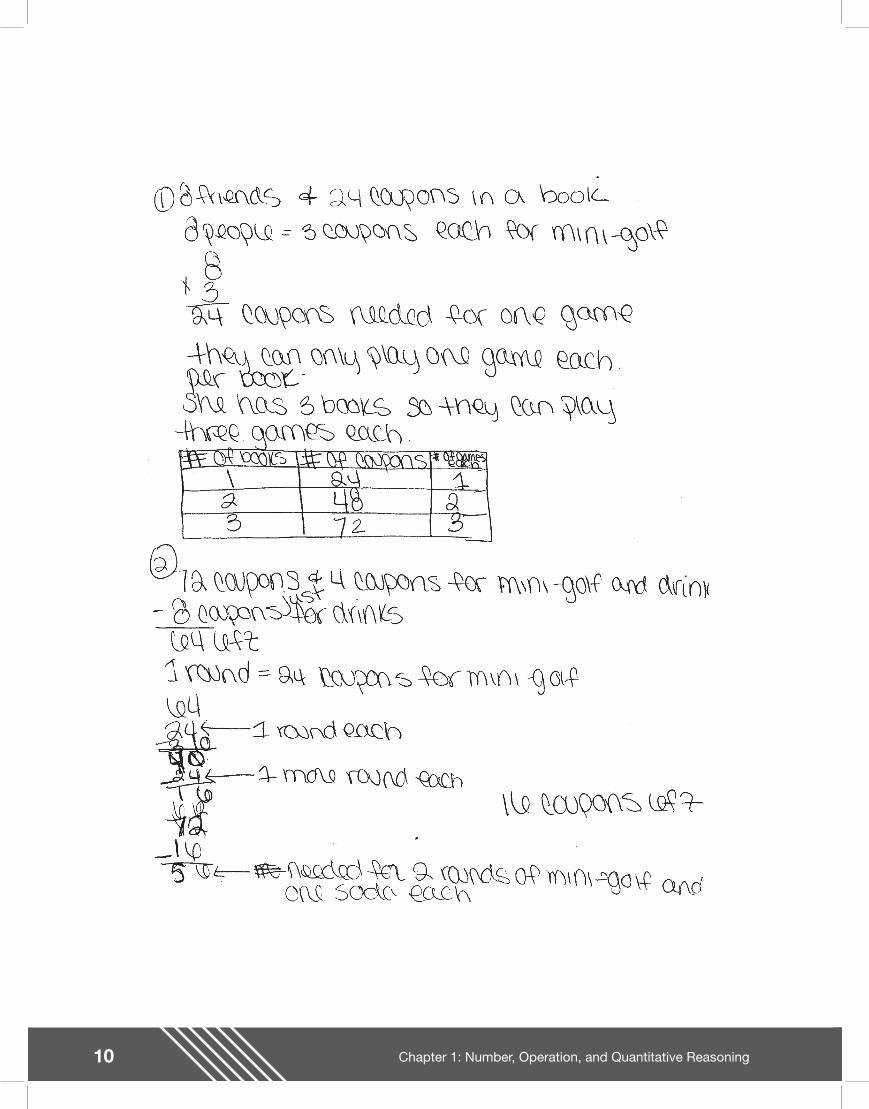
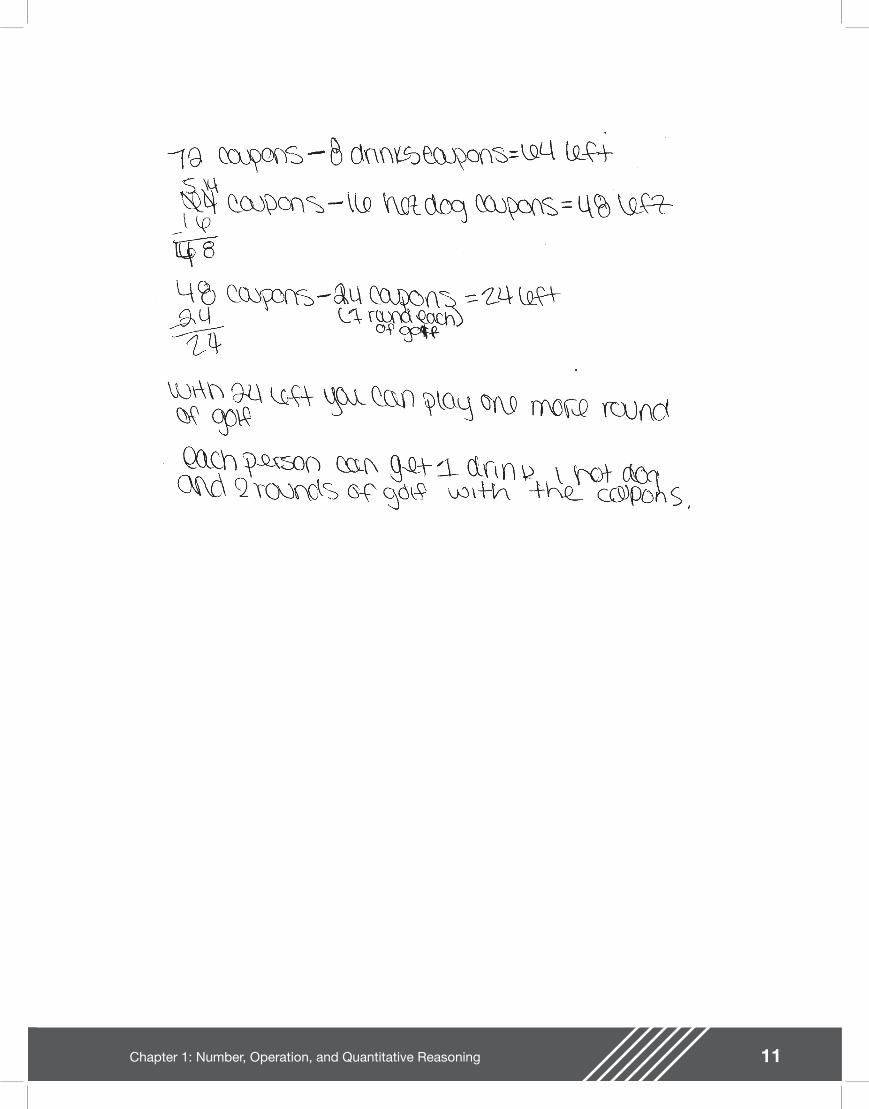
Student work sample
This student�’s work shows an understanding of the relationships between coupons, books, and coupons needed for activities.
The work exempli es many of the criteria on the solution guide, especially the following:
�• Describes mathematical relationships
�• Evaluates the reasonableness or signi cance of the solution in the context of the problem
�• Demonstrates an understanding of mathematical concepts, processes, and skills
�• Uses multiple representations (such as concrete models, tables, graphs, symbols, and verbal descriptions) and makes connections among them
�• States a clear and accurate solution using correct units
10 Chapter 1: Number, Operation, and Quantitative Reasoning
11Chapter 1: Number, Operation, and Quantitative Reasoning

12 Chapter 1: Number, Operation, and Quantitative Reasoning
13Chapter 1: Number, Operation, and Quantitative Reasoning
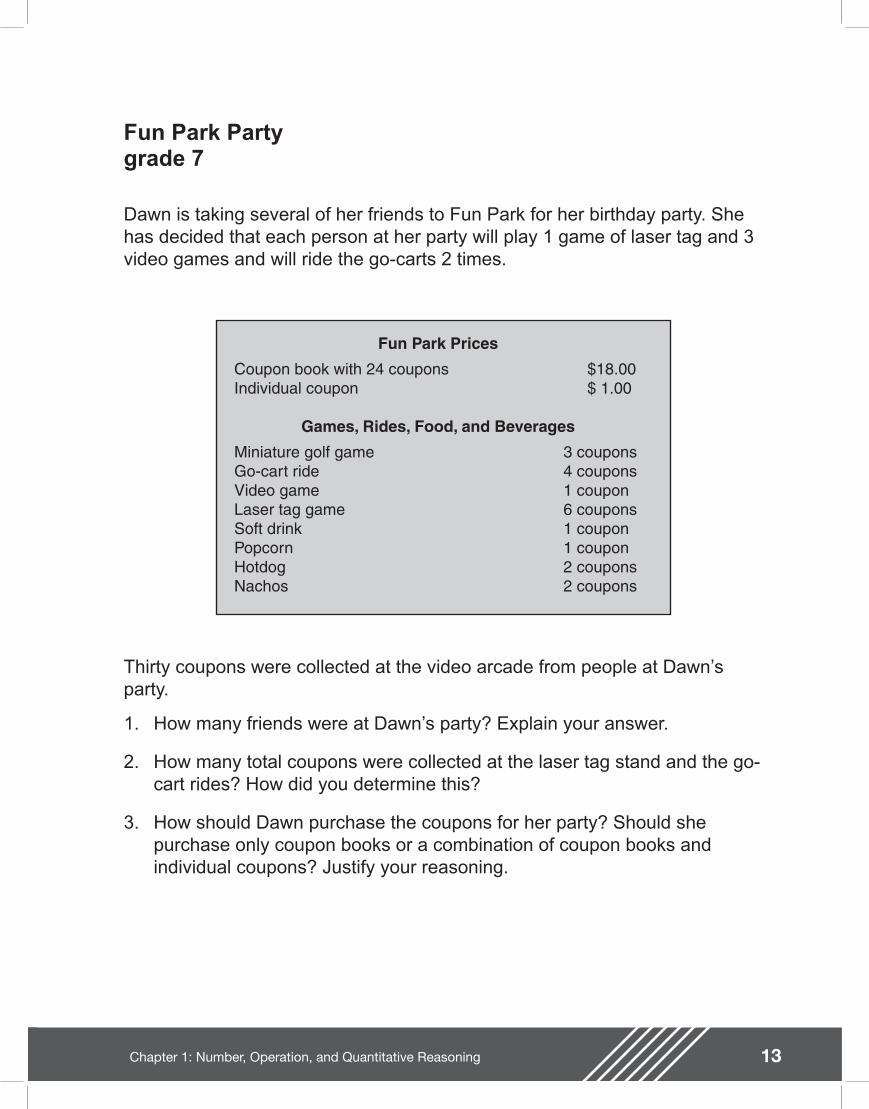
Fun Park Party
Dawn is taking several of her friends to Fun Park for her birthday party. She has decided that each person at her party will play 1 game of laser tag and 3 video games and will ride the go-carts 2 times.
Thirty coupons were collected at the video arcade from people at Dawn�’s party.
1. How many friends were at Dawn�’s party? Explain your answer.
2. How many total coupons were collected at the laser tag stand and the go-cart rides? How did you determine this?
3. How should Dawn purchase the coupons for her party? Should she purchase only coupon books or a combination of coupon books and individual coupons? Justify your reasoning.
Fun Park Prices
Coupon book with 24 coupons $18.00Individual coupon $ 1.00
Games, Rides, Food, and Beverages
Miniature golf game 3 couponsGo-cart ride 4 couponsVideo game 1 couponLaser tag game 6 couponsSoft drink 1 couponPopcorn 1 couponHotdog 2 couponsNachos 2 coupons
grade 7
14 Chapter 1: Number, Operation, and Quantitative Reasoning
Teacher Notes
Materials
Graphing calculator
Connections to Middle School TEKS
(7.2) Number, operation, and quantitative reasoning. The student adds, subtracts, multiplies, or divides to solve problems and justify solutions. The student is expected to:
(F) select and use appropriate operations to solve problems and justify the selections
(G) determine the reasonableness of a solution to a problem
(7.3) Patterns, relationships, and algebraic thinking. The student solves problems involving proportional relationships. The student is expected to:
(B) estimate and nd solutions to application problems involving proportional relationships such as similarity, scaling, unit costs, and related measurement units
(7.13) Underlying processes and mathematical tools. The student applies Grade 7 mathematics to solve problems connected to everyday experiences, investigations in other disciplines, and activities in and outside of school. The student is expected to:
(A) identify and apply mathematics to everyday experiences, to activities in
Scaffolding Questions
�• How many coupons does it take to play one game in the video arcade? Three games?
�• How can you nd the number of people at Dawn�’s party?
�• How can you determine the number of coupons needed for everyone at the party to ride the go-carts 2 times? To play laser tag 1 time?
�• How many total coupons will it take for everyone at the party to play 3 video games and 1 game of laser tag and to ride the go-carts 2 times? Explain.
�• What is the least number of coupon books Dawn should purchase for her party?
�• What is the greatest number of coupon books Dawn should purchase? Will that give her any coupons left over?
�• What are some purchase options for the combination of coupon books and individual coupons?
�• How can you determine if you have explored all possible options?
�• How can you decide which purchase option is best for Dawn?
Sample Solutions
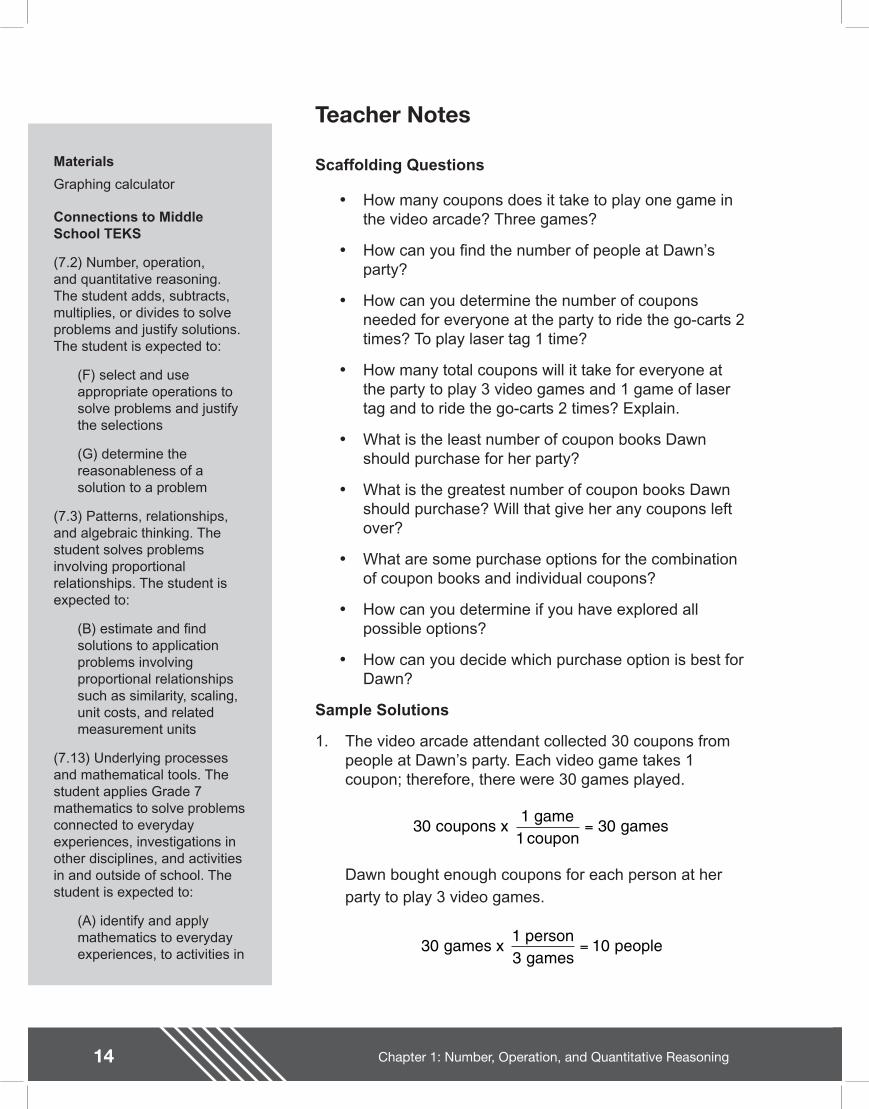
1. The video arcade attendant collected 30 coupons from people at Dawn�’s party. Each video game takes 1 coupon; therefore, there were 30 games played.
Dawn bought enough coupons for each person at her party to play 3 video games.
301
30 coupons x 1 game coupon
games=
303
10 games x 1 person
games people=
15Chapter 1: Number, Operation, and Quantitative Reasoning
and outside of school, with other disciplines, and with other mathematical topics
(B) use a problem-solving model that incorporates understanding the problem, making a plan, carrying out the plan, and evaluating the solution for reasonableness
(C) select or develop an appropriate problem-solving strategy from a variety of different types, including drawing a picture, looking for a pattern, systematic guessing and checking, acting it out, making a table, working a simpler problem, or working backwards to solve a problem
(D) select tools such as real objects, manipulatives, paper/pencil, and technology or techniques such as mental math, estimation, and number sense to solve problems
Texas Assessment of Knowledge and Skills
Objective 1: The student will demonstrate an understanding of numbers, operations, and quantitative reasoning.
Objective 2: The student will demonstrate an understanding of patterns, relationships, and algebraic reasoning.
Objective 6: The student will demonstrate an understanding of the mathematical processes and tools used in problem solving.
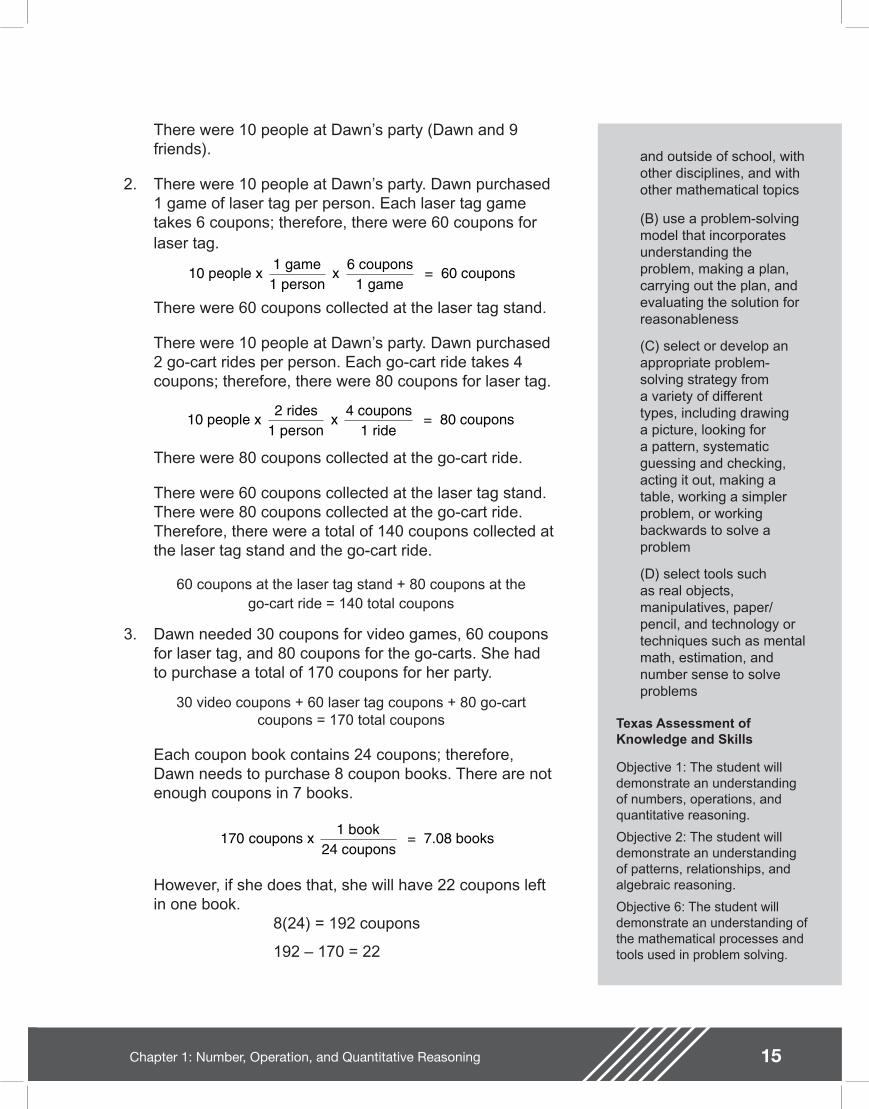
There were 10 people at Dawn�’s party (Dawn and 9 friends).
2. There were 10 people at Dawn�’s party. Dawn purchased 1 game of laser tag per person. Each laser tag game takes 6 coupons; therefore, there were 60 coupons for laser tag.
There were 60 coupons collected at the laser tag stand.
There were 10 people at Dawn�’s party. Dawn purchased 2 go-cart rides per person. Each go-cart ride takes 4 coupons; therefore, there were 80 coupons for laser tag.
There were 80 coupons collected at the go-cart ride.
There were 60 coupons collected at the laser tag stand. There were 80 coupons collected at the go-cart ride. Therefore, there were a total of 140 coupons collected at the laser tag stand and the go-cart ride.
60 coupons at the laser tag stand + 80 coupons at thego-cart ride = 140 total coupons
3. Dawn needed 30 coupons for video games, 60 coupons for laser tag, and 80 coupons for the go-carts. She had to purchase a total of 170 coupons for her party.
30 video coupons + 60 laser tag coupons + 80 go-cart coupons = 170 total coupons
Each coupon book contains 24 coupons; therefore, Dawn needs to purchase 8 coupon books. There are not enough coupons in 7 books.
However, if she does that, she will have 22 coupons left in one book.
8(24) = 192 coupons
192 �– 170 = 22
10 people x 1 game1 person
x 6 coupons
1 game = 60 coupons
10 people x 2 rides
1 person x
4 coupons1 ride
= 80 coupons
170 coupons x 1 book
24 coupons = 7.08 books
16 Chapter 1: Number, Operation, and Quantitative Reasoning
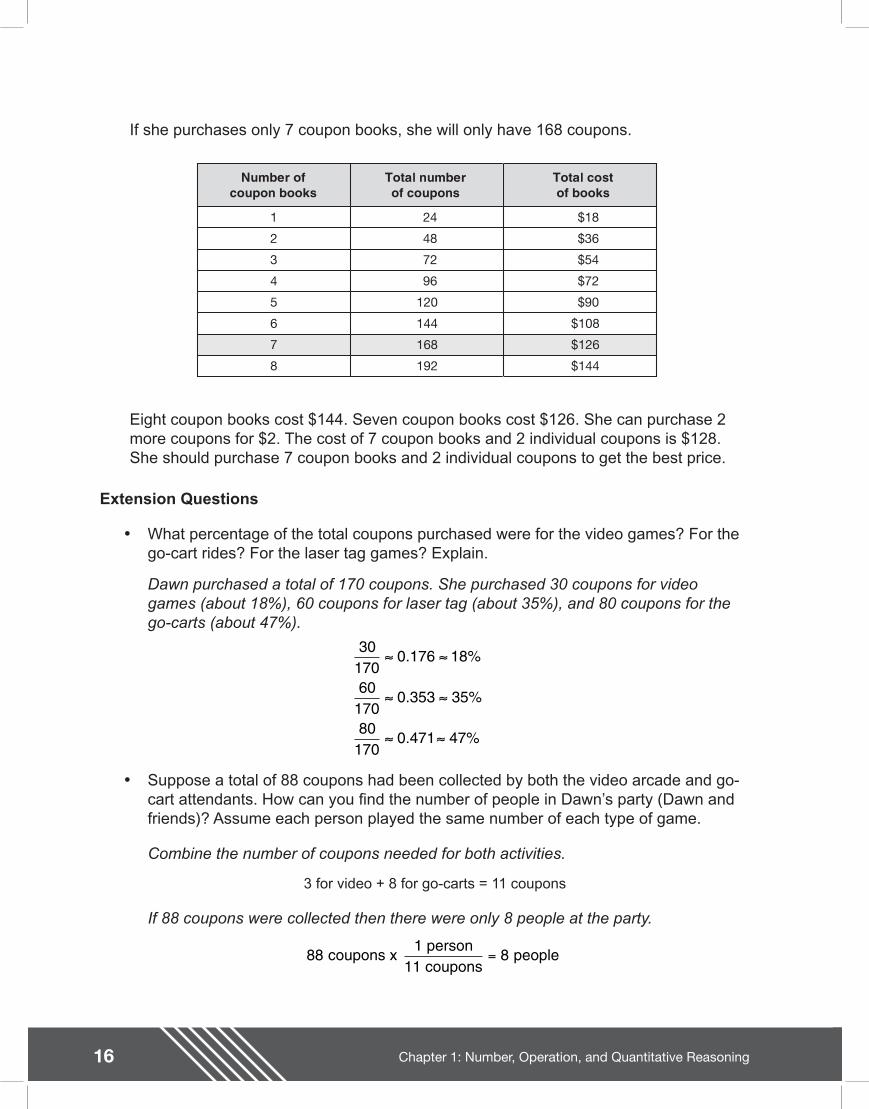
If she purchases only 7 coupon books, she will only have 168 coupons.
Number ofcoupon books
Total numberof coupons
Total costof books
1
2
3
4
5
6
7
8
24
48
72
96
120
144
168
192
$18
$36
$54
$72
$90
$108
$126
$144
Eight coupon books cost $144. Seven coupon books cost $126. She can purchase 2 more coupons for $2. The cost of 7 coupon books and 2 individual coupons is $128. She should purchase 7 coupon books and 2 individual coupons to get the best price.
Extension Questions
�• What percentage of the total coupons purchased were for the video games? For the go-cart rides? For the laser tag games? Explain.
Dawn purchased a total of 170 coupons. She purchased 30 coupons for video games (about 18%), 60 coupons for laser tag (about 35%), and 80 coupons for the go-carts (about 47%).
30170
0 176 18
60170
0 353 35
80170
0 471 47
. %
. %
. %
�• Suppose a total of 88 coupons had been collected by both the video arcade and go-cart attendants. How can you nd the number of people in Dawn�’s party (Dawn and friends)? Assume each person played the same number of each type of game.
Combine the number of coupons needed for both activities.
3 for video + 8 for go-carts = 11 coupons
If 88 coupons were collected then there were only 8 people at the party.
88 8 coupons x 1 person
11 coupons people=
17Chapter 1: Number, Operation, and Quantitative Reasoning
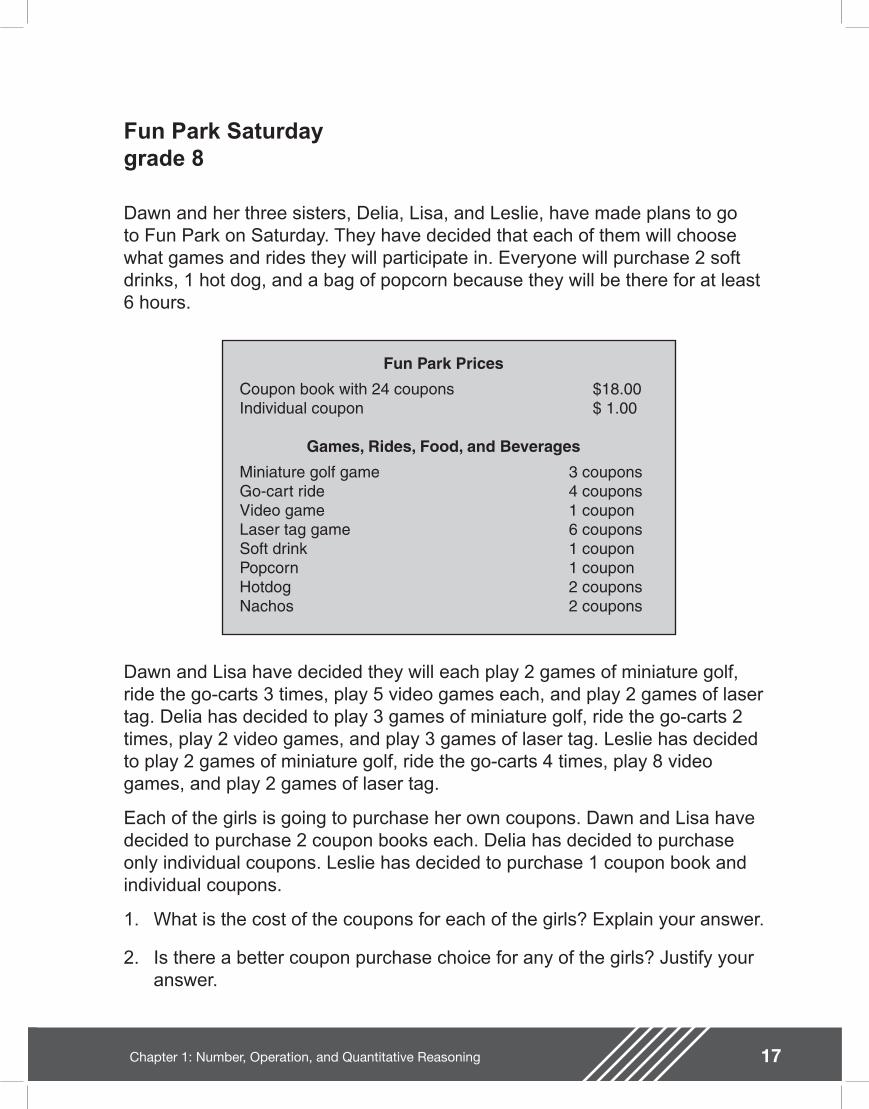
Fun Park Saturday
Dawn and her three sisters, Delia, Lisa, and Leslie, have made plans to go to Fun Park on Saturday. They have decided that each of them will choose what games and rides they will participate in. Everyone will purchase 2 soft drinks, 1 hot dog, and a bag of popcorn because they will be there for at least 6 hours.
Dawn and Lisa have decided they will each play 2 games of miniature golf, ride the go-carts 3 times, play 5 video games each, and play 2 games of laser tag. Delia has decided to play 3 games of miniature golf, ride the go-carts 2 times, play 2 video games, and play 3 games of laser tag. Leslie has decided to play 2 games of miniature golf, ride the go-carts 4 times, play 8 video games, and play 2 games of laser tag.
Each of the girls is going to purchase her own coupons. Dawn and Lisa have decided to purchase 2 coupon books each. Delia has decided to purchase only individual coupons. Leslie has decided to purchase 1 coupon book and individual coupons.
1. What is the cost of the coupons for each of the girls? Explain your answer.
2. Is there a better coupon purchase choice for any of the girls? Justify your answer.
Fun Park Prices
Coupon book with 24 coupons $18.00Individual coupon $ 1.00
Games, Rides, Food, and Beverages
Miniature golf game 3 couponsGo-cart ride 4 couponsVideo game 1 couponLaser tag game 6 couponsSoft drink 1 couponPopcorn 1 couponHotdog 2 couponsNachos 2 coupons
grade 8
18 Chapter 1: Number, Operation, and Quantitative Reasoning
Teacher Notes
Materials
Graphing calculator
Connections to Middle School TEKS:
(8.2) Number, operation, and quantitative reasoning. The student selects and uses appropriate operations to solve problems and justify solutions. The student is expected to:
(D) use multiplication by a constant factor (unit rate) to represent proportional relationships; for example, the arm span of a gibbon is about 1.4 times its height, a = 1.4h
(8.5) Patterns, relationships, and algebraic thinking. The student uses graphs, tables, and algebraic representations to make predictions and solve problems. The student is expected to:
(A) estimate, nd, and justify solutions to application problems using appropriate tables, graphs, and algebraic equations
(8.14) Underlying processes and mathematical tools. The student applies Grade 8 mathematics to solve problems connected to
Scaffolding Questions
�• How many coupons will each girl need for the day?
�• What is the cost of one coupon book? One individual coupon?
�• How can you nd the total cost of the coupon books and individual coupons for Dawn? Lisa? Delia? Leslie?
�• How could you determine the lowest cost for the number of coupons each girl is purchasing?
Sample Solutions
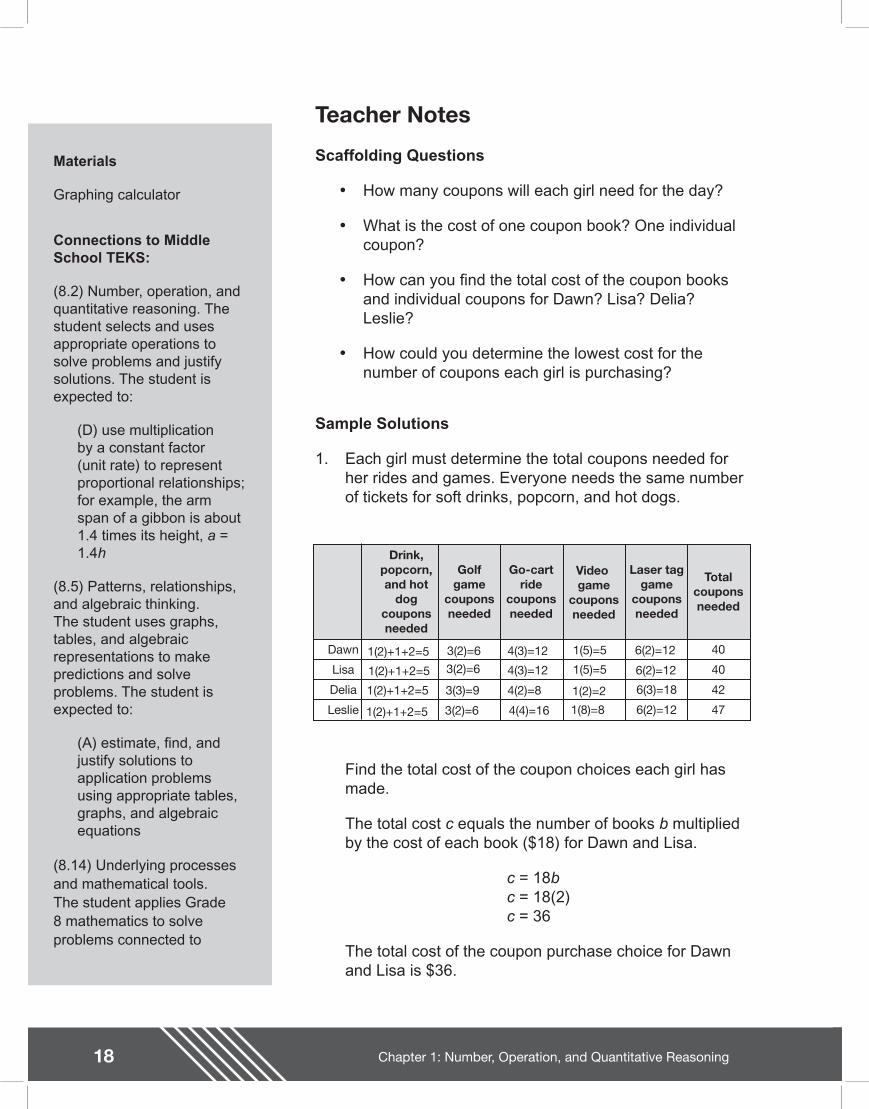
1. Each girl must determine the total coupons needed for her rides and games. Everyone needs the same number of tickets for soft drinks, popcorn, and hot dogs.
Drink,popcorn,and hot
dogcouponsneeded
Golfgame
couponsneeded
Go-cartride
couponsneeded
Video game
couponsneeded
Laser taggame
couponsneeded
Totalcouponsneeded
Dawn
Lisa
Delia
Leslie
1(2)+1+2=5
1(2)+1+2=5
1(2)+1+2=5
1(2)+1+2=5
3(2)=6
3(2)=6
3(3)=9
3(2)=6
4(3)=12
4(3)=12
4(2)=8
4(4)=16
1(5)=5
1(5)=5
1(2)=2
1(8)=8
6(2)=12
6(2)=12
6(3)=18
6(2)=12
40
40
42
47
Find the total cost of the coupon choices each girl has made.
The total cost c equals the number of books b multiplied by the cost of each book ($18) for Dawn and Lisa.
c = 18bc = 18(2)c = 36
The total cost of the coupon purchase choice for Dawn and Lisa is $36.
19Chapter 1: Number, Operation, and Quantitative Reasoning
everyday experiences, investigations in other disciplines, and activities in and outside of school. The student is expected to:
(A) identify and apply mathematics to everyday experiences, to activities in and outside of school, with other disciplines, and with other mathematical topics
(B) use a problem-solving model that incorporates understanding the problem, making a plan, carrying out the plan, and evaluating the solution for reasonableness
(C) select or develop an appropriate problem-solving strategy from a variety of different types, including drawing a picture, looking for a pattern, systematic guessing and checking, acting it out, making a table, working a simpler problem, or working backwards to solve a problem
(D) select tools such as real objects, manipulatives, paper/pencil, and technology or techniques such as mental math, estimation, and number sense to solve problems
For Delia, the total cost c equals the cost of each individual coupon ($1) multiplied by the number of individual coupons i.
c = 1ic = 1(42)c = 42
The total cost for Delia�’s individual coupons is $42.
For Leslie, the total cost equals the cost of the 1 book she is purchasing plus the cost of individual coupons multiplied by the number of individual coupons she is purchasing. Leslie needs 47 coupons. One book takes care of 24 coupons.
47 �– 24 = 23
So, Leslie is going to purchase 1 book and 23 additional coupons.
c = ($18 x 1) + ($1 x 23)c = $18 + $23c = $41
The total cost for Leslie�’s coupons is $41.
2. The table shows that Dawn and Lisa needed 40 coupons. If they buy 2 coupon books with 24 coupons in each book they will have 2(24) or 48 coupons. They will each have 48 �– 40 or 8 coupons left at the end of the day. They could each purchase 1 book to take care of 24 coupons and buy an additional 16 individual coupons. The following equation can be solved to nd the cost c of 1 coupon book and 16 individual coupons.
c = ($18 x 1) + ($1 x 16)c = $18 + $16c = $34
Buying 2 books costs them $18(2) or $36 each. Buying 1 book and 16 tickets would cost them $34 each. The latter option would be a better choice, resulting in a savings of $2 each.
If she buys individual coupons, Delia will not have any coupons left at the end of the day. She needs 42
20 Chapter 1: Number, Operation, and Quantitative Reasoning
Teacher Notes
Texas Assessment of Knowledge and Skills
Objective 1: The student will demonstrate an understanding of numbers, operations, and quantitative reasoning.
Objective 2: The student will demonstrate an understanding of patterns, relationships, and algebraic reasoning.
Objective 6: The student will demonstrate an understanding of the mathematical processes and tools used in problem solving.
coupons. She could have purchased 1 coupon book to take care of 24 coupons. She would need 42 �– 24, or an additional 18 individual coupons.
c = ($18 x 1) + ($1 x 18)c = $18 + $18c = $36
Delia�’s original choice to purchase only individual coupons cost her $42. Buying one book and 18 additional coupons would only cost her $36. The better choice is the second option.
Leslie will not have any coupons left at the end of the day. She needed 47 coupons. She could have purchased 2 coupon books that would have given her 48 coupons with one coupon left over at the end of the day.
c = 2($18)c = $36
Leslie�’s original choice to purchase one coupon book and 23 additional coupons cost her $41. Buying two books would only cost $36 and would leave her with one coupon left at the end of the day. The second option is the better choice.
Extension Questions
�• Would it be a good idea for some of the girls to consider purchasing coupon books together to save money? Which girls should purchase together? How many books and individual tickets should they purchase? Explain your answers.
Leslie could purchase with Delia. They would need 42 plus 47, or 89 coupons. Three coupon books would give 3(24), or 72 coupons. They would each get 36 coupons and need 17 more coupons. Delia would need to buy 6 more coupons for $6 and Leslie would need to buy 11 more coupons for $11.
The cost of 3 coupon books is $18 (3) or $54. Dividing this cost by 2, each girl would pay $27.
21Chapter 1: Number, Operation, and Quantitative Reasoning
Delia�’s cost: $27 + $6 = $33.
Leslie�’s cost: $27 + $11 = $38.
Delia is saving $42 �– $33, or $9.
Leslie is saving $41 �– $38, or $3.
Even though Leslie is paying more than Delia, she is still saving $3 and Delia is saving $9.
Dawn and Leslie together need 80 coupons. Three coupon books would give 72 coupons. Dawn could purchase with Lisa and split the cost equally for 3 coupon books and 8 individual coupons. Three coupon books cost $54. The individual coupons would cost $8. The total cost would be $54 plus $8, or $62. That would cost them $31 each instead of $36 each.
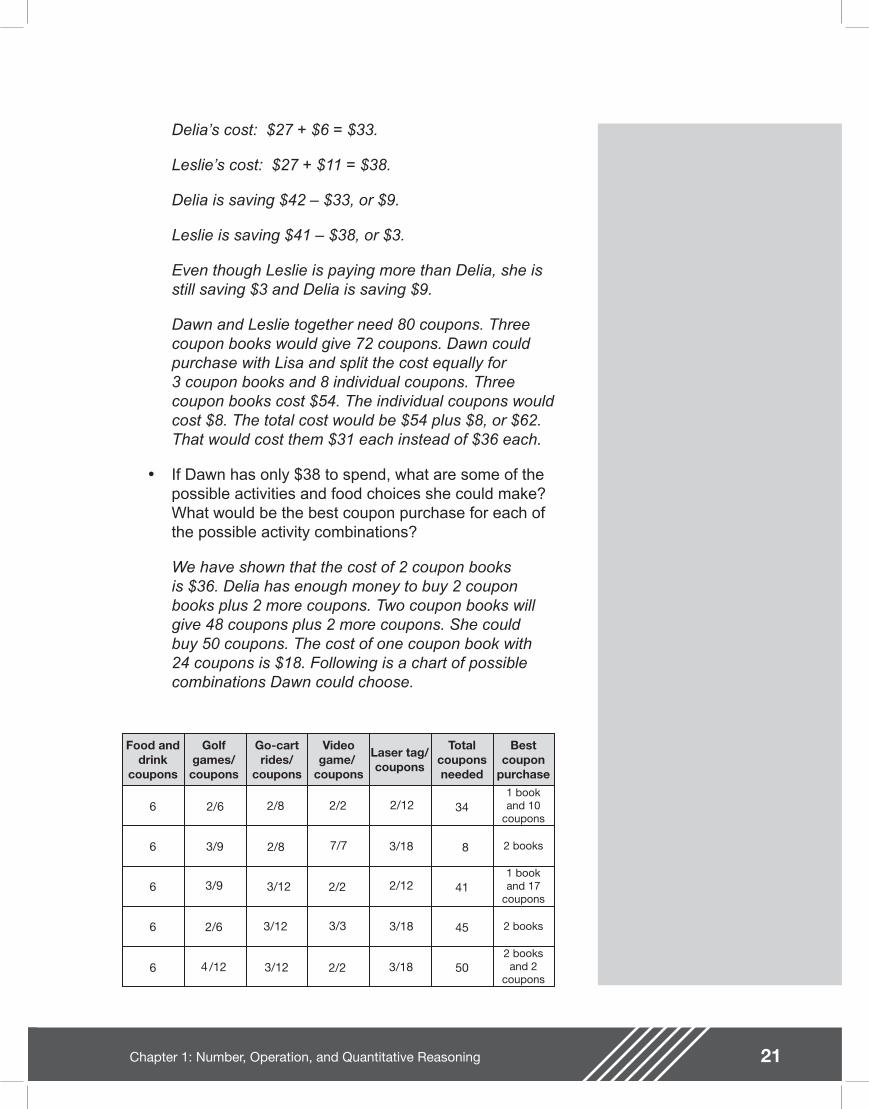
�• If Dawn has only $38 to spend, what are some of the possible activities and food choices she could make? What would be the best coupon purchase for each of the possible activity combinations?
We have shown that the cost of 2 coupon books is $36. Delia has enough money to buy 2 coupon books plus 2 more coupons. Two coupon books will give 48 coupons plus 2 more coupons. She could buy 50 coupons. The cost of one coupon book with 24 coupons is $18. Following is a chart of possible combinations Dawn could choose.

22 Chapter 1: Number, Operation, and Quantitative Reasoning
The last column shows the best coupon purchase for the combinations. For example:
41 coupons purchased as one book (24 coupons) plus 17 coupons would cost$18 + $17, or $35. That is cheaper than purchasing 2 books.
45 coupons purchased as one book (24 coupons) plus 21 coupons would cost$18 + $21 or $39. It would be cheaper to buy 2 coupon books at $36.
23Chapter 1: Number, Operation, and Quantitative Reasoning
Homecoming Chiligrade 6
Alicia�’s favorite chili recipe calls for 3 pounds of ground beef. The recipe serves 8 people. Alicia bought a package of ground beef that weighs 11.5 pounds to make a large batch of chili for the annual Homecoming Chili Dinner at the local high school.
What is the best estimate of the number of people her chili will serve if she follows the recipe? Explain your reasoning.
24 Chapter 1: Number, Operation, and Quantitative Reasoning
Teacher Notes
Materials
Graphing calculator
Connections to Middle School TEKS
(6.2) Number, operation, and quantitative reasoning. The student adds, subtracts, multiplies, and divides to solve problems and justify solutions. The student is expected to:
(C) use multiplication and division of whole numbers to solve problems including situations involving equivalent ratios and rates
(D) estimate and round to approximate reasonable results and to solve problems where exact answers are not required
(6.11) Underlying processes and mathematical tools. The student applies Grade 6 mathematics to solve problems connected to everyday experiences, investigations in other disciplines, and activities in and outside of school. The student is expected to:
(A) identify and apply mathematics to everyday experiences, to activities in and outside of school, with other disciplines, and with other mathematical topics
Scaffolding Questions
�• If one recipe serves 8 people, how many people will a double recipe serve? A triple recipe? A quadruple recipe?
�• How can you determine the amount of ground beef needed for a double recipe? A triple recipe? A quadruple recipe?
�• How many pounds of ground beef does it take for each serving? How can you determine this?
�• How can you nd the number of servings for 11.5 pounds of ground beef?
Sample Solutions
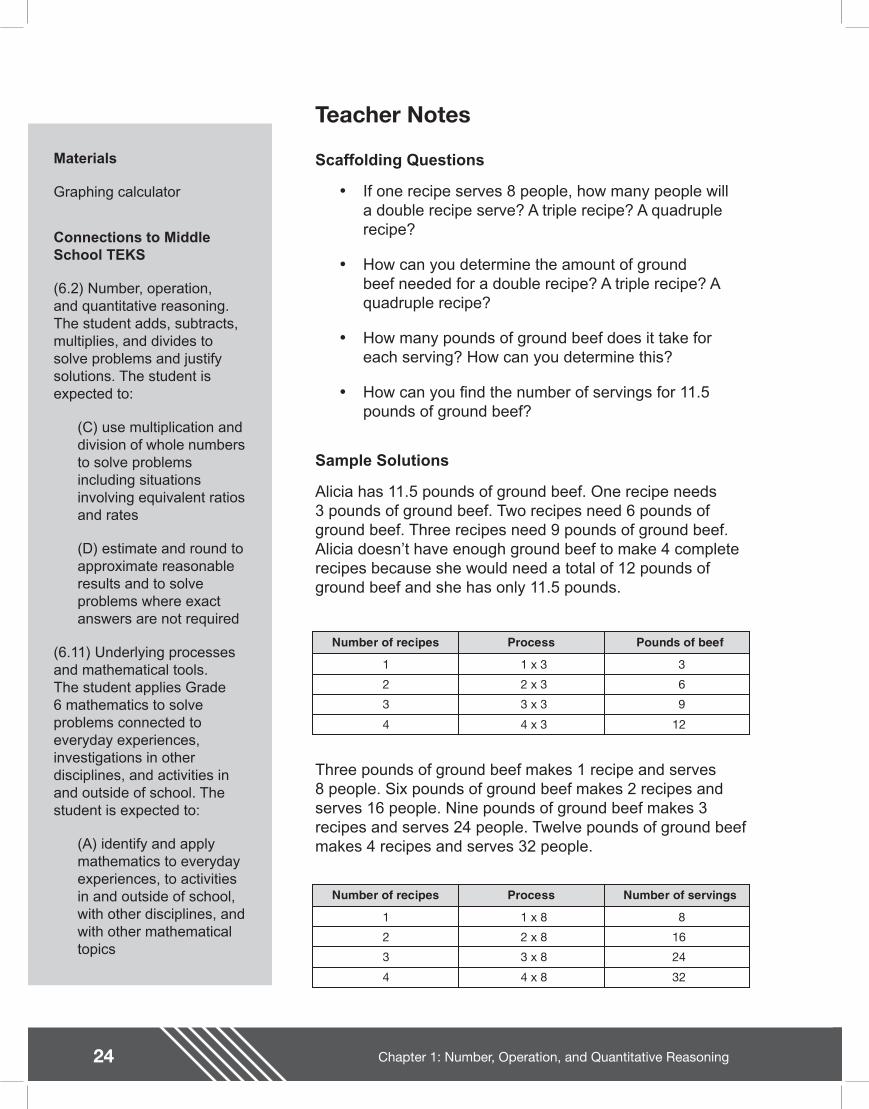
Alicia has 11.5 pounds of ground beef. One recipe needs 3 pounds of ground beef. Two recipes need 6 pounds of ground beef. Three recipes need 9 pounds of ground beef. Alicia doesn�’t have enough ground beef to make 4 complete recipes because she would need a total of 12 pounds of ground beef and she has only 11.5 pounds.
Number of recipes Process Pounds of beef
1 1 x 3 3
2 2 x 3 6
3 3 x 3 9
4 4 x 3 12
Three pounds of ground beef makes 1 recipe and serves 8 people. Six pounds of ground beef makes 2 recipes and serves 16 people. Nine pounds of ground beef makes 3 recipes and serves 24 people. Twelve pounds of ground beef makes 4 recipes and serves 32 people.
Number of recipes Process Number of servings
1 1 x 8 8
2 2 x 8 16
3 3 x 8 24
4 4 x 8 32
25Chapter 1: Number, Operation, and Quantitative Reasoning
(B) use a problem-solving model that incorporates understanding the problem, making a plan, carrying out the plan, and evaluating the solution for reasonableness
(C) select or develop an appropriate problem-solving strategy from a variety of different types, including drawing a picture, looking for a pattern, systematic guessing and checking, acting it out, making a table, working a simpler problem, or working backwards to solve a problem
(D) select tools such as real objects, manipulatives, paper/pencil, and technology or techniques such as mental math, estimation, and number sense to solve problems
Texas Assessment of Knowledge and Skills
Objective 1: The student will demonstrate an understanding of numbers, operations, and quantitative reasoning.
Objective 6: The student will demonstrate an understanding of the mathematical processes and tools used in problem solving.
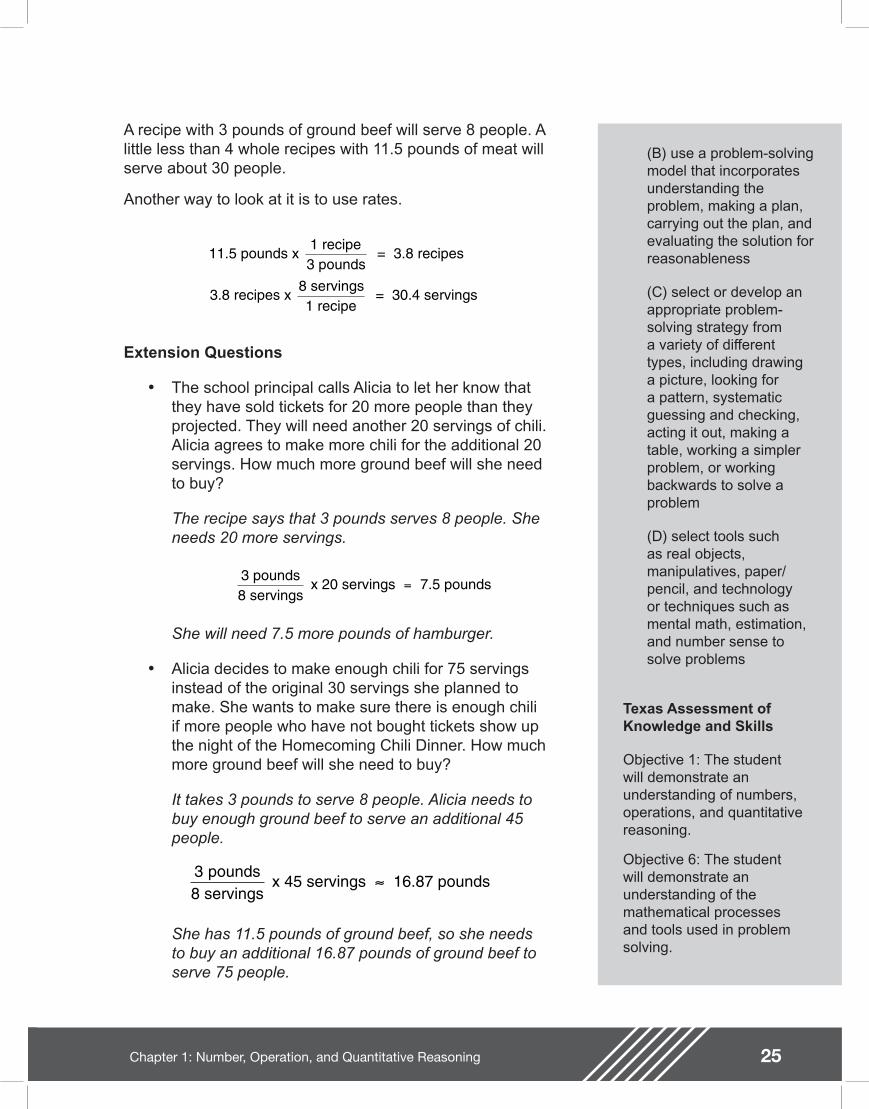
A recipe with 3 pounds of ground beef will serve 8 people. A little less than 4 whole recipes with 11.5 pounds of meat will serve about 30 people.
Another way to look at it is to use rates.
Extension Questions
�• The school principal calls Alicia to let her know that they have sold tickets for 20 more people than they projected. They will need another 20 servings of chili. Alicia agrees to make more chili for the additional 20 servings. How much more ground beef will she need to buy?
The recipe says that 3 pounds serves 8 people. She needs 20 more servings.
She will need 7.5 more pounds of hamburger.
�• Alicia decides to make enough chili for 75 servings instead of the original 30 servings she planned to make. She wants to make sure there is enough chili if more people who have not bought tickets show up the night of the Homecoming Chili Dinner. How much more ground beef will she need to buy?
It takes 3 pounds to serve 8 people. Alicia needs to buy enough ground beef to serve an additional 45 people.
3 pounds8 servings
x 45 servings 16.87 pounds
She has 11.5 pounds of ground beef, so she needs to buy an additional 16.87 pounds of ground beef to serve 75 people.
11.5 pounds x 1 recipe3 pounds
= 3.8 recipes
3.8 recipes x 8 servings1 recipe
= 30.4 servings
3 pounds8 servings
x 20 servings 7.5 pounds=

26 Chapter 1: Number, Operation, and Quantitative Reasoning
27Chapter 1: Number, Operation, and Quantitative Reasoning
Spring Sensationsgrade 6
The rst performance of the Maxwell Middle School Spring Sensations will be next Friday in the new school auditorium. The performance is sold out. The auditorium has 840 seats, and each section in the auditorium seats 60 people. The Maxwell Student Council members have volunteered to usher for the performance. There are 24 members in the Student Council. The Student Council will invite other students to usher so that there will be at least two ushers in each section.
1. How many ushers will be needed other than the 24 Student Council members? Explain your reasoning.
2. About how many people will each Student Council member seat? How did you determine this?
28 Chapter 1: Number, Operation, and Quantitative Reasoning
Teacher Notes
Materials
Graphing calculator
Connections to Middle School TEKS
(6.2) Number, operation, and quantitative reasoning. The student adds, subtracts, multiplies, and divides to solve problems and justify solutions. The student is expected to:
(C) use multiplication and division of whole numbers to solve problems including situations involving equivalent ratios and rates
(D) estimate and round to approximate reasonable results and to solve problems where exact answers are not required
(6.11) Underlying processes and mathematical tools. The student applies Grade 6 mathematics to solve problems connected to everyday experiences, investigations in other disciplines, and activities in and outside of school. The student is expected to:
(A) identify and apply mathematics to everyday experiences, to activities in and outside of school, with other disciplines, and with other mathematical topics
Scaffolding Questions
�• If all of the 840 seats are occupied, how many sections are full?
�• If 2 ushers are needed for each section, how can you nd the total number of ushers needed?
�• If 24 Student Council members will usher, how many more ushers are needed so there will be at least 2 ushers in each section?
�• If there are 60 seats in each section, how can you determine the number of people each of the ushers will seat?
Sample Solutions
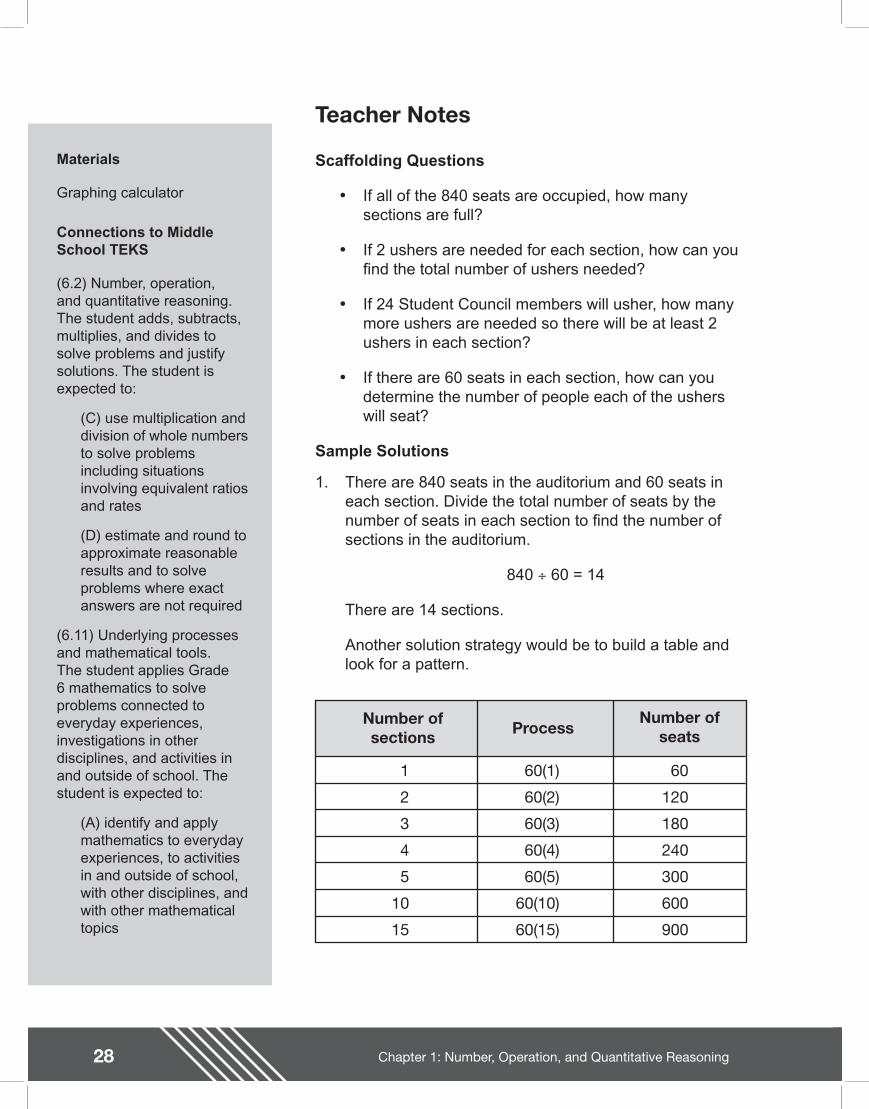
1. There are 840 seats in the auditorium and 60 seats in each section. Divide the total number of seats by the number of seats in each section to nd the number of sections in the auditorium.
840 ÷ 60 = 14
There are 14 sections.
Another solution strategy would be to build a table and look for a pattern.
Number ofsections
1
2
3
4
5
10
15
Process
60(1)
60(2)
60(3)
60(4)
60(5)
60(10)
60(15)
Number ofseats
60
120
180
240
300
600
900
29Chapter 1: Number, Operation, and Quantitative Reasoning
(B) use a problem-solving model that incorporates understanding the problem, making a plan, carrying out the plan, and evaluating the solution for reasonableness
(C) select or develop an appropriate problem-solving strategy from a variety of different types, including drawing a picture, looking for a pattern, systematic guessing and checking, acting it out, making a table, working a simpler problem, or working backwards to solve a problem
(D) select tools such as real objects, manipulatives, paper/pencil, and technology or techniques such as mental math, estimation, and number sense to solve problems
Texas Assessment of Knowledge and Skills
Objective 1: The student will demonstrate an understanding of numbers, operations, and quantitative reasoning.
Objective 6: The student will demonstrate an understanding of the mathematical processes and tools used in problem solving.
Fifteen sections are 60 seats too many, so there are 14 sections in the auditorium.
60(14) = 840
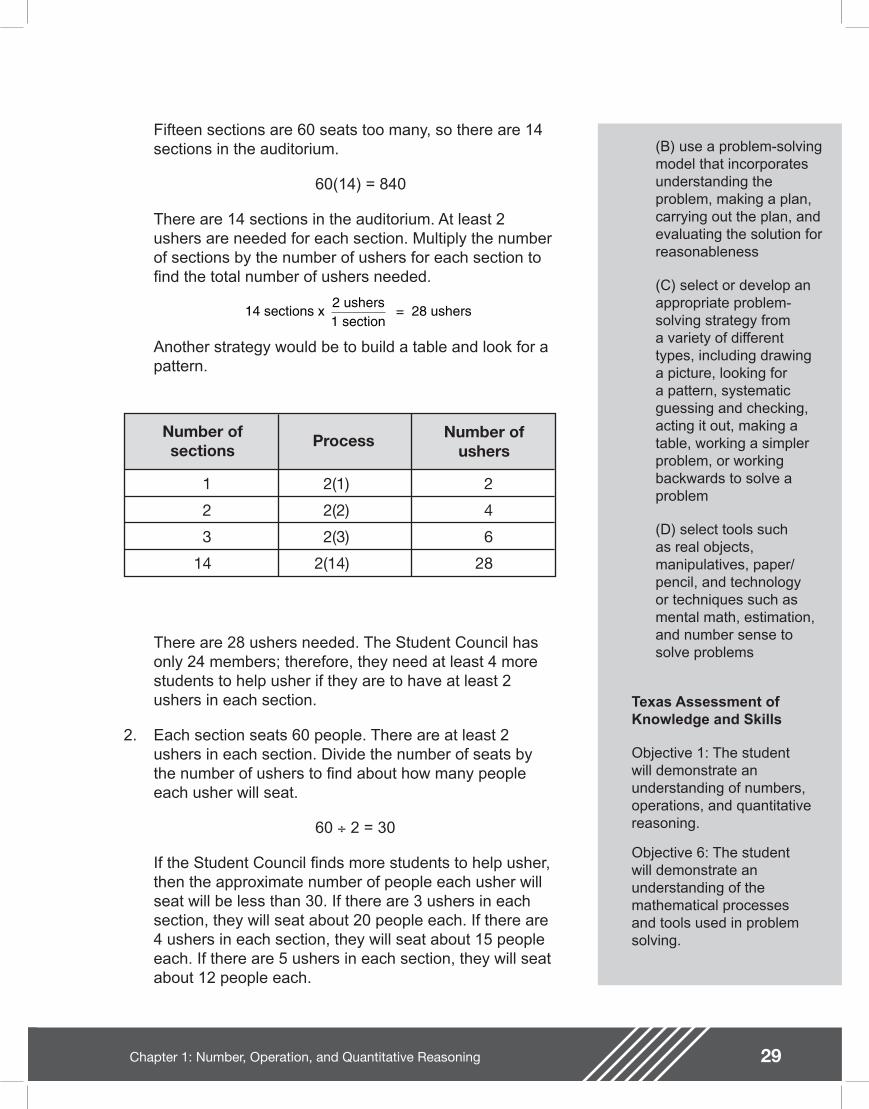
There are 14 sections in the auditorium. At least 2 ushers are needed for each section. Multiply the number of sections by the number of ushers for each section to nd the total number of ushers needed.
Another strategy would be to build a table and look for a pattern.
Number ofsections
1
2
3
14
Process
2(1)
2(2)
2(3)
2(14)
Number ofushers
2
4
6
28
There are 28 ushers needed. The Student Council has only 24 members; therefore, they need at least 4 more students to help usher if they are to have at least 2 ushers in each section.
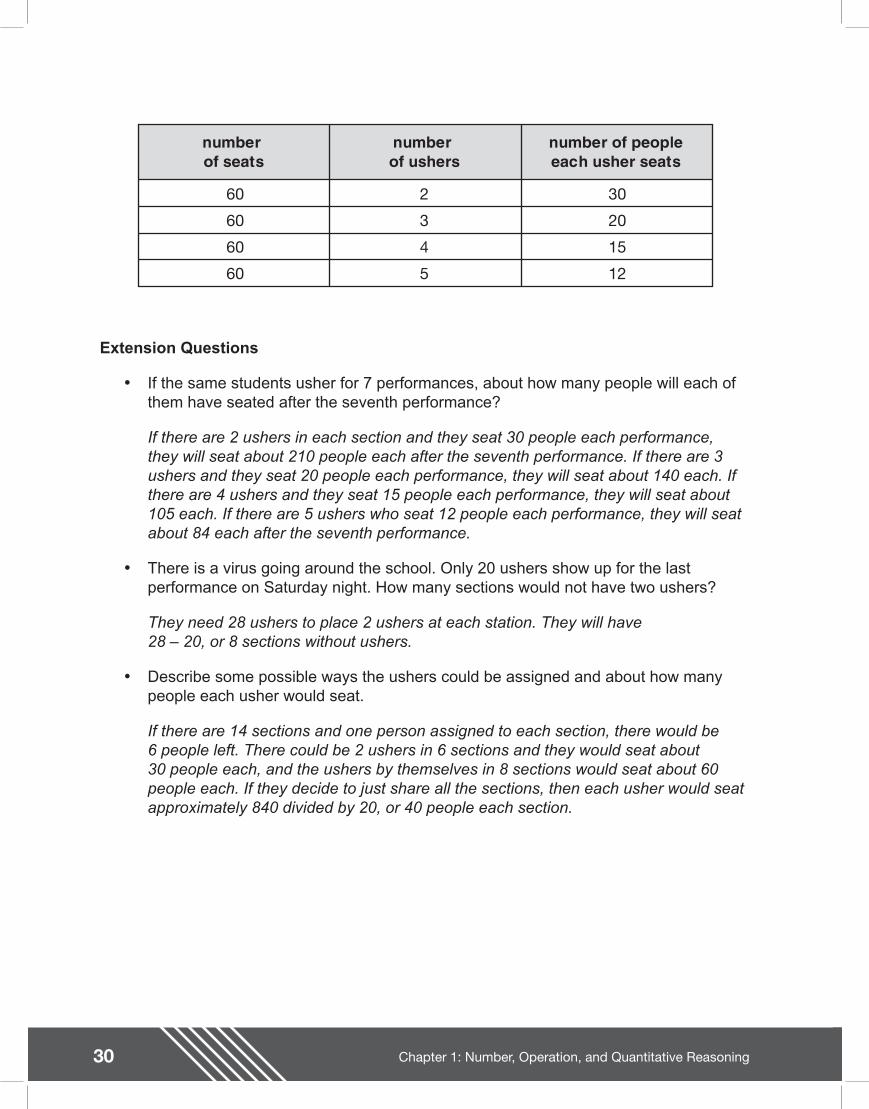
2. Each section seats 60 people. There are at least 2 ushers in each section. Divide the number of seats by the number of ushers to nd about how many people each usher will seat.
60 ÷ 2 = 30
If the Student Council nds more students to help usher, then the approximate number of people each usher will seat will be less than 30. If there are 3 ushers in each section, they will seat about 20 people each. If there are 4 ushers in each section, they will seat about 15 people each. If there are 5 ushers in each section, they will seat about 12 people each.
14 sections x 2 ushers1 section
= 28 ushers
30 Chapter 1: Number, Operation, and Quantitative Reasoning
Extension Questions
�• If the same students usher for 7 performances, about how many people will each of them have seated after the seventh performance?
If there are 2 ushers in each section and they seat 30 people each performance, they will seat about 210 people each after the seventh performance. If there are 3 ushers and they seat 20 people each performance, they will seat about 140 each. If there are 4 ushers and they seat 15 people each performance, they will seat about 105 each. If there are 5 ushers who seat 12 people each performance, they will seat about 84 each after the seventh performance.
�• There is a virus going around the school. Only 20 ushers show up for the last performance on Saturday night. How many sections would not have two ushers?
They need 28 ushers to place 2 ushers at each station. They will have 28 �– 20, or 8 sections without ushers.
�• Describe some possible ways the ushers could be assigned and about how many people each usher would seat.
If there are 14 sections and one person assigned to each section, there would be 6 people left. There could be 2 ushers in 6 sections and they would seat about 30 people each, and the ushers by themselves in 8 sections would seat about 60 people each. If they decide to just share all the sections, then each usher would seat approximately 840 divided by 20, or 40 people each section.
number of seats
60
60
60
60
number of ushers
2
3
4
5
number of peopleeach usher seats
30
20
15
12
31Chapter 1: Number, Operation, and Quantitative Reasoning
Bargain Shoppinggrade 7
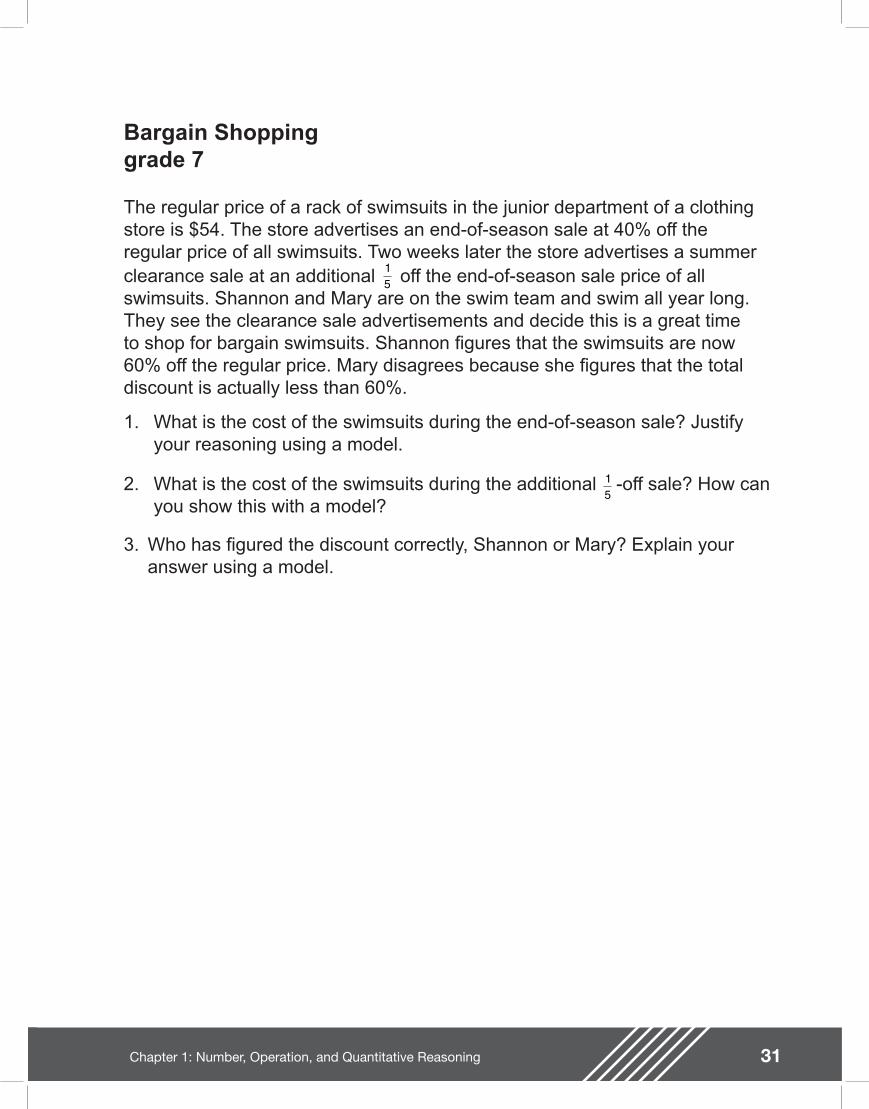
The regular price of a rack of swimsuits in the junior department of a clothing store is $54. The store advertises an end-of-season sale at 40% off the regular price of all swimsuits. Two weeks later the store advertises a summer clearance sale at an additional off the end-of-season sale price of all swimsuits. Shannon and Mary are on the swim team and swim all year long. They see the clearance sale advertisements and decide this is a great time to shop for bargain swimsuits. Shannon gures that the swimsuits are now 60% off the regular price. Mary disagrees because she gures that the total discount is actually less than 60%.
1. What is the cost of the swimsuits during the end-of-season sale? Justify your reasoning using a model.
2. What is the cost of the swimsuits during the additional -off sale? How can you show this with a model?
3. Who has gured the discount correctly, Shannon or Mary? Explain your answer using a model.
15
15
32 Chapter 1: Number, Operation, and Quantitative Reasoning
Teacher Notes
Materials
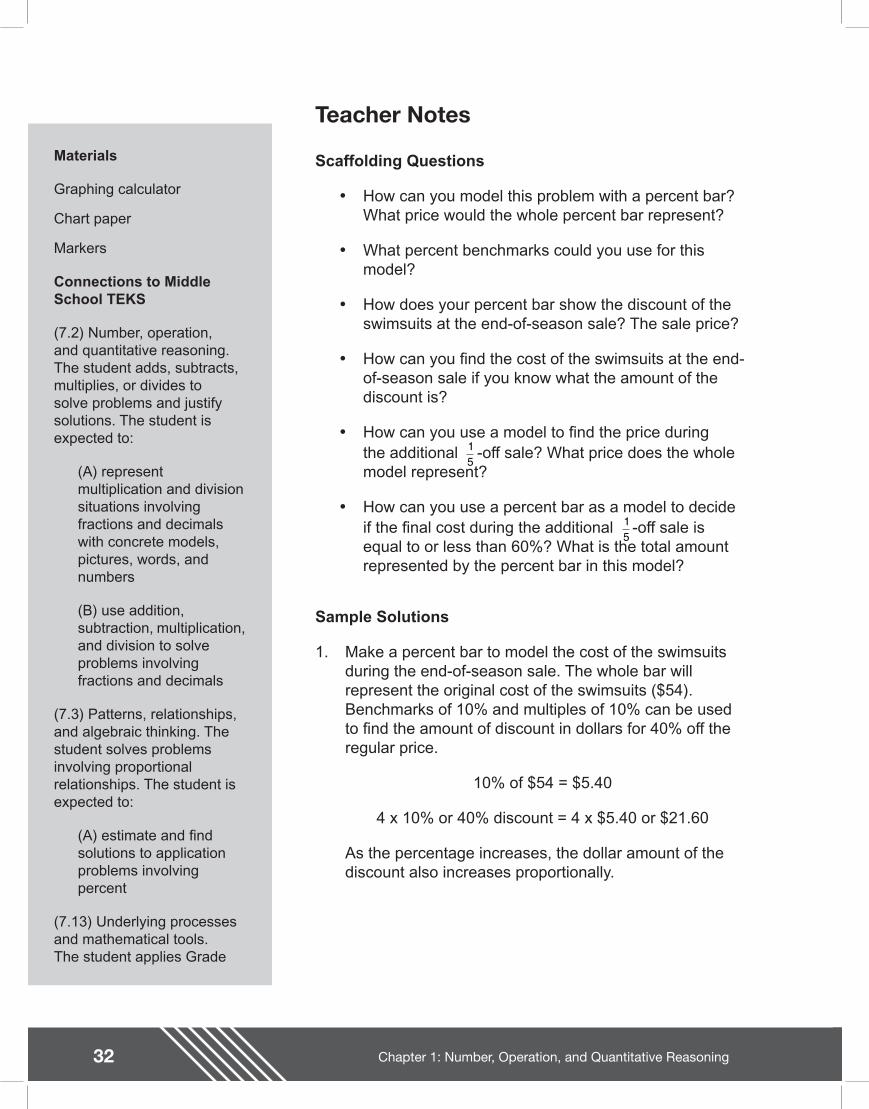
Graphing calculator
Chart paper
Markers
Connections to Middle School TEKS
(7.2) Number, operation, and quantitative reasoning. The student adds, subtracts, multiplies, or divides to solve problems and justify solutions. The student is expected to:
(A) represent multiplication and division situations involving fractions and decimals with concrete models, pictures, words, and numbers
(B) use addition, subtraction, multiplication, and division to solve problems involving fractions and decimals
(7.3) Patterns, relationships, and algebraic thinking. The student solves problems involving proportional relationships. The student is expected to:
(A) estimate and nd solutions to application problems involving percent
(7.13) Underlying processes and mathematical tools. The student applies Grade
Scaffolding Questions
�• How can you model this problem with a percent bar? What price would the whole percent bar represent?
�• What percent benchmarks could you use for this model?
�• How does your percent bar show the discount of the swimsuits at the end-of-season sale? The sale price?
�• How can you nd the cost of the swimsuits at the end-of-season sale if you know what the amount of the discount is?
�• How can you use a model to nd the price during the additional -off sale? What price does the whole model represent?
�• How can you use a percent bar as a model to decide if the nal cost during the additional -off sale is equal to or less than 60%? What is the total amount represented by the percent bar in this model?
Sample Solutions
1. Make a percent bar to model the cost of the swimsuits during the end-of-season sale. The whole bar will represent the original cost of the swimsuits ($54). Benchmarks of 10% and multiples of 10% can be used to nd the amount of discount in dollars for 40% off the regular price.
10% of $54 = $5.40
4 x 10% or 40% discount = 4 x $5.40 or $21.60
As the percentage increases, the dollar amount of the discount also increases proportionally.
15
15
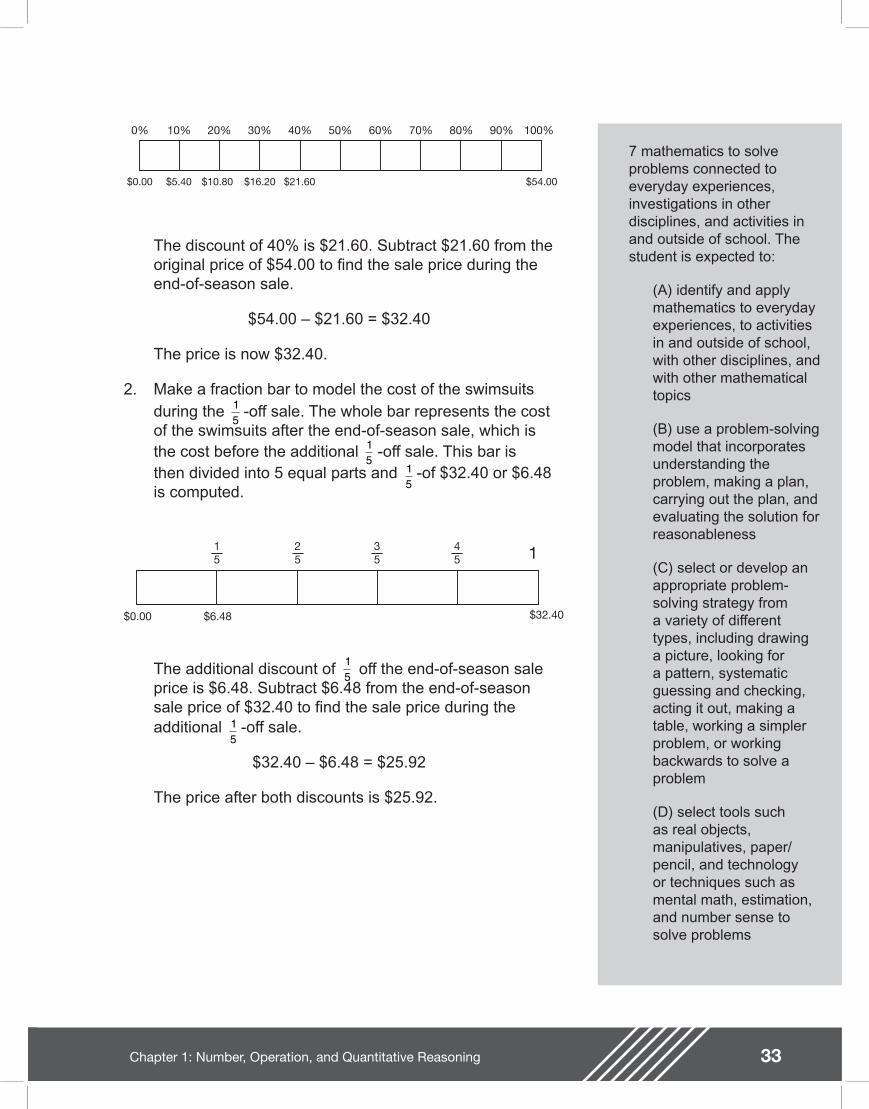
33Chapter 1: Number, Operation, and Quantitative Reasoning
0% 10% 20% 30% 40% 50% 60% 70% 80% 90% 100%
$0.00 $5.40 $10.80 $16.20 $21.60 $54.00
7 mathematics to solve problems connected to everyday experiences, investigations in other disciplines, and activities in and outside of school. The student is expected to:
(A) identify and apply mathematics to everyday experiences, to activities in and outside of school, with other disciplines, and with other mathematical topics
(B) use a problem-solving model that incorporates understanding the problem, making a plan, carrying out the plan, and evaluating the solution for reasonableness
(C) select or develop an appropriate problem-solving strategy from a variety of different types, including drawing a picture, looking for a pattern, systematic guessing and checking, acting it out, making a table, working a simpler problem, or working backwards to solve a problem
(D) select tools such as real objects, manipulatives, paper/pencil, and technology or techniques such as mental math, estimation, and number sense to solve problems
The discount of 40% is $21.60. Subtract $21.60 from the original price of $54.00 to nd the sale price during the end-of-season sale.
$54.00 �– $21.60 = $32.40
The price is now $32.40.
2. Make a fraction bar to model the cost of the swimsuits during the -off sale. The whole bar represents the cost of the swimsuits after the end-of-season sale, which is the cost before the additional -off sale. This bar isthen divided into 5 equal parts and -of $32.40 or $6.48 is computed.
15
15
15
$0.00 $6.48
15
25
35
45 1
$32.40
The additional discount of off the end-of-season sale price is $6.48. Subtract $6.48 from the end-of-season sale price of $32.40 to nd the sale price during the additional -off sale.
$32.40 �– $6.48 = $25.92
The price after both discounts is $25.92.
15
15
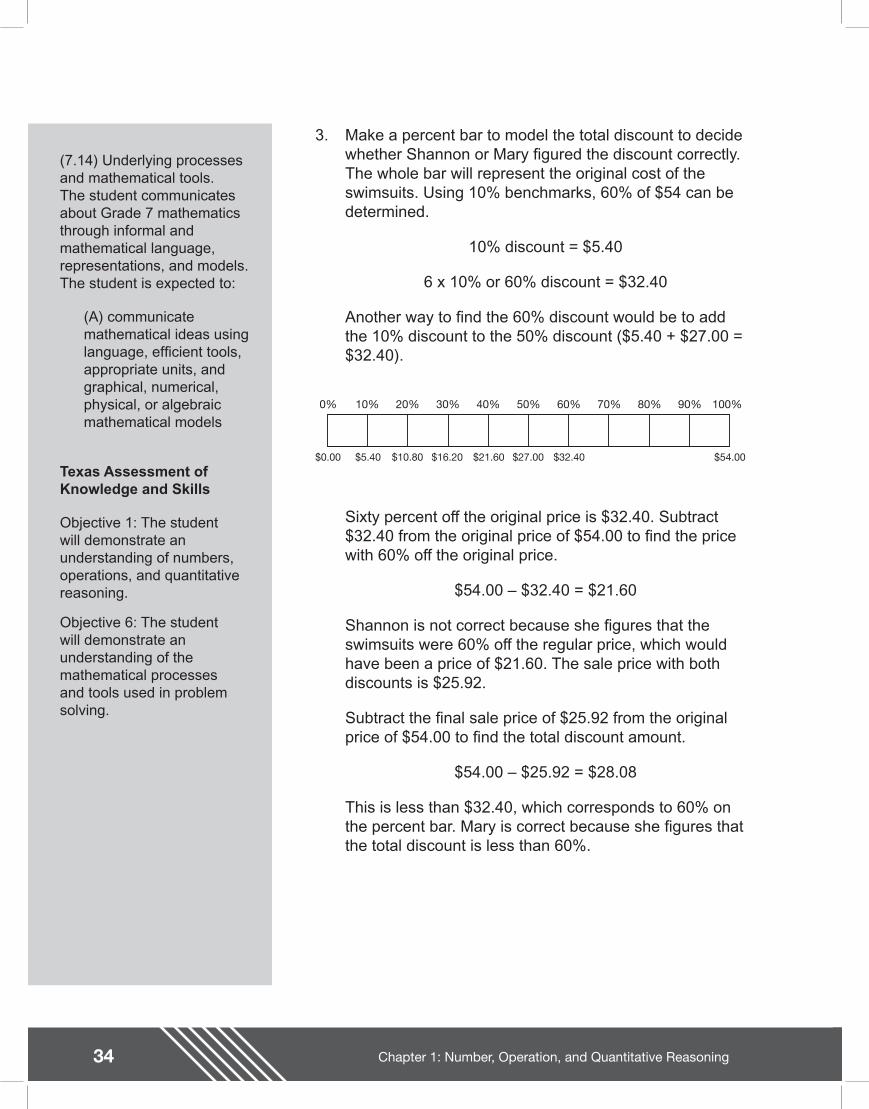
34 Chapter 1: Number, Operation, and Quantitative Reasoning
Teacher Notes
(7.14) Underlying processes and mathematical tools. The student communicates about Grade 7 mathematics through informal and mathematical language, representations, and models. The student is expected to:
(A) communicate mathematical ideas using language, ef cient tools, appropriate units, and graphical, numerical, physical, or algebraic mathematical models
Texas Assessment of Knowledge and Skills
Objective 1: The student will demonstrate an understanding of numbers, operations, and quantitative reasoning.
Objective 6: The student will demonstrate an understanding of the mathematical processes and tools used in problem solving.
3. Make a percent bar to model the total discount to decide whether Shannon or Mary gured the discount correctly. The whole bar will represent the original cost of the swimsuits. Using 10% benchmarks, 60% of $54 can be determined.
10% discount = $5.40
6 x 10% or 60% discount = $32.40
Another way to nd the 60% discount would be to add the 10% discount to the 50% discount ($5.40 + $27.00 = $32.40).
0% 10% 20% 30% 40% 50% 60% 70% 80% 90% 100%
$0.00 $5.40 $10.80 $16.20 $21.60 $27.00 $32.40 $54.00
Sixty percent off the original price is $32.40. Subtract $32.40 from the original price of $54.00 to nd the price with 60% off the original price.
$54.00 �– $32.40 = $21.60
Shannon is not correct because she gures that the swimsuits were 60% off the regular price, which would have been a price of $21.60. The sale price with both discounts is $25.92.
Subtract the nal sale price of $25.92 from the original price of $54.00 to nd the total discount amount.
$54.00 �– $25.92 = $28.08
This is less than $32.40, which corresponds to 60% on the percent bar. Mary is correct because she gures that the total discount is less than 60%.
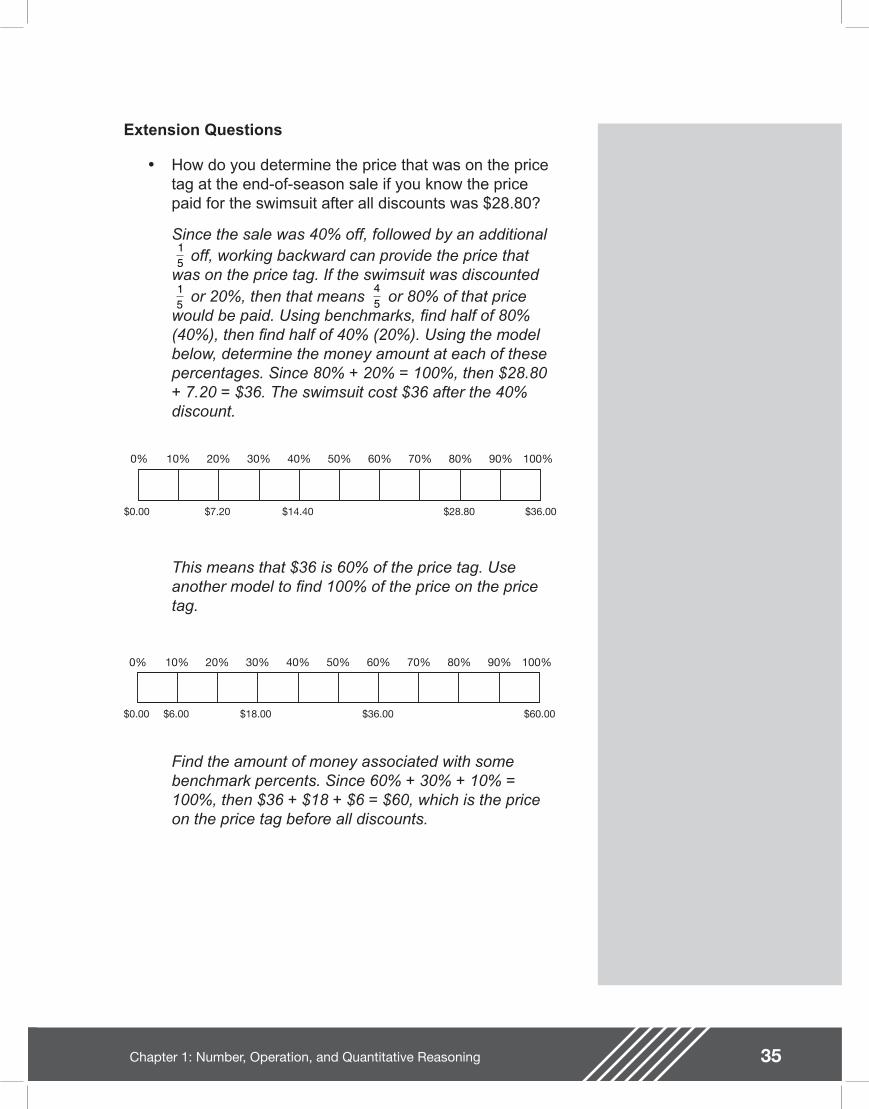
35Chapter 1: Number, Operation, and Quantitative Reasoning
Extension Questions
�• How do you determine the price that was on the price tag at the end-of-season sale if you know the price paid for the swimsuit after all discounts was $28.80?
Since the sale was 40% off, followed by an additional off, working backward can provide the price that
was on the price tag. If the swimsuit was discounted or 20%, then that means or 80% of that price
would be paid. Using benchmarks, nd half of 80% (40%), then nd half of 40% (20%). Using the model below, determine the money amount at each of these percentages. Since 80% + 20% = 100%, then $28.80 + 7.20 = $36. The swimsuit cost $36 after the 40% discount.
15
15
45
0% 10% 20% 30% 40% 50% 60% 70% 80% 90% 100%
$7.20$0.00 $14.40 $28.80 $36.00
This means that $36 is 60% of the price tag. Use another model to nd 100% of the price on the price tag.
0% 10% 20% 30% 40% 50% 60% 70% 80% 90% 100%
$6.00$0.00 $18.00 $36.00 $60.00
Find the amount of money associated with some benchmark percents. Since 60% + 30% + 10% = 100%, then $36 + $18 + $6 = $60, which is the price on the price tag before all discounts.

36 Chapter 1: Number, Operation, and Quantitative Reasoning
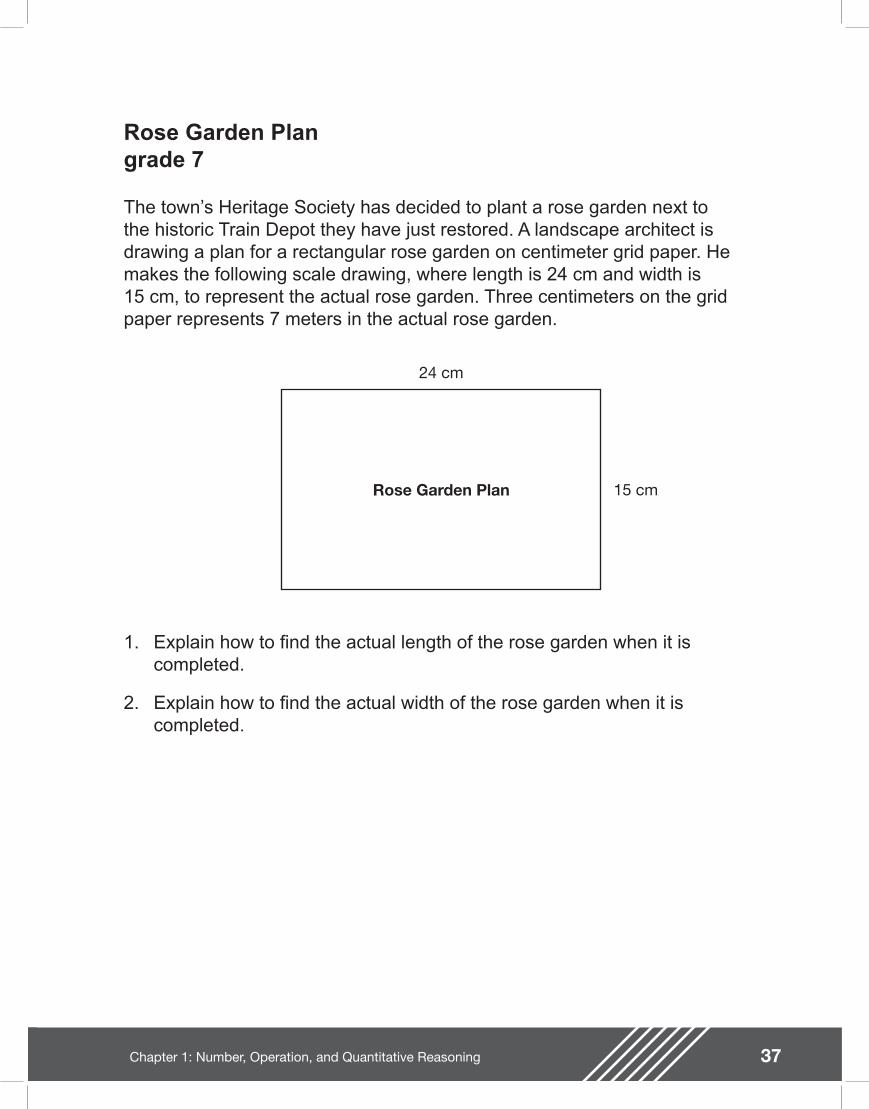
37Chapter 1: Number, Operation, and Quantitative Reasoning
Rose Garden Plangrade 7
The town�’s Heritage Society has decided to plant a rose garden next tothe historic Train Depot they have just restored. A landscape architect is drawing a plan for a rectangular rose garden on centimeter grid paper. Hemakes the following scale drawing, where length is 24 cm and width is 15 cm, to represent the actual rose garden. Three centimeters on the grid paper represents 7 meters in the actual rose garden.
24 cm
15 cmRose Garden Plan
1. Explain how to nd the actual length of the rose garden when it is completed.
2. Explain how to nd the actual width of the rose garden when it is completed.
38 Chapter 1: Number, Operation, and Quantitative Reasoning
Teacher Notes
Materials
Graphing calculator
Centimeter grid paper
Connections to Middle School TEKS
(7.2) Number, operation, and quantitative reasoning. The student adds, subtracts, multiplies, or divides to solve problems and justify solutions. The student is expected to:
(D) use division to nd unit rates and ratios in proportional relationships such as speed, density, price, recipes, and student-teacher ratio
(G) determine the reasonableness of a solution to a problem
(7.13) Underlying processes and mathematical tools. The student applies Grade 7 mathematics to solve problems connected to everyday experiences, investigations in other disciplines, and activities in and outside of school. The student is expected to:
(A) identify and apply mathematics to everyday experiences, to activities in and outside of school, with other disciplines, and with other mathematical topics
Scaffolding Questions
�• How many centimeters in 1 meter?
�• How can you change centimeters to meters?
�• How does the rectangle in the scale drawing compare to the rectangle in the actual rose garden?
�• How do you change the size of a gure without changing its shape?
�• What is the ratio of the number of meters in the actual rose garden to the number of centimeters in the scale drawing?
�• How can you use the scale in the drawing to nd the actual dimensions of the rose garden?
Sample Solutions
1. The relationship between the measure on the grid paper and the actual measure is
Since the length on the scale drawing is 24, we must nd a scale factor that will result in 24 cm.
The ratio is equivalent to and represents 24 cm in the scale drawing to 56 m in the actual rose garden. Therefore, the length of the actual rose garden will be 56 meters.
Possible solution using the equation method:
Find the scale factor from 3 cm to 24 cm and multiply 7 m by this same scale factor of 8 to get 56 m.
3 cm on scale drawing7 meters in the rose garden
37
88
2456
× =
2456
37
37
24 cm m
cm=
x
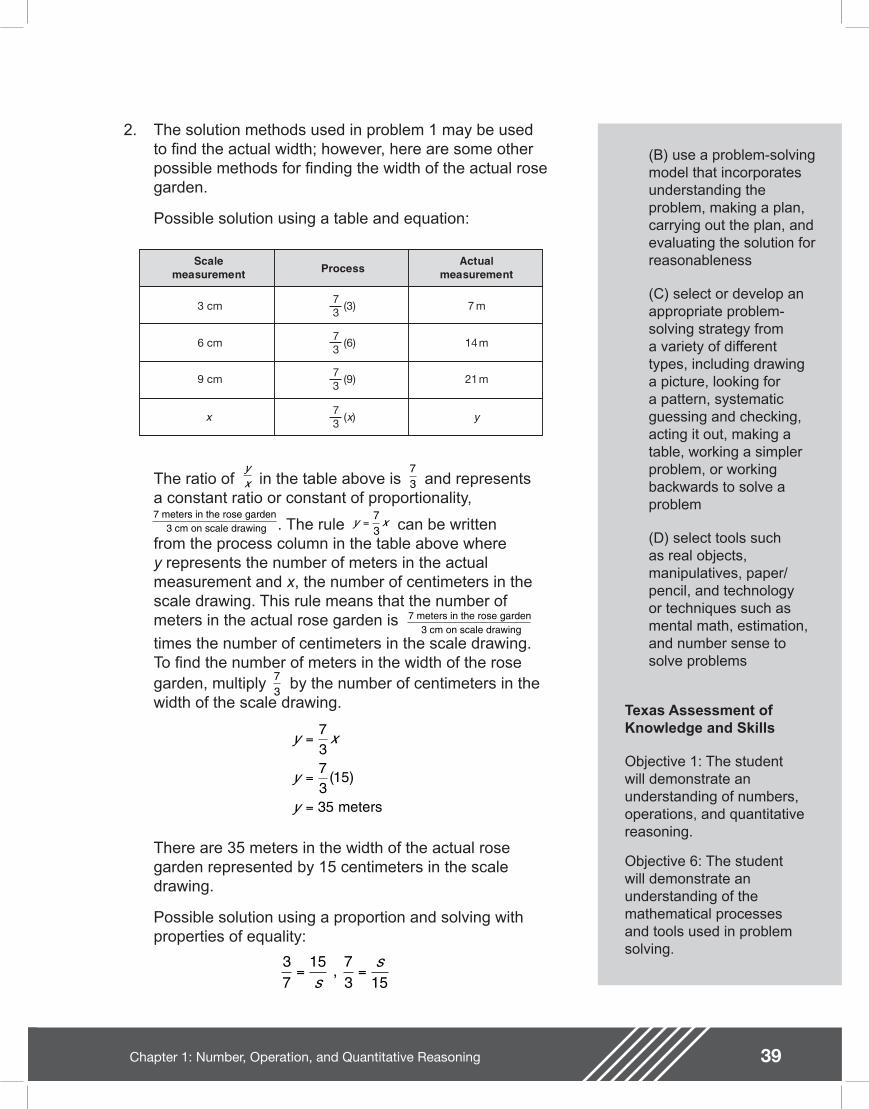
39Chapter 1: Number, Operation, and Quantitative Reasoning
(B) use a problem-solving model that incorporates understanding the problem, making a plan, carrying out the plan, and evaluating the solution for reasonableness
(C) select or develop an appropriate problem-solving strategy from a variety of different types, including drawing a picture, looking for a pattern, systematic guessing and checking, acting it out, making a table, working a simpler problem, or working backwards to solve a problem
(D) select tools such as real objects, manipulatives, paper/pencil, and technology or techniques such as mental math, estimation, and number sense to solve problems
Texas Assessment of Knowledge and Skills
Objective 1: The student will demonstrate an understanding of numbers, operations, and quantitative reasoning.
Objective 6: The student will demonstrate an understanding of the mathematical processes and tools used in problem solving.
2. The solution methods used in problem 1 may be used to nd the actual width; however, here are some other possible methods for nding the width of the actual rose garden.
Possible solution using a table and equation:
Scalemeasurement Process
Actualmeasurement
3 cm 7 m73
(3)
6 cm 14 m73
(6)
9 cm 21 m73
(9)
x y73
(x)
The ratio of in the table above is and represents a constant ratio or constant of proportionality,
. The rule can be written from the process column in the table above where y represents the number of meters in the actual measurement and x, the number of centimeters in the scale drawing. This rule means that the number of meters in the actual rose garden is
times the number of centimeters in the scale drawing. To nd the number of meters in the width of the rose garden, multiply by the number of centimeters in the width of the scale drawing.
There are 35 meters in the width of the actual rose garden represented by 15 centimeters in the scale drawing.
Possible solution using a proportion and solving with properties of equality:
yx
73
7 meters in the rose garden 3 cm on scale drawing y x=
73
7 meters in the rose garden 3 cm on scale drawing
73
y x
y
y
=
=
=
7373
15
35
( )
meters
37
15 73 15
= =s
s ,
40 Chapter 1: Number, Operation, and Quantitative Reasoning
Multiply both sides of the equation by 15 to get the following solution:
Extension Questions
�• The Heritage Society decides they will put both a rose garden and a vegetable garden in the same amount of space as the original rose garden. What are several options for the design of the rose garden/vegetable garden combination? The new scale drawing uses a scale of 2 centimeters on the grid paper to represent 5 meters in the garden. What will the dimensions of the new scale drawing be?
The problem involves �“undoing�” what was done in problems 1 and 2 where the dimensions of the scale drawing were given and the dimensions of the actual rose garden had to be found. In this problem, the dimensions of the actual rose garden are known from problems 1 and 2 (l = 56 m, w = 35 m), and the dimensions of the scale drawing must be found.
Another difference involves the scale used: 2 cm on the grid represents 5 m in the actual garden. The equation can be written and solved using the scale factor method. Scale up 5 m to 35 m using a scale factor of 7. Multiply 2 cm by the scale factor 7 to get 14 cm for the width in the new scale drawing.
The equation is solved in a similar way. Scale up 5 m to 56 m using a scale factor of 11.2. Multiply 2 cm by 11.2 to get 22.4 cm for the length in the new scale drawing. The dimensions of the new scale drawing using 2 centimeters to represent 5 meters in the actual garden will be length = 22.4 cm and width = 14 cm.
This area can then be divided into the rose garden and the vegetable garden in a variety of ways.
�• Suppose the dimensions of the scale drawing in the original problem are doubled. How would this affect the scale so that the actual size of the garden does not change? Explain.
The actual size of the garden was found to be 35 meters by 56 meters in the original problem. When the dimensions of the scale drawing are doubled, they become30 cm by 48 cm. The question is �“What scale is used in the drawing (30 cm by48 cm) to represent 35 meters by 56 meters in the actual garden?�”
The ratio of centimeters in the width of the scale drawing to corresponding meters
2 cm5 m 35 m
=x
2 cm5 m 56 m
=x
15 x 73
= 15 x
=
m = or = 35 meters
s
s
s s
15105
335

41Chapter 1: Number, Operation, and Quantitative Reasoning
in the width of the actual garden can be written as 30 cm : 35 m or 6 cm : 7 m. The ratio of centimeters in the length of the scale drawing to corresponding meters in the length of the actual garden can also be written as 48 cm : 56 m or 6 cm : 7 m. This common ratio 6 cm : 7 m shows the scale that was used in the scale drawing with l = 48 cm and w = 30 to represent the dimensions of the actual garden of 35 meters by 56 meters.

42 Chapter 1: Number, Operation, and Quantitative Reasoning
43Chapter 1: Number, Operation, and Quantitative Reasoning
Talk, Talk, Talkgrade 8
Mrs. Kim decided to buy her son, Jason, a cellular phone so that he can easily communicate with his parents when he is away from home. Mrs. Kim found two companies that offer special rates for students. Talk Cheap cellular phone service has no monthly basic fee but charges $0.55 a minute. Talk Easy cellular phone service charges a basic monthly fee of $35 plus $0.15 for each minute used. Both companies do not round the time to the nearest minute like many of their competitors do; they charge only for the exact amount of time used. Build a table, make a graph, and write a rule to represent the cost of cellular service for both companies.
1. If price is the only factor, which plan is better?
2. Which company should Mrs. Kim choose if Jason never uses more than 30 minutes of cellular phone time each month?
3. If Jason knows the cost of each plan for 30 minutes, can he double this cost to nd the cost for 60 minutes? Explain your answer.
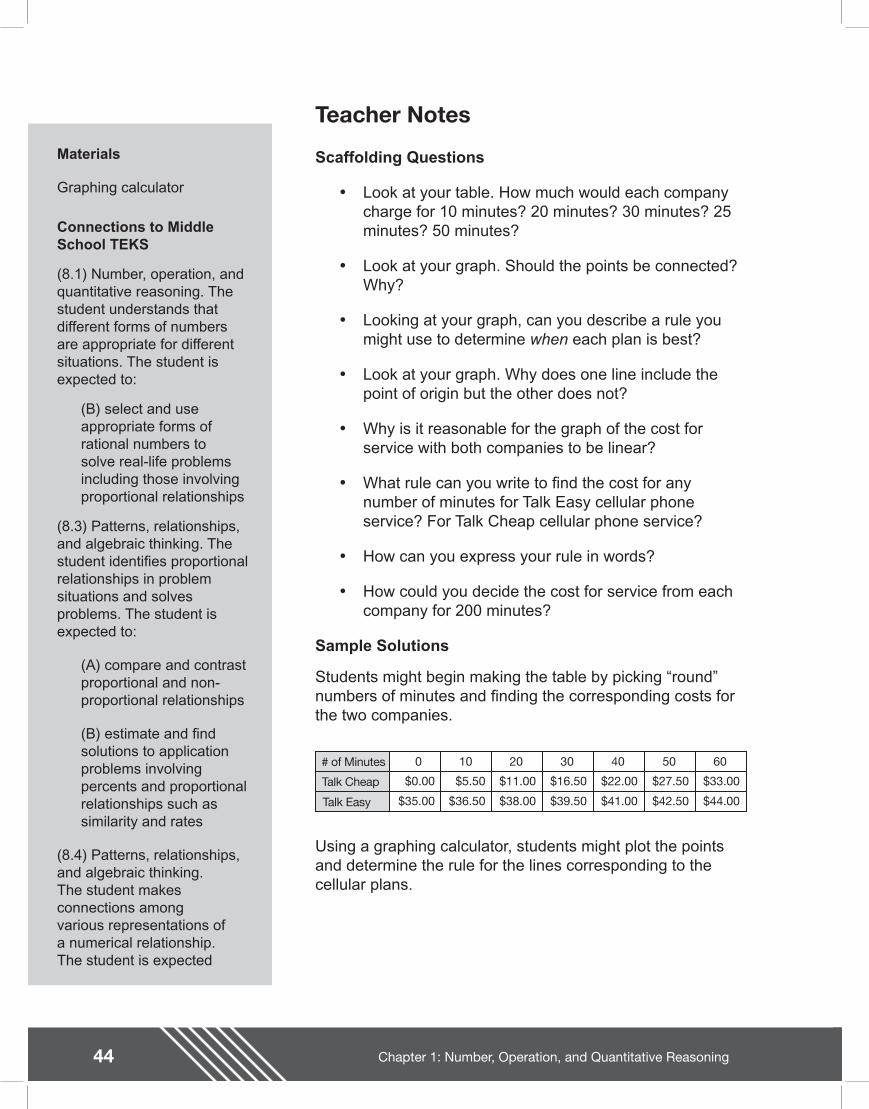
44 Chapter 1: Number, Operation, and Quantitative Reasoning
Teacher Notes
Materials
Graphing calculator
Connections to Middle School TEKS
(8.1) Number, operation, and quantitative reasoning. The student understands that different forms of numbers are appropriate for different situations. The student is expected to:
(B) select and use appropriate forms of rational numbers to solve real-life problems including those involving proportional relationships
(8.3) Patterns, relationships, and algebraic thinking. The student identi es proportional relationships in problem situations and solves problems. The student is expected to:
(A) compare and contrast proportional and non-proportional relationships
(B) estimate and nd solutions to application problems involving percents and proportional relationships such as similarity and rates
(8.4) Patterns, relationships, and algebraic thinking. The student makes connections among various representations of a numerical relationship. The student is expected
Scaffolding Questions
�• Look at your table. How much would each company charge for 10 minutes? 20 minutes? 30 minutes? 25 minutes? 50 minutes?
�• Look at your graph. Should the points be connected? Why?
�• Looking at your graph, can you describe a rule you might use to determine when each plan is best?
�• Look at your graph. Why does one line include the point of origin but the other does not?
�• Why is it reasonable for the graph of the cost for service with both companies to be linear?
�• What rule can you write to nd the cost for any number of minutes for Talk Easy cellular phone service? For Talk Cheap cellular phone service?
�• How can you express your rule in words?
�• How could you decide the cost for service from each company for 200 minutes?
Sample Solutions
Students might begin making the table by picking �“round�” numbers of minutes and nding the corresponding costs for the two companies.
0
$0.00
$35.00
10
$5.50
$36.50
20
$11.00
$38.00
30
$16.50
$39.50
40
$22.00
$41.00
50
$27.50
$42.50
60
$33.00
$44.00
# of Minutes
Talk Cheap
Talk Easy
Using a graphing calculator, students might plot the points and determine the rule for the lines corresponding to the cellular plans.
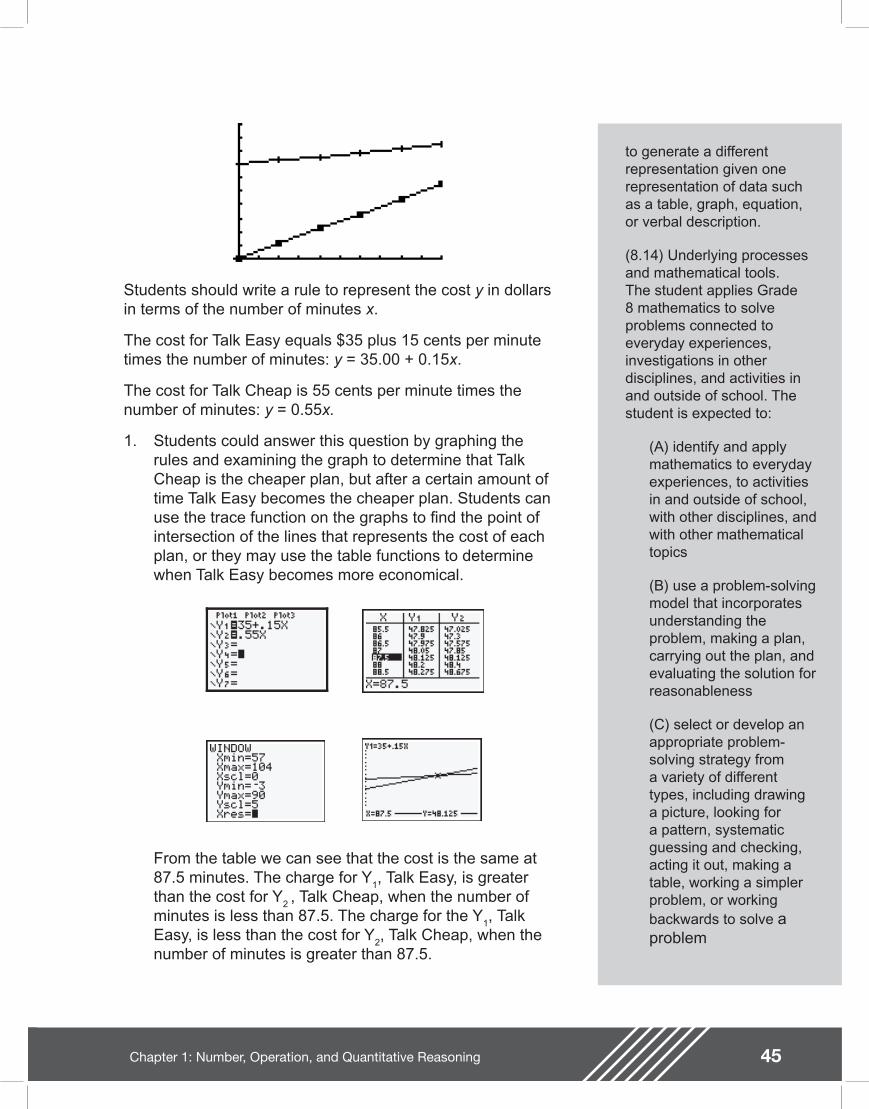
45Chapter 1: Number, Operation, and Quantitative Reasoning
to generate a different representation given one representation of data such as a table, graph, equation, or verbal description.
(8.14) Underlying processes and mathematical tools. The student applies Grade 8 mathematics to solve problems connected to everyday experiences, investigations in other disciplines, and activities in and outside of school. The student is expected to:
(A) identify and apply mathematics to everyday experiences, to activities in and outside of school, with other disciplines, and with other mathematical topics
(B) use a problem-solving model that incorporates understanding the problem, making a plan, carrying out the plan, and evaluating the solution for reasonableness
(C) select or develop an appropriate problem-solving strategy from a variety of different types, including drawing a picture, looking for a pattern, systematic guessing and checking, acting it out, making a table, working a simpler problem, or working backwards to solve a problem
Students should write a rule to represent the cost y in dollars in terms of the number of minutes x.
The cost for Talk Easy equals $35 plus 15 cents per minute times the number of minutes: y = 35.00 + 0.15x.
The cost for Talk Cheap is 55 cents per minute times the number of minutes: y = 0.55x.
1. Students could answer this question by graphing the rules and examining the graph to determine that Talk Cheap is the cheaper plan, but after a certain amount of time Talk Easy becomes the cheaper plan. Students can use the trace function on the graphs to nd the point of intersection of the lines that represents the cost of each plan, or they may use the table functions to determine when Talk Easy becomes more economical.
From the table we can see that the cost is the same at 87.5 minutes. The charge for Y
1, Talk Easy, is greater
than the cost for Y2 , Talk Cheap, when the number of
minutes is less than 87.5. The charge for the Y1, Talk
Easy, is less than the cost for Y2, Talk Cheap, when the
number of minutes is greater than 87.5.
46 Chapter 1: Number, Operation, and Quantitative Reasoning
Teacher Notes
(D) select tools such as real objects, manipulatives, paper/pencil, and technology or techniques such as mental math, estimation, and number sense to solve problems
(8.15) Underlying processes and mathematical tools. The student communicates about Grade 8 mathematics through informal and mathematical language, representations, and models. The student is expected to:
(A) communicate mathematical ideas using language, ef cient tools, appropriate units, and graphical, numerical, physical, or algebraic mathematical models
The graph of Y1, Talk Easy, is above the graph of Y
2, Talk
Cheap, for minutes less than 87.5. The graph of Y1, Talk
Easy, is below the graph of Y2, Talk Cheap, for minutes
greater than 87.5.
Using one of these methods students will conclude that Talk Cheap is a more economical plan if the phone is used for less than 87.5 minutes; otherwise, Talk Easy is the better plan.
2. Mrs. Kim should choose Talk Cheap if Jason never uses more than 30 minutes of talk time. This can be determined by using the table or graph shown above.
3. The rule for the Talk Cheap plan is y = 0.55x and the graph of the rule passes through the origin. Therefore, the cost of Talk Cheap plan is proportional to the time used, so Jason can gure the cost of 60 minutes by doubling the cost of 30 minutes of talk time for this plan. However, because there is a basic monthly fee, Talk Easy charges are not proportional to the time used. That is, the graph of the rule, y = 35.00 + 0.15x, does not pass through the origin, so this rule does not represent a proportional relationship. Jason cannot gure the cost of 60 minutes by doubling the cost of 30 minutes of talk time for this plan.
y = 35.00 + 0.15(30) = $39.50
y = 35.00 + 0.15(60) = $44

47Chapter 1: Number, Operation, and Quantitative Reasoning
Texas Assessment of Knowledge and Skills
Objective 1: The student will demonstrate an understanding of numbers, operations, and quantitative reasoning.
Objective 2: The student will demonstrate an understanding of patterns, relationships, and algebraic reasoning.
Objective 6: The student will demonstrate an understanding of the mathematical processes and tools used in problem solving.
Extension Questions
�• How would the graphs be affected if Talk Easy increased or decreased its basic fee, or if Talk Cheap began charging a fee?
The point where the graph of the line intersects the y-axis would be changed to the new starting fee amount.
�• How would the graph of Talk Cheap be affected if the company increased or decreased its cost per minute?
The steepness (slope) of the graph would change.
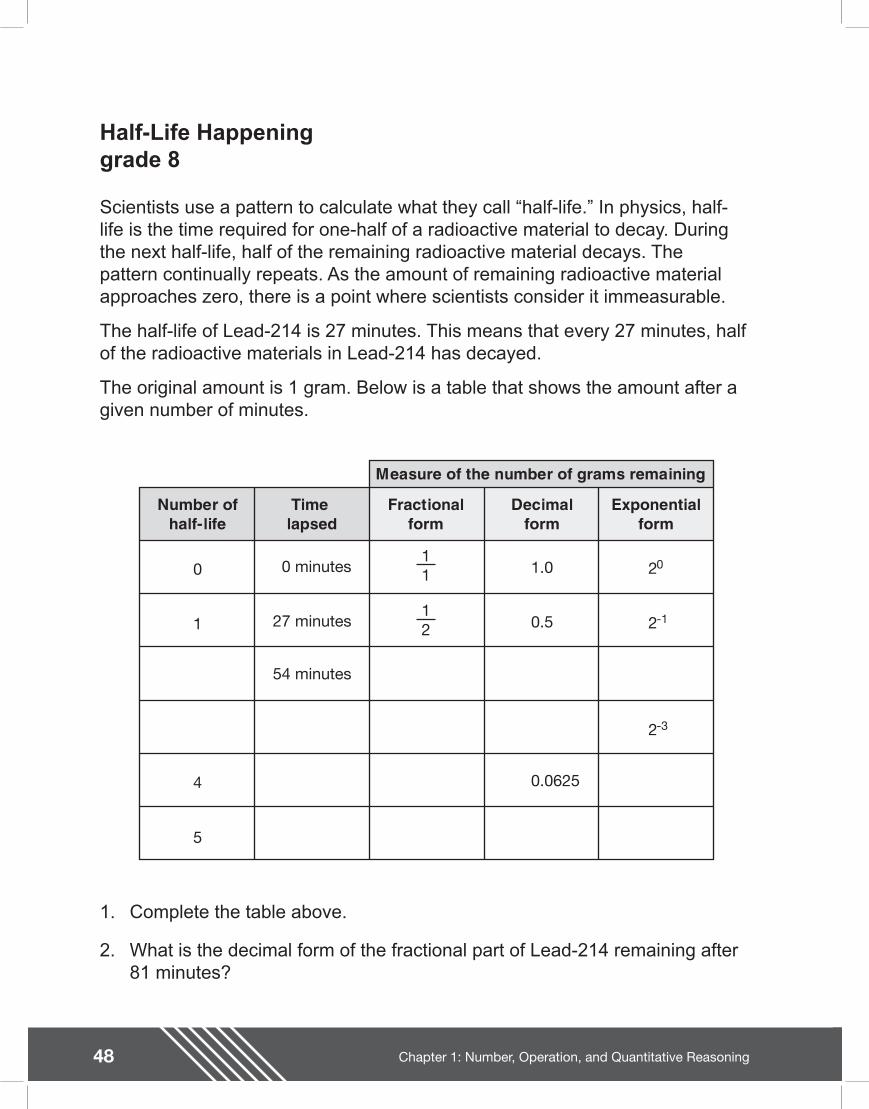
48 Chapter 1: Number, Operation, and Quantitative Reasoning
Half-Life Happeninggrade 8
Scientists use a pattern to calculate what they call �“half-life.�” In physics, half-life is the time required for one-half of a radioactive material to decay. During the next half-life, half of the remaining radioactive material decays. The pattern continually repeats. As the amount of remaining radioactive material approaches zero, there is a point where scientists consider it immeasurable.
The half-life of Lead-214 is 27 minutes. This means that every 27 minutes, half of the radioactive materials in Lead-214 has decayed.
The original amount is 1 gram. Below is a table that shows the amount after a given number of minutes.
Number ofhalf-life
Time lapsed
Fractionalform
Decimalform
Exponentialform
Measure of the number of grams remaining
0 0 minutes 1.0 2011
1 27 minutes 0.5 2-112
54 minutes
2-3
4 0.0625
5
1. Complete the table above.
2. What is the decimal form of the fractional part of Lead-214 remaining after 81 minutes?
49Chapter 1: Number, Operation, and Quantitative Reasoning
3. What is the exponential form of the fractional part of Lead-214 remaining after 108 minutes?
4. Using scienti c notation, give the part of Lead-214 that is remaining after 2 hours and 15 minutes of decay.
5. If you know the time lapse at the fth half-life, can you double this amount to nd the time lapse at the tenth half-life? Explain.
6. If you know the amount remaining of Lead-214 at the fth half-life, can you double this amount to nd the amount remaining of Lead-214 at the tenth half-life? Explain.
7. What is the amount of decay at the fth half-life? Can you double this amount to nd the amount of decay of Lead-214 for tenth half-life? Explain.
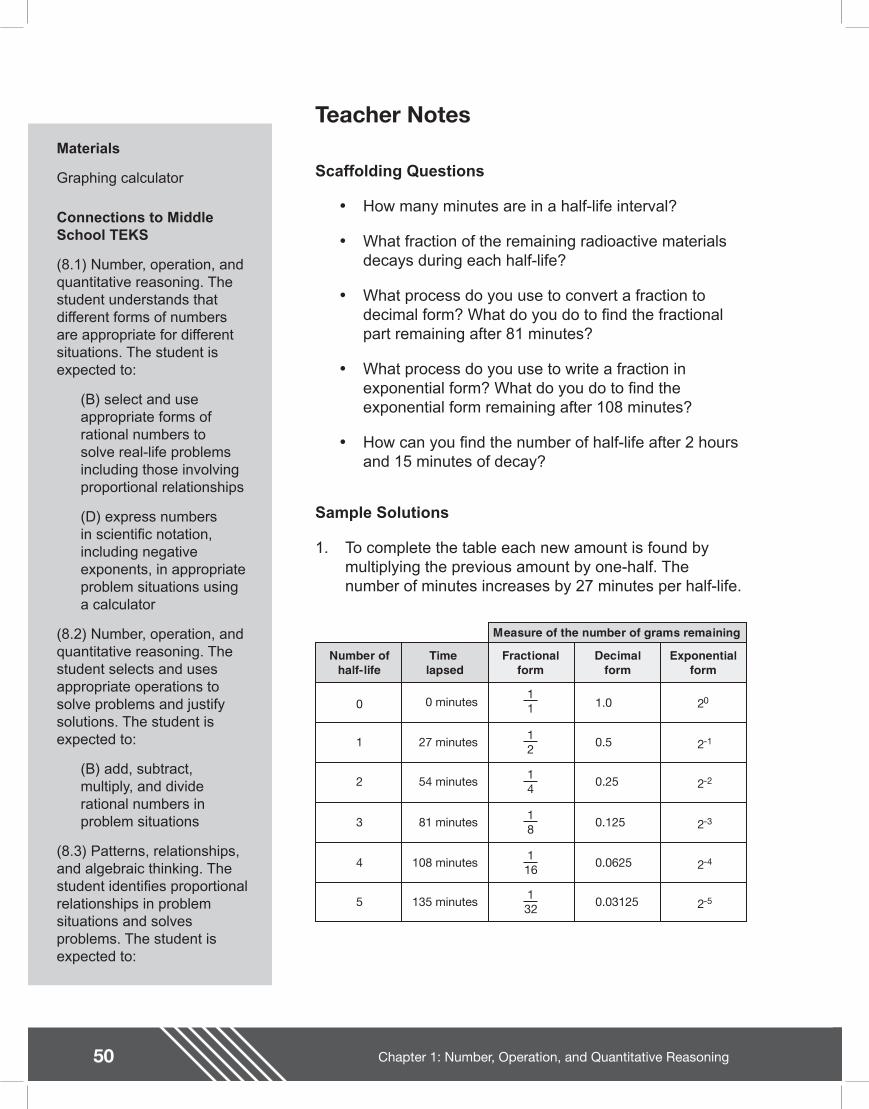
50 Chapter 1: Number, Operation, and Quantitative Reasoning
Teacher NotesMaterials
Graphing calculator
Connections to Middle School TEKS
(8.1) Number, operation, and quantitative reasoning. The student understands that different forms of numbers are appropriate for different situations. The student is expected to:
(B) select and use appropriate forms of rational numbers to solve real-life problems including those involving proportional relationships
(D) express numbers in scienti c notation, including negative exponents, in appropriate problem situations using a calculator
(8.2) Number, operation, and quantitative reasoning. The student selects and uses appropriate operations to solve problems and justify solutions. The student is expected to:
(B) add, subtract, multiply, and divide rational numbers in problem situations
(8.3) Patterns, relationships, and algebraic thinking. The student identi es proportional relationships in problem situations and solves problems. The student is expected to:
Scaffolding Questions
�• How many minutes are in a half-life interval?
�• What fraction of the remaining radioactive materials decays during each half-life?
�• What process do you use to convert a fraction to decimal form? What do you do to nd the fractional part remaining after 81 minutes?
�• What process do you use to write a fraction in exponential form? What do you do to nd the exponential form remaining after 108 minutes?
�• How can you nd the number of half-life after 2 hours and 15 minutes of decay?
Sample Solutions
1. To complete the table each new amount is found by multiplying the previous amount by one-half. The number of minutes increases by 27 minutes per half-life.
Number ofhalf-life
Time lapsed
Fractionalform
Decimalform
Exponentialform
Measure of the number of grams remaining
0 1.0 2011
1
2
3
0.5
0.25
0.125
0.03125
2-1
2-2
2-4
2-5
12
14
18
116
132
0 minutes
27 minutes
54 minutes
81 minutes
108 minutes
135 minutes
2-3
4 0.0625
5
51Chapter 1: Number, Operation, and Quantitative Reasoning
(A) compare and contrast proportional and non-proportional relationships
(8.14) Underlying processes and mathematical tools. The student applies Grade 8 mathematics to solve problems connected to everyday experiences, investigations in other disciplines, and activities in and outside of school. The student is expected to:
(A) identify and apply mathematics to everyday experiences, to activities in and outside of school, with other disciplines, and with other mathematical topics
(B) use a problem-solving model that incorporates understanding the problem, making a plan, carrying out the plan, and evaluating the solution for reasonableness
(C) select or develop an appropriate problem-solving strategy from a variety of different types, including drawing a picture, looking for a pattern, systematic guessing and checking, acting it out, making a table, working a simpler problem, or working backwards to solve a problem
2. Students should use the table they created to answer this question. The decimal form of the fractional part of Lead-214 remaining after 81 minutes is 0.125 grams.
3. The exponential form of the fractional part of Lead-214 remaining after 108 minutes is grams.
4. Students must convert 2 hours and 15 minutes to minutes. Two hours is 2(60), or 120 minutes; 120 minutes plus 15 minutes is 135 minutes. From the table, the decimal form of measures of amount remaining is 0.3125. Change this to scienti c notation.
0.03125 in scienti c notation is
5. Yes, the time lapse is growing at a constant rate of 27 minutes per half-life. The time lapse for the fth half-life is 5(27), or 135 minutes, so the time lapse of the tenth half-life will be 10(27), or 270 minutes.
6. No, the measures of amount remaining are not growing at a constant rate. In fact, they are decreasing exponentially. For example, the change from the rst half-life to the second half-life is 0.25 �– 0.5 or a decrease of 0.25. The change from the second half-life to the third half-life is 0.125 �– 0.5, or a decrease of 0.125.
7. For fth half-life, the amount remaining is ; therefore, the amount of decay is . No, the amount of decay is not growing at a constant rate. The amount remaining
for the tenth half-life is ; therefore, the amount of decay is .
2 4
3 125 10 2. ×
13231
32
110241023
1024
52 Chapter 1: Number, Operation, and Quantitative Reasoning
Teacher Notes
(D) select tools such as real objects, manipulatives, paper/pencil, and technology or techniques such as mental math, estimation, and number sense to solve problems
(8.15) Underlying processes and mathematical tools. The student communicates about Grade 8 mathematics through informal and mathematical language, representations, and models. The student is expected to:
(A) communicate mathematical ideas using language, ef cient tools, appropriate units, and graphical, numerical, physical, or algebraic mathematical models
Texas Assessment of Knowledge and Skills
Objective 1: The student will demonstrate an understanding of numbers, operations, and quantitative reasoning.
Objective 2: The student will demonstrate an understanding of patterns, relationships, and algebraic reasoning.
Objective 6: The student will demonstrate an understanding of the mathematical processes and tools used in problem solving.
Extension Questions
�• Can you write an equation to represent the decay of Lead-214 (y) in terms of the number of half-life (x)? Explain your equation.
Every half-life the amount of Lead-214 decreases by , so an exponent can be used to represent the half-
life number, and that will give us the amount of decay for that half-life number. For example, for half-life 5, so
y x= ( )12
12
y = ( )12
5 y = 0.03125

53Chapter 1: Number, Operation, and Quantitative Reasoning

54 Chapter 1: Number, Operation, and Quantitative Reasoning

Middle SchooIAssessments
Chapter 2:Patterns, Relationships,and Algebraic Thinking

56 Chapter 2: Patterns, Relationships, and Algebraic Thinking
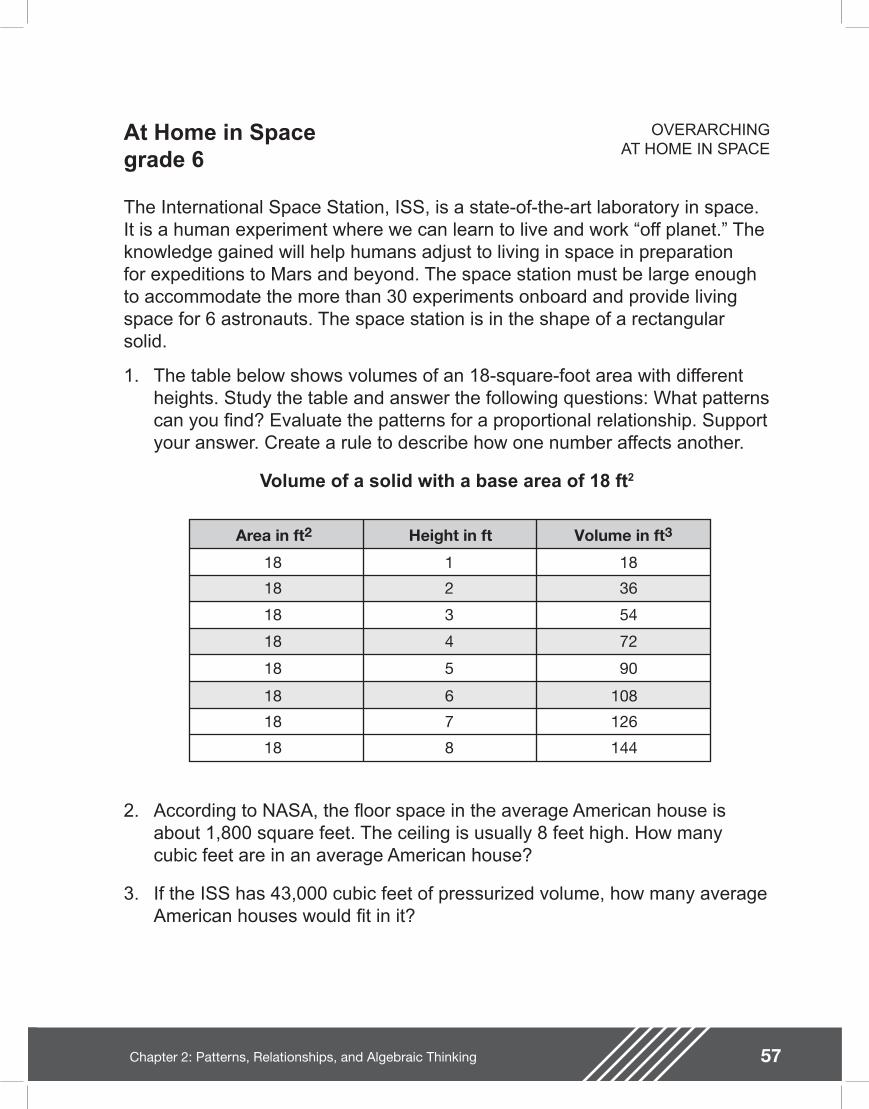
57Chapter 2: Patterns, Relationships, and Algebraic Thinking
At Home in Spacegrade 6
The International Space Station, ISS, is a state-of-the-art laboratory in space. It is a human experiment where we can learn to live and work �“off planet.�” The knowledge gained will help humans adjust to living in space in preparation for expeditions to Mars and beyond. The space station must be large enough to accommodate the more than 30 experiments onboard and provide living space for 6 astronauts. The space station is in the shape of a rectangular solid.
1. The table below shows volumes of an 18-square-foot area with different heights. Study the table and answer the following questions: What patterns can you nd? Evaluate the patterns for a proportional relationship. Support your answer. Create a rule to describe how one number affects another.
Volume of a solid with a base area of 18 ft2
OVERARCHINGAT HOME IN SPACE
Area in ft2 Height in ft Volume in ft3
18 1 18
18 2 36
18 3 54
18 4 72
18 5 90
18 6 108
18 7 126
18 8 144
2. According to NASA, the oor space in the average American house is about 1,800 square feet. The ceiling is usually 8 feet high. How many cubic feet are in an average American house?
3. If the ISS has 43,000 cubic feet of pressurized volume, how many average American houses would t in it?
58
Teacher Notes
Chapter 2: Patterns, Relationships, and Algebraic Thinking
Materials
Calculator
Cubes
Rectangular boxes
Grid paper
Connections to TEKS
(6.3) Patterns, relationships, and algebraic thinking. The student solves problems involving proportional relationships. The student is expected to:
(A) use ratios to describe proportional situations
(B) represent ratios and percents with concrete models, fractions, and decimals
(C) use ratios to make predictions in proportional situations
(6.4) Patterns, relationships, and algebraic thinking. The student uses letters as variables in mathematical expressions to describe how one quantity changes when a related quantity changes. The student is expected to:
(A) use tables and symbols to represent and describe proportional and other relationships involving conversions, sequences, perimeter, area, etc.
Scaffolding Questions
�• Can you describe a strategy to nd volume?
�• How are units of measurement used to express area? Volume?
�• Describe how you could show the oor area with cubes.
�• What ratios can be found using the data in the table?
�• How does area relate to volume? Volume to area? Volume to height?
�• How is the living space at home like or different from the living space in the ISS?
�• What solid gure best describes a simple house?
�• What is the oor area of the average American house?
�• Can you describe a method for nding oor area?
�• How can you use cubes to model a rectangular house?
�• Does a simpler problem created by dividing the area and volume by 100 model the same pattern?
�• Is there a relationship between the height and the number of cubes?
�• Which item from the table is represented by the variable?
Sample Solutions
1. Answers will vary. Here are some patterns the students may nd.
�• The area remains the same or constant.
�• The volume is always the area times the height.
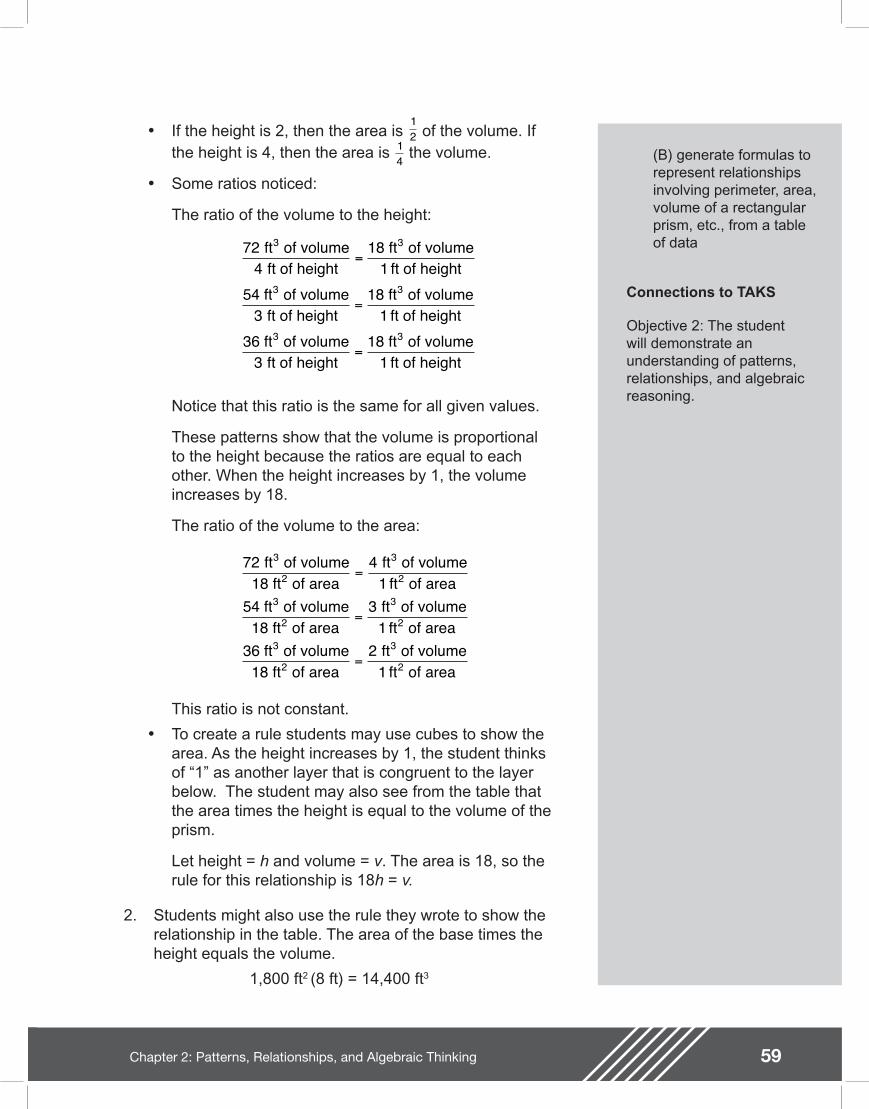
59Chapter 2: Patterns, Relationships, and Algebraic Thinking
(B) generate formulas to represent relationships involving perimeter, area, volume of a rectangular prism, etc., from a table of data
Connections to TAKS
Objective 2: The student will demonstrate an understanding of patterns, relationships, and algebraic reasoning.
�• If the height is 2, then the area is of the volume. If the height is 4, then the area is the volume.
�• Some ratios noticed:
The ratio of the volume to the height:
Notice that this ratio is the same for all given values.
These patterns show that the volume is proportional to the height because the ratios are equal to each other. When the height increases by 1, the volume increases by 18.
The ratio of the volume to the area:
This ratio is not constant.
�• To create a rule students may use cubes to show the area. As the height increases by 1, the student thinks of �“1�” as another layer that is congruent to the layer below. The student may also see from the table that the area times the height is equal to the volume of the prism.
Let height = h and volume = v. The area is 18, so the rule for this relationship is 18h = v.
2. Students might also use the rule they wrote to show the relationship in the table. The area of the base times the height equals the volume.
1,800 ft2 (8 ft) = 14,400 ft3
12
14
721
41
51
31
31
21
ft of volume8 ft of area
ft of volume ft of area
4 ft of volume8 ft of area
ft of volume ft of area
6 ft of volume8 ft of area
ft of volume ft of area
3
2
3
2
3
2
3
2
3
2
3
2
=
=
=
724
11
53
11
33
11
ft of volume ft of height
8 ft of volume ft of height
4 ft of volume ft of height
8 ft of volume ft of height
6 ft of volume ft of height
8 ft of volume ft of height
3 3
3 3
3 3
=
=
=
60 Chapter 2: Patterns, Relationships, and Algebraic Thinking
3. The calculator may assist with this solution. Some students may use repeated addition such as 14,400 + 14,400 + 14,400 = 43,200, or some may divide 43,000 by 14,400 to nd that the answer is approximately 3 houses.
Extension Questions
�• According to NASA, the average American house has a 100 amp service from the electric company. The following conversion is also true:
100 amps x 110 volts = 11,000 watts or 11 kilowatts
If the International Space Station uses approximately 110 kilowatts, about how many houses could it power?
The student can set up a relationship between kilowatts used per house and the kilowatts used on the space station to nd the number of houses that would use the same amount of kilowatts.
The same relationship can be shown using the following table:
11 11 110 kw of power1 house
kw of power x 101 house x 10
kw of power10 houses
= =
Houses
Kilowatts
10
110
9
99
8
88
7
77
6
66
5
55
4
44
3
33
2
22
1
11
Resources used in this section
NASA Human Spacefl ight, spacefl ight.nasa.gov
NASA Fun Stuff! Station Overview, www.hq.nasa.gov/osf/funstuff/stationoverview/sld019.htm and www.hq.nasa.gov/osf/funstuff/stationoverview/sld021.htm
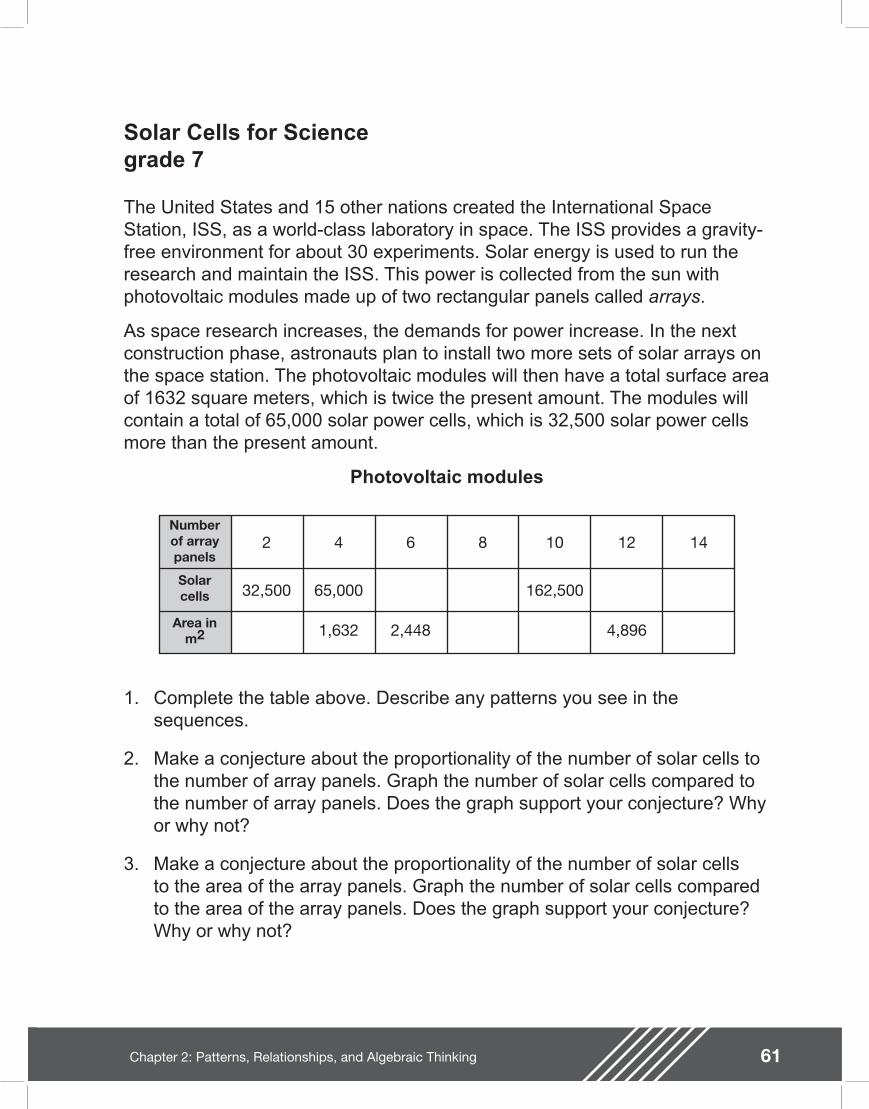
61Chapter 2: Patterns, Relationships, and Algebraic Thinking
Solar Cells for Science grade 7
The United States and 15 other nations created the International Space Station, ISS, as a world-class laboratory in space. The ISS provides a gravity-free environment for about 30 experiments. Solar energy is used to run the research and maintain the ISS. This power is collected from the sun with photovoltaic modules made up of two rectangular panels called arrays.
As space research increases, the demands for power increase. In the next construction phase, astronauts plan to install two more sets of solar arrays on the space station. The photovoltaic modules will then have a total surface area of 1632 square meters, which is twice the present amount. The modules will contain a total of 65,000 solar power cells, which is 32,500 solar power cells more than the present amount.
Photovoltaic modules
Numberof arraypanels
Solarcells
Area inm2
2 4 6 8 10 12 14
32,500 65,000 162,500
1,632 2,448 4,896
1. Complete the table above. Describe any patterns you see in the sequences.
2. Make a conjecture about the proportionality of the number of solar cells to the number of array panels. Graph the number of solar cells compared to the number of array panels. Does the graph support your conjecture? Why or why not?
3. Make a conjecture about the proportionality of the number of solar cells to the area of the array panels. Graph the number of solar cells compared to the area of the array panels. Does the graph support your conjecture? Why or why not?
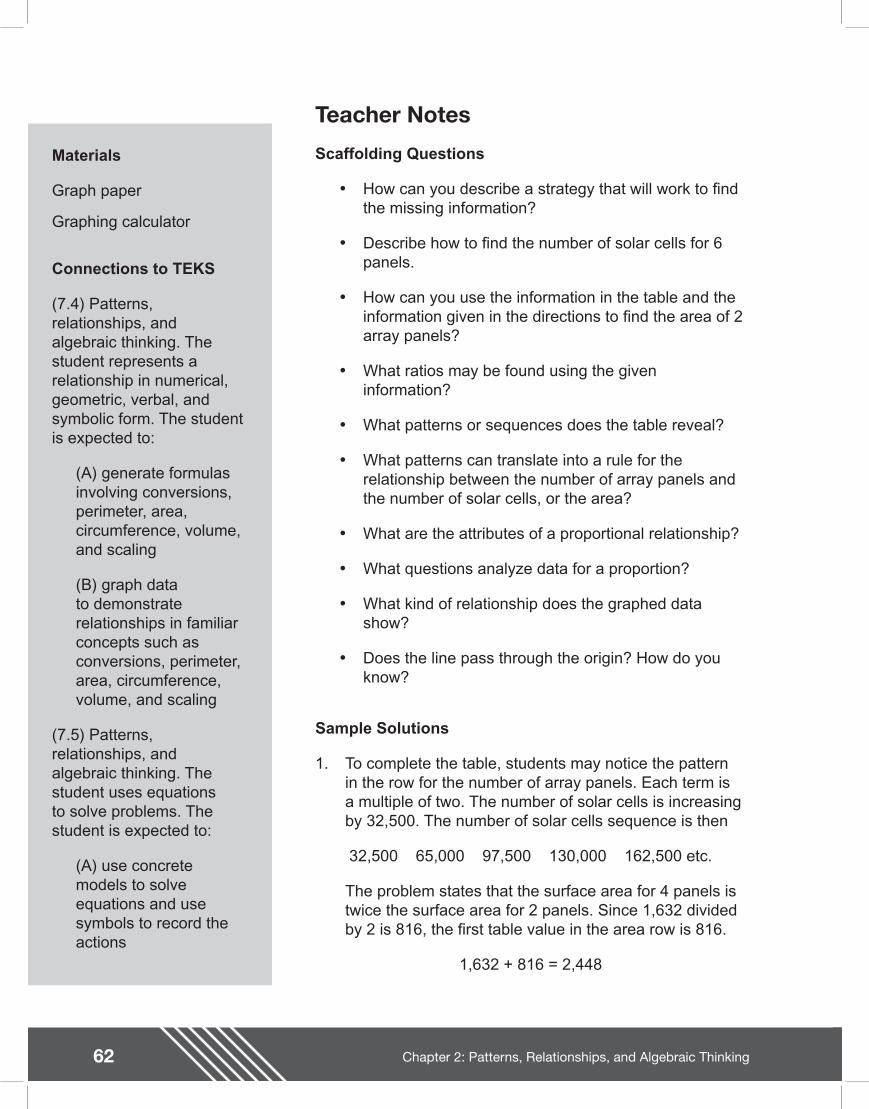
62
Teacher Notes
Chapter 2: Patterns, Relationships, and Algebraic Thinking
Materials
Graph paper
Graphing calculator
Connections to TEKS
(7.4) Patterns, relationships, and algebraic thinking. The student represents a relationship in numerical, geometric, verbal, and symbolic form. The student is expected to:
(A) generate formulas involving conversions, perimeter, area, circumference, volume, and scaling
(B) graph data to demonstrate relationships in familiar concepts such as conversions, perimeter, area, circumference, volume, and scaling
(7.5) Patterns, relationships, and algebraic thinking. The student uses equations to solve problems. The student is expected to:
(A) use concrete models to solve equations and use symbols to record the actions
Scaffolding Questions
�• How can you describe a strategy that will work to nd the missing information?
�• Describe how to nd the number of solar cells for 6 panels.
�• How can you use the information in the table and the information given in the directions to nd the area of 2 array panels?
�• What ratios may be found using the given information?
�• What patterns or sequences does the table reveal?
�• What patterns can translate into a rule for the relationship between the number of array panels and the number of solar cells, or the area?
�• What are the attributes of a proportional relationship?
�• What questions analyze data for a proportion?
�• What kind of relationship does the graphed data show?
�• Does the line pass through the origin? How do you know?
Sample Solutions
1. To complete the table, students may notice the pattern in the row for the number of array panels. Each term is a multiple of two. The number of solar cells is increasing by 32,500. The number of solar cells sequence is then
32,500 65,000 97,500 130,000 162,500 etc.
The problem states that the surface area for 4 panels is twice the surface area for 2 panels. Since 1,632 divided by 2 is 816, the rst table value in the area row is 816.
1,632 + 816 = 2,448
63Chapter 2: Patterns, Relationships, and Algebraic Thinking
Connections to TAKS
Objective 2: The student will demonstrate an understanding of patterns, relationships, and algebraic reasoning.
Each new value is 816 more than the previous value.
816 1,632 2,448 3,264 4,080 etc.
Another approach may be to set up a ratio between the area and the number of array panels.
With the ratio in lowest terms, the student can nd the other areas by multiplying the area, 408 m2, by the number of array panels.
Find the ratio between array panels and solar cells:
With the ratio in lowest terms, the student can nd the other amounts of solar cells by multiplying the solar cells,16,250, by the number of array panels.
Photovoltaic modules
1632 m 4 panels
= 408 m1 panel
2 2
4 1 array panels65,000 solar cells
array panel16,250 solar cells
=
# of arraypanelsSolarcells
Area inm2
2 4 6 8 10 12 14
32,500 65,000 97,500 130,000 162,500 195,000 227,500
816 1632 2448 3264 4080 4896 5712
2. Students may conjecture that the number of solar cells increases as the number of panels increases. The number of solar cells increases at the constant rate of 32,500 for every 2 panels, or 16,250 cells per 1 panel. If the relationship is proportional, the number of panels will increase by the constant rate. For example, if the number of panels doubles, then the number of solar cells doubles. The scatterplot of the data lies on a straight line through the origin. When a proportional relationship is graphed, the line goes through the origin.
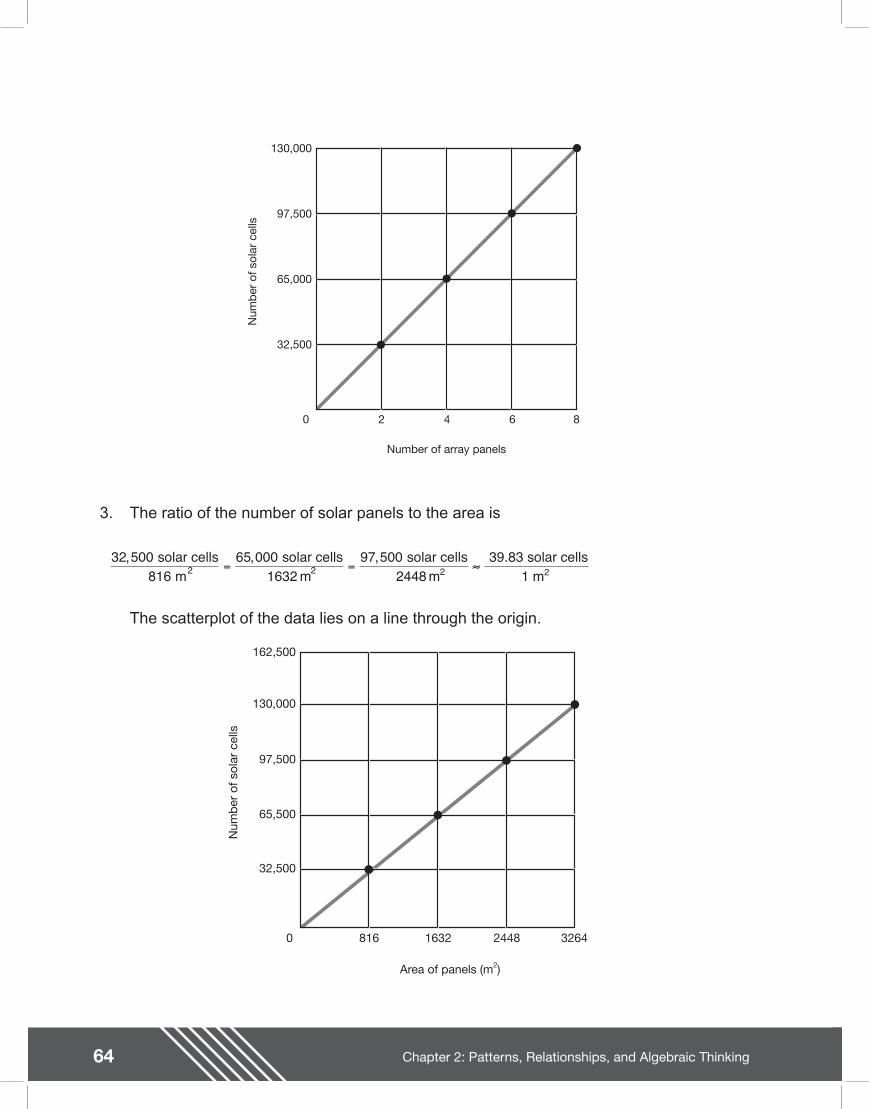
64 Chapter 2: Patterns, Relationships, and Algebraic Thinking
3. The ratio of the number of solar panels to the area is
The scatterplot of the data lies on a line through the origin.
32,500
65,000
97,500
130,000
2 4 6 80
Number of array panels
Num
ber
of s
olar
cel
ls
32,500
65,500
97,500
130,000
162,500
816 1632 2448 32640
Area of panels (m2)
Num
ber
of s
olar
cel
ls
32 500816
65 0001632
97 5002448
, , , solar cells m
solar cells m
solar cells m
39.83 solar cells1 m22 2 2= =

65Chapter 2: Patterns, Relationships, and Algebraic Thinking
14
14
14
14
Extension Questions
�• The NASA engineers design a new solar array panel. The photovoltaic modules now have the total surface area they had before and the number of solar cells, but they still collect the same amount of power. Complete a new table showing the numbers of solar cells and area in m2.
The original surface area for 2 panels was 816 m2 and had 32,500 solar cells, so 1 panel would have an area of 408 m2 for every 16,250 solar cells. If the new panel uses only the area and the solar cells, then the new panel would have an area of 102 m2 and have 4,062.5 solar cells.
Resources used in this section
NASA Human Spacefl ight, spacefl ight.nasa.gov

66 Chapter 2: Patterns, Relationships, and Algebraic Thinking
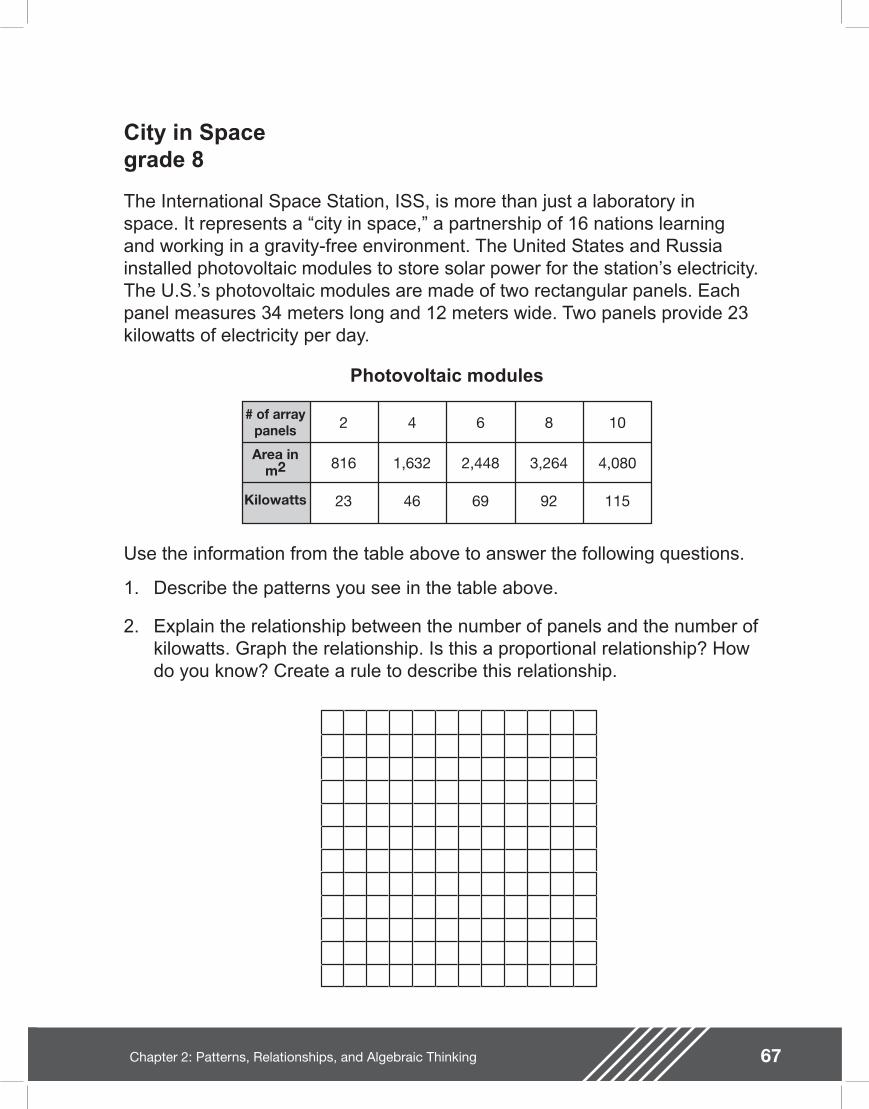
67Chapter 2: Patterns, Relationships, and Algebraic Thinking
City in Spacegrade 8
The International Space Station, ISS, is more than just a laboratory in space. It represents a �“city in space,�” a partnership of 16 nations learning and working in a gravity-free environment. The United States and Russia installed photovoltaic modules to store solar power for the station�’s electricity. The U.S.�’s photovoltaic modules are made of two rectangular panels. Each panel measures 34 meters long and 12 meters wide. Two panels provide 23 kilowatts of electricity per day.
Photovoltaic modules
# of arraypanels
Kilowatts
Area inm2
2 4 6 8 10
816 1,632 2,448 3,264 4,080
23 46 69 92 115
Use the information from the table above to answer the following questions.
1. Describe the patterns you see in the table above.
2. Explain the relationship between the number of panels and the number of kilowatts. Graph the relationship. Is this a proportional relationship? How do you know? Create a rule to describe this relationship.
68 Chapter 2: Patterns, Relationships, and Algebraic Thinking
3. Predict the number of kilowatts if there had been 16 array panels.
4. Show how to determine the number of array panels if there are 276 kilowatts being produced.
5. Describe the relationship between the area and the number of kilowatts. Write a rule that describes the relationship. Create a graph of the relationship. How can you tell from the rule and the graph whether this is a proportional relationship?
6. Due to a workload increase, the ISS engineers need to increase the electrical power by 50%. If the ISS has 8 panels now, how much solar power in kilowatts is needed to meet the workload increase?

69Chapter 2: Patterns, Relationships, and Algebraic Thinking
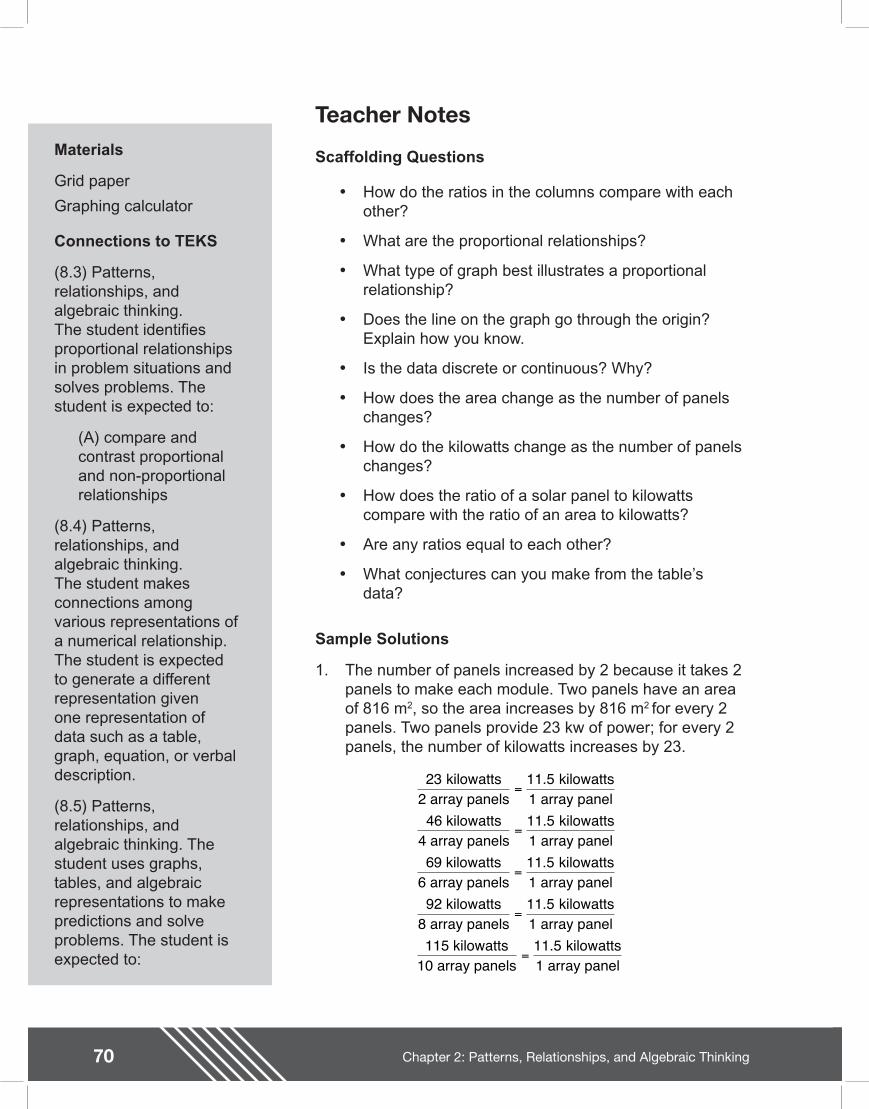
70
Teacher Notes
Chapter 2: Patterns, Relationships, and Algebraic Thinking
Materials
Grid paper
Graphing calculator
Connections to TEKS
(8.3) Patterns, relationships, and algebraic thinking. The student identi es proportional relationships in problem situations and solves problems. The student is expected to:
(A) compare and contrast proportional and non-proportional relationships
(8.4) Patterns, relationships, and algebraic thinking. The student makes connections among various representations of a numerical relationship. The student is expected to generate a different representation given one representation of data such as a table, graph, equation, or verbal description.
(8.5) Patterns, relationships, and algebraic thinking. The student uses graphs, tables, and algebraic representations to make predictions and solve problems. The student is expected to:
Scaffolding Questions
�• How do the ratios in the columns compare with each other?
�• What are the proportional relationships?
�• What type of graph best illustrates a proportional relationship?
�• Does the line on the graph go through the origin? Explain how you know.
�• Is the data discrete or continuous? Why?
�• How does the area change as the number of panels changes?
�• How do the kilowatts change as the number of panels changes?
�• How does the ratio of a solar panel to kilowatts compare with the ratio of an area to kilowatts?
�• Are any ratios equal to each other?
�• What conjectures can you make from the table�’s data?
Sample Solutions
1. The number of panels increased by 2 because it takes 2 panels to make each module. Two panels have an area of 816 m2, so the area increases by 816 m2 for every 2 panels. Two panels provide 23 kw of power; for every 2 panels, the number of kilowatts increases by 23.
23 11 5
4 11 5
6 11 5
9 11 5
1 11 5
kilowatts2 array panels
kilowatts1 array panel
6 kilowatts4 array panels
kilowatts1 array panel
9 kilowatts6 array panels
kilowatts1 array panel
2 kilowatts8 array panels
kilowatts1 array panel
15 kilowatts10 array panels
kilowatts1 array panel
=
=
=
=
=
.
.
.
.
.
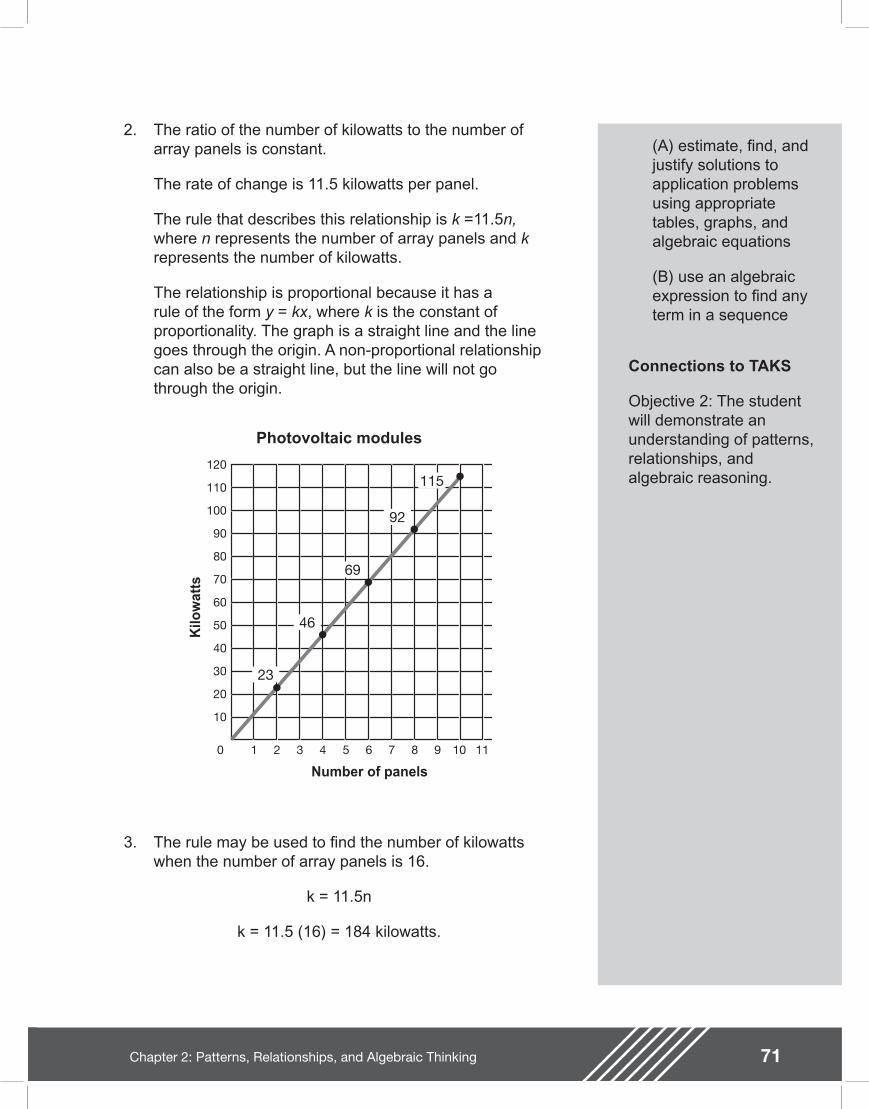
71Chapter 2: Patterns, Relationships, and Algebraic Thinking
(A) estimate, nd, and justify solutions to application problems using appropriate tables, graphs, and algebraic equations
(B) use an algebraic expression to nd any term in a sequence
Connections to TAKS
Objective 2: The student will demonstrate an understanding of patterns, relationships, and algebraic reasoning.
2. The ratio of the number of kilowatts to the number of array panels is constant.
The rate of change is 11.5 kilowatts per panel.
The rule that describes this relationship is k =11.5n, where n represents the number of array panels and k represents the number of kilowatts.
The relationship is proportional because it has a rule of the form y = kx, where k is the constant of proportionality. The graph is a straight line and the line goes through the origin. A non-proportional relationship can also be a straight line, but the line will not go through the origin.
30
10
20
60
40
50
90
70
80
120
100
110
31 2 64 5 97 8 10 110
23
46
69
92
115
Kilo
wat
ts
Number of panels
Photovoltaic modules
3. The rule may be used to nd the number of kilowatts when the number of array panels is 16.
k = 11.5n
k = 11.5 (16) = 184 kilowatts.
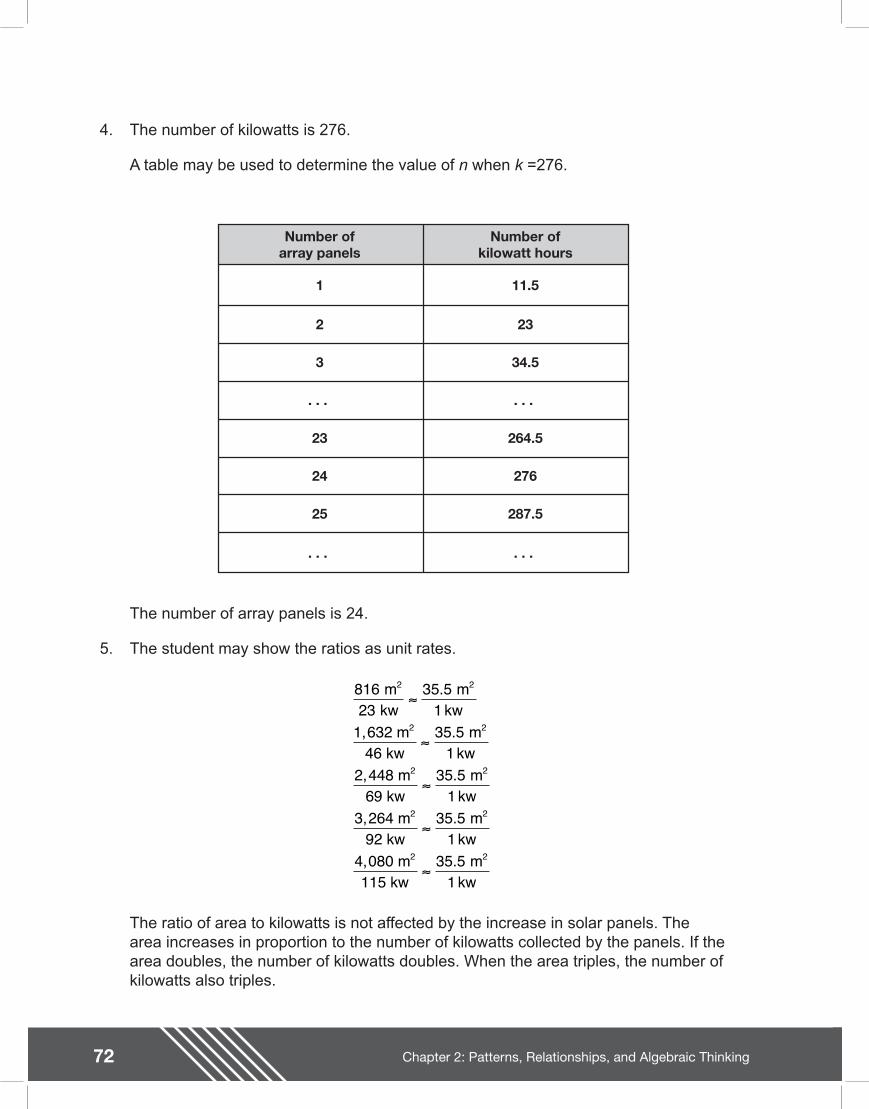
72 Chapter 2: Patterns, Relationships, and Algebraic Thinking
4. The number of kilowatts is 276.
A table may be used to determine the value of n when k =276.
Number ofarray panels
Number ofkilowatt hours
1 11.5
2 23
3 34.5
. . . . . .
23 264.5
24 276
25 287.5
. . . . . .
The number of array panels is 24.
5. The student may show the ratios as unit rates.
The ratio of area to kilowatts is not affected by the increase in solar panels. The area increases in proportion to the number of kilowatts collected by the panels. If the area doubles, the number of kilowatts doubles. When the area triples, the number of kilowatts also triples.
81623
35 5135 5
135 5
135 5
135 5
1
m kw
m kw
1,632 m46 kw
m kw
2,448 m69 kw
m kw
3,264 m92 kw
m kw
4,080 m115 kw
m kw
2 2
2 2
2 2
2 2
2 2
.
.
.
.
.
73Chapter 2: Patterns, Relationships, and Algebraic Thinking
6. To increase by 50% means that the amount is 100% plus 50%. Multiply by 150% or 1.5.
There would be 12 panels for 138 kilowatts.
Extension Questions
�• Every 45 minutes the modules store energy from the daylight side of their orbit and again from the dark side of their orbit. How many power storage cycles take place in one day?
Every 45 minutes a cycle takes place can be written as
14
cycle5 minutes
Since there are 60 minutes in 1 hour and 24 hours in 1 day, rates may be multiplied to convert to cycles per day.
Resources used in this section
NASA Human Space ight, space ight.nasa.gov
92 92 1 kilowatts8 array panels
kilowatts x 1.58 array panels x 1.5
38 kilowatts12 array panels
= =
14
61
cycle5 minutes
x 0 minutes1 hour
x 24 hours day
32 cycles1 day
=

74 Chapter 2: Patterns, Relationships, and Algebraic Thinking
75Chapter 2: Patterns, Relationships, and Algebraic Thinking
Community Clean-Upgrade 6
The state has an all-volunteer beach cleanup program to clean beaches and educate citizens about the problem of beach trash. Volunteers pick up trash along the coast twice a year. In the last 14 years, 273,000 volunteers have removed 450,000 kilograms of trash from the state�’s beaches. As a service project, the math club members decide to educate and recruit students for this year�’s beach clean-up.
1. Create and label several ratios to study relationships among the beach cleanup facts. Discuss your ndings.
2. If a volunteer picks up the same ratio of trash every year, how much total trash will he or she pick up in ten years?
3. Determine the total trash to be removed this year if there are 50 volunteers. Predict the total trash in kilograms to be collected in the next ve years and in the next 15 years. Graph the results.
4. If the 50 volunteers picked up double the amount of trash for the 15-year period, how much trash would be picked up? Graph this situation and compare to the graph in problem 3.
5. How could the math club use any of this information to recruit student volunteers for this year�’s beach clean-up?
76
Teacher Notes
Chapter 2: Patterns, Relationships, and Algebraic Thinking
Materials
Calculator
Poster board
Chart paper or construction paper
Markers or crayons
Connections to TEKS
(6.3) Patterns, relationships, and algebraic thinking. The student solves problems involving proportional relationships. The student is expected to:
(A) use ratios to describe proportional situations
(C) use ratios to make predictions in proportional situations
Scaffolding Questions
�• What determines how you set up a ratio?
�• Must it be in lowest terms?
�• What is the relationship of volunteers to years?
�• How do metric tons of trash compare with years?
�• What is the ratio of the amount of trash picked up per volunteer?
�• Are the relationships proportional? Why or why not?
�• What steps can you take to predict trash pick-up in other years?
�• How will a chart or graph help?
Sample Solutions
1. Ratios may vary.
The ratio of volunteers to years shows that 19,500 volunteers are needed each year to pick up trash if the amount of trash stays the same each year.
The ratio of trash pick-up to years shows that 32,143 kg of trash is the average amount of trash picked up in one year.
The ratio of amount of trash picked up in a year to volunteers shows that each volunteer picked up approximately 1.65 kg of trash a year.
273 000 1414
19 5001
, , volunteers years 14
volunteers year
÷÷
=
3 19 50019 500 19 500
1 651
2,143 kg of trash volunteers
kg of trash volunteer
÷÷
,, ,
.
450 000 1414
32 1431
, kg years 14
kg year
÷÷
,
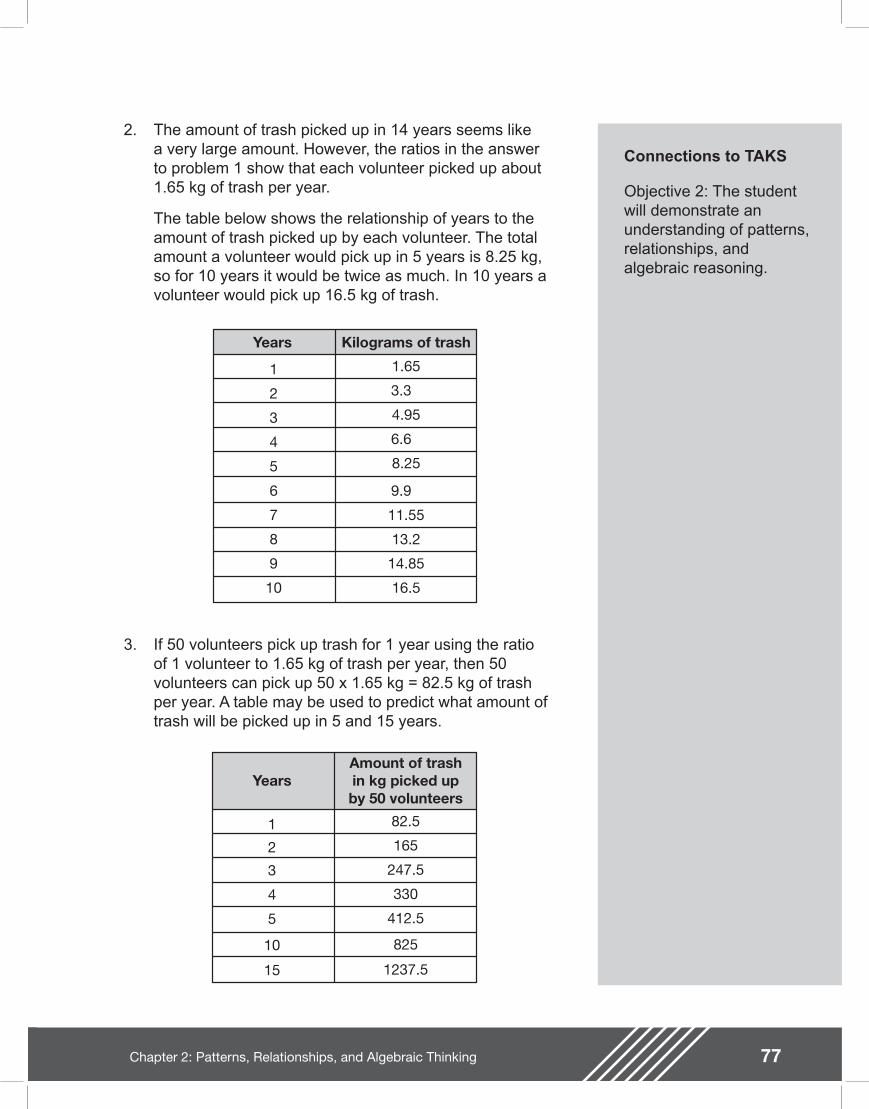
77Chapter 2: Patterns, Relationships, and Algebraic Thinking
Connections to TAKS
Objective 2: The student will demonstrate an understanding of patterns, relationships, and algebraic reasoning.
2. The amount of trash picked up in 14 years seems like a very large amount. However, the ratios in the answer to problem 1 show that each volunteer picked up about 1.65 kg of trash per year.
The table below shows the relationship of years to the amount of trash picked up by each volunteer. The total amount a volunteer would pick up in 5 years is 8.25 kg, so for 10 years it would be twice as much. In 10 years a volunteer would pick up 16.5 kg of trash.
Years Kilograms of trash
1 1.65
2 3.3
3 4.95
4 6.6
5
6
7
8
9
10
8.25
9.9
11.55
13.2
14.85
16.5
3. If 50 volunteers pick up trash for 1 year using the ratio of 1 volunteer to 1.65 kg of trash per year, then 50 volunteers can pick up 50 x 1.65 kg = 82.5 kg of trash per year. A table may be used to predict what amount of trash will be picked up in 5 and 15 years.
YearsAmount of trashin kg picked upby 50 volunteers
1 82.5
2 165
3 247.5
4 330
5 412.5
10 825
15 1237.5
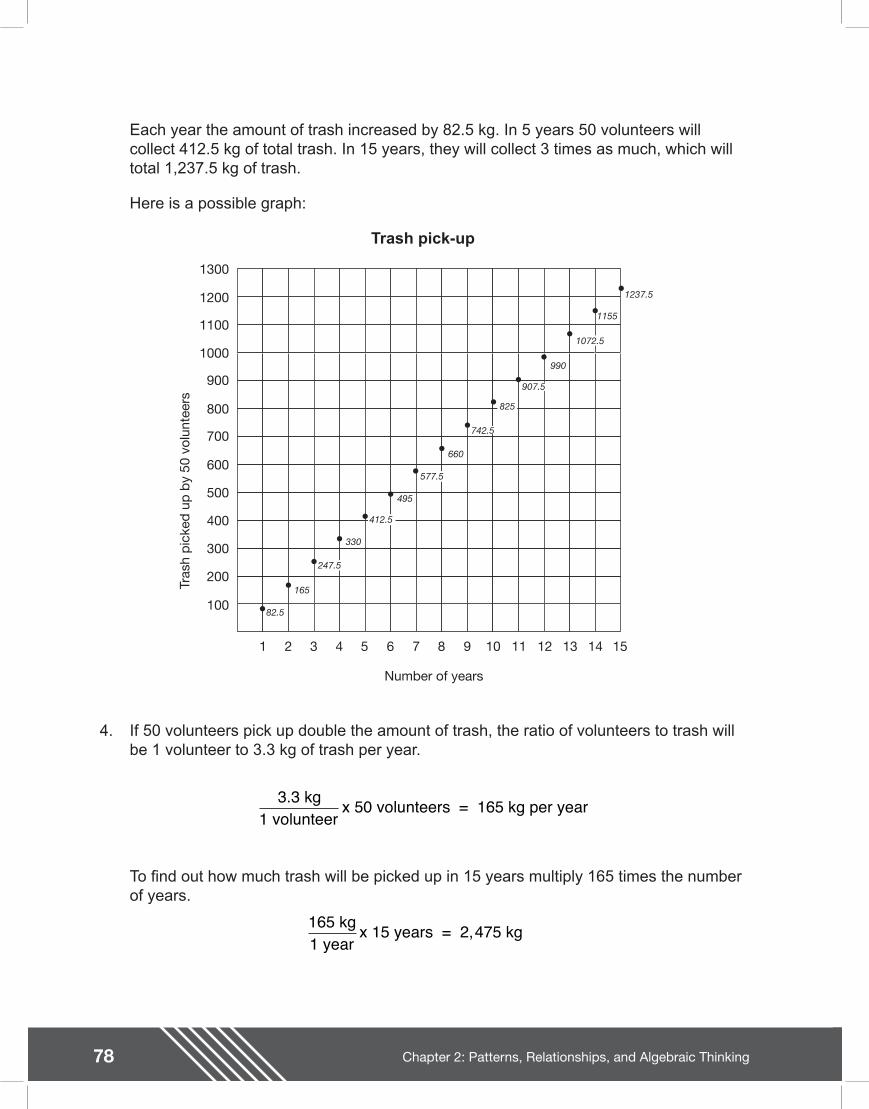
78 Chapter 2: Patterns, Relationships, and Algebraic Thinking
Each year the amount of trash increased by 82.5 kg. In 5 years 50 volunteers will collect 412.5 kg of total trash. In 15 years, they will collect 3 times as much, which will total 1,237.5 kg of trash.
Here is a possible graph:
Trash pick-up
1
100
200
300
400
500
600
700
800
900
1000
1100
1200
1300
2 3 4 5 6 7 8 9 10 11 12 13 14 15
Number of years
Tras
h p
icke
d u
p b
y 50
vol
unte
ers
82.5
165
247.5
330
412.5
495
577.5
660
742.5
825
907.5
990
1072.5
1155
1237.5
4. If 50 volunteers pick up double the amount of trash, the ratio of volunteers to trash will be 1 volunteer to 3.3 kg of trash per year.
To nd out how much trash will be picked up in 15 years multiply 165 times the number of years.
3.3 kg1 volunteer
x 50 volunteers = 165 kg per year
165 kg1 year
x 15 years = 2,475 kg
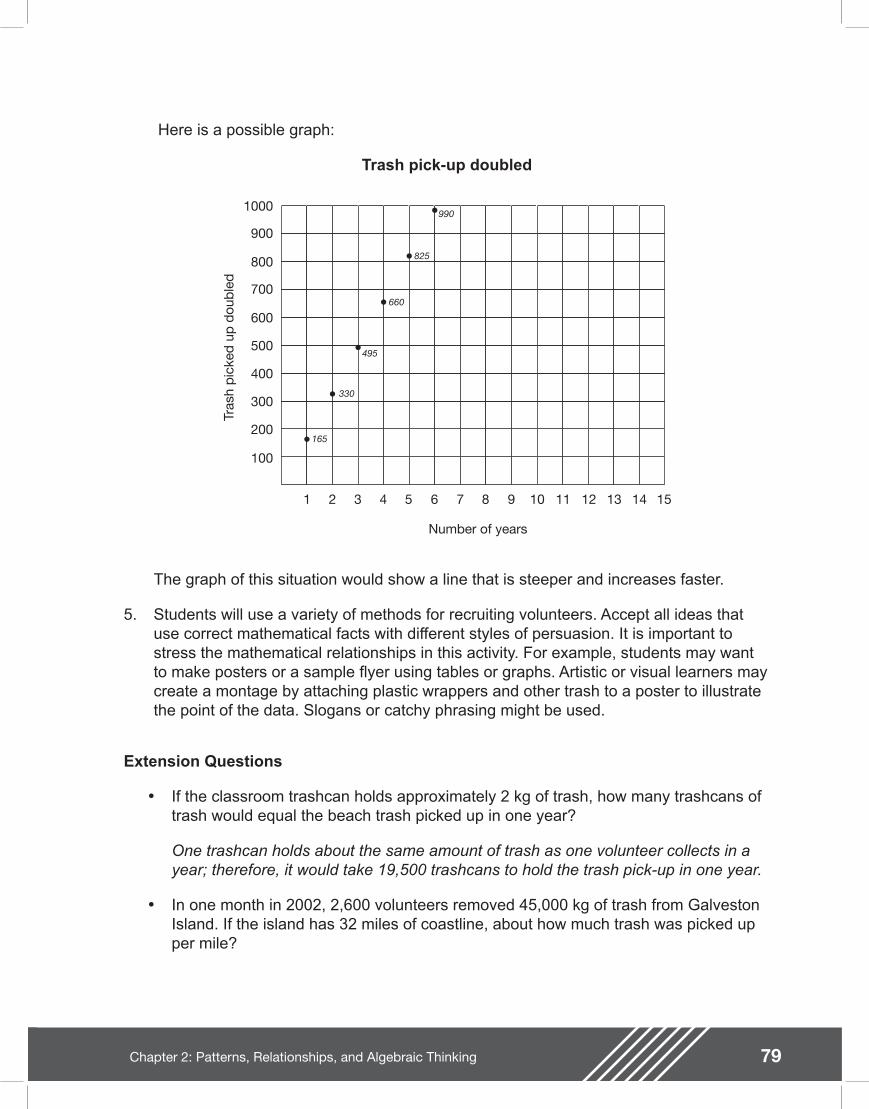
79Chapter 2: Patterns, Relationships, and Algebraic Thinking
Here is a possible graph:
Trash pick-up doubled
1
100
200
300
400
500
600
700
800
900
1000
2 3 4 5 6 7 8 9 10 11 12 13 14 15
Number of years
Tras
h p
icke
d u
p d
oub
led
165
330
495
660
825
990
The graph of this situation would show a line that is steeper and increases faster.
5. Students will use a variety of methods for recruiting volunteers. Accept all ideas that use correct mathematical facts with different styles of persuasion. It is important to stress the mathematical relationships in this activity. For example, students may want to make posters or a sample yer using tables or graphs. Artistic or visual learners may create a montage by attaching plastic wrappers and other trash to a poster to illustrate the point of the data. Slogans or catchy phrasing might be used.
Extension Questions
�• If the classroom trashcan holds approximately 2 kg of trash, how many trashcans of trash would equal the beach trash picked up in one year?
One trashcan holds about the same amount of trash as one volunteer collects in a year; therefore, it would take 19,500 trashcans to hold the trash pick-up in one year.
�• In one month in 2002, 2,600 volunteers removed 45,000 kg of trash from Galveston Island. If the island has 32 miles of coastline, about how much trash was picked up per mile?

80 Chapter 2: Patterns, Relationships, and Algebraic Thinking
About 1,406 kg of trash per mile was picked up.
Resources used in this section
Texas Adopt-A-Beach Program, www.glo.state.tx.us.
International Coastal Cleanup, www.coastalcleanup.org/top10.cfm
Texas Natural Resource Conservation Commission, www.tnrcc.state.tx.us
45,000 kg 32 miles
1,406 kg1 mile
÷÷
3232
81Chapter 2: Patterns, Relationships, and Algebraic Thinking
Student Work Sample
This student�’s work shows the use of various forms of one to simplify the ratios.
The work exemplifi es many of the criteria on the solution guide, especially the following:
�• Describes mathematical relationships
�• Recognizes and applies proportional relationships
�• Solves problems involving proportional relationships using solution method(s) including equivalent ratios, scale factors, and equations
�• Evaluates the reasonableness or signi cance of the solution in the context of the problem
�• Uses multiple representations (such as concrete models, tables, graphs, symbols, and verbal descriptions) and makes connections among them
�• States a clear and accurate solution using correct units
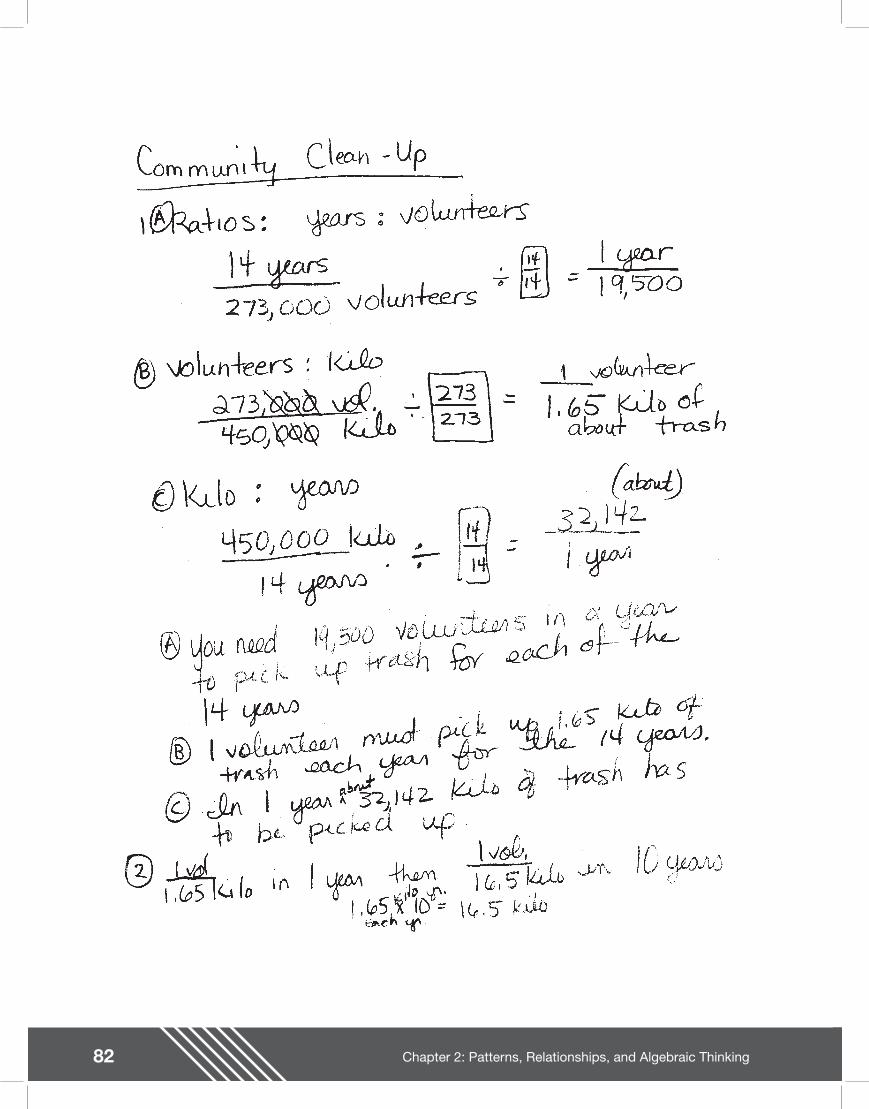
82 Chapter 2: Patterns, Relationships, and Algebraic Thinking
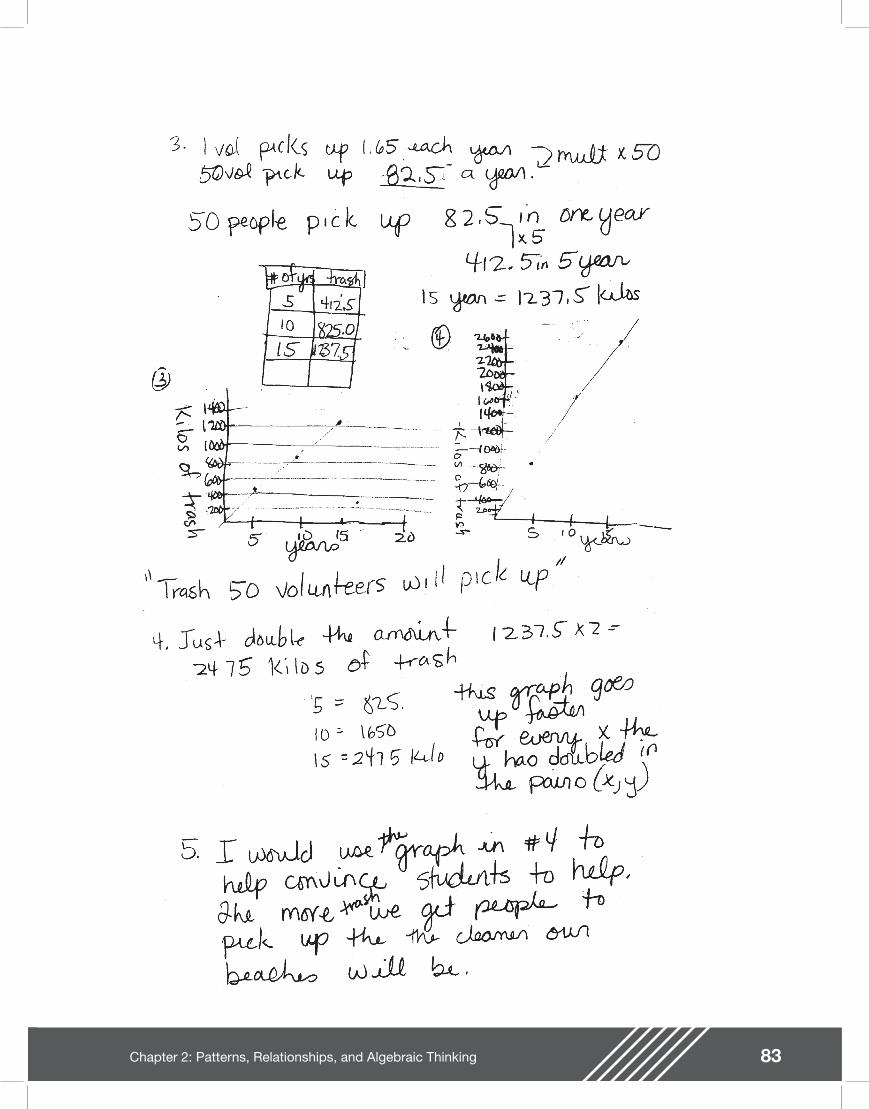
83Chapter 2: Patterns, Relationships, and Algebraic Thinking

84 Chapter 2: Patterns, Relationships, and Algebraic Thinking
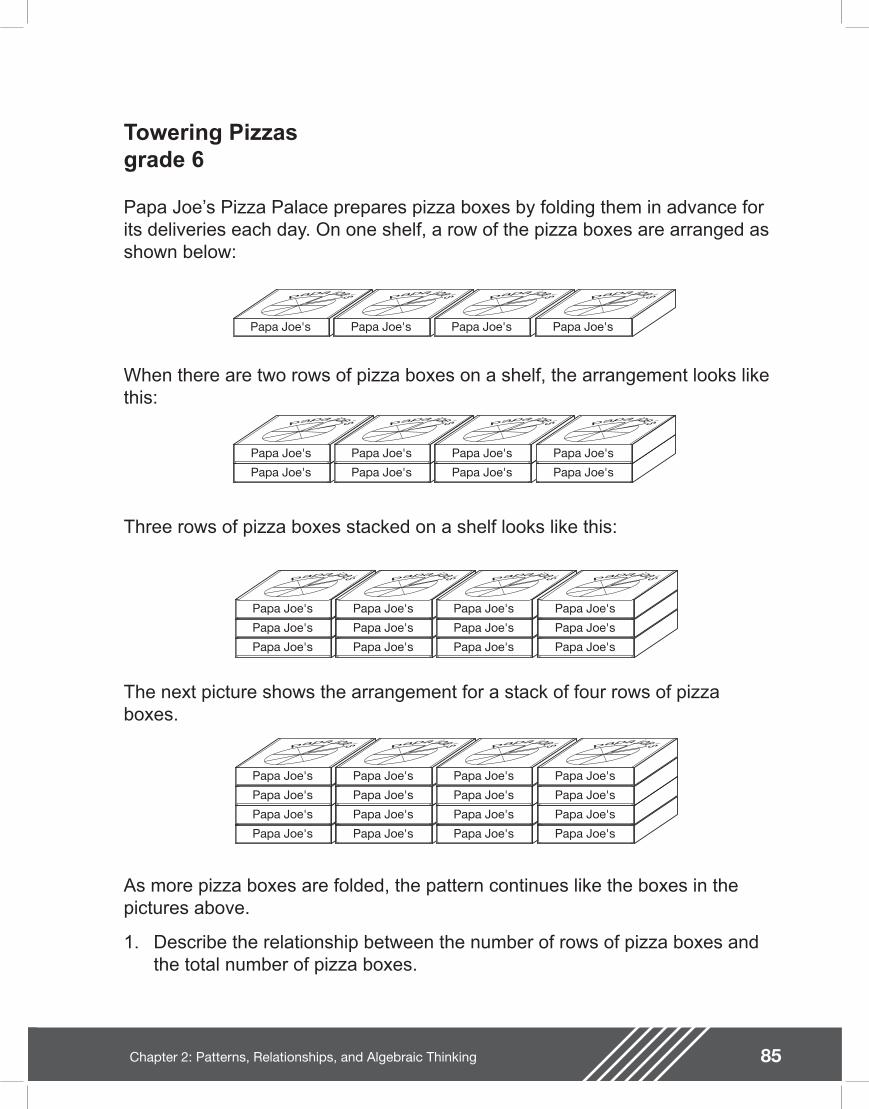
85Chapter 2: Patterns, Relationships, and Algebraic Thinking
Towering Pizzas grade 6
Papa Joe�’s Pizza Palace prepares pizza boxes by folding them in advance for its deliveries each day. On one shelf, a row of the pizza boxes are arranged as shown below:
When there are two rows of pizza boxes on a shelf, the arrangement looks like this:
Three rows of pizza boxes stacked on a shelf looks like this:
\
The next picture shows the arrangement for a stack of four rows of pizza boxes.
As more pizza boxes are folded, the pattern continues like the boxes in the pictures above.
1. Describe the relationship between the number of rows of pizza boxes and the total number of pizza boxes.
Papa Joe's
papa joe's
Papa Joe's
papa joe's
Papa Joe's
papa joe'sPapa Joe's
papa joe's
Papa Joe's
papa joe's
Papa Joe's
papa joe's
Papa Joe's
papa joe's
Papa Joe's
papa joe's
Papa Joe's
papa joe's
Papa Joe's
papa joe's
Papa Joe's
papa joe's
Papa Joe's
papa joe's
Papa Joe's
papa joe's
Papa Joe's
papa joe's
Papa Joe's
papa joe's
Papa Joe's
papa joe's
Papa Joe's
papa joe's
Papa Joe's
papa joe's
Papa Joe's
papa joe's
Papa Joe's
papa joe's
Papa Joe's
papa joe's
Papa Joe's
papa joe's
Papa Joe's
papa joe's
Papa Joe's
papa joe's
Papa Joe's
papa joe's
Papa Joe's
papa joe's
Papa Joe's
papa joe's
Papa Joe's
papa joe's
Papa Joe's
papa joe's
Papa Joe's
papa joe's
Papa Joe's
papa joe's
Papa Joe's
papa joe's
Papa Joe's
papa joe's
Papa Joe's
papa joe's
Papa Joe's
papa joe's
Papa Joe's
papa joe's
Papa Joe's
papa joe's
Papa Joe's
papa joe's
Papa Joe's
papa joe's
Papa Joe's
papa joe's
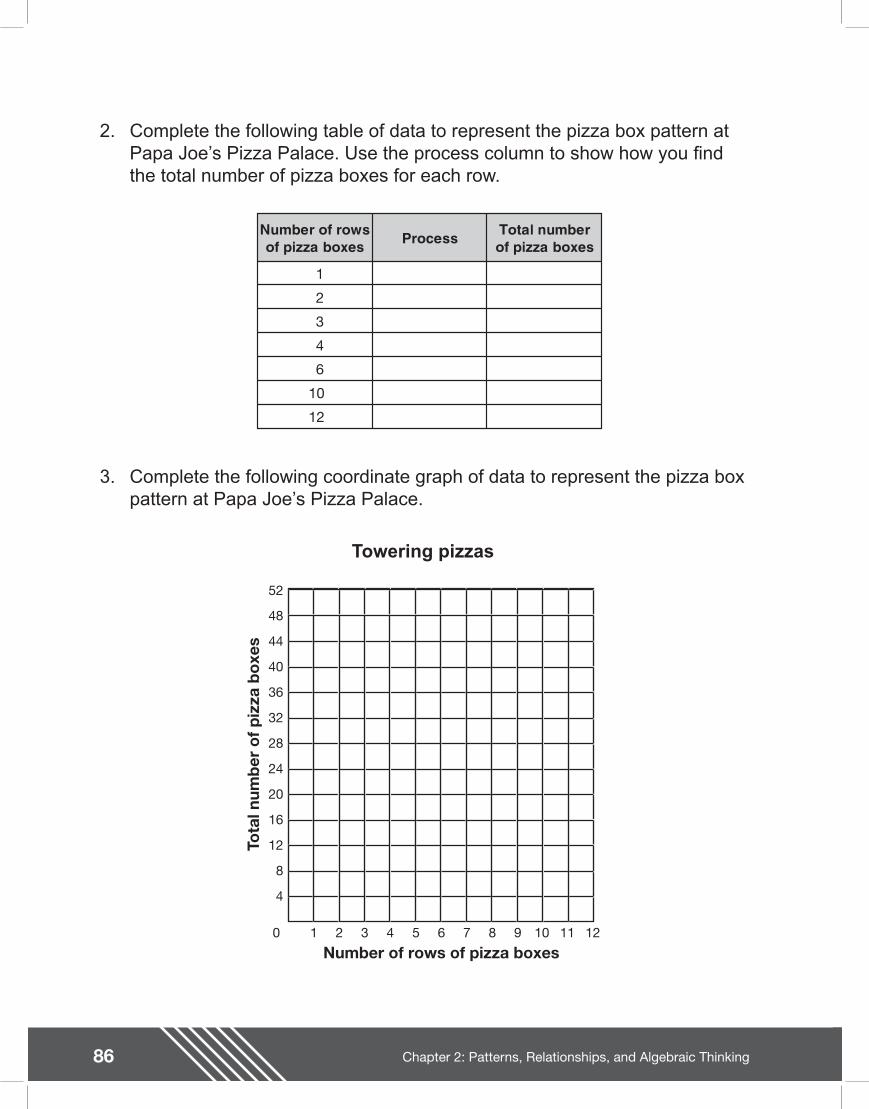
86 Chapter 2: Patterns, Relationships, and Algebraic Thinking
2. Complete the following table of data to represent the pizza box pattern at Papa Joe�’s Pizza Palace. Use the process column to show how you nd the total number of pizza boxes for each row.
Number of rowsof pizza boxes Process Total number
of pizza boxes
1
2
3
4
6
10
12
3. Complete the following coordinate graph of data to represent the pizza box pattern at Papa Joe�’s Pizza Palace.
Towering pizzas
12
4
8
24
16
20
36
28
32
48
52
40
44
31 2 64 5 97 8 1210 110
Number of rows of pizza boxes
Tota
l num
ber
of p
izza
box
es
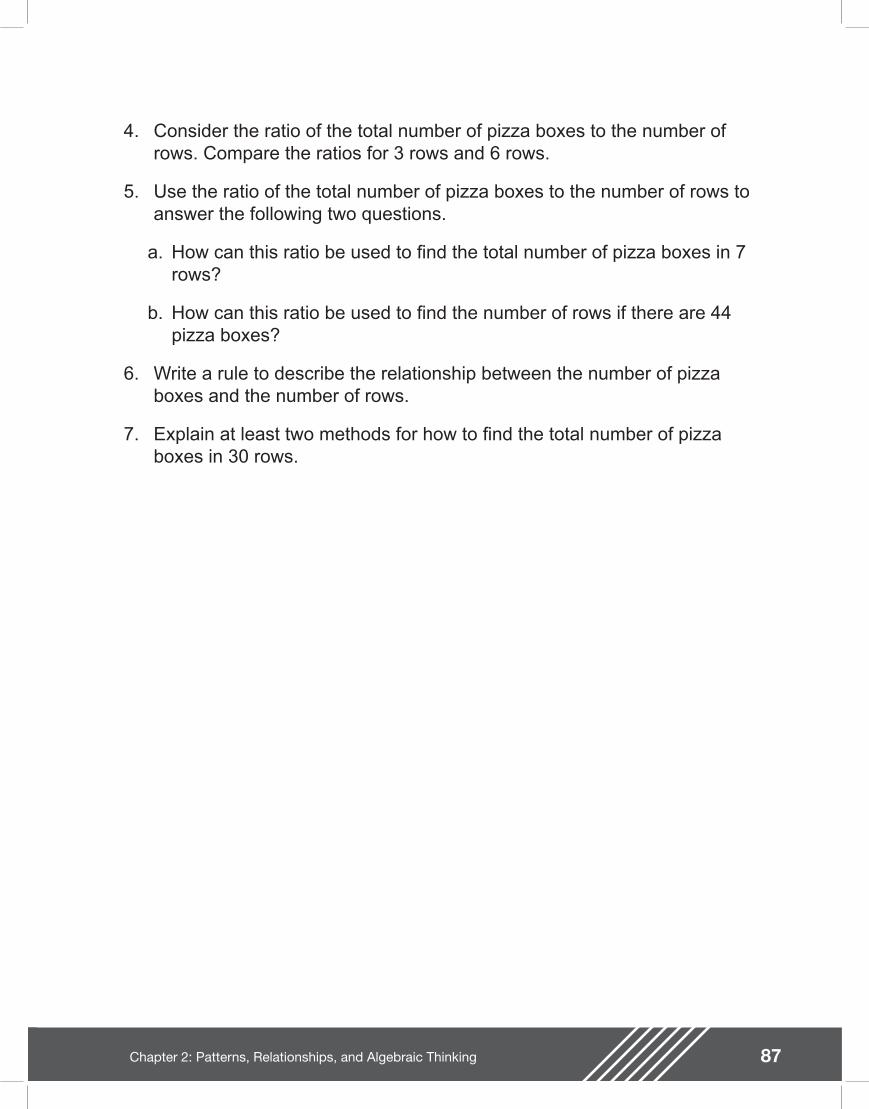
87Chapter 2: Patterns, Relationships, and Algebraic Thinking
4. Consider the ratio of the total number of pizza boxes to the number of rows. Compare the ratios for 3 rows and 6 rows.
5. Use the ratio of the total number of pizza boxes to the number of rows to answer the following two questions.
a. How can this ratio be used to nd the total number of pizza boxes in 7 rows?
b. How can this ratio be used to nd the number of rows if there are 44 pizza boxes?
6. Write a rule to describe the relationship between the number of pizza boxes and the number of rows.
7. Explain at least two methods for how to nd the total number of pizza boxes in 30 rows.
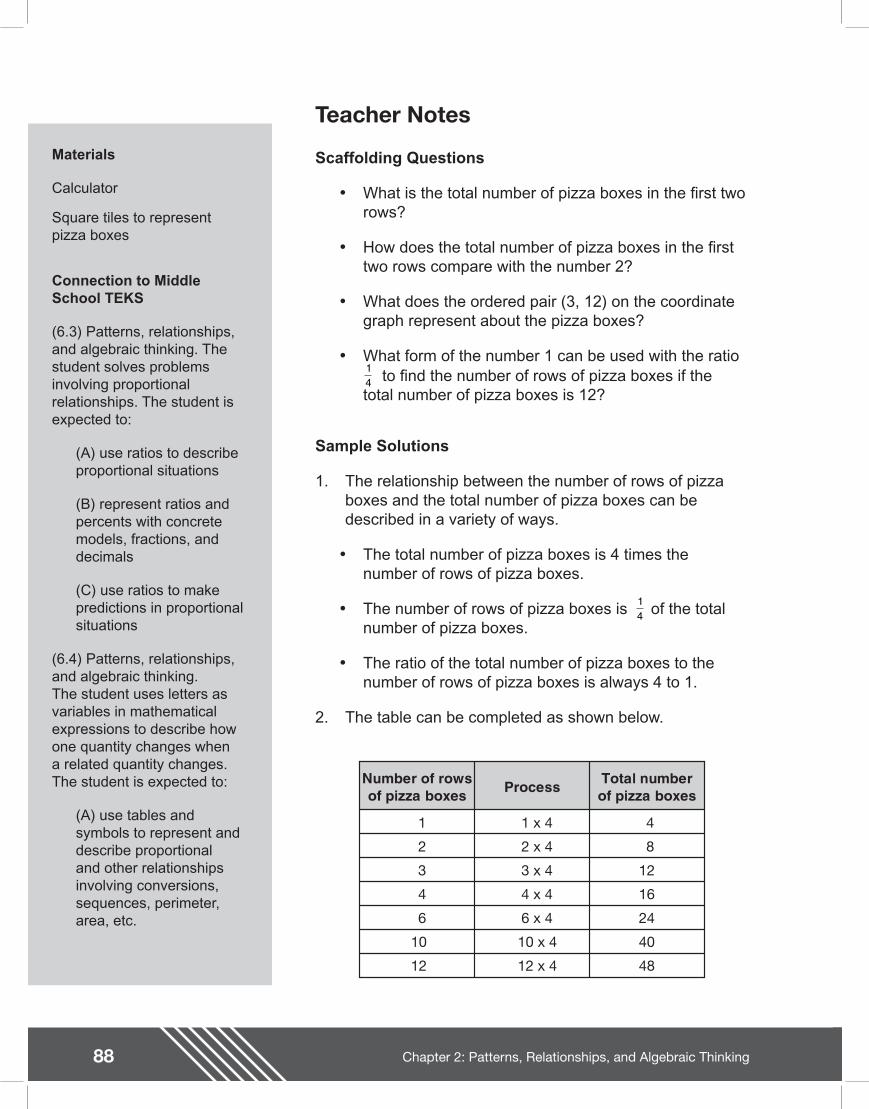
88
Teacher Notes
Chapter 2: Patterns, Relationships, and Algebraic Thinking
Materials
Calculator
Square tiles to represent pizza boxes
Connection to Middle School TEKS
(6.3) Patterns, relationships, and algebraic thinking. The student solves problems involving proportional relationships. The student is expected to:
(A) use ratios to describe proportional situations
(B) represent ratios and percents with concrete models, fractions, and decimals
(C) use ratios to make predictions in proportional situations
(6.4) Patterns, relationships, and algebraic thinking. The student uses letters as variables in mathematical expressions to describe how one quantity changes when a related quantity changes. The student is expected to:
(A) use tables and symbols to represent and describe proportional and other relationships involving conversions, sequences, perimeter, area, etc.
Scaffolding Questions
�• What is the total number of pizza boxes in the rst two rows?
�• How does the total number of pizza boxes in the rst two rows compare with the number 2?
�• What does the ordered pair (3, 12) on the coordinate graph represent about the pizza boxes?
�• What form of the number 1 can be used with the ratio to nd the number of rows of pizza boxes if the
total number of pizza boxes is 12?
Sample Solutions
1. The relationship between the number of rows of pizza boxes and the total number of pizza boxes can be described in a variety of ways.
�• The total number of pizza boxes is 4 times the number of rows of pizza boxes.
�• The number of rows of pizza boxes is of the total number of pizza boxes.
�• The ratio of the total number of pizza boxes to the number of rows of pizza boxes is always 4 to 1.
2. The table can be completed as shown below.
14
14
Number of rowsof pizza boxes Process Total number
of pizza boxes
1
2
3
4
6
10
12
1 x 4
2 x 4
3 x 4
4 x 4
6 x 4
10 x 4
12 x 4
4
8
12
16
24
40
48
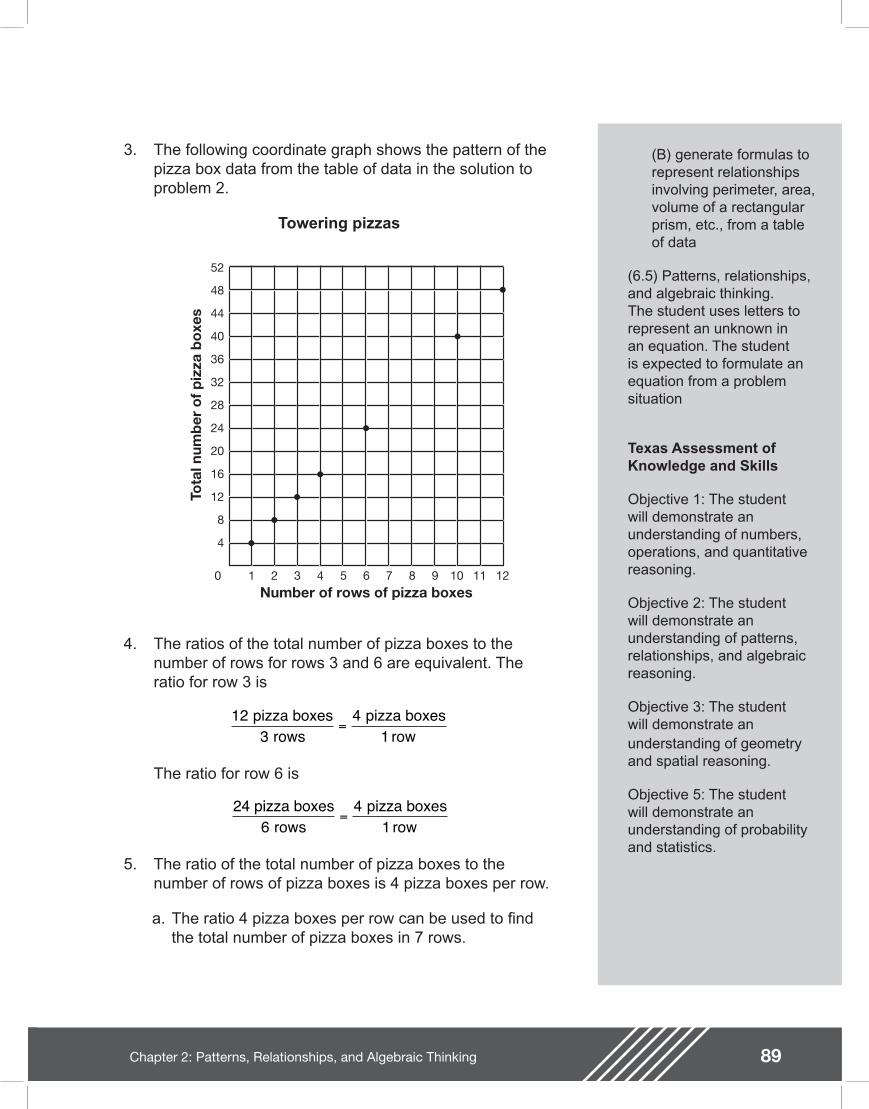
89Chapter 2: Patterns, Relationships, and Algebraic Thinking
(B) generate formulas to represent relationships involving perimeter, area, volume of a rectangular prism, etc., from a table of data
(6.5) Patterns, relationships, and algebraic thinking. The student uses letters to represent an unknown in an equation. The student is expected to formulate an equation from a problem situation
Texas Assessment of Knowledge and Skills
Objective 1: The student will demonstrate an understanding of numbers, operations, and quantitative reasoning.
Objective 2: The student will demonstrate an understanding of patterns, relationships, and algebraic reasoning.
Objective 3: The student will demonstrate an understanding of geometry and spatial reasoning.
Objective 5: The student will demonstrate an understanding of probability and statistics.
3. The following coordinate graph shows the pattern of the pizza box data from the table of data in the solution to problem 2.
Towering pizzas
12
4
8
24
16
20
36
28
32
48
52
40
44
31 2 64 5 97 8 1210 110
Number of rows of pizza boxes
Tota
l num
ber
of p
izza
box
es
4. The ratios of the total number of pizza boxes to the number of rows for rows 3 and 6 are equivalent. The ratio for row 3 is
123
41
pizza boxes rows
pizza boxes row
=
The ratio for row 6 is
26
41
4 pizza boxes rows
pizza boxes row
=
5. The ratio of the total number of pizza boxes to the number of rows of pizza boxes is 4 pizza boxes per row.
a. The ratio 4 pizza boxes per row can be used to nd the total number of pizza boxes in 7 rows.
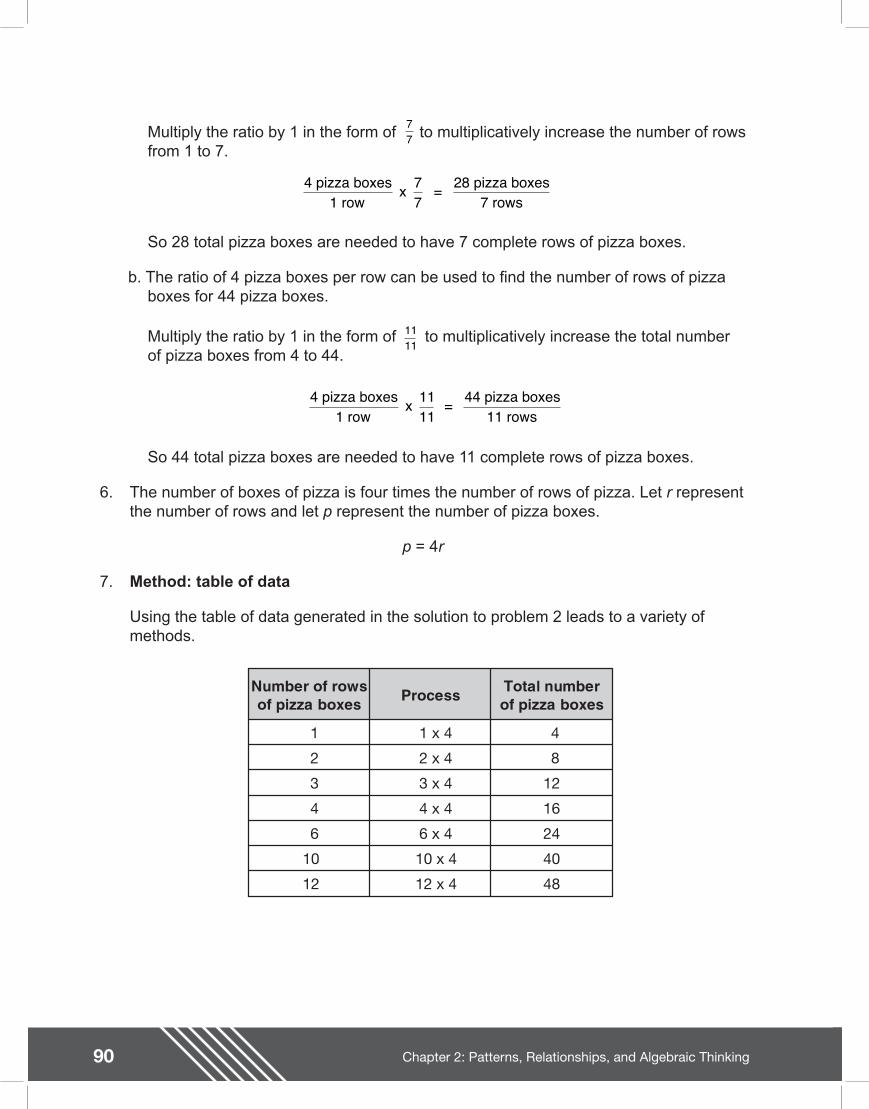
90 Chapter 2: Patterns, Relationships, and Algebraic Thinking
Multiply the ratio by 1 in the form of to multiplicatively increase the number of rows from 1 to 7.
So 28 total pizza boxes are needed to have 7 complete rows of pizza boxes.
b. The ratio of 4 pizza boxes per row can be used to nd the number of rows of pizza boxes for 44 pizza boxes.
Multiply the ratio by 1 in the form of to multiplicatively increase the total number of pizza boxes from 4 to 44.
So 44 total pizza boxes are needed to have 11 complete rows of pizza boxes.
6. The number of boxes of pizza is four times the number of rows of pizza. Let r represent the number of rows and let p represent the number of pizza boxes.
p = 4r
7. Method: table of data
Using the table of data generated in the solution to problem 2 leads to a variety of methods.
77
1111
Number of rowsof pizza boxes Process Total number
of pizza boxes
1
2
3
4
6
10
12
1 x 4
2 x 4
3 x 4
4 x 4
6 x 4
10 x 4
12 x 4
4
8
12
16
24
40
48
4 pizza boxes1 row
x 77
= 28 pizza boxes7 rows
4 pizza boxes1 row
x 1111
= 44 pizza boxes11 rows
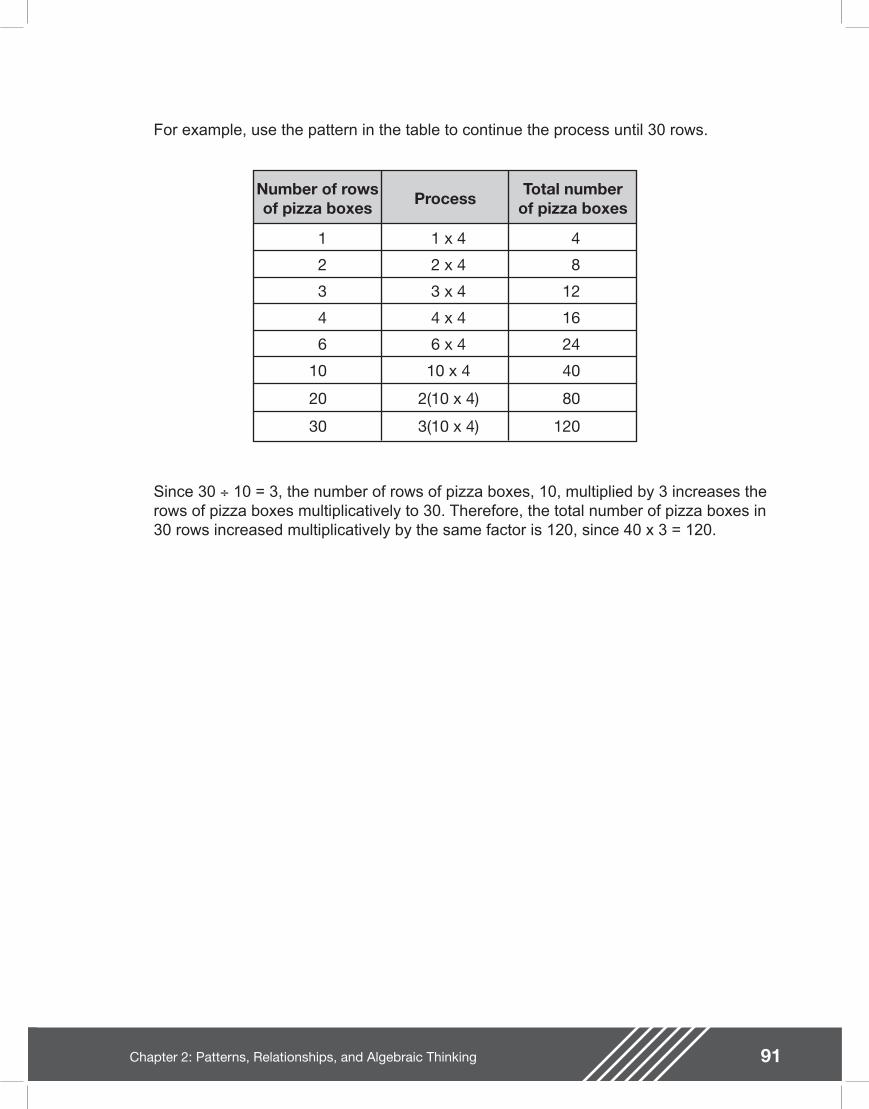
91Chapter 2: Patterns, Relationships, and Algebraic Thinking
For example, use the pattern in the table to continue the process until 30 rows.
Number of rowsof pizza boxes Process Total number
of pizza boxes
1
2
3
4
6
10
20
1 x 4
2 x 4
3 x 4
4 x 4
6 x 4
10 x 4
2(10 x 4)
4
8
12
16
24
40
80
30 3(10 x 4) 120
Since 30 ÷ 10 = 3, the number of rows of pizza boxes, 10, multiplied by 3 increases the rows of pizza boxes multiplicatively to 30. Therefore, the total number of pizza boxes in 30 rows increased multiplicatively by the same factor is 120, since 40 x 3 = 120.
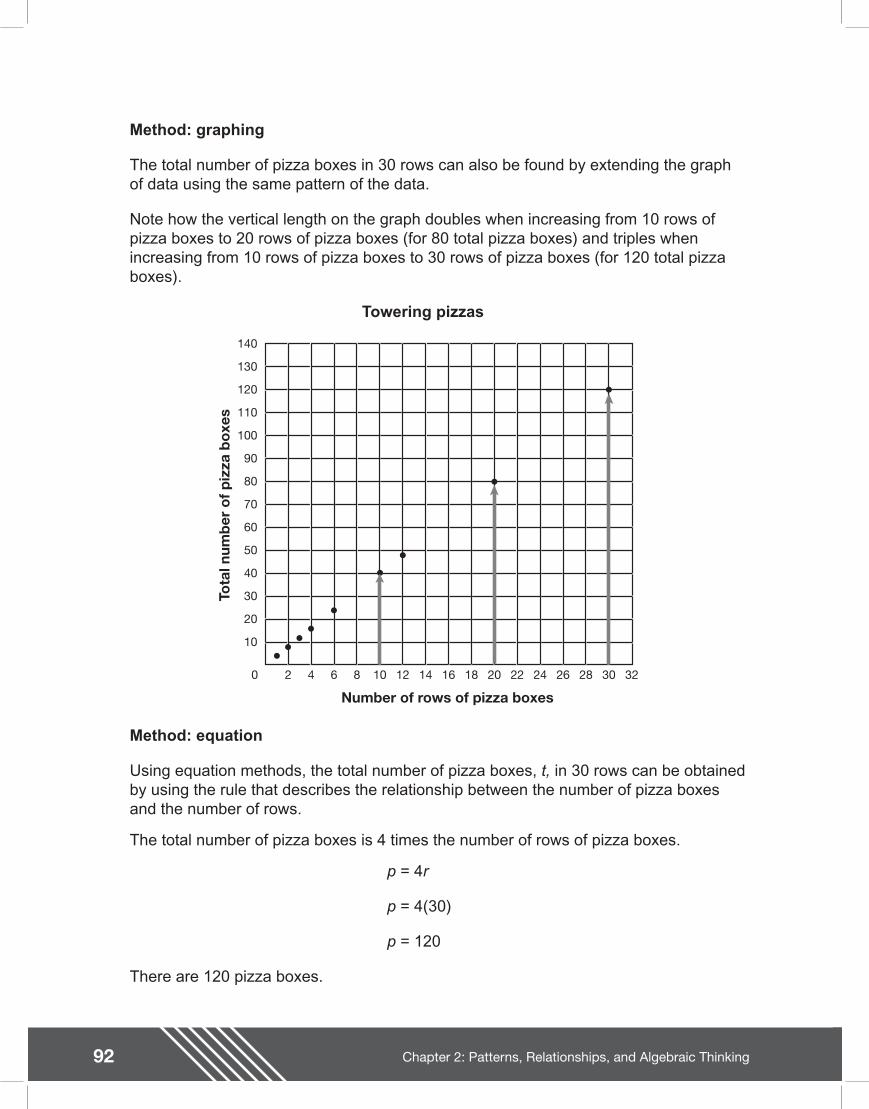
92 Chapter 2: Patterns, Relationships, and Algebraic Thinking
Method: graphing
The total number of pizza boxes in 30 rows can also be found by extending the graph of data using the same pattern of the data.
Note how the vertical length on the graph doubles when increasing from 10 rows of pizza boxes to 20 rows of pizza boxes (for 80 total pizza boxes) and triples when increasing from 10 rows of pizza boxes to 30 rows of pizza boxes (for 120 total pizza boxes).
Towering pizzas
30
10
20
60
40
50
90
70
80
120
100
110
140
130
62 4 128 10 1814 16 2420 22 2826 30 320
Number of rows of pizza boxes
Tota
l num
ber
of p
izza
box
es
Method: equation
Using equation methods, the total number of pizza boxes, t, in 30 rows can be obtained by using the rule that describes the relationship between the number of pizza boxes and the number of rows.
The total number of pizza boxes is 4 times the number of rows of pizza boxes.
p = 4r
p = 4(30)
p = 120
There are 120 pizza boxes.
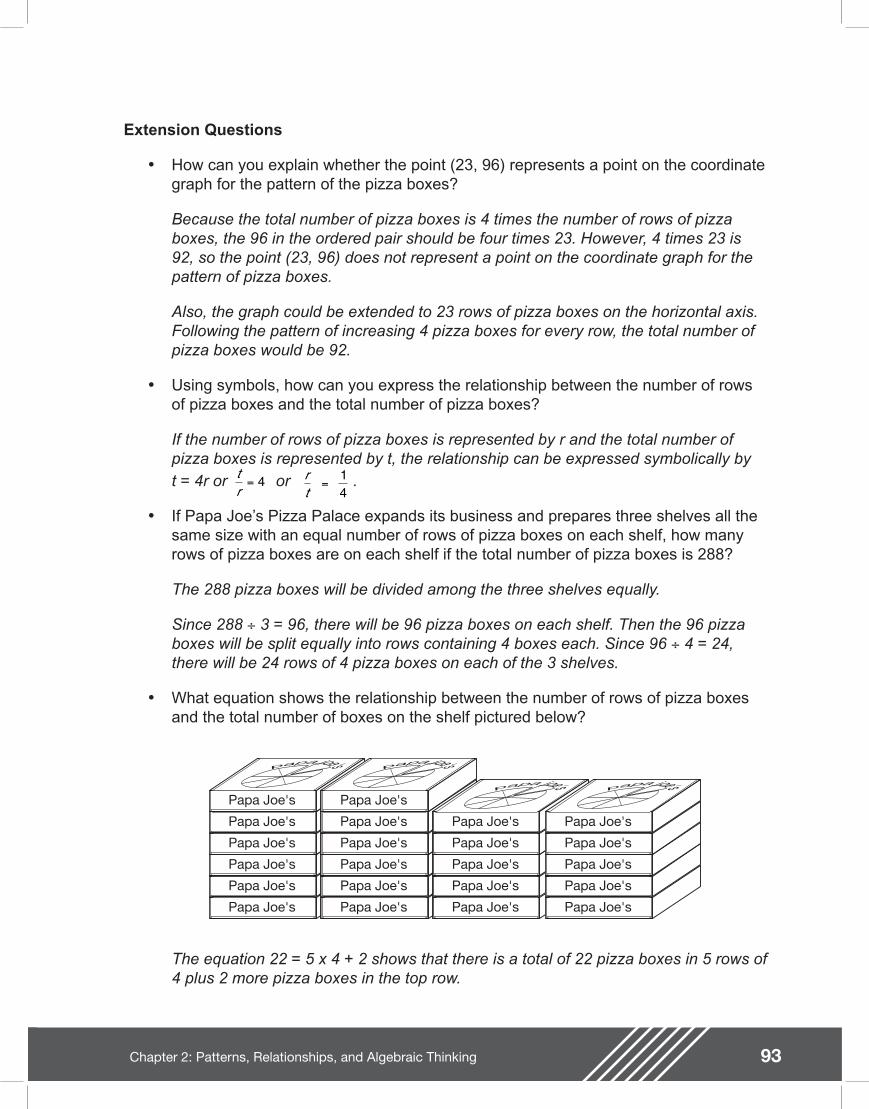
93Chapter 2: Patterns, Relationships, and Algebraic Thinking
Extension Questions
�• How can you explain whether the point (23, 96) represents a point on the coordinate graph for the pattern of the pizza boxes?
Because the total number of pizza boxes is 4 times the number of rows of pizza boxes, the 96 in the ordered pair should be four times 23. However, 4 times 23 is 92, so the point (23, 96) does not represent a point on the coordinate graph for the pattern of pizza boxes.
Also, the graph could be extended to 23 rows of pizza boxes on the horizontal axis. Following the pattern of increasing 4 pizza boxes for every row, the total number of pizza boxes would be 92.
�• Using symbols, how can you express the relationship between the number of rows of pizza boxes and the total number of pizza boxes?
If the number of rows of pizza boxes is represented by r and the total number of pizza boxes is represented by t, the relationship can be expressed symbolically byt = 4r or or .
�• If Papa Joe�’s Pizza Palace expands its business and prepares three shelves all the same size with an equal number of rows of pizza boxes on each shelf, how many rows of pizza boxes are on each shelf if the total number of pizza boxes is 288?
The 288 pizza boxes will be divided among the three shelves equally.
Since 288 ÷ 3 = 96, there will be 96 pizza boxes on each shelf. Then the 96 pizza boxes will be split equally into rows containing 4 boxes each. Since 96 ÷ 4 = 24, there will be 24 rows of 4 pizza boxes on each of the 3 shelves.
�• What equation shows the relationship between the number of rows of pizza boxes and the total number of boxes on the shelf pictured below?
tr
= 4 rt
=14
Papa Joe's
papa joe's
Papa Joe's
papa joe's
Papa Joe's
papa joe's
Papa Joe's
papa joe's
Papa Joe's
papa joe's
Papa Joe's
papa joe's
Papa Joe's
papa joe's
Papa Joe's
papa joe's
Papa Joe's
papa joe's
Papa Joe's
papa joe's
Papa Joe's
papa joe's
Papa Joe's
papa joe's
Papa Joe's
papa joe's
Papa Joe's
papa joe's
Papa Joe's
papa joe's
Papa Joe's
papa joe's
Papa Joe's
papa joe's
Papa Joe's
papa joe's
Papa Joe's
papa joe's
Papa Joe's
papa joe's
Papa Joe's
papa joe's
Papa Joe's
papa joe's
The equation 22 = 5 x 4 + 2 shows that there is a total of 22 pizza boxes in 5 rows of 4 plus 2 more pizza boxes in the top row.

94 Chapter 2: Patterns, Relationships, and Algebraic Thinking

95Chapter 2: Patterns, Relationships, and Algebraic Thinking
South Texas Nativesgrade 7
The South Texas region is home to more plant, butter y, and animal species than any other biological region in Texas. Due to the introduction of foreign plants and foreign animals, South Texas native plants and animals are in danger of being overrun and even becoming extinct. The South Texas Natives program helps landowners replant native plants in private and public lands. To make seeds available, volunteers collect seeds of these threatened native plants.
With this in mind, the school science club volunteers to collect buffalo grass seeds. As an incentive, the South Texas Natives program pays $20 dollars for each kilogram of buffalo grass seeds collected.
1. Fifteen students help collect seeds for the science club project. How much money did the science club earn if each student collected 2 kilograms? Explain your solution.
2. Describe the relationship between the number of kilograms and the amount of money received. Is the relationship proportional? Explain why or why not.
3. Describe the relationship between the amount of money earned and the number of students. Is the relationship proportional? Explain why or why not.
4. The science club has a goal to raise $1,000 dollars during this school year. What percentage of this year�’s goal was met by the 15 students with the seed collection project? Explain your reasoning.
5. What percentage of the money did each student collect? Explain your solution.
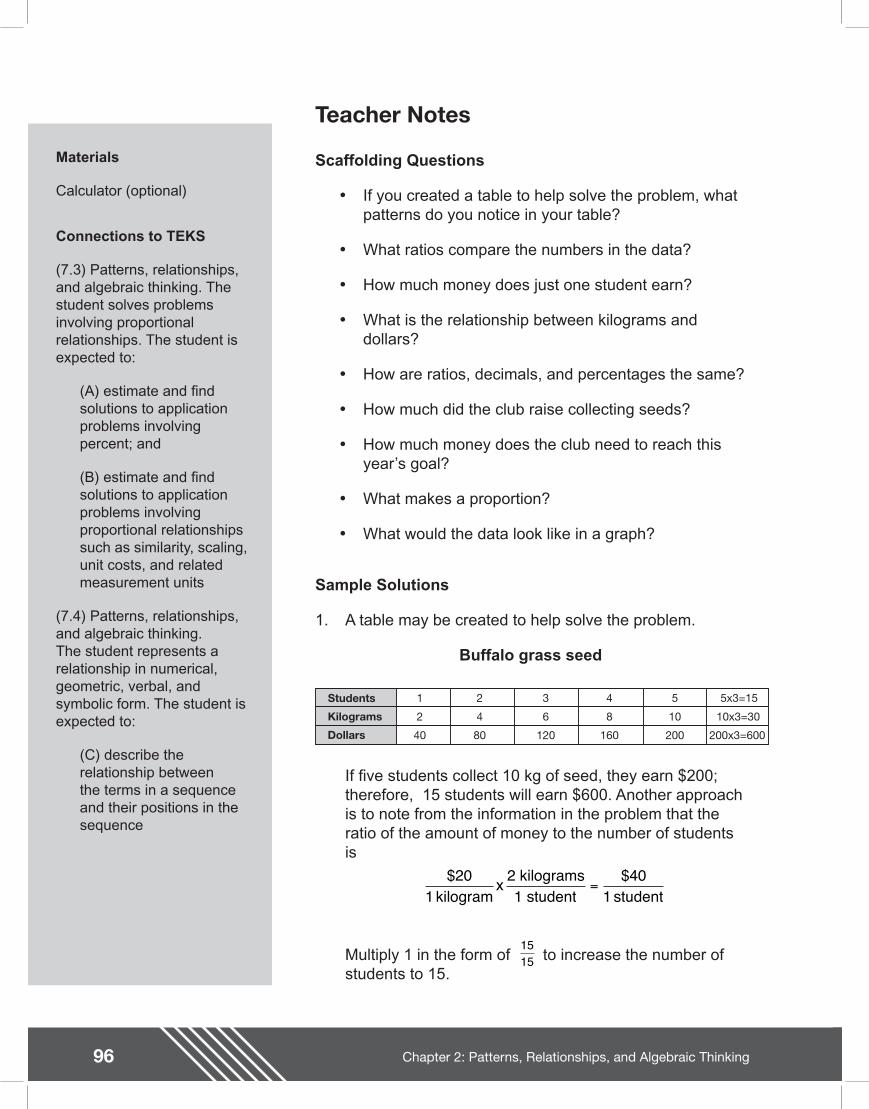
96
Teacher Notes
Chapter 2: Patterns, Relationships, and Algebraic Thinking
Materials
Calculator (optional)
Connections to TEKS
(7.3) Patterns, relationships, and algebraic thinking. The student solves problems involving proportional relationships. The student is expected to:
(A) estimate and nd solutions to application problems involving percent; and
(B) estimate and nd solutions to application problems involving proportional relationships such as similarity, scaling, unit costs, and related measurement units
(7.4) Patterns, relationships, and algebraic thinking. The student represents a relationship in numerical, geometric, verbal, and symbolic form. The student is expected to:
(C) describe the relationship between the terms in a sequence and their positions in the sequence
Scaffolding Questions
�• If you created a table to help solve the problem, what patterns do you notice in your table?
�• What ratios compare the numbers in the data?
�• How much money does just one student earn?
�• What is the relationship between kilograms and dollars?
�• How are ratios, decimals, and percentages the same?
�• How much did the club raise collecting seeds?
�• How much money does the club need to reach this year�’s goal?
�• What makes a proportion?
�• What would the data look like in a graph?
Sample Solutions
1. A table may be created to help solve the problem.
Buffalo grass seed
Students
Kilograms
Dollars
1 2 3 4 5
2 4 6 8 10
40 80 120 160 200
5x3=15
10x3=30
200x3=600
If ve students collect 10 kg of seed, they earn $200; therefore, 15 students will earn $600. Another approach is to note from the information in the problem that the ratio of the amount of money to the number of students is
$ $201
401 kilogram
x 2 kilograms1 student student
=
Multiply 1 in the form of to increase the number of students to 15.
1515
97Chapter 2: Patterns, Relationships, and Algebraic Thinking
Connections to TAKS
Objective 2: The student will demonstrate an understanding of patterns, relationships, and algebraic reasoning.
2. The ratio of amount of money in dollars to the number of kilograms is as follows: The club earns 20 dollars for every kilogram of seed collected. Yes, this is a proportional relationship. There is a constant of proportionality of $20 per kilogram. If the student collects zero kilograms, the student earns zero dollars. On a line graph, the data would show a straight line that goes through the origin.
A rule may be created for the amount of money earned. The number of kilograms times $20 equals y, the amount of money earned.
20n = y
3. The ratio of the amount of money earned to the number of students was shown in problem 1.
The ratio is a constant. Therefore, this is a proportional relationship.
The relationship may be described using the following rule: y = 40s, where y is the amount of money earned and s is the number of students.
4. Students in class may compare $600 with $1,000 and simplify to $60 for every $100, resulting in 60%. A proportion could be used to show 60%.
Students may also see the ratio $600 to $1,000 as a division problem. The quotient 0.60 converts to 60%.
5. Each student collected 2 kilograms, worth $40. The $40 may be compared to $600, the total amount earned by the club.
Students may set up the ratio $40 to $600 and divide,
$ $401
1201 student
x 1515 5 students
=
$ $201
401 kilogram
x 2 kilograms1 student student
=
$600$1,000
= 100%x
98 Chapter 2: Patterns, Relationships, and Algebraic Thinking
resulting in approximately 0.067. When the decimal is converted to a percentage, the answer is 6.7%.
Extension Question
�• The science teacher nds a price list for seed collections by the individual seed. If coma shrub seeds are 5 cents per seed, how many seeds must each student collect to earn the same amount as with the buffalo grass?
The student may solve by dividing $40 by $.05, resulting in 800 seeds. Another strategy may be to think of the ratio of nickels to dollars. If 1 dollar has 20 nickels, then 40 dollars equals 800 nickels. To earn 800 nickels the student has to collect 800 seeds, since the ratio is a nickel to 1 coma seed.
Resources used in this section
South Texas Natives, www.southtexasnatives.org
$$
. %40600
0 066 6 23
= =
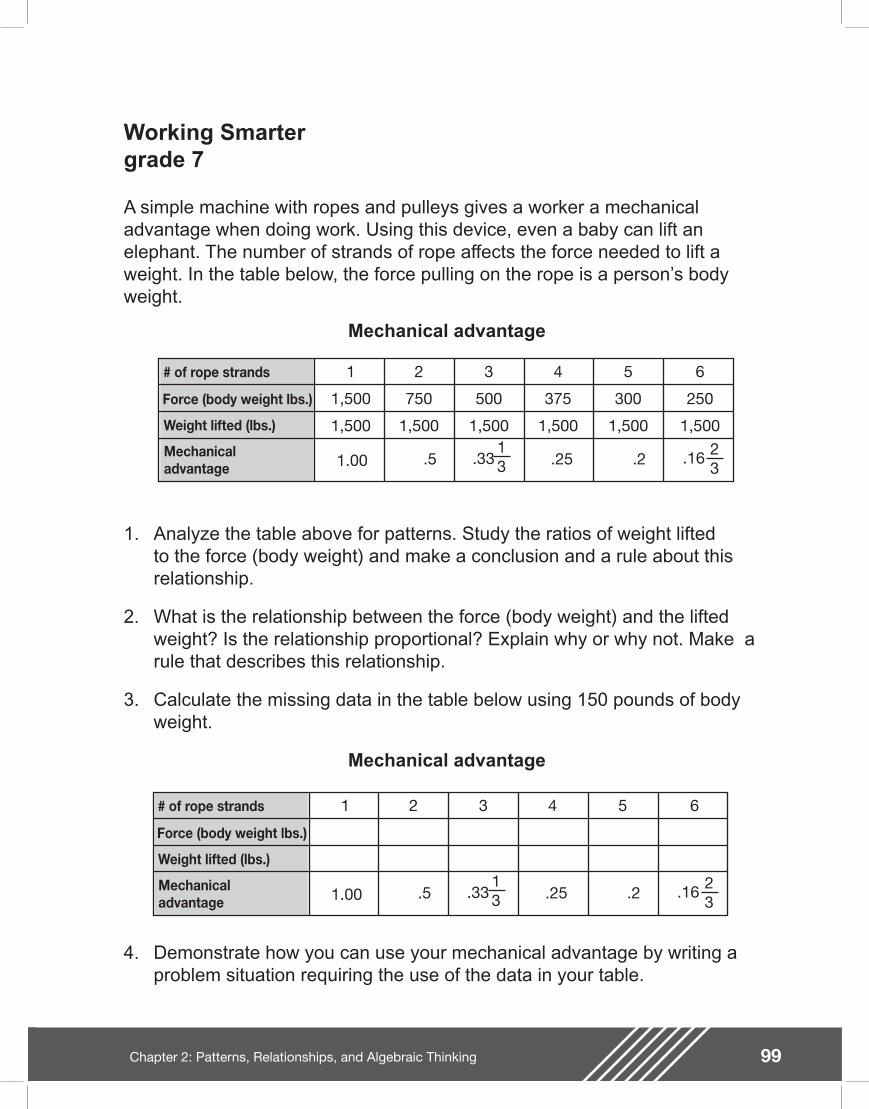
99Chapter 2: Patterns, Relationships, and Algebraic Thinking
Working Smartergrade 7
A simple machine with ropes and pulleys gives a worker a mechanical advantage when doing work. Using this device, even a baby can lift an elephant. The number of strands of rope affects the force needed to lift a weight. In the table below, the force pulling on the rope is a person�’s body weight.
Mechanical advantage
# of rope strands
Force (body weight lbs.)
Weight lifted (lbs.)
Mechanicaladvantage
1
1,500
1,500
2
750
1,500
4
375
1,500
6
250
1,500
5
300
1,500
3
500
1,500
1.00 .5 .2523
.16.213.33
1. Analyze the table above for patterns. Study the ratios of weight lifted to the force (body weight) and make a conclusion and a rule about this relationship.
2. What is the relationship between the force (body weight) and the lifted weight? Is the relationship proportional? Explain why or why not. Make a rule that describes this relationship.
3. Calculate the missing data in the table below using 150 pounds of body weight.
Mechanical advantage
1 2 4 653
1.00 .5 .2523
.16.213.33
# of rope strands
Force (body weight lbs.)
Weight lifted (lbs.)
Mechanicaladvantage
4. Demonstrate how you can use your mechanical advantage by writing a problem situation requiring the use of the data in your table.
100
Teacher Notes
Chapter 2: Patterns, Relationships, and Algebraic Thinking
Materials
Picture of ropes and pulleys (optional)
Connections to TEKS
(7.4) Patterns, relationships, and algebraic thinking. The student represents a relationship in numerical, geometric, verbal, and symbolic form. The student is expected to:
(A) generate formulas involving conversions, perimeter, area, circumference, volume, and scaling
(C) describe the relationship between the terms in a sequence and their positions in the sequence
(7.5) Patterns, relationships, and algebraic thinking. The student uses equations to solve problems. The student is expected to:
(B) formulate a possible problem situation when given a simple equation
Scaffolding Questions
�• What are the patterns in the table?
�• How do the ropes and pulleys help to do work?
�• What is mechanical advantage?
�• How do the sequences in the table support the use of ropes and pulleys?
�• Do all the numbers change in the data? Why or why not?
�• What determines the set-up of a ratio?
�• What rule develops from each sequence?
�• How is mechanical advantage computed?
�• What are the different ways to express ratios?
�• How are ratios in decimal form converted to common fraction form?
�• What relationships exist between mechanical advantage and other numbers in the table?
�• What units of measurement are used to measure body weight?
�• Does the type of unit used for weight affect the mechanical advantage ratio?
Sample Solutions
1. Patterns found include
�• The rope strands increase by one.
�• The weight to be lifted stays the same.
�• The ratio of weight lifted to rope strands is equal to the force (body weight in lbs).
�• The ratio of force (body weight) to weight lifted is equal to the mechanical advantage.
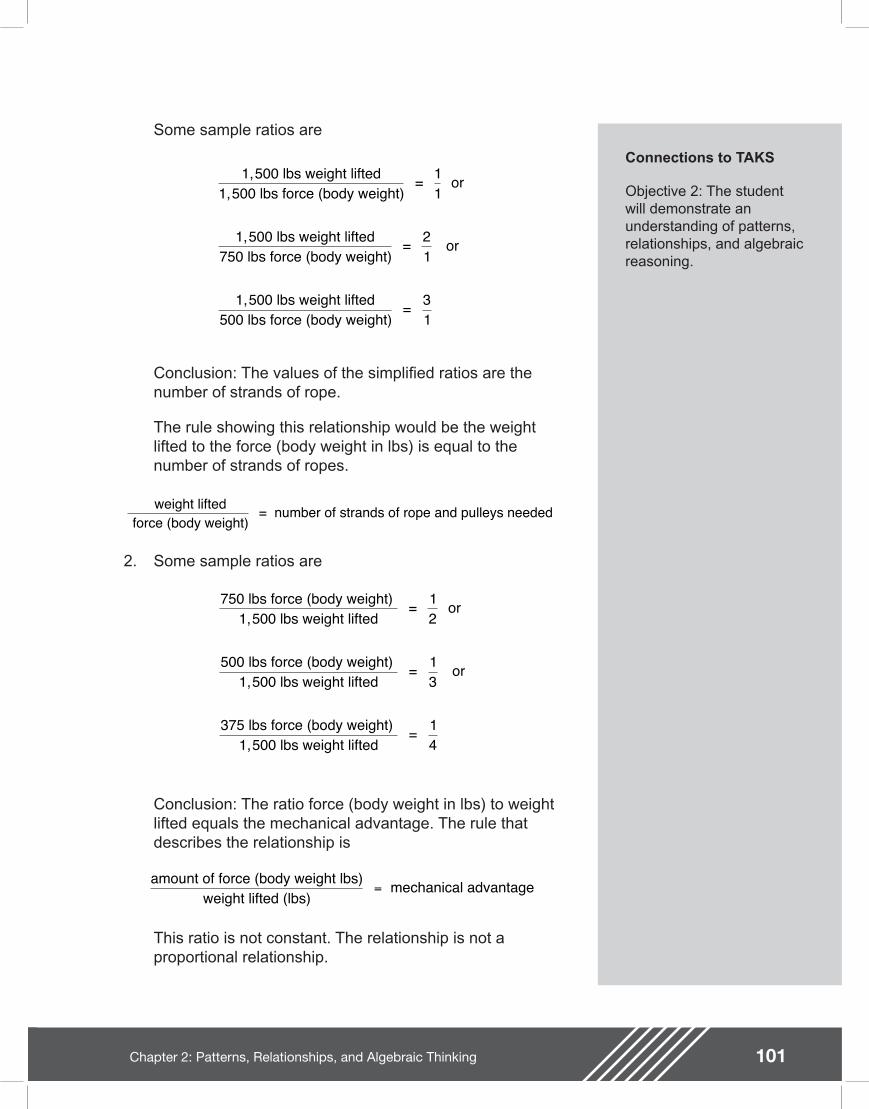
101Chapter 2: Patterns, Relationships, and Algebraic Thinking
Connections to TAKS
Objective 2: The student will demonstrate an understanding of patterns, relationships, and algebraic reasoning.
Some sample ratios are
Conclusion: The values of the simpli ed ratios are the number of strands of rope.
The rule showing this relationship would be the weight lifted to the force (body weight in lbs) is equal to the number of strands of ropes.
2. Some sample ratios are
Conclusion: The ratio force (body weight in lbs) to weight lifted equals the mechanical advantage. The rule that describes the relationship is
This ratio is not constant. The relationship is not a proportional relationship.
weight lifted force (body weight)
= number of strands of rope and pulleys needed
1,500 lbs weight lifted1,500 lbs force (body weight)
= 11
or
1,500 lbs weight lifted750 lbs force (body weight)
= 21
or
1,500 lbs weight lifted500 lbs force (body weight)
= 31
750 lbs force (body weight) 1,500 lbs weight lifted
= 12
or
500 lbs force (body weight) 1,500 lbs weight lifted
= 13
or
375 lbs force (body weight) 1,500 lbs weight lifted
= 14
amount of force (body weight lbs)weight lifted (lbs)
mechanical advantage=
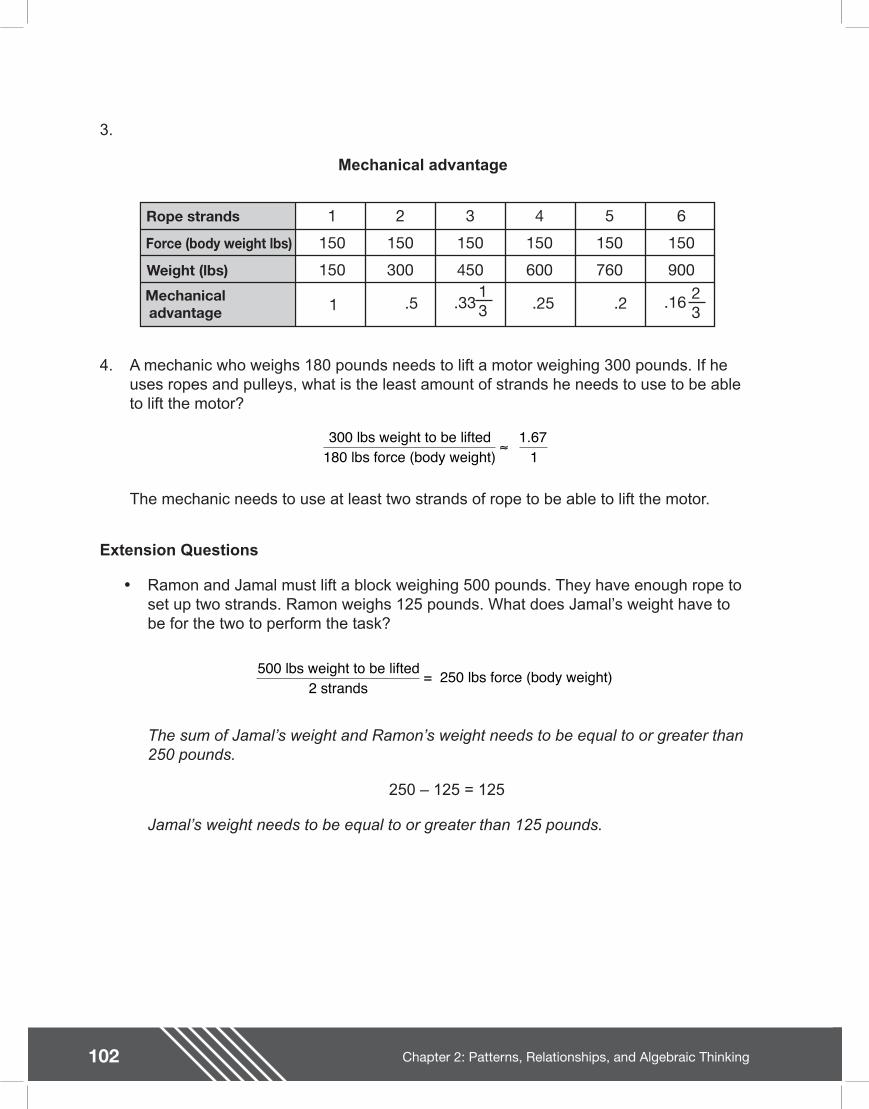
102 Chapter 2: Patterns, Relationships, and Algebraic Thinking
3.
Mechanical advantage
Rope strands
Force (body weight lbs)
Weight (lbs)
Mechanicaladvantage
1
150
150
2
150
300
4
150
600
6
150
900
5
150
760
3
150
450
1 .5 .2523
.16.213.33
4. A mechanic who weighs 180 pounds needs to lift a motor weighing 300 pounds. If he uses ropes and pulleys, what is the least amount of strands he needs to use to be able to lift the motor?
The mechanic needs to use at least two strands of rope to be able to lift the motor.
Extension Questions
�• Ramon and Jamal must lift a block weighing 500 pounds. They have enough rope to set up two strands. Ramon weighs 125 pounds. What does Jamal�’s weight have to be for the two to perform the task?
The sum of Jamal�’s weight and Ramon�’s weight needs to be equal to or greater than 250 pounds.
250 �– 125 = 125
Jamal�’s weight needs to be equal to or greater than 125 pounds.
300 lbs weight to be lifted180 lbs force (body weight)
1.671
500 lbs weight to be lifted2 strands
= 250 lbs force (body weight)
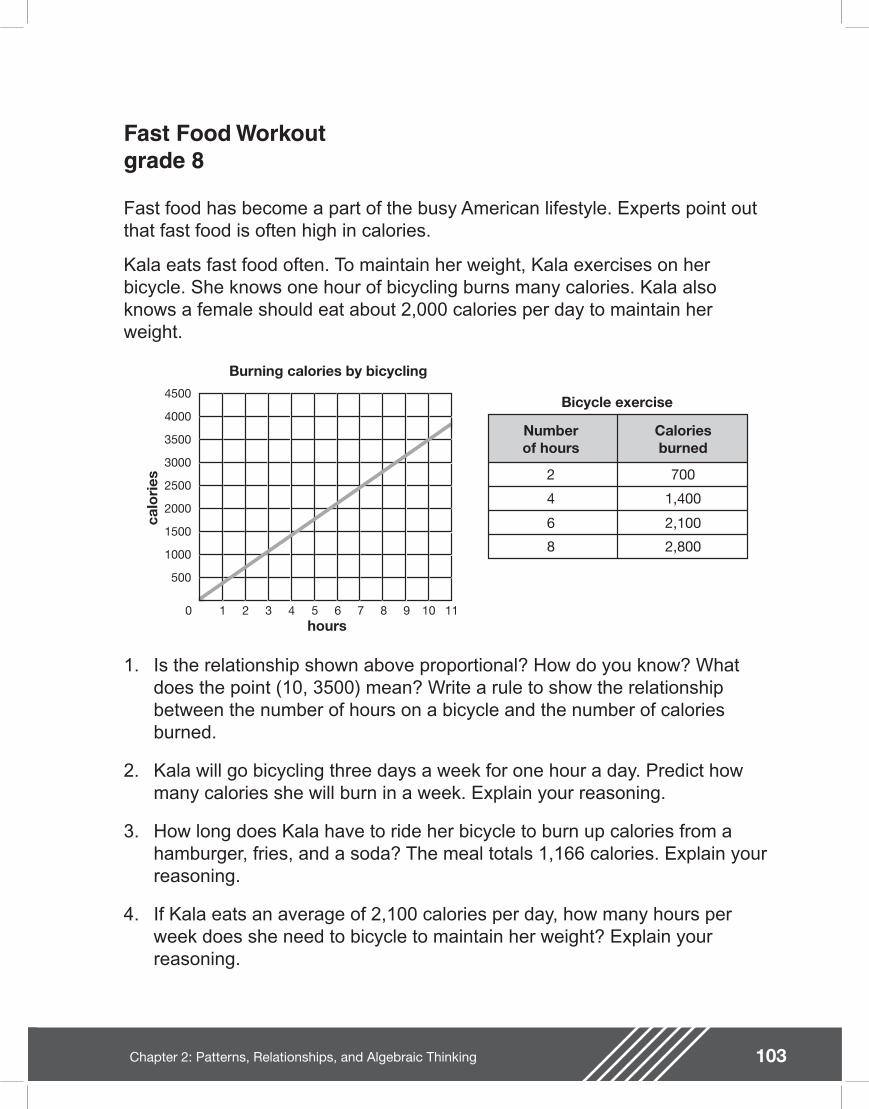
103Chapter 2: Patterns, Relationships, and Algebraic Thinking
Fast Food Workoutgrade 8
Fast food has become a part of the busy American lifestyle. Experts point out that fast food is often high in calories.
Kala eats fast food often. To maintain her weight, Kala exercises on her bicycle. She knows one hour of bicycling burns many calories. Kala also knows a female should eat about 2,000 calories per day to maintain her weight.
1500
500
1000
3000
2000
2500
4500
3500
4000
31 2 64 5 97 8 10 110
Burning calories by bicycling
hours
calo
ries
Numberof hours
Caloriesburned
2 700
4 1,400
6 2,100
8 2,800
Bicycle exercise
1. Is the relationship shown above proportional? How do you know? What does the point (10, 3500) mean? Write a rule to show the relationship between the number of hours on a bicycle and the number of calories burned.
2. Kala will go bicycling three days a week for one hour a day. Predict how many calories she will burn in a week. Explain your reasoning.
3. How long does Kala have to ride her bicycle to burn up calories from a hamburger, fries, and a soda? The meal totals 1,166 calories. Explain your reasoning.
4. If Kala eats an average of 2,100 calories per day, how many hours per week does she need to bicycle to maintain her weight? Explain your reasoning.
104
Teacher Notes
Chapter 2: Patterns, Relationships, and Algebraic Thinking
Materials
Graphing calculator
Straight edge
Connections to TEKS
(8.3) Patterns, relationships, and algebraic thinking. The student identi es proportional relationships in problem situations and solves problems. The student is expected to:
(B) estimate and nd solutions to application problems involving percents and proportional relationships such as similarity and rates
(8.4) Patterns, relationships, and algebraic thinking. The student makes connections among various representations of a numerical relationship. The student is expected to generate a different representation given one representation of data such as a table, graph, equation, or verbal description.
Scaffolding Questions
�• What points on the graph can be read without estimation?
�• Which is the independent variable and which is the dependent variable?
�• How does time affect the calories burned?
�• How can you evaluate the situation for proportionality?
�• How does the line graph support or not support a proportional relationship?
�• What is the rate Kala burns up calories by bicycling?
�• How does a rule help predict an outcome?
Sample Solutions
1. The relationship between the number of calories burned and the number of hours is proportional because the graph is a line graph that goes through the origin. The rate of change is the same for each hour. The data in the table needs to be studied to nd the rate of calories burned in one hour. Any ratio of the number of calories burned to the number of hours may be simpli ed into 350 calories per hour.
The point (10, 3500) means 10 hours of bicycling burns 3,500 calories.
Kala burns 350 calories in one hour. The total number of calories burned is 350 calories per hour times the
7002
31
14004
31
21006
31
28008
31
calories hours
50 calories hour
350 calories per hour
calories hours
50 calories hour
350 calories per hour
calories hours
50 calories hour
350 calories per hour
calories hours
50 calories hour
350 calories per hour
= =
= =
= =
= =
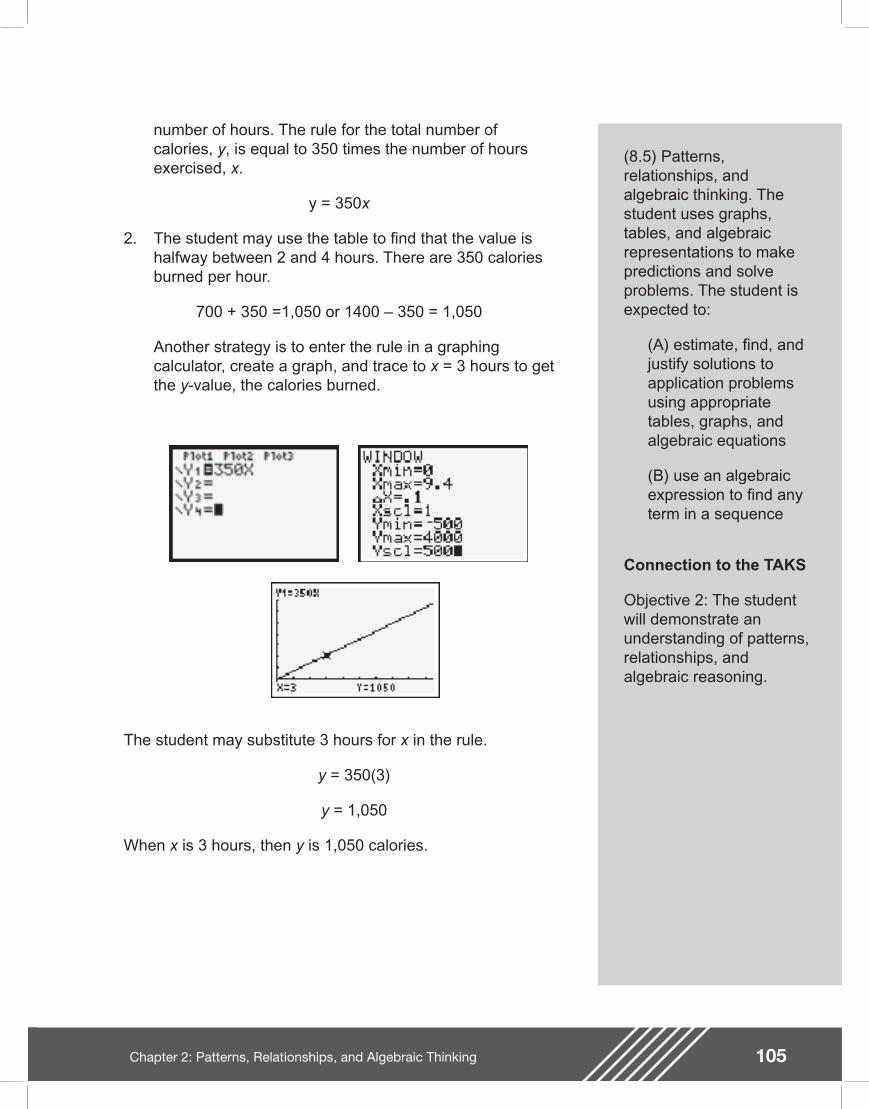
105Chapter 2: Patterns, Relationships, and Algebraic Thinking
(8.5) Patterns, relationships, and algebraic thinking. The student uses graphs, tables, and algebraic representations to make predictions and solve problems. The student is expected to:
(A) estimate, nd, and justify solutions to application problems using appropriate tables, graphs, and algebraic equations
(B) use an algebraic expression to nd any term in a sequence
Connection to the TAKS
Objective 2: The student will demonstrate an understanding of patterns, relationships, and algebraic reasoning.
number of hours. The rule for the total number of calories, y, is equal to 350 times the number of hours exercised, x.
y = 350x
2. The student may use the table to nd that the value is halfway between 2 and 4 hours. There are 350 calories burned per hour.
700 + 350 =1,050 or 1400 �– 350 = 1,050
Another strategy is to enter the rule in a graphing calculator, create a graph, and trace to x = 3 hours to get the y-value, the calories burned.
The student may substitute 3 hours for x in the rule.
y = 350(3)
y = 1,050
When x is 3 hours, then y is 1,050 calories.
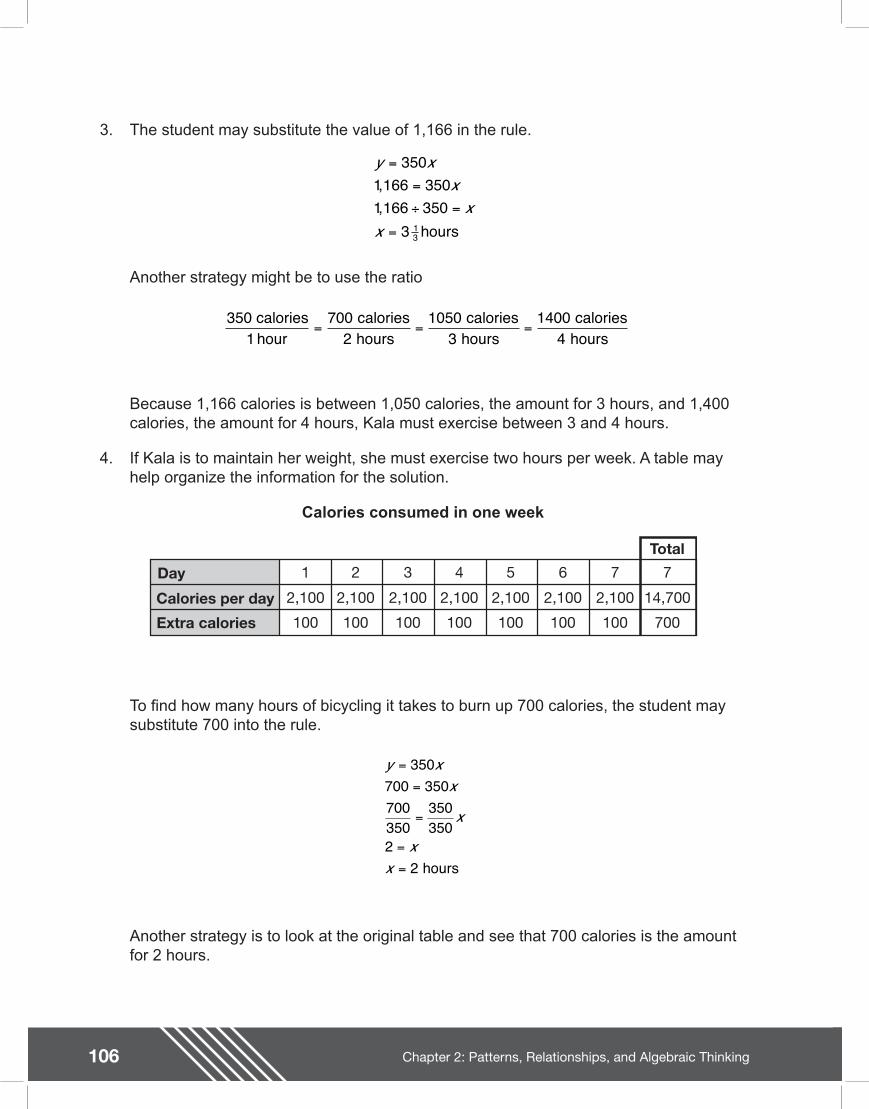
106 Chapter 2: Patterns, Relationships, and Algebraic Thinking
3. The student may substitute the value of 1,166 in the rule.
Another strategy might be to use the ratio
Because 1,166 calories is between 1,050 calories, the amount for 3 hours, and 1,400 calories, the amount for 4 hours, Kala must exercise between 3 and 4 hours.
4. If Kala is to maintain her weight, she must exercise two hours per week. A table may help organize the information for the solution.
Calories consumed in one week
y xxx
x
=
=
÷ =
=
3501166 3501166 350
3 13
,,
hours
31
7002
10503
14004
50 calories hour
calories hours
calories hours
calories hours
= = =
Calories per day
Extra calories
Day
Total1
2,100
100
2
2,100
100
3
2,100
100
4
2,100
100
5
2,100
100
6
2,100
100
7
2,100
100
7
14,700
700
To nd how many hours of bicycling it takes to burn up 700 calories, the student may substitute 700 into the rule.
Another strategy is to look at the original table and see that 700 calories is the amount for 2 hours.
y xx
x
xx
=
=
=
=
=
350700 350700350
350350
22 hours
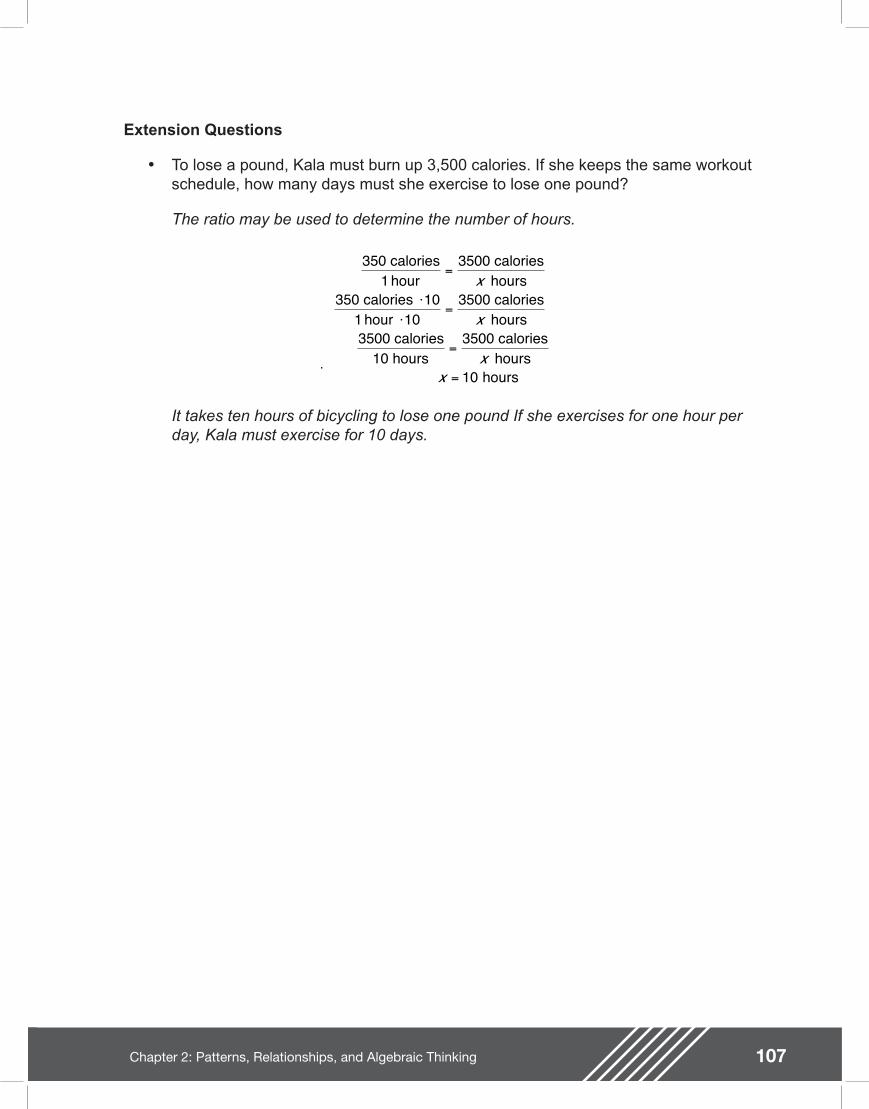
107Chapter 2: Patterns, Relationships, and Algebraic Thinking
Extension Questions
�• To lose a pound, Kala must burn up 3,500 calories. If she keeps the same workout schedule, how many days must she exercise to lose one pound?
The ratio may be used to determine the number of hours.
It takes ten hours of bicycling to lose one pound If she exercises for one hour per day, Kala must exercise for 10 days.
50 calories hour
500 calories hours
50 calories 10 hour 10
500 calories hours
500 calories0 hours
500 calories hours
hours
31
3
31
3
31
3
10
=
=
=
=
x
x
xx

108 Chapter 2: Patterns, Relationships, and Algebraic Thinking
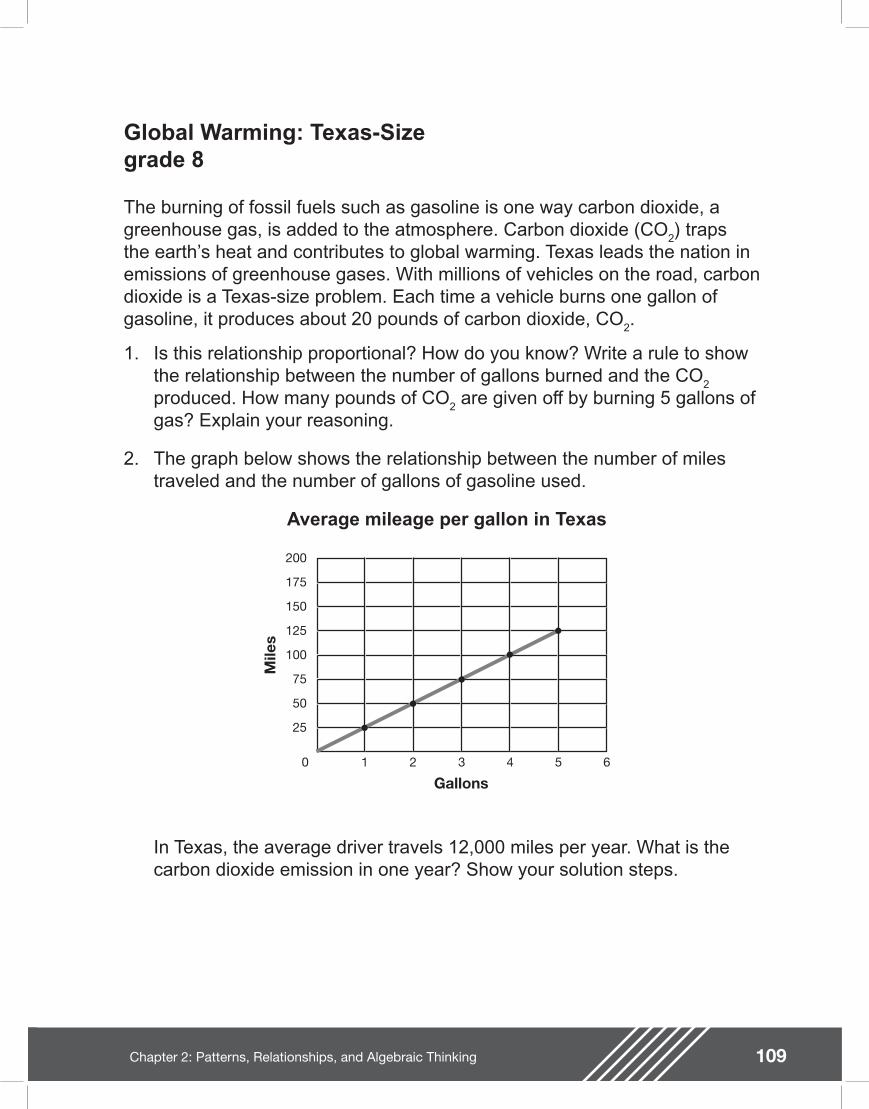
109Chapter 2: Patterns, Relationships, and Algebraic Thinking
Global Warming: Texas-Sizegrade 8
The burning of fossil fuels such as gasoline is one way carbon dioxide, a greenhouse gas, is added to the atmosphere. Carbon dioxide (CO
2) traps
the earth�’s heat and contributes to global warming. Texas leads the nation in emissions of greenhouse gases. With millions of vehicles on the road, carbon dioxide is a Texas-size problem. Each time a vehicle burns one gallon of gasoline, it produces about 20 pounds of carbon dioxide, CO
2.
1. Is this relationship proportional? How do you know? Write a rule to show the relationship between the number of gallons burned and the CO
2
produced. How many pounds of CO2 are given off by burning 5 gallons of
gas? Explain your reasoning.
2. The graph below shows the relationship between the number of miles traveled and the number of gallons of gasoline used.
Average mileage per gallon in Texas
75
25
50
150
100
125
175
200
1 32 4 650
Mile
s
Gallons
In Texas, the average driver travels 12,000 miles per year. What is the carbon dioxide emission in one year? Show your solution steps.
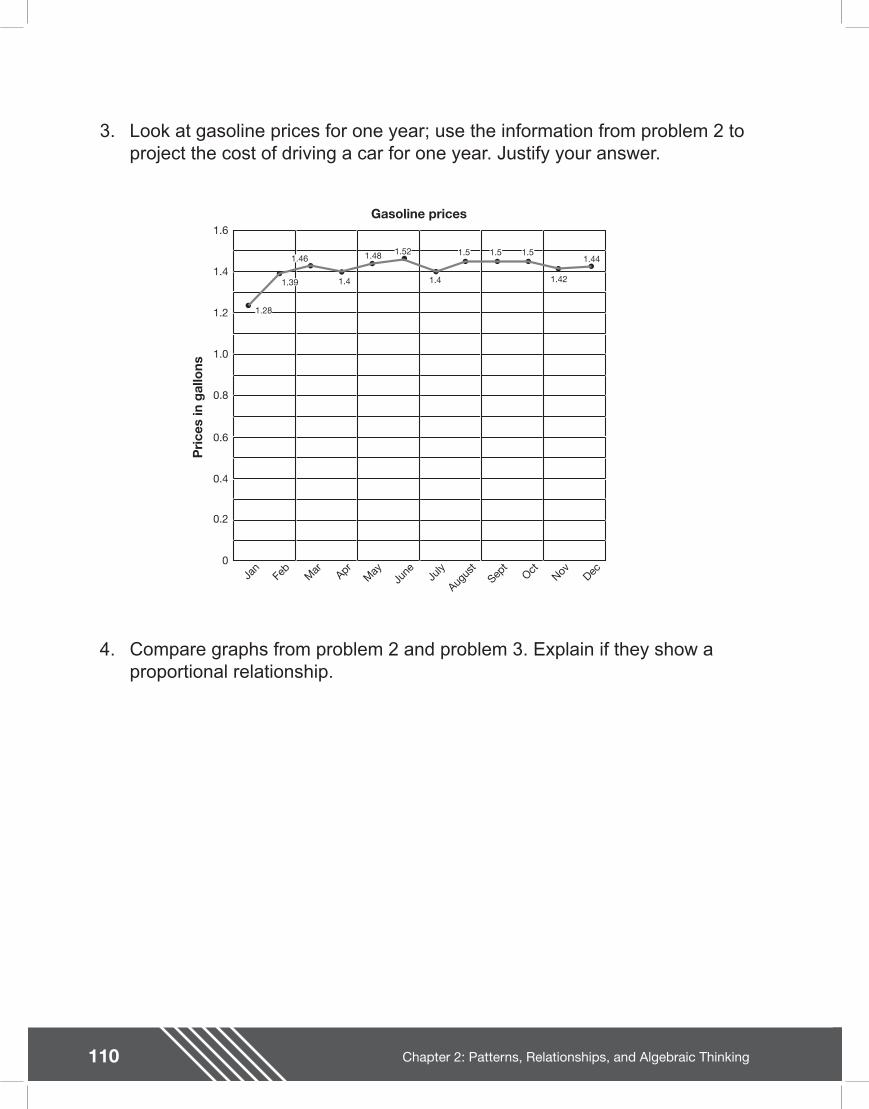
110 Chapter 2: Patterns, Relationships, and Algebraic Thinking
3. Look at gasoline prices for one year; use the information from problem 2 to project the cost of driving a car for one year. Justify your answer.
Gasoline pricesP
rice
s in
gal
lons
0.6
0.2
0.4
1.2
0.8
1.0
1.4
1.6
MarJa
nFe
bJu
neAprM
aySep
tJu
ly
Augus
tDecOct
Nov0
1.28
1.39
1.46
1.4
1.48 1.52
1.42
1.441.5 1.5 1.5
1.4
4. Compare graphs from problem 2 and problem 3. Explain if they show a proportional relationship.

111Chapter 2: Patterns, Relationships, and Algebraic Thinking
112
Teacher Notes
Chapter 2: Patterns, Relationships, and Algebraic Thinking
Materials
Graphing calculator
Ruler
Connections to TEKS
(8.3) Patterns, relationships, and algebraic thinking. The student identi es proportional relationships in problem situations and solves problems. The student is expected to:
(A) compare and contrast proportional and non-proportional relationships
(8.4) Patterns, relationships, and algebraic thinking. The student makes connections among various representations of a numerical relationship. The student is expected to generate a different representation given one representation of data such as a table, graph, equation, or verbal description.
(8.5) Patterns, relationships, and algebraic thinking. The student uses graphs, tables, and algebraic representations to make
Scaffolding Questions
�• What is the ratio of gallons to pounds of carbon dioxide?
�• What other ratios are in the table?
�• What patterns help create the equation?
�• What clues determine the operations to use in the rule?
�• What kind of relationship is illustrated on the line graph?
�• What rate of change does the graph express?
�• How are the independent variable and the dependent variable determined?
�• What are some visual clues of proportionality on a graph?
�• How can a ruler assist in reading a graph?
Sample Solutions
1. There is a constant rate of change; for every 1 gallon of gasoline burned, 20 pounds of CO
2 are produced. If 0
gallons of gasoline are burned, then no CO2 is produced.
Therefore, there is a proportional relationship between the gallons burned and the pollution produced.
The number of pounds of CO2 is equal to 20 pounds
per gallon times the number of gallons. A rule for this proportion could be written as p = 20g, where g is the gallons and p is the pounds of CO
2.
The rule may be used to determine the number of pounds when the number of gallons is 5.
p = 20g
p = 20(5) = 100
113Chapter 2: Patterns, Relationships, and Algebraic Thinking
predictions and solve problems. The student is expected to:
(A) estimate, nd, and justify solutions to application problems using appropriate tables, graphs, and algebraic equations
(B) use an algebraic expression to nd any term in a sequence
Connections to TAKS
Objective 2: The student will demonstrate an understanding of patterns, relationships, and algebraic reasoning.
One hundred pounds of CO2 are produced by burning 5
gallons of gasoline.
The ratio could also be used to answer the question. Multiply by 5 to make the number of gallons be 5 gallons.
2. The graph is a straight line that passes through the origin. There is a constant rate of change.
25 miles for 1 gallon
50 miles for 2 gallons
75 miles for 3 gallons
100 miles for 4 gallons
125 miles for 5 gallons
The rate is 25 miles per gallon.
Proportions may be used to nd the number of gallons for 1,200 miles.
The driver uses 480 gallons in one year.
To nd the number of pounds of CO2, use the rule
p = 20g when g is 480 gallons.
p = 20(480) = 9,600
Therefore, 9,600 pounds of CO2 would be produced in
one year.
3. The student nds the average of the cost of gasoline for the year. The sum of the price of gas for 12 months, $17.29, is divided by 12 months. The mean is about $1.44 per gallon. The information from problem 2 helps
20 20 100 pounds1 gallon
pounds 51 gallon 5
pounds5 gallons
= =
25 1
25 14
miles1 gallon
2,000 miles gallons
miles x 4801 gallon x 480
2,000 miles80 gallons
=
=
x
114 Chapter 2: Patterns, Relationships, and Algebraic Thinking
with this solution. From problem 2, the student gathers that the yearly total is 480 gallons.
4. The graph in problem 2 is a proportion because the line goes through the origin (0, 0) and it has a constant rate of change; the ratio is
25 miles : 1 gallon of gasoline
The graph in problem 3 is not a straight line and does not go through the origin (0, 0). The comparison of gasoline prices is not proportional. There is not a constant rate of change among the prices of gasoline over the months.
Extension Questions
�• A large Douglas r tree takes in 16,000 pounds of carbon dioxide per year. How many trees can counteract the car emission of 10,000 pounds of carbon dioxide?
One Douglas r tree can counteract 10,000 pounds of carbon dioxide.
Resources used in this section
Environmental Protection Agency, www.epa.gov/OMSWWW/
Public Citizen, www.citizen.org/pressroom/release.cfm?ID=524
$ . $ .1 44 4801
691 20480
××
= gallon 480 gallons
The driver spends $691.20 to buy 480 gallons of gas.
16,000 pounds carbon dioxide1 tree
= pounds carbon dioxide
16,000 pounds carbon dioxide .631 tree .63
so it takes approximately 1 tree
10 000
10 00063
,
,.
x×
×
Middle SchooIAssessments
Chapter 3:Geometry andSpatial Reasoning

116 Chapter 3: Geometry and Spatial Reasoning
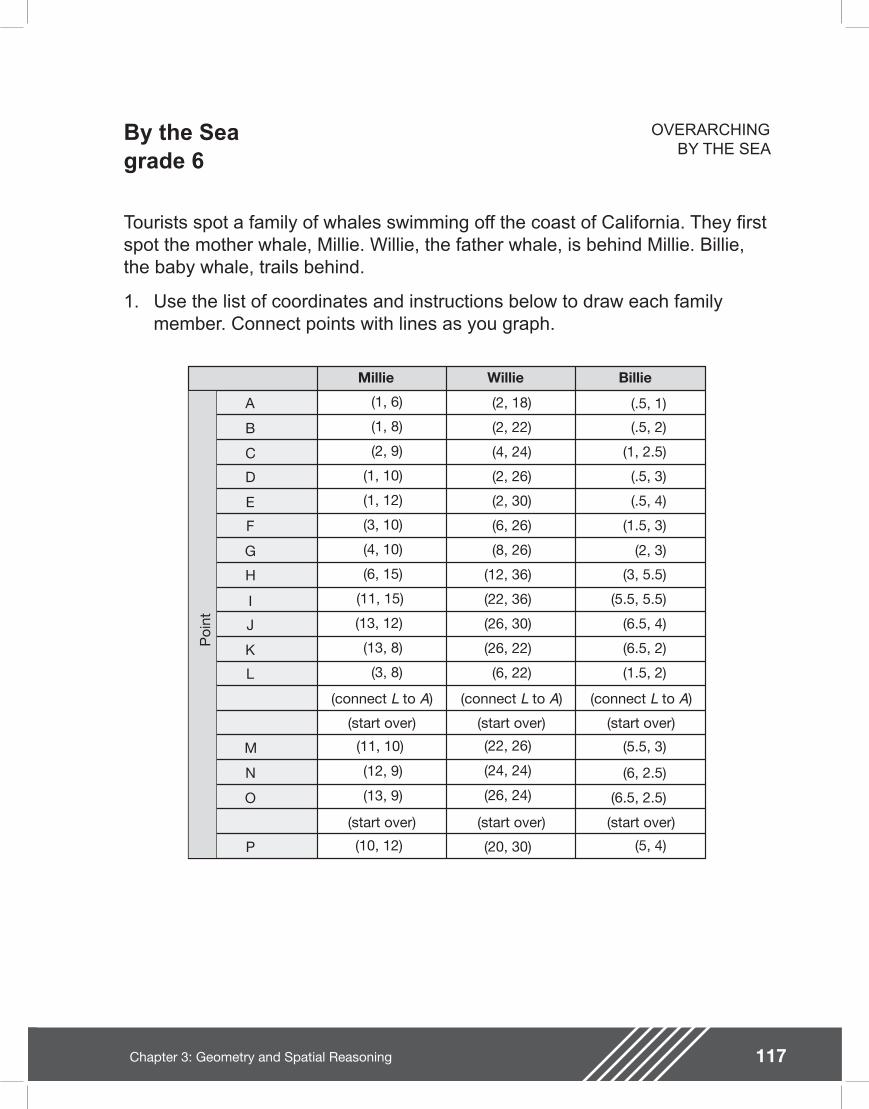
117Chapter 3: Geometry and Spatial Reasoning
By the Sea
Tourists spot a family of whales swimming off the coast of California. They rst spot the mother whale, Millie. Willie, the father whale, is behind Millie. Billie, the baby whale, trails behind.
1. Use the list of coordinates and instructions below to draw each family member. Connect points with lines as you graph.
Poi
nt
A
B
C
D
E
F
G
H
I
J
K
L
M
N
O
P
Billie
(start over)
(start over)
(connect L to A)
(.5, 1)
(.5, 2)
(1, 2.5)
(.5, 3)
(.5, 4)
(1.5, 3)
(2, 3)
(3, 5.5)
(5.5, 5.5)
(6.5, 4)
(6.5, 2)
(1.5, 2)
(5.5, 3)
(6, 2.5)
(6.5, 2.5)
(5, 4)
Willie
(start over)
(start over)
(connect L to A)
(2, 18)
(2, 22)
(4, 24)
(2, 26)
(2, 30)
(6, 26)
(8, 26)
(12, 36)
(22, 36)
(26, 30)
(26, 22)
(6, 22)
(22, 26)
(24, 24)
(26, 24)
(20, 30)
Millie
(connect L to A)
(start over)
(start over)
(1, 6)
(1, 8)
(2, 9)
(1, 10)
(1, 12)
(3, 10)
(4, 10)
(6, 15)
(11, 15)
(13, 12)
(13, 8)
(3, 8)
(11, 10)
(12, 9)
(13, 9)
(10, 12)
grade 6
OVERARCHINGBY THE SEA
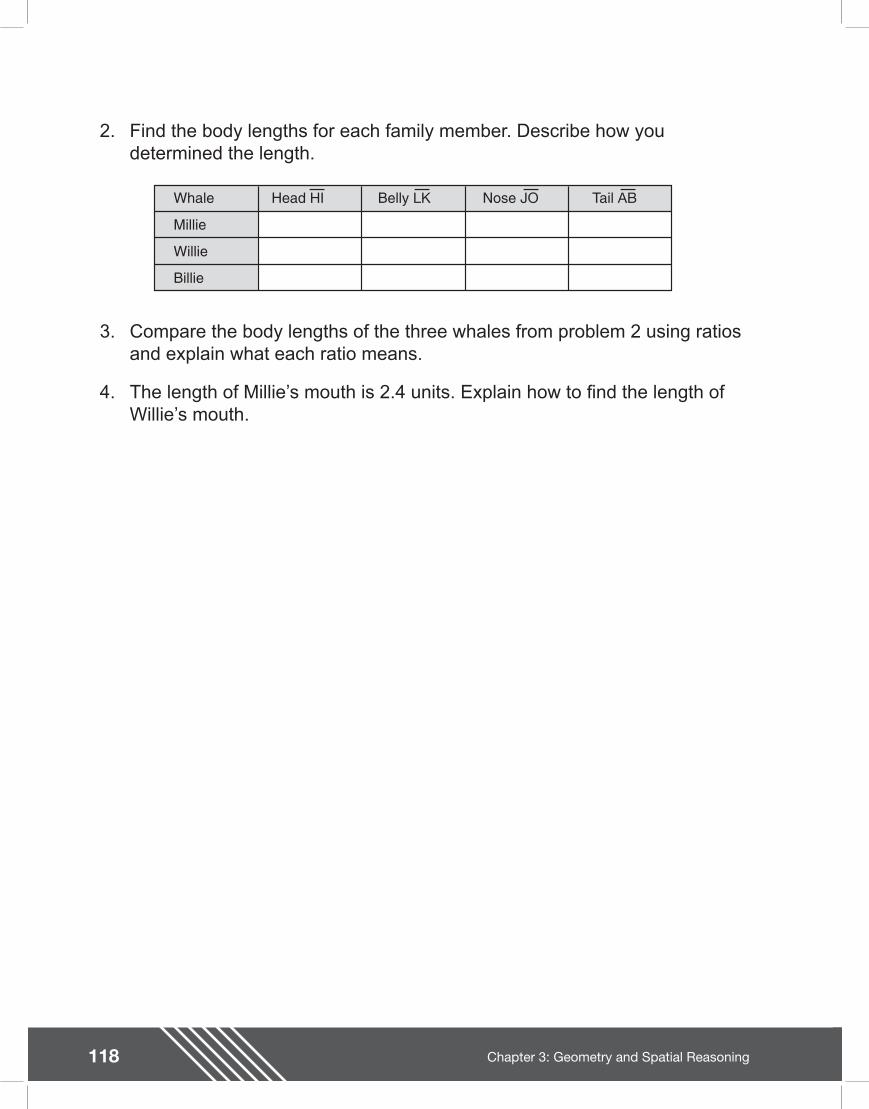
118 Chapter 3: Geometry and Spatial Reasoning
2. Find the body lengths for each family member. Describe how you determined the length.
Billie
Willie
Millie
Whale Head HI Belly LK Nose JO Tail AB
3. Compare the body lengths of the three whales from problem 2 using ratios and explain what each ratio means.
4. The length of Millie�’s mouth is 2.4 units. Explain how to nd the length of Willie�’s mouth.

119Chapter 3: Geometry and Spatial Reasoning
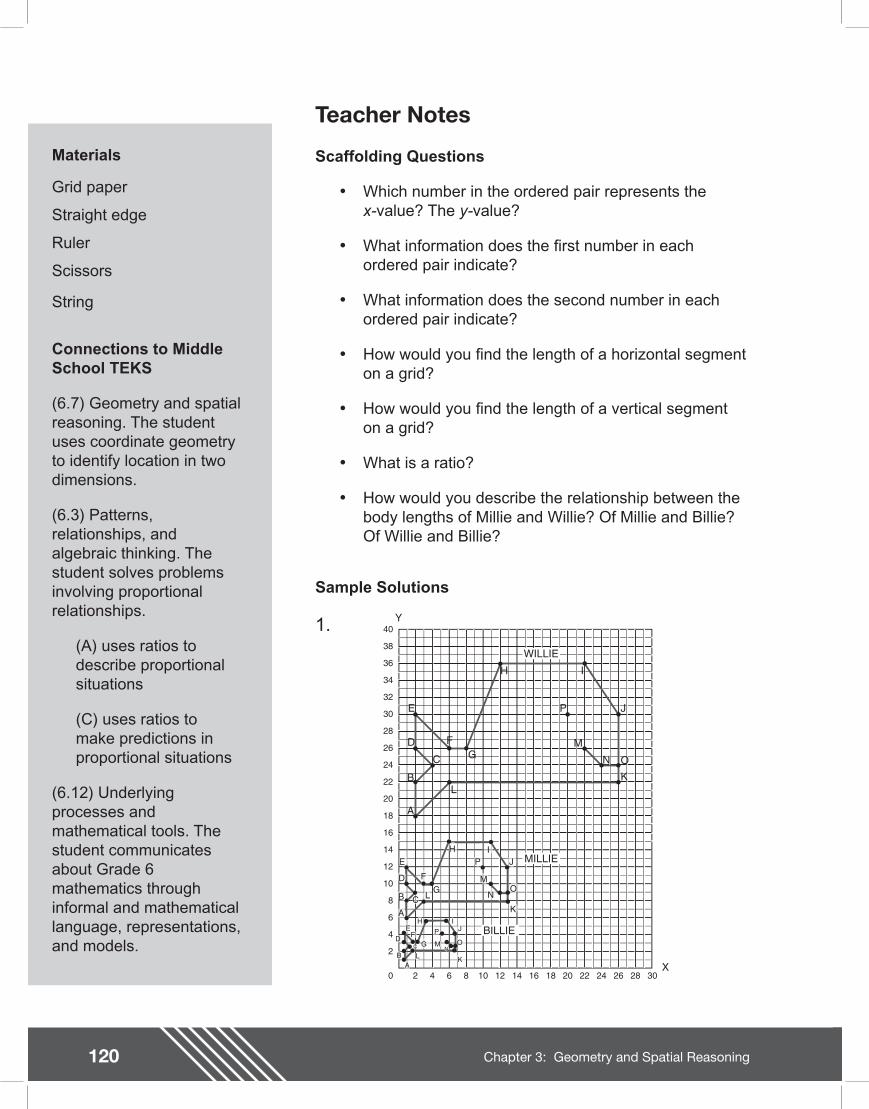
120 Chapter 3: Geometry and Spatial Reasoning
Teacher Notes
Materials
Grid paper
Straight edge
Ruler
Scissors
String
Connections to Middle School TEKS
(6.7) Geometry and spatial reasoning. The student uses coordinate geometry to identify location in two dimensions.
(6.3) Patterns, relationships, and algebraic thinking. The student solves problems involving proportional relationships.
(A) uses ratios to describe proportional situations
(C) uses ratios to make predictions in proportional situations
(6.12) Underlying processes and mathematical tools. The student communicates about Grade 6 mathematics through informal and mathematical language, representations, and models.
Scaffolding Questions
�• Which number in the ordered pair represents thex-value? The y-value?
�• What information does the rst number in each ordered pair indicate?
�• What information does the second number in each ordered pair indicate?
�• How would you nd the length of a horizontal segment on a grid?
�• How would you nd the length of a vertical segment on a grid?
�• What is a ratio?
�• How would you describe the relationship between the body lengths of Millie and Willie? Of Millie and Billie? Of Willie and Billie?
Sample Solutions
1.
6
2
4
12
8
10
18
14
16
24
20
22
28
26
34
30
32
40
36
38
62 4 128 10 1814 16 2420 22 2826 300X
Y
A
B
C
D
E
FG
H I
J
KL
M
N O
P
WILLIE
A
B C
D
E
FG
H IJ
K
L
M
NO
P MILLIE
AB
CD
EF
G
H IJ
KL
MN
O
P BILLIE
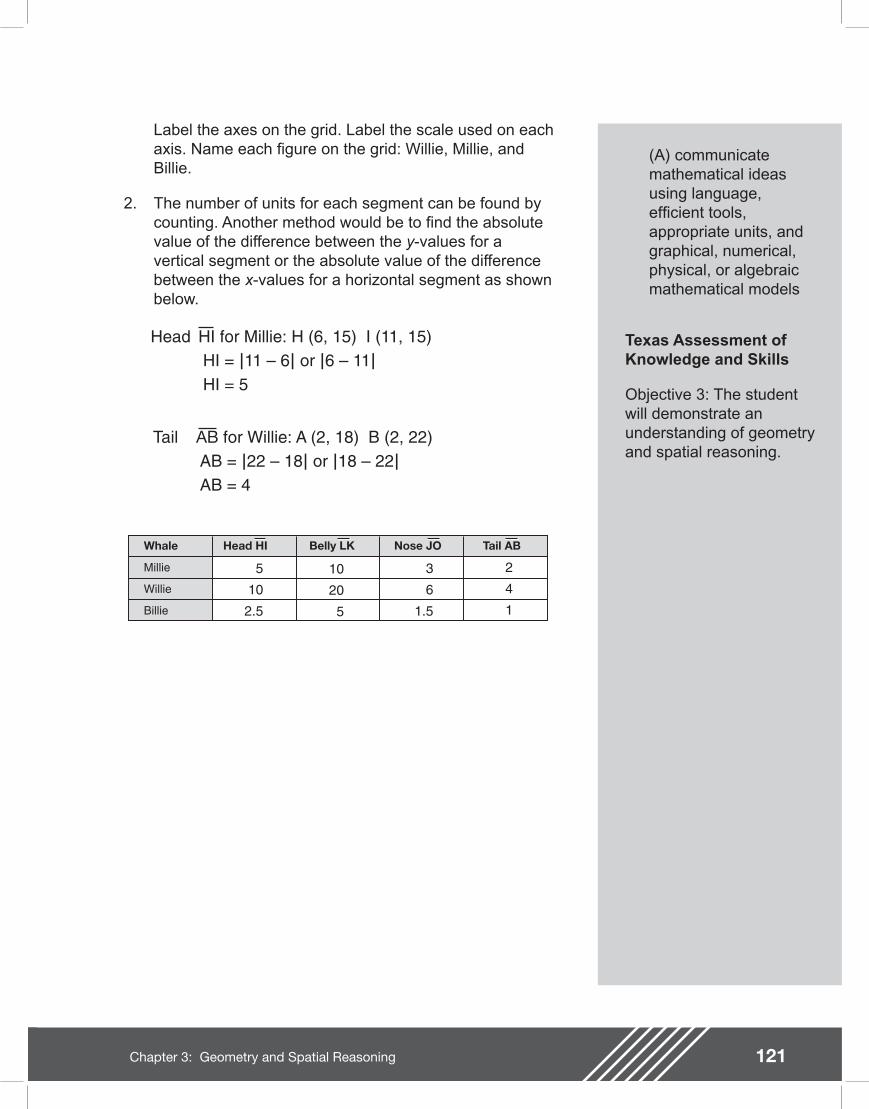
121Chapter 3: Geometry and Spatial Reasoning
(A) communicate mathematical ideas using language, ef cient tools, appropriate units, and graphical, numerical, physical, or algebraic mathematical models
Texas Assessment of Knowledge and Skills
Objective 3: The student will demonstrate an understanding of geometry and spatial reasoning.
Label the axes on the grid. Label the scale used on each axis. Name each gure on the grid: Willie, Millie, and Billie.
2. The number of units for each segment can be found by counting. Another method would be to nd the absolute value of the difference between the y-values for a vertical segment or the absolute value of the difference between the x-values for a horizontal segment as shown below.
Head HI for Millie: H (6, 15) I (11, 15) HI = |11 – 6| or |6 – 11| HI = 5
Tail AB for Willie: A (2, 18) B (2, 22) AB = |22 – 18| or |18 – 22| AB = 4
Billie
Willie
Millie
Whale Head HI Belly LK Nose JO Tail AB
5
10
2.5
10
20
5
3
6
1.5
2
4
1
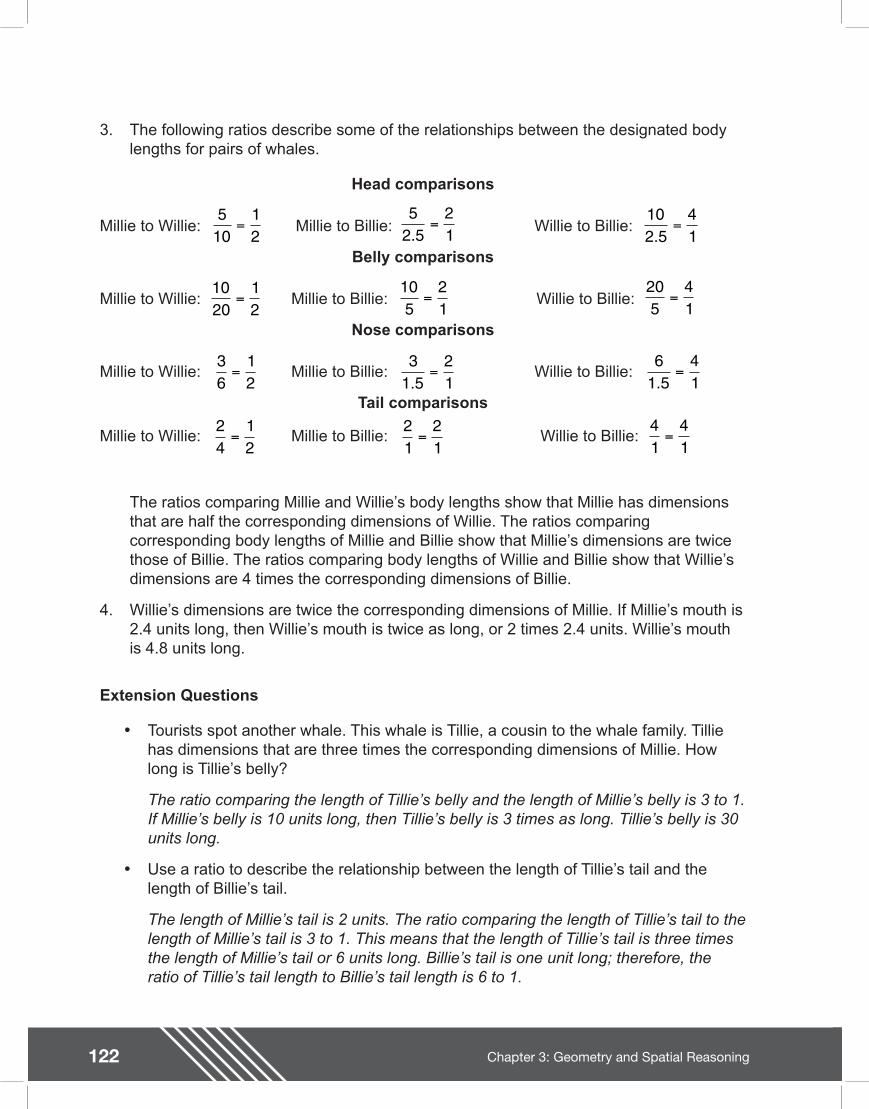
122 Chapter 3: Geometry and Spatial Reasoning
3. The following ratios describe some of the relationships between the designated body lengths for pairs of whales.
Head comparisons
Millie to Willie: Millie to Billie: Willie to Billie:
Belly comparisons
Millie to Willie: Millie to Billie: Willie to Billie:
Nose comparisons
Millie to Willie: Millie to Billie: Willie to Billie:
Tail comparisons
Millie to Willie: Millie to Billie: Willie to Billie:
The ratios comparing Millie and Willie�’s body lengths show that Millie has dimensions that are half the corresponding dimensions of Willie. The ratios comparing corresponding body lengths of Millie and Billie show that Millie�’s dimensions are twice those of Billie. The ratios comparing body lengths of Willie and Billie show that Willie�’s dimensions are 4 times the corresponding dimensions of Billie.
4. Willie�’s dimensions are twice the corresponding dimensions of Millie. If Millie�’s mouth is 2.4 units long, then Willie�’s mouth is twice as long, or 2 times 2.4 units. Willie�’s mouth is 4.8 units long.
Extension Questions
�• Tourists spot another whale. This whale is Tillie, a cousin to the whale family. Tillie has dimensions that are three times the corresponding dimensions of Millie. How long is Tillie�’s belly?
The ratio comparing the length of Tillie�’s belly and the length of Millie�’s belly is 3 to 1. If Millie�’s belly is 10 units long, then Tillie�’s belly is 3 times as long. Tillie�’s belly is 30 units long.
�• Use a ratio to describe the relationship between the length of Tillie�’s tail and the length of Billie�’s tail.
The length of Millie�’s tail is 2 units. The ratio comparing the length of Tillie�’s tail to the length of Millie�’s tail is 3 to 1. This means that the length of Tillie�’s tail is three times the length of Millie�’s tail or 6 units long. Billie�’s tail is one unit long; therefore, the ratio of Tillie�’s tail length to Billie�’s tail length is 6 to 1.
510
12
=5
2 521.
= 102 5
41.
=
1020
12
=105
21
=205
41
=
36
12
=3
1 521.
=6
1 541.
=
24
12
=21
21
=41
41
=
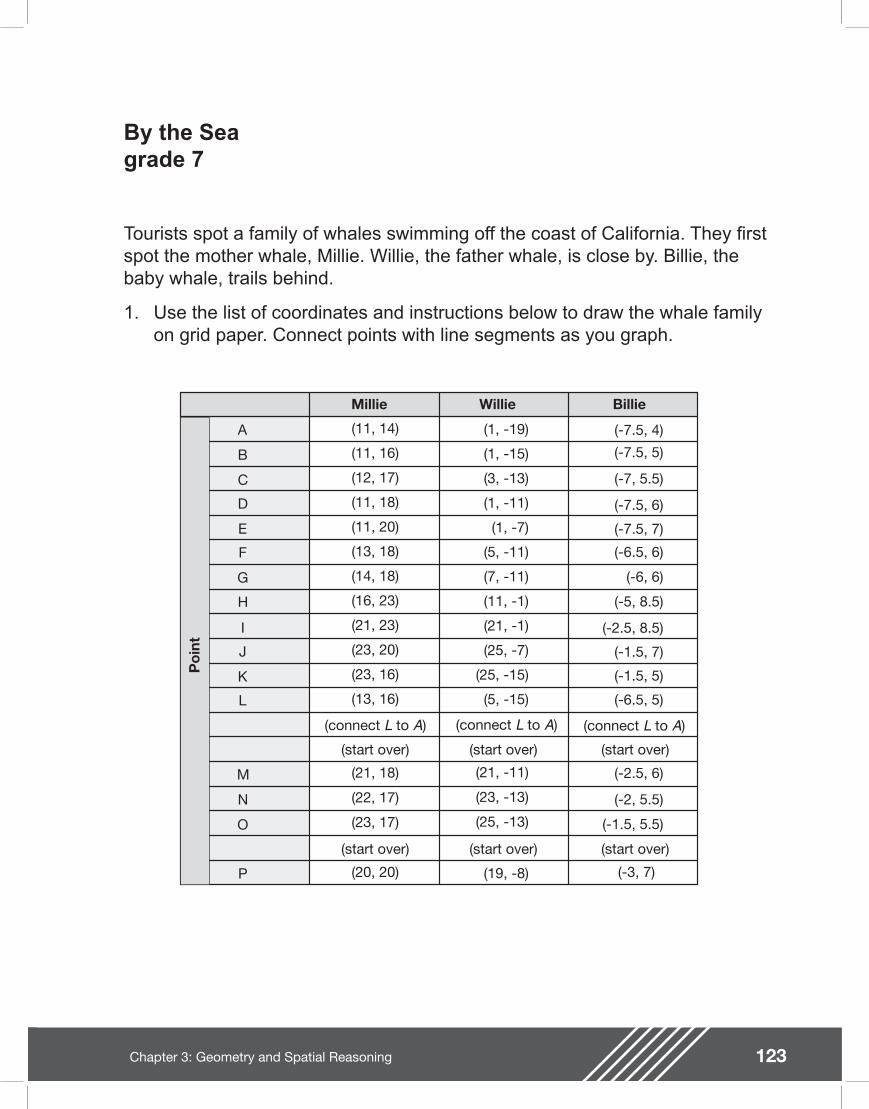
123Chapter 3: Geometry and Spatial Reasoning
By the Sea
Tourists spot a family of whales swimming off the coast of California. They rst spot the mother whale, Millie. Willie, the father whale, is close by. Billie, the baby whale, trails behind.
1. Use the list of coordinates and instructions below to draw the whale family on grid paper. Connect points with line segments as you graph.
Poi
nt
A
B
C
D
E
F
G
H
I
J
K
L
M
N
O
P
Billie
(start over)
(start over)
(-7.5, 4)
(-7.5, 5)
(-7, 5.5)
(-7.5, 6)
(-7.5, 7)
(-6.5, 6)
(-6, 6)
(-5, 8.5)
(-2.5, 8.5)
(-1.5, 7)
(-1.5, 5)
(-6.5, 5)
(-2.5, 6)
(-2, 5.5)
(-1.5, 5.5)
(-3, 7)
Willie
(start over)
(start over)
(1, -19)
(1, -15)
(3, -13)
(1, -11)
(1, -7)
(5, -11)
(7, -11)
(11, -1)
(21, -1)
(25, -7)
(25, -15)
(5, -15)
(21, -11)
(23, -13)
(25, -13)
(19, -8)
Millie
(connect L to A)
(start over)
(start over)
(11, 14)
(11, 16)
(12, 17)
(11, 18)
(11, 20)
(13, 18)
(14, 18)
(16, 23)
(21, 23)
(23, 20)
(23, 16)
(13, 16)
(21, 18)
(22, 17)
(23, 17)
(20, 20)
(connect L to A) (connect L to A)
grade 7
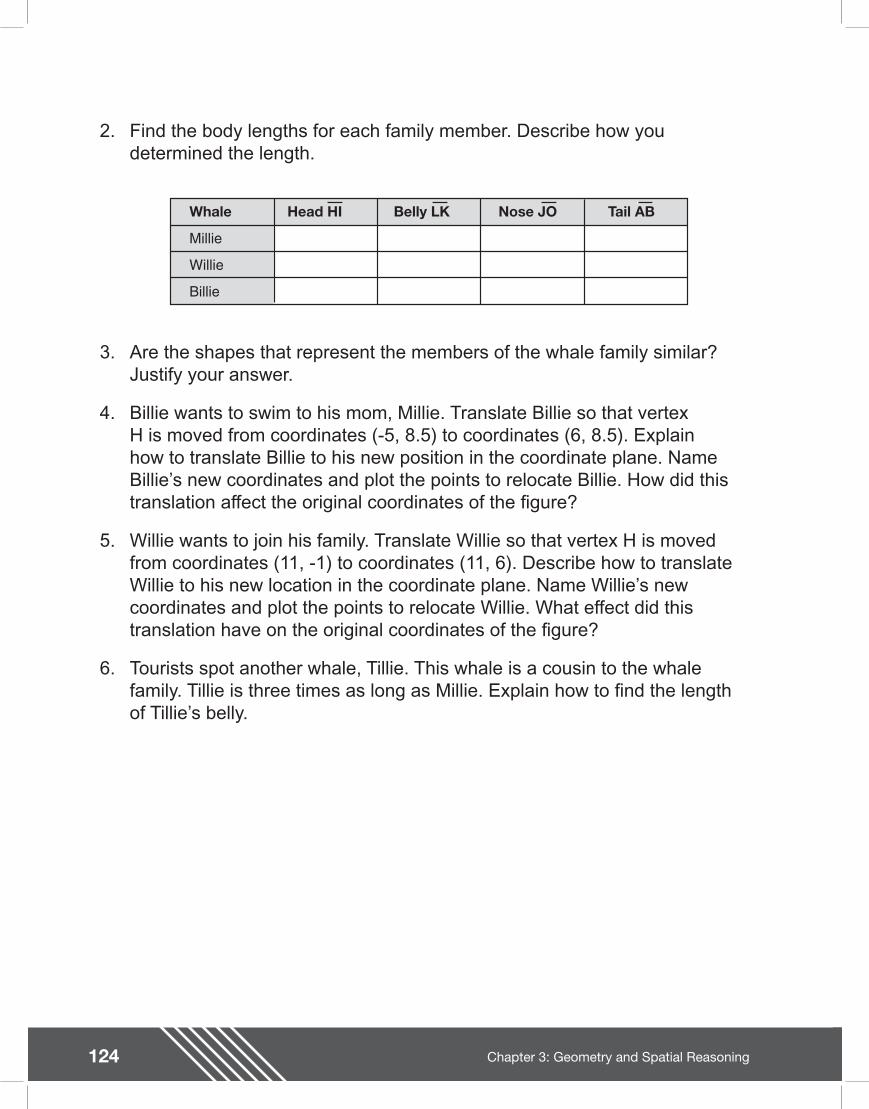
124 Chapter 3: Geometry and Spatial Reasoning
2. Find the body lengths for each family member. Describe how you determined the length.
Billie
Willie
Millie
Whale Head HI Belly LK Nose JO Tail AB
3. Are the shapes that represent the members of the whale family similar? Justify your answer.
4. Billie wants to swim to his mom, Millie. Translate Billie so that vertex H is moved from coordinates (-5, 8.5) to coordinates (6, 8.5). Explain how to translate Billie to his new position in the coordinate plane. Name Billie�’s new coordinates and plot the points to relocate Billie. How did this translation affect the original coordinates of the gure?
5. Willie wants to join his family. Translate Willie so that vertex H is moved from coordinates (11, -1) to coordinates (11, 6). Describe how to translate Willie to his new location in the coordinate plane. Name Willie�’s new coordinates and plot the points to relocate Willie. What effect did this translation have on the original coordinates of the gure?
6. Tourists spot another whale, Tillie. This whale is a cousin to the whale family. Tillie is three times as long as Millie. Explain how to nd the length of Tillie�’s belly.

125Chapter 3: Geometry and Spatial Reasoning
126 Chapter 3: Geometry and Spatial Reasoning
Teacher Notes
Materials
Calculator
Half-centimeter grid paper
Scissors
Tracing paper
Straight edge
Ruler
Strips of paper about 20 inches long and 1 inch wide
Connections to Middle School TEKS
(7.6) Geometry and spatial reasoning. The student compares and classi es shapes and solids using geometric vocabulary and properties. The student:
(D) uses critical attributes to de ne similarity
(7.7) Geometry and spatial reasoning. The student uses coordinate geometry to describe location on a plane. The student:
(A) locates and names points on a coordinate plane using ordered pairs of integers
(B) graphs translations on a coordinate plane
Scaffolding Questions
�• What makes two gures similar?
�• How could you show that two whales are similar?
�• How do corresponding angles of the whale family compare? Why?
�• How do corresponding sides of the whale family compare?
�• How do you locate ordered pairs on a coordinate graph?
�• What does it mean to translate a gure?
�• Describe how you would translate a gure 3 units to the right in the coordinate plane. How does this translation affect the coordinates (x, y) of the gure?
�• How would you translate a gure 2 units up in the coordinate plane? How does this affect the coordinates (x, y) of the gure?
�• How does a translation affect the length of the sides of a gure? The angles of a gure?
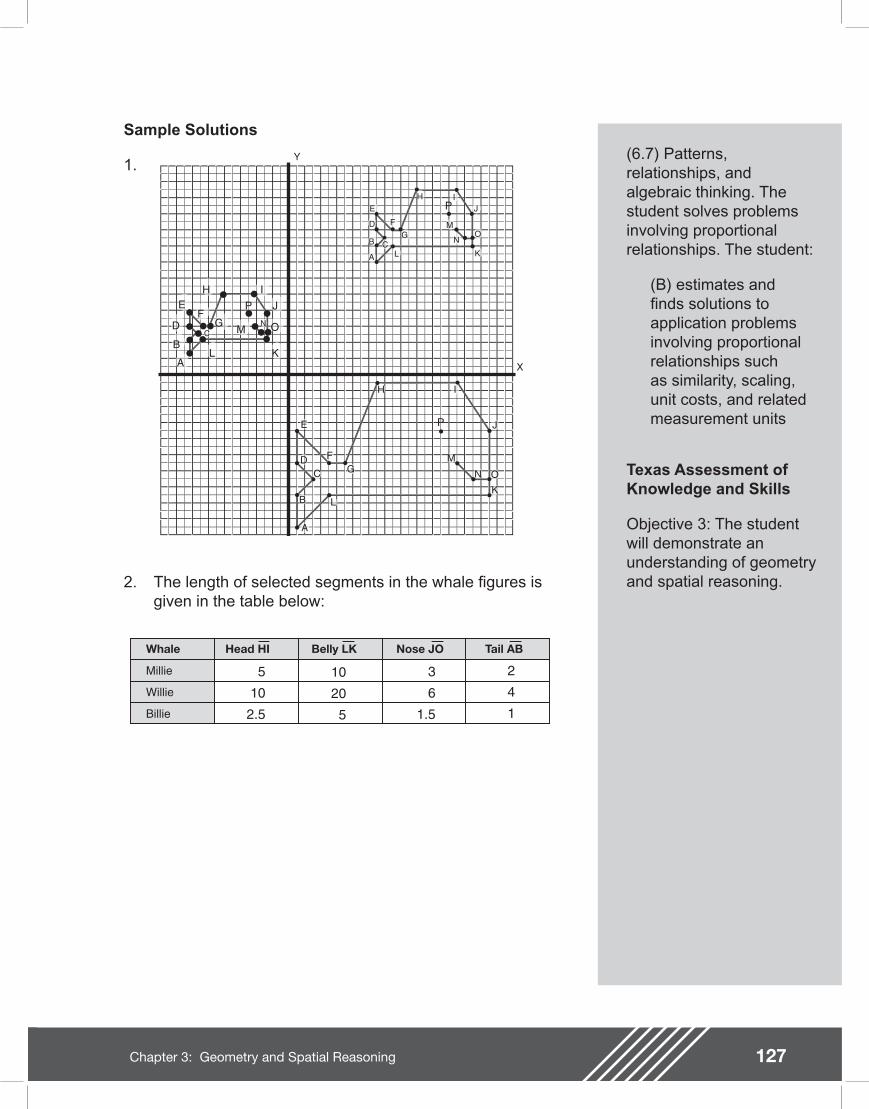
127Chapter 3: Geometry and Spatial Reasoning
(6.7) Patterns, relationships, and algebraic thinking. The student solves problems involving proportional relationships. The student:
(B) estimates and nds solutions to application problems involving proportional relationships such as similarity, scaling, unit costs, and related measurement units
Texas Assessment of Knowledge and Skills
Objective 3: The student will demonstrate an understanding of geometry and spatial reasoning.
X
Y
A
B
CD
E
FG
H I
J
KL
M
N O
A
B C
D
E
FG
H IJ
KL
M
NO
A
BC
D
EF
G
H IJP
P
P
KL
MN O
Sample Solutions
1.
2. The length of selected segments in the whale gures is given in the table below:
Billie
Willie
Millie
Whale Head HI Belly LK Nose JO Tail AB
5
10
2.5
10
20
5
3
6
1.5
2
4
1

128 Chapter 3: Geometry and Spatial Reasoning
3. The shapes of all members of the whale family are similar. The dimensions of Willie are twice the corresponding dimensions of Millie and 4 times the corresponding dimensions of Billie, as shown in the table above. The ratio of corresponding sides for any two of the whales in this family can be shown to be equivalent.
For example,
Millie�’s head length : Willie�’s head length Millie�’s belly length : Willie�’s belly length
5 : 10 10 : 20
Millie�’s nose length : Willie�’s nose length Millie�’s tail length : Willie�’s tail length
3 : 6 2 : 4
The ratios 5 : 10, 10 : 20, 3 : 6, and 2 : 4 are all equivalent to 1 : 2. A comparison of the lengths of other corresponding sides of the whale gures for Millie and Willie will also have a ratio of 1 : 2. This ratio of 1 : 2 means that all the side lengths of Millie are half the corresponding side lengths of Willie, or all the side lengths of Willie are twice the corresponding side lengths of Millie. Therefore, the corresponding sides of the two gures (Willie and Millie) are proportional.
The corresponding interior angles have the same measurement. This can be veri ed by comparing the measures of the angles using tracing paper. Trace one angle of Willie on tracing paper and place the angle over the corresponding angle of Millie. Continue this process of tracing each angle of Willie�’s gure and comparing with the corresponding angle in Millie�’s gure. Angle measurement comparisons can also be made using a protractor.
This process can be repeated for angle comparisons of Willie and Billie.
Willie�’s head length : Billie�’s head length Willie�’s belly length : Billie�’s belly length
10 : 2.5 20 : 5
Willie�’s nose length : Billie�’s nose length Willie�’s tail length : Billie�’s tail length
6 : 1.5 4 : 1
Each of these ratios is equivalent to 4 : 1. The length of a measure on Willie is four times the length of a corresponding measure on Billie.
The table below shows that the ratio of a length for Millie to a corresponding length for Billie is equivalent to 2 : 1.
Millie�’s head length : Billie�’s head length Millie�’s belly length : Billie�’s belly length
5 : 2.5 10 : 5
Millie�’s nose length : Billie�’s nose length Millie�’s tail length : Billie�’s tail length
3 : 1.5 2 : 1
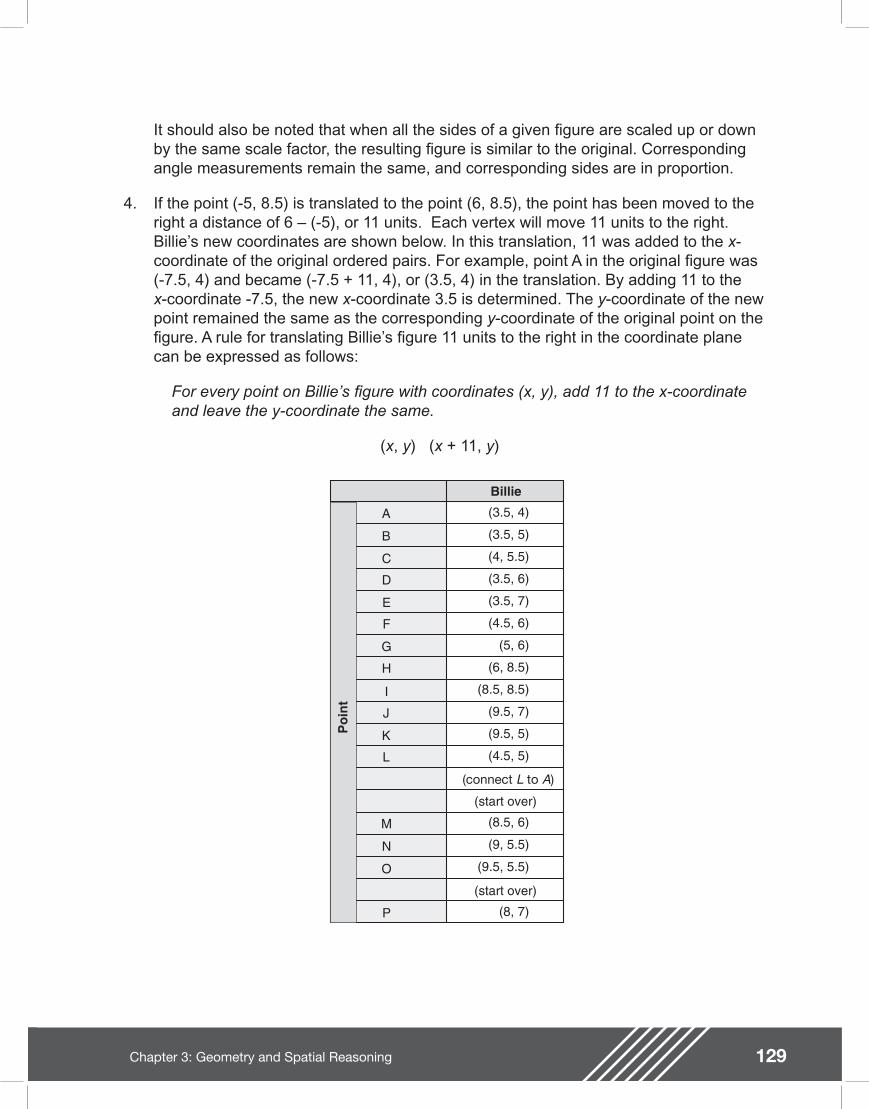
129Chapter 3: Geometry and Spatial Reasoning
It should also be noted that when all the sides of a given gure are scaled up or down by the same scale factor, the resulting gure is similar to the original. Corresponding angle measurements remain the same, and corresponding sides are in proportion.
4. If the point (-5, 8.5) is translated to the point (6, 8.5), the point has been moved to the right a distance of 6 �– (-5), or 11 units. Each vertex will move 11 units to the right. Billie�’s new coordinates are shown below. In this translation, 11 was added to the x-coordinate of the original ordered pairs. For example, point A in the original gure was (-7.5, 4) and became (-7.5 + 11, 4), or (3.5, 4) in the translation. By adding 11 to the x-coordinate -7.5, the new x-coordinate 3.5 is determined. The y-coordinate of the new point remained the same as the corresponding y-coordinate of the original point on the gure. A rule for translating Billie�’s gure 11 units to the right in the coordinate plane can be expressed as follows:
For every point on Billie�’s gure with coordinates (x, y), add 11 to the x-coordinate and leave the y-coordinate the same.
(x, y) (x + 11, y)
Poi
nt
A
B
C
D
E
F
G
H
I
J
K
L
M
N
O
P
(start over)
(start over)
(3.5, 4)
(3.5, 5)
(4, 5.5)
(3.5, 6)
(3.5, 7)
(4.5, 6)
(5, 6)
(6, 8.5)
(8.5, 8.5)
(9.5, 7)
(9.5, 5)
(4.5, 5)
(8.5, 6)
(9, 5.5)
(9.5, 5.5)
(8, 7)
(connect L to A)
Billie
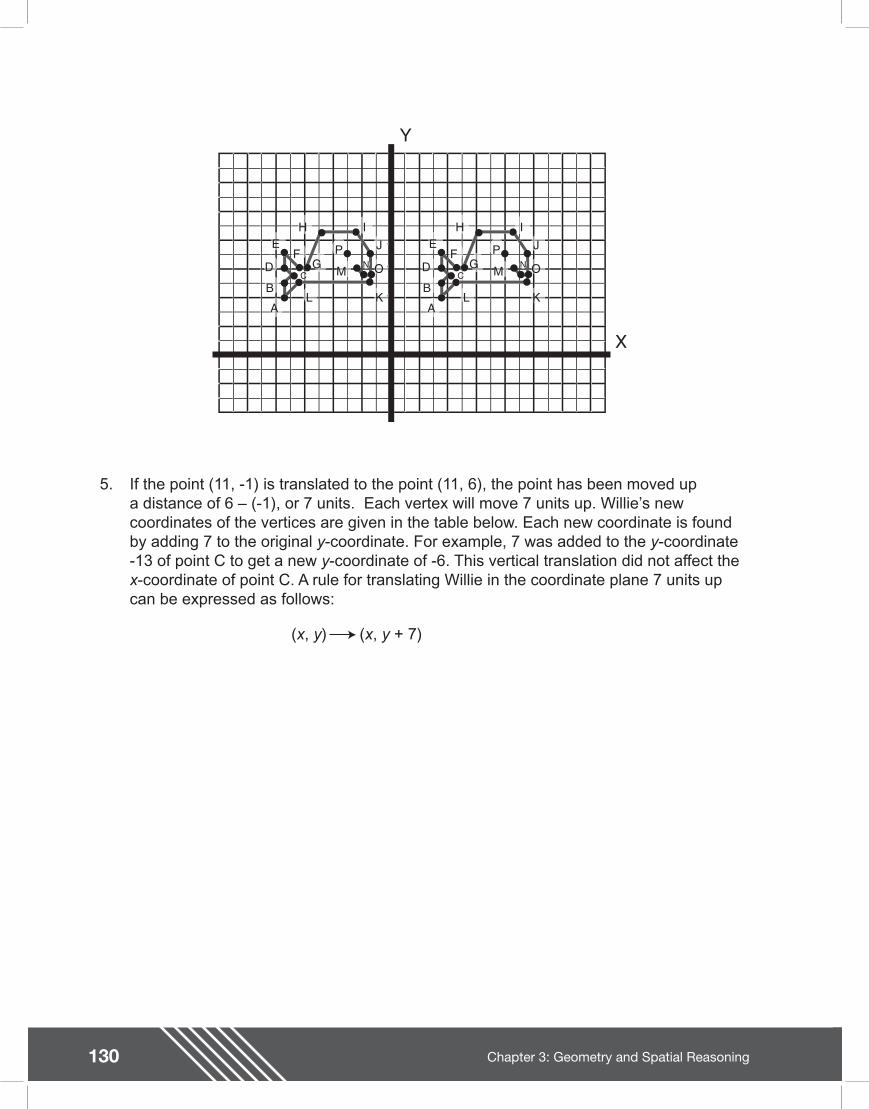
130 Chapter 3: Geometry and Spatial Reasoning
5. If the point (11, -1) is translated to the point (11, 6), the point has been moved up a distance of 6 �– (-1), or 7 units. Each vertex will move 7 units up. Willie�’s new coordinates of the vertices are given in the table below. Each new coordinate is found by adding 7 to the original y-coordinate. For example, 7 was added to the y-coordinate -13 of point C to get a new y-coordinate of -6. This vertical translation did not affect the x-coordinate of point C. A rule for translating Willie in the coordinate plane 7 units up can be expressed as follows:
(x, y) (x, y + 7)
X
Y
A
BC
D
EF
G
H IJ
KL
M
PN O
P
A
BC
D
EF
G
H IJ
KL
MN O
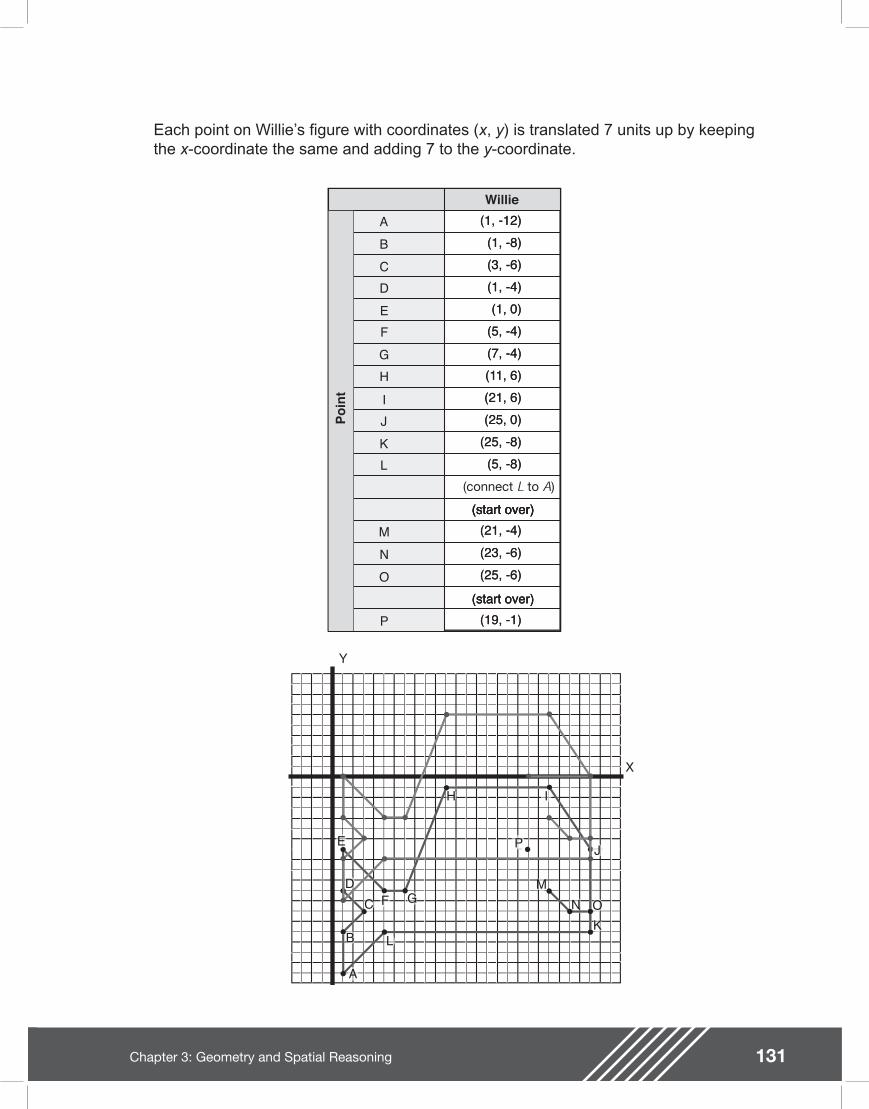
131Chapter 3: Geometry and Spatial Reasoning
Each point on Willie�’s gure with coordinates (x, y) is translated 7 units up by keeping the x-coordinate the same and adding 7 to the y-coordinate.
X
Y
A
B
C
D
E
F G
H I
J
KL
M
P
N O
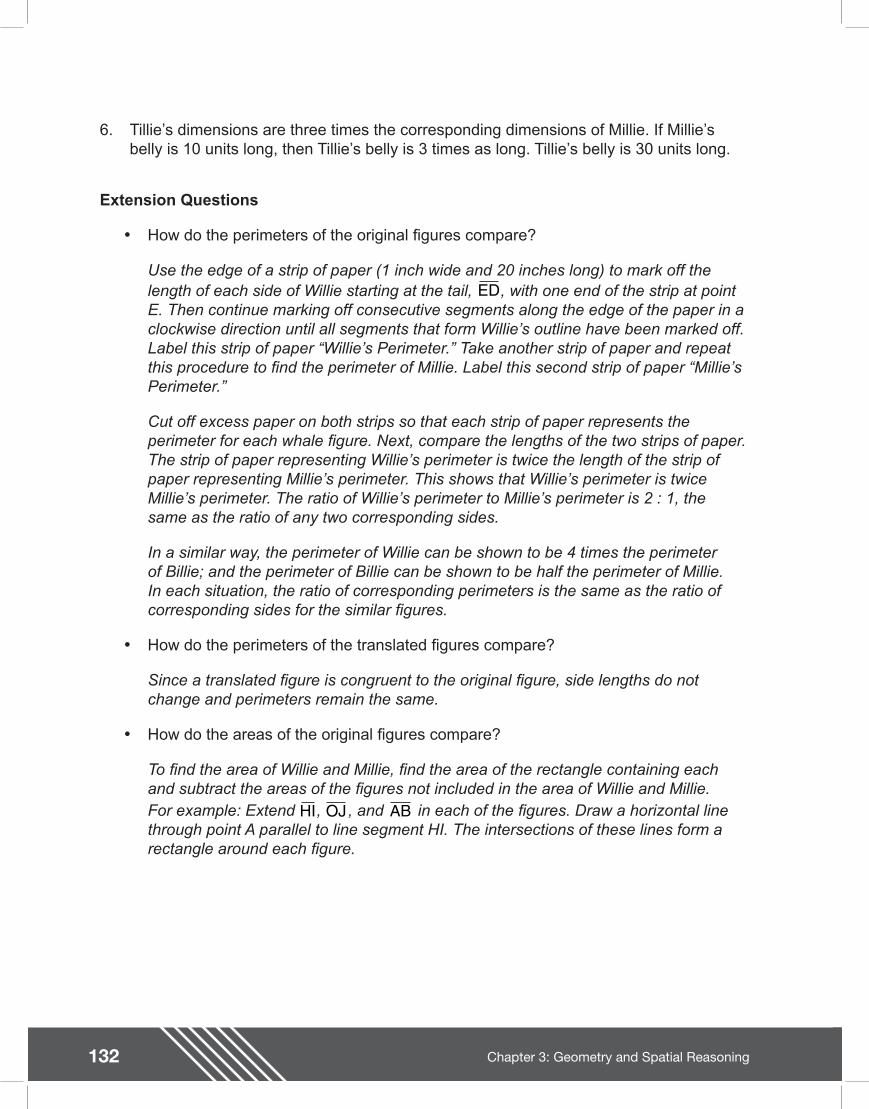
132 Chapter 3: Geometry and Spatial Reasoning
6. Tillie�’s dimensions are three times the corresponding dimensions of Millie. If Millie�’s belly is 10 units long, then Tillie�’s belly is 3 times as long. Tillie�’s belly is 30 units long.
Extension Questions
�• How do the perimeters of the original gures compare?
Use the edge of a strip of paper (1 inch wide and 20 inches long) to mark off the length of each side of Willie starting at the tail, , with one end of the strip at point E. Then continue marking off consecutive segments along the edge of the paper in a clockwise direction until all segments that form Willie�’s outline have been marked off. Label this strip of paper �“Willie�’s Perimeter.�” Take another strip of paper and repeat this procedure to nd the perimeter of Millie. Label this second strip of paper �“Millie�’s Perimeter.�”
Cut off excess paper on both strips so that each strip of paper represents the perimeter for each whale gure. Next, compare the lengths of the two strips of paper. The strip of paper representing Willie�’s perimeter is twice the length of the strip of paper representing Millie�’s perimeter. This shows that Willie�’s perimeter is twice Millie�’s perimeter. The ratio of Willie�’s perimeter to Millie�’s perimeter is 2 : 1, the same as the ratio of any two corresponding sides.
In a similar way, the perimeter of Willie can be shown to be 4 times the perimeter of Billie; and the perimeter of Billie can be shown to be half the perimeter of Millie. In each situation, the ratio of corresponding perimeters is the same as the ratio of corresponding sides for the similar gures.
�• How do the perimeters of the translated gures compare?
Since a translated gure is congruent to the original gure, side lengths do not change and perimeters remain the same.
�• How do the areas of the original gures compare?
To nd the area of Willie and Millie, nd the area of the rectangle containing each and subtract the areas of the gures not included in the area of Willie and Millie. For example: Extend , , and in each of the gures. Draw a horizontal line through point A parallel to line segment HI. The intersections of these lines form a rectangle around each gure.
ED
HI OJ AB
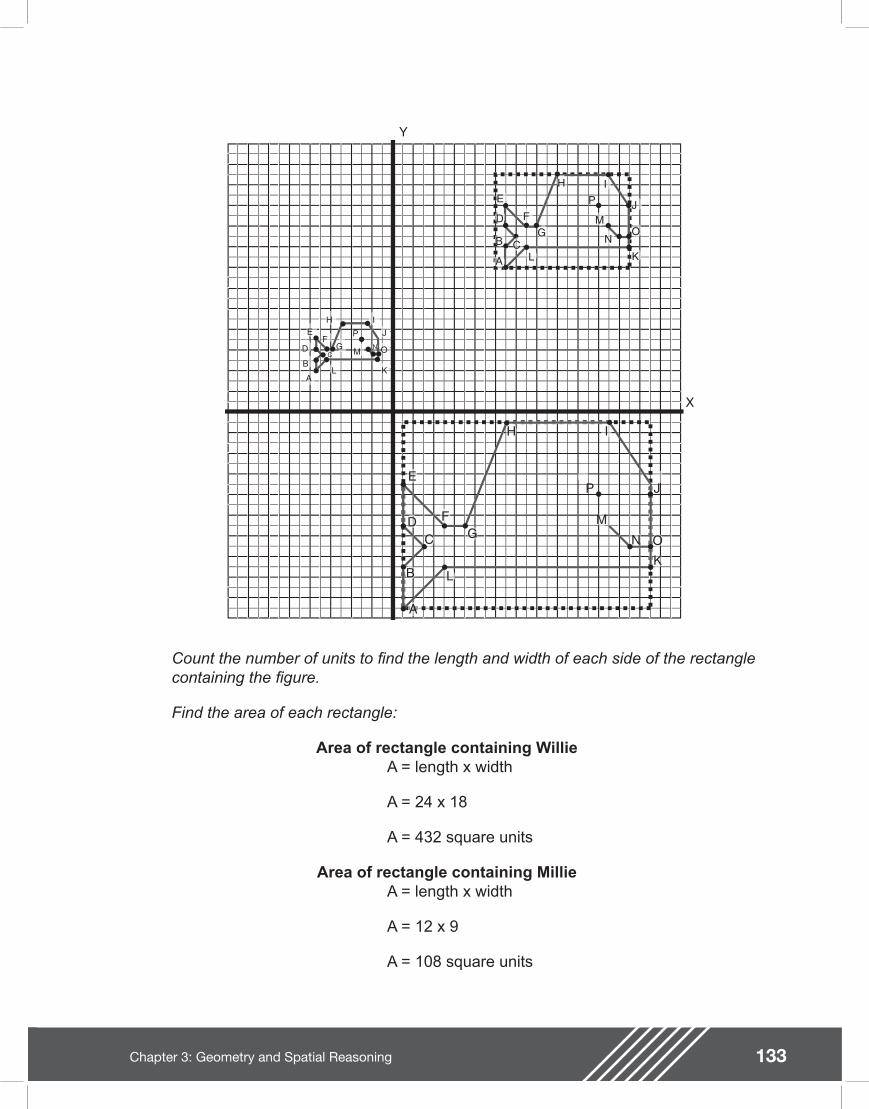
133Chapter 3: Geometry and Spatial Reasoning
Count the number of units to nd the length and width of each side of the rectangle containing the gure.
Find the area of each rectangle:
Area of rectangle containing WillieA = length x width
A = 24 x 18
A = 432 square units
Area of rectangle containing MillieA = length x width
A = 12 x 9
A = 108 square units
X
Y
A
B
CD
E
FG
H I
KL
M
P J
N O
A
B C
D
E
FG
H I
KL
M
P
NO
J
A
BC
D
EF
G
H IJ
KL
M
PN O
134 Chapter 3: Geometry and Spatial Reasoning
Next, count the squares and partial squares that are not included in the areas of Willie and Millie. Half squares may be combined to estimate a whole square. An estimate of the number of squares not included in the area of Millie is 44 and of Willie is 176. Subtract the area not included from the area of each rectangle above to nd the area of each whale gure.
Willie�’s area: 432 square units �– 176 square units = 256 square units
Millie�’s area: 108 square units �– 44 square units = 64 square units
Since 256 square units is 4 times 64 square units, Willie�’s area is 4 times the area of Millie. In a similar way, it can be shown that the area of Millie is 4 times the area of Billie and the area of Willie is 16 times the area of Billie. In each case, the ratio of the areas of two whale gures is the square of the ratio of two corresponding sides. For example, the ratio of corresponding sides for Willie and Millie is 2 : 1 and the ratio of corresponding areas is 4 : 1. The ratio of corresponding sides for Willie and Billie is 4 : 1 and the ratio of corresponding areas can be shown to be 16 : 1 or 42 : 1.
�• How do the areas of the translated gures compare?
The areas of the translated gures remain the same. This can be veri ed by tracing the original whale gure on tracing paper and placing it on top of the translated gure to check if the gures will align. The gures are the same size and shape and have the same area.
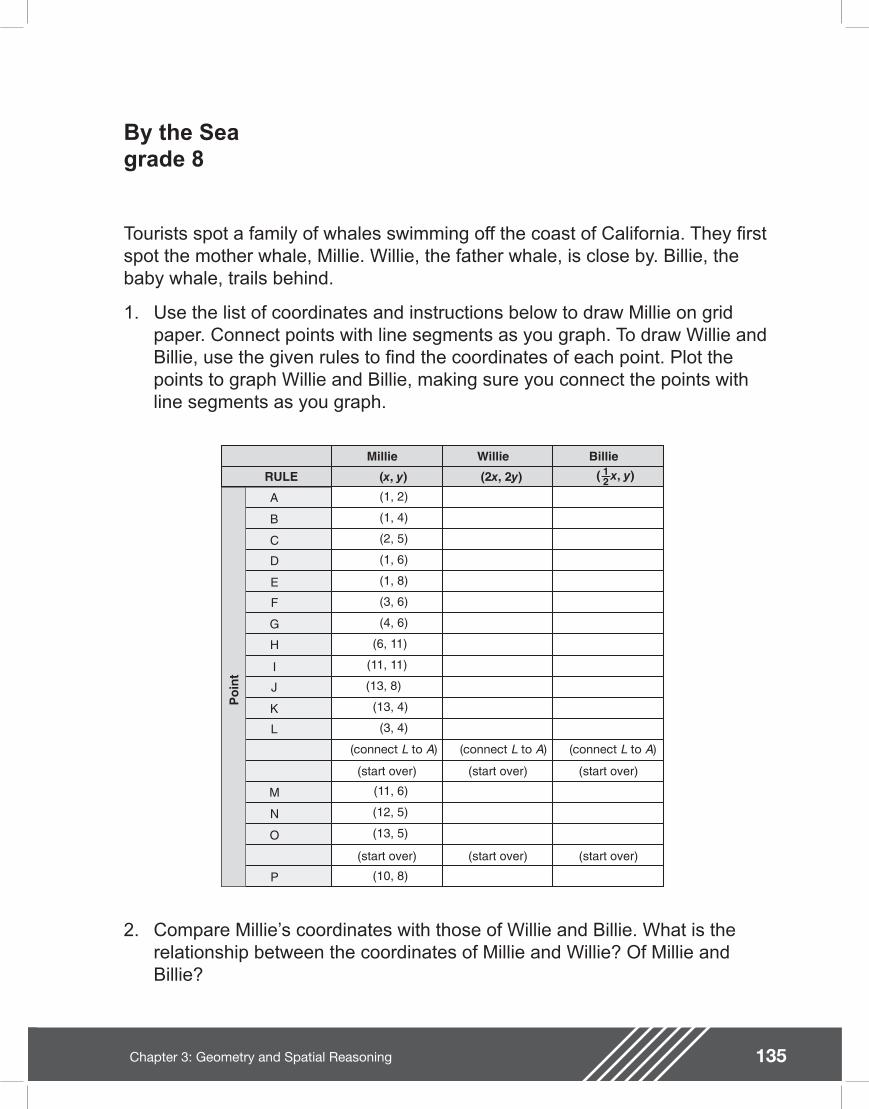
135Chapter 3: Geometry and Spatial Reasoning
By the Sea
Tourists spot a family of whales swimming off the coast of California. They rst spot the mother whale, Millie. Willie, the father whale, is close by. Billie, the baby whale, trails behind.
1. Use the list of coordinates and instructions below to draw Millie on grid paper. Connect points with line segments as you graph. To draw Willie and Billie, use the given rules to nd the coordinates of each point. Plot the points to graph Willie and Billie, making sure you connect the points with line segments as you graph.
Poi
nt
A
B
C
D
E
F
G
H
I
J
K
L
M
N
O
P
Billie
(start over)
(start over)
Willie
(start over)
(start over)
Millie
(start over)
(start over)
RULE
(1, 2)
(1, 4)
(2, 5)
(1, 6)
(1, 8)
(3, 6)
(4, 6)
(6, 11)
(11, 11)
(13, 8)
(13, 4)
(3, 4)
(11, 6)
(12, 5)
(13, 5)
(10, 8)
(x, y) (2x, 2y) ( x, y)12
(connect L to A) (connect L to A) (connect L to A)
2. Compare Millie�’s coordinates with those of Willie and Billie. What is the relationship between the coordinates of Millie and Willie? Of Millie and Billie?
grade 8
136 Chapter 3: Geometry and Spatial Reasoning
3. Compare and contrast the shapes of the three whales. What do you observe?
4. Billie becomes playful and does ips in the water. Re ect Billie using the x-axis as the line of re ection and list the new coordinates. How do these coordinates compare with the original coordinates? Write a rule in words and symbols that re ects a point with coordinates (x, y) about the x-axis.
5. Billie continues to play. Now re ect Billie using the y-axis as the line of re ection and list the new coordinates. How do these new coordinates compare with the previous coordinates? Write a rule in words and symbols for a re ection of a point with coordinates (x, y) about the y-axis.

137Chapter 3: Geometry and Spatial Reasoning
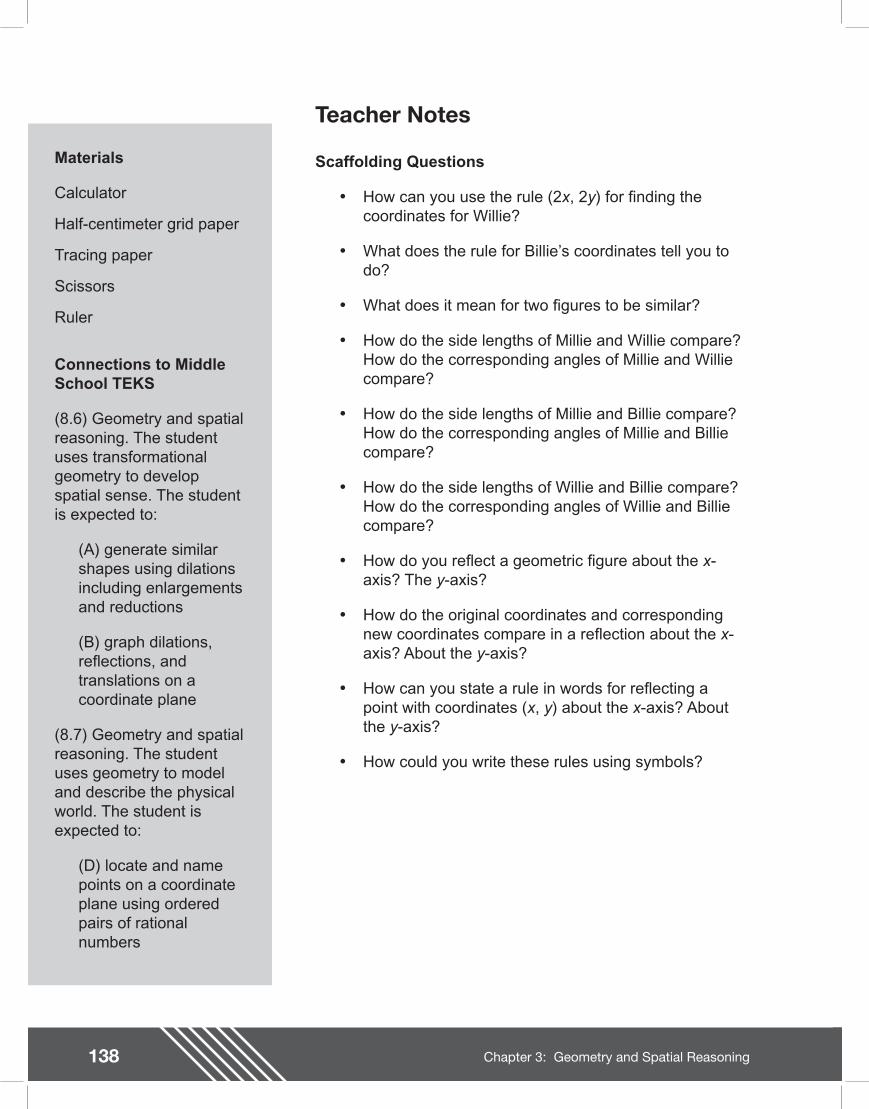
138 Chapter 3: Geometry and Spatial Reasoning
Teacher Notes
Materials
Calculator
Half-centimeter grid paper
Tracing paper
Scissors
Ruler
Connections to Middle School TEKS
(8.6) Geometry and spatial reasoning. The student uses transformational geometry to develop spatial sense. The student is expected to:
(A) generate similar shapes using dilations including enlargements and reductions
(B) graph dilations, re ections, and translations on a coordinate plane
(8.7) Geometry and spatial reasoning. The student uses geometry to model and describe the physical world. The student is expected to:
(D) locate and name points on a coordinate plane using ordered pairs of rational numbers
Scaffolding Questions
�• How can you use the rule (2x, 2y) for nding the coordinates for Willie?
�• What does the rule for Billie�’s coordinates tell you to do?
�• What does it mean for two gures to be similar?
�• How do the side lengths of Millie and Willie compare? How do the corresponding angles of Millie and Willie compare?
�• How do the side lengths of Millie and Billie compare? How do the corresponding angles of Millie and Billie compare?
�• How do the side lengths of Willie and Billie compare? How do the corresponding angles of Willie and Billie compare?
�• How do you re ect a geometric gure about the x-axis? The y-axis?
�• How do the original coordinates and corresponding new coordinates compare in a re ection about the x-axis? About the y-axis?
�• How can you state a rule in words for re ecting a point with coordinates (x, y) about the x-axis? About the y-axis?
�• How could you write these rules using symbols?

139Chapter 3: Geometry and Spatial Reasoning
(8.9) Measurement. The student uses indirect measurements to solve problems. The student is expected to:
(A) use the Pythagorean Theorem to solve real-life problems
Texas Assessment of Knowledge and Skills
Objective 3: The student will demonstrate an understanding of geometry and spatial reasoning.
Sample Solutions
1.P
oint
A
B
C
D
E
F
G
H
I
J
K
L
M
N
O
P
Billie
(start over)
(start over)
Willie
(start over)
(start over)
Millie
(start over)
(start over)
RULE
(1, 2)
(1, 4)
(2, 5)
(1, 6)
(1, 8)
(3, 6)
(4, 6)
(6, 11)
(11, 11)
(13, 8)
(13, 4)
(3, 4)
(11, 6)
(12, 5)
(13, 5)
(10, 8)
(x, y) (2x, 2y)
(2, 4)
(2, 8)
(4, 10)
(2, 12)
(2, 16)
(6, 12)
(8, 12)
(12, 22)
(22, 22)
(26, 16)
(26, 8)
(6, 8)
(22, 12)
(24, 10)
(26, 10)
(20, 16)
( x, y)12
(.5, 2)
(.5, 4)
(1, 5)
(.5, 6)
(.5, 8)
(1.5, 6)
(2, 6)
(3, 11)
(5.5, 11)
(6.5, 8)
(6.5, 4)
(1.5, 4)
(5.5, 6)
(6, 5)
(6.5, 5)
(5, 8)
(connect L to A) (connect L to A) (connect L to A)
A
B C
D
E
FG
H IJ
K
L
M
P
NO
MILLIE
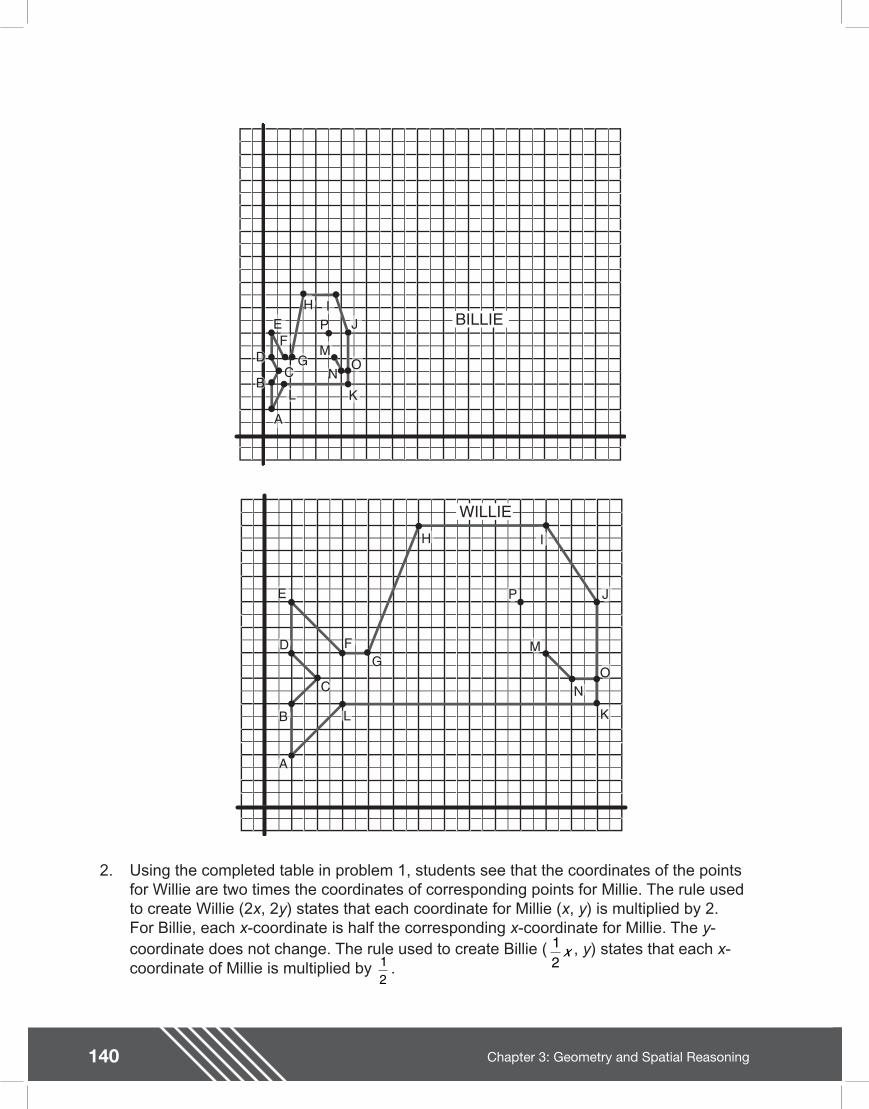
140 Chapter 3: Geometry and Spatial Reasoning
2. Using the completed table in problem 1, students see that the coordinates of the points for Willie are two times the coordinates of corresponding points for Millie. The rule used to create Willie (2x, 2y) states that each coordinate for Millie (x, y) is multiplied by 2. For Billie, each x-coordinate is half the corresponding x-coordinate for Millie. The y-coordinate does not change. The rule used to create Billie ( , y) states that each x-coordinate of Millie is multiplied by .
A
BC
D
EF
G
H IJP
KL
M
NO
BILLIE
A
B
C
D
E
FG
H I
JP
KL
M
NO
WILLIE
12
x12
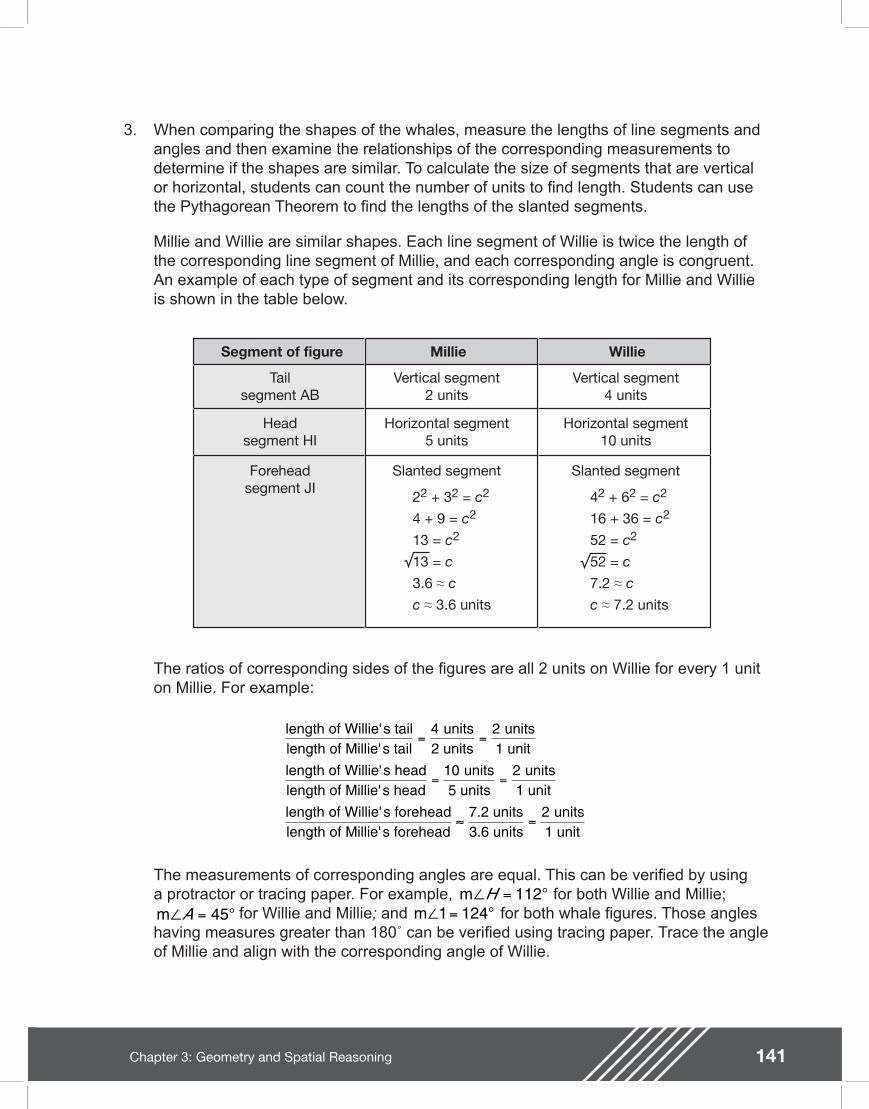
141Chapter 3: Geometry and Spatial Reasoning
3. When comparing the shapes of the whales, measure the lengths of line segments and angles and then examine the relationships of the corresponding measurements to determine if the shapes are similar. To calculate the size of segments that are vertical or horizontal, students can count the number of units to nd length. Students can use the Pythagorean Theorem to nd the lengths of the slanted segments.
Millie and Willie are similar shapes. Each line segment of Willie is twice the length of the corresponding line segment of Millie, and each corresponding angle is congruent. An example of each type of segment and its corresponding length for Millie and Willie is shown in the table below.
Segment of figure Millie Willie
Tailsegment AB
Headsegment HI
Foreheadsegment JI
Vertical segment2 units
Vertical segment4 units
Horizontal segment10 units
Horizontal segment5 units
Slanted segment Slanted segment
22 + 32 = c2
4 + 9 = c2
13 = c2
13 = c3.6 cc 3.6 units
42 + 62 = c2
16 + 36 = c2
52 = c2
52 = c7.2 cc 7.2 units
The ratios of corresponding sides of the gures are all 2 units on Willie for every 1 unit on Millie. For example:
The measurements of corresponding angles are equal. This can be veri ed by using a protractor or tracing paper. For example, for both Willie and Millie;
for Willie and Millie; and for both whale gures. Those angles having measures greater than 180 can be veri ed using tracing paper. Trace the angle of Millie and align with the corresponding angle of Willie.
length of Willie' s taillength of Millie's tail
units2 units
units1 unit
length of Willie' s headlength of Millie's head
units5 units
units1 unit
length of Willie' s foreheadlength of Millie's forehead
7.2 units3.6 units
units1 unit
= =
= =
=
4 2
10 2
2
m = °H 112m = °A 45 m = °1 124
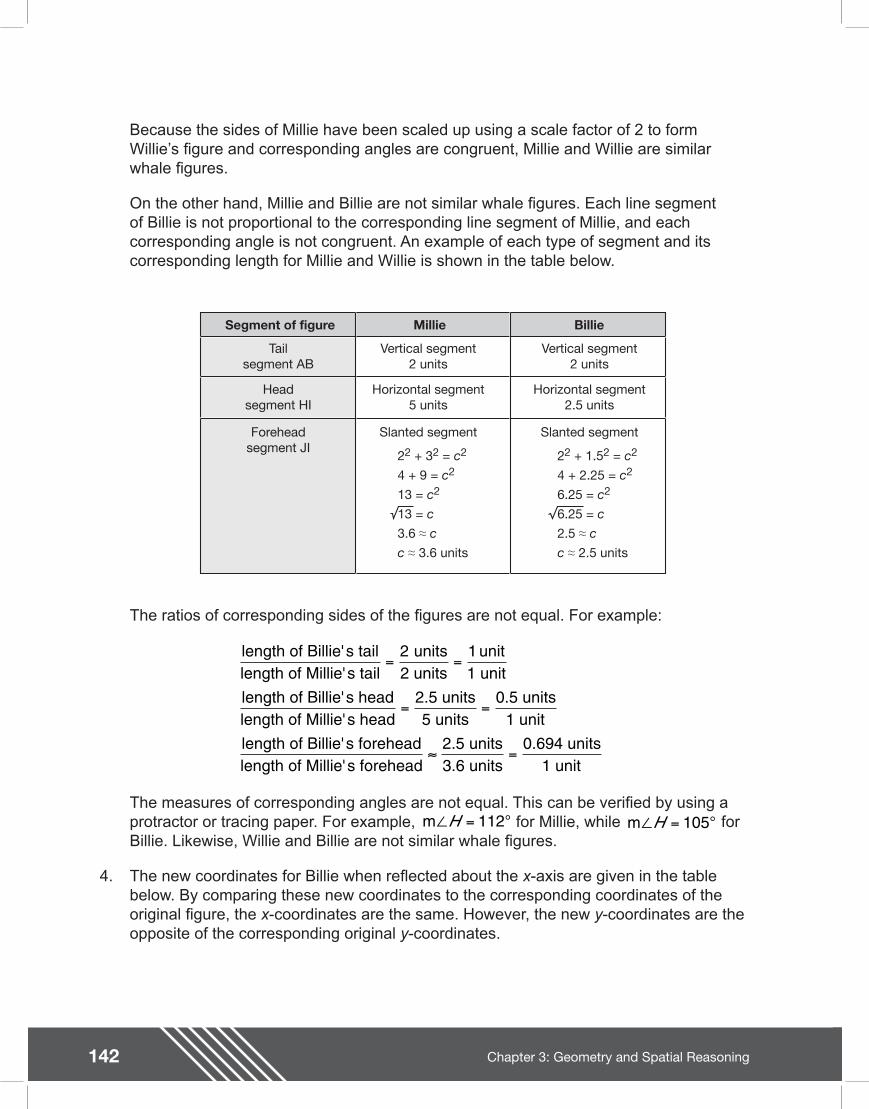
142 Chapter 3: Geometry and Spatial Reasoning
Because the sides of Millie have been scaled up using a scale factor of 2 to form Willie�’s gure and corresponding angles are congruent, Millie and Willie are similar whale gures.
On the other hand, Millie and Billie are not similar whale gures. Each line segment of Billie is not proportional to the corresponding line segment of Millie, and each corresponding angle is not congruent. An example of each type of segment and its corresponding length for Millie and Willie is shown in the table below.
Segment of figure Millie Billie
Tailsegment AB
Headsegment HI
Foreheadsegment JI
Vertical segment2 units
Vertical segment2 units
Horizontal segment2.5 units
Horizontal segment5 units
Slanted segment Slanted segment
22 + 32 = c2
4 + 9 = c2
13 = c2
13 = c3.6 cc 3.6 units
22 + 1.52 = c2
4 + 2.25 = c2
6.25 = c2
6.25 = c2.5 cc 2.5 units
The ratios of corresponding sides of the gures are not equal. For example:
The measures of corresponding angles are not equal. This can be veri ed by using a protractor or tracing paper. For example, for Millie, while for Billie. Likewise, Willie and Billie are not similar whale gures.
4. The new coordinates for Billie when re ected about the x-axis are given in the table below. By comparing these new coordinates to the corresponding coordinates of the original gure, the x-coordinates are the same. However, the new y-coordinates are the opposite of the corresponding original y-coordinates.
length of Billie' s taillength of Millie's tail
units2 units
unit1 unit
length of Billie' s headlength of Millie's head
.5 units5 units
.5 units1 unit
length of Billie' s foreheadlength of Millie's forehead
2.5 units3.6 units
.694 units1 unit
= =
= =
=
2 1
2 0
0
m = °H 112 m = °H 105
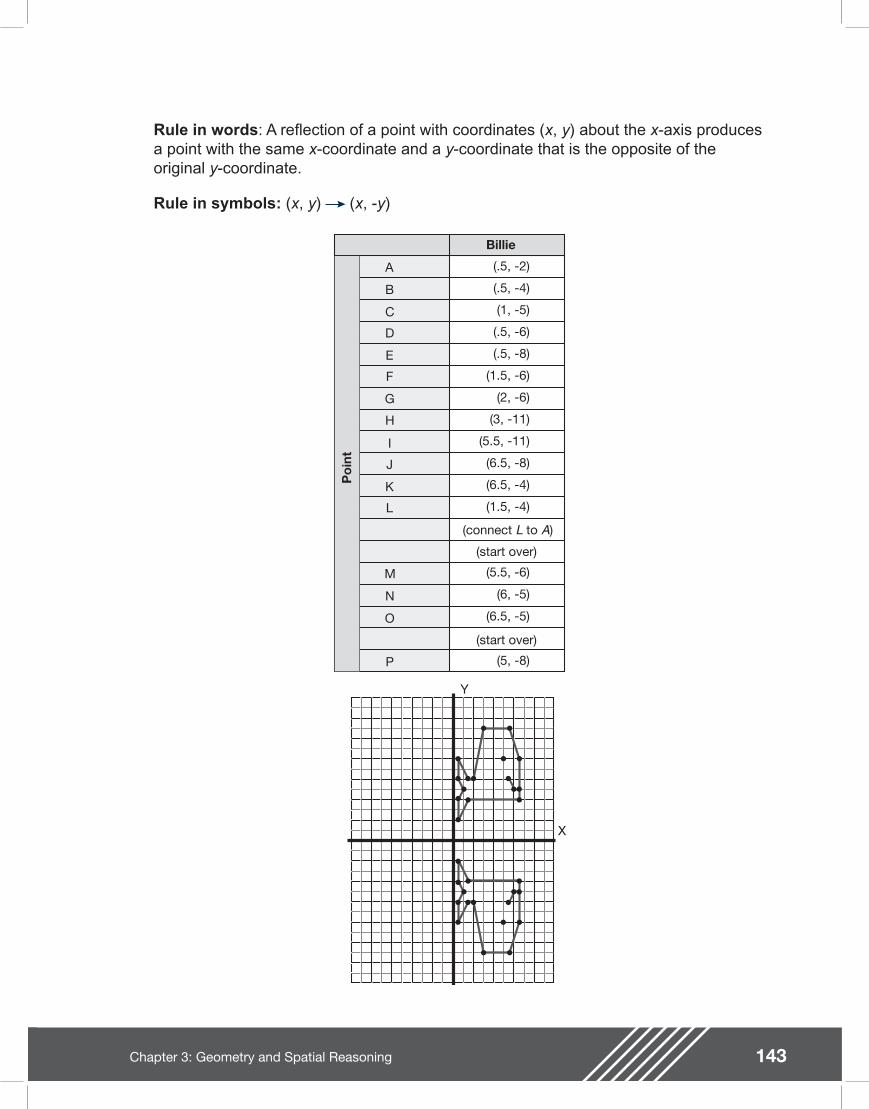
143Chapter 3: Geometry and Spatial Reasoning
Rule in words: A re ection of a point with coordinates (x, y) about the x-axis produces a point with the same x-coordinate and a y-coordinate that is the opposite of the original y-coordinate.
Rule in symbols: (x, y) (x, -y)
Poi
nt
A
B
C
D
E
F
G
H
I
J
K
L
M
N
O
P
(connect L to A)
(start over)
(start over)
(.5, -2)
(.5, -4)
(1, -5)
(.5, -6)
(.5, -8)
(1.5, -6)
(2, -6)
(3, -11)
(5.5, -11)
(6.5, -8)
(6.5, -4)
(1.5, -4)
(5.5, -6)
(6, -5)
(6.5, -5)
(5, -8)
Billie
X
Y
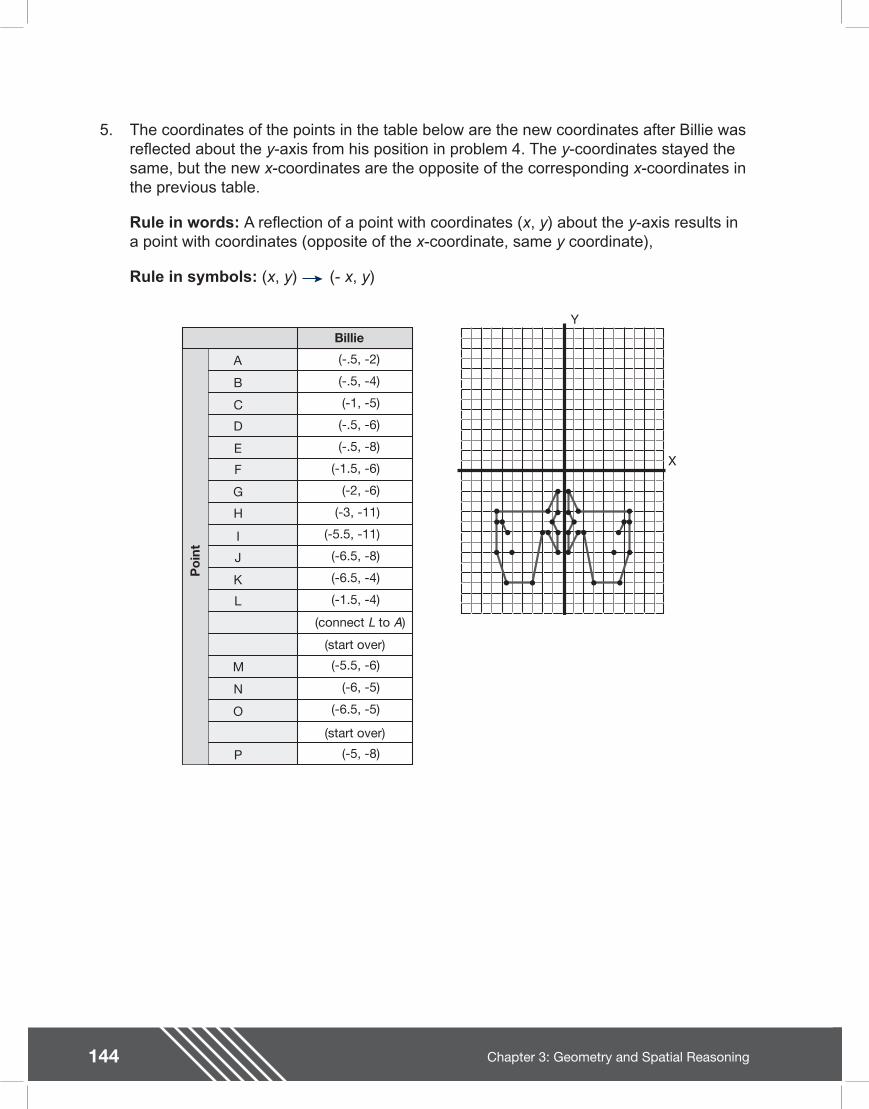
144 Chapter 3: Geometry and Spatial Reasoning
5. The coordinates of the points in the table below are the new coordinates after Billie was re ected about the y-axis from his position in problem 4. The y-coordinates stayed the same, but the new x-coordinates are the opposite of the corresponding x-coordinates in the previous table.
Rule in words: A re ection of a point with coordinates (x, y) about the y-axis results in a point with coordinates (opposite of the x-coordinate, same y coordinate),
Rule in symbols: (x, y) (- x, y)
Poi
nt
A
B
C
D
E
F
G
H
I
J
K
L
M
N
O
P
(start over)
(start over)
(-.5, -2)
(-.5, -4)
(-1, -5)
(-.5, -6)
(-.5, -8)
(-1.5, -6)
(-2, -6)
(-3, -11)
(-5.5, -11)
(-6.5, -8)
(-6.5, -4)
(-1.5, -4)
(-5.5, -6)
(-6, -5)
(-6.5, -5)
(-5, -8)
Billie
(connect L to A)
X
Y
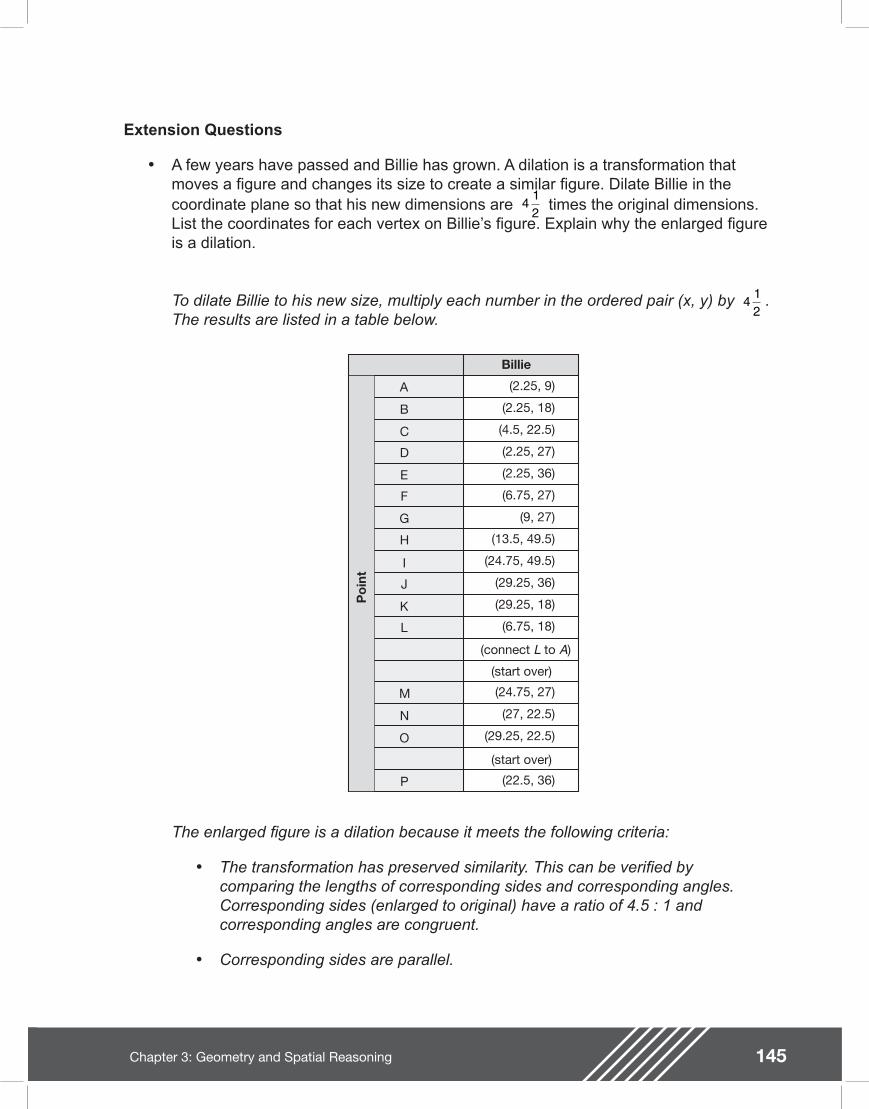
145Chapter 3: Geometry and Spatial Reasoning
Extension Questions
�• A few years have passed and Billie has grown. A dilation is a transformation that moves a gure and changes its size to create a similar gure. Dilate Billie in the coordinate plane so that his new dimensions are times the original dimensions. List the coordinates for each vertex on Billie�’s gure. Explain why the enlarged gure is a dilation.
To dilate Billie to his new size, multiply each number in the ordered pair (x, y) by . The results are listed in a table below.
412
412
Poi
nt
A
B
C
D
E
F
G
H
I
J
K
L
M
N
O
P
(start over)
(start over)
(2.25, 9)
(2.25, 18)
(4.5, 22.5)
(2.25, 27)
(2.25, 36)
(6.75, 27)
(9, 27)
(13.5, 49.5)
(24.75, 49.5)
(29.25, 36)
(29.25, 18)
(6.75, 18)
(24.75, 27)
(27, 22.5)
(29.25, 22.5)
(22.5, 36)
Billie
(connect L to A)
The enlarged gure is a dilation because it meets the following criteria:
�• The transformation has preserved similarity. This can be veri ed by comparing the lengths of corresponding sides and corresponding angles. Corresponding sides (enlarged to original) have a ratio of 4.5 : 1 and corresponding angles are congruent.
�• Corresponding sides are parallel.
146 Chapter 3: Geometry and Spatial Reasoning
�• Since this transformation is not a translation, there is a center of dilation. In this case, the center of dilation is at (0, 0). This can be determined by drawing lines through corresponding vertices. These lines all intersect at the center of dilation.
�• Each side has been enlarged by a scale factor of .
�• Orientation of the gures is the same.
�• Describe how this transformation has affected the perimeter and area of the original gure.
Perimeter: Since Billie�’s gure has been scaled up by a factor of 4.5, the enlarged gure is similar to the original gure, and the ratio of corresponding sides (enlarged to original) is 4.5 : 1. This ratio is the same as the ratio of corresponding perimeters. Therefore, the ratio of corresponding perimeters (enlarged gure to original gure) is 4.5 : 1.
Area: Since the enlarged gure formed by the dilation is similar to the original gure, the ratio of the areas (enlarged to original) is the square of the ratio of corresponding sides. The ratio of the area of the enlarged gure to the area of the original gure is (4.5)2 : 12 or 20.5 : 1.
412
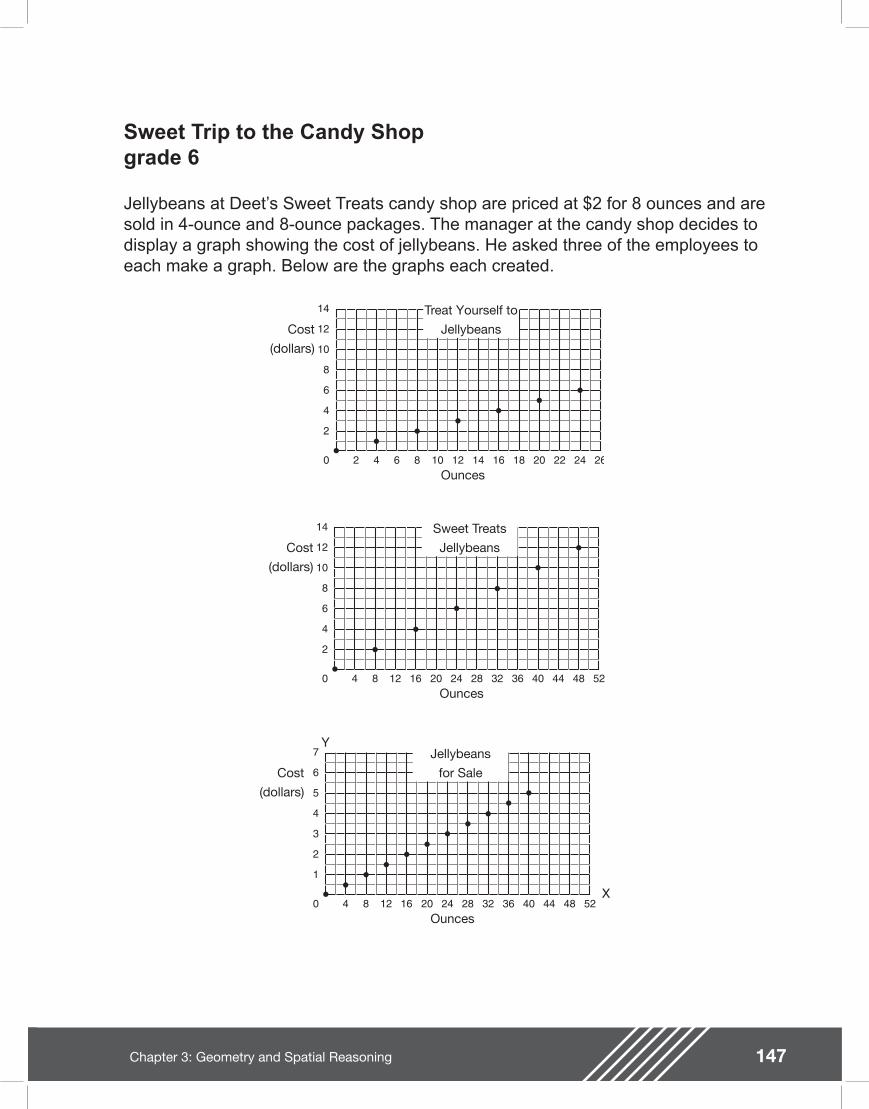
147Chapter 3: Geometry and Spatial Reasoning
Sweet Trip to the Candy Shopgrade 6
Jellybeans at Deet�’s Sweet Treats candy shop are priced at $2 for 8 ounces and are sold in 4-ounce and 8-ounce packages. The manager at the candy shop decides to display a graph showing the cost of jellybeans. He asked three of the employees to each make a graph. Below are the graphs each created.
6
2
4
12
8
10
14
62 4 128 10 1814 16 2420 22 260Ounces
Cost
(dollars)
Treat Yourself to
Jellybeans
6
2
4
12
8
10
14
124 8 2416 20 3628 32 4840 44 520Ounces
Cost
(dollars)
Sweet Treats
Jellybeans
3
1
2
6
4
5
7
124 8 2416 20 3628 32 4840 44 520X
Y
Ounces
Cost
(dollars)
Jellybeans
for Sale
148 Chapter 3: Geometry and Spatial Reasoning
1. What is being shown to the customer in each graph?
2. The manager wants to display the best graph for his customers. Make recommendations about each graph.
3. To help clerks sell jellybeans, create a price guide for up to 4 pounds and justify your reasoning.
4. Using 4-ounce and 8-ounce packages, how many different ways can you purchase 4 pounds of jellybeans? Explain.

149Chapter 3: Geometry and Spatial Reasoning

150 Chapter 3: Geometry and Spatial Reasoning
Teacher NotesMaterials
Calculator
Straight edge
Connections to Middle School TEKS
(6.7) Geometry and spatial reasoning. The student uses coordinate geometry to identify location in two dimensions.
(6.12) Underlying processes and mathematical tools. The student communicates about Grade 6 mathematics through informal and mathematical language, representations, and models. The student is expected to:
(A) communicate mathematical ideas using language, ef cient tools, appropriate units, and graphical, numerical, physical, or algebraic mathematical models
(B) evaluate the effectiveness of different representations to communicate ideas
Scaffolding Questions
�• What is the scale of the horizontal axis shown on each graph?
�• What will the point (16, 4) mean on the Sweet Treats Jellybeans graph?
�• What does each graph show about the cost of jellybeans as the number of ounces increases?
�• What is the cost of 16 ounces of jellybeans on each graph? 24 ounces? 48 ounces?
�• How many ounces of jellybeans will a customer be able to purchase with $2? $4? $5?
�• What is the relationship between the number of ounces of jellybeans and the cost in dollars?
�• If a customer purchases 24 ounces of jellybeans, how can you nd the number of 4-ounce packages he or she can buy? How many 8-ounce packages? How many combinations of 4-ounce and 8-ounce packages?
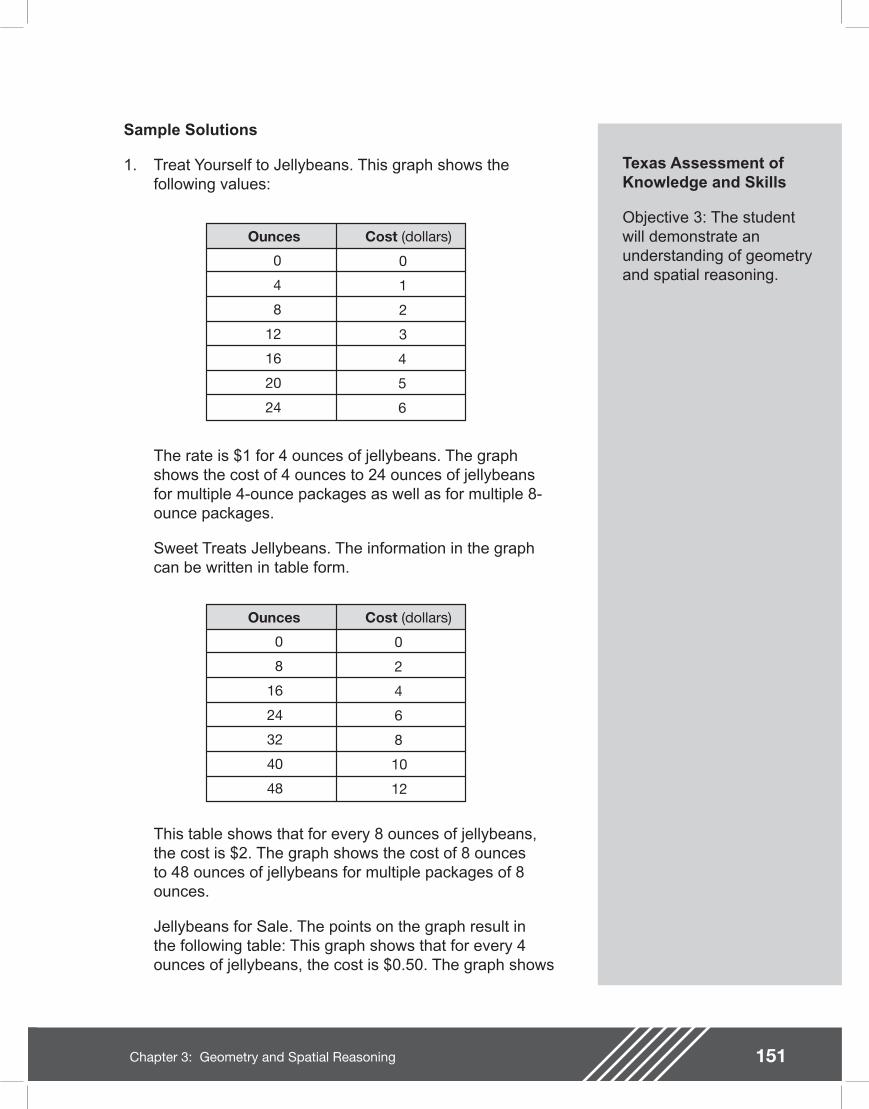
151Chapter 3: Geometry and Spatial Reasoning
Texas Assessment of Knowledge and Skills
Objective 3: The student will demonstrate an understanding of geometry and spatial reasoning.
Sample Solutions
1. Treat Yourself to Jellybeans. This graph shows the following values:
Cost (dollars)Ounces
0
4
8
12
16
20
24
0
1
2
3
4
5
6
The rate is $1 for 4 ounces of jellybeans. The graph shows the cost of 4 ounces to 24 ounces of jellybeans for multiple 4-ounce packages as well as for multiple 8-ounce packages.
Sweet Treats Jellybeans. The information in the graph can be written in table form.
Cost (dollars)Ounces
0
8
16
24
32
40
48
0
2
4
6
8
10
12
This table shows that for every 8 ounces of jellybeans, the cost is $2. The graph shows the cost of 8 ounces to 48 ounces of jellybeans for multiple packages of 8 ounces.
Jellybeans for Sale. The points on the graph result in the following table: This graph shows that for every 4 ounces of jellybeans, the cost is $0.50. The graph shows
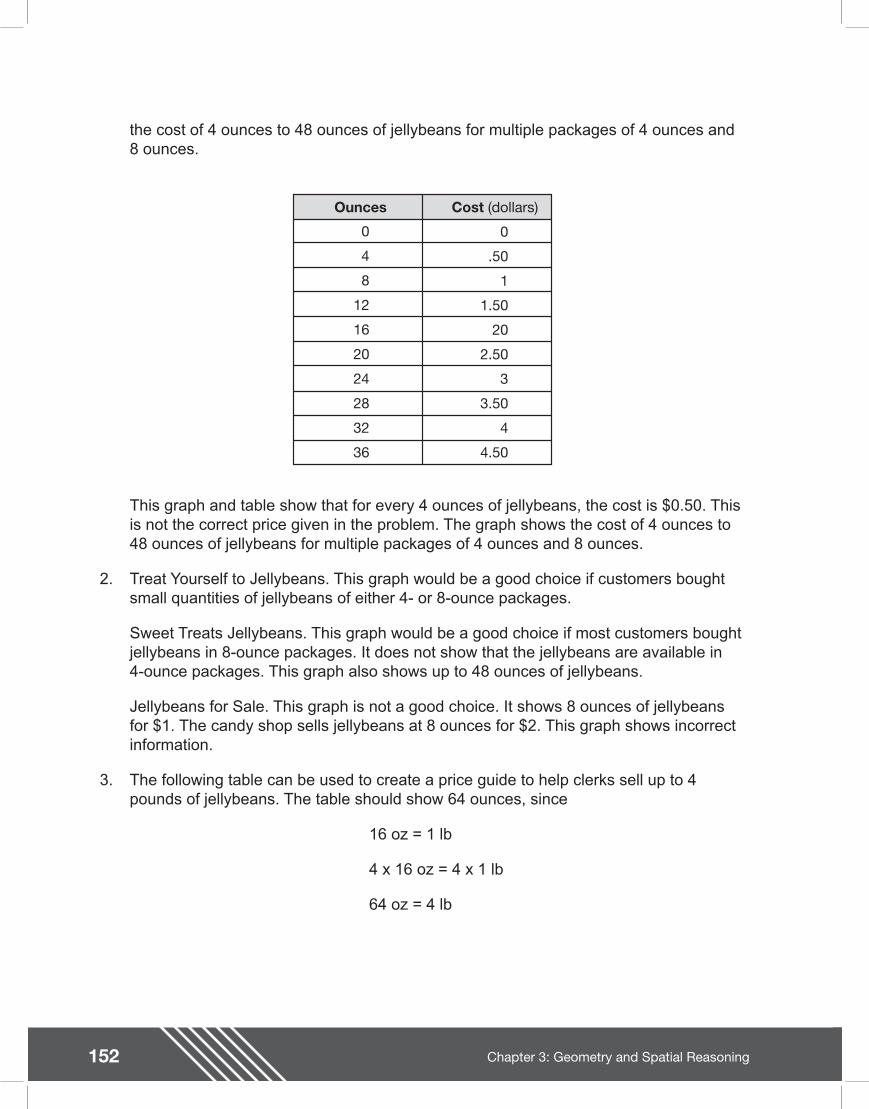
152 Chapter 3: Geometry and Spatial Reasoning
the cost of 4 ounces to 48 ounces of jellybeans for multiple packages of 4 ounces and 8 ounces.
Cost (dollars)Ounces
0
4
8
12
16
20
24
0
.50
1
1.50
20
2.50
3
28
32
36
3.50
4
4.50
This graph and table show that for every 4 ounces of jellybeans, the cost is $0.50. This is not the correct price given in the problem. The graph shows the cost of 4 ounces to 48 ounces of jellybeans for multiple packages of 4 ounces and 8 ounces.
2. Treat Yourself to Jellybeans. This graph would be a good choice if customers bought small quantities of jellybeans of either 4- or 8-ounce packages.
Sweet Treats Jellybeans. This graph would be a good choice if most customers bought jellybeans in 8-ounce packages. It does not show that the jellybeans are available in 4-ounce packages. This graph also shows up to 48 ounces of jellybeans.
Jellybeans for Sale. This graph is not a good choice. It shows 8 ounces of jellybeans for $1. The candy shop sells jellybeans at 8 ounces for $2. This graph shows incorrect information.
3. The following table can be used to create a price guide to help clerks sell up to 4 pounds of jellybeans. The table should show 64 ounces, since
16 oz = 1 lb
4 x 16 oz = 4 x 1 lb
64 oz = 4 lb
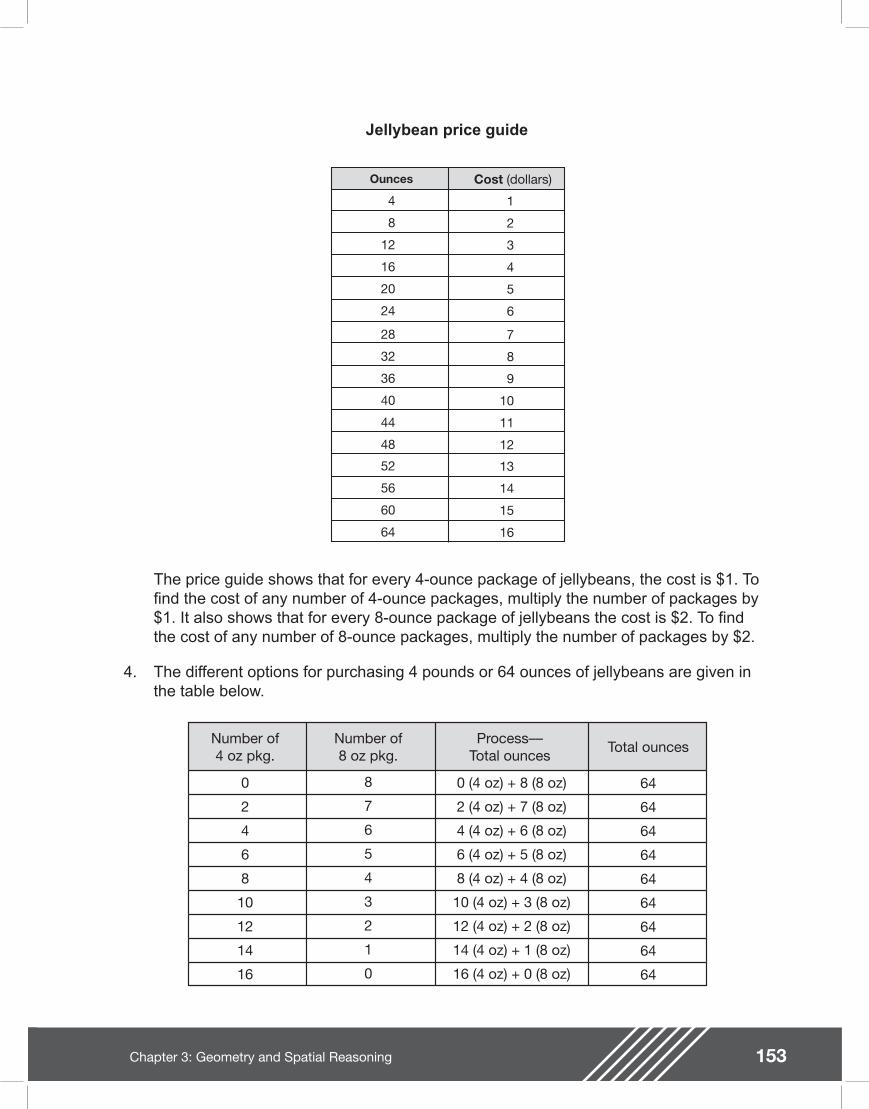
153Chapter 3: Geometry and Spatial Reasoning
Jellybean price guide
Ounces
4
8
12
16
20
24
1
2
3
4
5
6
28
32
36
40
44
48
7
8
9
10
11
12
52
56
60
64
13
14
15
16
Cost (dollars)
The price guide shows that for every 4-ounce package of jellybeans, the cost is $1. To nd the cost of any number of 4-ounce packages, multiply the number of packages by $1. It also shows that for every 8-ounce package of jellybeans the cost is $2. To nd the cost of any number of 8-ounce packages, multiply the number of packages by $2.
4. The different options for purchasing 4 pounds or 64 ounces of jellybeans are given in the table below.
Number of4 oz pkg.
Number of8 oz pkg.
Process�–�–Total ounces
Total ounces
0
2
4
6
8
10
12
14
16
64
64
64
64
64
64
64
64
64
8
7
6
5
4
3
2
1
0
0 (4 oz) + 8 (8 oz)
2 (4 oz) + 7 (8 oz)
4 (4 oz) + 6 (8 oz)
6 (4 oz) + 5 (8 oz)
8 (4 oz) + 4 (8 oz)
10 (4 oz) + 3 (8 oz)
12 (4 oz) + 2 (8 oz)
14 (4 oz) + 1 (8 oz)
16 (4 oz) + 0 (8 oz)
154 Chapter 3: Geometry and Spatial Reasoning
There are 16 groups of 4 ounces in 64 ounces. Four-ounce packages must be purchased in multiples of 2. It is not possible to purchase an odd number of 4-ounce packages and still make 8-ounce packages.
Extension Questions
�• How much is the cost of one ounce of jellybeans at the same rate?
If Deet�’s Sweet Treats sells 8 ounces of jellybeans for $2, then the cost of one ounce of jellybeans is .
�• What would a customer pay for a quarter-pound of jellybeans?
One pound of jellybeans is the same as 16 ounces of jellybeans, and of 16 ounces is 4 ounces. Since 16 ounces of jellybeans is $4 and of $4 is $1, the cost of one quarter-pound (4 ounces) of jellybeans is $1.
�• Find the cost of 96 ounces of jellybeans.
The unit rate is $0.25 per ounce.
The cost of 96 ounces is $24.
$ . $ .2 008
0 251 ounces ounce
=
141
4
$ . $ . $0 251
0 251
2496 ounce
x 96 ounce x 96 ounces
= =
155Chapter 3: Geometry and Spatial Reasoning
The Round Tablegrade 6
Leo has been asked to design a circular table using -inch plywood so that 12 chairs can be placed around the table, with at least 8 inches between chairs. Each chair uses 16 inches of the edge of the table.
1. Will this table t reasonably in a dining room measuring 12 feet by 14 feet? Explain.
2. Leo is shipping the tabletop. He has added hinges so that the tabletop folds in half. The legs of the table are removable and will be sent separately. Can the tabletop be shipped in a rectangular box measuring 8 feet by 4 feet by 3 inches? Explain your reasoning.
3. Leo decides to make a smaller table. Each chair still uses 16 inches of the edge of the table, and he still wants 8 inches between chairs. He would like the new table to seat 8, that is, the number of people the original table sat. Can Leo take of each measurement of the table to get the size of the new table? Why or why not?
34
232
3
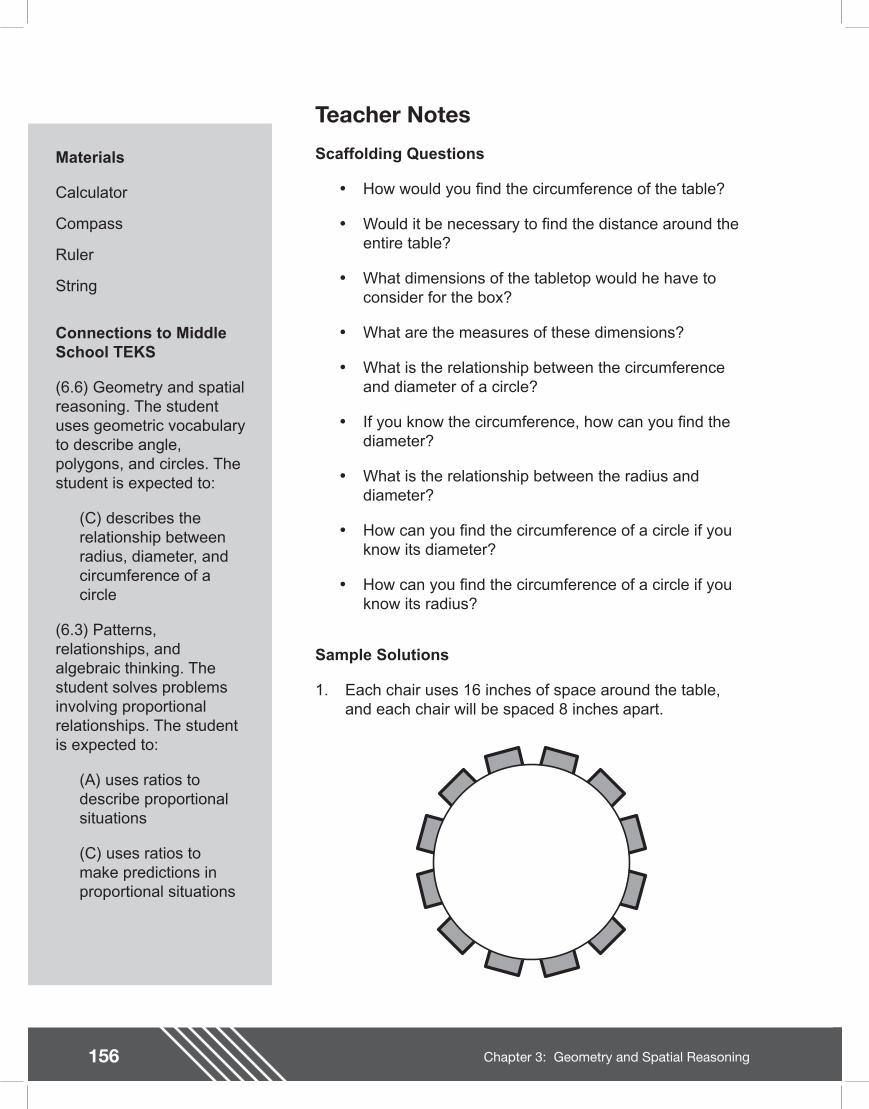
156 Chapter 3: Geometry and Spatial Reasoning
Teacher Notes
Materials
Calculator
Compass
Ruler
String
Connections to Middle School TEKS
(6.6) Geometry and spatial reasoning. The student uses geometric vocabulary to describe angle, polygons, and circles. The student is expected to:
(C) describes the relationship between radius, diameter, and circumference of a circle
(6.3) Patterns, relationships, and algebraic thinking. The student solves problems involving proportional relationships. The student is expected to:
(A) uses ratios to describe proportional situations
(C) uses ratios to make predictions in proportional situations
Scaffolding Questions
�• How would you nd the circumference of the table?
�• Would it be necessary to nd the distance around the entire table?
�• What dimensions of the tabletop would he have to consider for the box?
�• What are the measures of these dimensions?
�• What is the relationship between the circumference and diameter of a circle?
�• If you know the circumference, how can you nd the diameter?
�• What is the relationship between the radius and diameter?
�• How can you nd the circumference of a circle if you know its diameter?
�• How can you nd the circumference of a circle if you know its radius?
Sample Solutions
1. Each chair uses 16 inches of space around the table, and each chair will be spaced 8 inches apart.
157Chapter 3: Geometry and Spatial Reasoning
Texas Assessment of Knowledge and Skills
Objective 3: The student will demonstrate an understanding of geometry and spatial reasoning.
There will be a total of 12 chairs around the table.
12 x 16 = 192 inches
There will be a total of 12 spaces between each chair.
12 x 8 = 96 inches
The circumference of the table is 288 inches. This is the sum of the chairs and the spacing that separates each chair.
192 + 96 = 288 inches
Since C = d , then . So, by substitution, which means . The diameter of the table Leo will design is approximately 91.67 inches. This means that the distance across the table is approximately 91.67 inches. This distance converted to feet, using 1 foot = 12 inches, is approximately 7.64 feet.
The table should t in a dining room measuring 12 feet by 14 feet. The t will be a little tight.
2. Leo�’s tabletop has a diameter of 7.64 feet. If the diameter is 7.64 feet, then the radius of the tabletop is half of 7.64 feet. The radius of the tabletop is 3.82 feet. The length of the diameter, 7.64 feet, is the length of the box that Leo will need. The length of the radius, 3.82 feet, is the width of the box. Since the tabletop is made of -inch plywood and the table is folded over, the height of the box would need to be at least twice the width of the plywood, or inches. So yes, Leo could use a rectangular box measuring 8 feet by 4 feet by 3 inches.
dC
= d =288
d 91 67.
91 671
127 64. . inches
foot inches
×
34
121
feet
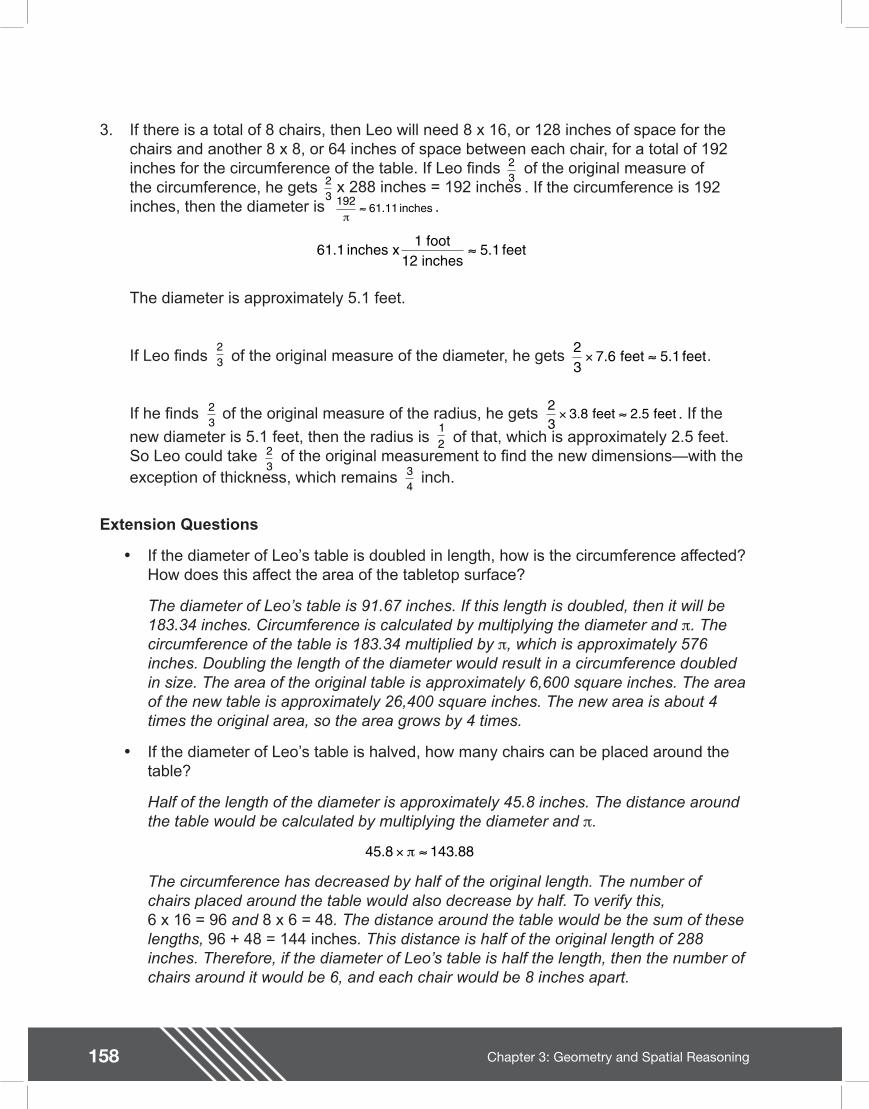
158 Chapter 3: Geometry and Spatial Reasoning
3. If there is a total of 8 chairs, then Leo will need 8 x 16, or 128 inches of space for the chairs and another 8 x 8, or 64 inches of space between each chair, for a total of 192 inches for the circumference of the table. If Leo nds of the original measure of the circumference, he gets . If the circumference is 192 inches, then the diameter is .
The diameter is approximately 5.1 feet.
If Leo nds of the original measure of the diameter, he gets .
If he nds of the original measure of the radius, he gets . If the
new diameter is 5.1 feet, then the radius is of that, which is approximately 2.5 feet. So Leo could take of the original measurement to nd the new dimensions�—with the exception of thickness, which remains inch.
Extension Questions
�• If the diameter of Leo�’s table is doubled in length, how is the circumference affected? How does this affect the area of the tabletop surface?
The diameter of Leo�’s table is 91.67 inches. If this length is doubled, then it will be 183.34 inches. Circumference is calculated by multiplying the diameter and . The circumference of the table is 183.34 multiplied by , which is approximately 576 inches. Doubling the length of the diameter would result in a circumference doubled in size. The area of the original table is approximately 6,600 square inches. The area of the new table is approximately 26,400 square inches. The new area is about 4 times the original area, so the area grows by 4 times.
�• If the diameter of Leo�’s table is halved, how many chairs can be placed around the table?
Half of the length of the diameter is approximately 45.8 inches. The distance around the table would be calculated by multiplying the diameter and .
The circumference has decreased by half of the original length. The number of chairs placed around the table would also decrease by half. To verify this, 6 x 16 = 96 and 8 x 6 = 48. The distance around the table would be the sum of these lengths, 96 + 48 = 144 inches. This distance is half of the original length of 288 inches. Therefore, if the diameter of Leo�’s table is half the length, then the number of chairs around it would be 6, and each chair would be 8 inches apart.
232
3x 288 inches = 192 inches192
61 11. inches
61 1 5 1. . inches x1 foot
12 inches feet
23
23
7 6 5 1× . . feet feet
23
23
3 8 2 5× . . feet feet12
23 3
4
45 8 143 88. .×
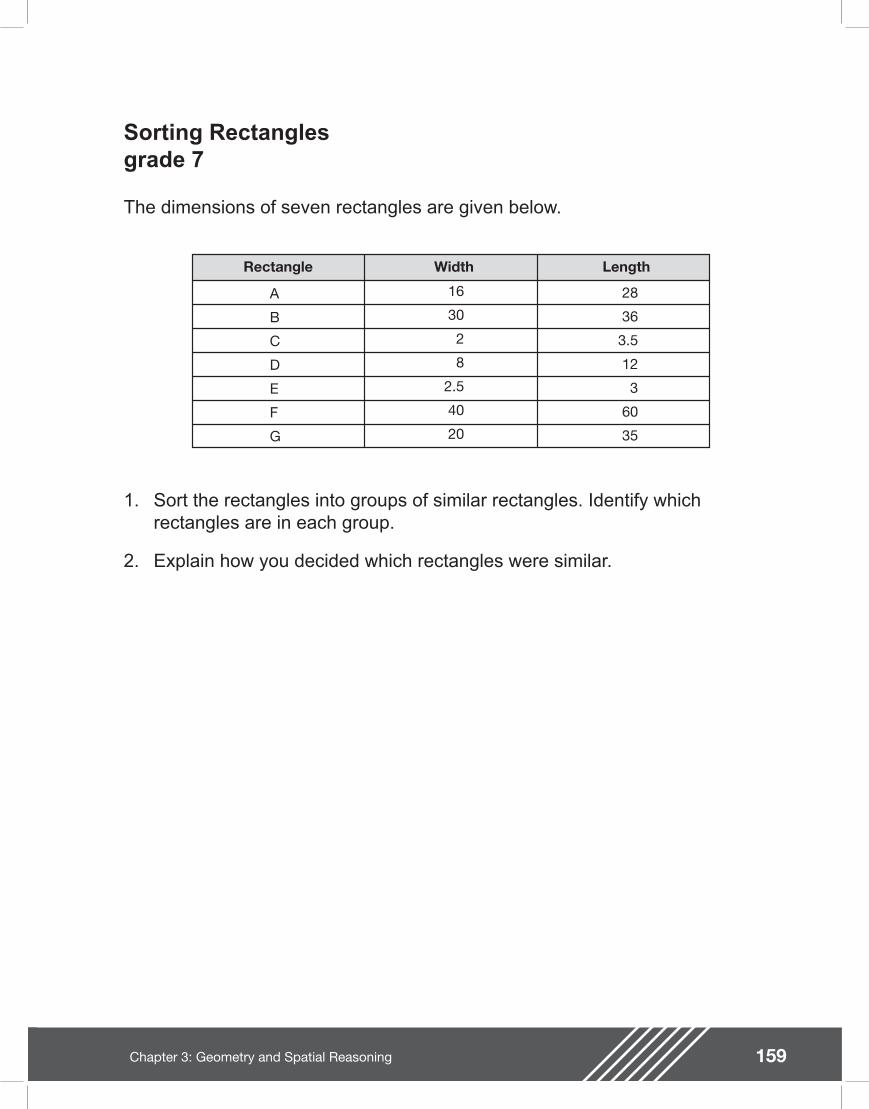
159Chapter 3: Geometry and Spatial Reasoning
Sorting Rectanglesgrade 7
The dimensions of seven rectangles are given below.
Rectangle Width Length
A
B
C
D
E
F
G
16
30
2
8
2.5
40
20
28
36
3.5
12
3
60
35
1. Sort the rectangles into groups of similar rectangles. Identify which rectangles are in each group.
2. Explain how you decided which rectangles were similar.
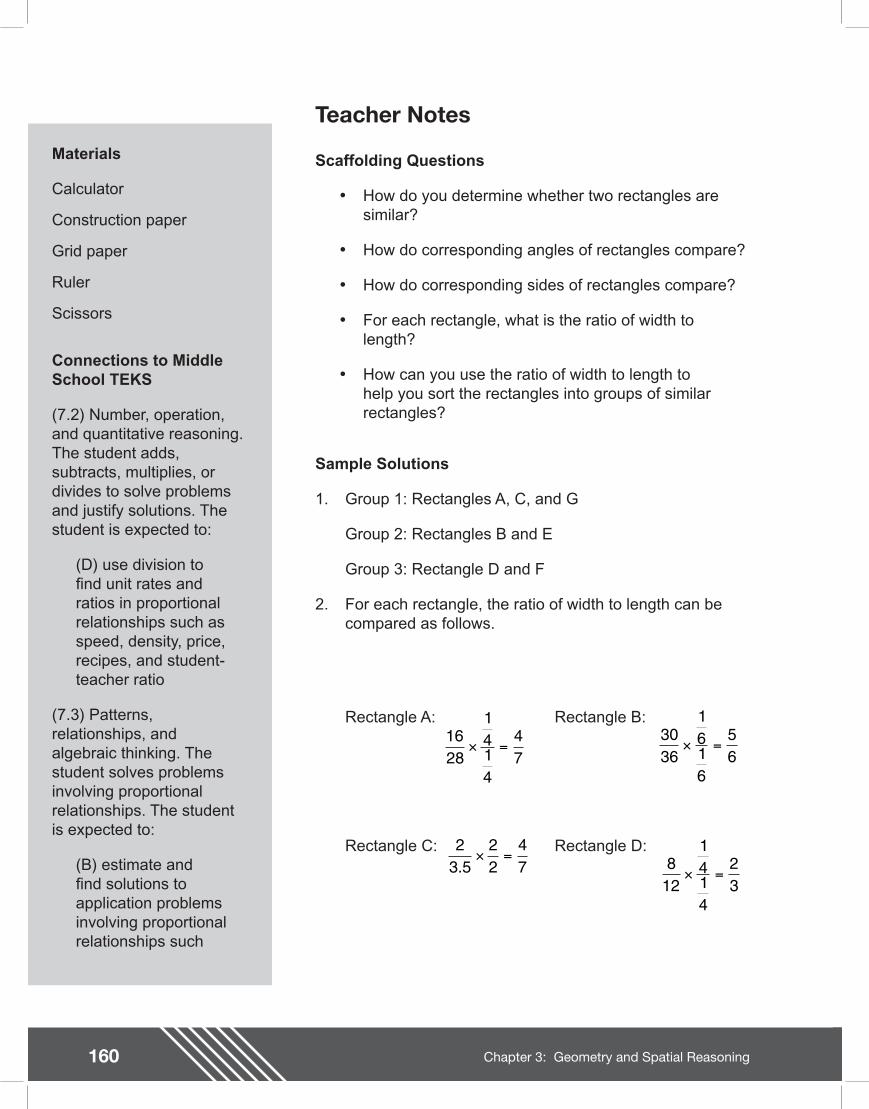
160 Chapter 3: Geometry and Spatial Reasoning
Teacher Notes
Materials
Calculator
Construction paper
Grid paper
Ruler
Scissors
Connections to Middle School TEKS
(7.2) Number, operation, and quantitative reasoning. The student adds, subtracts, multiplies, or divides to solve problems and justify solutions. The student is expected to:
(D) use division to nd unit rates and ratios in proportional relationships such as speed, density, price, recipes, and student-teacher ratio
(7.3) Patterns, relationships, and algebraic thinking. The student solves problems involving proportional relationships. The student is expected to:
(B) estimate and nd solutions to application problems involving proportional relationships such
Scaffolding Questions
�• How do you determine whether two rectangles are similar?
�• How do corresponding angles of rectangles compare?
�• How do corresponding sides of rectangles compare?
�• For each rectangle, what is the ratio of width to length?
�• How can you use the ratio of width to length to help you sort the rectangles into groups of similar rectangles?
Sample Solutions
1. Group 1: Rectangles A, C, and G
Group 2: Rectangles B and E
Group 3: Rectangle D and F
2. For each rectangle, the ratio of width to length can be compared as follows.
Rectangle A: Rectangle B:
Rectangle C: Rectangle D:
1628
1414
47
× =3036
1616
56
× =
23 5
22
47.
× = 812
1414
23
× =
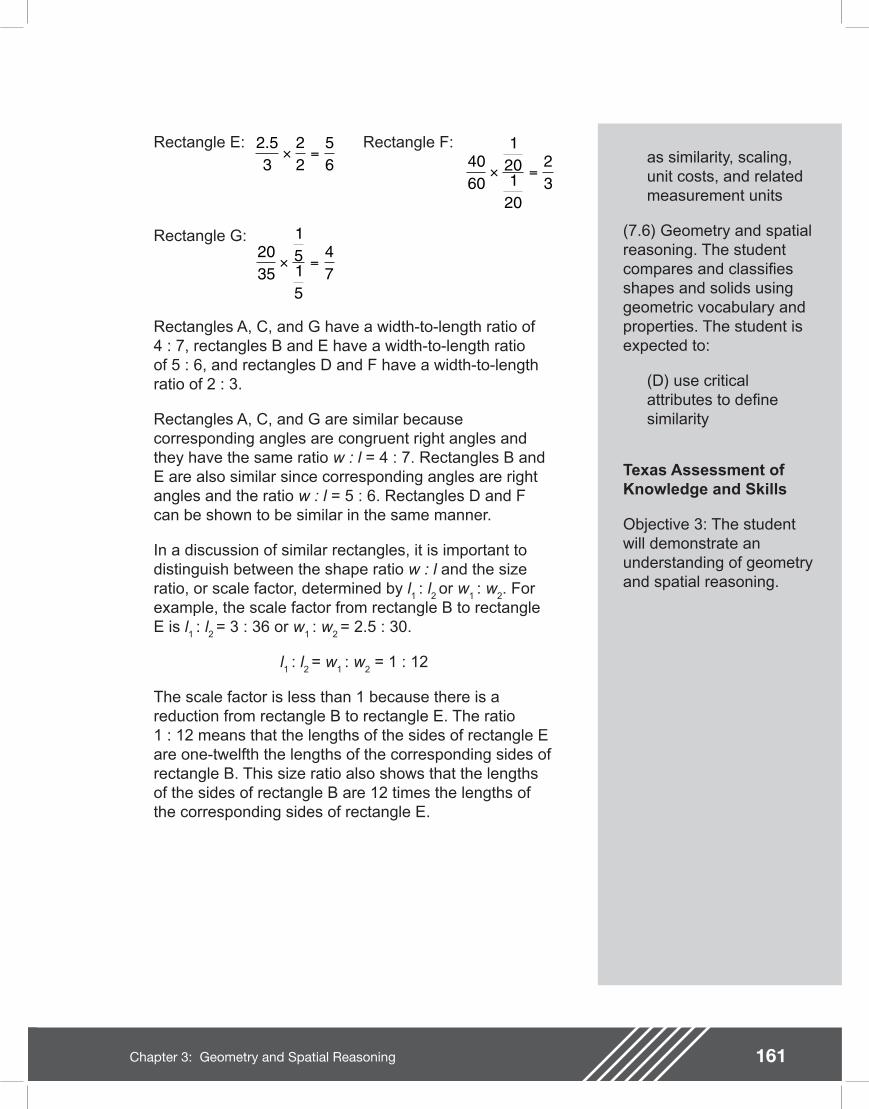
161Chapter 3: Geometry and Spatial Reasoning
as similarity, scaling, unit costs, and related measurement units
(7.6) Geometry and spatial reasoning. The student compares and classi es shapes and solids using geometric vocabulary and properties. The student is expected to:
(D) use critical attributes to de ne similarity
Texas Assessment of Knowledge and Skills
Objective 3: The student will demonstrate an understanding of geometry and spatial reasoning.
Rectangle E: Rectangle F:
Rectangle G:
2 53
22
56
.× = 40
60
1201
20
23
× =
2035
1515
47
× =
Rectangles A, C, and G have a width-to-length ratio of 4 : 7, rectangles B and E have a width-to-length ratio of 5 : 6, and rectangles D and F have a width-to-length ratio of 2 : 3.
Rectangles A, C, and G are similar because corresponding angles are congruent right angles and they have the same ratio w : l = 4 : 7. Rectangles B and E are also similar since corresponding angles are right angles and the ratio w : l = 5 : 6. Rectangles D and F can be shown to be similar in the same manner.
In a discussion of similar rectangles, it is important to distinguish between the shape ratio w : l and the size ratio, or scale factor, determined by l
1 : l
2 or w
1 : w
2. For
example, the scale factor from rectangle B to rectangle E is l
1 : l
2 = 3 : 36 or w
1 : w
2 = 2.5 : 30.
l1 : l
2 = w
1 : w
2 = 1 : 12
The scale factor is less than 1 because there is a reduction from rectangle B to rectangle E. The ratio1 : 12 means that the lengths of the sides of rectangle E are one-twelfth the lengths of the corresponding sides of rectangle B. This size ratio also shows that the lengths of the sides of rectangle B are 12 times the lengths of the corresponding sides of rectangle E.
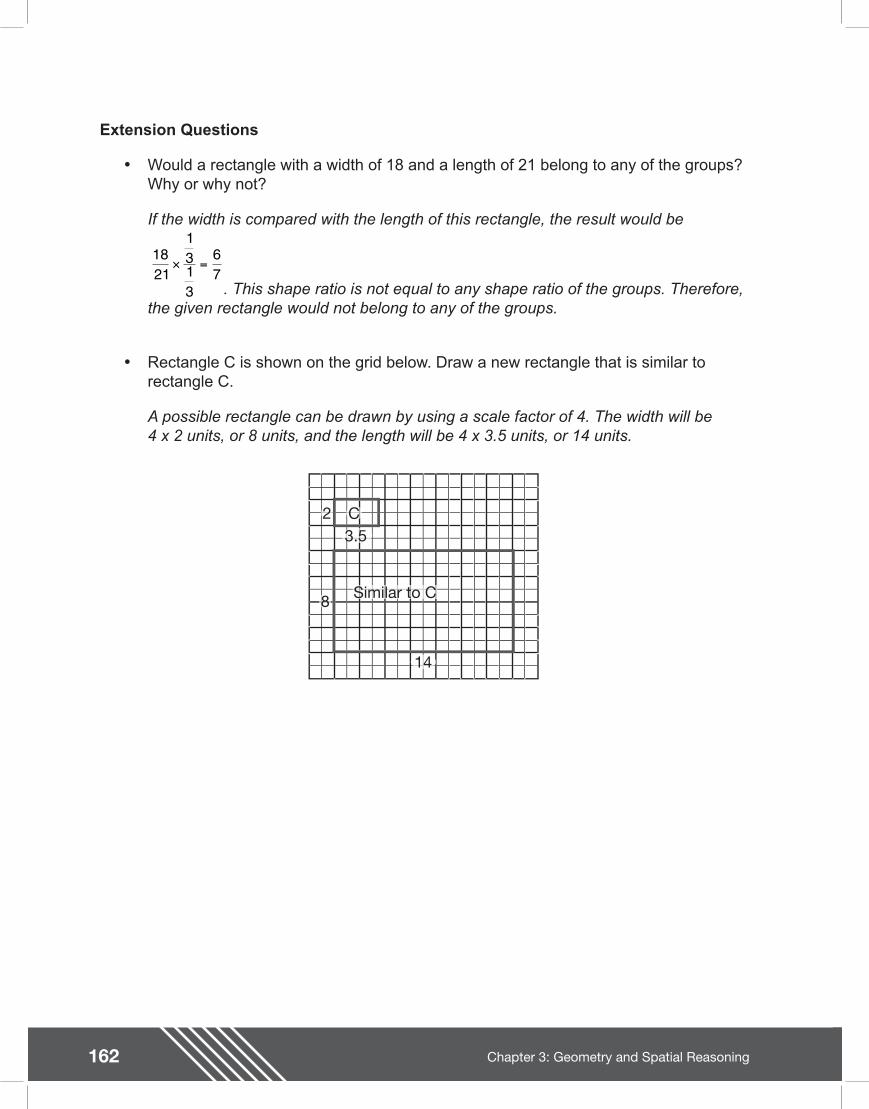
162 Chapter 3: Geometry and Spatial Reasoning
Extension Questions
�• Would a rectangle with a width of 18 and a length of 21 belong to any of the groups? Why or why not?
If the width is compared with the length of this rectangle, the result would be
. This shape ratio is not equal to any shape ratio of the groups. Therefore, the given rectangle would not belong to any of the groups.
�• Rectangle C is shown on the grid below. Draw a new rectangle that is similar to
rectangle C.
A possible rectangle can be drawn by using a scale factor of 4. The width will be4 x 2 units, or 8 units, and the length will be 4 x 3.5 units, or 14 units.
1821
1313
67
× =
C23.5
8
14
Similar to C
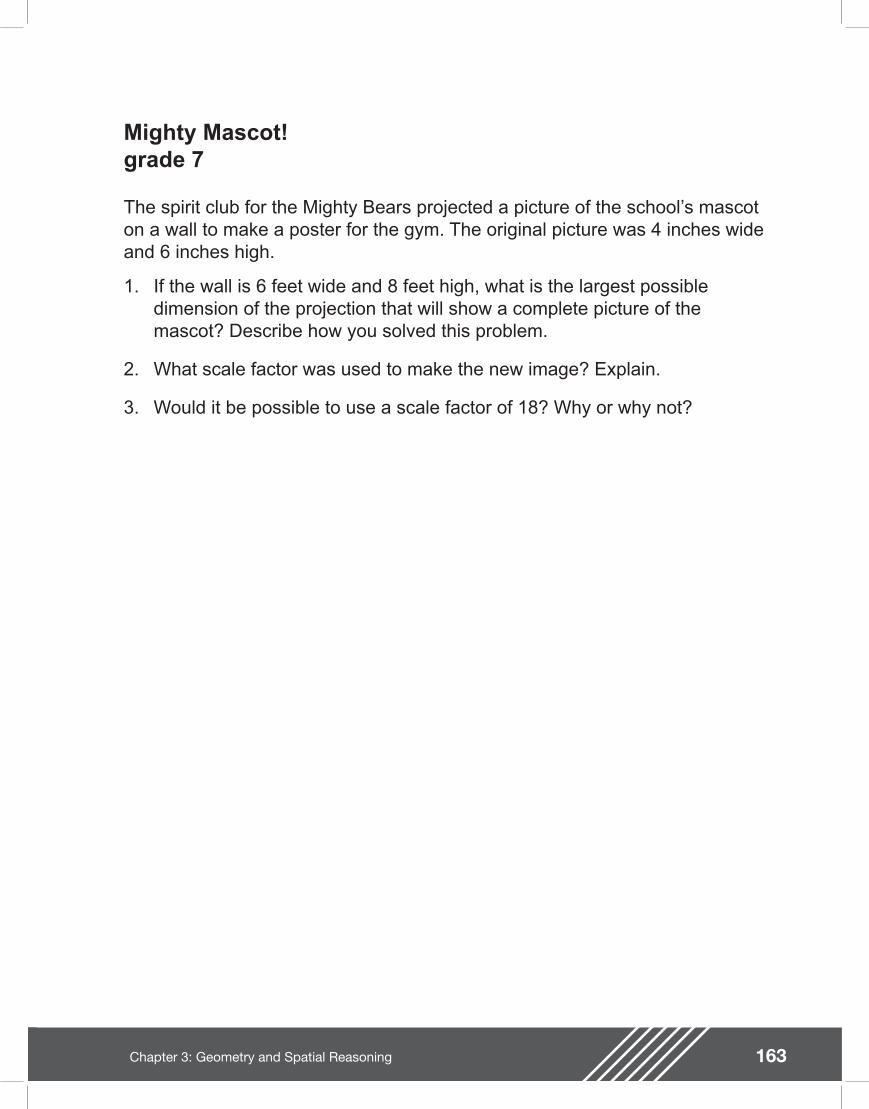
163Chapter 3: Geometry and Spatial Reasoning
Mighty Mascot!grade 7
The spirit club for the Mighty Bears projected a picture of the school�’s mascot on a wall to make a poster for the gym. The original picture was 4 inches wide and 6 inches high.
1. If the wall is 6 feet wide and 8 feet high, what is the largest possible dimension of the projection that will show a complete picture of the mascot? Describe how you solved this problem.
2. What scale factor was used to make the new image? Explain.
3. Would it be possible to use a scale factor of 18? Why or why not?
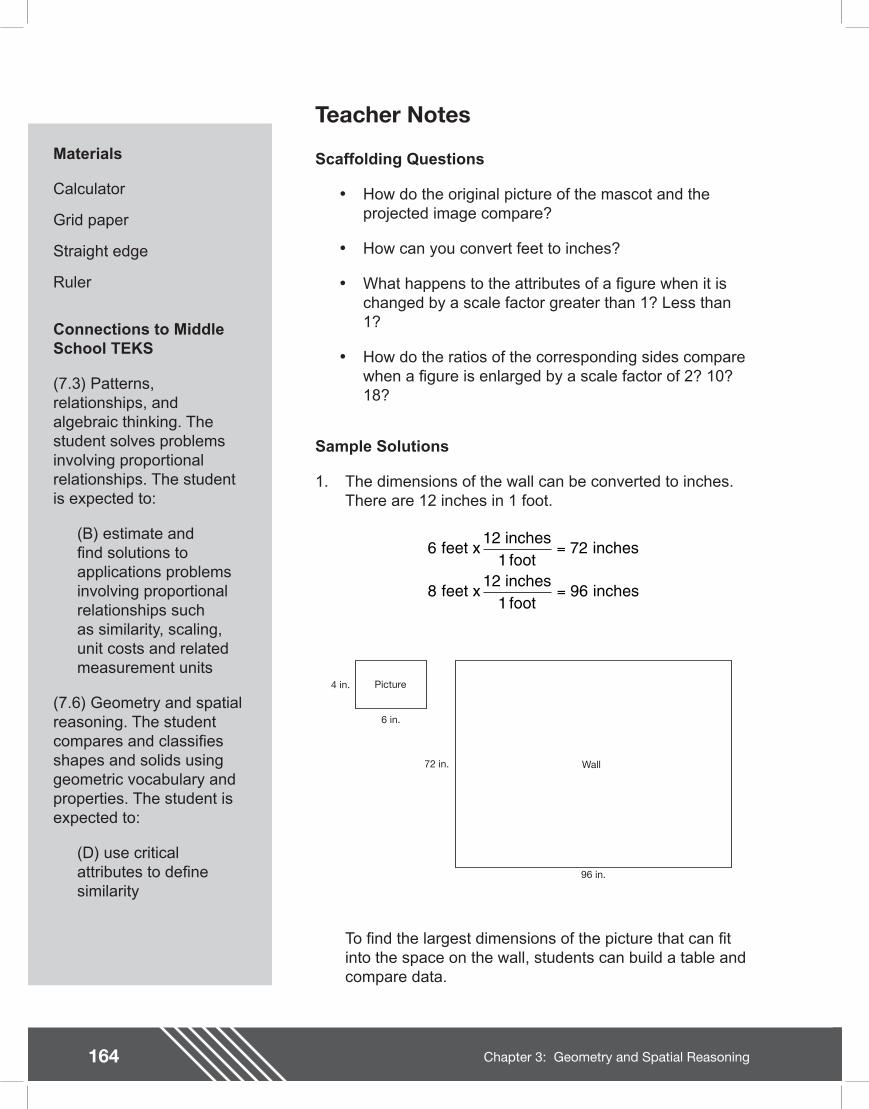
164 Chapter 3: Geometry and Spatial Reasoning
Teacher Notes
Materials
Calculator
Grid paper
Straight edge
Ruler
Connections to Middle School TEKS
(7.3) Patterns, relationships, and algebraic thinking. The student solves problems involving proportional relationships. The student is expected to:
(B) estimate and nd solutions to applications problems involving proportional relationships such as similarity, scaling, unit costs and related measurement units
(7.6) Geometry and spatial reasoning. The student compares and classi es shapes and solids using geometric vocabulary and properties. The student is expected to:
(D) use critical attributes to de ne similarity
Scaffolding Questions
�• How do the original picture of the mascot and the projected image compare?
�• How can you convert feet to inches?
�• What happens to the attributes of a gure when it is changed by a scale factor greater than 1? Less than 1?
�• How do the ratios of the corresponding sides compare when a gure is enlarged by a scale factor of 2? 10? 18?
Sample Solutions
1. The dimensions of the wall can be converted to inches. There are 12 inches in 1 foot.
61
72
81
96
feet x12 inches
foot inches
feet x12 inches
foot inches
=
=
4 in.
6 in.
72 in.
96 in.
Picture
Wall
To nd the largest dimensions of the picture that can t into the space on the wall, students can build a table and compare data.
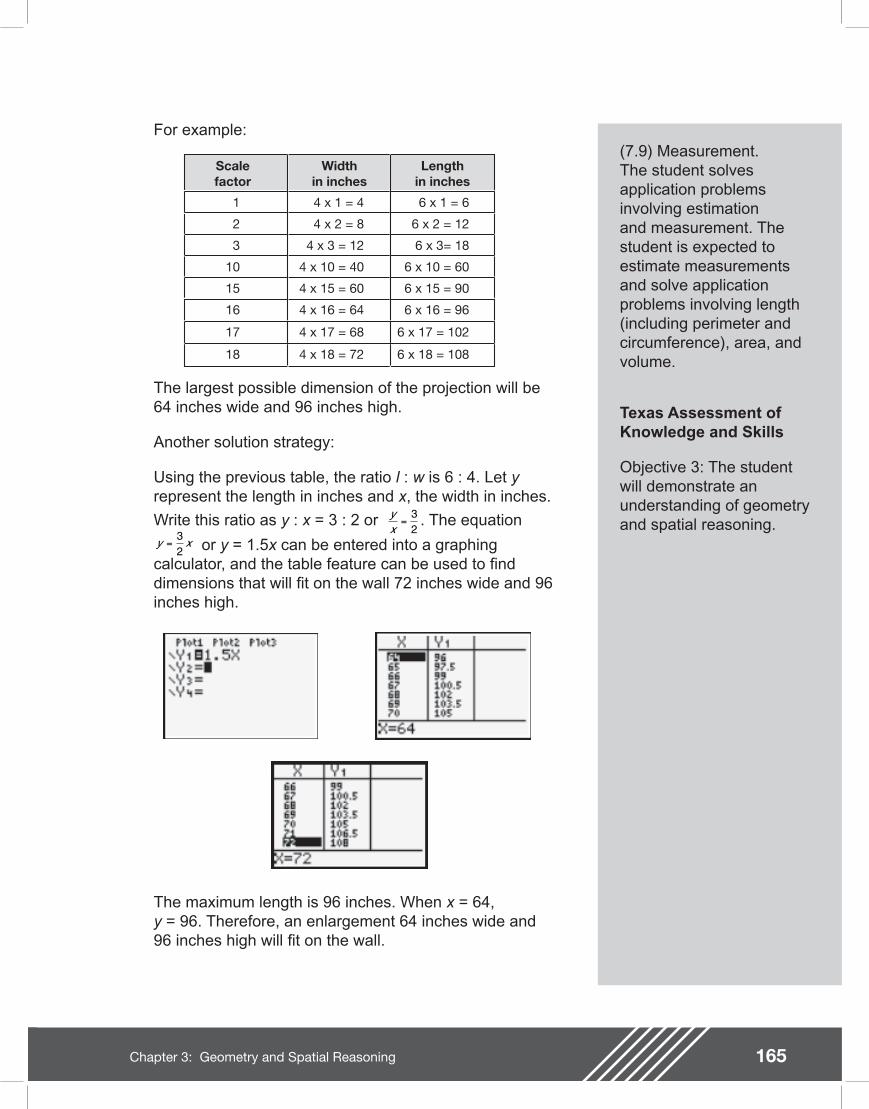
165Chapter 3: Geometry and Spatial Reasoning
(7.9) Measurement. The student solves application problems involving estimation and measurement. The student is expected to estimate measurements and solve application problems involving length (including perimeter and circumference), area, and volume.
Texas Assessment of Knowledge and Skills
Objective 3: The student will demonstrate an understanding of geometry and spatial reasoning.
For example:
Scalefactor
Widthin inches
Lengthin inches
1
2
3
10
15
16
4 x 1 = 4
4 x 2 = 8
4 x 3 = 12
4 x 10 = 40
4 x 15 = 60
4 x 16 = 64
6 x 1 = 6
6 x 2 = 12
6 x 3= 18
6 x 10 = 60
6 x 15 = 90
6 x 16 = 96
17 4 x 17 = 68 6 x 17 = 102
18 4 x 18 = 72 6 x 18 = 108
The largest possible dimension of the projection will be 64 inches wide and 96 inches high.
Another solution strategy:
Using the previous table, the ratio l : w is 6 : 4. Let y represent the length in inches and x, the width in inches.
Write this ratio as y : x = 3 : 2 or . The equation
or y = 1.5x can be entered into a graphing calculator, and the table feature can be used to nd dimensions that will t on the wall 72 inches wide and 96 inches high.
The maximum length is 96 inches. When x = 64, y = 96. Therefore, an enlargement 64 inches wide and 96 inches high will t on the wall.
yx
=32
y x=32
166 Chapter 3: Geometry and Spatial Reasoning
2. The scale factor used to create the new image is 16. Refer to the table in problem 1.
4 x 16 = 64 and 6 x 16 = 96
Since this is an enlargement, the scale factor is greater than 1. Multiplying the original dimensions by 16 gives the dimensions of 64 inches by 96 inches.
Another way to nd the scale factor that produced this enlargement is to nd the ratio of corresponding widths w
1 : w
2 = 64 : 4 = 16 : 1 or the ratio of corresponding lengths
l1 : l
2 = 96 : 6 = 16 : 1.
3. It would not be possible to use a scale factor of 18 because multiplying the dimensions of the picture by the scale factor 18 would result in an enlargement that is 72 inches by 108 inches.
4 inches x 18 = 72 inches
6 inches x 18 = 108 inches
The enlargement would be too tall to t on the wall that is 72 inches wide and 96 inches high.
Extension Questions
�• What size surface would be needed to project the picture of the mascot using a scale factor of 20?
To nd the size of the surface, you would multiply the dimensions of the picture by 20.
4 inches x 20 = 80 inches
6 inches x 20 = 120 inches
The new dimensions could be converted to feet.
The size of the surface should be about 7 feet by 10 feet, rounding to the nearest foot.
�• A projection of a picture on a wall measures 48 inches wide by 72 inches high. The
80 inches x 1 foot
12 inches 6.667 feet
120 inches x 1 foot
12 inches = 10 feet
167Chapter 3: Geometry and Spatial Reasoning
original picture�’s dimensions have been increased by in this projected image. What were the original dimensions? Explain your reasoning.
If the dimension has been increased by , then the new image is
of the original image.
The dimensions of the projection on the wall are times the original
dimensions of the picture. This means that 48 inches is times the width (w) of the
original picture and 72 inches is times the length (l) of the original picture. The following equations can be written and solved to determine the original dimensions.
The dimensions of the original picture are width = 36 inches and length = 54 inches.
3313
%
3313
%
13313
% = 133
13
100 =
13313
100 x
33
= 43
100 3313
3313
% % %+ or 1
113
43
or
43
43
48
3436
= 43
x 48 = 34
x 43
=
w
w
w
72
3454
= 43
x 72 = 34
x 43
=
l
l
l

168 Chapter 3: Geometry and Spatial Reasoning

169Chapter 3: Geometry and Spatial Reasoning
Javier Builds a Modelgrade 8
Javier, an architect, builds a scale model of the new faculty center at the university. A diagram of the scale model is shown below.
3 in.20 in.
3 in.
16 in.
10 in.
12 in.
2 in.
4 in.
Entrance
1. In the scale model, the entrance is 12 inches wide. If the entrance is actually 60 feet wide, what scale did Javier use to create the model? Explain your answer.
2. Show how to nd the actual measurements of the new faculty center at the university. Redraw the model, labeling its actual dimensions.
170 Chapter 3: Geometry and Spatial Reasoning
Teacher NotesMaterials
Calculator
Ruler
Cubes
Connections to Middle School TEKS
(8.3) Patterns, relationships, and algebraic thinking. The student identi es proportional relationships in problem situations and solves problems. The student is expected to:
(B) estimate and nd solutions to application problems involving percents and proportional relationships such as similarity and rates
(8.5) Patterns, relationships, and algebraic thinking. The student uses graphs, tables, and algebraic representations to make predictions and solve problems. The student is expected to:
(A) estimate, nd, and justify solutions to application problems using appropriate tables, graphs, and algebraic equations
(8.7) Geometry and spatial reasoning. The student
Scaffolding Questions
�• What does it mean for two gures to be similar?
�• How does the actual measure of the entrance compare with that of the model?
�• What does a scale factor tell you about the dimensions of two similar gures?
�• How can you nd a scale factor from the scale model to the actual building? From the actual building to the scale model?
�• How can you nd the dimensions of the actual gure if you know the scale factor used to make the model?
�• How does the ratio of the corresponding areas of two similar gures compare to the ratio of their corresponding sides?
Sample Solutions
1. To calculate the scale used, begin with the relationship between the number of inches in the scale drawing and the number of feet in the actual building.
Therefore, Javier used a scale of 1 inch = 5 feet.
2. To convert from the dimensions in the scale model to the dimensions of the actual building, the rate
may be used. For example, convert 2 inches to the actual size.
60 5 feet in the actual building12 inches in the scale model
feet in the actual building1 inch in the scale model
=
5 feet in the actual building1 inch in the scale model
5 feet in the actual building1 inch in the scale model
x 2 inches in the scale model =
10 feet in the actual building

171Chapter 3: Geometry and Spatial Reasoning
uses geometry to model and describe the physical world. The student is expected to:
(B) use geometric concepts and properties to solve problems in elds such as art and architecture
(8.8) Measurement. The student uses procedures to determine measures of solids. The student is expected to:
(C) estimate answers and use formulas to solve application problems involving surface area and volume
(8.14) Underlying processes and mathematical tools. The student applies Grade 8 mathematics to solve problems connected to everyday experiences, investigations in other disciplines, and activities in and outside of school. The student is expected to:
(A) identify and apply mathematics to everyday experiences, to activities in and outside of school, with other disciplines, and with other mathematical topics
If the rate is , the rule that de nes the relationship is y = 5x, where y represents the number of feet in the actual building and x, the number of inches in the scale model. The equation y = 5x states that the number of feet in the actual building is 5 times the number of inches in the scale drawing.
This equation, y = 5x, can be used to nd the actual dimensions of the new faculty center.
Large rectangular prism: Length: y = (5)(20) = 100 ft
Width: y = (5)(16) = 80 ft
Height: y = (5)(3) = 15 ft
Cylinder: Radius: y = (5)(4) = 20 ft
Height: y = (5)(3) = 15 ft
Small rectangular prism: Length: y = (5)(10) = 50 ft
Width: y = (5)(12) = 60 ft
Height: y = (5)(2) = 10 ft
5 feet in the actual building1 inch in the scale model
15 ft.100 ft.
15 ft.
80 ft.
50 ft.
60 ft.
10 ft.
20 ft.
Entrance
172 Chapter 3: Geometry and Spatial Reasoning
Teacher Notes(C) select or develop an appropriate problem-solving strategy from a variety of different types, including drawing a picture, looking for a pattern, systematic guessing and checking, acting it out, making a table, working a simpler problem, or working backwards to solve a problem
(D) select tools such as real objects, manipulatives, paper/pencil, and technology or techniques such as mental math, estimation, and number sense to solve problems
(8.15) Underlying processes and mathematical tools. The student communicates about Grade 8 mathematics through informal and mathematical language, representations, and models. The student is expected to:
(A) communicate mathematical ideas using language, ef cient tools, appropriate units, and graphical, numerical, physical, or algebraic mathematical models
Extension Questions
�• The university is purchasing material for a roof of the building. How much area will be covered?
The area of the roof of the building is the area of the top of the large rectangular prism and the top of the small rectangular prism. The roof of the large rectangular prism consists of a part of the rectangle that is around the circular portion of the cylinder and a circular portion (base of cylinder). Since the bases of a cylinder are congruent circles, the top of the cylinder has the same area as the bottom. Therefore, the area of the roof of the large rectangular prism is the area of a rectangle with dimensions 100 feet by 80 feet. The area of the smaller section is 50 feet by 60 feet. The total roof area is the sum of these two areas.
Area = (100)(80) + (50)(60)
Area = 8,000 + 3,000 = 11,000 square feet
�• How much material did Javier use to make the roof of the model?
The area of the roof of the model is the area of the top of the large rectangular prism and the top of the small rectangular prism.
Area = (20)(16) + (10)(12)
Area = 320 + 120 = 440 square inches.
�• How does the area of the roof of the model compare with the area of the roof of the actual building?
A comparison of the areas of the two roofs requires a conversion of feet to inches or inches to feet. Unit conversion can be used to nd the number of square feet in 440 square inches.
The ratio of the number of square feet in the roof of the model to the number of square feet in the roof of the actual building is 3.055 : 11,000 or 1 : 3,600. The
4401
1443 055 in
ft in
ft22
22× .
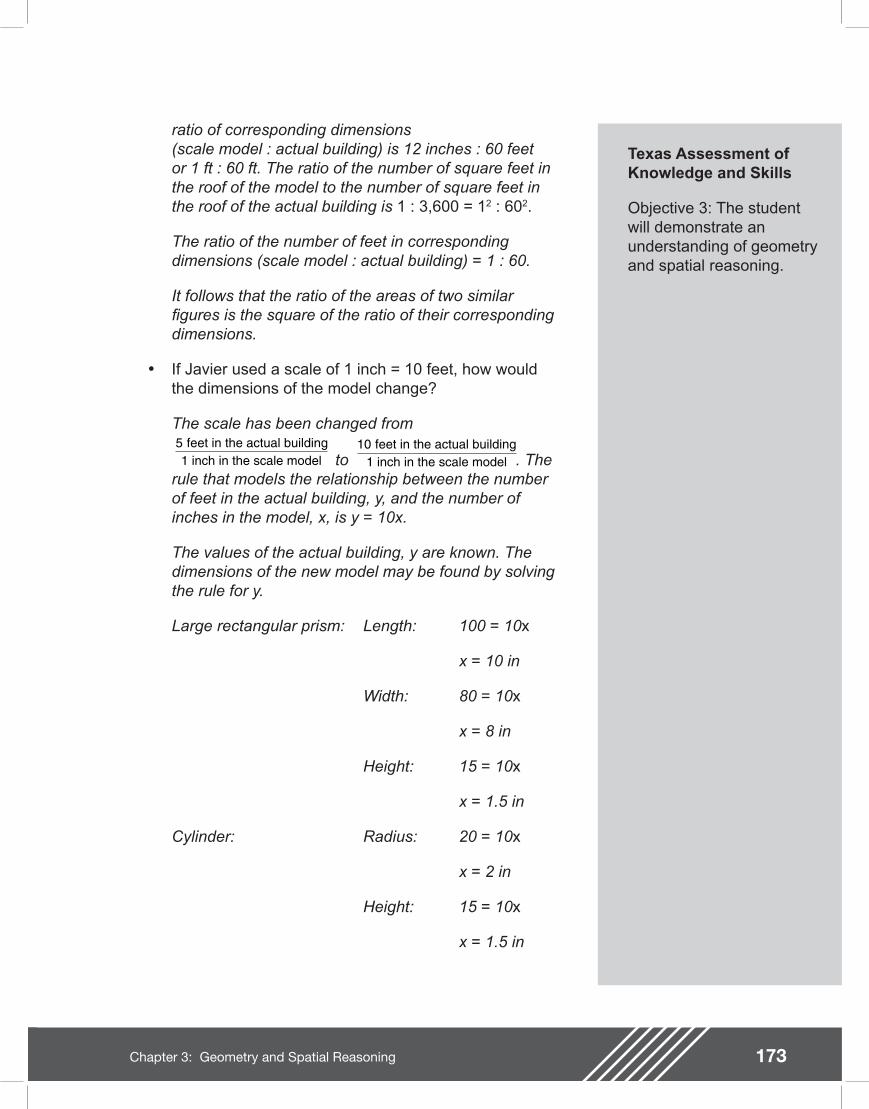
173Chapter 3: Geometry and Spatial Reasoning
Texas Assessment of Knowledge and Skills
Objective 3: The student will demonstrate an understanding of geometry and spatial reasoning.
ratio of corresponding dimensions(scale model : actual building) is 12 inches : 60 feet or 1 ft : 60 ft. The ratio of the number of square feet in the roof of the model to the number of square feet in the roof of the actual building is 1 : 3,600 = 12 : 602.
The ratio of the number of feet in corresponding dimensions (scale model : actual building) = 1 : 60.
It follows that the ratio of the areas of two similar gures is the square of the ratio of their corresponding dimensions.
�• If Javier used a scale of 1 inch = 10 feet, how would the dimensions of the model change?
The scale has been changed from
to . The rule that models the relationship between the number of feet in the actual building, y, and the number of inches in the model, x, is y = 10x.
The values of the actual building, y are known. The dimensions of the new model may be found by solving the rule for y.
Large rectangular prism: Length: 100 = 10x
x = 10 in
Width: 80 = 10x
x = 8 in
Height: 15 = 10x
x = 1.5 in
Cylinder: Radius: 20 = 10x
x = 2 in
Height: 15 = 10x
x = 1.5 in
5 feet in the actual building1 inch in the scale model
10 feet in the actual building1 inch in the scale model
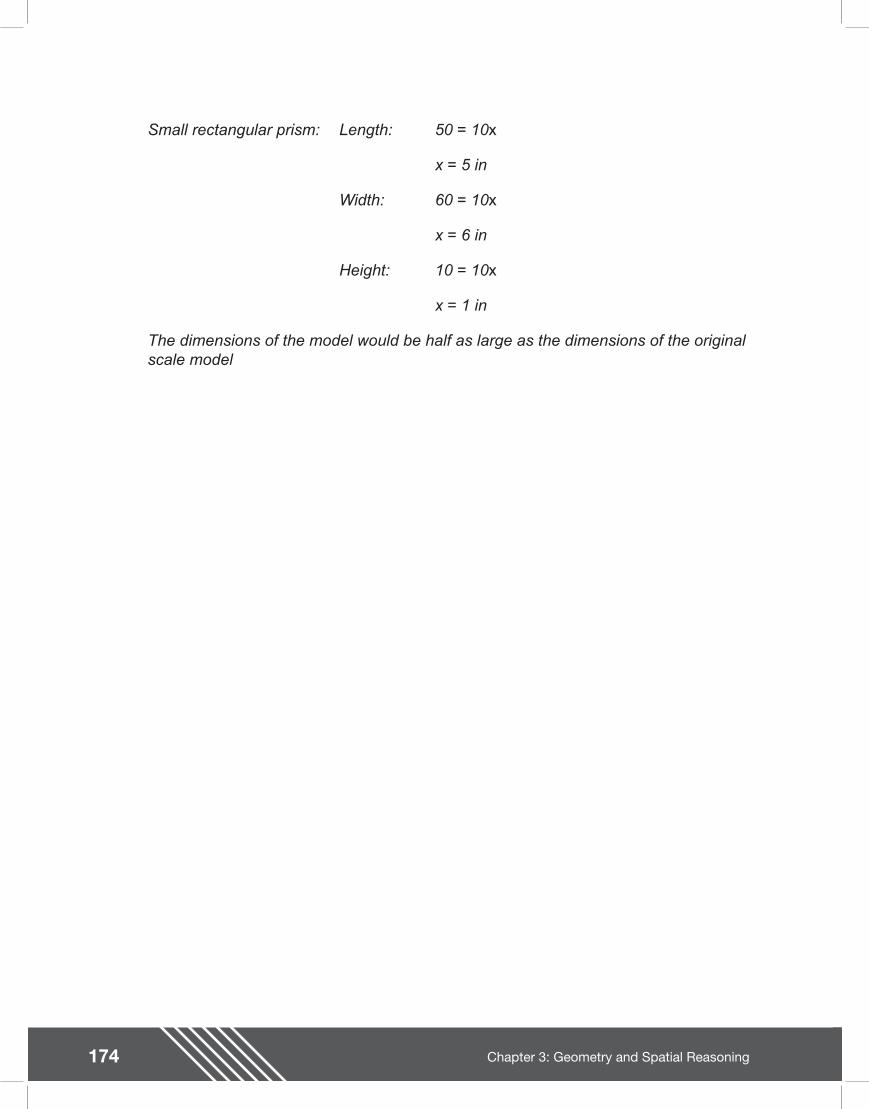
174 Chapter 3: Geometry and Spatial Reasoning
Small rectangular prism: Length: 50 = 10x
x = 5 in
Width: 60 = 10x
x = 6 in
Height: 10 = 10x
x = 1 in
The dimensions of the model would be half as large as the dimensions of the original scale model
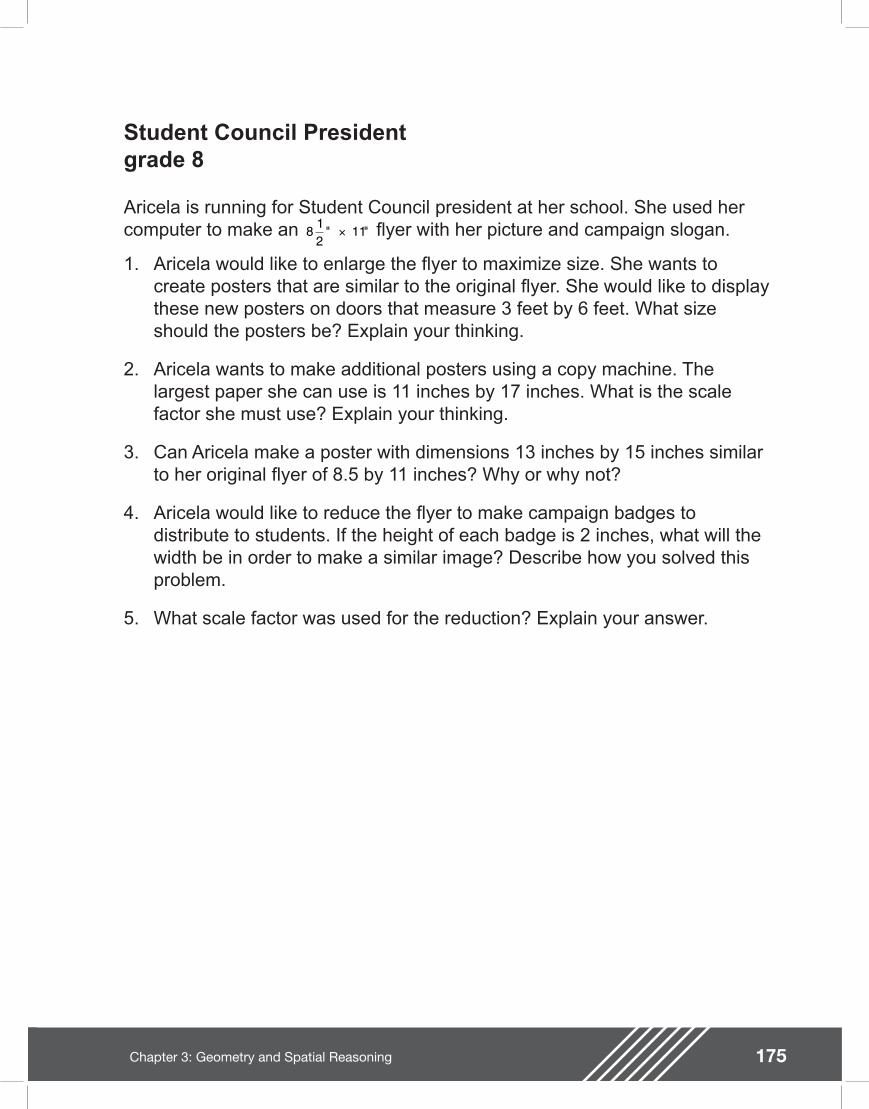
175Chapter 3: Geometry and Spatial Reasoning
Student Council Presidentgrade 8
Aricela is running for Student Council president at her school. She used her computer to make an yer with her picture and campaign slogan.
1. Aricela would like to enlarge the yer to maximize size. She wants to create posters that are similar to the original yer. She would like to display these new posters on doors that measure 3 feet by 6 feet. What size should the posters be? Explain your thinking.
2. Aricela wants to make additional posters using a copy machine. The largest paper she can use is 11 inches by 17 inches. What is the scale factor she must use? Explain your thinking.
3. Can Aricela make a poster with dimensions 13 inches by 15 inches similar to her original yer of 8.5 by 11 inches? Why or why not?
4. Aricela would like to reduce the yer to make campaign badges to distribute to students. If the height of each badge is 2 inches, what will the width be in order to make a similar image? Describe how you solved this problem.
5. What scale factor was used for the reduction? Explain your answer.
812
11" " ×
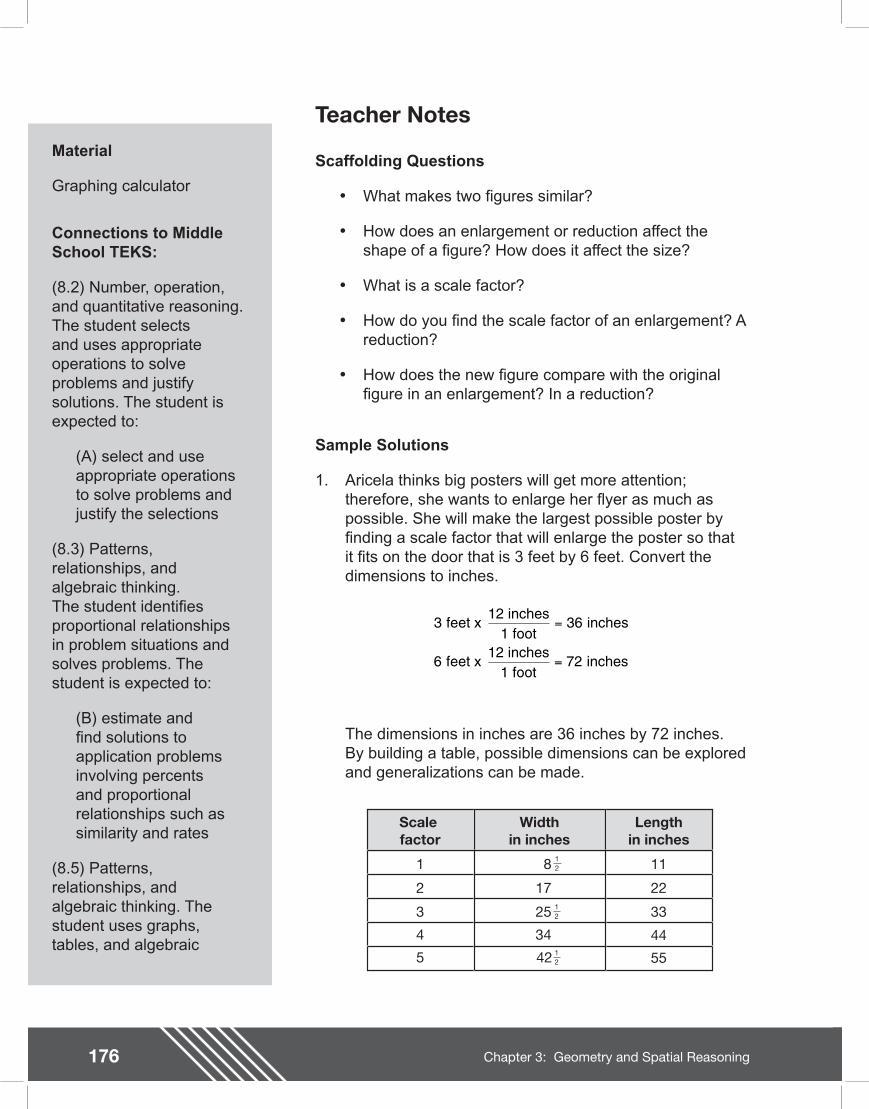
176 Chapter 3: Geometry and Spatial Reasoning
Teacher NotesMaterial
Graphing calculator
Connections to Middle School TEKS:
(8.2) Number, operation, and quantitative reasoning. The student selects and uses appropriate operations to solve problems and justify solutions. The student is expected to:
(A) select and use appropriate operations to solve problems and justify the selections
(8.3) Patterns, relationships, and algebraic thinking. The student identi es proportional relationships in problem situations and solves problems. The student is expected to:
(B) estimate and nd solutions to application problems involving percents and proportional relationships such as similarity and rates
(8.5) Patterns, relationships, and algebraic thinking. The student uses graphs, tables, and algebraic
Scaffolding Questions
�• What makes two gures similar?
�• How does an enlargement or reduction affect the shape of a gure? How does it affect the size?
�• What is a scale factor?
�• How do you nd the scale factor of an enlargement? A reduction?
�• How does the new gure compare with the original gure in an enlargement? In a reduction?
Sample Solutions
1. Aricela thinks big posters will get more attention; therefore, she wants to enlarge her yer as much as possible. She will make the largest possible poster by nding a scale factor that will enlarge the poster so that it ts on the door that is 3 feet by 6 feet. Convert the dimensions to inches.
The dimensions in inches are 36 inches by 72 inches. By building a table, possible dimensions can be explored and generalizations can be made.
3 36
6 72
feet x 12 inches
1 foot inches
feet x 12 inches
1 foot inches
=
=
Scale factor
Widthin inches
Lengthin inches
8
17
25
34
1
2
3
4
5
11
22
33
44
5542
12
12
12
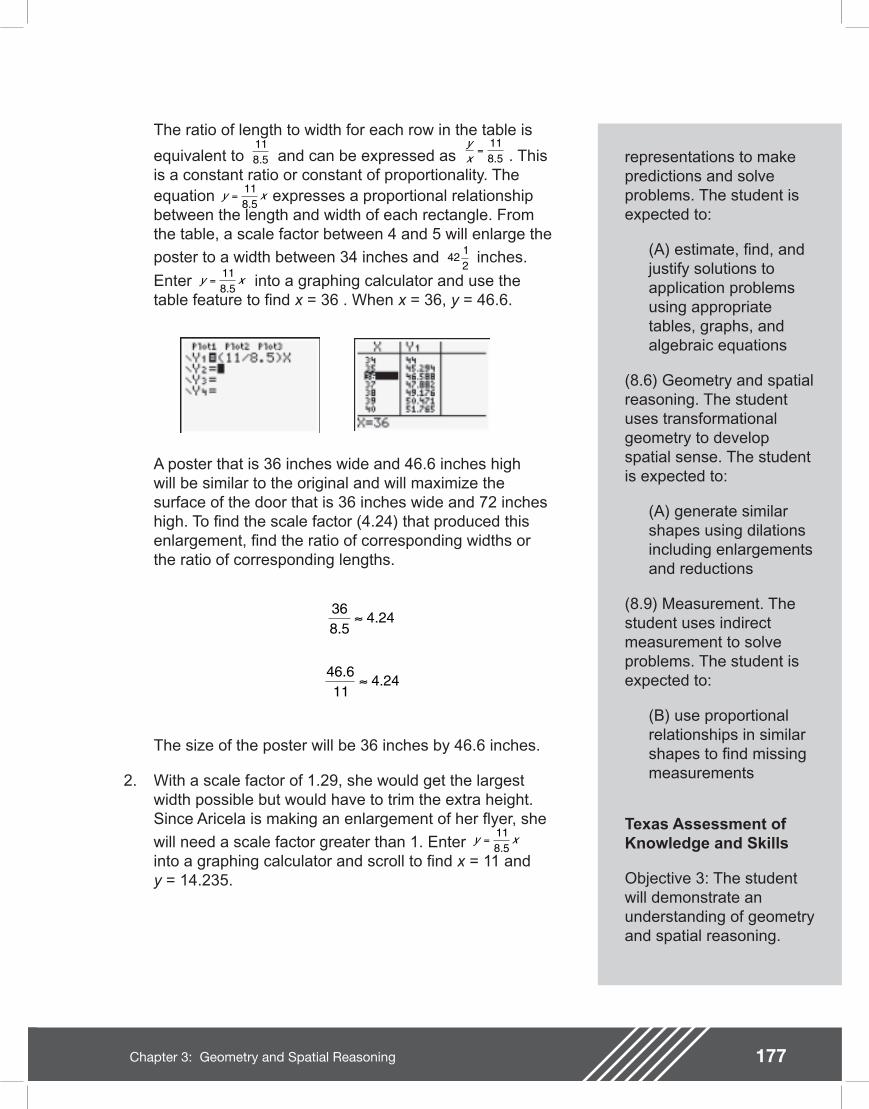
177Chapter 3: Geometry and Spatial Reasoning
representations to make predictions and solve problems. The student is expected to:
(A) estimate, nd, and justify solutions to application problems using appropriate tables, graphs, and algebraic equations
(8.6) Geometry and spatial reasoning. The student uses transformational geometry to develop spatial sense. The student is expected to:
(A) generate similar shapes using dilations including enlargements and reductions
(8.9) Measurement. The student uses indirect measurement to solve problems. The student is expected to:
(B) use proportional relationships in similar shapes to nd missing measurements
Texas Assessment of Knowledge and Skills
Objective 3: The student will demonstrate an understanding of geometry and spatial reasoning.
The ratio of length to width for each row in the table is
equivalent to and can be expressed as . This is a constant ratio or constant of proportionality. The equation expresses a proportional relationship between the length and width of each rectangle. From the table, a scale factor between 4 and 5 will enlarge the
poster to a width between 34 inches and inches.
Enter into a graphing calculator and use the table feature to nd x = 36 . When x = 36, y = 46.6.
A poster that is 36 inches wide and 46.6 inches high will be similar to the original and will maximize the surface of the door that is 36 inches wide and 72 inches high. To nd the scale factor (4.24) that produced this enlargement, nd the ratio of corresponding widths or the ratio of corresponding lengths.
The size of the poster will be 36 inches by 46.6 inches.
2. With a scale factor of 1.29, she would get the largest width possible but would have to trim the extra height. Since Aricela is making an enlargement of her yer, she
will need a scale factor greater than 1. Enter into a graphing calculator and scroll to nd x = 11 andy = 14.235.
118 5.
yx
=118 5.
y x=118 5.
4212
y x=118 5.
368 5
4 24.
.
46 611
4 24.
.
y x=118 5.
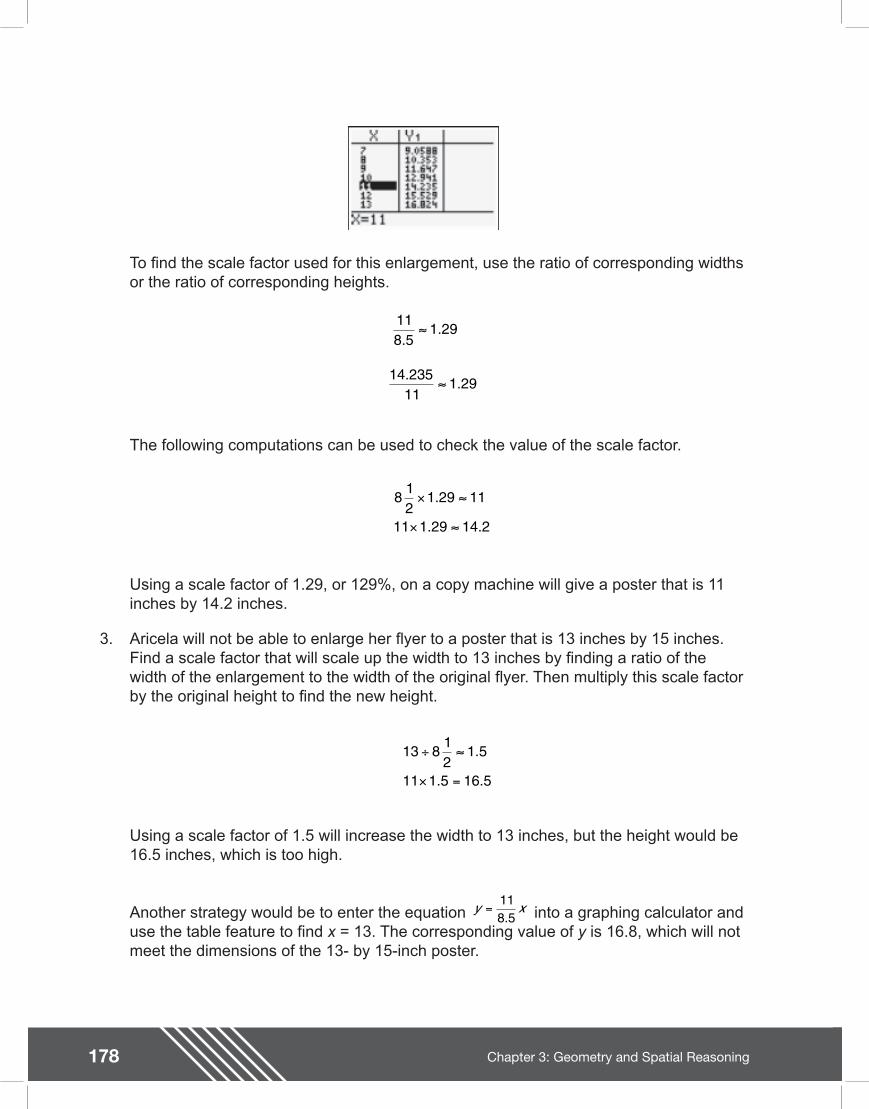
178 Chapter 3: Geometry and Spatial Reasoning
To nd the scale factor used for this enlargement, use the ratio of corresponding widths or the ratio of corresponding heights.
The following computations can be used to check the value of the scale factor.
Using a scale factor of 1.29, or 129%, on a copy machine will give a poster that is 11 inches by 14.2 inches.
3. Aricela will not be able to enlarge her yer to a poster that is 13 inches by 15 inches. Find a scale factor that will scale up the width to 13 inches by nding a ratio of the width of the enlargement to the width of the original yer. Then multiply this scale factor by the original height to nd the new height.
Using a scale factor of 1.5 will increase the width to 13 inches, but the height would be 16.5 inches, which is too high.
Another strategy would be to enter the equation into a graphing calculator and use the table feature to nd x = 13. The corresponding value of y is 16.8, which will not meet the dimensions of the 13- by 15-inch poster.
118 5
1 29.
.
14 23511
1 29.
.
812
1 29 11
11 1 29 14 2
×
×
.
. .
13 812
1 5
11 1 5 16 5
÷
× =
.
. .
y x=118 5.
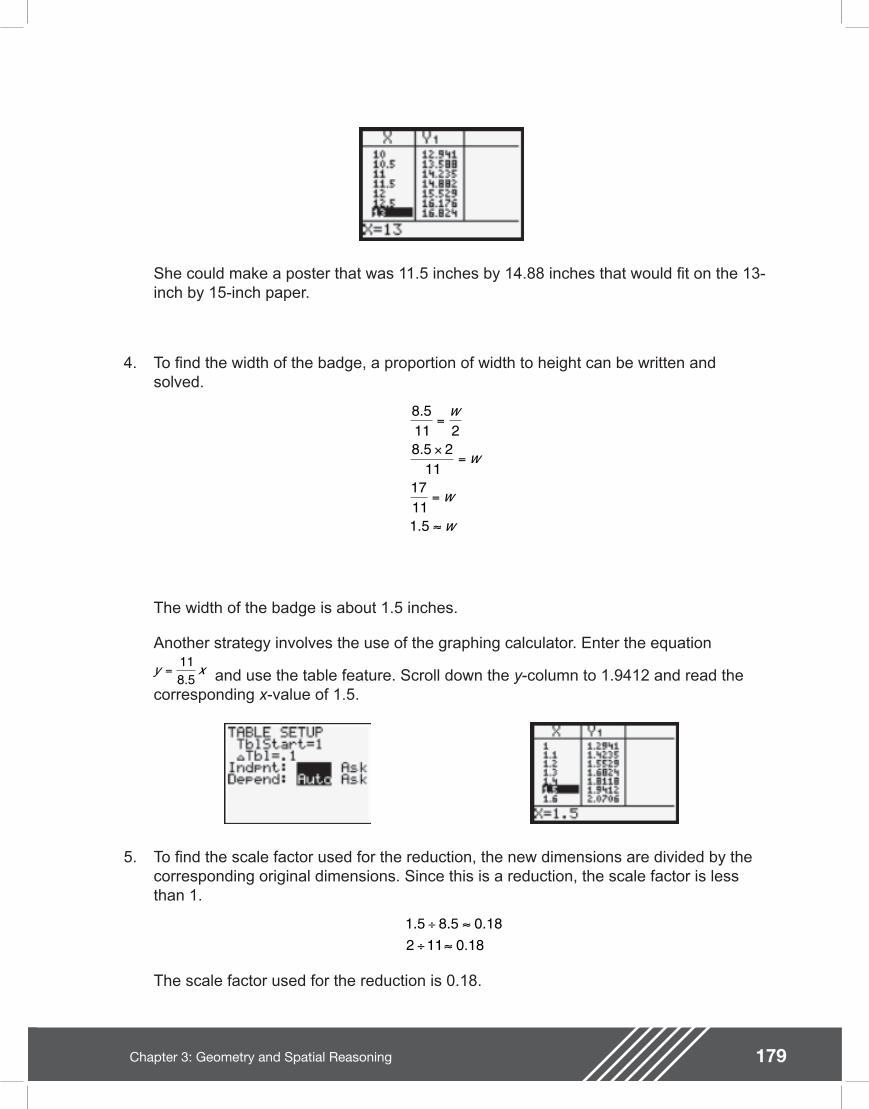
179Chapter 3: Geometry and Spatial Reasoning
She could make a poster that was 11.5 inches by 14.88 inches that would t on the 13-inch by 15-inch paper.
4. To nd the width of the badge, a proportion of width to height can be written and solved.
The width of the badge is about 1.5 inches.
Another strategy involves the use of the graphing calculator. Enter the equation
and use the table feature. Scroll down the y-column to 1.9412 and read the corresponding x-value of 1.5.
5. To nd the scale factor used for the reduction, the new dimensions are divided by the corresponding original dimensions. Since this is a reduction, the scale factor is less than 1.
The scale factor used for the reduction is 0.18.
8 511 28 5 2
1117111 5
.
.
.
=
×=
=
w
w
w
w
y x=118 5.
1 5 8 5 0 182 11 0 18. . .
.÷
÷
180 Chapter 3: Geometry and Spatial Reasoning
Extension Questions
�• On most copy machines, users are allowed to reduce or enlarge documents by specifying a percentage between 50% and 200%. How would you use the copy machine to reduce Aricela�’s yer to 25% of the original document?
A user would need to make a 50% reduction and then reduce the half-size yer by another 50%. Let x be a dimension of the original document.
Reduction by 50% means the new image is 0.50x.
Reducing by 50% again means the next image is 50% of 0.50x or 0.50(0.50x) = 0.25x or 25% of x.
181Chapter 3: Geometry and Spatial Reasoning
Student Work Sample
This student�’s work shows the use of scale factor.
The work exempli es many of the criteria on the solution guide, especially the following:
�• Describes mathematical relationships
�• Recognizes and applies proportional relationships
�• Develops and carries out a plan for solving a problem that includes understand the problem, select a strategy, solve the problem, and check
�• Solves problems involving proportional relationships using solution method(s) including equivalent ratios, scale factors, and equations
�• Evaluates the reasonableness or signi cance of the solution in the context of the problem
�• Demonstrates an understanding of mathematical concepts, processes, and skills
�• Communicates clear, detailed, and organized solution strategy
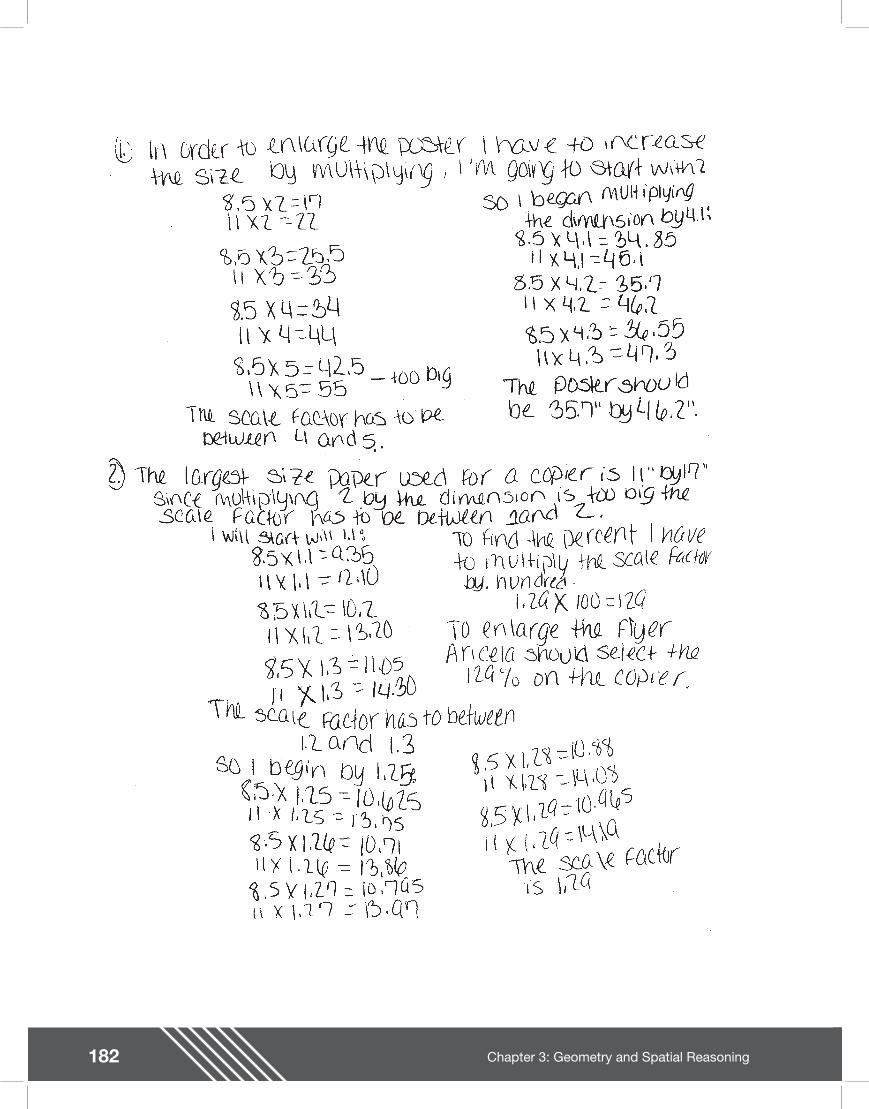
182 Chapter 3: Geometry and Spatial Reasoning
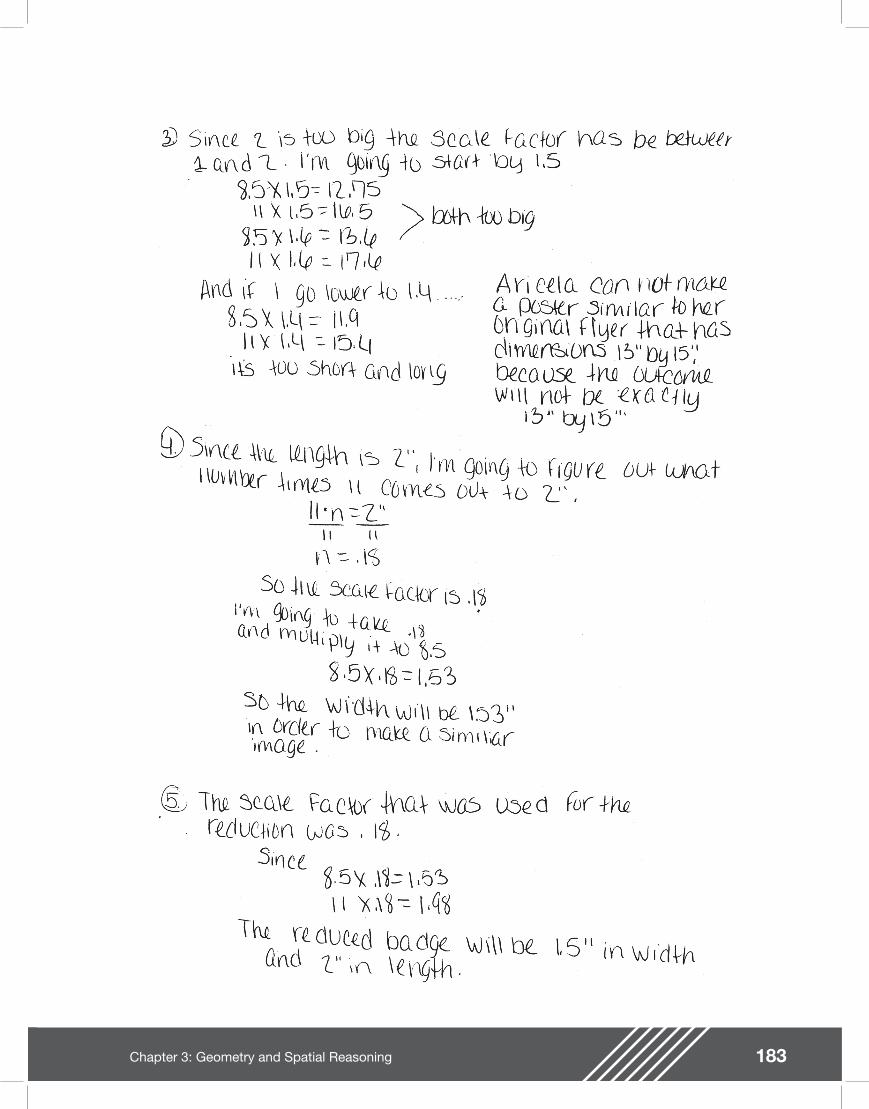
183Chapter 3: Geometry and Spatial Reasoning

184 Chapter 3: Geometry and Spatial Reasoning
Middle SchooIAssessments
Chapter 4:Measurement

186 Chapter 4: Measurement
187Chapter 4: Measurement
Lights at the Marleys�’ and Farleys�’
The Marley family and the Farley family are neighbors who live across the street from each other on Boxgarden Light Lane. They have been good friends for many years. Frequently, their projects for home improvement turn out to involve the same part of their homes.
For Halloween, both families like to hang lights on their windows. Last year both families bought orange lights. The Marley family bought a string of orange lights 20 feet long. The Farley family bought a string of orange lights 30 feet long.
This year, each family decided to decorate one additional window at each of their homes. Fortunately, additional orange lights were available in just the sizes they needed by the same company. The Marleys increased their orange light supply to 30 feet and the Farleys increased their orange light supply to 40 feet.
1. Which family increased their orange light supply more? Explain your thinking.
2. What was the percentage increase by length of lights for each of the families? Explain your thinking.
3. The neighbors in the other 12 homes on the Marley side of the street decide to decorate their homes with orange lights exactly like the Marleys. The neighbors in the other 10 homes on the Farley side of the street decide to decorate their homes with orange lights exactly like the Farleys. Is 280 yards of orange lights enough to light Boxgarden Light Lane this year? How do you know?
OVERARCHINGTHE MARLEYS AND
FARLEYSgrade 6
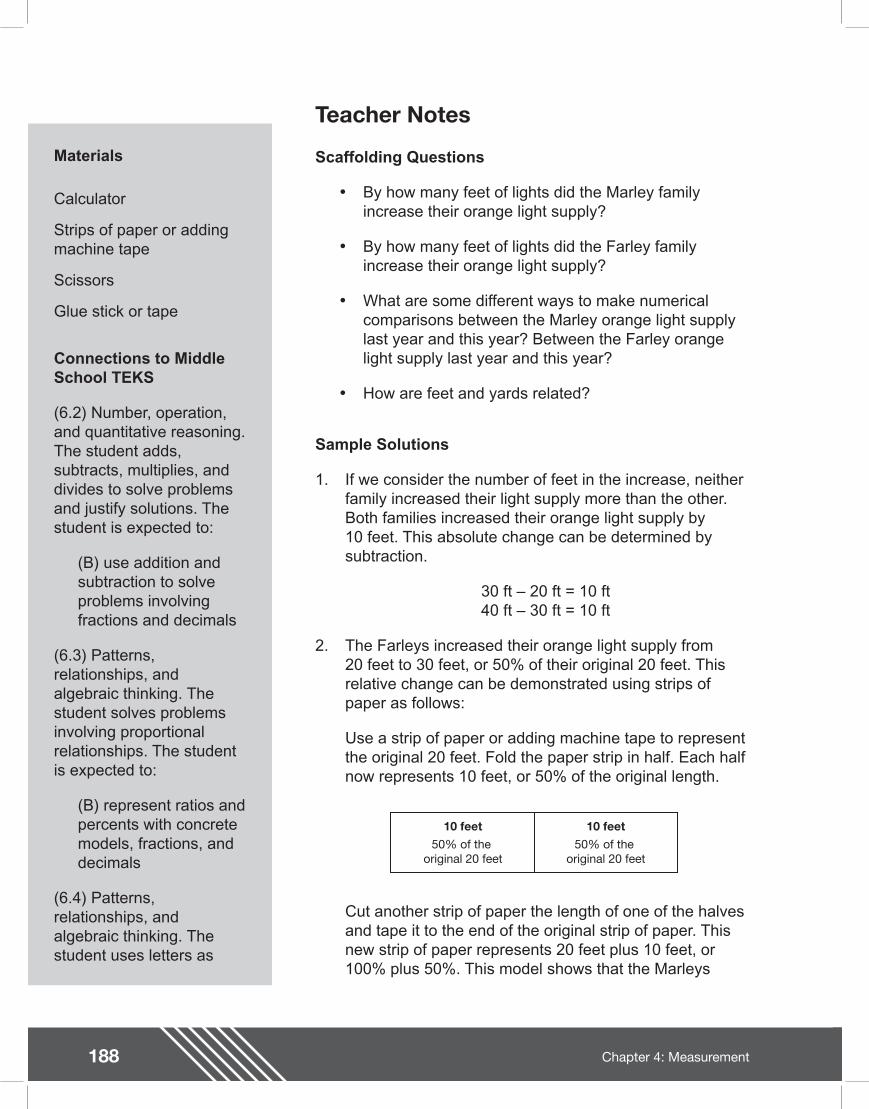
188 Chapter 4: Measurement
Teacher Notes
Materials
Calculator
Strips of paper or adding machine tape
Scissors
Glue stick or tape
Connections to Middle School TEKS
(6.2) Number, operation, and quantitative reasoning. The student adds, subtracts, multiplies, and divides to solve problems and justify solutions. The student is expected to:
(B) use addition and subtraction to solve problems involving fractions and decimals
(6.3) Patterns, relationships, and algebraic thinking. The student solves problems involving proportional relationships. The student is expected to:
(B) represent ratios and percents with concrete models, fractions, and decimals
(6.4) Patterns, relationships, and algebraic thinking. The student uses letters as
Scaffolding Questions
�• By how many feet of lights did the Marley family increase their orange light supply?
�• By how many feet of lights did the Farley family increase their orange light supply?
�• What are some different ways to make numerical comparisons between the Marley orange light supply last year and this year? Between the Farley orange light supply last year and this year?
�• How are feet and yards related?
Sample Solutions
1. If we consider the number of feet in the increase, neither family increased their light supply more than the other. Both families increased their orange light supply by 10 feet. This absolute change can be determined by subtraction.
30 ft �– 20 ft = 10 ft40 ft �– 30 ft = 10 ft
2. The Farleys increased their orange light supply from 20 feet to 30 feet, or 50% of their original 20 feet. This relative change can be demonstrated using strips of paper as follows:
Use a strip of paper or adding machine tape to represent the original 20 feet. Fold the paper strip in half. Each half now represents 10 feet, or 50% of the original length.
10 feet50% of the
original 20 feet
10 feet50% of the
original 20 feet
Cut another strip of paper the length of one of the halves and tape it to the end of the original strip of paper. This new strip of paper represents 20 feet plus 10 feet, or 100% plus 50%. This model shows that the Marleys
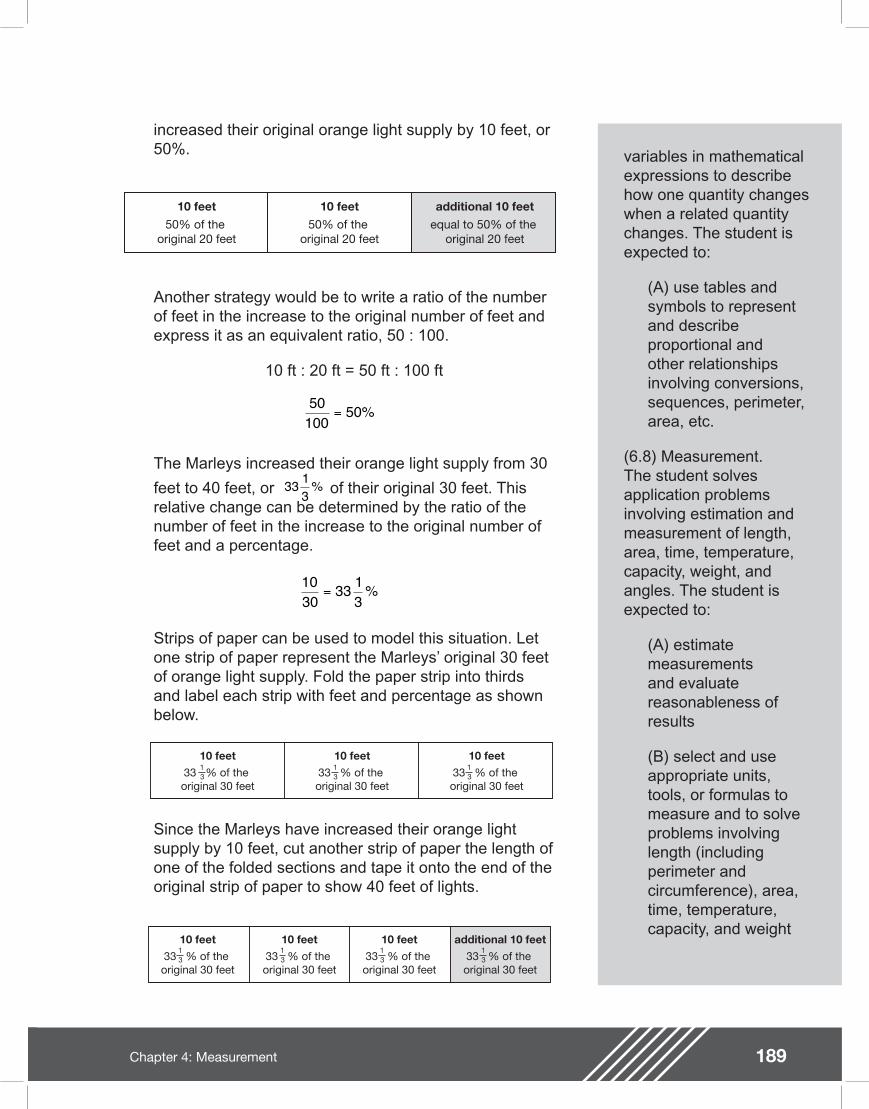
189Chapter 4: Measurement
variables in mathematical expressions to describe how one quantity changes when a related quantity changes. The student is expected to:
(A) use tables and symbols to represent and describe proportional and other relationships involving conversions, sequences, perimeter, area, etc.
(6.8) Measurement. The student solves application problems involving estimation and measurement of length, area, time, temperature, capacity, weight, and angles. The student is expected to:
(A) estimate measurements and evaluate reasonableness of results
(B) select and use appropriate units, tools, or formulas to measure and to solve problems involving length (including perimeter and circumference), area, time, temperature, capacity, and weight
increased their original orange light supply by 10 feet, or 50%.
10 feet50% of the
original 20 feet
10 feet50% of the
original 20 feet
Another strategy would be to write a ratio of the number of feet in the increase to the original number of feet and express it as an equivalent ratio, 50 : 100.
10 ft : 20 ft = 50 ft : 100 ft
The Marleys increased their orange light supply from 30
feet to 40 feet, or of their original 30 feet. This relative change can be determined by the ratio of the number of feet in the increase to the original number of feet and a percentage.
Strips of paper can be used to model this situation. Let one strip of paper represent the Marleys�’ original 30 feet of orange light supply. Fold the paper strip into thirds and label each strip with feet and percentage as shown below.
50100
50= %
33 13
%
1030
33 13
= %
10 feet33 % of the original 30 feet
10 feet33 % of the original 30 feet
10 feet33 % of the original 30 feet
13
13
13
Since the Marleys have increased their orange light supply by 10 feet, cut another strip of paper the length of one of the folded sections and tape it onto the end of the original strip of paper to show 40 feet of lights.
10 feet33 % of the original 30 feet
10 feet33 % of the original 30 feet
additional 10 feet33 % of the original 30 feet
10 feet33 % of the original 30 feet
13
13
13
13
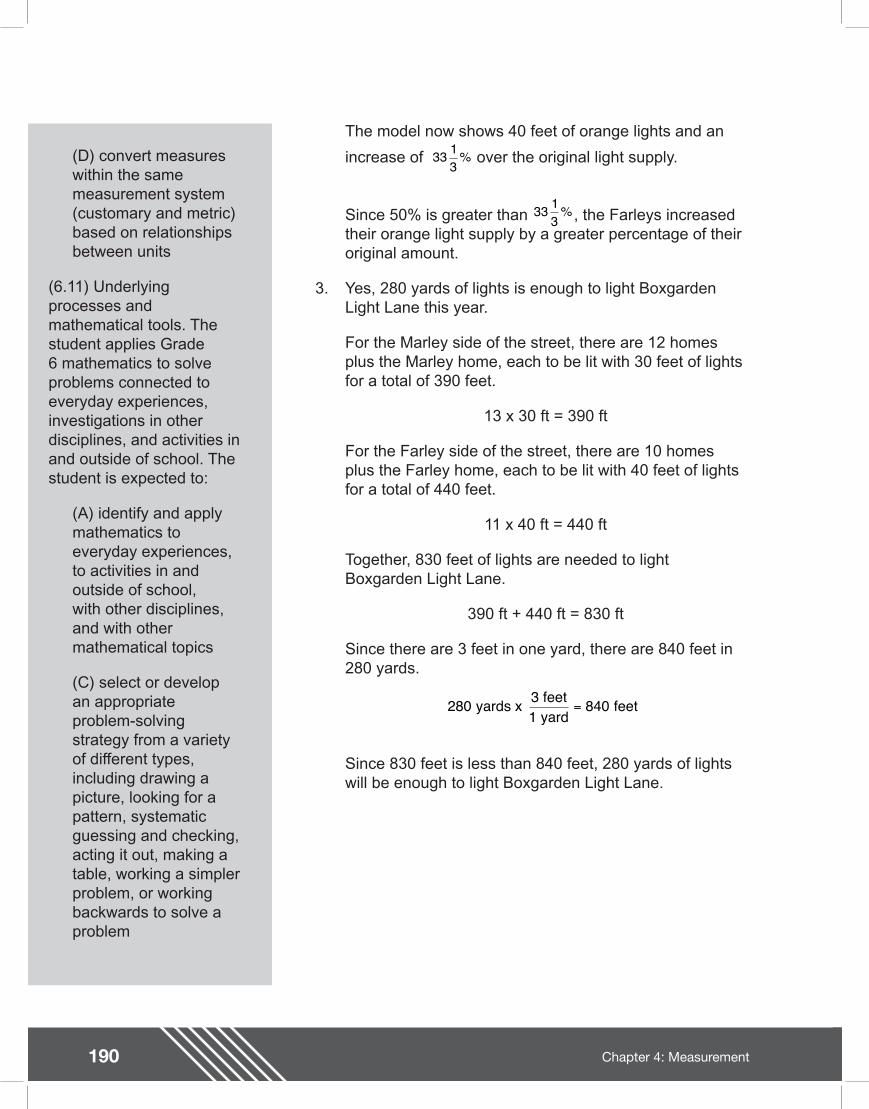
190 Chapter 4: Measurement
Teacher Notes
(D) convert measures within the same measurement system (customary and metric) based on relationships between units
(6.11) Underlying processes and mathematical tools. The student applies Grade 6 mathematics to solve problems connected to everyday experiences, investigations in other disciplines, and activities in and outside of school. The student is expected to:
(A) identify and apply mathematics to everyday experiences, to activities in and outside of school, with other disciplines, and with other mathematical topics
(C) select or develop an appropriate problem-solving strategy from a variety of different types, including drawing a picture, looking for a pattern, systematic guessing and checking, acting it out, making a table, working a simpler problem, or working backwards to solve a problem
The model now shows 40 feet of orange lights and an
increase of over the original light supply.
Since 50% is greater than , the Farleys increased their orange light supply by a greater percentage of their original amount.
3. Yes, 280 yards of lights is enough to light Boxgarden Light Lane this year.
For the Marley side of the street, there are 12 homes plus the Marley home, each to be lit with 30 feet of lights for a total of 390 feet.
13 x 30 ft = 390 ft
For the Farley side of the street, there are 10 homes plus the Farley home, each to be lit with 40 feet of lights for a total of 440 feet.
11 x 40 ft = 440 ft
Together, 830 feet of lights are needed to light Boxgarden Light Lane.
390 ft + 440 ft = 830 ft
Since there are 3 feet in one yard, there are 840 feet in 280 yards.
Since 830 feet is less than 840 feet, 280 yards of lights will be enough to light Boxgarden Light Lane.
33 13
%
33 13
%
280 840 yards x 3 feet1 yard
feet=
191Chapter 4: Measurement
(6.12) Underlying processes and mathematical tools. The student communicates about Grade 6 mathematics through informal and mathematical language, representations, and models. The student is expected to:
(A) communicate mathematical ideas using language, ef cient tools, appropriate units, and graphical, numerical, physical, or algebraic mathematical models
Texas Assessment of Knowledge and Skills
Objective 2: The student will demonstrate an understanding of patterns, relationships, and algebraic reasoning.
Objective 4: The student will demonstrate an understanding of the concepts and uses of measurement.
Extension Questions
�• If the number of houses varied, what rule could be used to show the relationship between the total number of feet of lights needed and the number of homes displaying lights in the same way as the Marleys�’ home?
f = 30h
The variable f represents the number of feet of lights needed, and h represents the number of homes that will display lights.
�• If the number of houses varied, what rule could be used to show the relationship between the total number of feet of lights needed and the number of homes displaying lights in the same way as the Farleys�’ home?
f = 40h
The variable f represents the number of feet of lights needed, and h represents the number of homes that will display lights.
�• For the winter holidays, all 24 homes on Boxgarden Light Lane agree to display 50 feet of white lights. Would 350 yards of white lights be enough to light Boxgarden Light Lane for the winter holidays? How do you know?
No, 350 yards of lights would not be enough. The 24 homes would need 1,200 feet of lights.
50 ft x 24 ft = 1,200 ft
Since 1 yard is the same as 3 feet, 350 yards is the same as 1,050 feet.
This would be 150 ft less than what is needed.
350 1 050 yards x 3 feet1 yard
feet= ,

192 Chapter 4: Measurement
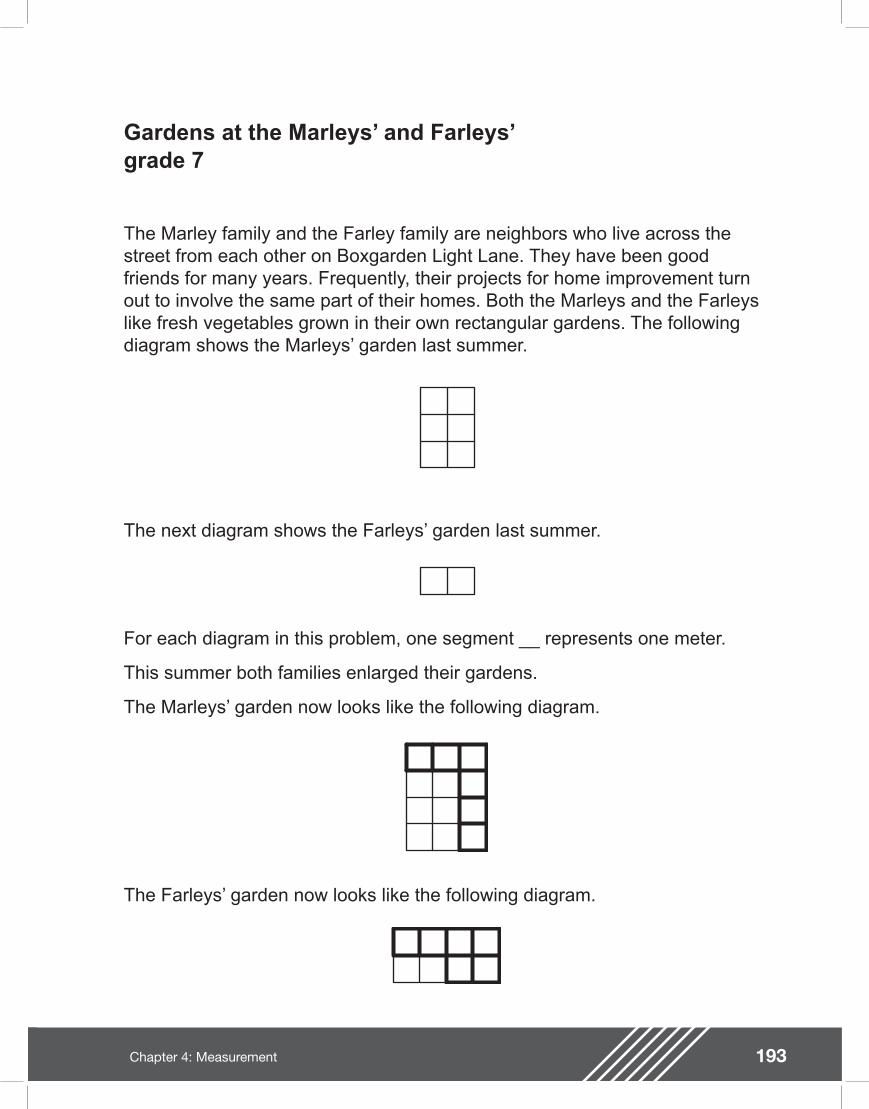
193Chapter 4: Measurement
For each diagram in this problem, one segment __ represents one meter.
This summer both families enlarged their gardens.
The Marleys�’ garden now looks like the following diagram.
Gardens at the Marleys�’ and Farleys�’
The Marley family and the Farley family are neighbors who live across the street from each other on Boxgarden Light Lane. They have been good friends for many years. Frequently, their projects for home improvement turn out to involve the same part of their homes. Both the Marleys and the Farleys like fresh vegetables grown in their own rectangular gardens. The following diagram shows the Marleys�’ garden last summer.
The next diagram shows the Farleys�’ garden last summer.
The Farleys�’ garden now looks like the following diagram.
grade 7
194 Chapter 4: Measurement
1. What are the dimensions of each garden for last summer and this summer?
2. Which family increased the size of their garden more? Describe how you determined your response.
3. Is your response to problem 2 the only possible answer? Explain.
4. Is the Marleys�’ new garden mathematically similar to their old garden? Is the Farleys�’ new garden mathematically similar to their old garden? Explain how you know if they are similar.

195Chapter 4: Measurement
196 Chapter 4: Measurement
Teacher Notes
Materials
Calculator
Color tiles or grid paper
Connections to Middle School TEKS
(7.2) Number, operation, and quantitative reasoning. The student adds, subtracts, multiplies, or divides to solve problems and justify solutions. The student is expected to:
(D) use division to nd unit rates and ratios in proportional relationships such as speed, density, price, recipes, and student-teacher ratio
(3) Patterns, relationships, and algebraic thinking. The student solves problems involving proportional relationships. The student is expected to:
(A) estimate and nd solutions to application problems involving percent
(B) estimate and nd solutions to application problems involving proportional relationships such as similarity, scaling,
Scaffolding Questions
�• What are the dimensions of each garden?
�• By how many square meters did the Marleys�’ garden increase?
�• By how many square meters did the Farleys�’ garden increase?
�• What is the percentage increase of the Marleys�’ garden from last summer to this summer?
�• What is the percentage increase of the Farleys�’ garden from last summer to this summer?
�• How can you use a pictorial model to represent the percentage increase of each garden from last summer to this summer?
�• What are some different ways to make numerical comparisons of the Marley and Farley gardens?
�• What are the critical attributes of similar shape?
�• How can you show similarity between the original Marley garden and the enlarged Marley garden? Between the original Farley garden and the enlarged Farley garden?
Sample Solutions
1. Last summer the Marley garden measured 2 meters by 3 meters. This summer the Marley garden measures 3 meters by 4 meters.
Last summer the Farley garden measured 1 meter by 2 meters. This summer the Farley garden measures 2 meters by 4 meters.
2. If we consider the number of square feet of increase in the garden, neither family increased their garden more than the other from last summer to this summer. Both families increased their garden by 6 square meters. This absolute change is determined by the subtraction of their areas.
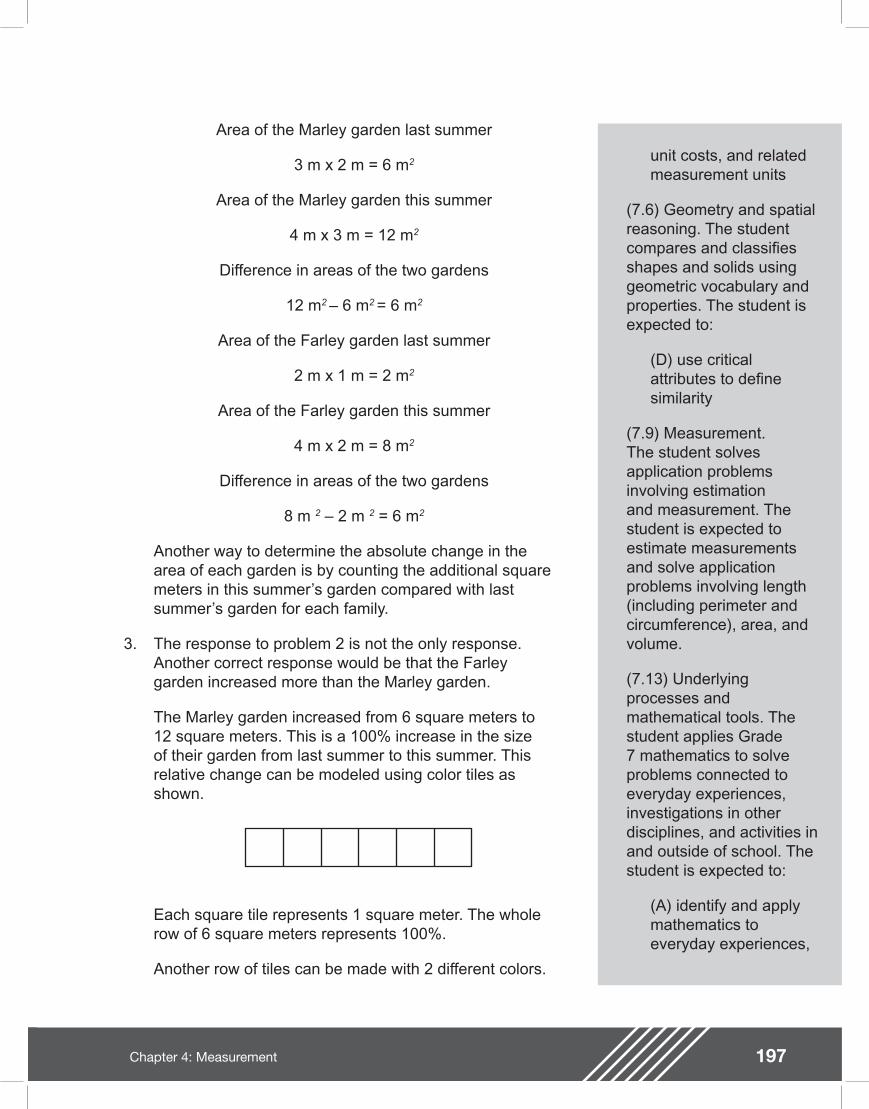
197Chapter 4: Measurement
unit costs, and related measurement units
(7.6) Geometry and spatial reasoning. The student compares and classi es shapes and solids using geometric vocabulary and properties. The student is expected to:
(D) use critical attributes to de ne similarity
(7.9) Measurement. The student solves application problems involving estimation and measurement. The student is expected to estimate measurements and solve application problems involving length (including perimeter and circumference), area, and volume.
(7.13) Underlying processes and mathematical tools. The student applies Grade 7 mathematics to solve problems connected to everyday experiences, investigations in other disciplines, and activities in and outside of school. The student is expected to:
(A) identify and apply mathematics to everyday experiences,
Area of the Marley garden last summer
3 m x 2 m = 6 m2
Area of the Marley garden this summer
4 m x 3 m = 12 m2
Difference in areas of the two gardens
12 m2 �– 6 m2 = 6 m2
Area of the Farley garden last summer
2 m x 1 m = 2 m2
Area of the Farley garden this summer
4 m x 2 m = 8 m2
Difference in areas of the two gardens
8 m 2 �– 2 m 2 = 6 m2
Another way to determine the absolute change in the area of each garden is by counting the additional square meters in this summer�’s garden compared with last summer�’s garden for each family.
3. The response to problem 2 is not the only response. Another correct response would be that the Farley garden increased more than the Marley garden.
The Marley garden increased from 6 square meters to 12 square meters. This is a 100% increase in the size of their garden from last summer to this summer. This relative change can be modeled using color tiles as shown.
Each square tile represents 1 square meter. The whole row of 6 square meters represents 100%.
Another row of tiles can be made with 2 different colors.
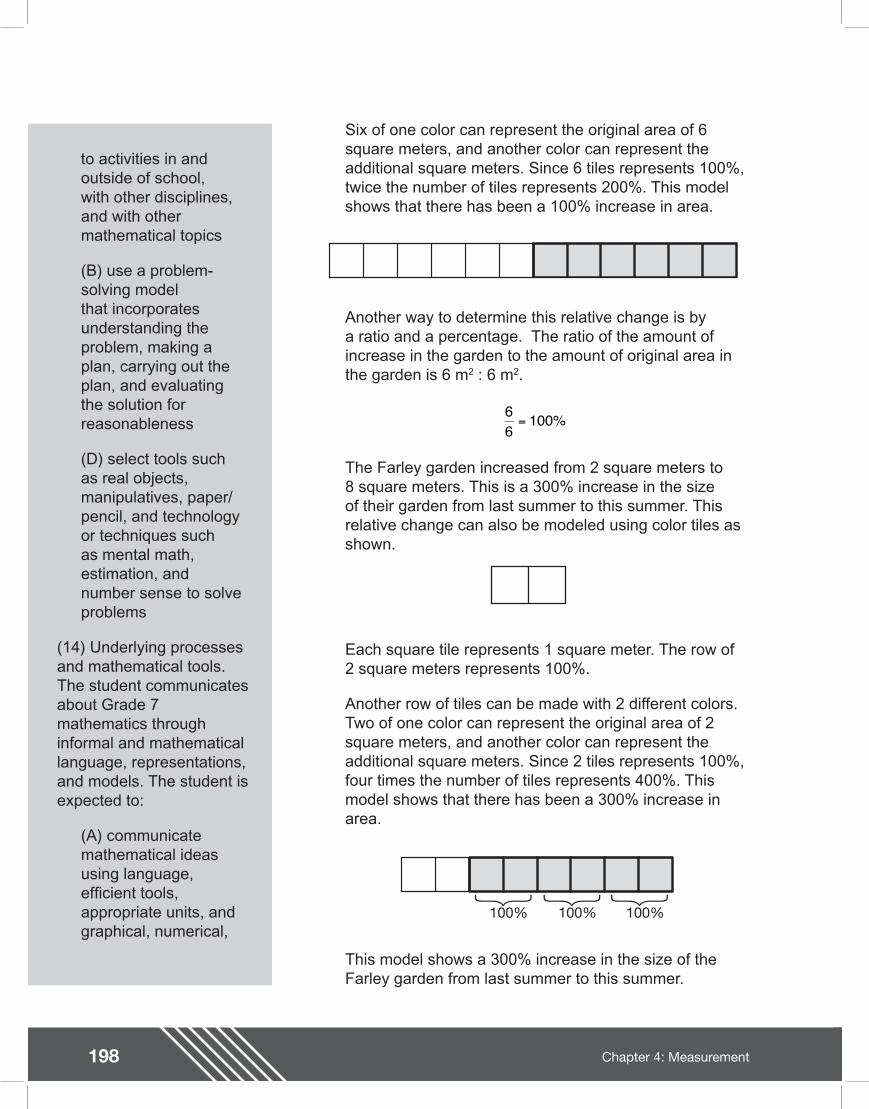
198 Chapter 4: Measurement
Teacher Notes
to activities in and outside of school, with other disciplines, and with other mathematical topics
(B) use a problem-solving model that incorporates understanding the problem, making a plan, carrying out the plan, and evaluating the solution for reasonableness
(D) select tools such as real objects, manipulatives, paper/pencil, and technology or techniques such as mental math, estimation, and number sense to solve problems
(14) Underlying processes and mathematical tools. The student communicates about Grade 7 mathematics through informal and mathematical language, representations, and models. The student is expected to:
(A) communicate mathematical ideas using language, ef cient tools, appropriate units, and graphical, numerical,
Six of one color can represent the original area of 6 square meters, and another color can represent the additional square meters. Since 6 tiles represents 100%, twice the number of tiles represents 200%. This model shows that there has been a 100% increase in area.
Another way to determine this relative change is by a ratio and a percentage. The ratio of the amount of increase in the garden to the amount of original area in the garden is 6 m2 : 6 m2.
The Farley garden increased from 2 square meters to 8 square meters. This is a 300% increase in the size of their garden from last summer to this summer. This relative change can also be modeled using color tiles as shown.
Each square tile represents 1 square meter. The row of 2 square meters represents 100%.
Another row of tiles can be made with 2 different colors. Two of one color can represent the original area of 2 square meters, and another color can represent the additional square meters. Since 2 tiles represents 100%, four times the number of tiles represents 400%. This model shows that there has been a 300% increase in area.
66
100= %
100% 100% 100%
This model shows a 300% increase in the size of the Farley garden from last summer to this summer.
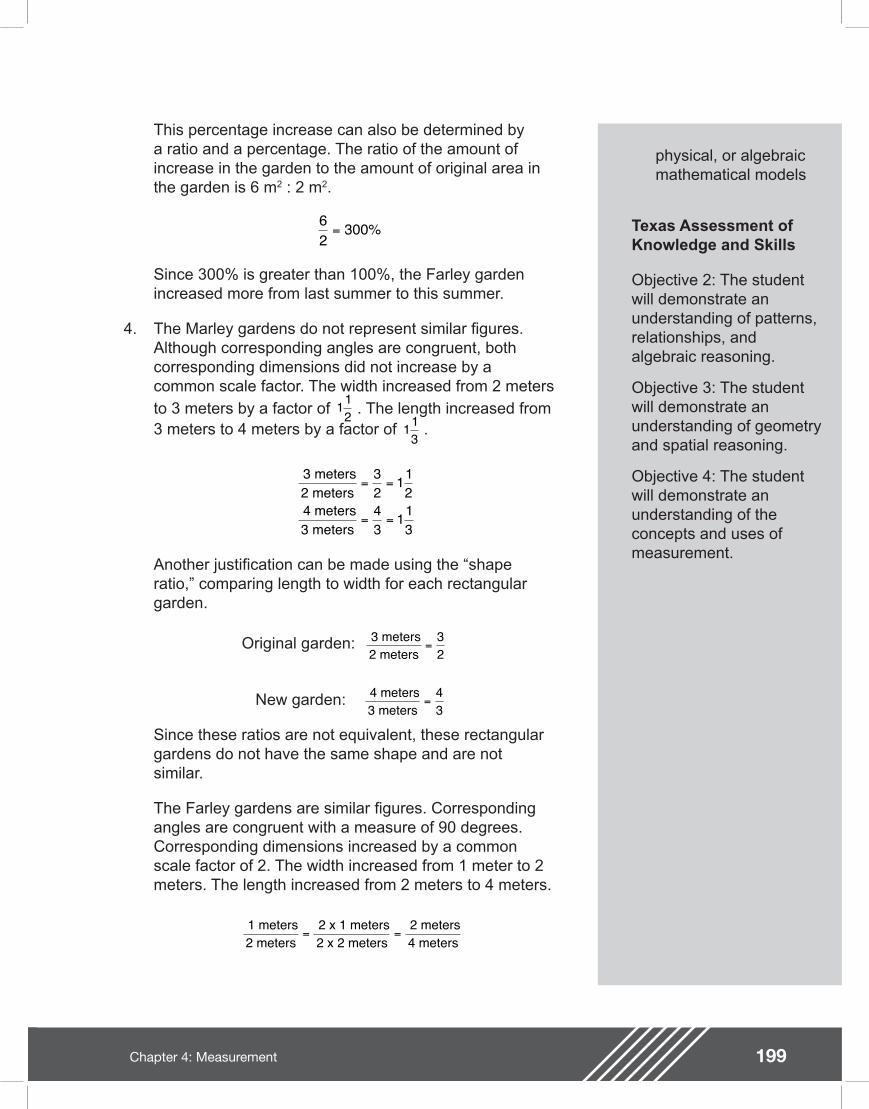
199Chapter 4: Measurement
physical, or algebraic mathematical models
Texas Assessment of Knowledge and Skills
Objective 2: The student will demonstrate an understanding of patterns, relationships, and algebraic reasoning.
Objective 3: The student will demonstrate an understanding of geometry and spatial reasoning.
Objective 4: The student will demonstrate an understanding of the concepts and uses of measurement.
This percentage increase can also be determined by a ratio and a percentage. The ratio of the amount of increase in the garden to the amount of original area in the garden is 6 m2 : 2 m2.
Since 300% is greater than 100%, the Farley garden increased more from last summer to this summer.
4. The Marley gardens do not represent similar gures. Although corresponding angles are congruent, both corresponding dimensions did not increase by a common scale factor. The width increased from 2 meters to 3 meters by a factor of . The length increased from 3 meters to 4 meters by a factor of .
Another justi cation can be made using the �“shape ratio,�” comparing length to width for each rectangular garden.
Original garden:
New garden:
Since these ratios are not equivalent, these rectangular gardens do not have the same shape and are not similar.
The Farley gardens are similar gures. Corresponding angles are congruent with a measure of 90 degrees. Corresponding dimensions increased by a common scale factor of 2. The width increased from 1 meter to 2 meters. The length increased from 2 meters to 4 meters.
62
300= %
112
113
3 meters2 meters
=32
4 meters3 meters
=43
1 meters2 meters
2 x 1 meters2 x 2 meters
2 meters4 meters
= =
3 meters2 meters 4 meters3 meters
= =
= =
32
112
43
113
200 Chapter 4: Measurement
By comparing the �“shape ratios�” for the original and new gardens, it can be shown that the rectangular gardens are similar.
Original garden: l : w = 2 : 1
New garden: l : w = 4 : 2
2 : 1 = 4 : 2
Since these ratios are equivalent, the gardens have similar shapes.
Extension Questions
�• This summer both families decided to fence in their gardens. Fencing costs $1.50 per meter. Find the cost of the fence for each garden.
The perimeter of the Marley garden this summer is 14 meters. At $1.50 per meter, their cost for fencing is $21.
Perimeter: 2 x 4 m + 2 x 3 m = 14 m
14 m x $1.50 per meter = $21
The perimeter of the Farley garden this summer is 12 meters. At $1.50 per meter, their cost for fencing is $18.
Perimeter: 2 x 2 m + 2 x 4 m = 12 m
12 m x $1.50 per meter = $18
�• If the Marleys had increased the dimensions of their garden by the same scale factor as the Farleys increased their garden, what would be the dimensions of the Marley garden this summer?
If the dimensions of the Marley garden increased by the same scale factor of 2 as the Farley garden increased, the dimensions of the Marley garden this summer would be 4 meters by 6 meters.
2 m x 2 = 4 m
3 m x 2 = 6 m
�• How does the scale factor of 2 for the increase in the dimensions of the Farleys�’ garden affect the increase in area?
The area of the Farley garden increased from 2 m2 to 8 m2, which is a factor of 4. A factor of 4 is the square of the scale factor 2.
22 = 4
8 m 2 m
2
2 =41
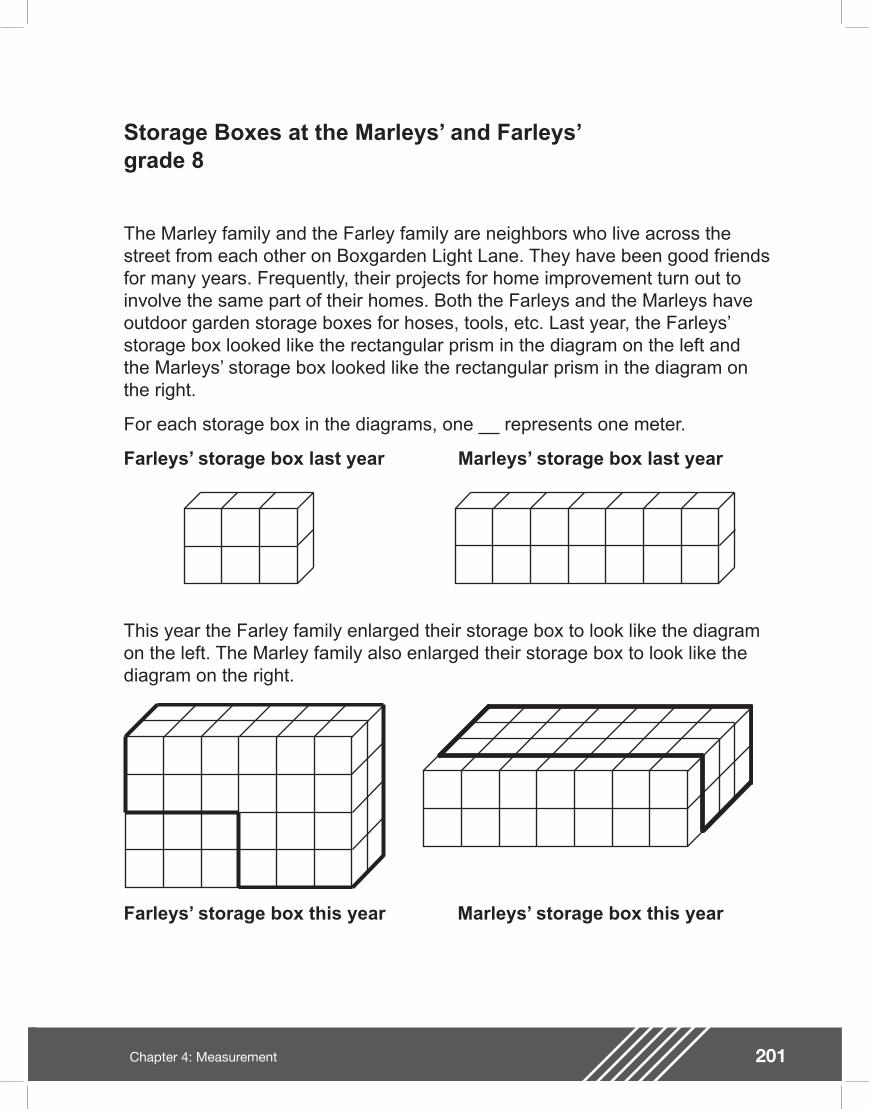
201Chapter 4: Measurement
Storage Boxes at the Marleys�’ and Farleys�’
The Marley family and the Farley family are neighbors who live across the street from each other on Boxgarden Light Lane. They have been good friends for many years. Frequently, their projects for home improvement turn out to involve the same part of their homes. Both the Farleys and the Marleys have outdoor garden storage boxes for hoses, tools, etc. Last year, the Farleys�’ storage box looked like the rectangular prism in the diagram on the left and the Marleys�’ storage box looked like the rectangular prism in the diagram on the right.
For each storage box in the diagrams, one __ represents one meter.
Farleys�’ storage box last year Marleys�’ storage box last year
This year the Farley family enlarged their storage box to look like the diagram on the left. The Marley family also enlarged their storage box to look like the diagram on the right.
Farleys�’ storage box this year Marleys�’ storage box this year
grade 8
202 Chapter 4: Measurement
1. What are the dimensions of each storage box?
2. Which family increased the size of their storage box more? Describe how you determined your response.
3. Is your response to problem 2 the only possible answer? Explain your thinking.
4. Is the Marleys�’ new storage box mathematically similar to their old storage box? Is the Farleys�’ new storage box mathematically similar to their old storage box? Explain how you know if they are similar.

203Chapter 4: Measurement
204 Chapter 4: Measurement
Teacher Notes
Materials
Calculator
Cubes or Isometric Dot Paper
Connections to Middle School TEKS
(8.2) Number, operation, and quantitative reasoning. The student selects and uses appropriate operations to solve problems and justify solutions. The student is expected to:
(D) use multiplication by a constant factor (unit rate) to represent proportional relationships; for example, the arm span of a gibbon is about 1.4 times its height, a = 1.4h
(8.3) Patterns, relationships, and algebraic thinking. The student identi es proportional relationships in problem situations and solves problems. The student is expected to:
(A) compare and contrast proportional and non-proportional relationships
Scaffolding Questions
�• What are the dimensions of each storage box?
�• By how many cubic meters did the Marley storage box increase?
�• By how many cubic meters did the Farley storage box increase?
�• What are some different ways to make numerical comparisons between the volume of the Marley storage boxes last year and this year? Between the volume of the Farley storage boxes last year and this year?
�• What are the critical attributes of similar rectangular prisms?
Sample Solutions
1. The dimensions of the Farleys�’ storage box last year were 3 meters by 1 meter by 2 meters. The dimensions of the Farleys�’ storage box this year are 6 meters by 2 meters by 4 meters.
The dimensions of the Marleys�’ storage box last year were 7 meters by 1 meter by 2 meters. The dimensions of the Marleys�’ storage box this year are 7 meters by 4 meters by 2 meters.
2. Neither family increased the volume of their storage box more than the other this year. Both families increased the volume of their storage boxes by 42 cubic meters. This absolute change is determined by the difference of their volumes.
3 m x 1 m x 2 m = 6 m3
6 m x 2 m x 4 m = 48 m3
48 m3 �– 6 m3 = 42 m3
7 m x 1 m x 2 m = 14 m3
7 m x 2 m x 4 m = 56 m3
56 m3 �– 14 m3 = 42 m3
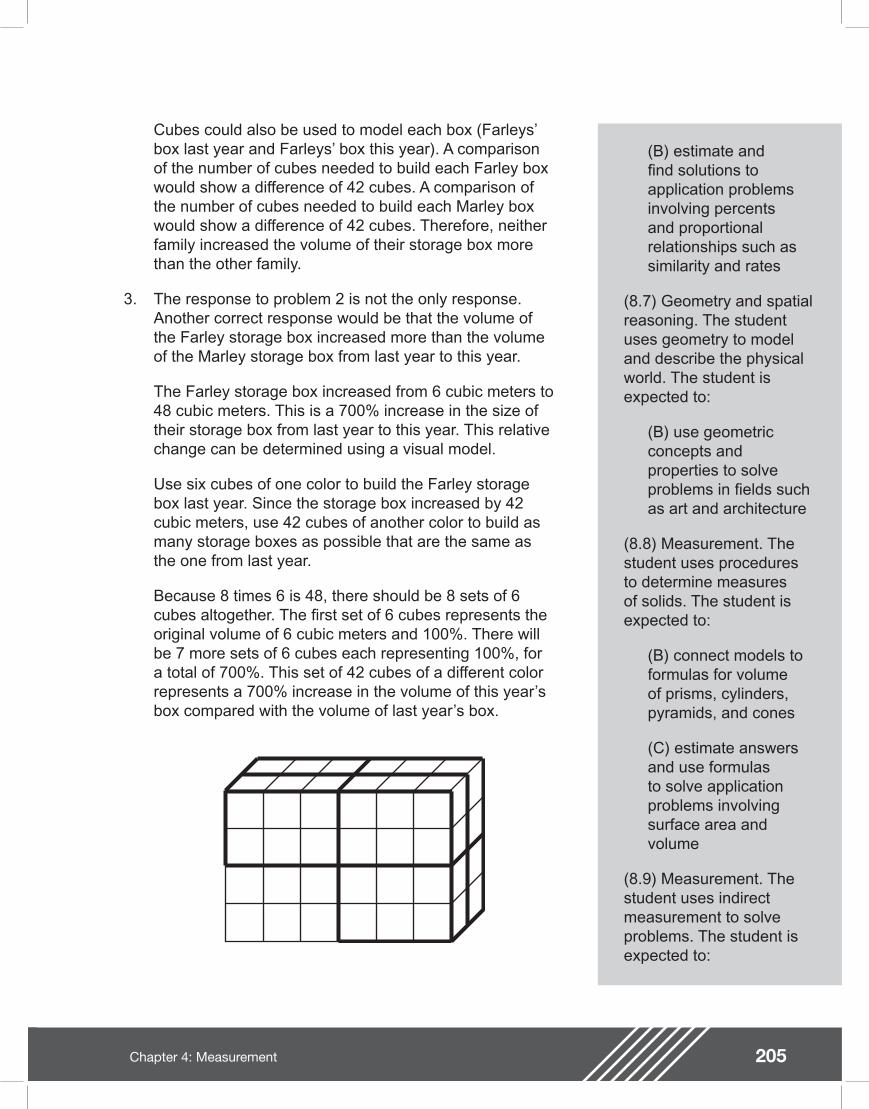
205Chapter 4: Measurement
(B) estimate and nd solutions to application problems involving percents and proportional relationships such as similarity and rates
(8.7) Geometry and spatial reasoning. The student uses geometry to model and describe the physical world. The student is expected to:
(B) use geometric concepts and properties to solve problems in elds such as art and architecture
(8.8) Measurement. The student uses procedures to determine measures of solids. The student is expected to:
(B) connect models to formulas for volume of prisms, cylinders, pyramids, and cones
(C) estimate answers and use formulas to solve application problems involving surface area and volume
(8.9) Measurement. The student uses indirect measurement to solve problems. The student is expected to:
Cubes could also be used to model each box (Farleys�’ box last year and Farleys�’ box this year). A comparison of the number of cubes needed to build each Farley box would show a difference of 42 cubes. A comparison of the number of cubes needed to build each Marley box would show a difference of 42 cubes. Therefore, neither family increased the volume of their storage box more than the other family.
3. The response to problem 2 is not the only response. Another correct response would be that the volume of the Farley storage box increased more than the volume of the Marley storage box from last year to this year.
The Farley storage box increased from 6 cubic meters to 48 cubic meters. This is a 700% increase in the size of their storage box from last year to this year. This relative change can be determined using a visual model.
Use six cubes of one color to build the Farley storage box last year. Since the storage box increased by 42 cubic meters, use 42 cubes of another color to build as many storage boxes as possible that are the same as the one from last year.
Because 8 times 6 is 48, there should be 8 sets of 6 cubes altogether. The rst set of 6 cubes represents the original volume of 6 cubic meters and 100%. There will be 7 more sets of 6 cubes each representing 100%, for a total of 700%. This set of 42 cubes of a different color represents a 700% increase in the volume of this year�’s box compared with the volume of last year�’s box.
206 Chapter 4: Measurement
Teacher Notes(B) use proportional relationships in similar shapes to nd missing measurements
(8.10) Measurement. The student describes how changes in dimensions affect linear, area, and volume measures. The student is expected to:
(B) describe the resulting effect on volume when dimensions of a solid are changed proportionally
(8.14) Underlying processes and mathematical tools. The student applies Grade 8 mathematics to solve problems connected to everyday experiences, investigations in other disciplines, and activities in and outside of school. The student is expected to:
(A) identify and apply mathematics to everyday experiences, to activities in and outside of school, with other disciplines, and with other mathematical topics
(B) use a problem-solving model that incorporates
Another way to show this relative change is by using a ratio expressed as a fraction and its equivalent percentage. The ratio is the ratio of the number of cubic meters of increase in volume to the original volume.
The volume of the Marley storage box increased from 14 cubic meters to 56 cubic meters. This is a 300% increase in the size of their storage box from last year to this year. This relative change can be modeled with cubes as described in the Farley problem. Use 14 cubes of one color to build the Marley storage box for last year. Then use 42 cubes of a different color to build 3 more boxes.
Because 4 times 14 is 56, there should be 4 sets of 14 cubes altogether. The rst set of 14 cubes represents the original volume of 14 cubic meters and 100%. There will be 3 more sets of 14 cubes, each representing 100%, for a total of 300%. This set of 42 cubes of a different color represents a 300% increase in the volume of this year�’s box compared to the volume of last year�’s box.
This can also be demonstrated using the ratio of the number of cubic meters of increase in volume to the original volume.
4. The Marley storage boxes do not represent similar solids. Although corresponding angles are congruent, all three corresponding dimensions do not increase by a scale factor. The length and height did not change; however, the width changed from 1 meter to 4 meters, a factor of 4. If the solids were similar the dimensions would have all changed by the same scale factor.
The Farley storage boxes do represent similar solids. Corresponding angles are 90 degrees because the storage boxes are rectangular prisms. Corresponding dimensions increased by a scale factor of 2. The
42 71
700100
700 m6 m
3
3 = = = %
42 31
300100
300 m14 m
3
3 = = = %
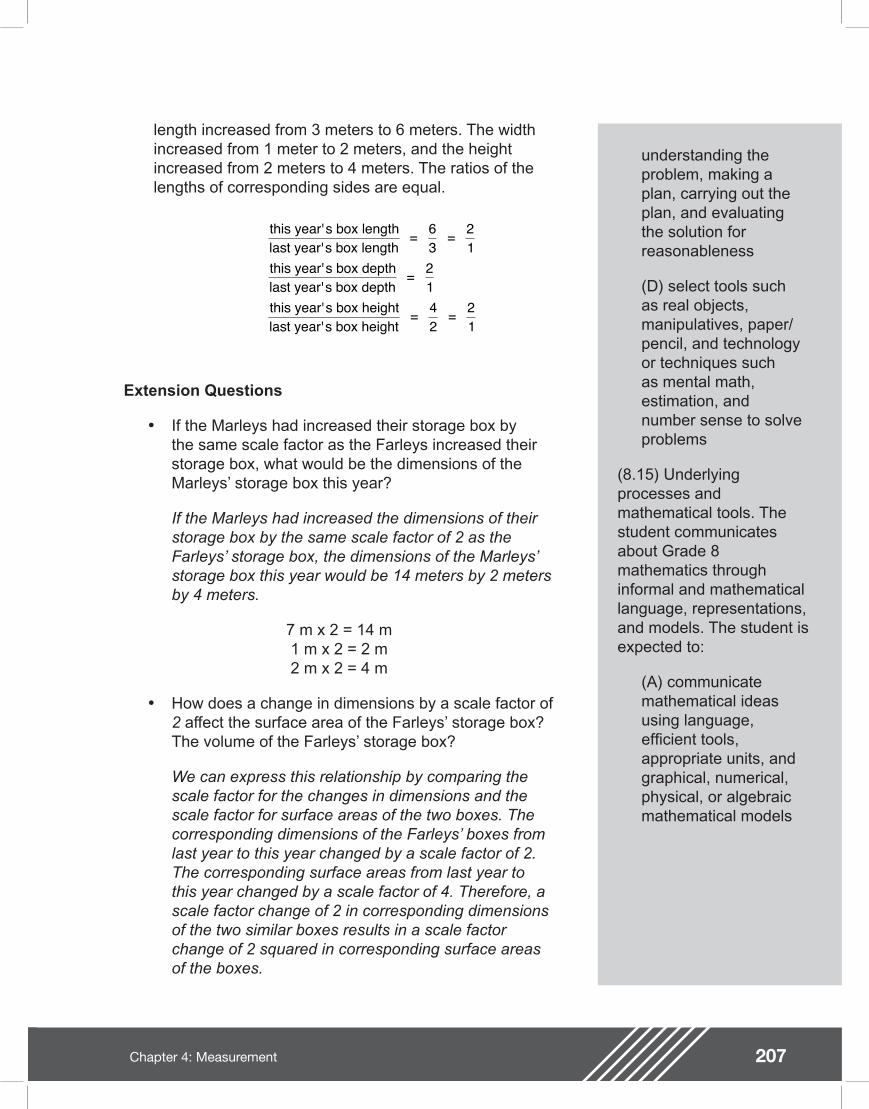
207Chapter 4: Measurement
understanding the problem, making a plan, carrying out the plan, and evaluating the solution for reasonableness
(D) select tools such as real objects, manipulatives, paper/pencil, and technology or techniques such as mental math, estimation, and number sense to solve problems
(8.15) Underlying processes and mathematical tools. The student communicates about Grade 8 mathematics through informal and mathematical language, representations, and models. The student is expected to:
(A) communicate mathematical ideas using language, ef cient tools, appropriate units, and graphical, numerical, physical, or algebraic mathematical models
length increased from 3 meters to 6 meters. The width increased from 1 meter to 2 meters, and the height increased from 2 meters to 4 meters. The ratios of the lengths of corresponding sides are equal.
Extension Questions
�• If the Marleys had increased their storage box by the same scale factor as the Farleys increased their storage box, what would be the dimensions of the Marleys�’ storage box this year?
If the Marleys had increased the dimensions of their storage box by the same scale factor of 2 as the Farleys�’ storage box, the dimensions of the Marleys�’ storage box this year would be 14 meters by 2 meters by 4 meters.
7 m x 2 = 14 m 1 m x 2 = 2 m2 m x 2 = 4 m
�• How does a change in dimensions by a scale factor of 2 affect the surface area of the Farleys�’ storage box? The volume of the Farleys�’ storage box?
We can express this relationship by comparing the scale factor for the changes in dimensions and the scale factor for surface areas of the two boxes. The corresponding dimensions of the Farleys�’ boxes from last year to this year changed by a scale factor of 2. The corresponding surface areas from last year to this year changed by a scale factor of 4. Therefore, a scale factor change of 2 in corresponding dimensions of the two similar boxes results in a scale factor change of 2 squared in corresponding surface areas of the boxes.
this year' s box lengthlast year' s box length
= 63
= 21
this year' s box depthlast year' s box depth
= 21
this year' s box heightlast year' s box height
= 42
= 21
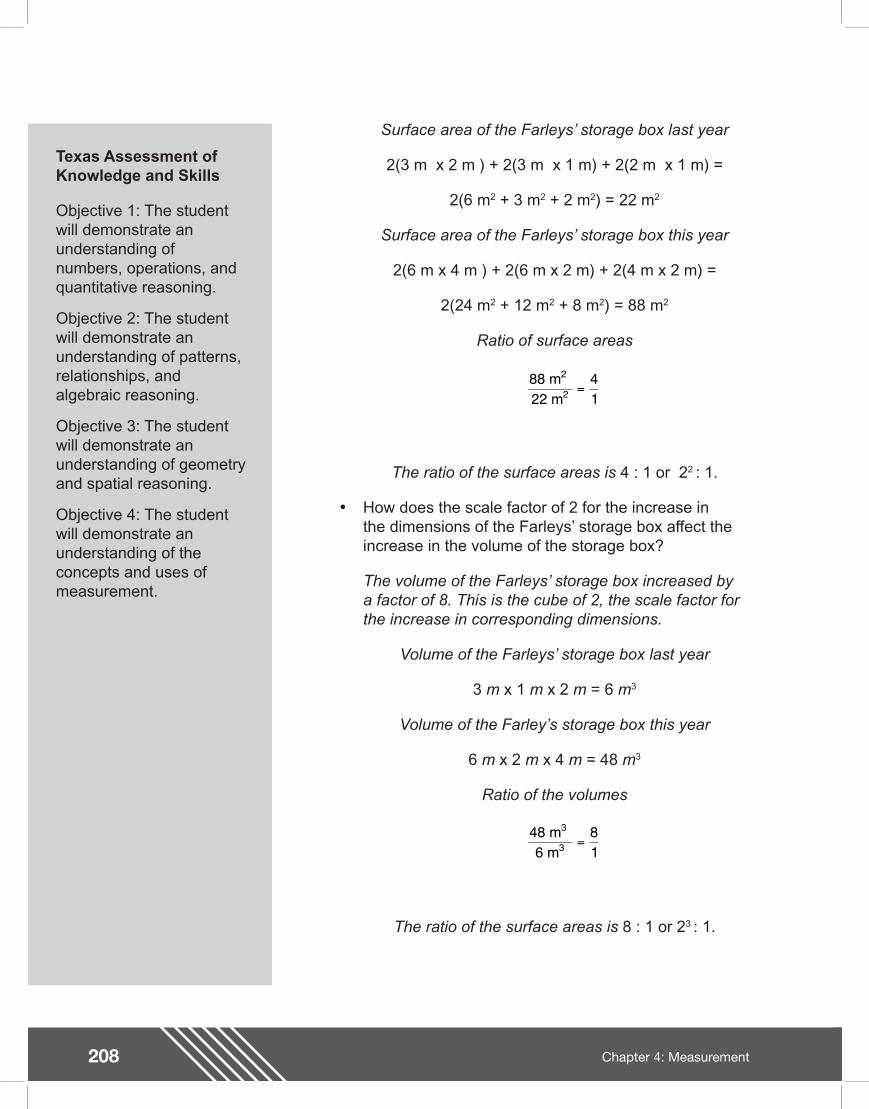
208 Chapter 4: Measurement
Teacher Notes
Texas Assessment of Knowledge and Skills
Objective 1: The student will demonstrate an understanding of numbers, operations, and quantitative reasoning.
Objective 2: The student will demonstrate an understanding of patterns, relationships, and algebraic reasoning.
Objective 3: The student will demonstrate an understanding of geometry and spatial reasoning.
Objective 4: The student will demonstrate an understanding of the concepts and uses of measurement.
Surface area of the Farleys�’ storage box last year
2(3 m x 2 m ) + 2(3 m x 1 m) + 2(2 m x 1 m) =
2(6 m2 + 3 m2 + 2 m2) = 22 m2
Surface area of the Farleys�’ storage box this year
2(6 m x 4 m ) + 2(6 m x 2 m) + 2(4 m x 2 m) =
2(24 m2 + 12 m2 + 8 m2) = 88 m2
Ratio of surface areas
The ratio of the surface areas is 4 : 1 or 22 : 1.
�• How does the scale factor of 2 for the increase in the dimensions of the Farleys�’ storage box affect the increase in the volume of the storage box?
The volume of the Farleys�’ storage box increased by a factor of 8. This is the cube of 2, the scale factor for the increase in corresponding dimensions.
Volume of the Farleys�’ storage box last year
3 m x 1 m x 2 m = 6 m3
Volume of the Farley�’s storage box this year
6 m x 2 m x 4 m = 48 m3
Ratio of the volumes
The ratio of the surface areas is 8 : 1 or 23 : 1.
88 m 22 m
2
2 =41
48 m 6 m
3
3 =81

209Chapter 4: Measurement

210 Chapter 4: Measurement
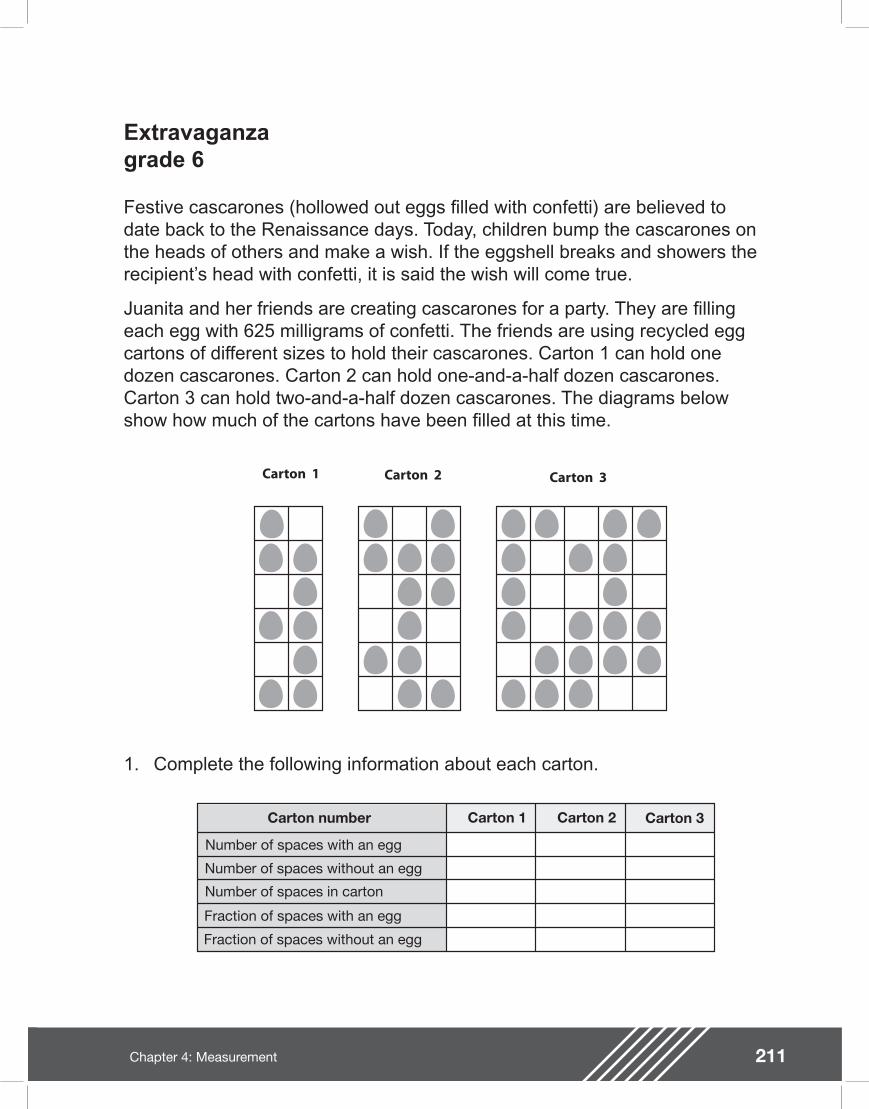
211Chapter 4: Measurement
Extravaganzagrade 6
Festive cascarones (hollowed out eggs lled with confetti) are believed to date back to the Renaissance days. Today, children bump the cascarones on the heads of others and make a wish. If the eggshell breaks and showers the recipient�’s head with confetti, it is said the wish will come true.
Juanita and her friends are creating cascarones for a party. They are lling each egg with 625 milligrams of confetti. The friends are using recycled egg cartons of different sizes to hold their cascarones. Carton 1 can hold one dozen cascarones. Carton 2 can hold one-and-a-half dozen cascarones. Carton 3 can hold two-and-a-half dozen cascarones. The diagrams below show how much of the cartons have been lled at this time.
Carton 1 Carton 2 Carton 3
1. Complete the following information about each carton.
Carton number
Number of spaces with an egg
Number of spaces without an egg
Number of spaces in carton
Fraction of spaces with an egg
Fraction of spaces without an egg
Carton 1 Carton 2 Carton 3
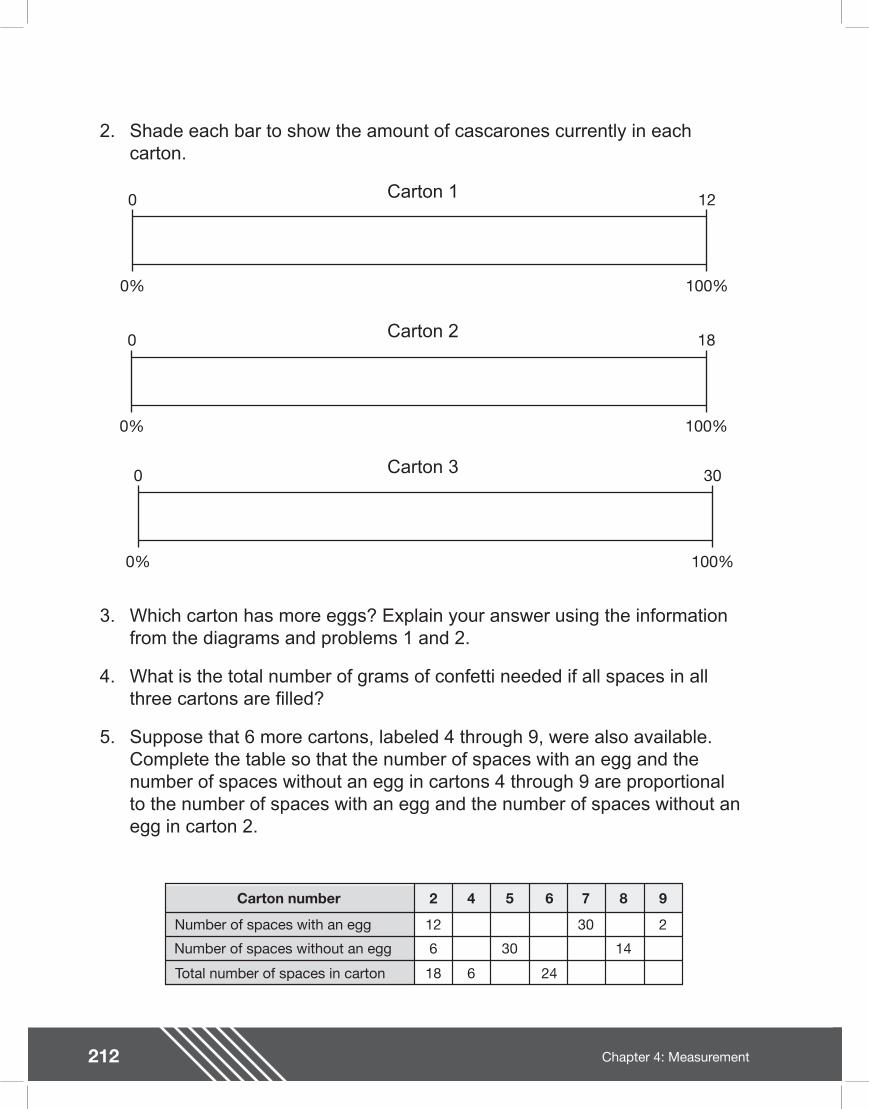
212 Chapter 4: Measurement
2. Shade each bar to show the amount of cascarones currently in each carton.
Carton 1
3. Which carton has more eggs? Explain your answer using the information from the diagrams and problems 1 and 2.
4. What is the total number of grams of confetti needed if all spaces in all three cartons are lled?
5. Suppose that 6 more cartons, labeled 4 through 9, were also available. Complete the table so that the number of spaces with an egg and the number of spaces without an egg in cartons 4 through 9 are proportional to the number of spaces with an egg and the number of spaces without an egg in carton 2.
Carton 2
Carton 3
Carton number
Number of spaces with an egg
Number of spaces without an egg
Total number of spaces in carton
2 4 5 6 7 8 9
12
6
18 6
30
30
14
2
24

213Chapter 4: Measurement
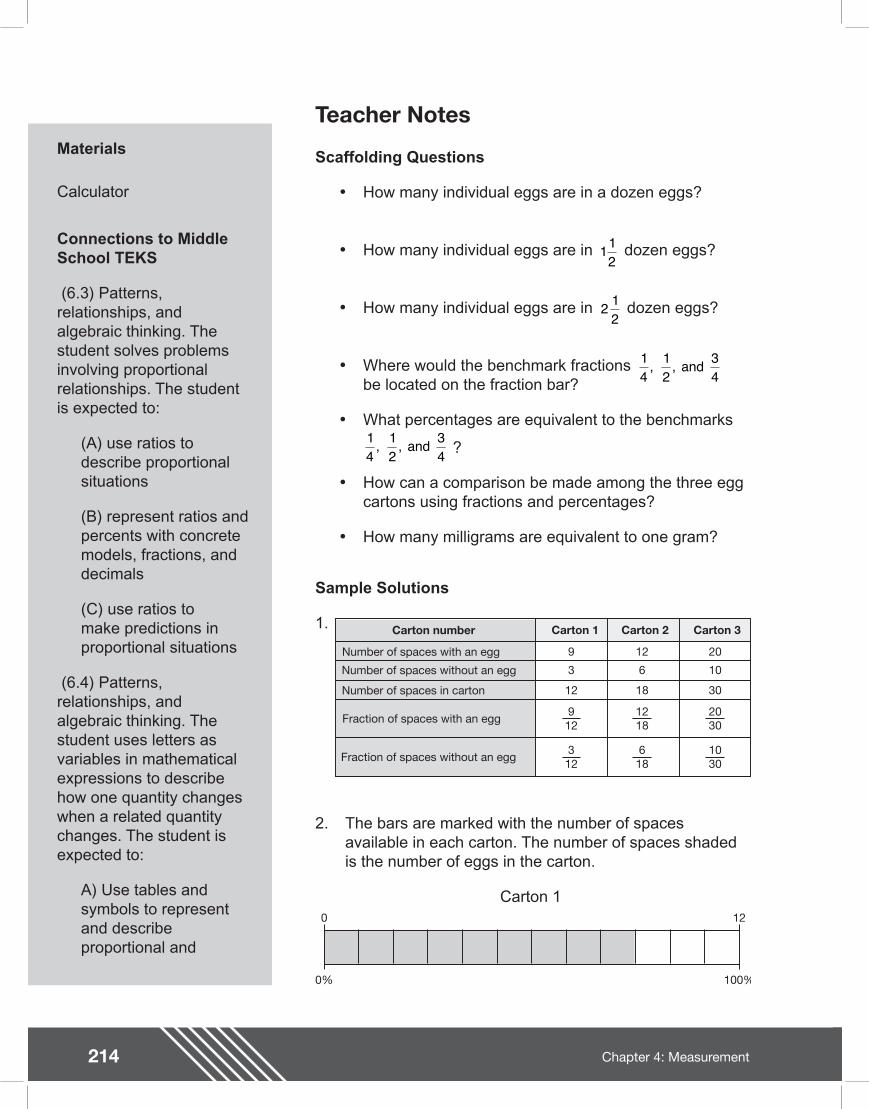
214 Chapter 4: Measurement
Teacher NotesMaterials
Calculator
Connections to Middle School TEKS
(6.3) Patterns, relationships, and algebraic thinking. The student solves problems involving proportional relationships. The student is expected to:
(A) use ratios to describe proportional situations
(B) represent ratios and percents with concrete models, fractions, and decimals
(C) use ratios to make predictions in proportional situations
(6.4) Patterns, relationships, and algebraic thinking. The student uses letters as variables in mathematical expressions to describe how one quantity changes when a related quantity changes. The student is expected to:
A) Use tables and symbols to represent and describe proportional and
Scaffolding Questions
�• How many individual eggs are in a dozen eggs?
�• How many individual eggs are in dozen eggs?
�• How many individual eggs are in dozen eggs?
�• Where would the benchmark fractions be located on the fraction bar?
�• What percentages are equivalent to the benchmarks
?
�• How can a comparison be made among the three egg cartons using fractions and percentages?
�• How many milligrams are equivalent to one gram?
Sample Solutions
1.
112
2 12
14
, 12
, and 34
14
, 12
, and 34
Carton number
Number of spaces with an egg
Number of spaces without an egg
Number of spaces in carton
Fraction of spaces with an egg
Fraction of spaces without an egg
Carton 1 Carton 2 Carton 3
9
3
12
12
6
18
20
10
30
912
312
1218
618
2030
1030
2. The bars are marked with the number of spaces available in each carton. The number of spaces shaded is the number of eggs in the carton.
Carton 10 12
0% 100%
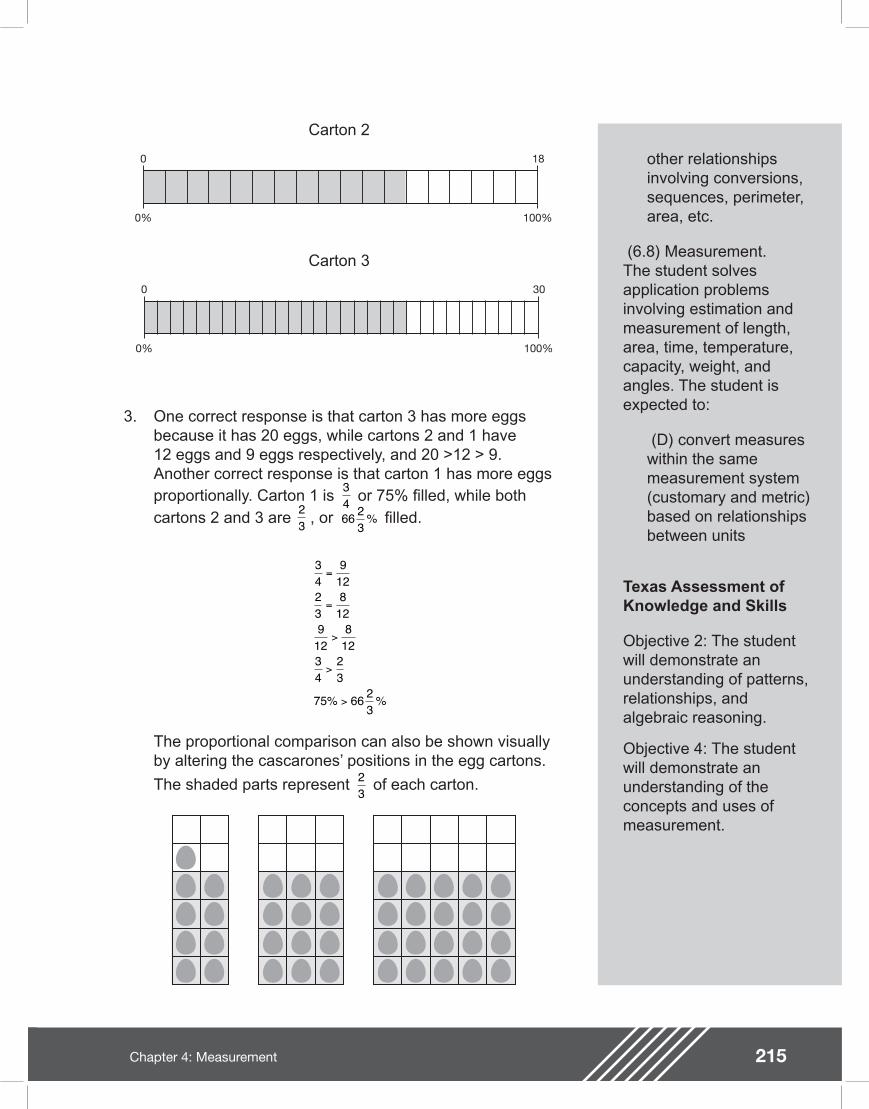
215Chapter 4: Measurement
other relationships involving conversions, sequences, perimeter, area, etc.
(6.8) Measurement. The student solves application problems involving estimation and measurement of length, area, time, temperature, capacity, weight, and angles. The student is expected to:
(D) convert measures within the same measurement system (customary and metric) based on relationships between units
Texas Assessment of Knowledge and Skills
Objective 2: The student will demonstrate an understanding of patterns, relationships, and algebraic reasoning.
Objective 4: The student will demonstrate an understanding of the concepts and uses of measurement.
Carton 2
0 18
0% 100%
Carton 3
0 30
0% 100%
3. One correct response is that carton 3 has more eggs because it has 20 eggs, while cartons 2 and 1 have 12 eggs and 9 eggs respectively, and 20 >12 > 9. Another correct response is that carton 1 has more eggs proportionally. Carton 1 is or 75% lled, while both cartons 2 and 3 are , or lled.
The proportional comparison can also be shown visually by altering the cascarones�’ positions in the egg cartons.
The shaded parts represent of each carton.
342
3 66 23
%
34
912
23
812
912
812
34
23
75 66 23
=
=
>
>
>% %
23
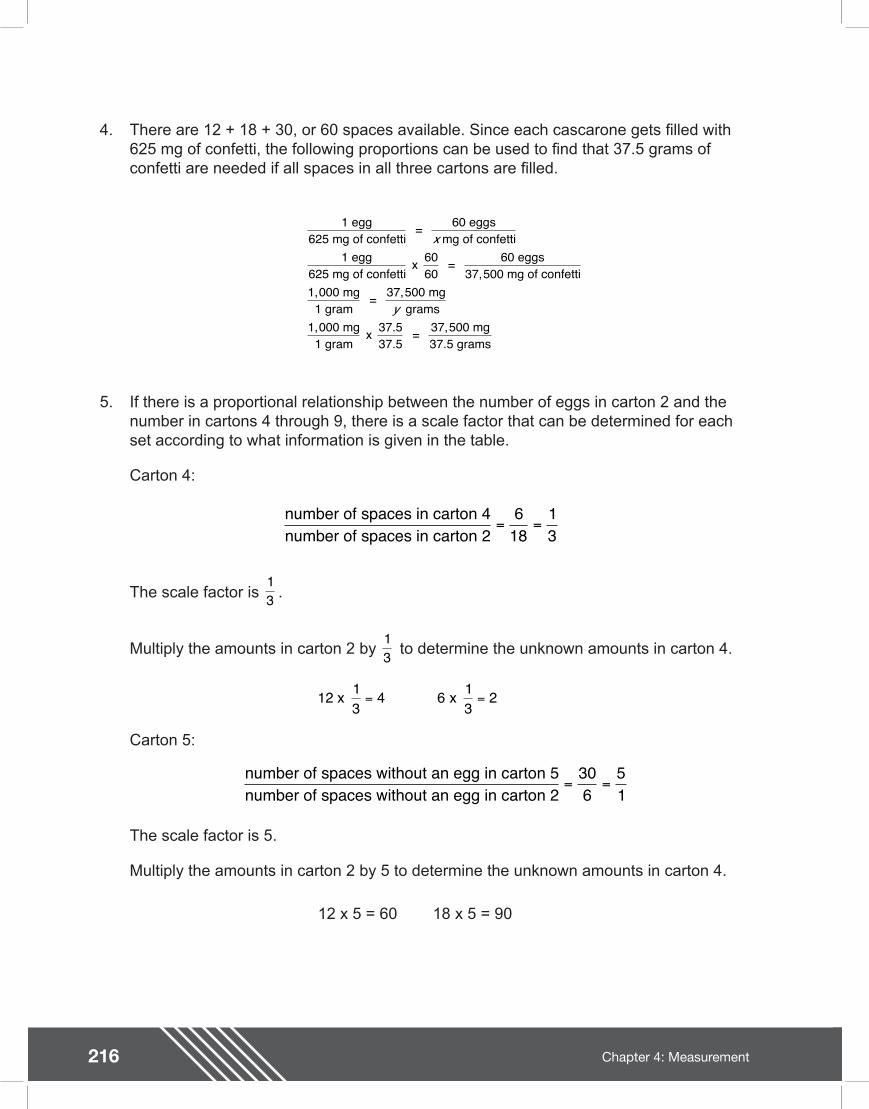
216 Chapter 4: Measurement
4. There are 12 + 18 + 30, or 60 spaces available. Since each cascarone gets lled with 625 mg of confetti, the following proportions can be used to nd that 37.5 grams of confetti are needed if all spaces in all three cartons are lled.
5. If there is a proportional relationship between the number of eggs in carton 2 and the number in cartons 4 through 9, there is a scale factor that can be determined for each set according to what information is given in the table.
Carton 4:
The scale factor is .
Multiply the amounts in carton 2 by to determine the unknown amounts in carton 4.
Carton 5:
The scale factor is 5.
Multiply the amounts in carton 2 by 5 to determine the unknown amounts in carton 4.
12 x 5 = 60 18 x 5 = 90
1 egg625 mg of confetti
= 60 eggs mg of confetti
1 egg625 mg of confetti
x 6060
= 60 eggs37,500 mg of confetti
1,000 mg1 gram
= 37,500 mg grams
1,000 mg1 gram
x 37.537.5
= 37,500 mg37.5 grams
x
y
number of spaces in carton 4number of spaces in carton 2
= =6
1813
13
13
1 13
4 6 13
22 x x = =
number of spaces without an egg in carton 5number of spaces without an egg in carton 2
= =306
51
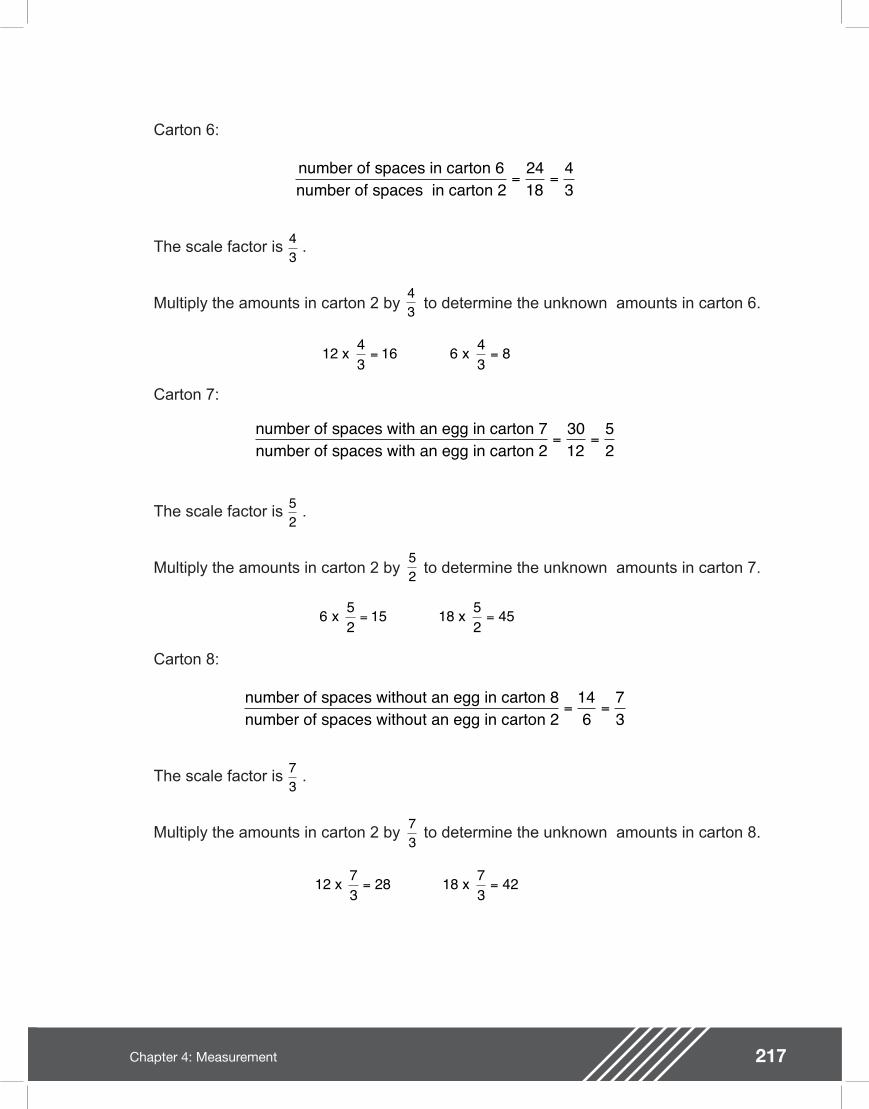
217Chapter 4: Measurement
Carton 6:
The scale factor is .
Multiply the amounts in carton 2 by to determine the unknown amounts in carton 6.
Carton 7:
The scale factor is .
Multiply the amounts in carton 2 by to determine the unknown amounts in carton 7.
Carton 8:
The scale factor is .
Multiply the amounts in carton 2 by to determine the unknown amounts in carton 8.
number of spaces in carton 6number of spaces in carton 2
= =2418
43
43
43
1 43
16 6 43
82 x x = =
number of spaces with an egg in carton 7number of spaces with an egg in carton 2
= =3012
52
52
52
6 52
15 1 52
45 x 8 x = =
number of spaces without an egg in carton 8number of spaces without an egg in carton 2
= =146
73
73
73
1 73
28 1 73
422 x 8 x = =
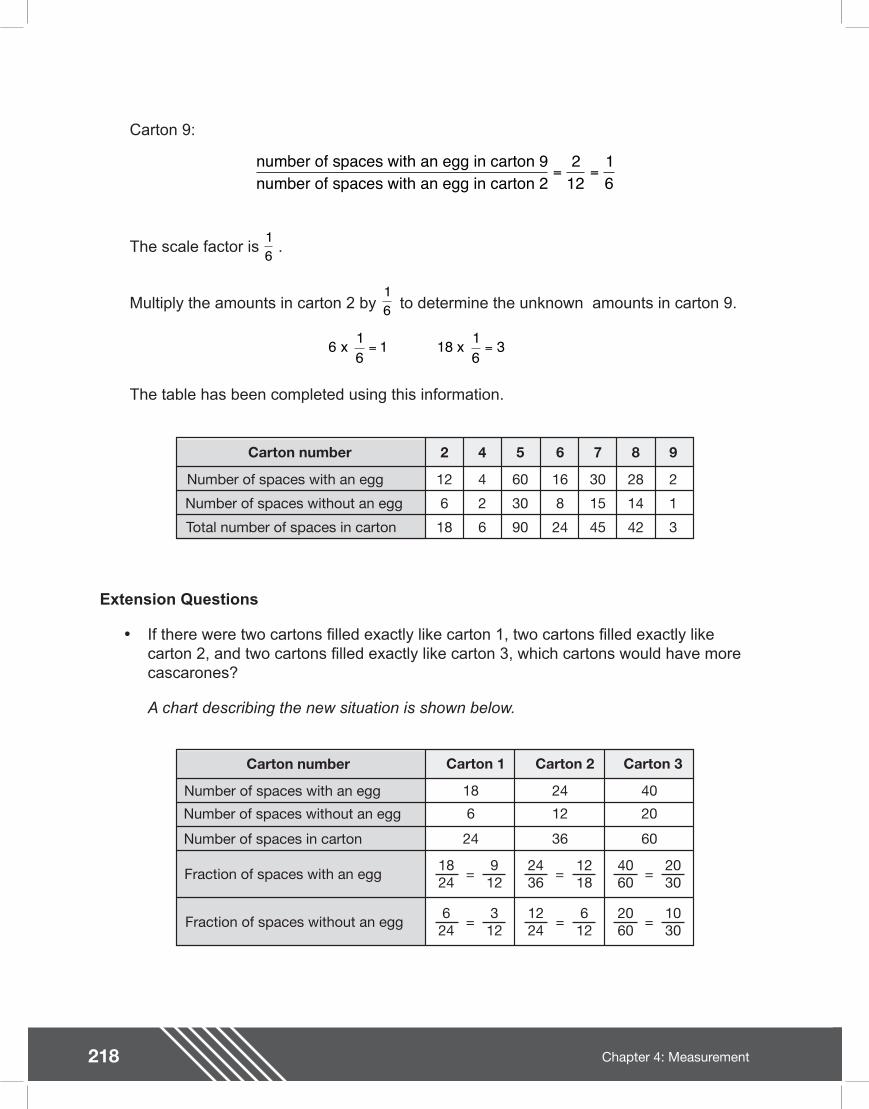
218 Chapter 4: Measurement
Carton 9:
The scale factor is .
Multiply the amounts in carton 2 by to determine the unknown amounts in carton 9.
The table has been completed using this information.
number of spaces with an egg in carton 9number of spaces with an egg in carton 2
= =2
1216
16
16
6 16
1 1 16
3 x 8 x = =
Carton number
Number of spaces with an egg
Number of spaces without an egg
Total number of spaces in carton
2 4 5 6 7 8 9
12
6
4
2
18 6
60
90
30
16
8
30
14
2
1
324
15
45
28
42
Extension Questions
�• If there were two cartons lled exactly like carton 1, two cartons lled exactly like carton 2, and two cartons lled exactly like carton 3, which cartons would have more cascarones?
A chart describing the new situation is shown below.
Carton number
Number of spaces with an egg
Number of spaces without an egg
Number of spaces in carton
Fraction of spaces with an egg
Fraction of spaces without an egg
Carton 1 Carton 2 Carton 3
18
6
24
24
12
36
40
20
60
912
1824
=
312
624
=
1218
2436
=
612
1224
=
2030
4060
=
1030
2060
=
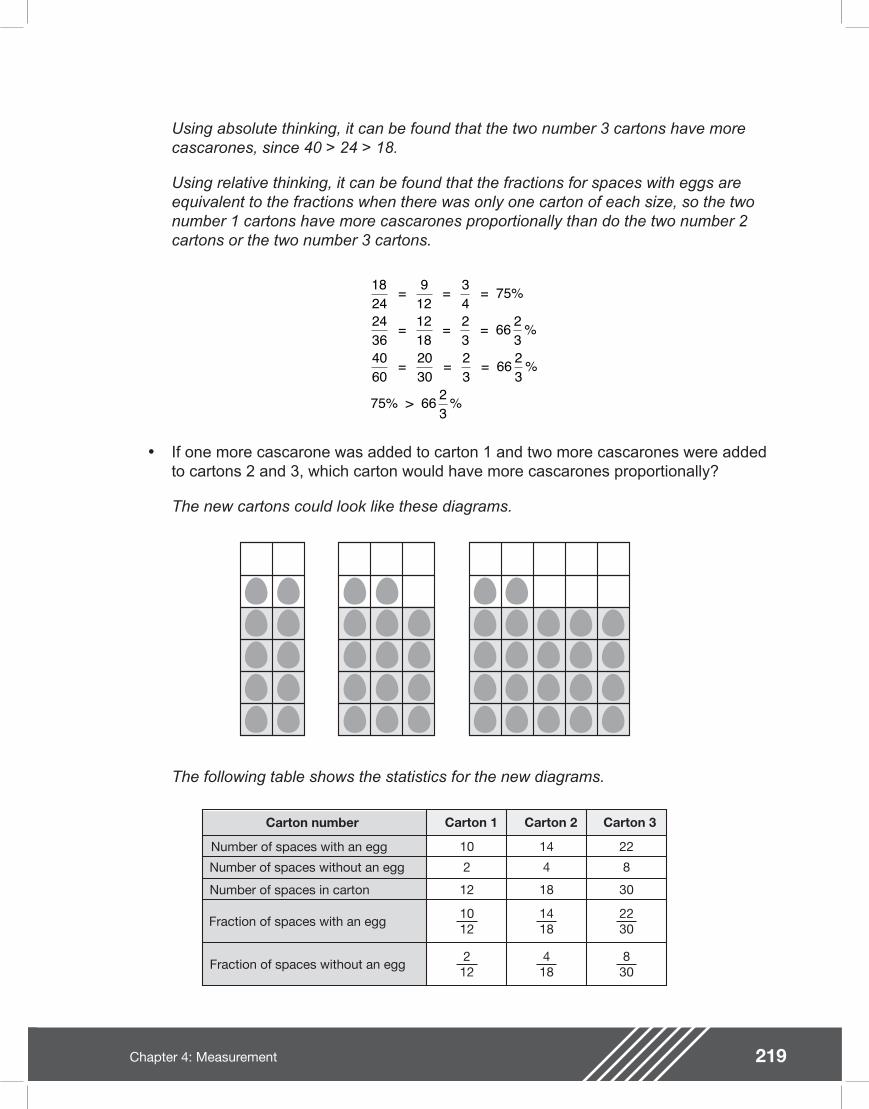
219Chapter 4: Measurement
Using absolute thinking, it can be found that the two number 3 cartons have more cascarones, since 40 > 24 > 18.
Using relative thinking, it can be found that the fractions for spaces with eggs are equivalent to the fractions when there was only one carton of each size, so the two number 1 cartons have more cascarones proportionally than do the two number 2 cartons or the two number 3 cartons.
�• If one more cascarone was added to carton 1 and two more cascarones were added to cartons 2 and 3, which carton would have more cascarones proportionally?
The new cartons could look like these diagrams.
182424364060
= 912
= 34
= 75%
= 1218
= 23
= 66 23
%
= 2030
= 23
= 66 23
%
75% > 66 23
%
The following table shows the statistics for the new diagrams.
Carton number
Number of spaces with an egg
Number of spaces without an egg
Number of spaces in carton
Fraction of spaces with an egg
Fraction of spaces without an egg
Carton 1 Carton 2 Carton 3
10
2
12
14
4
18
22
8
30
1012
212
1418
418
2230
830
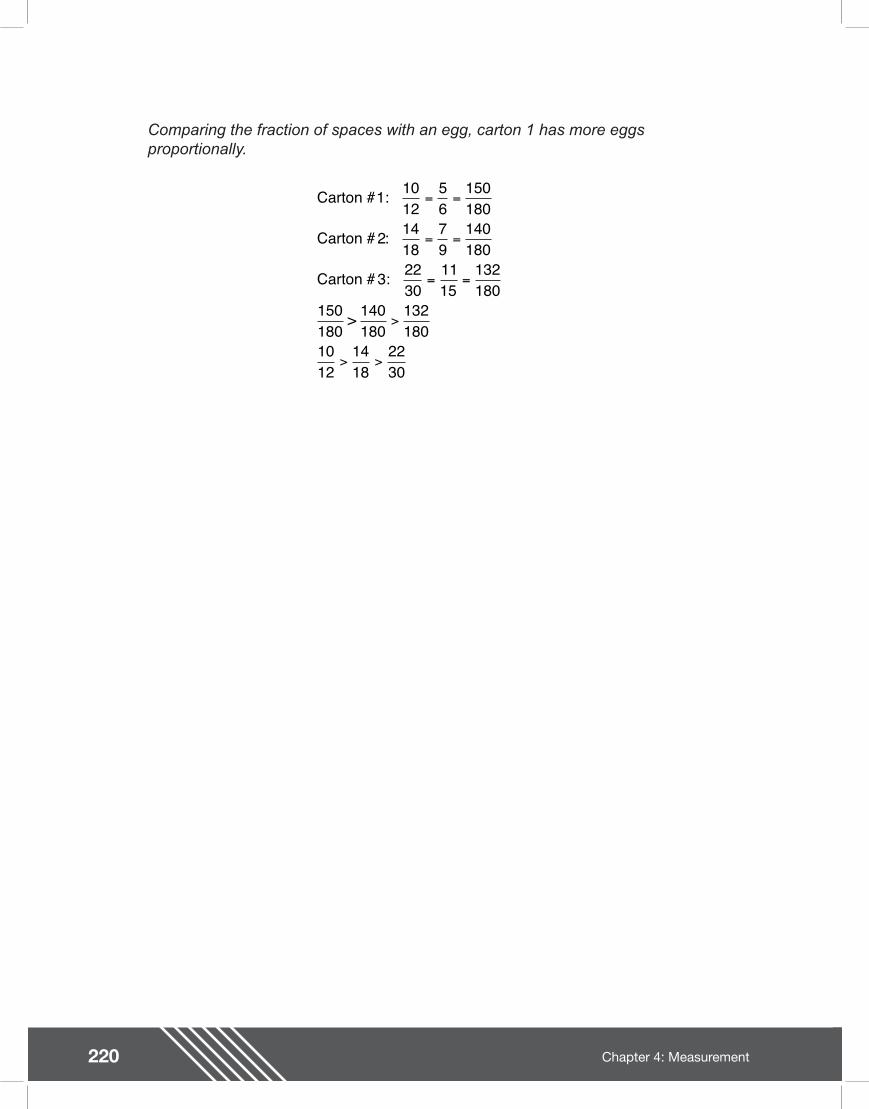
220 Chapter 4: Measurement
Comparing the fraction of spaces with an egg, carton 1 has more eggs proportionally.
Carton #1:
Carton #
Carton # 3:
>
1012
56
150180
2 1418
79
140180
2230
1115
132180
150180
140180
132180
1012
1418
2230
= =
= =
= =
>
> >
:
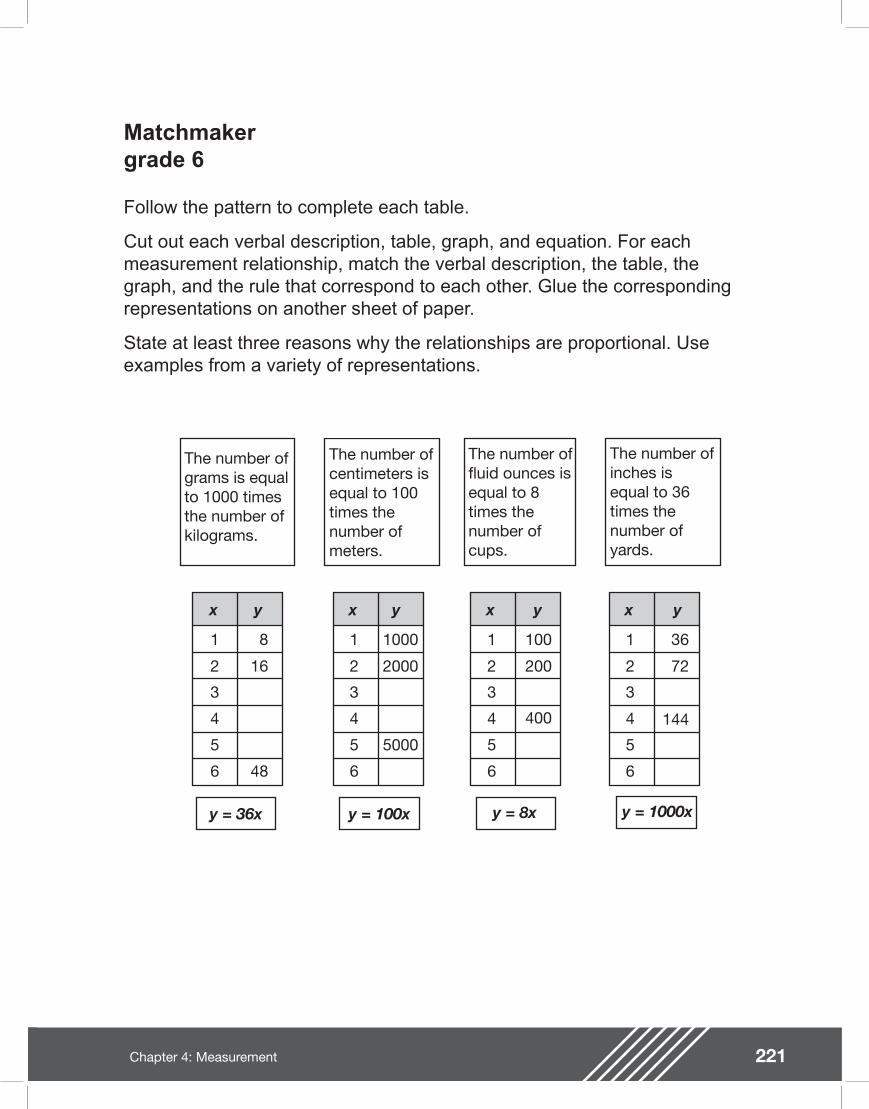
221Chapter 4: Measurement
Matchmakergrade 6
Follow the pattern to complete each table.
Cut out each verbal description, table, graph, and equation. For each measurement relationship, match the verbal description, the table, the graph, and the rule that correspond to each other. Glue the corresponding representations on another sheet of paper.
State at least three reasons why the relationships are proportional. Use examples from a variety of representations.
x y
48
8
16
1
2
3
4
5
6
x y
5000
1000
2000
1
2
3
4
5
6
x y
400
100
200
1
2
3
4
5
6
x y
144
36
72
1
2
3
4
5
6
y = 8x y = 1000xy = 100xy = 36x
The number of grams is equal to 1000 times the number of kilograms.
The number of centimeters is equal to 100 times the number of meters.
The number of fluid ounces is equal to 8 times the number of cups.
The number of inches is equal to 36 times the number of yards.
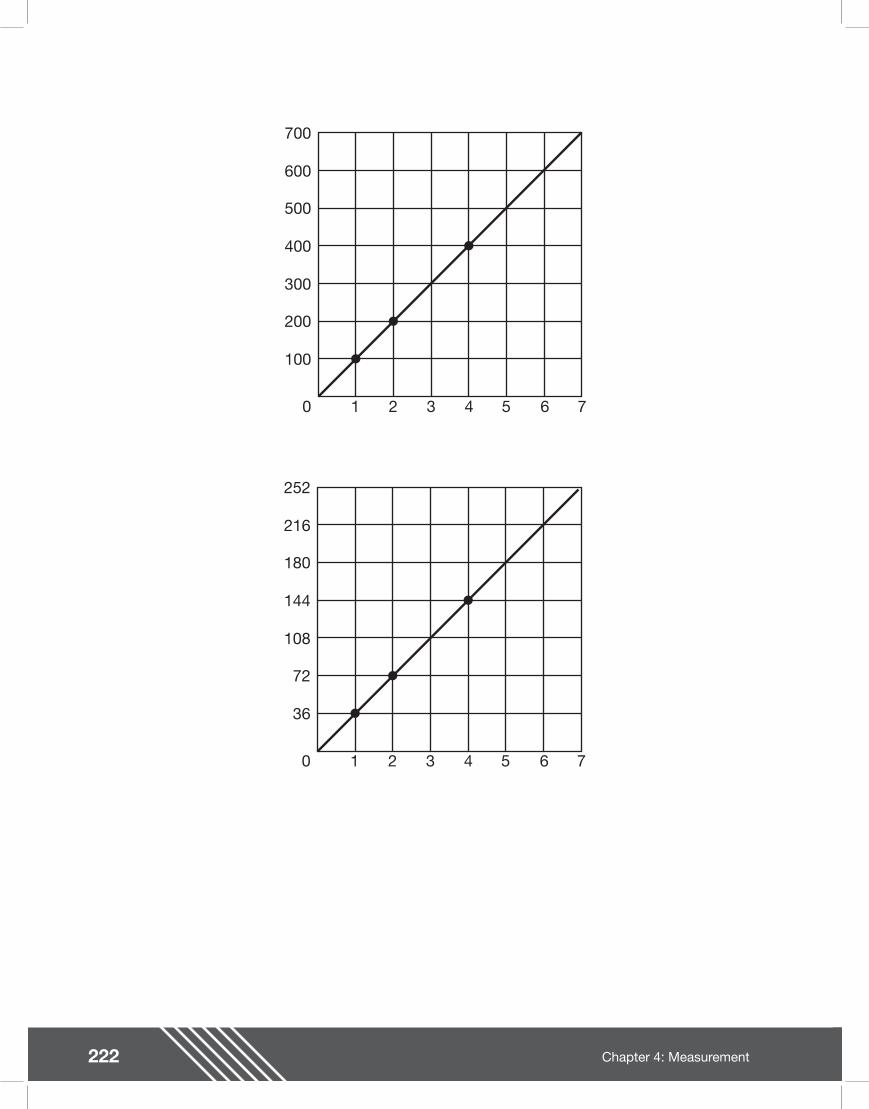
222 Chapter 4: Measurement
0 1
100
200
300
400
500
600
700
2 3 4 5 6 7
0 1
36
72
108
144
180
216
252
2 3 4 5 6 7
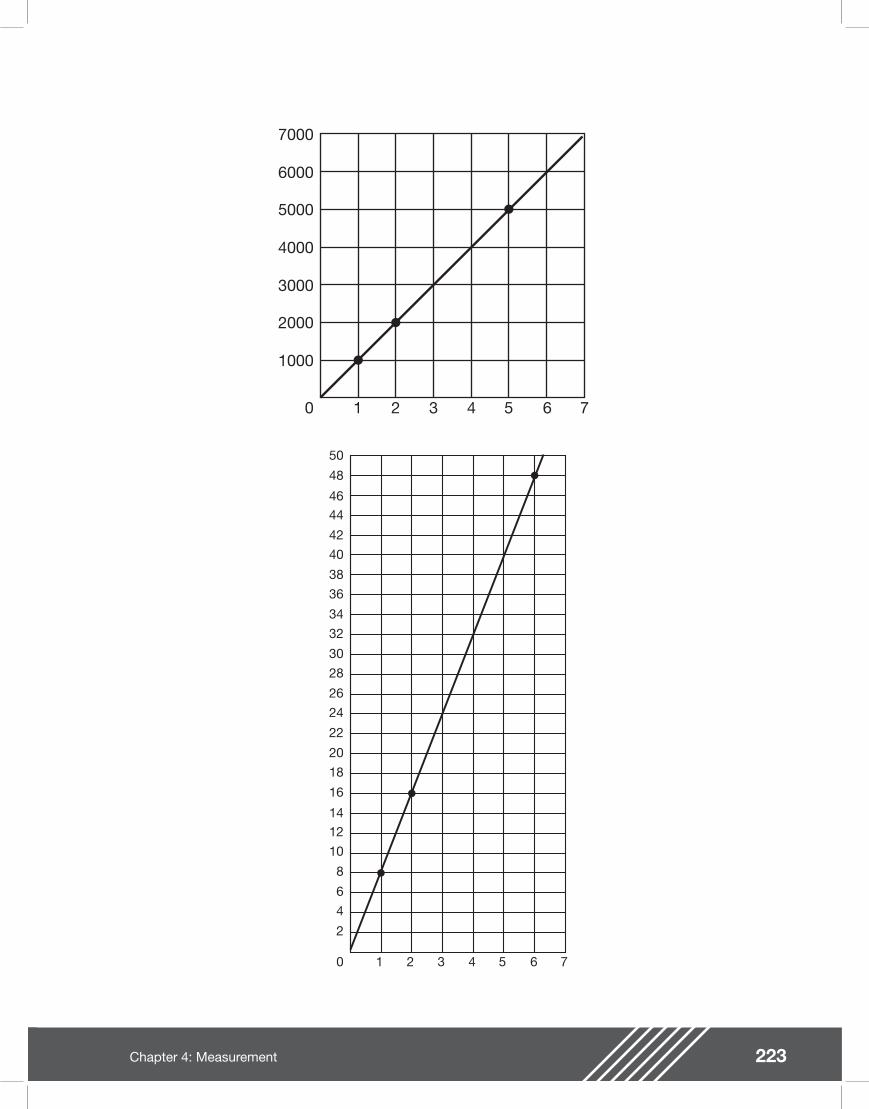
223Chapter 4: Measurement
0 1
1000
2000
3000
4000
5000
6000
7000
2 3 4 5 6 7
0 1
2
4
6
8
10
12
14
16
18
20
22
24
26
28
30
32
34
36
38
40
42
44
46
48
50
2 3 4 5 6 7
224 Chapter 4: Measurement
Teacher Notes
Materials
Calculator
Connections to Middle School TEKS
(6.8) Measurement. The student solves application problems involving estimation and measurement of length, area, time, temperature, capacity, weight, and angles.
(D) convert measures within the same measurement system (customary and metric) based on relationships between units
(6.10) Probability and statistics. The student uses statistical representations to analyze data.
(D) solve problems by collecting, organizing, displaying, and interpreting data
(6.12) Underlying processes and mathematical tools. The student communicates about Grade 6 mathematics through informal and mathematical language, representations, and models.
(A) communicate mathematical ideas using language, ef cient
Scaffolding Questions
�• In the table, what is the ratio y : x for each ordered pair (x, y)?
�• What is the signi cance of this ratio y : x?
�• What does the ordered pair (1, 8) mean in words?
�• How do you graph the ordered pair (2, 16)?
�• What is the relationship between the number of kilograms and the number of grams?
�• How many centimeters are there in 1 meter? 2 meters? 3 meters?
�• How many uid ounces are there in 1 cup? 2 cups? 3 cups?
�• How many inches are there in 1 yard?
�• How can you nd the number of inches in 2 yards? 3 yards?
�• How could you write an equation that expresses the relationship between the number of inches and the number of yards? The number of uid ounces and the number of cups?
�• How can you identify a proportional relationship from a table? Graph? Equation?
Sample Solutions
The rst match with the graph, verbal description, equation, and table is given below. Each representation shows the relationship between the number of grams and the number of kilograms. The verbal description states that the number of grams is 1,000 times the number of kilograms. The formula y = 1,000x follows from this statement, where y represents the number of grams and x, the number of kilograms. The rate is 1,000 kilograms per gram. The formula or rule can also be derived from the table using a process column to show 1,000(1), 1,000(2), 1,000(3) . . . 1,000(x).
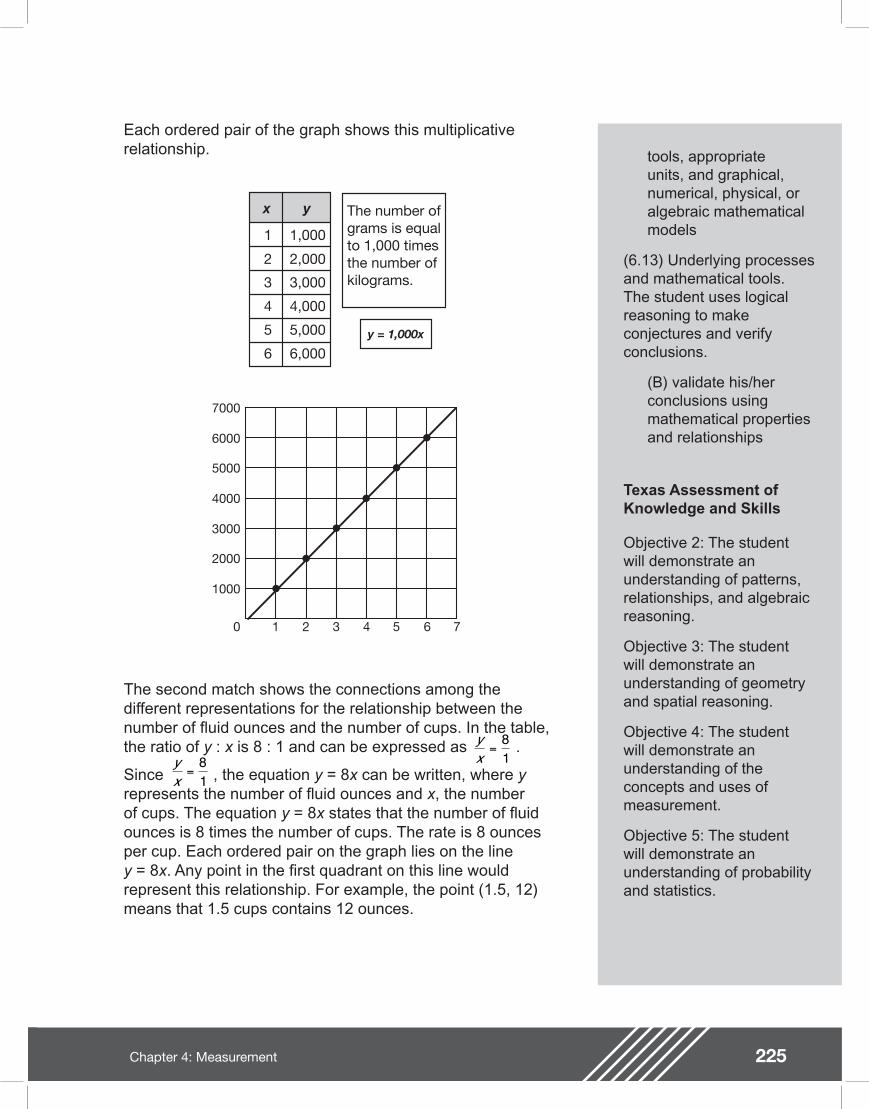
225Chapter 4: Measurement
tools, appropriate units, and graphical, numerical, physical, or algebraic mathematical models
(6.13) Underlying processes and mathematical tools. The student uses logical reasoning to make conjectures and verify conclusions.
(B) validate his/her conclusions using mathematical properties and relationships
Texas Assessment of Knowledge and Skills
Objective 2: The student will demonstrate an understanding of patterns, relationships, and algebraic reasoning.
Objective 3: The student will demonstrate an understanding of geometry and spatial reasoning.
Objective 4: The student will demonstrate an understanding of the concepts and uses of measurement.
Objective 5: The student will demonstrate an understanding of probability and statistics.
Each ordered pair of the graph shows this multiplicative relationship.
x y
5,000
6,000
1,000
2,000
3,000
4,000
1
2
3
4
5
6y = 1,000x
The number of grams is equal to 1,000 times the number of kilograms.
The second match shows the connections among the different representations for the relationship between the number of uid ounces and the number of cups. In the table, the ratio of y : x is 8 : 1 and can be expressed as .
Since , the equation y = 8x can be written, where y represents the number of uid ounces and x, the number of cups. The equation y = 8x states that the number of uid ounces is 8 times the number of cups. The rate is 8 ounces per cup. Each ordered pair on the graph lies on the line y = 8x. Any point in the rst quadrant on this line would represent this relationship. For example, the point (1.5, 12) means that 1.5 cups contains 12 ounces.
0 1
1000
2000
3000
4000
5000
6000
7000
2 3 4 5 6 7
yx
=81y
x=
81
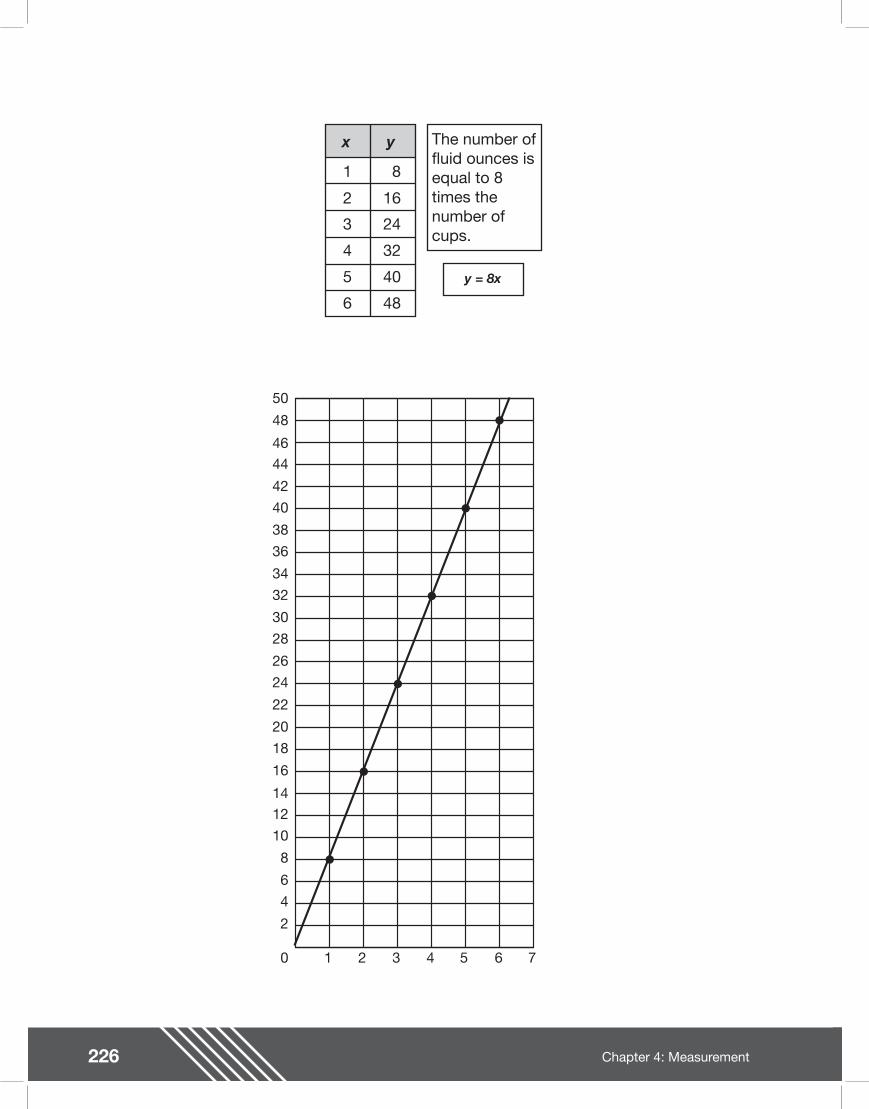
226 Chapter 4: Measurement
x y
48
8
16
24
32
40
1
2
3
4
5
6
y = 8x
The number of fluid ounces is equal to 8 times the number of cups.
0 1
2
4
6
8
10
12
14
16
18
20
22
24
26
28
30
32
34
36
38
40
42
44
46
48
50
2 3 4 5 6 7
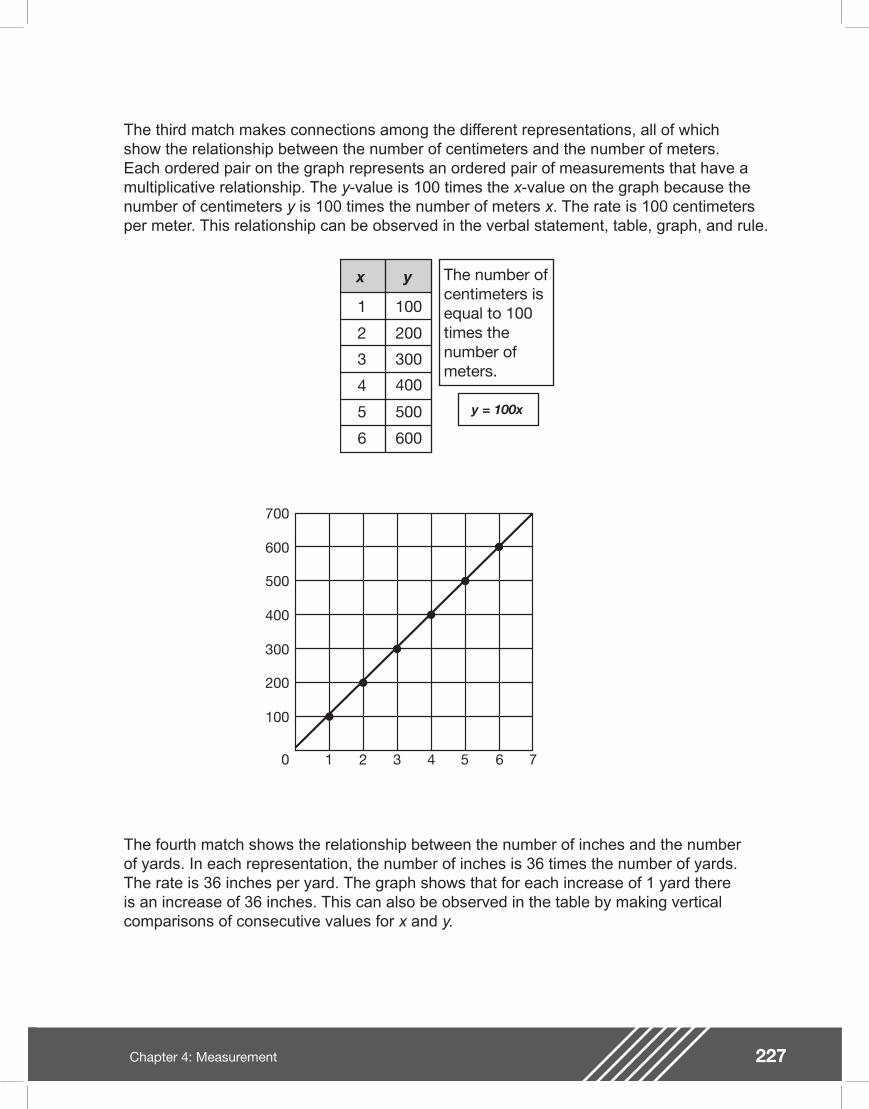
227Chapter 4: Measurement
The third match makes connections among the different representations, all of which show the relationship between the number of centimeters and the number of meters. Each ordered pair on the graph represents an ordered pair of measurements that have a multiplicative relationship. The y-value is 100 times the x-value on the graph because the number of centimeters y is 100 times the number of meters x. The rate is 100 centimeters per meter. This relationship can be observed in the verbal statement, table, graph, and rule.
x y
400
100
200
300
500
600
1
2
3
4
5
6
y = 100x
The number of centimeters is equal to 100 times the number of meters.
0 1
100
200
300
400
500
600
700
2 3 4 5 6 7
The fourth match shows the relationship between the number of inches and the number of yards. In each representation, the number of inches is 36 times the number of yards. The rate is 36 inches per yard. The graph shows that for each increase of 1 yard there is an increase of 36 inches. This can also be observed in the table by making vertical comparisons of consecutive values for x and y.
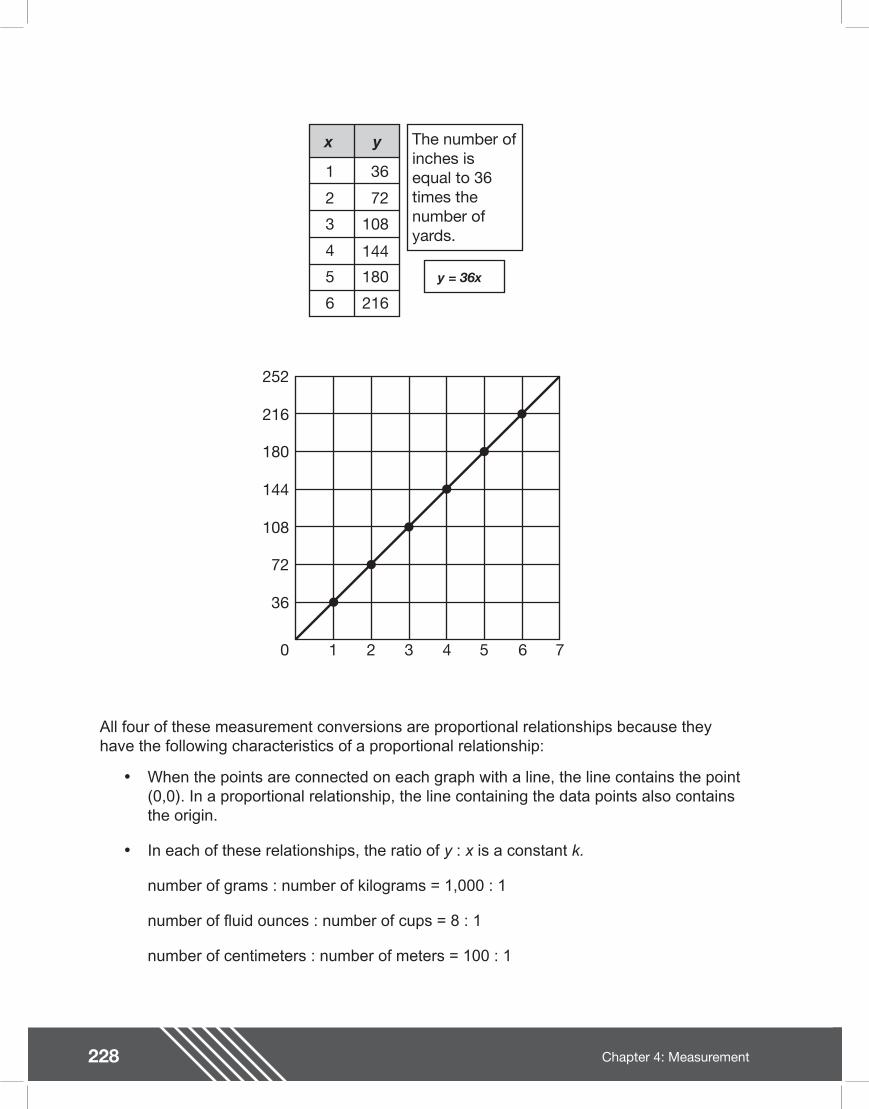
228 Chapter 4: Measurement
All four of these measurement conversions are proportional relationships because they have the following characteristics of a proportional relationship:
�• When the points are connected on each graph with a line, the line contains the point (0,0). In a proportional relationship, the line containing the data points also contains the origin.
�• In each of these relationships, the ratio of y : x is a constant k.
number of grams : number of kilograms = 1,000 : 1
number of uid ounces : number of cups = 8 : 1
number of centimeters : number of meters = 100 : 1
x y
144
36
72
108
180
216
1
2
3
4
5
6
y = 36x
The number of inches is equal to 36 times the number of yards.
0 1
36
72
108
144
180
216
252
2 3 4 5 6 7
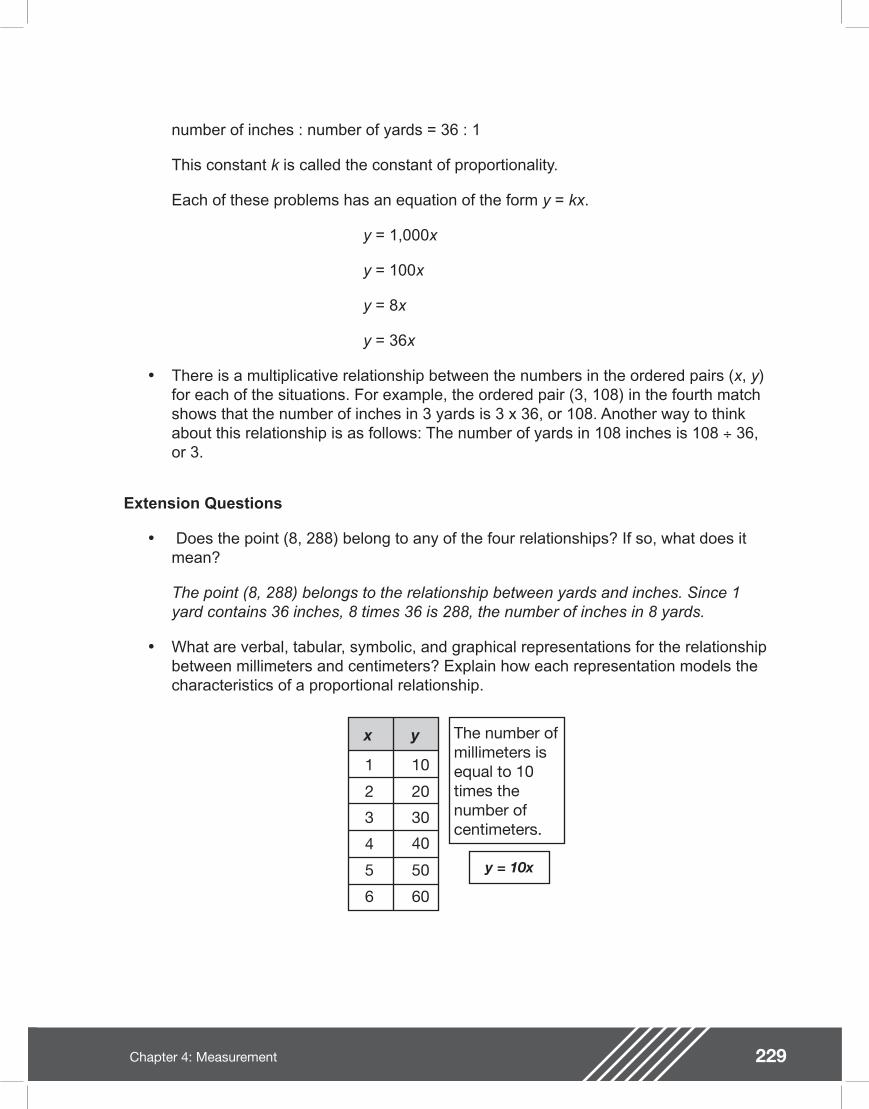
229Chapter 4: Measurement
number of inches : number of yards = 36 : 1
This constant k is called the constant of proportionality.
Each of these problems has an equation of the form y = kx.
y = 1,000x
y = 100x
y = 8x
y = 36x
�• There is a multiplicative relationship between the numbers in the ordered pairs (x, y) for each of the situations. For example, the ordered pair (3, 108) in the fourth match shows that the number of inches in 3 yards is 3 x 36, or 108. Another way to think about this relationship is as follows: The number of yards in 108 inches is 108 ÷ 36, or 3.
Extension Questions
�• Does the point (8, 288) belong to any of the four relationships? If so, what does it mean?
The point (8, 288) belongs to the relationship between yards and inches. Since 1 yard contains 36 inches, 8 times 36 is 288, the number of inches in 8 yards.
�• What are verbal, tabular, symbolic, and graphical representations for the relationship between millimeters and centimeters? Explain how each representation models the characteristics of a proportional relationship.
x y
40
10
20
30
50
60
1
2
3
4
5
6
y = 10x
The number of millimeters is equal to 10 times the number of centimeters.
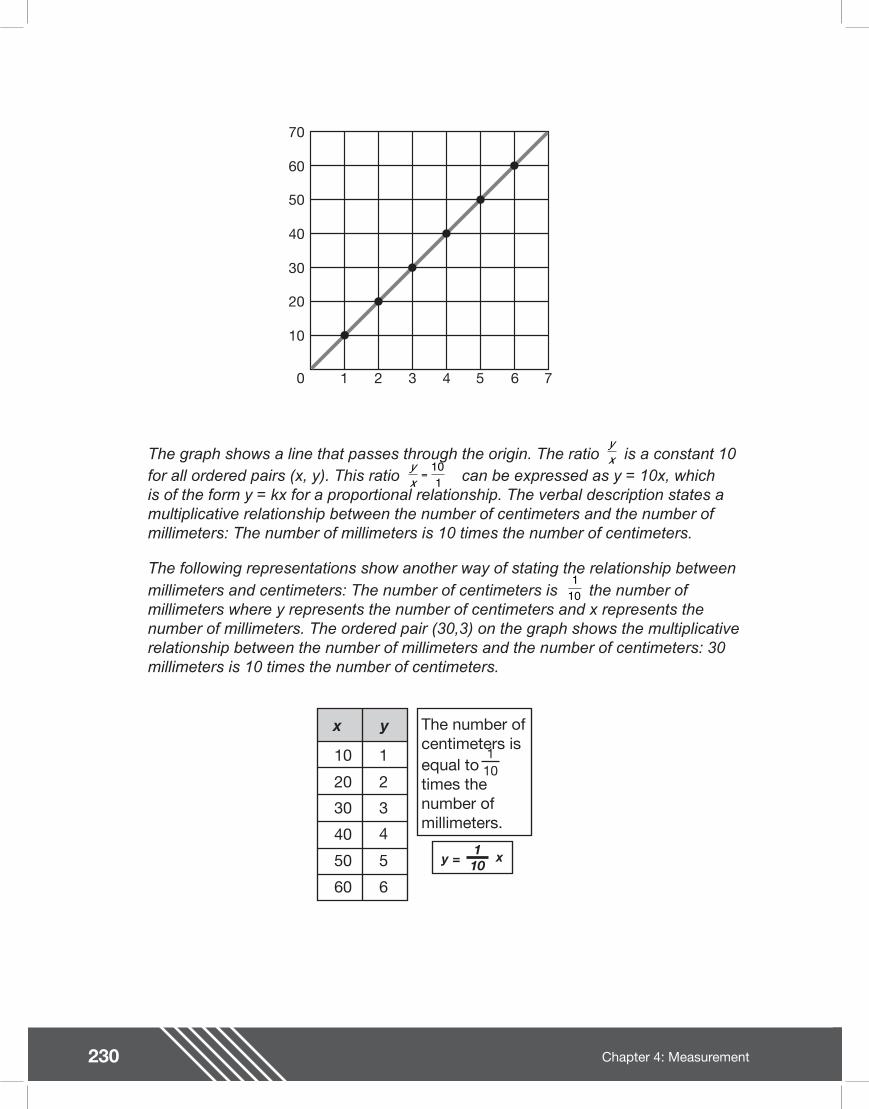
230 Chapter 4: Measurement
The graph shows a line that passes through the origin. The ratio is a constant 10 for all ordered pairs (x, y). This ratio can be expressed as y = 10x, which is of the form y = kx for a proportional relationship. The verbal description states a multiplicative relationship between the number of centimeters and the number of millimeters: The number of millimeters is 10 times the number of centimeters.
The following representations show another way of stating the relationship between millimeters and centimeters: The number of centimeters is the number of millimeters where y represents the number of centimeters and x represents the number of millimeters. The ordered pair (30,3) on the graph shows the multiplicative relationship between the number of millimeters and the number of centimeters: 30 millimeters is 10 times the number of centimeters.
0 1
10
20
30
40
50
60
70
2 3 4 5 6 7
yxy
x=
101
110
x y
4
1
2
3
5
6
10
20
30
40
50
60
y = 110
x
The number of centimeters is equal to times the number of millimeters.
110
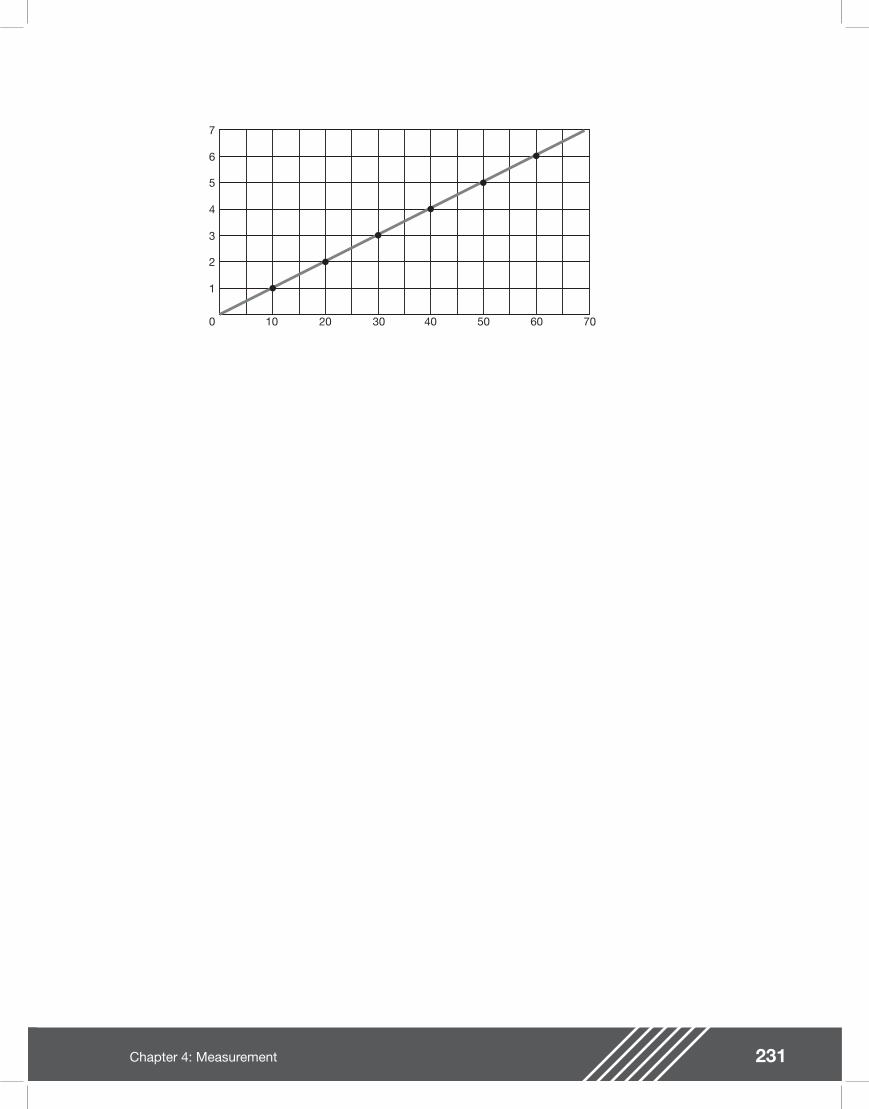
231Chapter 4: Measurement
0 10
1
2
3
4
5
6
7
20 30 40 50 60 70
232 Chapter 4: Measurement
Student Work Sample
This student�’s work shows that the student recognizes that there is proportional growth in the tables.
The work exempli es many of the criteria on the solution guide, especially the following:
�• Recognizes and applies proportional relationships
�• Uses multiple representations (such as concrete models, tables, graphs, symbols, and verbal descriptions) and makes connections among them
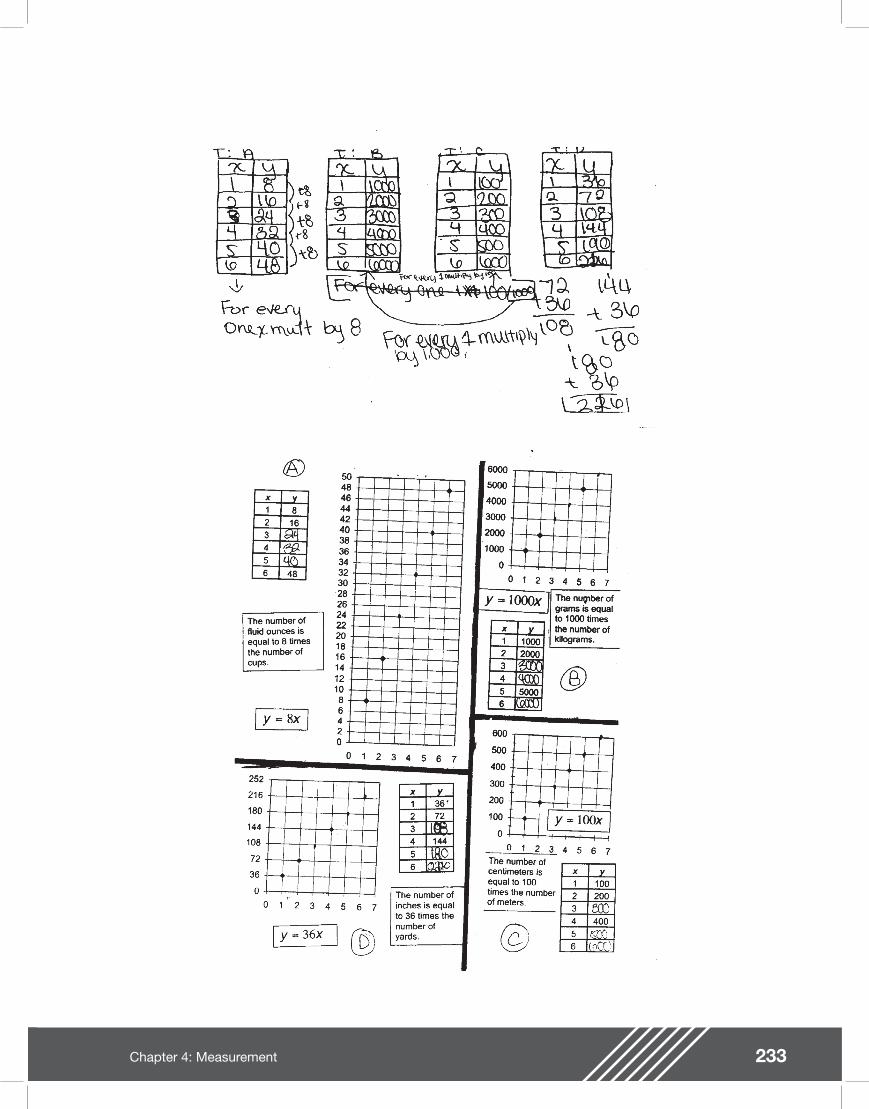
233Chapter 4: Measurement
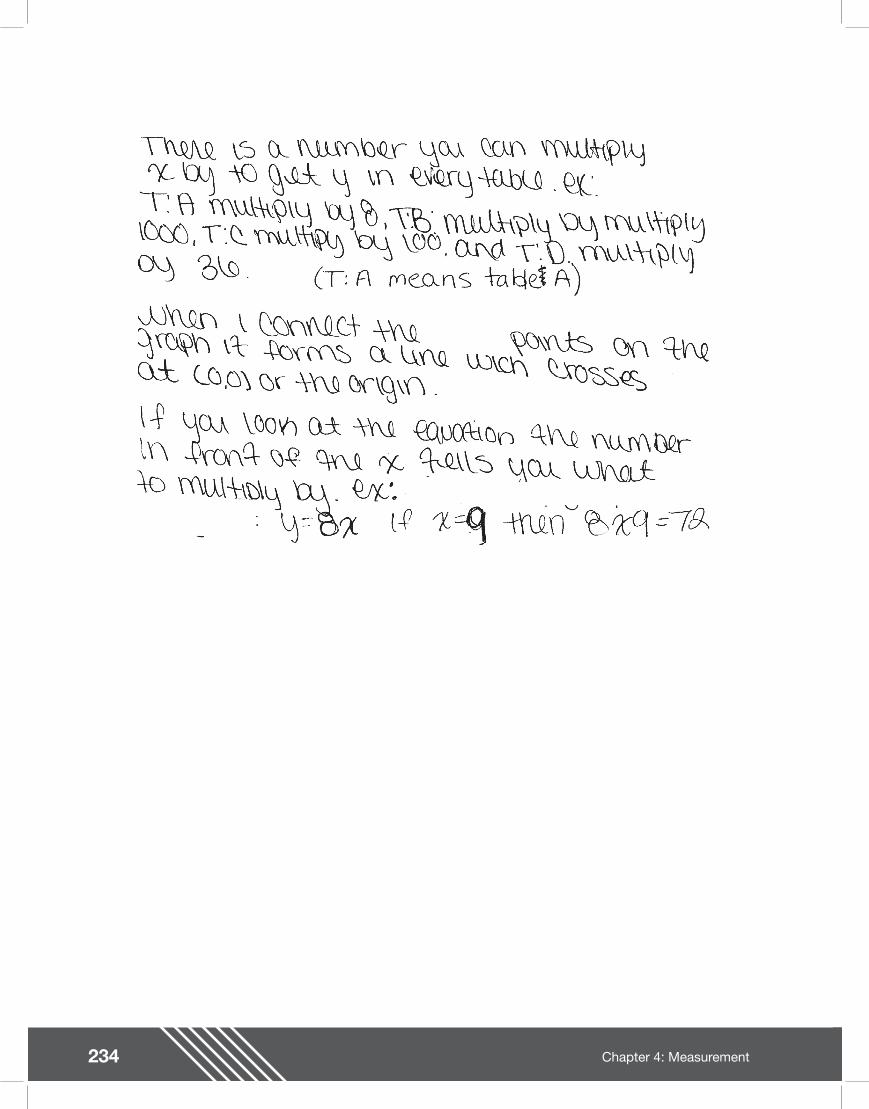
234 Chapter 4: Measurement
235Chapter 4: Measurement
Bug Juicegrade 7
When campers get thirsty, out comes the well-known camp beverage: Bug Juice!
The Camp Big Sky version of this popular beverage is made with four ounces of Mix A added to tap water to make two quarts of Bug Juice. Four ounces of Mix A costs $0.78.
The Camp Wild Flowers version of Bug Juice is made from a package of Mix B. It takes 0.14 of an ounce of mix with 4 ounces of sugar and tap water to make two quarts. Mix B costs $0.20 a package. Sugar costs $0.36 a pound.
Each camp has 180 campers. During a typical day, each camper drinks two 8-ounce cups of Bug Juice.
1. Each camp has budgeted $30 for their daily Bug Juice. Is $30 a day enough? How do you know?
2. Campers begin to complain. They want their Bug Juice �“buggier.�” How could each camp change their recipe, continue to serve 180 campers two 8-ounce cups of Bug Juice daily, and not spend more than a budget of $40 a day for Bug Juice? Explain your reasoning.
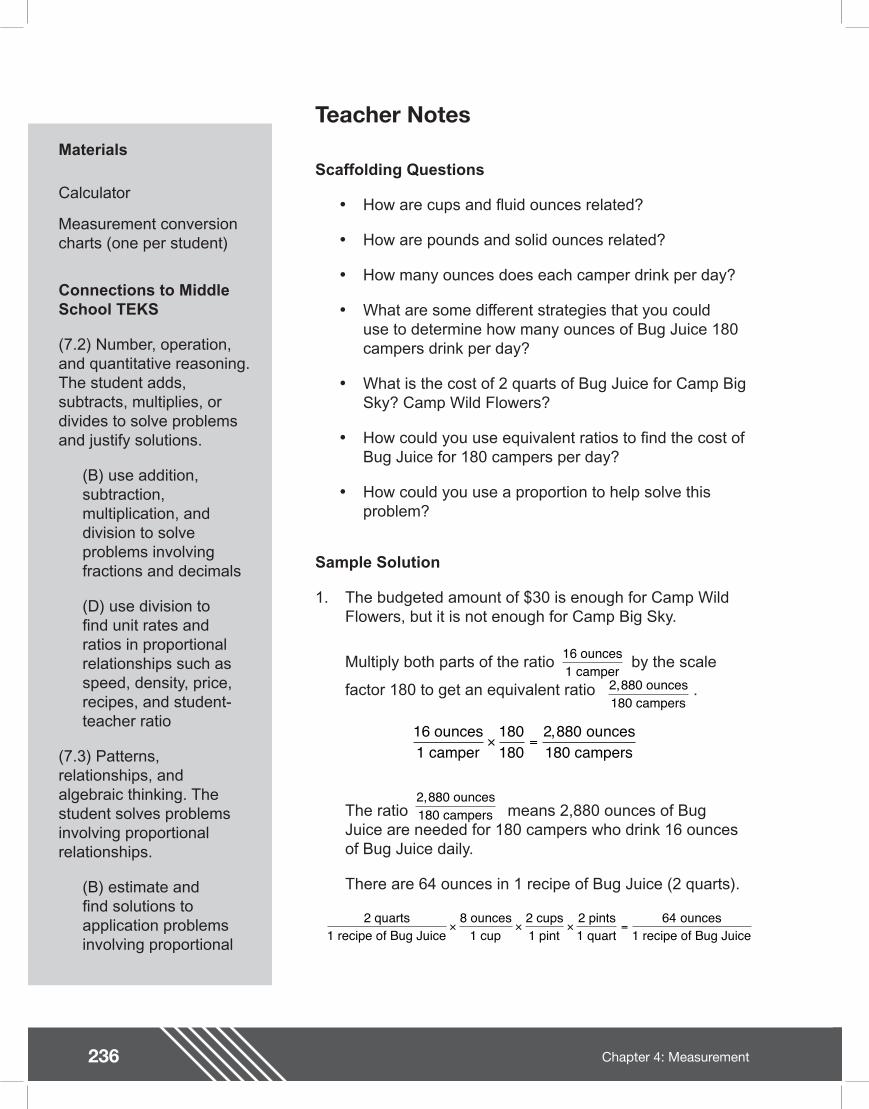
236 Chapter 4: Measurement
Teacher NotesMaterials
Calculator
Measurement conversion charts (one per student)
Connections to Middle School TEKS
(7.2) Number, operation, and quantitative reasoning. The student adds, subtracts, multiplies, or divides to solve problems and justify solutions.
(B) use addition, subtraction, multiplication, and division to solve problems involving fractions and decimals
(D) use division to nd unit rates and ratios in proportional relationships such as speed, density, price, recipes, and student-teacher ratio
(7.3) Patterns, relationships, and algebraic thinking. The student solves problems involving proportional relationships.
(B) estimate and nd solutions to application problems involving proportional
Scaffolding Questions
�• How are cups and uid ounces related?
�• How are pounds and solid ounces related?
�• How many ounces does each camper drink per day?
�• What are some different strategies that you could use to determine how many ounces of Bug Juice 180 campers drink per day?
�• What is the cost of 2 quarts of Bug Juice for Camp Big Sky? Camp Wild Flowers?
�• How could you use equivalent ratios to nd the cost of Bug Juice for 180 campers per day?
�• How could you use a proportion to help solve this problem?
Sample Solution
1. The budgeted amount of $30 is enough for Camp Wild Flowers, but it is not enough for Camp Big Sky.
Multiply both parts of the ratio by the scale
factor 180 to get an equivalent ratio .
The ratio means 2,880 ounces of Bug Juice are needed for 180 campers who drink 16 ounces of Bug Juice daily.
There are 64 ounces in 1 recipe of Bug Juice (2 quarts).
16 ounces1 camper
2,880 ounces180 campers
16 ounces1 camper
ounces180 campers
× =180180
2 880,
2,880 ounces180 campers
2 quarts1 recipe of Bug Juice
8 ounces1 cup
2 cups1 pint
2 pints1 quart
ounces1 recipe of Bug Juice
× × × =64
237Chapter 4: Measurement
relationships such as similarity, scaling, unit costs, and related measurement units
(7.9) Measurement. The student solves application problems involving estimation and measurement. The student is expected to estimate measurements and solve application problems involving length including perimeter and circumference), area, and volume
Texas Assessment of Knowledge and Skills
Objective 1: The student will demonstrate an understanding of numbers, operations, and quantitative reasoning.
Objective 2: The student will demonstrate an understanding of patterns, relationships, and algebraic reasoning.
Objective 4: The student will demonstrate an understanding of the concepts and uses of measurement.
At Camp Big Sky, 2 quarts, or 64 ounces of Bug Juice costs $0.78. Knowing that 2,880 ounces are needed for 180 campers, the following proportion can be written to nd the cost, c, for 180 campers.
Since 2,880 ÷ 64 = 45, the ratio multiplied by
equals . The cost for 180 campers at Camp Big Sky to have two 8-ounce cups of Bug Juice using Mix A is $35.10, which is greater than the $30 budgeted.
At Camp Wild Flowers, the cost for 2 quarts of their version of Bug Juice is determined by adding the cost of Mix B, $0.20 for 0.14 of an ounce, to the cost of 4 ounces of sugar. Knowing that sugar costs $0.36 for 1 pound or 16 ounces, the following proportion can be solved to nd the cost of 4 ounces of sugar, s.
Since , the ratio multiplied
by equals .
Thus, 4 ounces of sugar cost $0.09.
Add the cost of 4 ounces of sugar to the cost of Mix B ($0.09 + $0.20 = $0.29) to get the total cost of 2 quarts of Bug Juice.
Knowing that 2,880 ounces are needed for 180 campers, the following proportion can be written to nd the cost, c, for 180 campers at Camp Wild Flowers.
64 ounces$0.78
ounces=
2 880,c
64 ounces$0.7845
452,880 ounces
$35.10
$ .0 3616 ounces 4 ounces
=s
4 16 416
÷ = or 14
$ .0 3616 ounces
$ .0 094 ounces
64 ounces$0.29
ounces=
2 880,c
238 Chapter 4: Measurement
Multiplying the ratio by equals . A scale factor of 45 increases from 64 ounces to 2,880 ounces. The cost for 180 campers at Camp Wild Flowers to have two 8-ounce cups of Bug Juice using Mix B is $13.05, which is less than the budgeted $30 amount.
2. Answers will vary. Here is one possible solution.
At Camp Big Sky, the Bug Juice can be made slightly �“buggier�” and still t the new
$40 budget by adding more of the original Mix A to the tap water. The cost will be
times the original cost of $0.78, which is $0.8775, or about $0.88. The following proportion can be solved to determine the cost, c, for 180 campers at Camp Big Sky to
have Bug Juice that is buggier.
Multiplying the ratio by equals . The cost for 180
campers at Camp Big Sky to have Bug Juice that is buggier is $39.60, which is less than the new budgeted amount of $40.
At Camp Wild Flowers, Bug Juice can be made considerably buggier than at Camp Big Sky. For example, the amount of Mix B could be tripled from 0.14 of an ounce to 0.42 of an ounce. The cost would change by tripling the cost of 0.14 ounce of Mix B (3 x $0.20 = $0.60) and adding the cost of 4 ounces of sugar ($0.09). The total cost for the �“buggier�” juice is $0.60 + $0.09 = $0.69.
The following proportion can be solved to nd out the cost, c, for 180 campers at Camp Wild Flowers to have Bug Juice that is three times buggier.
Multiplying the ratio by equals .
The cost for 180 campers at Camp Wild Flowers to have Bug Juice that is three times �“buggier�” is $31.05, which is less than the new budgeted amount of $40. However, this may be too �“buggy�” because no additional sugar is being added in this situation.
64 ounces$0.29
4545
2,880 ounces$13.05
18
18
118
64 ounces$0.88
ounces=
2 880,c
18
64 ounces$0.88
4545
2,880 ounces$39.60
64 ounces$0.69
ounces=
2 880,c
4545
64 ounces$0.69
2,880 ounces$31.05
239Chapter 4: Measurement
Extension Questions
�• What is another way for campers at Camp Big Sky and Camp Wild Flowers to have buggier Bug Juice and stay within the $40 budget?
The number of ounces of water used to make Bug Juice for each camper daily could be reduced to create a �“buggier�” taste. No additional cost would be incurred for this new version of Bug Juice because no additional mix is added. However, each camper would be served smaller amounts.
�• Camp Armadillo makes their version of Bug Juice from Mix C, a liquid concentrate. Twelve ounces of concentrate are added to 36 ounces of water for their Bug Juice recipe. The 12 ounces of liquid concentrate cost $1.44. Will Camp Armadillo with 180 campers also meet the original $30 budgeted amount for Bug Juice? How do you know?
Camp Armadillo will not meet the original $30 budgeted amount for Bug Juice. Actually, Camp Armadillo will nearly triple the budgeted amount.
Knowing that 2,880 ounces are needed for 180 campers, the following proportion can be written to nd the cost, c, for 180 campers at Camp Armadillo. The 48 ounces is obtained by adding the 12 ounces of concentrate to three cans or 36 ounces of water for this recipe of Bug Juice.
Since 2,880 ÷ 48 = 60, the ratio can be multiplied by and equals
.
The cost for 180 campers at Camp Armadillo to have two 8-ounce cups of Bug Juice using Mix C is $86.40, far above the $30 budgeted amount.
48 ounces$1.44
2,880 ounces=
c
48 ounces$1.44
6060
2 880,$86.40

240 Chapter 4: Measurement
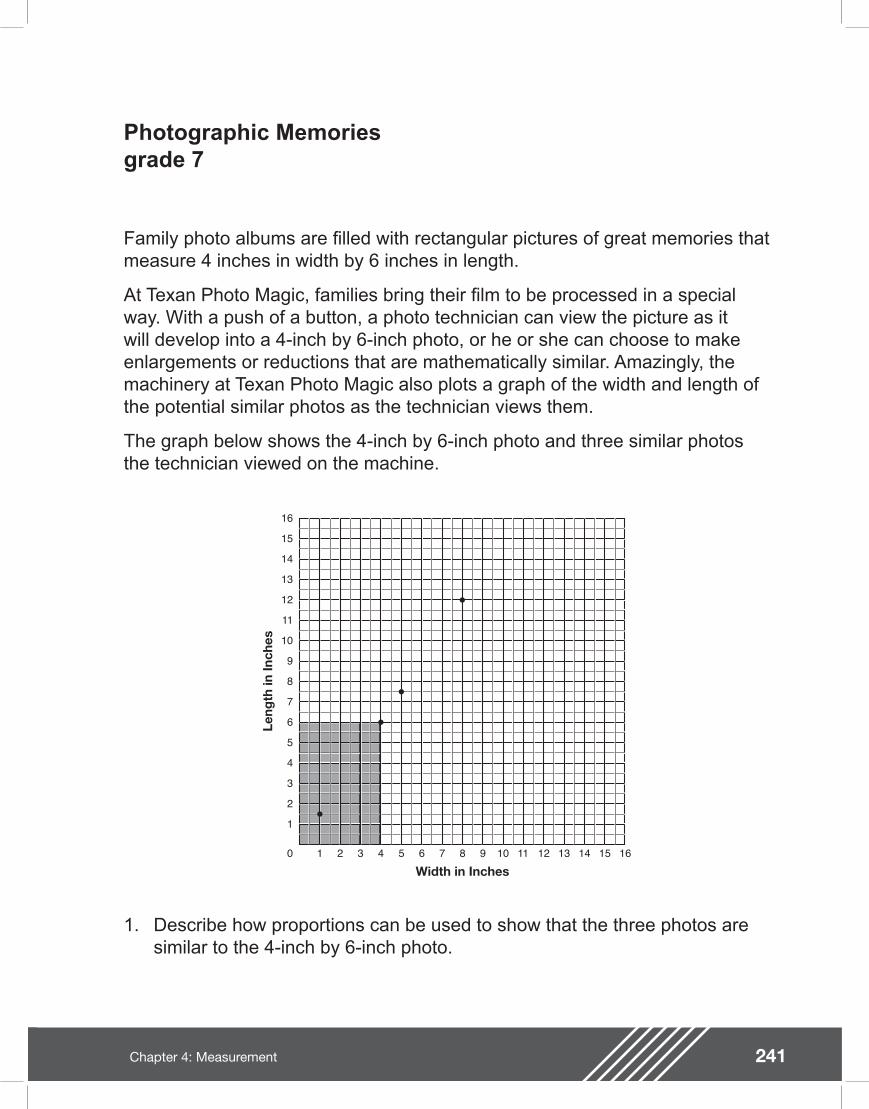
241Chapter 4: Measurement
Photographic Memoriesgrade 7
Family photo albums are lled with rectangular pictures of great memories that measure 4 inches in width by 6 inches in length.
At Texan Photo Magic, families bring their lm to be processed in a special way. With a push of a button, a photo technician can view the picture as it will develop into a 4-inch by 6-inch photo, or he or she can choose to make enlargements or reductions that are mathematically similar. Amazingly, the machinery at Texan Photo Magic also plots a graph of the width and length of the potential similar photos as the technician views them.
The graph below shows the 4-inch by 6-inch photo and three similar photos the technician viewed on the machine.
3
1
2
6
4
5
9
7
8
12
10
11
14
13
15
16
31 2 64 5 97 8 1210 11 1413 15 160
Leng
th in
Inch
es
Width in Inches
1. Describe how proportions can be used to show that the three photos are similar to the 4-inch by 6-inch photo.
242 Chapter 4: Measurement
2. In what other ways can the evidence for similarity be provided?
3. If a similar photo has a length of 15 inches, what will be its width? Explain your reasoning.
4. Will a photo measuring 9 inches by 13 inches follow the same pattern in the graph as the other similar photos? How do you know?
5. How many of the 1-inch by 1.5-inch photos could be printed on the same size paper as the 4-inch by 6-inch photo? How could you use the graph to demonstrate your answer?

243Chapter 4: Measurement
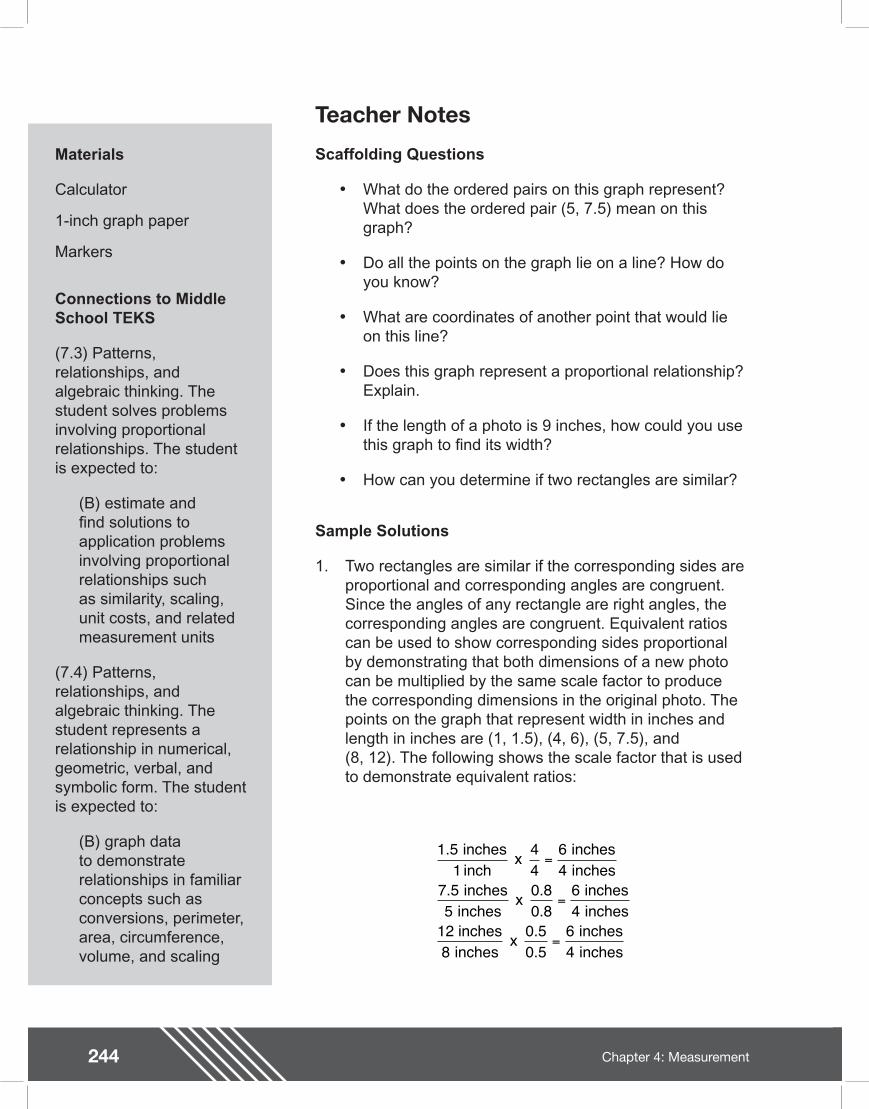
244 Chapter 4: Measurement
Teacher Notes
Scaffolding Questions
�• What do the ordered pairs on this graph represent? What does the ordered pair (5, 7.5) mean on this graph?
�• Do all the points on the graph lie on a line? How do you know?
�• What are coordinates of another point that would lie on this line?
�• Does this graph represent a proportional relationship? Explain.
�• If the length of a photo is 9 inches, how could you use this graph to nd its width?
�• How can you determine if two rectangles are similar?
Sample Solutions
1. Two rectangles are similar if the corresponding sides are proportional and corresponding angles are congruent. Since the angles of any rectangle are right angles, the corresponding angles are congruent. Equivalent ratios can be used to show corresponding sides proportional by demonstrating that both dimensions of a new photo can be multiplied by the same scale factor to produce the corresponding dimensions in the original photo. The points on the graph that represent width in inches and length in inches are (1, 1.5), (4, 6), (5, 7.5), and(8, 12). The following shows the scale factor that is used to demonstrate equivalent ratios:
1 51
64
7 55
64
18
64
.
.
inches inch
x 44
inches inches
inches inches
x 0.80.8
inches inches
2 inches inches
x 0.50.5
inches inches
=
=
=
Materials
Calculator
1-inch graph paper
Markers
Connections to Middle School TEKS
(7.3) Patterns, relationships, and algebraic thinking. The student solves problems involving proportional relationships. The student is expected to:
(B) estimate and nd solutions to application problems involving proportional relationships such as similarity, scaling, unit costs, and related measurement units
(7.4) Patterns, relationships, and algebraic thinking. The student represents a relationship in numerical, geometric, verbal, and symbolic form. The student is expected to:
(B) graph data to demonstrate relationships in familiar concepts such as conversions, perimeter, area, circumference, volume, and scaling
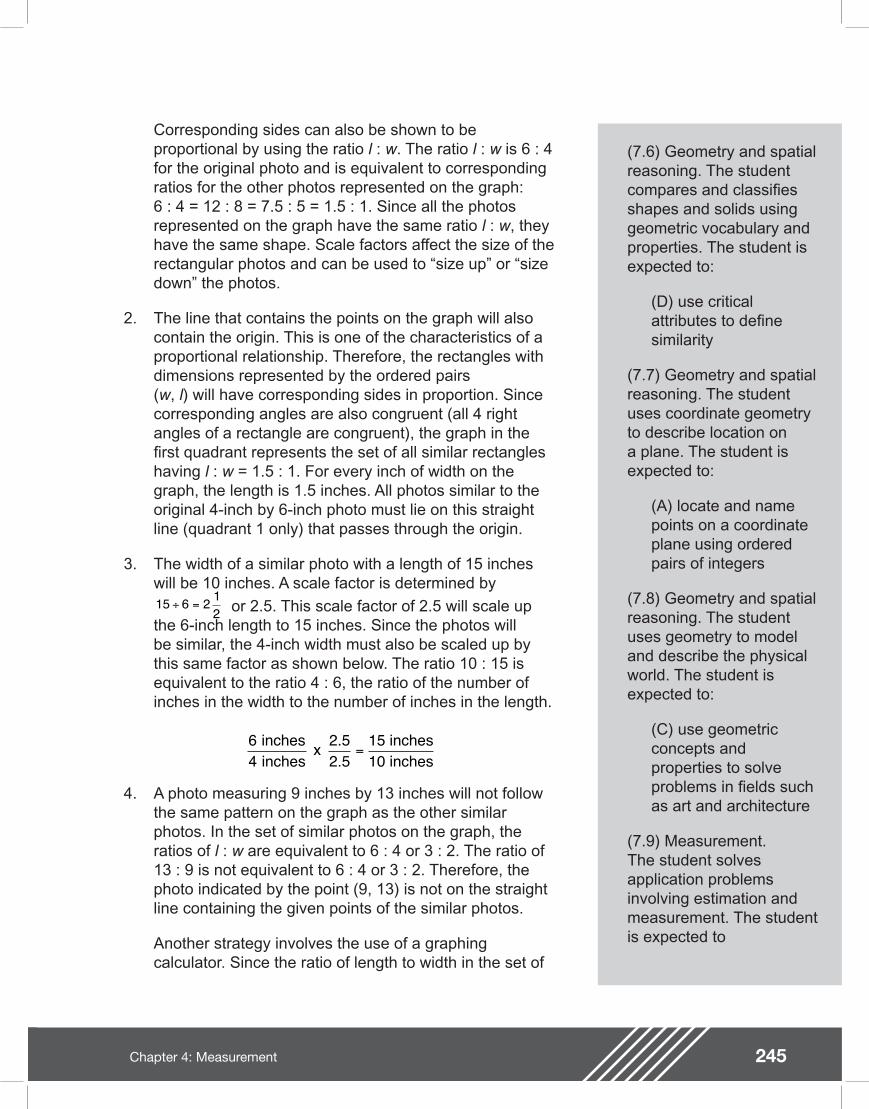
245Chapter 4: Measurement
Corresponding sides can also be shown to be proportional by using the ratio l : w. The ratio l : w is 6 : 4 for the original photo and is equivalent to corresponding ratios for the other photos represented on the graph: 6 : 4 = 12 : 8 = 7.5 : 5 = 1.5 : 1. Since all the photos represented on the graph have the same ratio l : w, they have the same shape. Scale factors affect the size of the rectangular photos and can be used to �“size up�” or �“size down�” the photos.
2. The line that contains the points on the graph will also contain the origin. This is one of the characteristics of a proportional relationship. Therefore, the rectangles with dimensions represented by the ordered pairs(w, l) will have corresponding sides in proportion. Since corresponding angles are also congruent (all 4 right angles of a rectangle are congruent), the graph in the rst quadrant represents the set of all similar rectangles having l : w = 1.5 : 1. For every inch of width on the graph, the length is 1.5 inches. All photos similar to the original 4-inch by 6-inch photo must lie on this straight line (quadrant 1 only) that passes through the origin.
3. The width of a similar photo with a length of 15 inches will be 10 inches. A scale factor is determined by
or 2.5. This scale factor of 2.5 will scale up the 6-inch length to 15 inches. Since the photos will be similar, the 4-inch width must also be scaled up by this same factor as shown below. The ratio 10 : 15 is equivalent to the ratio 4 : 6, the ratio of the number of inches in the width to the number of inches in the length.
4. A photo measuring 9 inches by 13 inches will not follow the same pattern on the graph as the other similar photos. In the set of similar photos on the graph, the ratios of l : w are equivalent to 6 : 4 or 3 : 2. The ratio of 13 : 9 is not equivalent to 6 : 4 or 3 : 2. Therefore, the photo indicated by the point (9, 13) is not on the straight line containing the given points of the similar photos.
Another strategy involves the use of a graphing calculator. Since the ratio of length to width in the set of
15 6 2 12
÷ =
64
11
inches inches
x 2.52.5
5 inches0 inches
=
(7.6) Geometry and spatial reasoning. The student compares and classi es shapes and solids using geometric vocabulary and properties. The student is expected to:
(D) use critical attributes to de ne similarity
(7.7) Geometry and spatial reasoning. The student uses coordinate geometry to describe location on a plane. The student is expected to:
(A) locate and name points on a coordinate plane using ordered pairs of integers
(7.8) Geometry and spatial reasoning. The student uses geometry to model and describe the physical world. The student is expected to:
(C) use geometric concepts and properties to solve problems in elds such as art and architecture
(7.9) Measurement. The student solves application problems involving estimation and measurement. The student is expected to
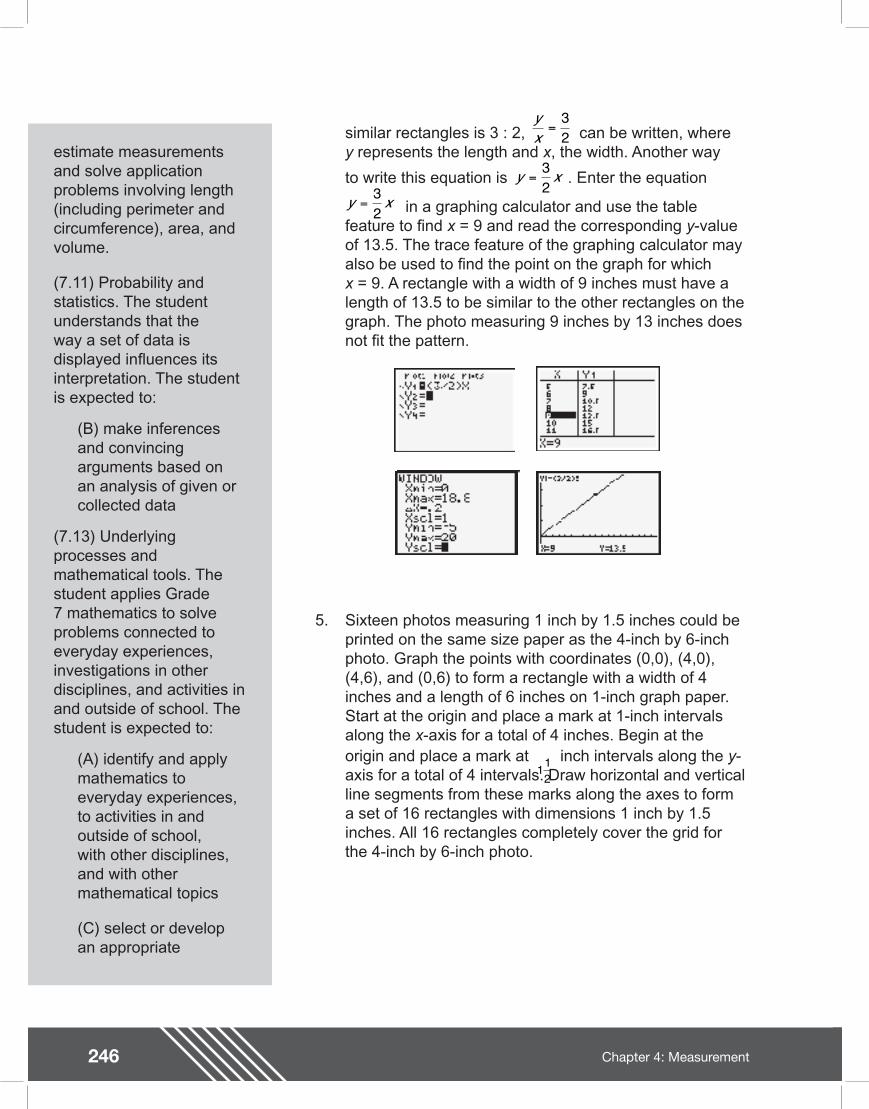
246 Chapter 4: Measurement
Teacher Notesestimate measurements and solve application problems involving length (including perimeter and circumference), area, and volume.
(7.11) Probability and statistics. The student understands that the way a set of data is displayed in uences its interpretation. The student is expected to:
(B) make inferences and convincing arguments based on an analysis of given or collected data
(7.13) Underlying processes and mathematical tools. The student applies Grade 7 mathematics to solve problems connected to everyday experiences, investigations in other disciplines, and activities in and outside of school. The student is expected to:
(A) identify and apply mathematics to everyday experiences, to activities in and outside of school, with other disciplines, and with other mathematical topics
(C) select or develop an appropriate
similar rectangles is 3 : 2, can be written, where y represents the length and x, the width. Another way
to write this equation is . Enter the equation
in a graphing calculator and use the table feature to nd x = 9 and read the corresponding y-value of 13.5. The trace feature of the graphing calculator may also be used to nd the point on the graph for whichx = 9. A rectangle with a width of 9 inches must have a length of 13.5 to be similar to the other rectangles on the graph. The photo measuring 9 inches by 13 inches does not t the pattern.
5. Sixteen photos measuring 1 inch by 1.5 inches could be printed on the same size paper as the 4-inch by 6-inch photo. Graph the points with coordinates (0,0), (4,0), (4,6), and (0,6) to form a rectangle with a width of 4 inches and a length of 6 inches on 1-inch graph paper. Start at the origin and place a mark at 1-inch intervals along the x-axis for a total of 4 inches. Begin at the origin and place a mark at inch intervals along the y-axis for a total of 4 intervals. Draw horizontal and vertical line segments from these marks along the axes to form a set of 16 rectangles with dimensions 1 inch by 1.5 inches. All 16 rectangles completely cover the grid for the 4-inch by 6-inch photo.
yx
=32
y x=32
y x=32
112
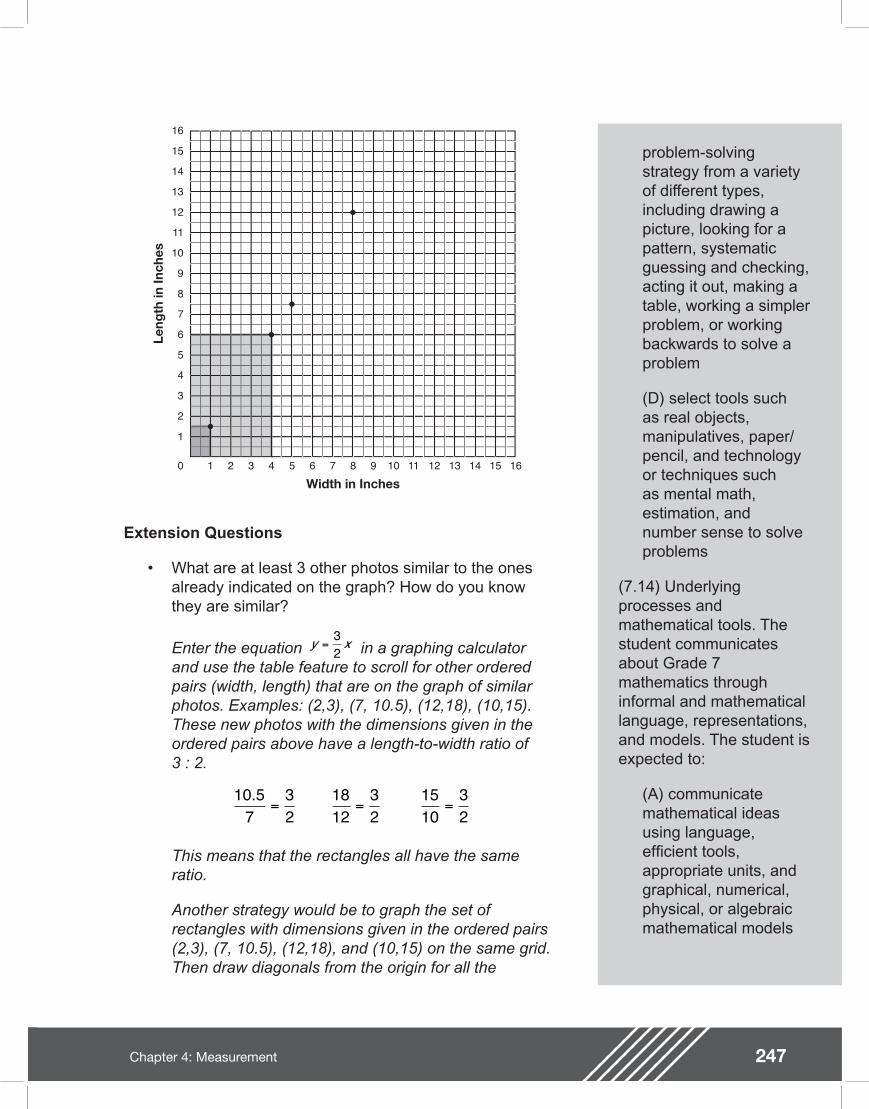
247Chapter 4: Measurement
problem-solving strategy from a variety of different types, including drawing a picture, looking for a pattern, systematic guessing and checking, acting it out, making a table, working a simpler problem, or working backwards to solve a problem
(D) select tools such as real objects, manipulatives, paper/pencil, and technology or techniques such as mental math, estimation, and number sense to solve problems
(7.14) Underlying processes and mathematical tools. The student communicates about Grade 7 mathematics through informal and mathematical language, representations, and models. The student is expected to:
(A) communicate mathematical ideas using language, ef cient tools, appropriate units, and graphical, numerical, physical, or algebraic mathematical models
3
1
2
6
4
5
9
7
8
12
10
11
14
13
15
16
31 2 64 5 97 8 1210 11 1413 15 160
Leng
th in
Inch
es
Width in Inches
Extension Questions
�• What are at least 3 other photos similar to the ones already indicated on the graph? How do you know they are similar?
Enter the equation in a graphing calculator and use the table feature to scroll for other ordered pairs (width, length) that are on the graph of similar photos. Examples: (2,3), (7, 10.5), (12,18), (10,15). These new photos with the dimensions given in the ordered pairs above have a length-to-width ratio of3 : 2.
This means that the rectangles all have the same ratio.
Another strategy would be to graph the set of rectangles with dimensions given in the ordered pairs (2,3), (7, 10.5), (12,18), and (10,15) on the same grid. Then draw diagonals from the origin for all the
y x=32
10 57
32
1812
32
1510
32
.= = =
248 Chapter 4: Measurement
Teacher Notes
Texas Assessment of Knowledge and Skills
Objective 2: The student will demonstrate an understanding of patterns, relationships, and algebraic reasoning.
Objective 3: The student will demonstrate an understanding of geometry and spatial reasoning.
Objective 4: The student will demonstrate an understanding of the concepts and uses of measurement.
Objective 5: The student will demonstrate an understanding of probability and statistics.
rectangles. The diagonals will all lie on the same line.
Graph the line . This line would contain all the ordered pairs whose coordinates represent similar
rectangles with the same ratio 3 : 2. The line is the same line as the line containing the diagonals of the given rectangles.
�• If you double the dimensions of the 4-inch by 6-inch photo, by what factor does the area change?
When the dimensions of the 4-inch by 6-inch photo are doubled to 8 inches by 12 inches, the area increases from 24 square inches to 96 square inches. This is an increase by a factor of 4 because96 ÷ 24 = 4. When the dimensions of a gure are changed by a scale factor n, the area is changed by a factor of n2 , the square of the scale factor.
y x=32
y x=32
249Chapter 4: Measurement
Student Work Sample
This student�’s work shows the use of multiple ways of nding percentages, including scaling, division, and knowledge of benchmark fractions and percentages.
The work exempli es many of the criteria on the solution guide, especially the following:
�• Describes mathematical relationships
�• Recognizes and applies proportional relationships
�• Solves problems involving proportional relationships using solution method(s) including equivalent ratios, scale factors, and equations
�• Demonstrates an understanding of mathematical concepts, processes, and skills
�• Uses multiple representations (such as concrete models, tables, graphs, symbols, and verbal descriptions) and makes connections among them
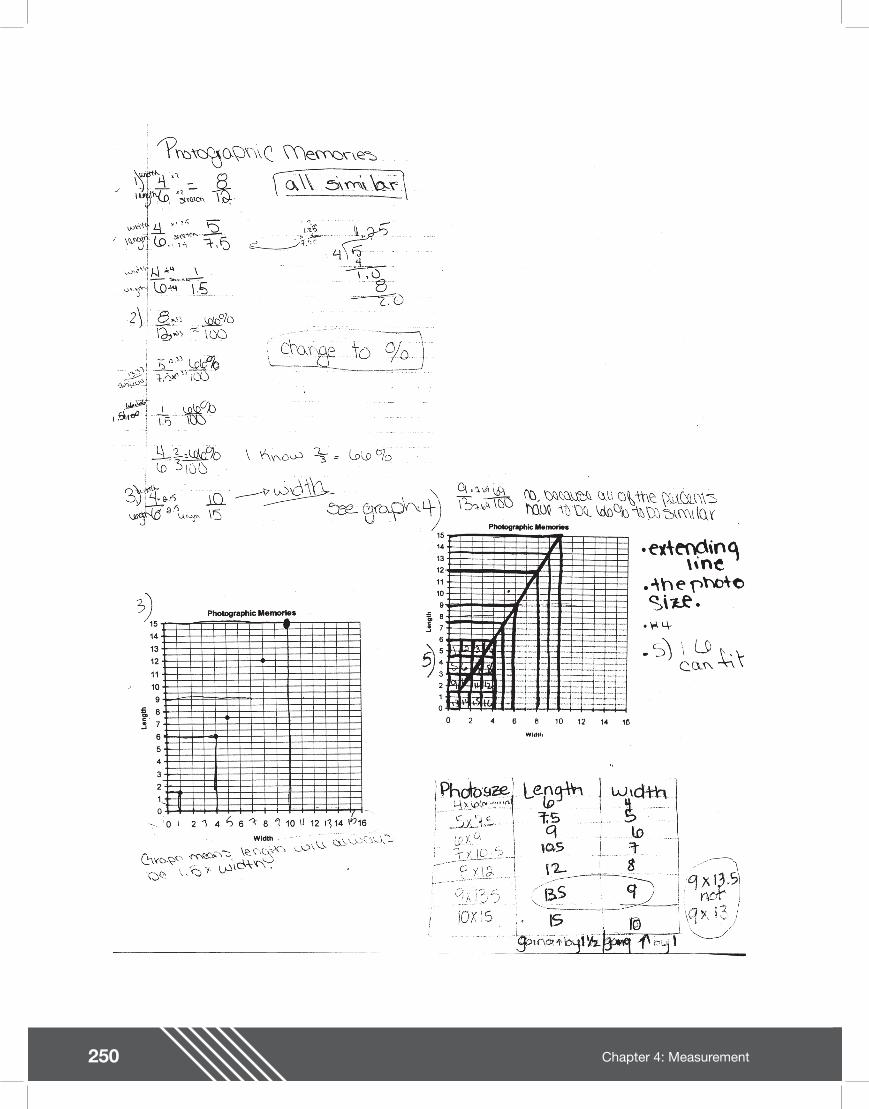
250 Chapter 4: Measurement
251Chapter 4: Measurement
Liberty Enlightening the World! grade 8
The Statue of Liberty was given to the United States more than 100 years ago by France in recognition of our friendship. Building the Statue of Liberty was a massive task. Lady Liberty holds in her left hand a tablet stating in Roman numerals July 4 (IV), 1776 (MDCCLXXVI). The tablet measures 7.19 meters long, 4.14 meters wide, and 0.61 meter thick.
The distance from the ground to the tip of the torch is 92.99 meters. The distance across one of the statue�’s eyes is 0.71 meter.
The gift shop sells a miniature Statue of Liberty to take home as a souvenir. The miniature statue is a scaled model of the actual statue.
1. If the distance across Lady Liberty�’s eye is 0.5 centimeter in the miniature statue, what is the scale factor from the miniature statue to the actual statue? Explain your thinking.
2. What are the approximate dimensions of the tablet in the miniature statue? Show how you determined these.
3. If the Statue of Liberty�’s tablet is solid, what would be the volume of the tablet? What would be the volume of the tablet in the miniature Statue of Liberty? How do these relate?
4. If you wanted a scaled model of the Statue of Liberty to be as tall as yourself, what information do you need?
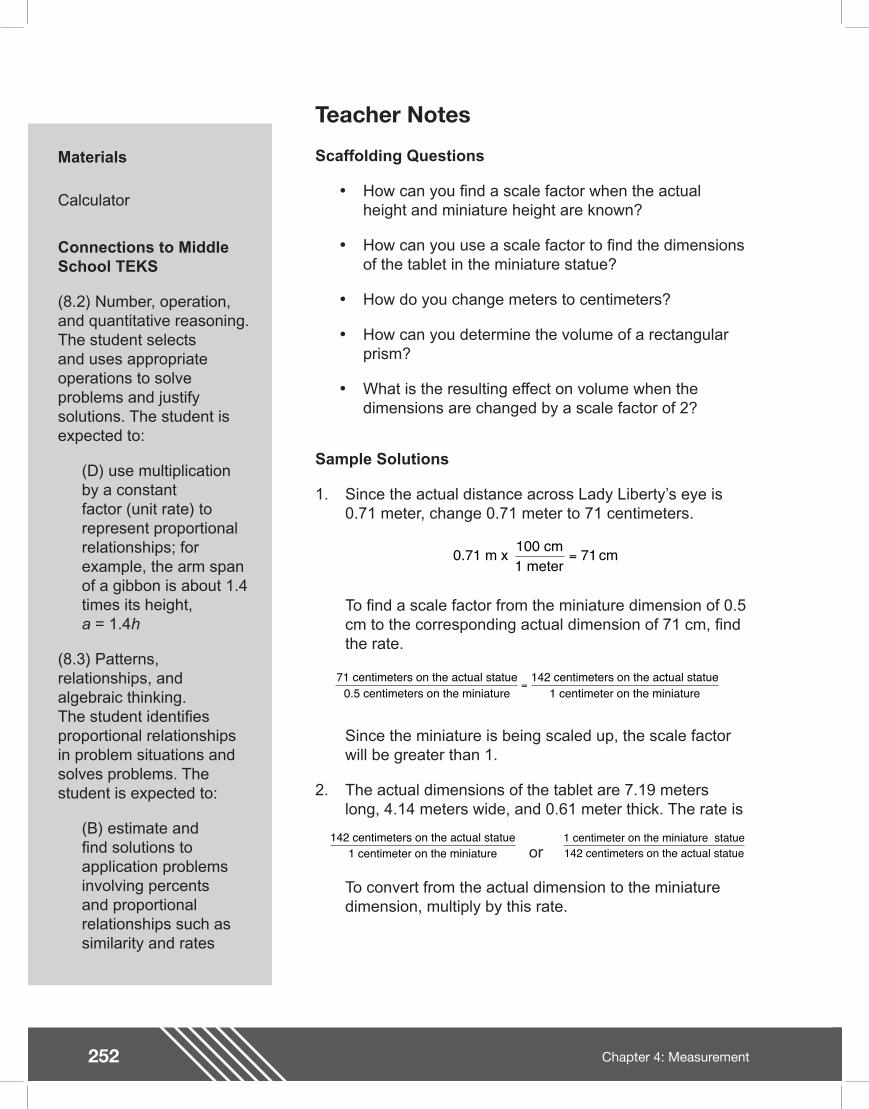
252 Chapter 4: Measurement
Teacher Notes
Materials
Calculator
Connections to Middle School TEKS
(8.2) Number, operation, and quantitative reasoning. The student selects and uses appropriate operations to solve problems and justify solutions. The student is expected to:
(D) use multiplication by a constant factor (unit rate) to represent proportional relationships; for example, the arm span of a gibbon is about 1.4 times its height,a = 1.4h
(8.3) Patterns, relationships, and algebraic thinking. The student identi es proportional relationships in problem situations and solves problems. The student is expected to:
(B) estimate and nd solutions to application problems involving percents and proportional relationships such as similarity and rates
Scaffolding Questions
�• How can you nd a scale factor when the actual height and miniature height are known?
�• How can you use a scale factor to nd the dimensions of the tablet in the miniature statue?
�• How do you change meters to centimeters?
�• How can you determine the volume of a rectangular prism?
�• What is the resulting effect on volume when the dimensions are changed by a scale factor of 2?
Sample Solutions
1. Since the actual distance across Lady Liberty�’s eye is 0.71 meter, change 0.71 meter to 71 centimeters.
To nd a scale factor from the miniature dimension of 0.5 cm to the corresponding actual dimension of 71 cm, nd the rate.
Since the miniature is being scaled up, the scale factor will be greater than 1.
2. The actual dimensions of the tablet are 7.19 meters long, 4.14 meters wide, and 0.61 meter thick. The rate is
or
To convert from the actual dimension to the miniature dimension, multiply by this rate.
0.71 m x 100 cm1 meter
cm= 71
71 centimeters on the actual statue0.5 centimeters on the miniature
142 centimeters on the actual statue1 centimeter on the miniature
=
1 centimeter on the miniature statue142 centimeters on the actual statue
142 centimeters on the actual statue1 centimeter on the miniature
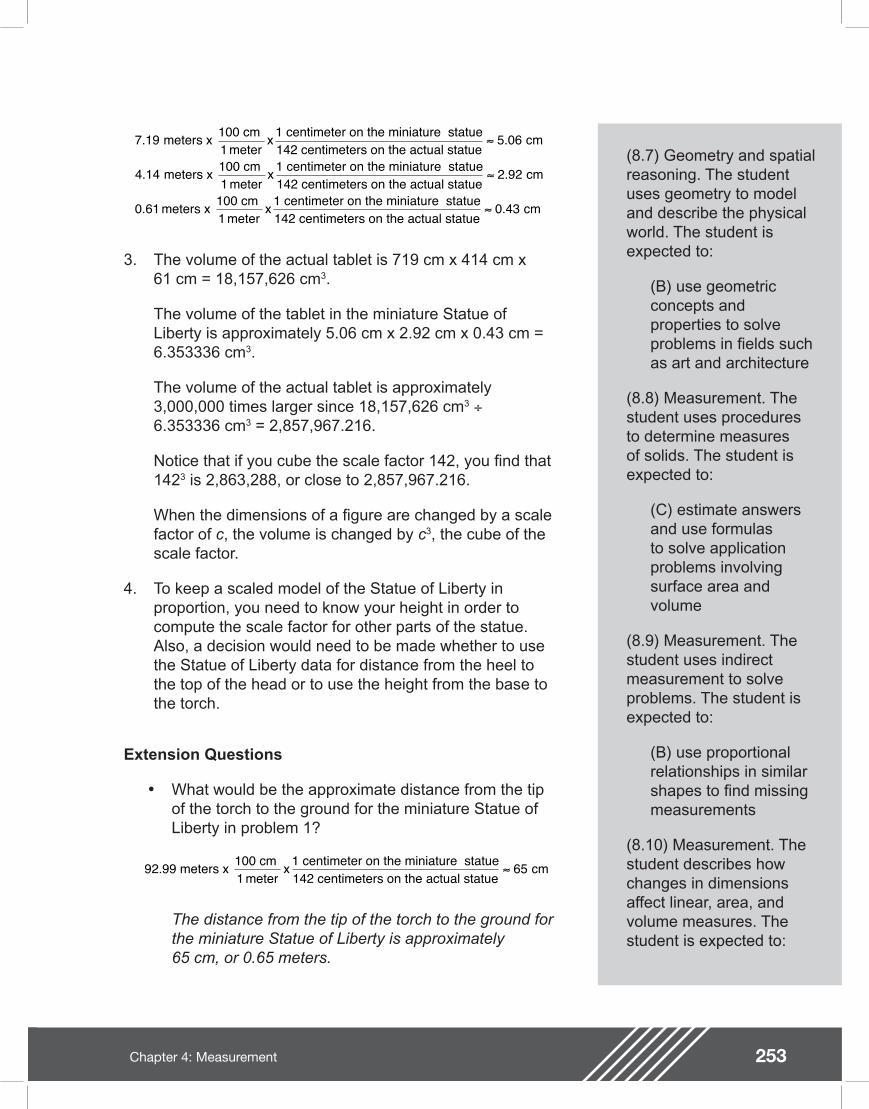
253Chapter 4: Measurement
(8.7) Geometry and spatial reasoning. The student uses geometry to model and describe the physical world. The student is expected to:
(B) use geometric concepts and properties to solve problems in elds such as art and architecture
(8.8) Measurement. The student uses procedures to determine measures of solids. The student is expected to:
(C) estimate answers and use formulas to solve application problems involving surface area and volume
(8.9) Measurement. The student uses indirect measurement to solve problems. The student is expected to:
(B) use proportional relationships in similar shapes to nd missing measurements
(8.10) Measurement. The student describes how changes in dimensions affect linear, area, and volume measures. The student is expected to:
3. The volume of the actual tablet is 719 cm x 414 cm x61 cm = 18,157,626 cm3.
The volume of the tablet in the miniature Statue of Liberty is approximately 5.06 cm x 2.92 cm x 0.43 cm = 6.353336 cm3.
The volume of the actual tablet is approximately 3,000,000 times larger since 18,157,626 cm3 ÷6.353336 cm3 = 2,857,967.216.
Notice that if you cube the scale factor 142, you nd that 1423 is 2,863,288, or close to 2,857,967.216.
When the dimensions of a gure are changed by a scale factor of c, the volume is changed by c3, the cube of the scale factor.
4. To keep a scaled model of the Statue of Liberty in proportion, you need to know your height in order to compute the scale factor for other parts of the statue. Also, a decision would need to be made whether to use the Statue of Liberty data for distance from the heel to the top of the head or to use the height from the base to the torch.
Extension Questions
�• What would be the approximate distance from the tip of the torch to the ground for the miniature Statue of Liberty in problem 1?
The distance from the tip of the torch to the ground for the miniature Statue of Liberty is approximately65 cm, or 0.65 meters.
7 191
5 06
4 141
2 92
0 611
0 43
. .
. .
. .
meters x 100 cm meter
x 1 centimeter on the miniature statue142 centimeters on the actual statue
cm
meters x 100 cm meter
x 1 centimeter on the miniature statue142 centimeters on the actual statue
cm
meters x 100 cm meter
x 1 centimeter on the miniature statue142 centimeters on the actual statue
cm
91
652.99 meters x 100 cm meter
x 1 centimeter on the miniature statue142 centimeters on the actual statue
cm
254 Chapter 4: Measurement
Teacher Notes
(B) describe the resulting effect on volume when dimensions of a solid are changed proportionally
Texas Assessment of Knowledge and Skills
Objective 1: The student will demonstrate an understanding of numbers, operations, and quantitative reasoning.
Objective 2: The student will demonstrate an understanding of patterns, relationships, and algebraic reasoning.
Objective 3: The student will demonstrate an understanding of geometry and spatial reasoning.
Objective 4: The student will demonstrate an understanding of the concepts and uses of measurement.
�• The distance from the heel to the top of the head of the Statue of Liberty is 33.86 m. What is the scale factor from your �“heel to top of the head�” height to the corresponding distance of the actual Statue of Liberty?
Answers will vary for this question depending on the height of the person. For example, if a person were 140 cm tall, a scale factor of 24.2 could be determined using division.
33.86 m = 3,386 cm
3 386 140 24 2, cm cm .÷

255Chapter 4: Measurement

256 Chapter 4: Measurement
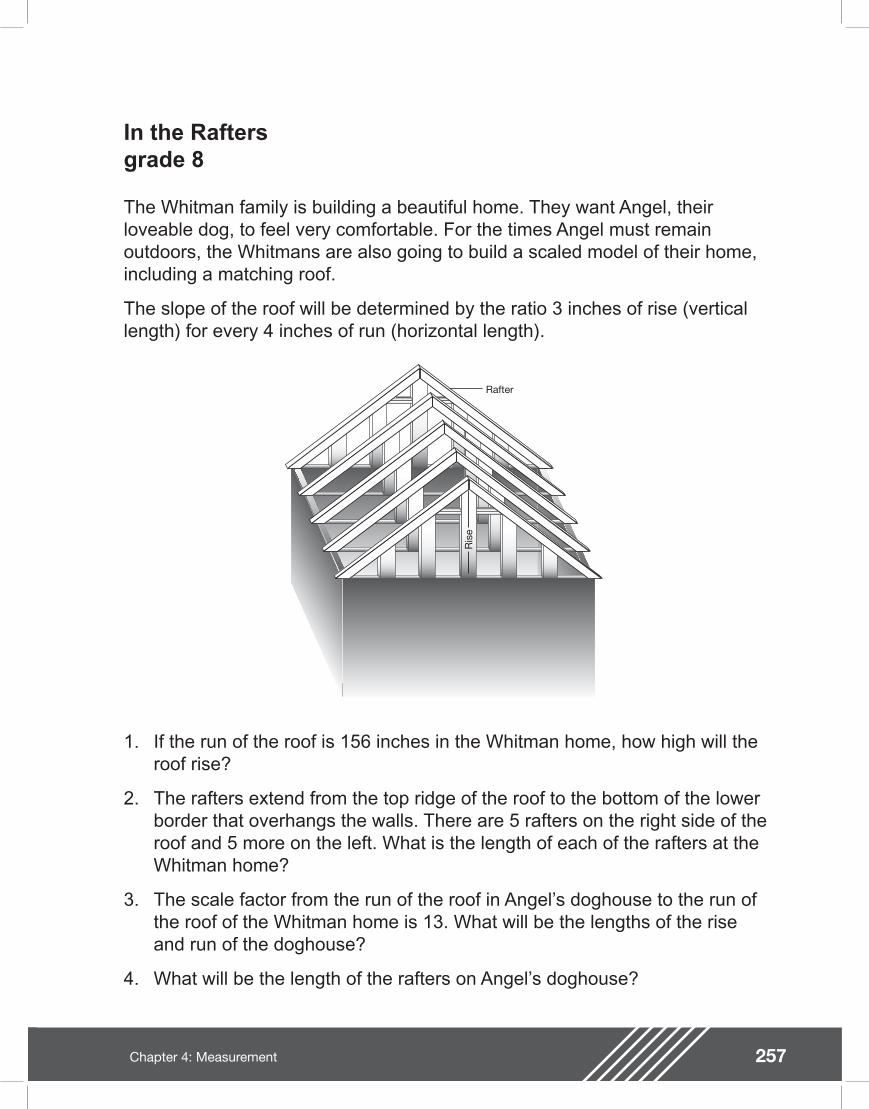
257Chapter 4: Measurement
In the Rafters grade 8
The Whitman family is building a beautiful home. They want Angel, their loveable dog, to feel very comfortable. For the times Angel must remain outdoors, the Whitmans are also going to build a scaled model of their home, including a matching roof.
The slope of the roof will be determined by the ratio 3 inches of rise (vertical length) for every 4 inches of run (horizontal length).
Rafter
Ris
e
1. If the run of the roof is 156 inches in the Whitman home, how high will the roof rise?
2. The rafters extend from the top ridge of the roof to the bottom of the lower border that overhangs the walls. There are 5 rafters on the right side of the roof and 5 more on the left. What is the length of each of the rafters at the Whitman home?
3. The scale factor from the run of the roof in Angel�’s doghouse to the run of the roof of the Whitman home is 13. What will be the lengths of the rise and run of the doghouse?
4. What will be the length of the rafters on Angel�’s doghouse?
258 Chapter 4: Measurement
Teacher Notes
Materials
Calculator
Connections to Middle School TEKS
(8.2) Number, operation, and quantitative reasoning. The student selects and uses appropriate operations to solve problems and justify solutions. The student is expected to:
(D) use multiplication by a constant factor (unit rate) to represent proportional relationships; for example, the arm span of a gibbon is about 1.4 times its height,a = 1.4h
(8.3) Patterns, relationships, and algebraic thinking. The student identi es proportional relationships in problem situations and solves problems. The student is expected to:
(B) estimate and nd solutions to application problems involving percents and proportional relationships such as similarity and rates
Scaffolding Questions
�• How could you label the roof of the Whitman home with the measurements that are given?
�• How would a triangle similar to one on the roof be labeled to show the relationships between rise and run?
�• How do you nd the length of the hypotenuse of a right triangle?
Sample Solution
1. The slope of a roof is determined by the ratio of 3 inches of rise for every 4 inches of run. The scale factor is 39 because 156 in. ÷ 4 in. = 39.
Therefore, the rise of the Whitman home is 117 feet.
2. A right triangle is formed by the rise, the run, and the connecting rafter, so the Pythagorean Theorem may be used to nd the length of one rafter. The legs of the right triangle are the rise and the run. The hypotenuse is the rafter.
32 + 42 = (hypoteneuse)2
9 + 16 = 25
25 = 52
This means that for every 3 inches of rise and every 4 inches of run, the rafter must be 5 inches long.
The proportion can be solved to nd f, the number of inches of rafter needed for the Whitman home. Since 117 in. ÷ 3 in. = 39 and 39 in. x 5 in. = 195, 195 inches of rafter are needed for each rafter of the Whitman home.
3 1 inches of rise4 inches of run
x 3939
17 inches of rise156 inches of run
=
3 inches of run inches of rafter
inches of run5
117=
f
259Chapter 4: Measurement
(8.6) Geometry and spatial reasoning. The student uses transformational geometry to develop spatial sense. The student is expected to:
(A) generate similar shapes using dilations including enlargements and reductions
(8.7) Geometry and spatial reasoning. The student uses geometry to model and describe the physical world. The student is expected to:
(B) use geometric concepts and properties to solve problems in elds such as art and architecture
(8.9) Measurement. The student uses indirect measurement to solve problems. The student is expected to:
(A) use the Pythagorean Theorem to solve real-life problems
(B) use proportional relationships in similar shapes to nd missing measurements
3. Using the given scale factor of 13, the proportion
can be solved for x and y using division.
117 in. ÷ 13 in. = 9 in. and 156 in. ÷ 13 in. = 12 in.
This means that the roof in Angel�’s home will have a rise of 9 inches and a run of 12 inches.
4. Because 92 + 122 = 81 + 144 = 225 = 152, each rafter will be 15 inches in length.
Extension Questions
�• How many feet of wood are needed for all 10 rafters in Angel�’s home?
Each rafter is 15 inches and there are 10 rafters, so 150 inches of wood are needed.
�• As much as possible, rafters are continuous pieces of wood for sturdiness, instead of a lot of pieces of wood patched together. Rafters should be patched at most once per rafter. If rafters are made of boards of wood 10 feet long, how many actual 10-foot boards are needed for all 10 rafters in the Whitman home?
Since one rafter is 195 inches or 16.25 ft. long and 16.25 ÷ 10 = 1.625, 1.625 pieces of 10 feet board are needed for one rafter. Since there can only be one patched piece, you will need 20 boards for the rafters.
Each rafter will need one 10-foot board and of a
second board. Since there is only of the second board left, this piece will be scrapped.
xy inches of rise inches of run
inches of rise156 inches of run
× =1313
117
150 12 5 inches x 1 foot12 inches
feet= .
583
8
260 Chapter 4: Measurement
Teacher Notes
Texas Assessment of Knowledge and Skills
Objective 2: The student will demonstrate an understanding of patterns, relationships, and algebraic reasoning.
Objective 3: The student will demonstrate an understanding of geometry and spatial reasoning.
Objective 4: The student will demonstrate an understanding of the concepts and uses of measurement.

261Chapter 4: Measurement

262 Chapter 4: Measurement
Middle SchooIAssessments
Chapter 5:Probability andStatistics

264 Chapter 5: Probability and Statistics
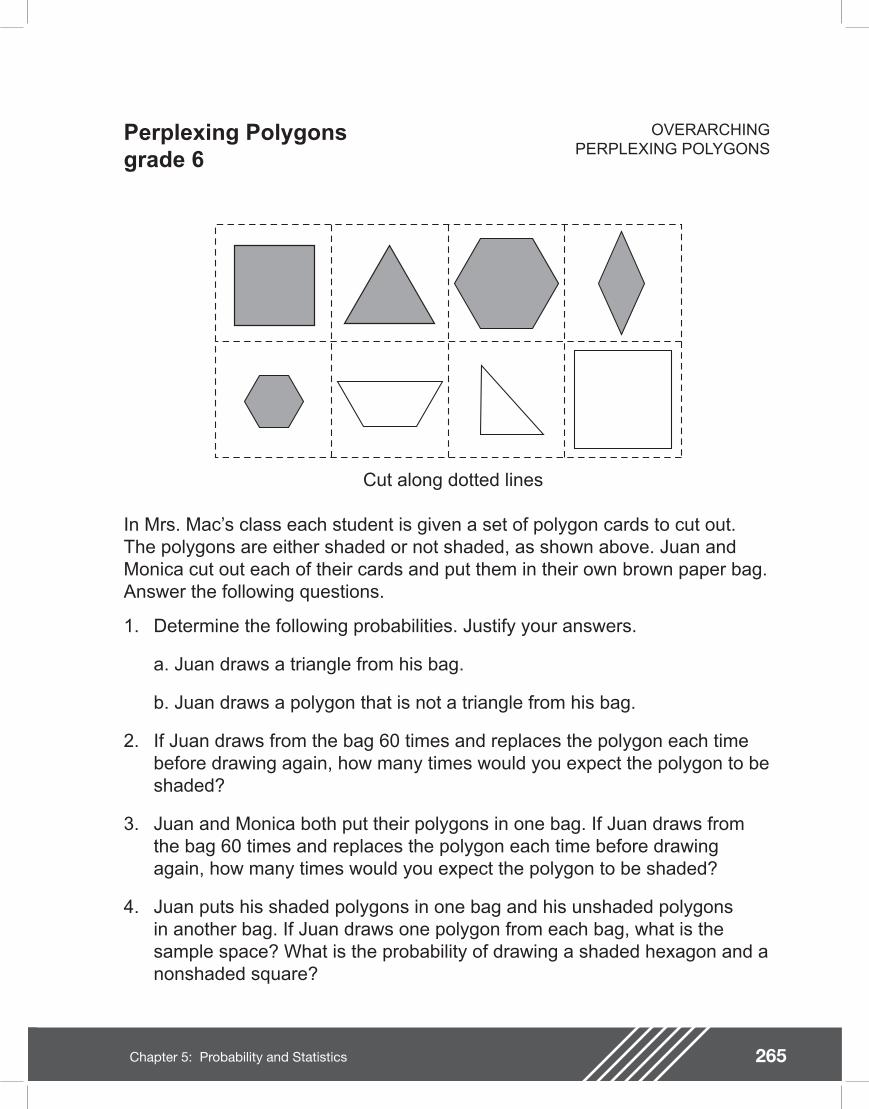
265Chapter 5: Probability and Statistics
Perplexing Polygonsgrade 6
Cut along dotted lines
In Mrs. Mac�’s class each student is given a set of polygon cards to cut out. The polygons are either shaded or not shaded, as shown above. Juan and Monica cut out each of their cards and put them in their own brown paper bag. Answer the following questions.
1. Determine the following probabilities. Justify your answers.
a. Juan draws a triangle from his bag.
b. Juan draws a polygon that is not a triangle from his bag.
2. If Juan draws from the bag 60 times and replaces the polygon each time before drawing again, how many times would you expect the polygon to be shaded?
3. Juan and Monica both put their polygons in one bag. If Juan draws from the bag 60 times and replaces the polygon each time before drawing again, how many times would you expect the polygon to be shaded?
4. Juan puts his shaded polygons in one bag and his unshaded polygons in another bag. If Juan draws one polygon from each bag, what is the sample space? What is the probability of drawing a shaded hexagon and a nonshaded square?
OVERARCHINGPERPLEXING POLYGONS
266 Chapter 5: Probability and Statistics
Teacher Notes
Materials
Calculator
Connections to Middle School TEKS
(6.9) Probability and statistics. The student uses experimental and theoretical probability to make predictions. The student is expected to:
(A) construct sample spaces using lists, tree diagrams, and combinations
(B) nd the probabilities of a simple event and its complement and describe the relationship between the two
(6.3) Patterns, relationships, and algebraic thinking. The student solves problems involving proportional relationships. Patterns, relationships, and algebraic thinking. The student solves problems involving proportional relationships. The student is expected to:
(C) use ratios to make predictions in proportional situations
Scaffolding Questions
�• How can you determine the probability of an event?
�• Which of the polygons are quadrilaterals? How do you know?
�• Explain the relationship between the questions in 1a and 1b.
�• How do you nd the probability of drawing a shaded polygon from the bag?
�• Describe the effect of pulling a polygon from the bag 60 times.
�• What is the effect of putting two sets of polygons together in a bag?
�• What does sample space mean?
Sample Solutions
1. a. There are two triangles in the set of eight polygons.
P(drawing a triangle) =
b. The probability of not drawing a triangle is the complement of drawing a triangle.
P(not drawing a triangle) = or
2. There are 5 shaded polygons in the bag and 8 total polygons in the bag.
P(drawing a shaded polygon) =
2 triangles8 polygons
=14
1 14
34
= 6 nontriangles8 polygons
=34
5 shaded polygons8 polygons
=58
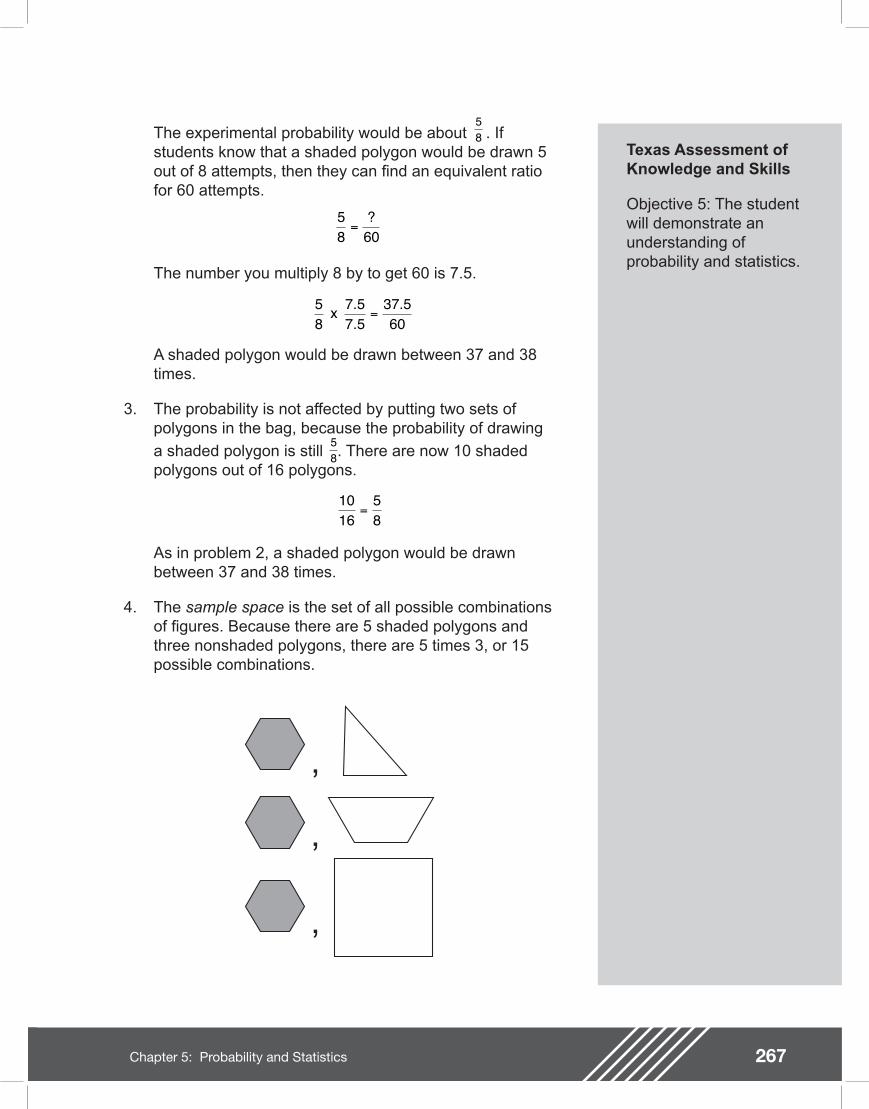
267Chapter 5: Probability and Statistics
Texas Assessment of Knowledge and Skills
Objective 5: The student will demonstrate an understanding of probability and statistics.
The experimental probability would be about . If students know that a shaded polygon would be drawn 5 out of 8 attempts, then they can nd an equivalent ratio for 60 attempts.
The number you multiply 8 by to get 60 is 7.5.
A shaded polygon would be drawn between 37 and 38 times.
3. The probability is not affected by putting two sets of polygons in the bag, because the probability of drawing
a shaded polygon is still . There are now 10 shaded polygons out of 16 polygons.
As in problem 2, a shaded polygon would be drawn between 37 and 38 times.
4. The sample space is the set of all possible combinations of gures. Because there are 5 shaded polygons and three nonshaded polygons, there are 5 times 3, or 15 possible combinations.
58
58 60
=?
58
37 560
x 7.57.5
=.
58
1016
58
=
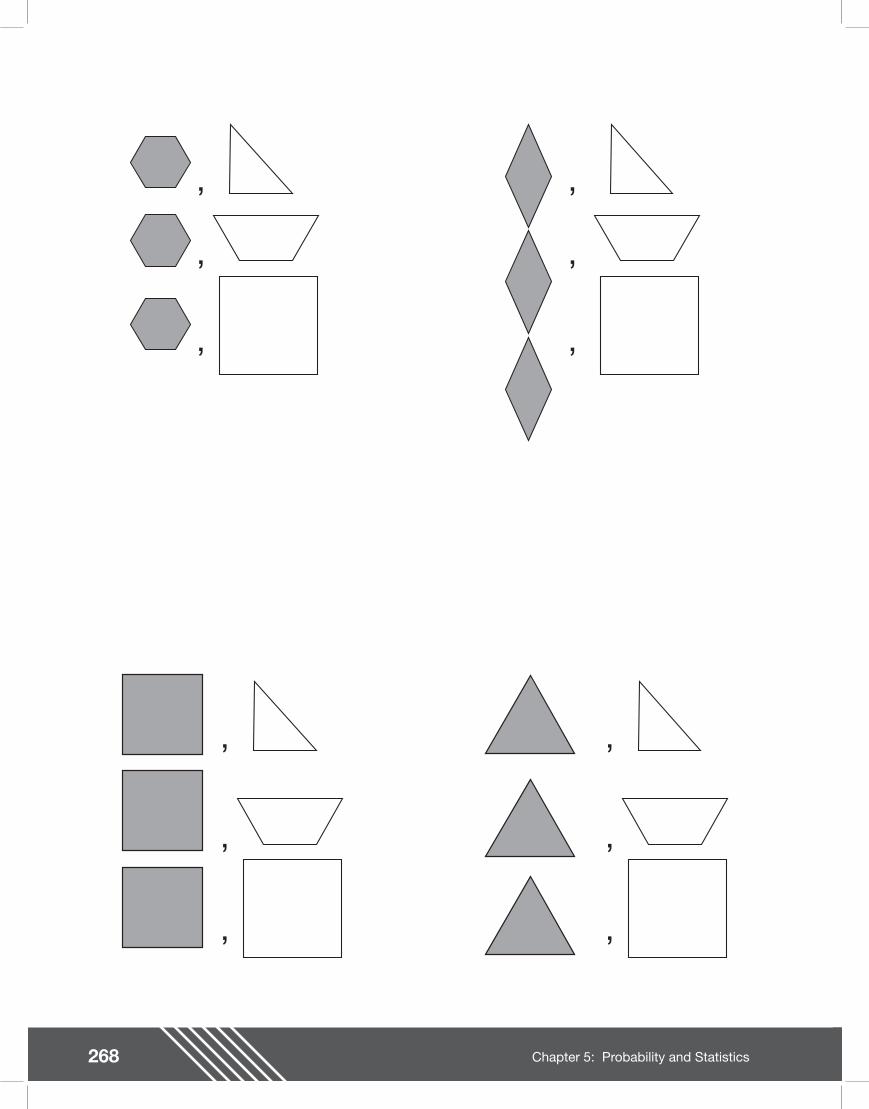
268 Chapter 5: Probability and Statistics
269Chapter 5: Probability and Statistics
Two out of the 15 possibilities have a shaded hexagon and a nonshaded square. The
probability of drawing a shaded hexagon and a nonshaded square is .
Extension Questions
�• Describe what could be done to Juan�’s set of polygons so that the probability of
drawing a triangle is .
One possibility is to leave the two triangles in the set of polygons and remove two other polygons from the set. The total number of polygons would then be 6.
�• Consider the situation described in problem 4. Describe how removing the triangles from both bags would change your answer.
The number of shaded polygons would be 4, and the number of nonshaded polygons would be 2. The total number of combinations would be 4 times 2, or 8.
There would still be two desired outcomes. The probability would be .
215
13
26
13
triangles polygons
=
28
14
=
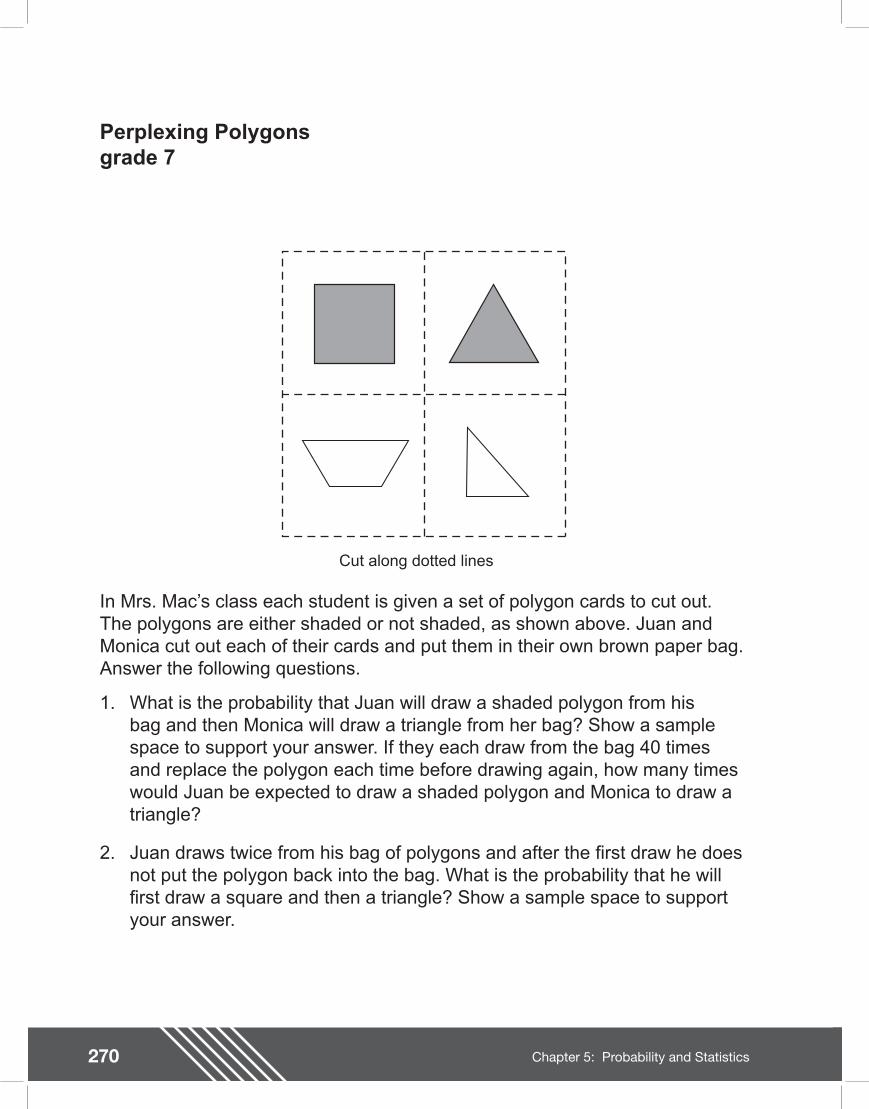
270 Chapter 5: Probability and Statistics
Perplexing Polygonsgrade 7
Cut along dotted lines
In Mrs. Mac�’s class each student is given a set of polygon cards to cut out. The polygons are either shaded or not shaded, as shown above. Juan and Monica cut out each of their cards and put them in their own brown paper bag. Answer the following questions.
1. What is the probability that Juan will draw a shaded polygon from his bag and then Monica will draw a triangle from her bag? Show a sample space to support your answer. If they each draw from the bag 40 times and replace the polygon each time before drawing again, how many times would Juan be expected to draw a shaded polygon and Monica to draw a triangle?
2. Juan draws twice from his bag of polygons and after the rst draw he does not put the polygon back into the bag. What is the probability that he will rst draw a square and then a triangle? Show a sample space to support your answer.

271Chapter 5: Probability and Statistics
3. Four of the students each put three of their polygons into the same bag. They do not tell which of the polygons they placed into the bag. A student draws from the bag. The results are shown below.
11 18 10 21
Based on these results, what is the experimental probability of drawing each of the polygons from the bag? What polygon will most likely be drawn next?

272 Chapter 5: Probability and Statistics
Teacher NotesMaterials
Calculator
Connections to Middle School TEKS
(7.10) Probability and statistics. The student recognizes that a physical or mathematical model can be used to describe the probability of real-life events. The student is expected to:
(A) construct sample spaces for compound events (dependent and independent)
(B) nd the approximate probability of a compound event through experimentation
(7.3) Patterns, relationships, and algebraic thinking. The student solves problems involving proportional relationships. The student is expected to:
(B) estimate and nd solutions to application problems involving proportional relationships such as similarity, scaling, unit costs, and related measurement units
Scaffolding Questions
�• How can you determine the probability of an event?
�• How do you nd the probability of drawing a shaded polygon from the bag?
�• How do you nd the probability of drawing a triangle from the bag?
�• Is the event described in problem 1 simple or compound?
�• Is the event dependent or independent?
�• Describe the effect of pulling a polygon from the bag 40 times.
�• What is the effect of putting four sets of polygons together in a bag?
�• Explain how to nd out how many polygons are in a bag.
�• Based on the table of results in problem 3, how can you nd out many times the experiment was conducted?
Sample Solutions
1.
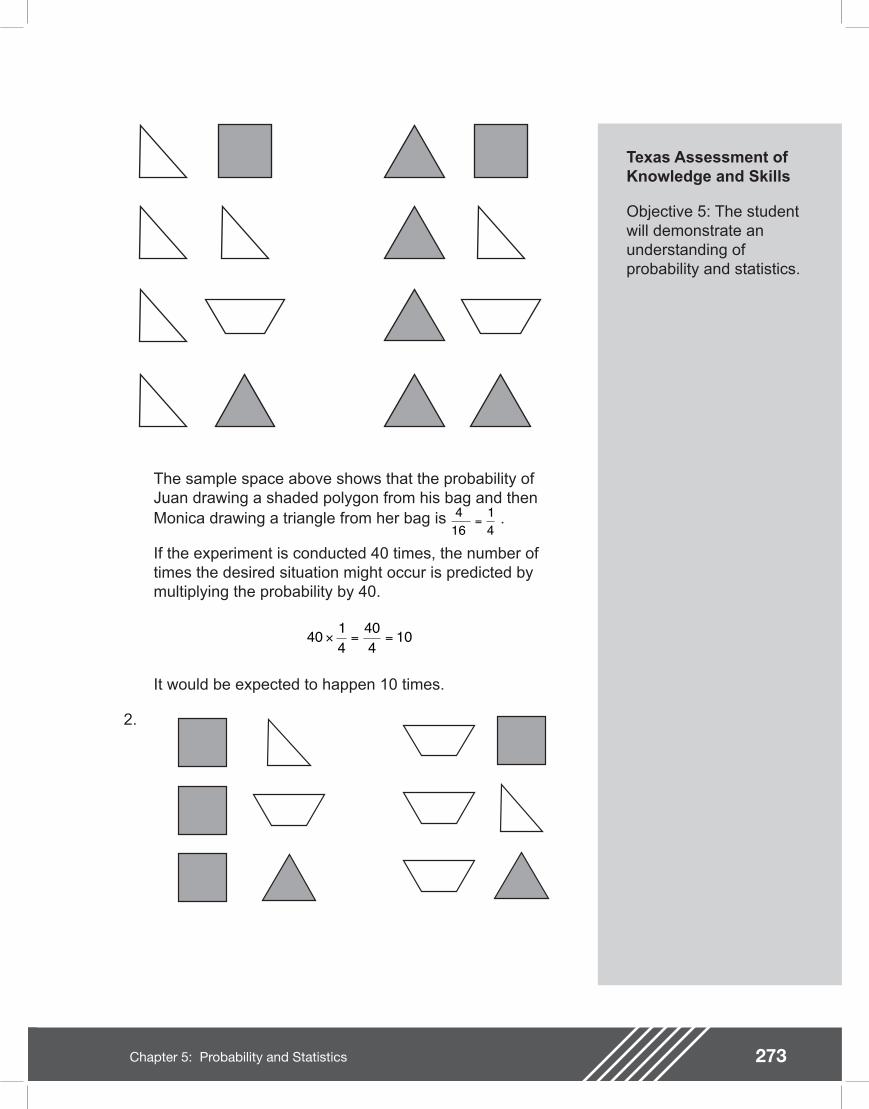
273Chapter 5: Probability and Statistics
Texas Assessment of Knowledge and Skills
Objective 5: The student will demonstrate an understanding of probability and statistics.
The sample space above shows that the probability of Juan drawing a shaded polygon from his bag and then Monica drawing a triangle from her bag is .
If the experiment is conducted 40 times, the number of times the desired situation might occur is predicted by multiplying the probability by 40.
It would be expected to happen 10 times.
2.
416
14
=
40 14
404
10× = =
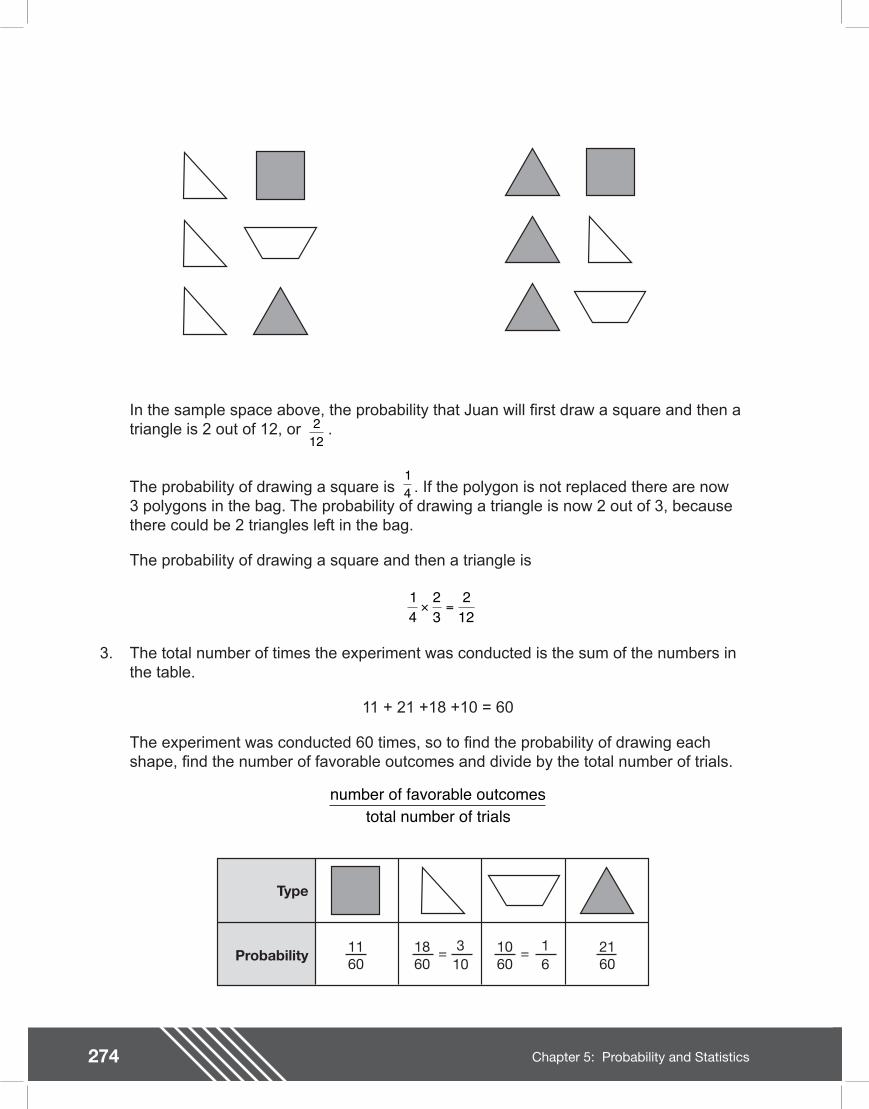
274 Chapter 5: Probability and Statistics
In the sample space above, the probability that Juan will rst draw a square and then a triangle is 2 out of 12, or .
The probability of drawing a square is . If the polygon is not replaced there are now 3 polygons in the bag. The probability of drawing a triangle is now 2 out of 3, because there could be 2 triangles left in the bag.
The probability of drawing a square and then a triangle is
3. The total number of times the experiment was conducted is the sum of the numbers in the table.
11 + 21 +18 +10 = 60
The experiment was conducted 60 times, so to nd the probability of drawing each shape, nd the number of favorable outcomes and divide by the total number of trials.
212
14
number of favorable outcomestotal number of trials
1160
1860
1060
2160
= =310
16
14
23
212
× =
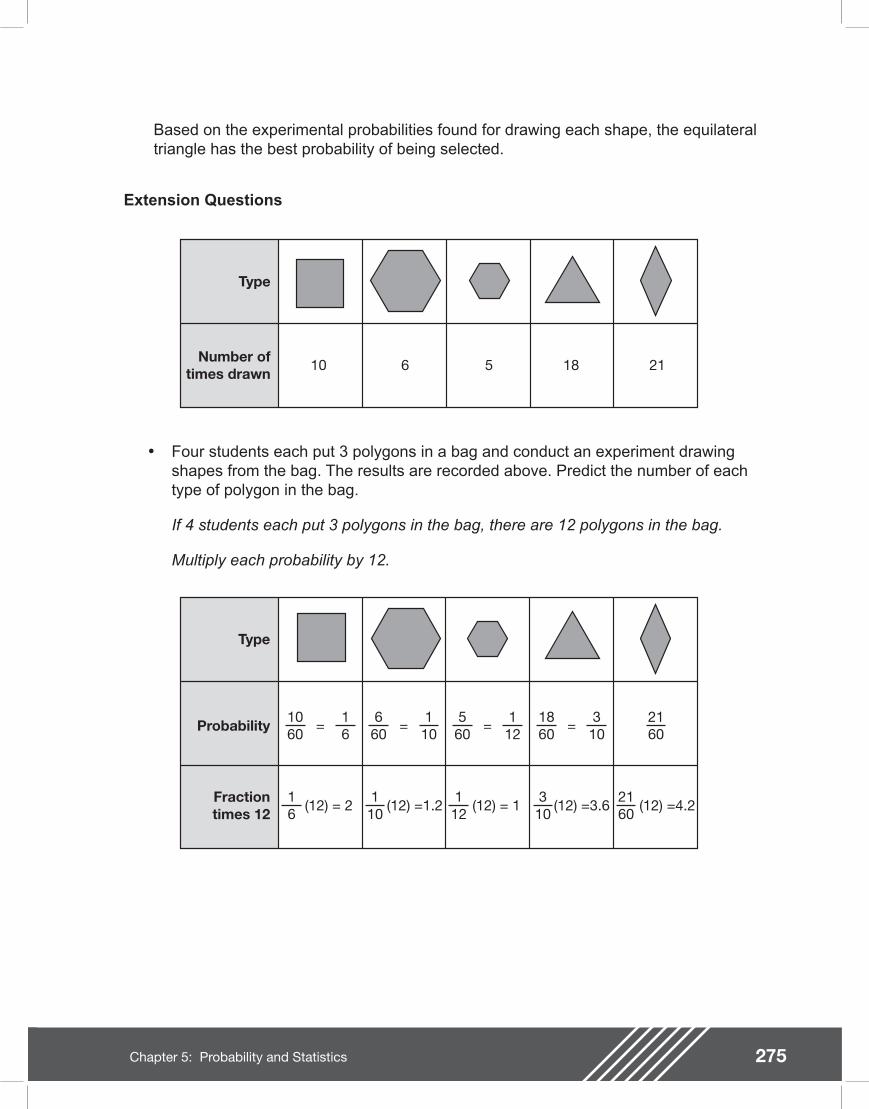
275Chapter 5: Probability and Statistics
Based on the experimental probabilities found for drawing each shape, the equilateral triangle has the best probability of being selected.
Extension Questions
10 6 5 18 21
�• Four students each put 3 polygons in a bag and conduct an experiment drawing shapes from the bag. The results are recorded above. Predict the number of each type of polygon in the bag.
If 4 students each put 3 polygons in the bag, there are 12 polygons in the bag.
Multiply each probability by 12.
1060
660
5 60
18 60
16
110
1 12
3 10
21 60
16
110
1 12
3 10
21 60
=
(12) = 2 (12) =1.2 (12) = 1 (12) =3.6 (12) =4.2
= = =
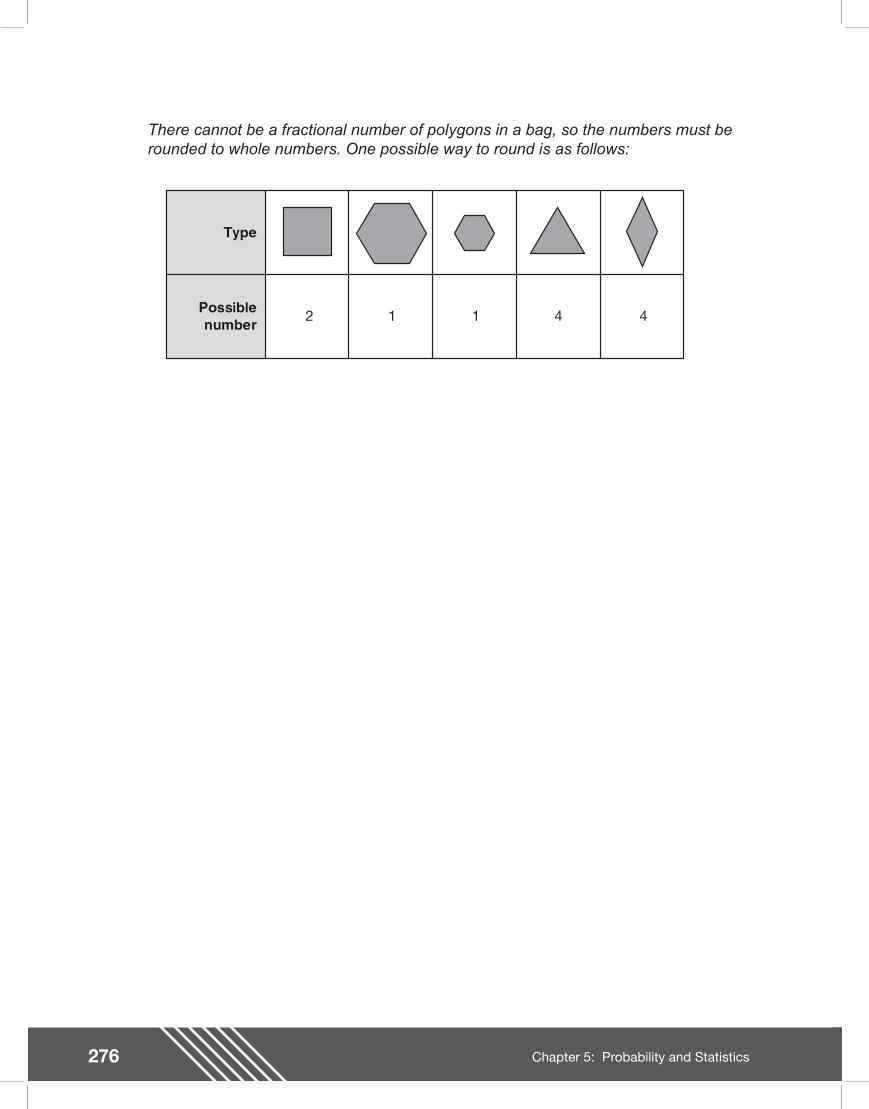
276 Chapter 5: Probability and Statistics
There cannot be a fractional number of polygons in a bag, so the numbers must be rounded to whole numbers. One possible way to round is as follows:
Type
Possiblenumber
2 1 1 4 4
277Chapter 5: Probability and Statistics
Student Work Sample
This student�’s work shows the use of different graphic organizers to nd solutions.
The work exempli es many of the criteria on the solution guide, especially the following:
�• Recognizes and applies proportional relationships
�• Develops and carries out a plan for solving a problem that includes understand the problem, select a strategy, solve the problem, and check
�• Solves problems involving proportional relationships using solution method(s) including equivalent ratios, scale factors, and equations
�• Demonstrates an understanding of mathematical concepts, processes, and skills
�• Uses multiple representations (such as concrete models, tables, graphs, symbols, and verbal descriptions) and makes connections among them
�• Communicates clear, detailed, and organized solution strategy
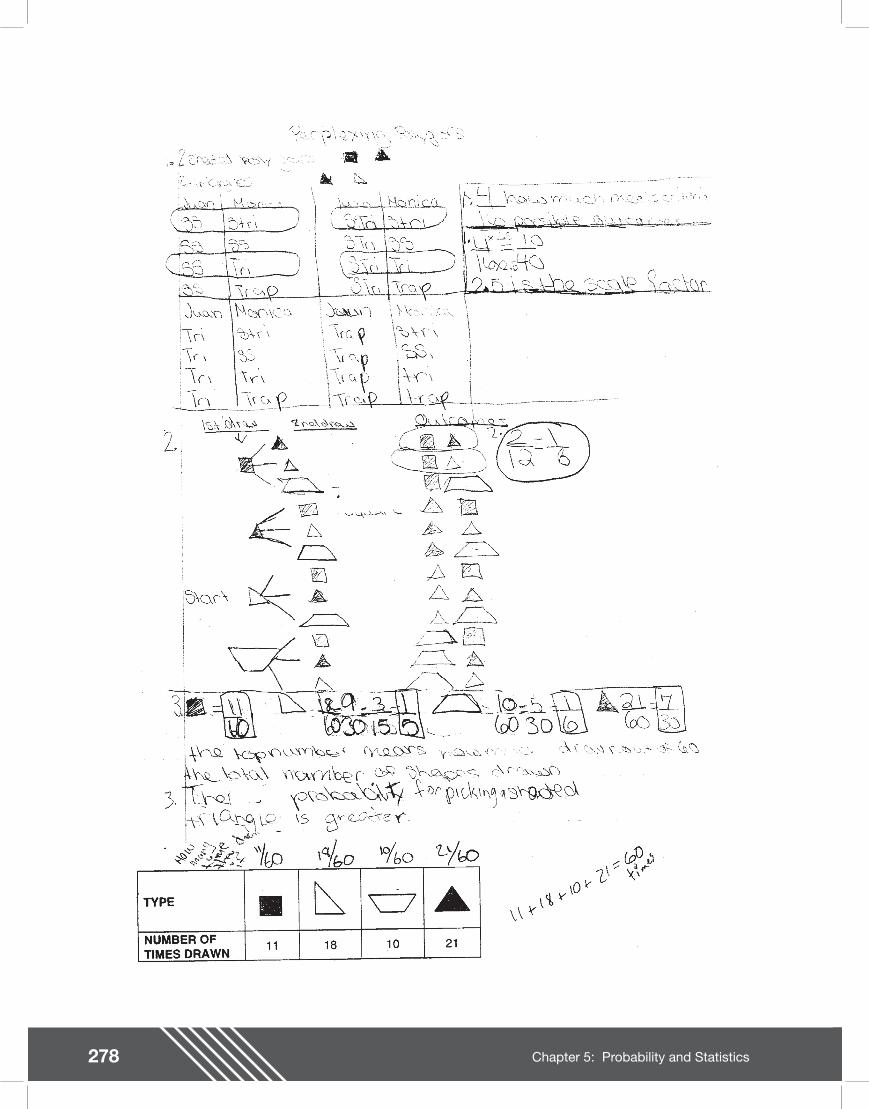
278 Chapter 5: Probability and Statistics
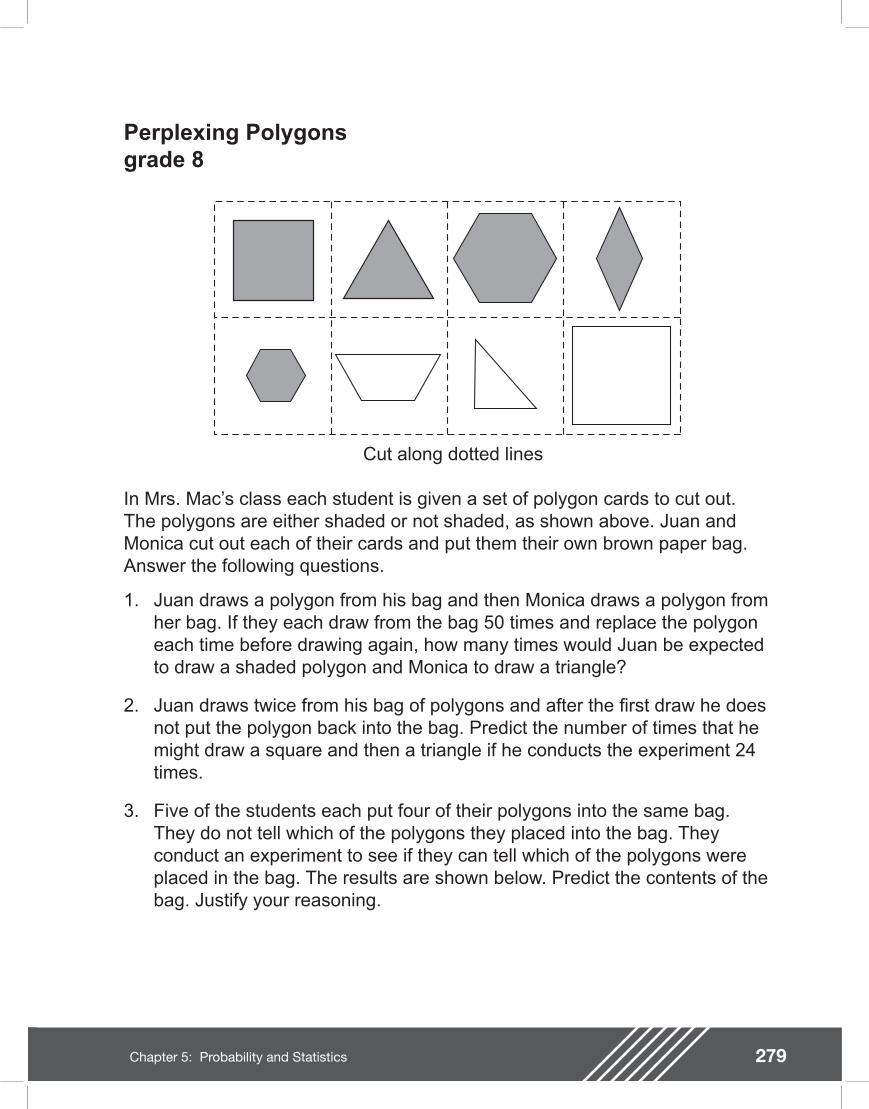
279Chapter 5: Probability and Statistics
Perplexing Polygons grade 8
Cut along dotted lines
In Mrs. Mac�’s class each student is given a set of polygon cards to cut out. The polygons are either shaded or not shaded, as shown above. Juan and Monica cut out each of their cards and put them their own brown paper bag. Answer the following questions.
1. Juan draws a polygon from his bag and then Monica draws a polygon from her bag. If they each draw from the bag 50 times and replace the polygon each time before drawing again, how many times would Juan be expected to draw a shaded polygon and Monica to draw a triangle?
2. Juan draws twice from his bag of polygons and after the rst draw he does not put the polygon back into the bag. Predict the number of times that he might draw a square and then a triangle if he conducts the experiment 24 times.
3. Five of the students each put four of their polygons into the same bag. They do not tell which of the polygons they placed into the bag. They conduct an experiment to see if they can tell which of the polygons were placed in the bag. The results are shown below. Predict the contents of the bag. Justify your reasoning.
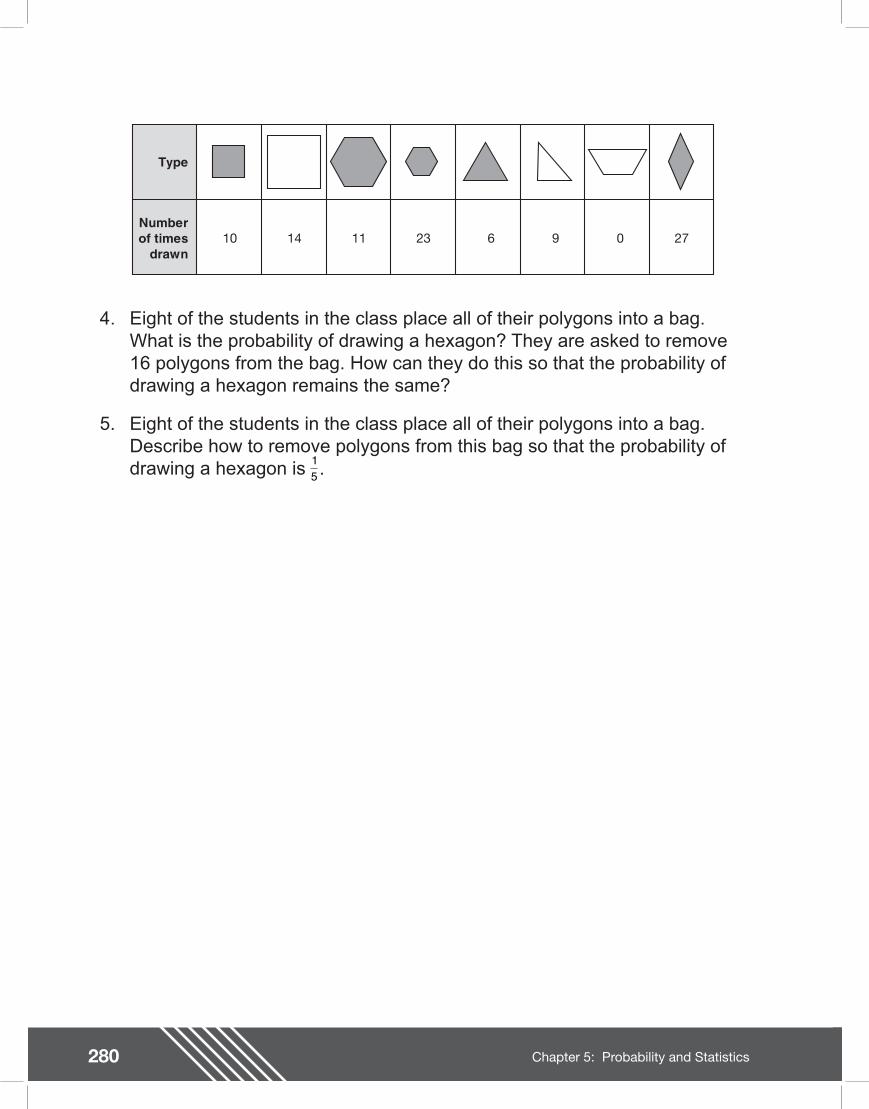
280 Chapter 5: Probability and Statistics
Type
Numberof times
drawn10 14 11 23 6 9 0 27
4. Eight of the students in the class place all of their polygons into a bag. What is the probability of drawing a hexagon? They are asked to remove 16 polygons from the bag. How can they do this so that the probability of drawing a hexagon remains the same?
5. Eight of the students in the class place all of their polygons into a bag. Describe how to remove polygons from this bag so that the probability of drawing a hexagon is .1
5

281Chapter 5: Probability and Statistics

282 Chapter 5: Probability and Statistics
Teacher Notes
Materials
Calculator
Connections to Middle School TEKS
(8.11) Probability and statistics. The student applies concepts of theoretical and experimental probability to make predictions.The student is expected to:
(A) nd the probabilities of compound events (dependent and independent)
(B) use theoretical probabilities and experimental results to make predictions and decisions
(8.3) Patterns, relationships, and algebraic thinking. The student identi es proportional relationships in problem situations and solves problems. The student is expected to:
(B) estimate and nd solutions to application problems involving percents and proportional relationships such as similarity and rates.
Scaffolding Questions
�• How do you determine the probability of an event?
�• How do you nd the probability of drawing a triangle from the bag?
�• Is the event described in problem 1 simple or compound? Explain how you know.
�• Is the event dependent or independent? Describe how you know.
�• Describe the effect of pulling a polygon from the bag 50 times.
�• What is the effect of putting four sets of polygons together in a bag?
�• Explain how to nd out how many polygons are in the bag.
�• Based on the results in the table in problem 3, how can you nd out many times the experiment was conducted?
�• Based on the results in the table in problem 3, how many times was a shaded square drawn from the bag? What does that mean about the possible number of shaded squares in the bag?
Sample Solutions
1. This is a problem about two independent events. The probabilities should be multiplied.
P(drawing a shaded polygon from Juan�’s bag) �• P(drawing a triangle from Monica�’s bag) =
58
28
1064
532
�• = =
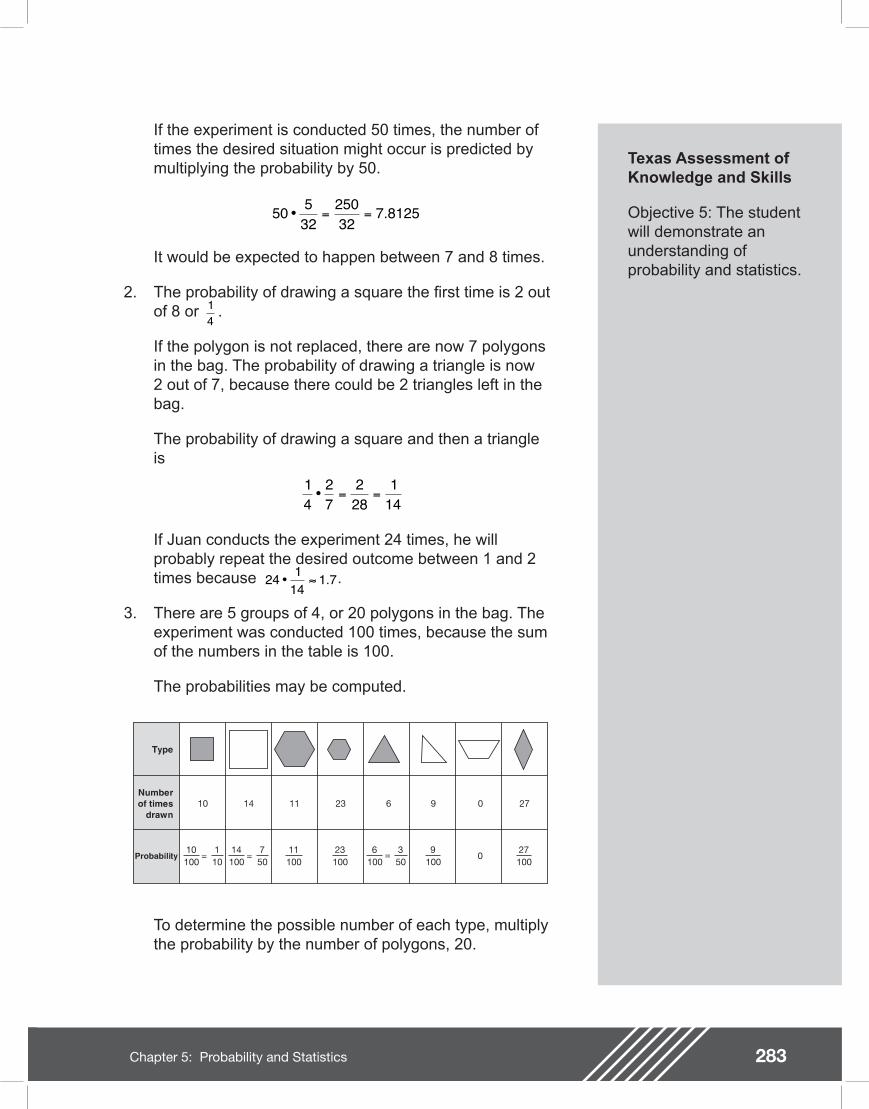
283Chapter 5: Probability and Statistics
Texas Assessment of Knowledge and Skills
Objective 5: The student will demonstrate an understanding of probability and statistics.
If the experiment is conducted 50 times, the number of times the desired situation might occur is predicted by multiplying the probability by 50.
It would be expected to happen between 7 and 8 times.
2. The probability of drawing a square the rst time is 2 out of 8 or .
If the polygon is not replaced, there are now 7 polygons in the bag. The probability of drawing a triangle is now 2 out of 7, because there could be 2 triangles left in the bag.
The probability of drawing a square and then a triangle is
If Juan conducts the experiment 24 times, he will probably repeat the desired outcome between 1 and 2 times because .
3. There are 5 groups of 4, or 20 polygons in the bag. The experiment was conducted 100 times, because the sum of the numbers in the table is 100.
The probabilities may be computed.
50 532
25032
7 8125�• = = .
14
14
27
228
114
�• = =
24 114
1 7�• .
Type
Numberof times
drawn10 14 11 23 6 9 0 27
Probability 010 100
14 100
11 100
23 100
6 100
9 100
27 100
1 10
750
350
= = =
To determine the possible number of each type, multiply the probability by the number of polygons, 20.
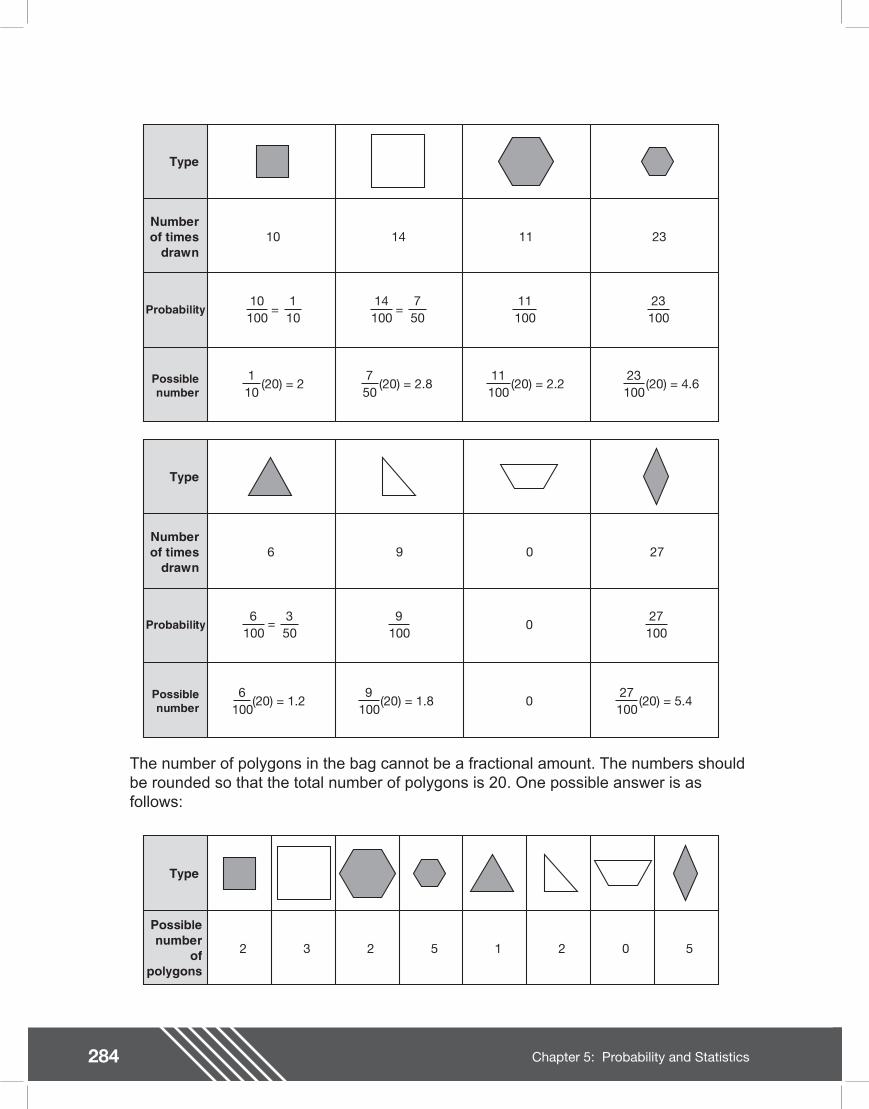
284 Chapter 5: Probability and Statistics
The number of polygons in the bag cannot be a fractional amount. The numbers should be rounded so that the total number of polygons is 20. One possible answer is as follows:
Type
Numberof times
drawn10 14 11 23
Probability10 100
14 100
11 100
23 100
1 10
750
= =
11 100
23 100
1 10
750
(20) = 2 (20) = 2.8 (20) = 2.2 (20) = 4.6Possiblenumber
Type
Numberof times
drawn6 9 0 27
Probability 09
10027 100
0
6 100
350
=
9 100
(20) = 1.86
100(20) = 1.2Possible
number27 100
(20) = 5.4
Type
Possiblenumber
ofpolygons
2 3 2 5 1 2 0 5
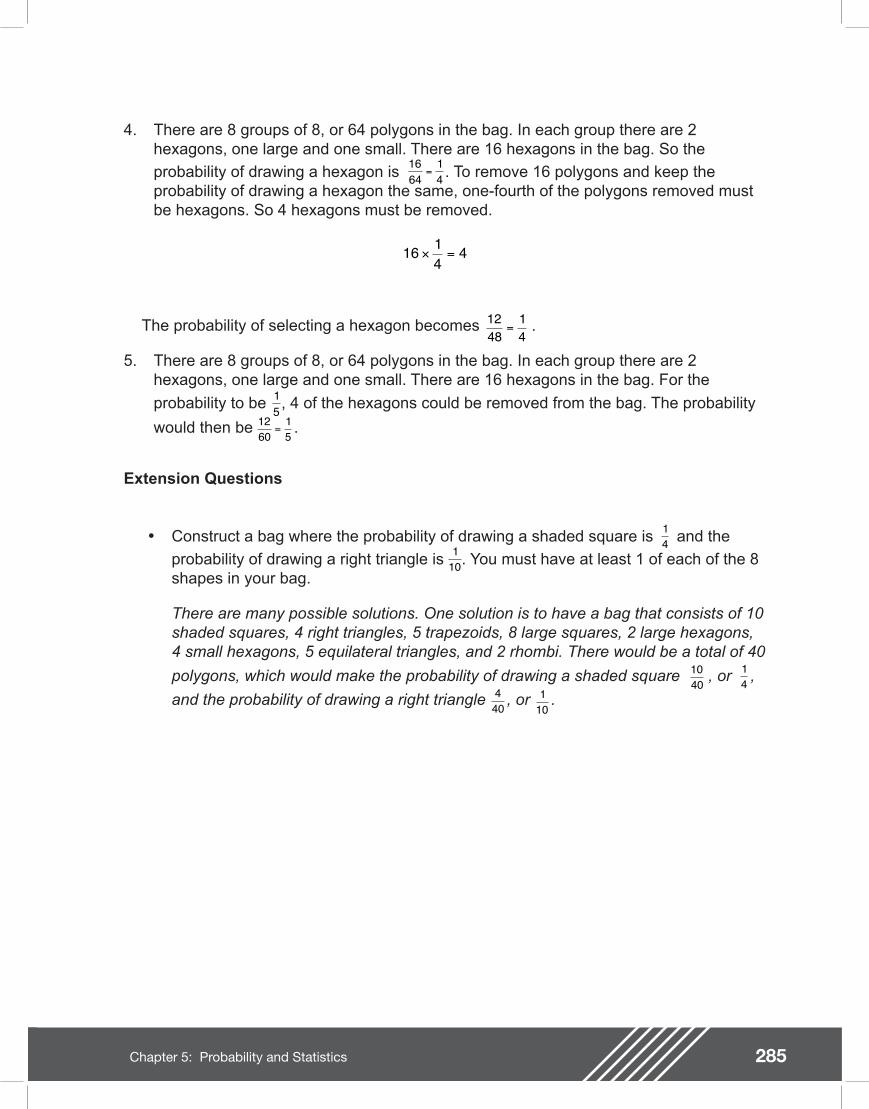
285Chapter 5: Probability and Statistics
4. There are 8 groups of 8, or 64 polygons in the bag. In each group there are 2 hexagons, one large and one small. There are 16 hexagons in the bag. So the
probability of drawing a hexagon is . To remove 16 polygons and keep the probability of drawing a hexagon the same, one-fourth of the polygons removed must be hexagons. So 4 hexagons must be removed.
The probability of selecting a hexagon becomes .
5. There are 8 groups of 8, or 64 polygons in the bag. In each group there are 2 hexagons, one large and one small. There are 16 hexagons in the bag. For the
probability to be , 4 of the hexagons could be removed from the bag. The probability
would then be .
Extension Questions
�• Construct a bag where the probability of drawing a shaded square is and the
probability of drawing a right triangle is . You must have at least 1 of each of the 8 shapes in your bag.
There are many possible solutions. One solution is to have a bag that consists of 10 shaded squares, 4 right triangles, 5 trapezoids, 8 large squares, 2 large hexagons, 4 small hexagons, 5 equilateral triangles, and 2 rhombi. There would be a total of 40
polygons, which would make the probability of drawing a shaded square , or ,
and the probability of drawing a right triangle , or .
1664
14
=
16 14
4× =
1248
14
=
15
1260
15
=
141
10
1040
14
110
440

286 Chapter 5: Probability and Statistics
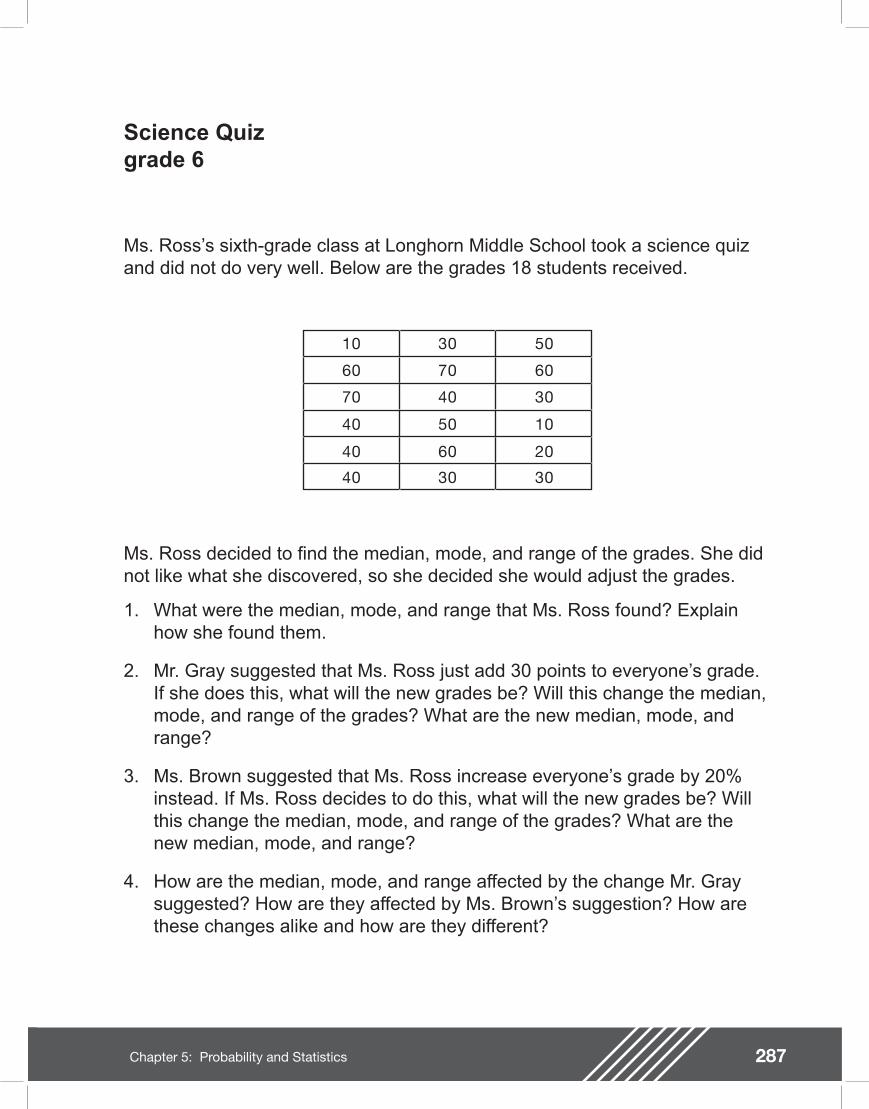
287Chapter 5: Probability and Statistics
Science Quizgrade 6
Ms. Ross�’s sixth-grade class at Longhorn Middle School took a science quiz and did not do very well. Below are the grades 18 students received.
10 30 50
60 70 60
70 40 30
40 50 10
40 60 20
40 30 30
Ms. Ross decided to nd the median, mode, and range of the grades. She did not like what she discovered, so she decided she would adjust the grades.
1. What were the median, mode, and range that Ms. Ross found? Explain how she found them.
2. Mr. Gray suggested that Ms. Ross just add 30 points to everyone�’s grade. If she does this, what will the new grades be? Will this change the median, mode, and range of the grades? What are the new median, mode, and range?
3. Ms. Brown suggested that Ms. Ross increase everyone�’s grade by 20% instead. If Ms. Ross decides to do this, what will the new grades be? Will this change the median, mode, and range of the grades? What are the new median, mode, and range?
4. How are the median, mode, and range affected by the change Mr. Gray suggested? How are they affected by Ms. Brown�’s suggestion? How are these changes alike and how are they different?
288 Chapter 5: Probability and Statistics
Teacher Notes
Connections to Middle School TEKS
(6.10) Probability and statistics. The student uses statistical representations to analyze data. The student is expected to:
(B) use median, mode, and range to describe data
(D) solve problems by collecting, organizing, displaying, and interpreting data
Scaffolding Questions
�• How do you nd the median of the data?
�• How do you nd the mode of the data?
�• How do you nd the range of the data?
�• If you made a 70, how would Mr. Gray�’s suggestion affect your grade?
�• If you made a 70, how would Ms. Brown�’s suggestion affect your grade?
�• What are the grades if 30 points are added to each?
�• What are the grades if 20% of the grade is added to each?
�• Do you get more points when 30 points are added or when 20% of the grade is added?
Sample Solutions
1. Ms. Ross needs to order the grades from least to greatest and determine the grade for which half the grades received are below that grade and half the grades are above that grade.
Here are the grades in order from least to greatest:
10,10,20,30,30,30,30,40,40,40,40,50,50,60,60,60,70,70
Since there are 18 grades, two of these grades, 40 and 40, t the requirement. Average those two grades and the median grade will be 40:
40 + 40 = 80
80 ÷ 2 = 40
The mode of the grades is the grade that most students received. In this data there are 2 modes, since the grades, 30 and 40 appear 4 times each on the list.
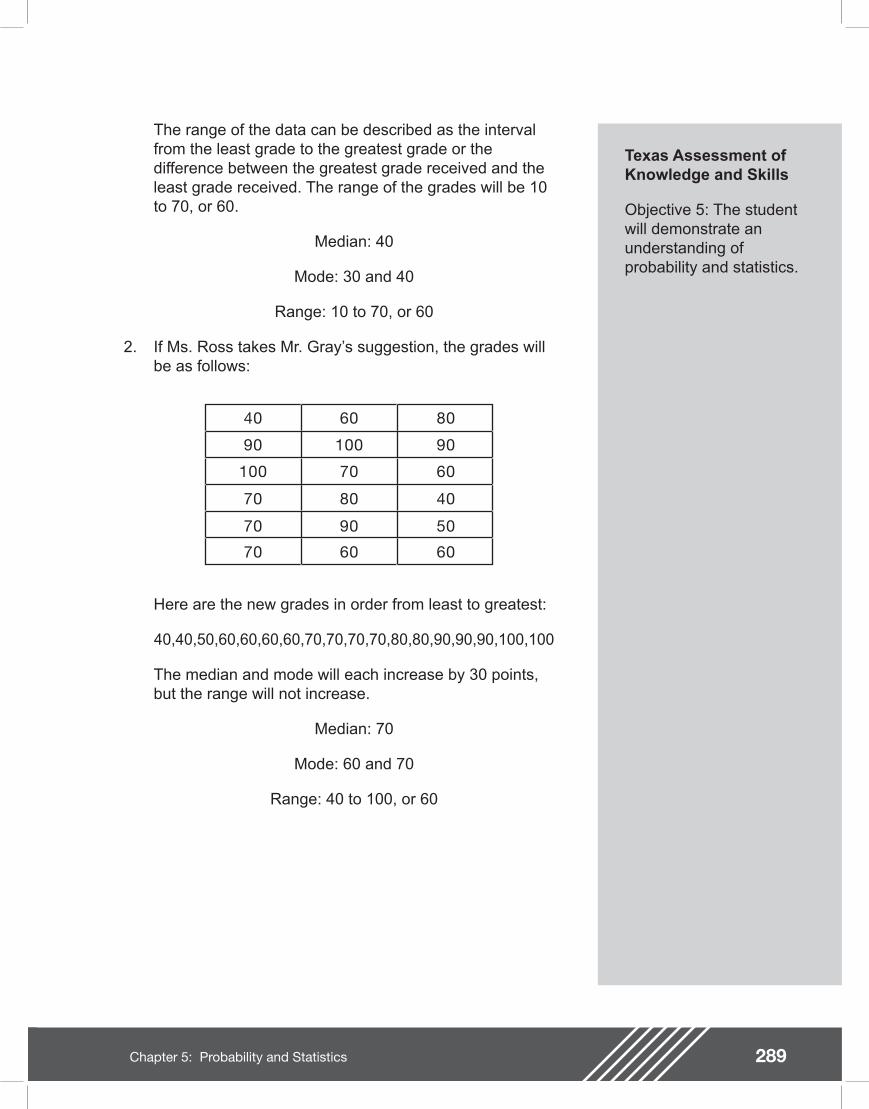
289Chapter 5: Probability and Statistics
Texas Assessment of Knowledge and Skills
Objective 5: The student will demonstrate an understanding of probability and statistics.
The range of the data can be described as the interval from the least grade to the greatest grade or the difference between the greatest grade received and the least grade received. The range of the grades will be 10 to 70, or 60.
Median: 40
Mode: 30 and 40
Range: 10 to 70, or 60
2. If Ms. Ross takes Mr. Gray�’s suggestion, the grades will be as follows:
40 60 80
90 100 90
100 70 60
70 80 40
70 90 50
70 60 60
Here are the new grades in order from least to greatest:
40,40,50,60,60,60,60,70,70,70,70,80,80,90,90,90,100,100
The median and mode will each increase by 30 points, but the range will not increase.
Median: 70
Mode: 60 and 70
Range: 40 to 100, or 60
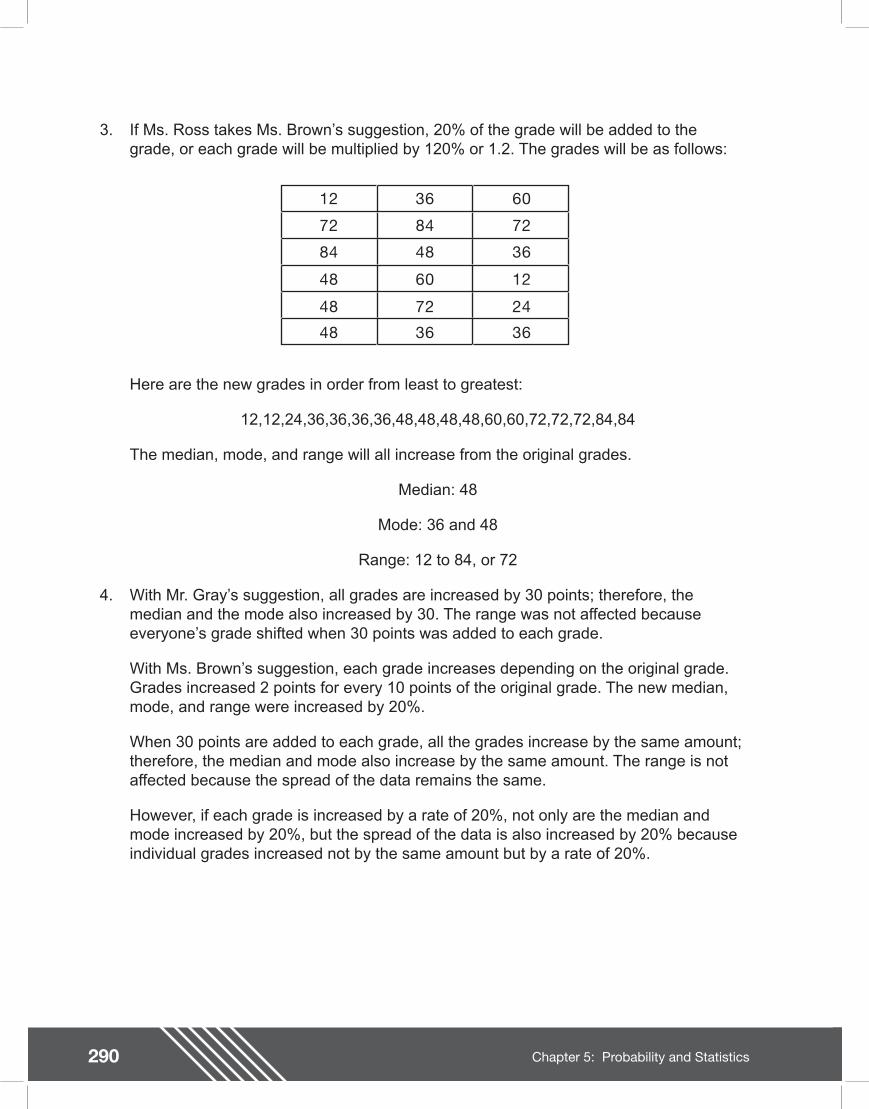
290 Chapter 5: Probability and Statistics
3. If Ms. Ross takes Ms. Brown�’s suggestion, 20% of the grade will be added to the grade, or each grade will be multiplied by 120% or 1.2. The grades will be as follows:
12 36 60
72 84 72
84 48 36
48 60 12
48 72 24
48 36 36
Here are the new grades in order from least to greatest:
12,12,24,36,36,36,36,48,48,48,48,60,60,72,72,72,84,84
The median, mode, and range will all increase from the original grades.
Median: 48
Mode: 36 and 48
Range: 12 to 84, or 72
4. With Mr. Gray�’s suggestion, all grades are increased by 30 points; therefore, the median and the mode also increased by 30. The range was not affected because everyone�’s grade shifted when 30 points was added to each grade.
With Ms. Brown�’s suggestion, each grade increases depending on the original grade. Grades increased 2 points for every 10 points of the original grade. The new median, mode, and range were increased by 20%.
When 30 points are added to each grade, all the grades increase by the same amount; therefore, the median and mode also increase by the same amount. The range is not affected because the spread of the data remains the same.
However, if each grade is increased by a rate of 20%, not only are the median and mode increased by 20%, but the spread of the data is also increased by 20% because individual grades increased not by the same amount but by a rate of 20%.
291Chapter 5: Probability and Statistics
Extension Questions
�• Ms. Ross likes Ms. Brown�’s suggestion, but she wants at least of her students to pass. Help Ms. Ross achieve her goal.
If Ms. Ross wants to use a suggestion like Ms. Brown�’s, the grades must all increase by the same percentage. The grades will have to increase so that of the students pass. If you look at the median grade of 40, that grade will have to increase by 30 points to a 70. Fifty percent of 40 is 20, which is not enough points. Ms. Ross would need another 10 points to get the original grade to 70. If 50% adds 20 points to the grade, another 25% would add 10 points; therefore, Ms. Ross needs to increase the percentage to 75%.
75% of 40 is 30 and 30 + 40 = 70
12
12

292 Chapter 5: Probability and Statistics
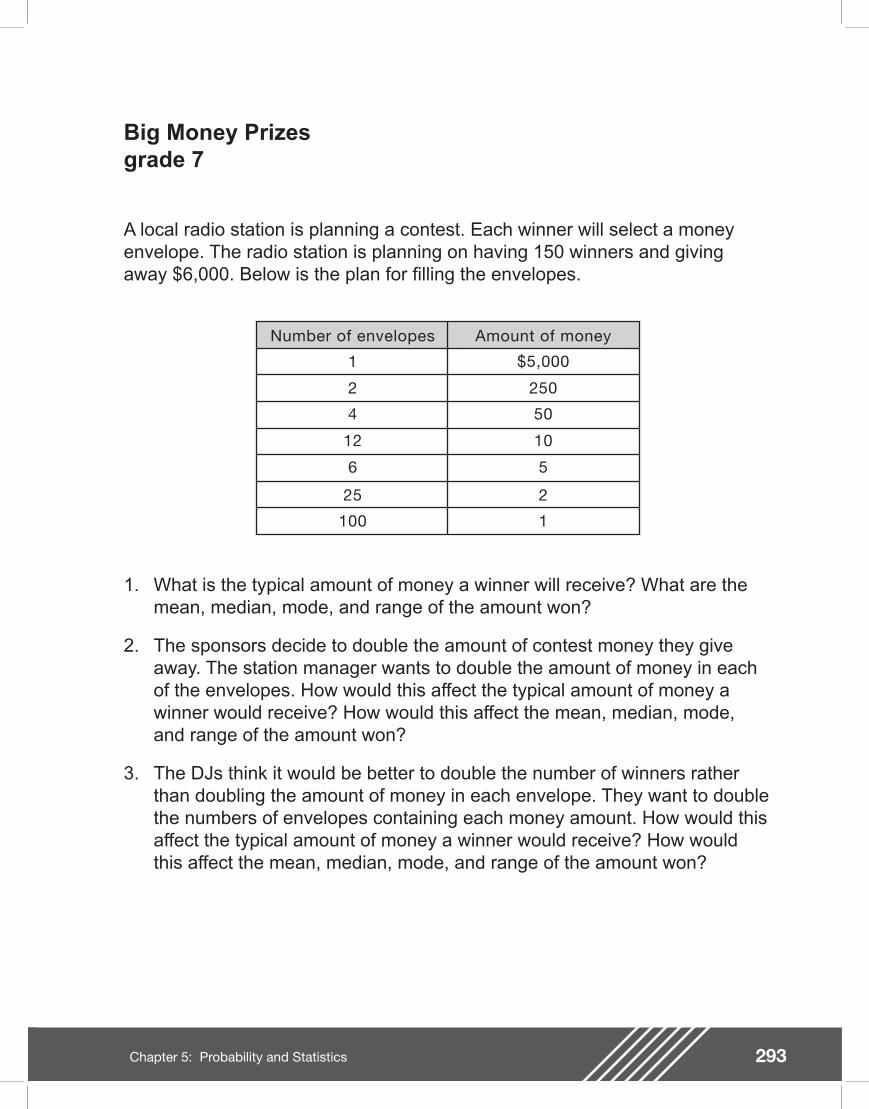
293Chapter 5: Probability and Statistics
Big Money Prizesgrade 7
A local radio station is planning a contest. Each winner will select a money envelope. The radio station is planning on having 150 winners and giving away $6,000. Below is the plan for lling the envelopes.
Number of envelopes Amount of money
1 $5,000
2 250
4 50
12 10
6 5
25 2
100 1
1. What is the typical amount of money a winner will receive? What are the mean, median, mode, and range of the amount won?
2. The sponsors decide to double the amount of contest money they give away. The station manager wants to double the amount of money in each of the envelopes. How would this affect the typical amount of money a winner would receive? How would this affect the mean, median, mode, and range of the amount won?
3. The DJs think it would be better to double the number of winners rather than doubling the amount of money in each envelope. They want to double the numbers of envelopes containing each money amount. How would this affect the typical amount of money a winner would receive? How would this affect the mean, median, mode, and range of the amount won?

294 Chapter 5: Probability and Statistics
Teacher Notes
Materials
Calculator (optional)
Connections to Middle School TEKS
(7.3) Patterns, relationships, and algebraic thinking. The student solves problems involving proportional relationships. The student is expected to:
(B) estimate and nd solutions to application problems involving proportional relationships such as similarity, scaling, unit costs, and related measurement units.
(7.12) Probability and statistics. The student uses measures of central tendency and range to describe a set of data. The student is expected to:
(A) describe a set of data using mean, median, mode, and range
(B) choose among mean, median, mode, or range to describe a set of data and justify the choice for a particular situation
Scaffolding Questions
�• What does the mean of the data tell you? What do the median, mode, and range tell you?
�• How many envelopes contain $50?
�• How much money will be given away in $50 envelopes?
�• How many envelopes contain $2?
�• How much money will be given away in $2 envelopes?
�• How can you nd the mean of the data?
�• How can you nd the median of the data?
�• How can you nd the mode of the data?
�• How can you nd the range of the data?
Sample Solutions
1. The typical amount of money can be described by using the mean, median, or mode. The mean is the total amount of money given away divided by the number of winners.
The number of winners is the sum of the number of envelopes, or 150 winners.
To verify that $6,000 is given away, consider the amount times the number of people who received that amount.
1($5,000) + 2($250) + 4($50) + 12($10) + 6($5) +25($2) + 100($1) = $6,000
Since $6,000 will be the amount given to 150 winners, the mean amount of money will be $6,000 ÷ 150 winners = $40 per winner. The median amount of money will be the amount for which half the winners receive at least that amount and half the winners receive at most that amount. One-half of 150 is 75. Since 100 people receive
295Chapter 5: Probability and Statistics
Texas Assessment of Knowledge and Skills
Objective 5: The student will demonstrate an understanding of probability and statistics.
the least amount of money, $1, the median amount will be $1. The mode amount of money will be the amount of money that most winners will receive. There are 100 people receiving $1. The mode amount of the money will be $1. The range of the data can be described as the interval from the least amount won to the greatest amount or the difference between the greatest amount won and the least amount won. The range of the winnings will be $1 to $5,000, or $4,999.
2. If the amount of money in each of the envelopes is doubled, the typical amount of money will double. The mean is $12,000 divided by 150, or $80. The mean and the median would be the minimum amount, or $2. The mean, median, and mode will double. The mean will be $80, the median will be $2, and the mode will be $2. The range of the new amounts will be $2 to $10,000, or $9,998.
3. If the number of winners is doubled by doubling the number of envelopes containing each amount of money, the typical amount of money a winner will receive stays the same as in the original plan. Consider the amount times the number of people who received that amount.
2($5,000) + 4($250) + 8($50) + 24($10) + 12($5) +50($2) + 200($1) = $12,000
The mean will be $12,000 ÷ 300 winners or $40 per winner. The median amount will be $1. The mode amount of the money will be $1. The range of the winnings will be $1 to $5,000, or $4,999.
Extension Questions
�• Is there another way of giving away the extra $6,000 so that the mean doubles but the mode and median stay the same?
A possible scenario would be to give the top winner $11,000 while the rest of the winnings remain the same.
�• If the radio station decides to triple the amount in each of the envelopes, how would this affect the
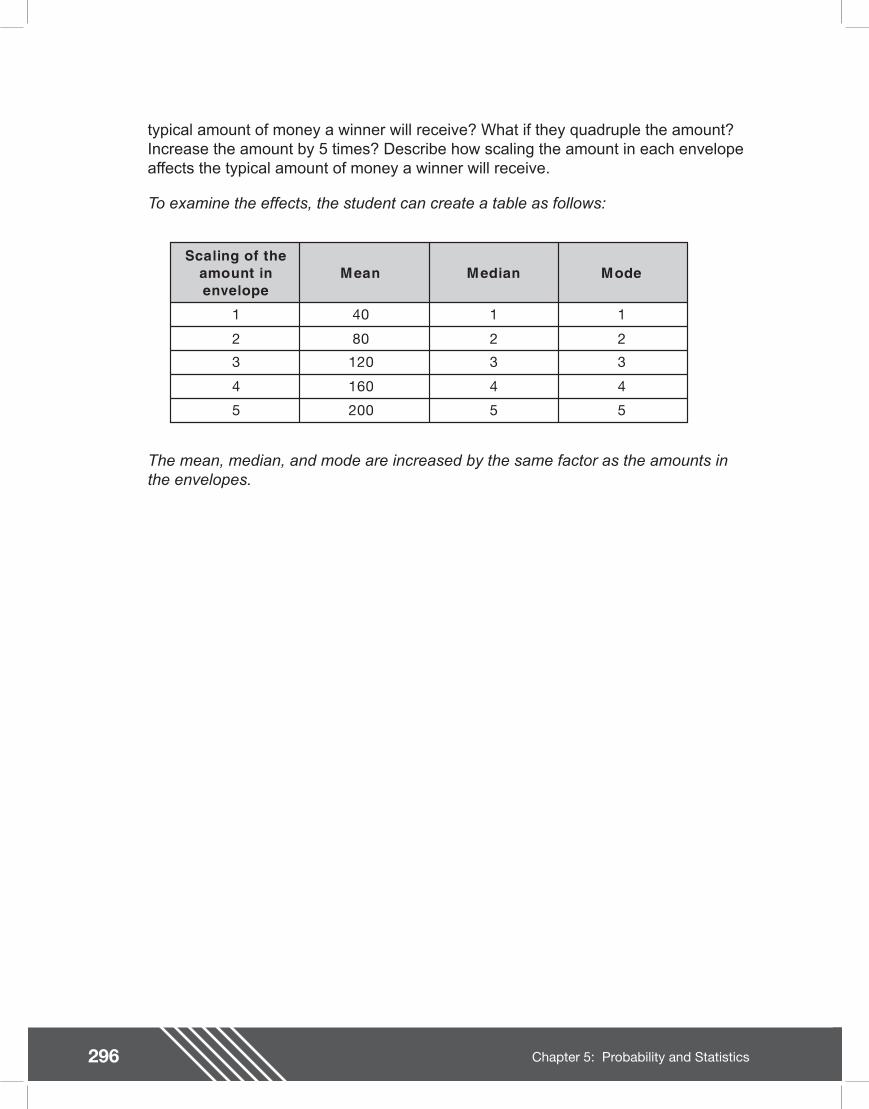
296 Chapter 5: Probability and Statistics
typical amount of money a winner will receive? What if they quadruple the amount? Increase the amount by 5 times? Describe how scaling the amount in each envelope affects the typical amount of money a winner will receive.
To examine the effects, the student can create a table as follows:
Scaling of theamount inenvelope
Mean Median Mode
1 40 1 1
2 80 2 2
3 120 3 3
4 160 4 4
5 200 5 5
The mean, median, and mode are increased by the same factor as the amounts in the envelopes.
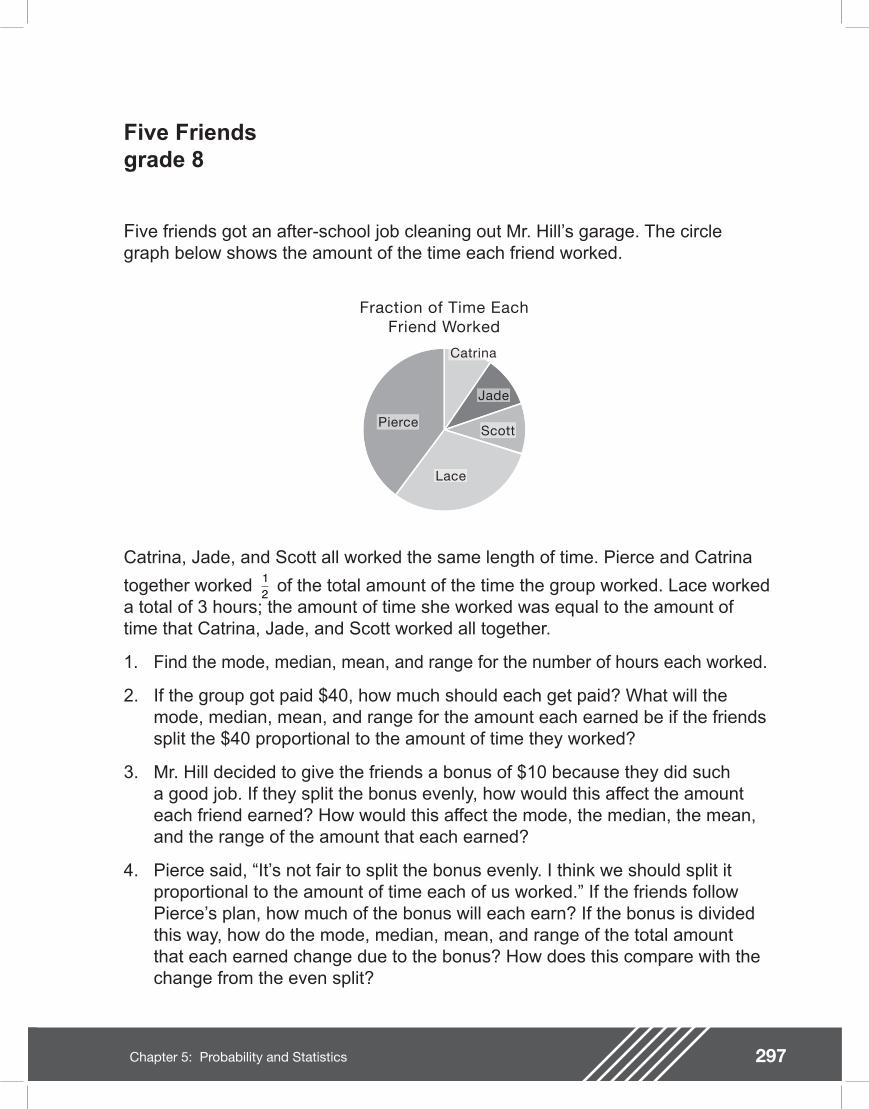
297Chapter 5: Probability and Statistics
Five Friendsgrade 8
Five friends got an after-school job cleaning out Mr. Hill�’s garage. The circle graph below shows the amount of the time each friend worked.
Catrina
Jade
Scott
Lace
Pierce
Fraction of Time EachFriend Worked
Catrina, Jade, and Scott all worked the same length of time. Pierce and Catrina
together worked of the total amount of the time the group worked. Lace worked a total of 3 hours; the amount of time she worked was equal to the amount of time that Catrina, Jade, and Scott worked all together.
1. Find the mode, median, mean, and range for the number of hours each worked.
2. If the group got paid $40, how much should each get paid? What will the mode, median, mean, and range for the amount each earned be if the friends split the $40 proportional to the amount of time they worked?
3. Mr. Hill decided to give the friends a bonus of $10 because they did such a good job. If they split the bonus evenly, how would this affect the amount each friend earned? How would this affect the mode, the median, the mean, and the range of the amount that each earned?
4. Pierce said, �“It�’s not fair to split the bonus evenly. I think we should split it proportional to the amount of time each of us worked.�” If the friends follow Pierce�’s plan, how much of the bonus will each earn? If the bonus is divided this way, how do the mode, median, mean, and range of the total amount that each earned change due to the bonus? How does this compare with the change from the even split?
12
298 Chapter 5: Probability and Statistics
Teacher Notes
Materials
Scissors
Connections to Middle School TEKS
(8.12) Probability and statistics. The student uses statistical procedures to describe data. The student is expected to:
(A) select the appropriate measure of central tendency to describe a set of data for a particular purpose
(B) draw conclusions and make predictions by analyzing trends in scatterplots
Scaffolding Questions
�• How can you nd the mode of a set of data?
�• How can you nd the median of a set of data?
�• How can you nd the mean of a set of data?
�• How can you nd the range of a set of data?
�• What does the circle graph represent?
�• What do you get when you add up the different fractional parts of the circle graph?
�• How do you nd what each part of the circle graph represents?
�• Who has worked the greatest amount of time?
�• Who has worked the least amount of time?
�• Do you see any relationships among the amount of time each friend worked?
�• How do you divide the money evenly?
�• How do you divide the money based on the amount of hours worked by each friend?
Sample Solutions
1. Using the circle graph and the information given, students can establish the amount of time each person worked. First, Catrina, Jade, and Scott all worked an equal amount of time. To verify this using the circle graph, students can cut out the portion of time Catrina worked and overlay this portion of the circle graph on Jade�’s and Scott�’s portion of the graph. The three friends had the same portion of the circle graph. If Lace worked 3 hours and this was equivalent to the amount of time Catrina, Jade and Scott worked, then Catrina, Jade, and Scott must have each worked one hour.
299Chapter 5: Probability and Statistics
Texas Assessment of Knowledge and Skills
Objective 5: The student will demonstrate an understanding of probability and statistics.
By looking at the circle graph, students can gure out that of the time worked by the group equals 5 hours because Jade�’s 1 hour + Scott�’s 1 hour + Lace�’s 3 hours = 5 hours. If the time was equal to 5 hours, then Pierce must have worked 4 hours, because Catrina�’s
1 hour + Pierce�’s time must equal 5 hours, the time. Therefore, Catrina worked 1 hour, Jade worked 1 hour, Scott worked 1 hour, Lace worked 3 hours, and Pierce worked 4 hours.
Based on the amount of time found above, the mode, median, mean, and range could now be found. Since 3 of the 5 friends worked 1 hour each, this amount of time was most often worked; therefore, the mode is 1 hour.
The median of the data may be found by ordering the data from the least amount of time worked to the greatest amount of time worked then nding the data point for which half of the values of the data fall below it and half the values of the data are above it. When this is done, the median is found.
1, 1, 1, 3, 4
The median of the data is 1 hour.
The mean of the data can be found by adding the amounts of time each worked and dividing the sum by 5, because there were 5 amounts.
1 + 1 + 1 + 3 + 4 = 10
10 ÷ 5 = 2
The mean of the data is 2 hours.
Finding the least amount of time worked and the greatest amount of time worked will give the spread of the data or the range. The range can also be the difference of these amounts. The least amount of time worked was 1 hour and the greatest amount of time worked was 4 hours, so the range of the data is 1 hour to 4 hours, or 3 hours.
2. If the friends decided to divide the money evenly, then each would get $40 ÷ 5, or $8. If this were done the
12
12
12
300 Chapter 5: Probability and Statistics
mode would be $8. The median would be $8, the mean would be $8, and there would be no difference in the range of amounts of money each received, so the range would be from $8 to $8, or 0. However, if the friends decided to divide the money based on the amount of time each worked, this would change the mode, median, mean, and range. This may be done by nding an amount of money each should get per hour worked, $40 ÷ 10 hours = $4 per hour. Since Catrina, Jade, and Scott worked 1 hour each would get $4. Lace worked 3 hours so she would get $12, and Pierce, who worked 4 hours, would get $16.
The amounts of money received are $4, $4, $4, $12, and $16.
With this data the mode would be $4, the median would be $4, the mean would be $8, and the range would be from $4 to $16, or $12. The mean would stay the same because even though each friend earned a different amount of money, they still received a total of $40 for the ve to split up.
3. If they split the bonus evenly, each friend would get $2 more. If they divided the original amount by 5, then each person would receive $8 + $2, or $10. If they were paid proportional to the amount of time they worked, each person would get $2 more, which means Catrina, Jade, and Scott would get $6, Lace would get $14, and Pierce would get $18.
The amounts of money received are $6, $6, $6, $14, and $18.
In this case, the mode would be $6, the median would be $6, the mean would be $10, and the range would be from $6 to $18, or $12. If each friend got $2 more, the mode, median, and mean would each increase by $2; however, the range would stay the same since the least amount of money earned would be $6 and the greatest amount would be $18. The range of the data shifted, but the spread or difference of the range remained $12.
4. If the friends decided to divide the bonus based on the amount of time each worked, they could nd the hourly rate for the bonus and give each friend that amount based on the amount of time worked. The hourly bonus rate would be $10 ÷ 10 hours worked equals $1 per hour; therefore, Catrina, Jade, and Scott would each get $1 added to their $4 earned, for a total of $5 each. Lace would get $3 added because she worked 3 hours originally, which would make her total earnings $15, and Pierce would get $4 of the bonus since he originally worked 4 hours, which would make his total earnings $20.
The amounts of money received are $5, $5, $5, $15, and $20.
The mode would now be $5, the median would be $5, the mean would be the same as when the bonus is divided evenly, or $10, and the range would be from $5 to $20, or $15.
Notice that when the bonus was distributed proportionally, each friend�’s earnings were
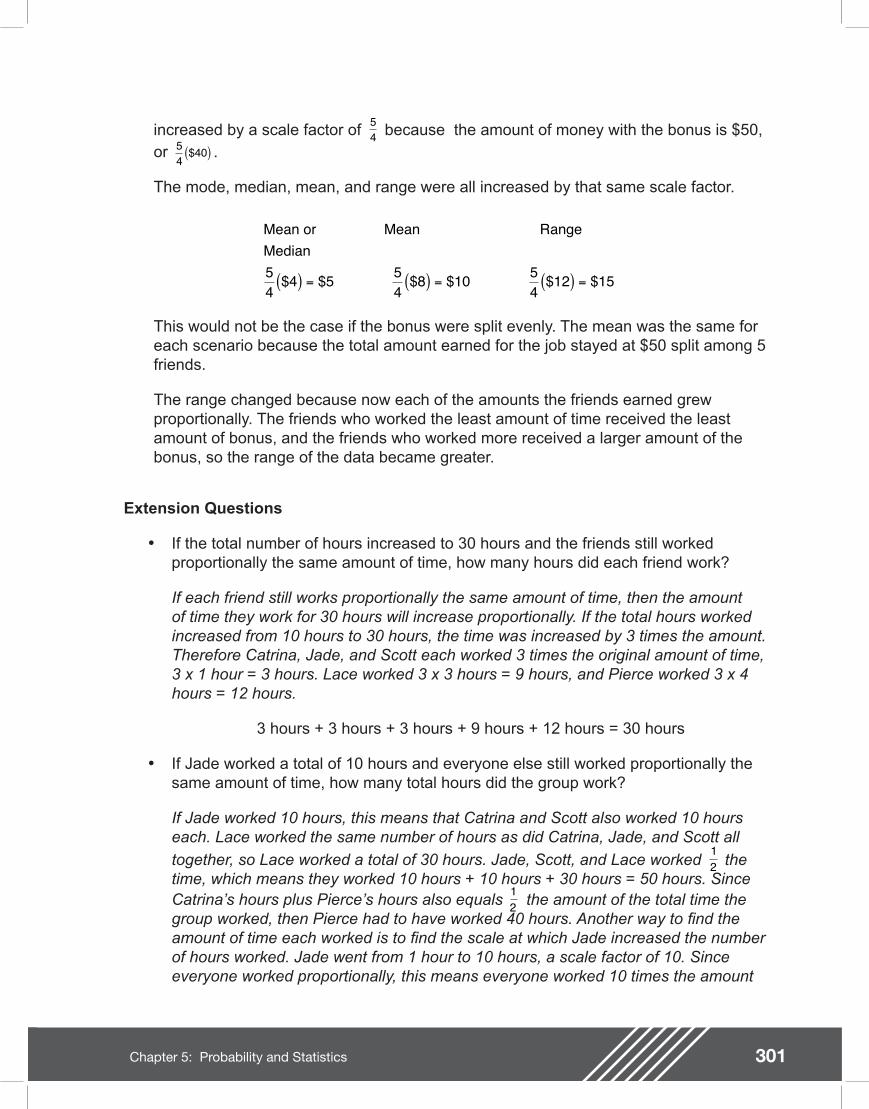
301Chapter 5: Probability and Statistics
increased by a scale factor of because the amount of money with the bonus is $50, or .
The mode, median, mean, and range were all increased by that same scale factor.
This would not be the case if the bonus were split evenly. The mean was the same for each scenario because the total amount earned for the job stayed at $50 split among 5 friends.
The range changed because now each of the amounts the friends earned grew proportionally. The friends who worked the least amount of time received the least amount of bonus, and the friends who worked more received a larger amount of the bonus, so the range of the data became greater.
Extension Questions
�• If the total number of hours increased to 30 hours and the friends still worked proportionally the same amount of time, how many hours did each friend work?
If each friend still works proportionally the same amount of time, then the amount of time they work for 30 hours will increase proportionally. If the total hours worked increased from 10 hours to 30 hours, the time was increased by 3 times the amount. Therefore Catrina, Jade, and Scott each worked 3 times the original amount of time, 3 x 1 hour = 3 hours. Lace worked 3 x 3 hours = 9 hours, and Pierce worked 3 x 4 hours = 12 hours.
3 hours + 3 hours + 3 hours + 9 hours + 12 hours = 30 hours
�• If Jade worked a total of 10 hours and everyone else still worked proportionally the same amount of time, how many total hours did the group work?
If Jade worked 10 hours, this means that Catrina and Scott also worked 10 hours each. Lace worked the same number of hours as did Catrina, Jade, and Scott all
together, so Lace worked a total of 30 hours. Jade, Scott, and Lace worked the time, which means they worked 10 hours + 10 hours + 30 hours = 50 hours. Since Catrina�’s hours plus Pierce�’s hours also equals the amount of the total time the group worked, then Pierce had to have worked 40 hours. Another way to nd the amount of time each worked is to nd the scale at which Jade increased the number of hours worked. Jade went from 1 hour to 10 hours, a scale factor of 10. Since everyone worked proportionally, this means everyone worked 10 times the amount
54
54
40$( )
Mean or Mean RangeMedian
54
4 5 54
8 10 54
12 15$ $ $ $ $ $( ) = ( ) = ( ) =
12
12

302 Chapter 5: Probability and Statistics
of time they had originally worked. Catrina, Jade, and Scott worked 1 hour x 10 = 10 hours. Lace worked 3 hours x 10 = 30 hours, and Pierce worked 4 hours x 10 = 40 hours.
�• If each data point in a data set is doubled, will the mode, median, mean, and range of the resulting data set all be two times the values for the original data set? How would doubling each point affect the shape of a line plot of the data?
Yes, scaling each data point results in all of the measures of center and range scaled by the same factor. The line plot will have a similar shape but will be dilated (rescaled).

303Chapter 5: Probability and Statistics

304 Chapter 5: Probability and Statistics
Middle SchooIAssessments
Chapter 6:Underlying Processesand Mathematical Tools

306 Chapter 6: Underlying Processes and Mathematical Tools
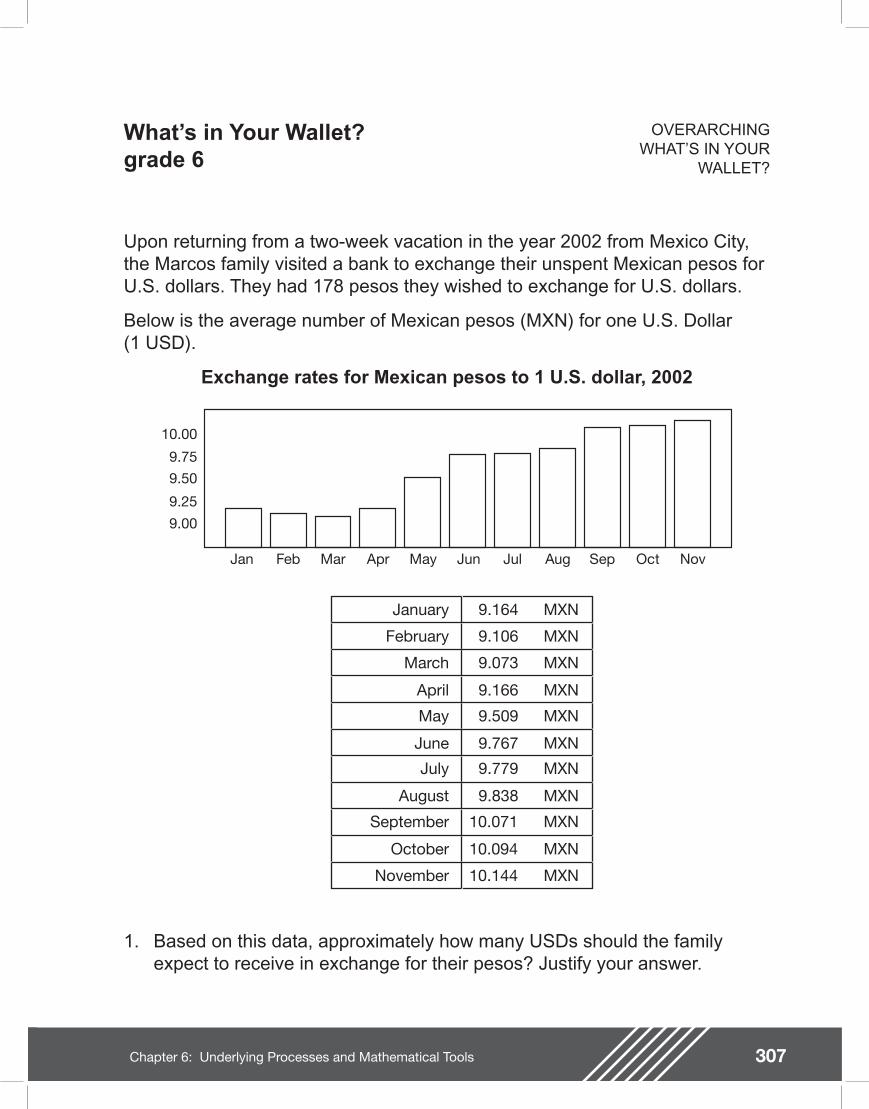
307Chapter 6: Underlying Processes and Mathematical Tools
What�’s in Your Wallet?grade 6
Upon returning from a two-week vacation in the year 2002 from Mexico City, the Marcos family visited a bank to exchange their unspent Mexican pesos for U.S. dollars. They had 178 pesos they wished to exchange for U.S. dollars.
Below is the average number of Mexican pesos (MXN) for one U.S. Dollar(1 USD).
Exchange rates for Mexican pesos to 1 U.S. dollar, 2002
OVERARCHINGWHAT�’S IN YOUR
WALLET?
Jan Feb Mar Apr May Jun Jul Aug Sep Oct Nov
9.00
9.25
9.50
9.75
10.00
1. Based on this data, approximately how many USDs should the family expect to receive in exchange for their pesos? Justify your answer.
January 9.164
February 9.106
March 9.073
April 9.166
May 9.509
June 9.767
July 9.779
August 9.838
September 10.071
October 10.094
November 10.144
MXN
MXN
MXN
MXN
MXN
MXN
MXN
MXN
MXN
MXN
MXN

308 Chapter 6: Underlying Processes and Mathematical Tools
2. Explain how you could determine which month would have resulted in fewer USDs in exchange for the pesos. Use language and graphical, numerical, physical, and/or algebraic models to communicate your reasoning.

309Chapter 6: Underlying Processes and Mathematical Tools
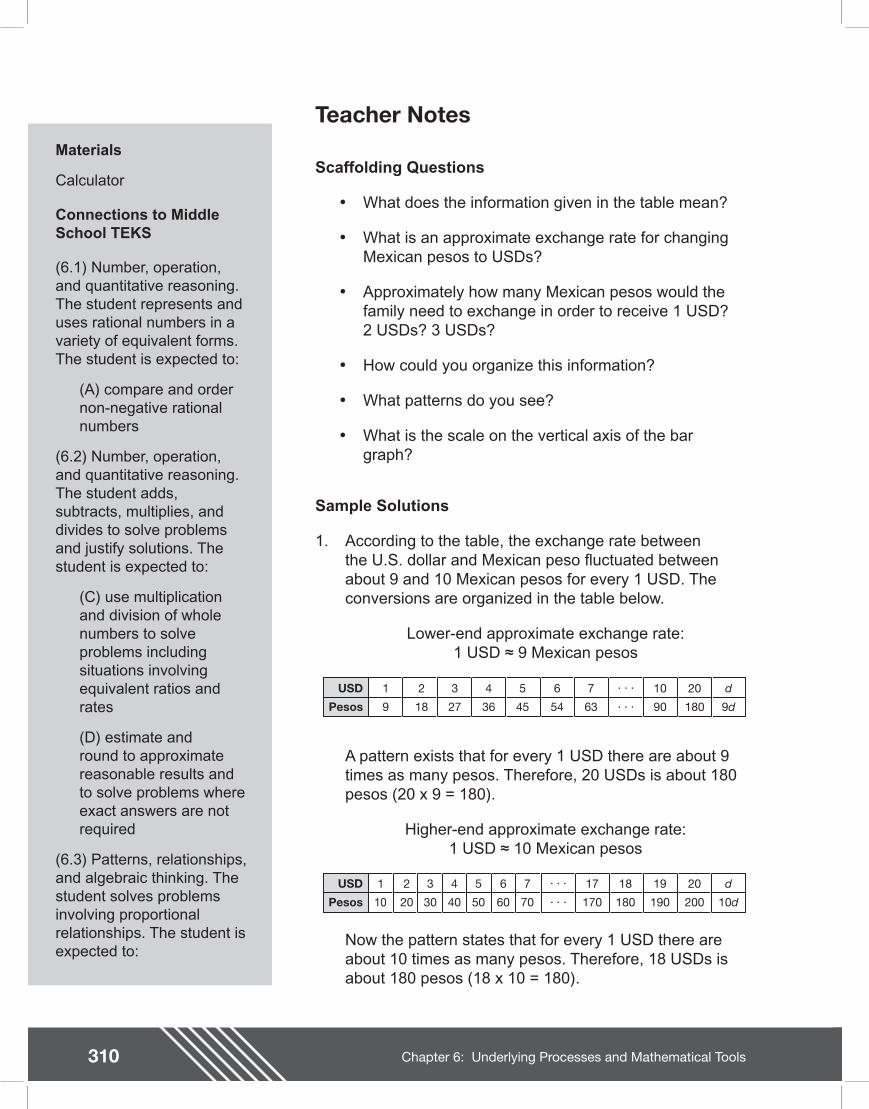
310 Chapter 6: Underlying Processes and Mathematical Tools
Teacher NotesMaterials
Calculator
Connections to Middle School TEKS
(6.1) Number, operation, and quantitative reasoning. The student represents and uses rational numbers in a variety of equivalent forms. The student is expected to:
(A) compare and order non-negative rational numbers
(6.2) Number, operation, and quantitative reasoning. The student adds, subtracts, multiplies, and divides to solve problems and justify solutions. The student is expected to:
(C) use multiplication and division of whole numbers to solve problems including situations involving equivalent ratios and rates
(D) estimate and round to approximate reasonable results and to solve problems where exact answers are not required
(6.3) Patterns, relationships, and algebraic thinking. The student solves problems involving proportional relationships. The student is expected to:
Scaffolding Questions
�• What does the information given in the table mean?
�• What is an approximate exchange rate for changing Mexican pesos to USDs?
�• Approximately how many Mexican pesos would the family need to exchange in order to receive 1 USD? 2 USDs? 3 USDs?
�• How could you organize this information?
�• What patterns do you see?
�• What is the scale on the vertical axis of the bar graph?
Sample Solutions
1. According to the table, the exchange rate between the U.S. dollar and Mexican peso uctuated between about 9 and 10 Mexican pesos for every 1 USD. The conversions are organized in the table below.
Lower-end approximate exchange rate: 1 USD 9 Mexican pesos
A pattern exists that for every 1 USD there are about 9 times as many pesos. Therefore, 20 USDs is about 180 pesos (20 x 9 = 180).
Higher-end approximate exchange rate: 1 USD 10 Mexican pesos
Now the pattern states that for every 1 USD there are about 10 times as many pesos. Therefore, 18 USDs is about 180 pesos (18 x 10 = 180).
. . .
. . .USD
Pesos
1
10
2
20
3
30
4
40
5
50
6
60
7
70
19
190
18
180
17
170
20
200
d
10d
. . .
. . .USD
Pesos
1
9
2
18
3
27
4
36
5
45
6
54
7
63
10
90
20
180
d
9d
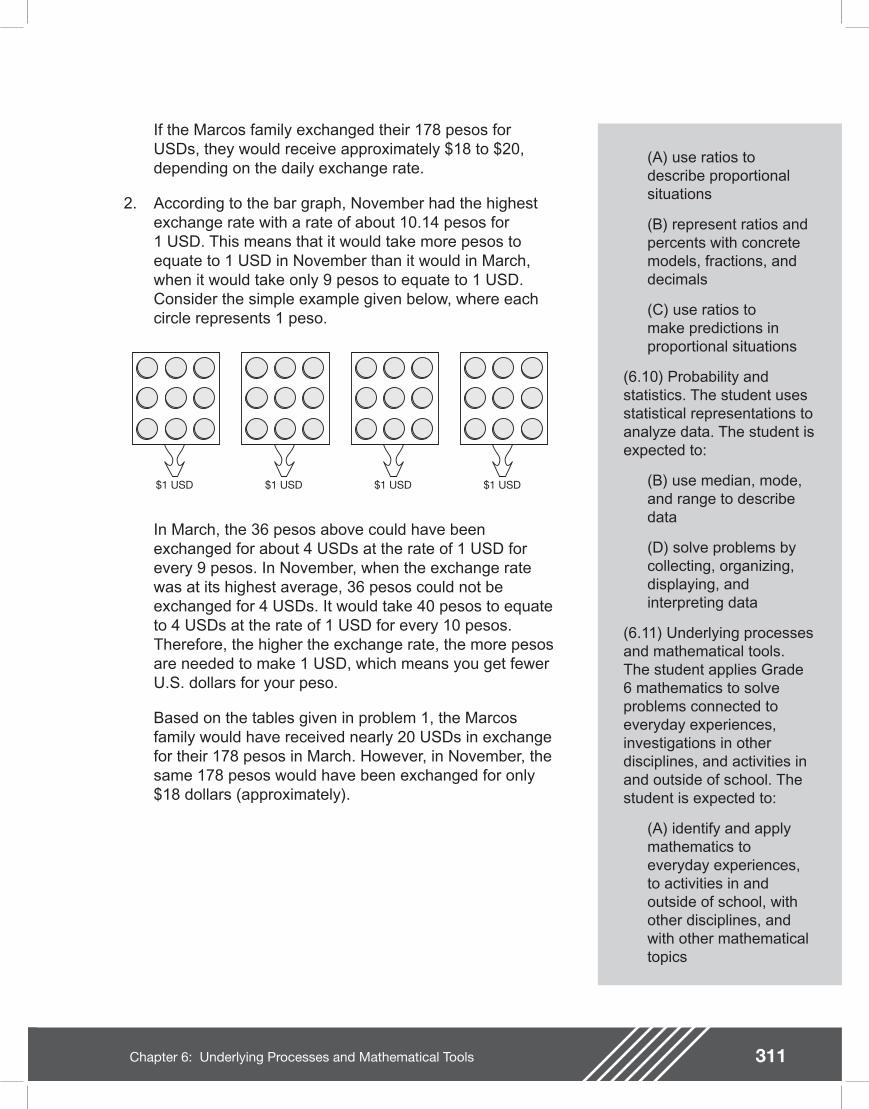
311Chapter 6: Underlying Processes and Mathematical Tools
(A) use ratios to describe proportional situations
(B) represent ratios and percents with concrete models, fractions, and decimals
(C) use ratios to make predictions in proportional situations
(6.10) Probability and statistics. The student uses statistical representations to analyze data. The student is expected to:
(B) use median, mode, and range to describe data
(D) solve problems by collecting, organizing, displaying, and interpreting data
(6.11) Underlying processes and mathematical tools. The student applies Grade 6 mathematics to solve problems connected to everyday experiences, investigations in other disciplines, and activities in and outside of school. The student is expected to:
(A) identify and apply mathematics to everyday experiences, to activities in and outside of school, with other disciplines, and with other mathematical topics
If the Marcos family exchanged their 178 pesos for USDs, they would receive approximately $18 to $20, depending on the daily exchange rate.
2. According to the bar graph, November had the highest exchange rate with a rate of about 10.14 pesos for 1 USD. This means that it would take more pesos to equate to 1 USD in November than it would in March, when it would take only 9 pesos to equate to 1 USD. Consider the simple example given below, where each circle represents 1 peso.
$1 USD $1 USD $1 USD $1 USD
In March, the 36 pesos above could have been exchanged for about 4 USDs at the rate of 1 USD for every 9 pesos. In November, when the exchange rate was at its highest average, 36 pesos could not be exchanged for 4 USDs. It would take 40 pesos to equate to 4 USDs at the rate of 1 USD for every 10 pesos. Therefore, the higher the exchange rate, the more pesos are needed to make 1 USD, which means you get fewer U.S. dollars for your peso.
Based on the tables given in problem 1, the Marcos family would have received nearly 20 USDs in exchange for their 178 pesos in March. However, in November, the same 178 pesos would have been exchanged for only $18 dollars (approximately).
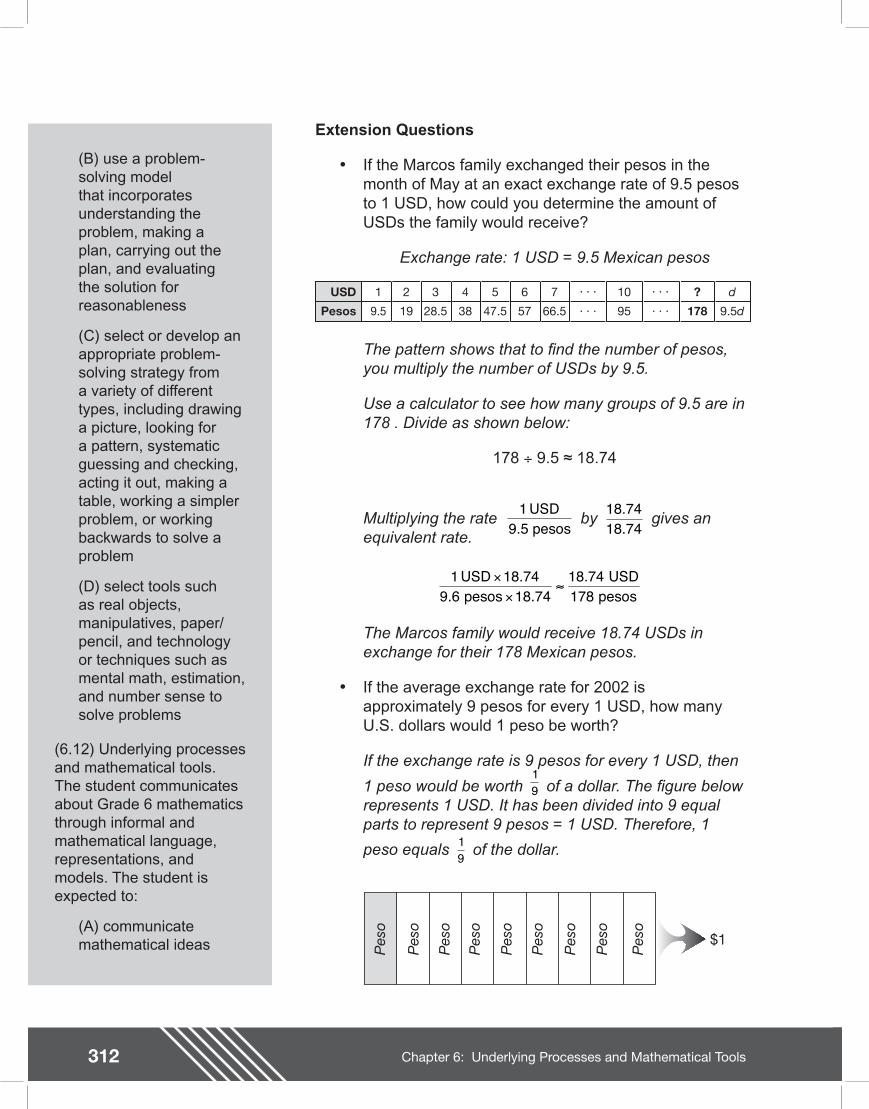
312 Chapter 6: Underlying Processes and Mathematical Tools
Teacher Notes
(B) use a problem-solving model that incorporates understanding the problem, making a plan, carrying out the plan, and evaluating the solution for reasonableness
(C) select or develop an appropriate problem-solving strategy from a variety of different types, including drawing a picture, looking for a pattern, systematic guessing and checking, acting it out, making a table, working a simpler problem, or working backwards to solve a problem
(D) select tools such as real objects, manipulatives, paper/pencil, and technology or techniques such as mental math, estimation, and number sense to solve problems
(6.12) Underlying processes and mathematical tools. The student communicates about Grade 6 mathematics through informal and mathematical language, representations, and models. The student is expected to:
(A) communicate mathematical ideas
Extension Questions
�• If the Marcos family exchanged their pesos in the month of May at an exact exchange rate of 9.5 pesos to 1 USD, how could you determine the amount of USDs the family would receive?
Exchange rate: 1 USD = 9.5 Mexican pesos
. . .
. . .
. . .
. . .USD
Pesos
1
9.5
2
19
3
28.5
4
38
5
47.5
6
57
7
66.5
10
95
?
178
d
9.5d
The pattern shows that to nd the number of pesos, you multiply the number of USDs by 9.5.
Use a calculator to see how many groups of 9.5 are in 178 . Divide as shown below:
178 ÷ 9.5 18.74
Multiplying the rate by gives an equivalent rate.
The Marcos family would receive 18.74 USDs in exchange for their 178 Mexican pesos.
�• If the average exchange rate for 2002 is approximately 9 pesos for every 1 USD, how many U.S. dollars would 1 peso be worth?
If the exchange rate is 9 pesos for every 1 USD, then
1 peso would be worth of a dollar. The gure below represents 1 USD. It has been divided into 9 equal parts to represent 9 pesos = 1 USD. Therefore, 1
peso equals of the dollar.
1 USD9.5 pesos
18 7418 74
.
.
1 18 749 6 18 74
18 74178
USDpesos
USDpesos
××
.. .
.
19
19
Pes
o
Pes
o
Pes
o
Pes
o
Pes
o
Pes
o
Pes
o
Pes
o
Pes
o
$1
313Chapter 6: Underlying Processes and Mathematical Tools
using language, ef cient tools, appropriate units, and graphical, numerical, physical, or algebraic mathematical models
(B) evaluate the effectiveness of different representations to communicate ideas
(6.13) Underlying processes and mathematical tools. The student uses logical reasoning to make conjectures and verify conclusions. The student is expected to:
(B) validate his/her conclusions using mathematical properties and relationships
Texas Assessment Knowledge and Skills
Objective 6: The student will demonstrate an understanding of the mathematical process and tools used in problem solving.

314 Chapter 6: Underlying Processes and Mathematical Tools
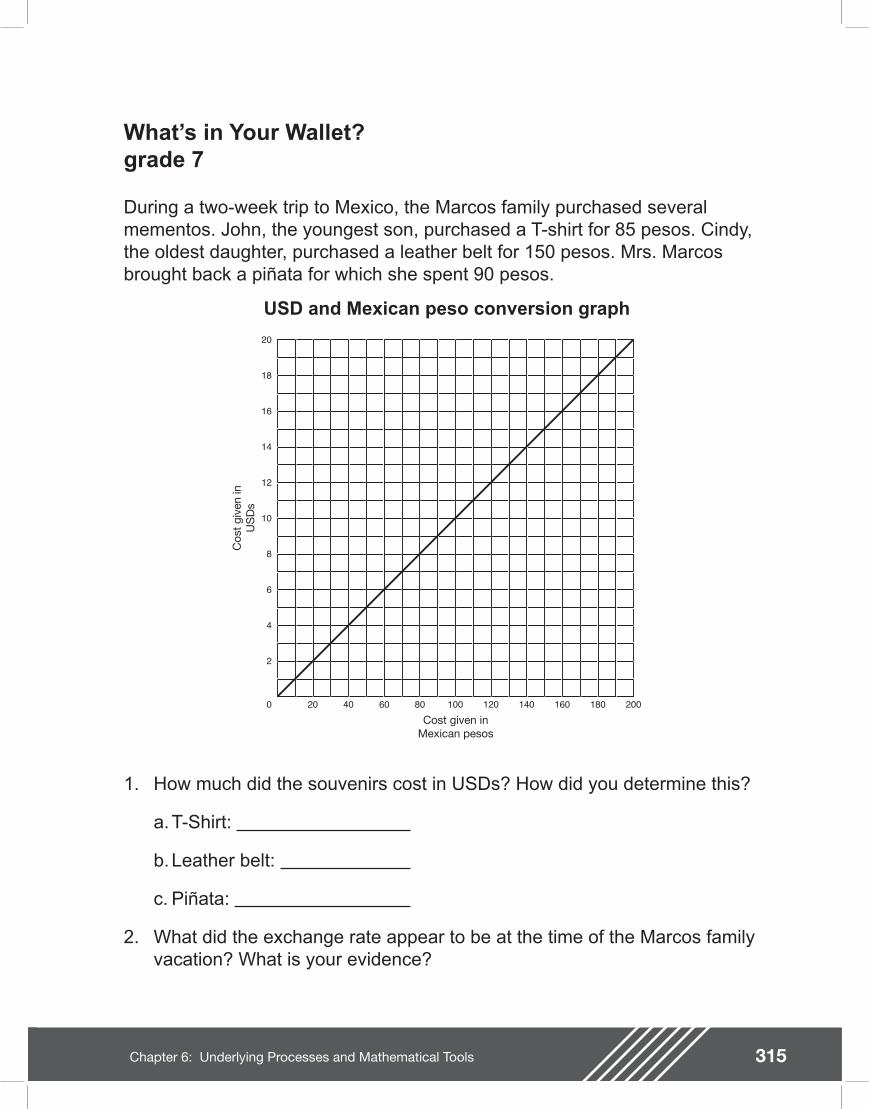
315Chapter 6: Underlying Processes and Mathematical Tools
What�’s in Your Wallet? grade 7
During a two-week trip to Mexico, the Marcos family purchased several mementos. John, the youngest son, purchased a T-shirt for 85 pesos. Cindy, the oldest daughter, purchased a leather belt for 150 pesos. Mrs. Marcos brought back a piñata for which she spent 90 pesos.
USD and Mexican peso conversion graph
2
6
4
8
12
10
14
16
20
18
20 6040 80 120100 140 160 2001800
Cos
t gi
ven
inU
SD
s
Cost given inMexican pesos
1. How much did the souvenirs cost in USDs? How did you determine this?
a. T-Shirt:
b. Leather belt:
c. Piñata:
2. What did the exchange rate appear to be at the time of the Marcos family vacation? What is your evidence?
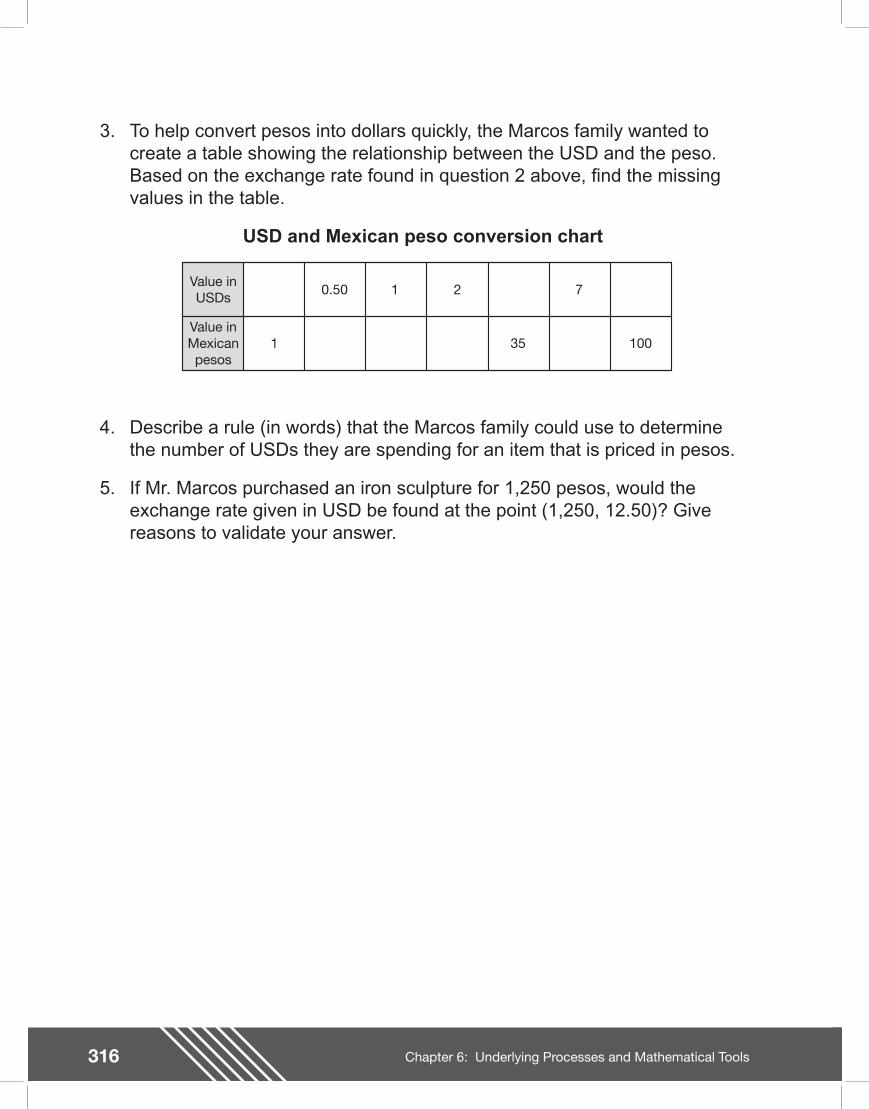
316 Chapter 6: Underlying Processes and Mathematical Tools
3. To help convert pesos into dollars quickly, the Marcos family wanted to create a table showing the relationship between the USD and the peso. Based on the exchange rate found in question 2 above, nd the missing values in the table.
USD and Mexican peso conversion chart
Value inUSDs
Value inMexicanpesos
0.50
1
1 2
35
7
100
4. Describe a rule (in words) that the Marcos family could use to determine the number of USDs they are spending for an item that is priced in pesos.
5. If Mr. Marcos purchased an iron sculpture for 1,250 pesos, would the exchange rate given in USD be found at the point (1,250, 12.50)? Give reasons to validate your answer.

317Chapter 6: Underlying Processes and Mathematical Tools
318 Chapter 6: Underlying Processes and Mathematical Tools
Teacher Notes
Materials
Graphing calculator (optional)
Ruler or straight edge
Connections to Middle School TEKS
(7.2) Number, operation, and quantitative reasoning. The student adds, subtracts, multiplies, or divides to solve problems and justify solutions. The student is expected to:
(D) use division to nd unit rates and ratios in proportional relationships such as speed, density, price, recipes, and student-teacher ratio
(7.3) Patterns, relationships, and algebraic thinking. The student solves problems involving proportional relationships. The student is expected to:
(B) estimate and nd solutions to application problems involving proportional relationships such as similarity, scaling, unit costs, and related measurement units
Scaffolding Questions
�• How could you use the graph to nd the number of pesos that are equal to 1 USD?
�• Explain why this rate is important. What is the name of this special rate?
�• How could you use this rate to complete the graph?
�• Using the graph, how many pesos are equivalent to 2 USDs? 3 USDs? 4 USDs?
�• How could you organize this data?
�• What patterns do you observe?
�• Using the unit rate and graph, how can you validate the cost in USDs of the T-shirt that was purchased for 85 pesos?
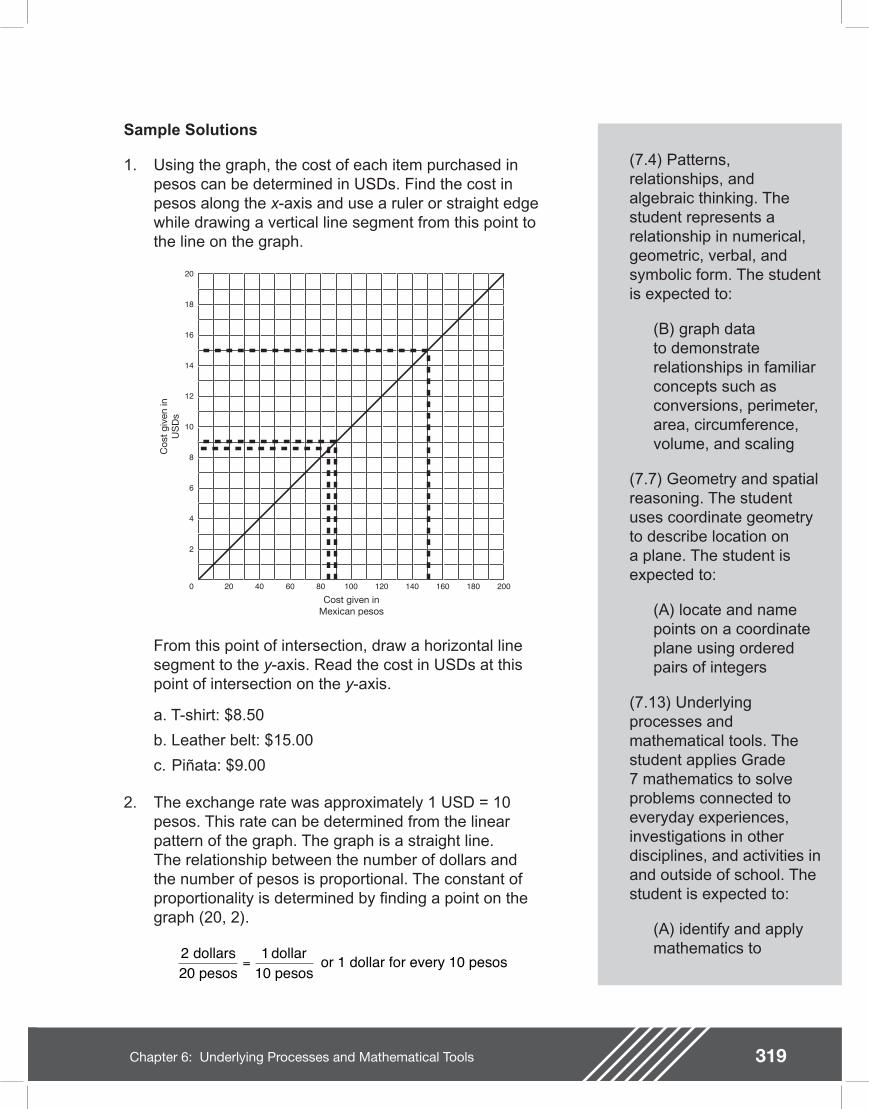
319Chapter 6: Underlying Processes and Mathematical Tools
(7.4) Patterns, relationships, and algebraic thinking. The student represents a relationship in numerical, geometric, verbal, and symbolic form. The student is expected to:
(B) graph data to demonstrate relationships in familiar concepts such as conversions, perimeter, area, circumference, volume, and scaling
(7.7) Geometry and spatial reasoning. The student uses coordinate geometry to describe location on a plane. The student is expected to:
(A) locate and name points on a coordinate plane using ordered pairs of integers
(7.13) Underlying processes and mathematical tools. The student applies Grade 7 mathematics to solve problems connected to everyday experiences, investigations in other disciplines, and activities in and outside of school. The student is expected to:
(A) identify and apply mathematics to
2
6
4
8
12
10
14
16
20
18
20 6040 80 120100 140 160 2001800
Cos
t gi
ven
inU
SD
s
Cost given inMexican pesos
Sample Solutions
1. Using the graph, the cost of each item purchased in pesos can be determined in USDs. Find the cost in pesos along the x-axis and use a ruler or straight edge while drawing a vertical line segment from this point to the line on the graph.
From this point of intersection, draw a horizontal line segment to the y-axis. Read the cost in USDs at this point of intersection on the y-axis.
a. T-shirt: $8.50
b. Leather belt: $15.00
c. Piñata: $9.00
2. The exchange rate was approximately 1 USD = 10 pesos. This rate can be determined from the linear pattern of the graph. The graph is a straight line. The relationship between the number of dollars and the number of pesos is proportional. The constant of proportionality is determined by nding a point on the graph (20, 2).
2 1 dollars20 pesos
dollar10 pesos
or 1 dollar for every 10 pesos=
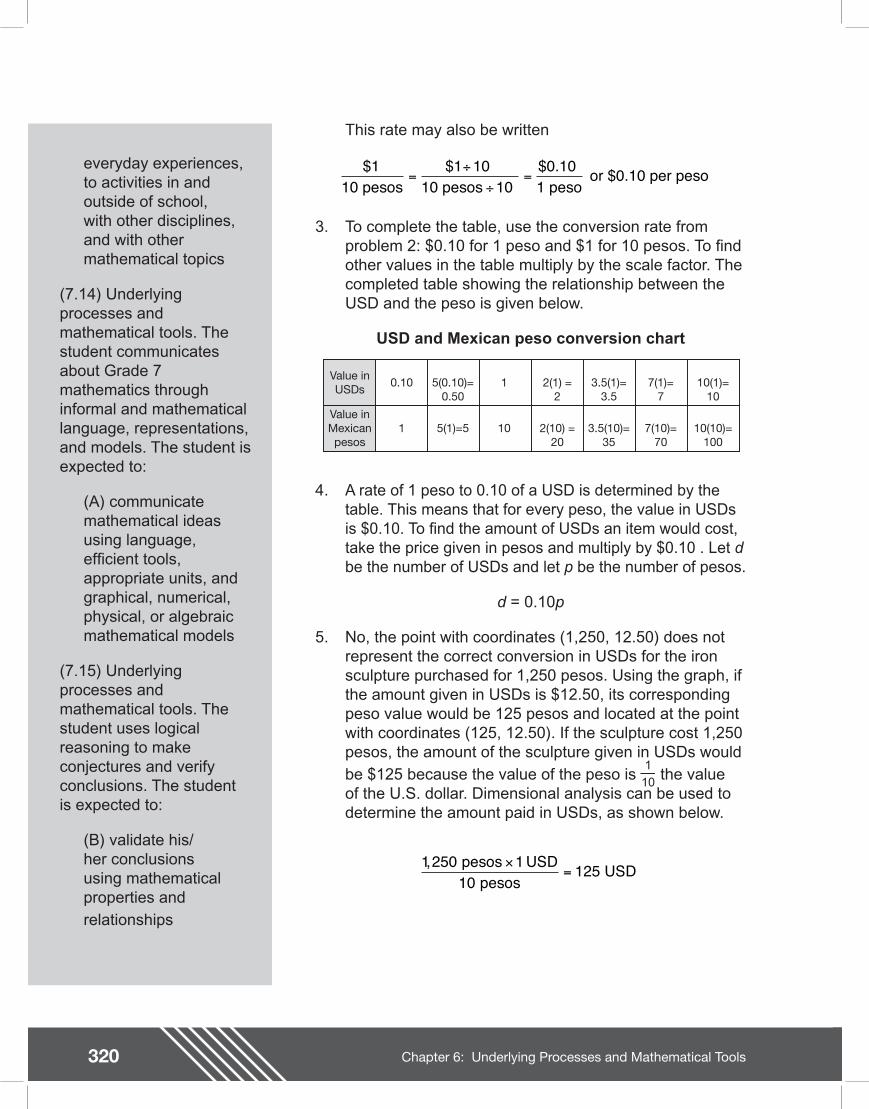
320 Chapter 6: Underlying Processes and Mathematical Tools
Teacher Notes
everyday experiences, to activities in and outside of school, with other disciplines, and with other mathematical topics
(7.14) Underlying processes and mathematical tools. The student communicates about Grade 7 mathematics through informal and mathematical language, representations, and models. The student is expected to:
(A) communicate mathematical ideas using language, ef cient tools, appropriate units, and graphical, numerical, physical, or algebraic mathematical models
(7.15) Underlying processes and mathematical tools. The student uses logical reasoning to make conjectures and verify conclusions. The student is expected to:
(B) validate his/her conclusions using mathematical properties and relationships
This rate may also be written
3. To complete the table, use the conversion rate from problem 2: $0.10 for 1 peso and $1 for 10 pesos. To nd other values in the table multiply by the scale factor. The completed table showing the relationship between the USD and the peso is given below.
USD and Mexican peso conversion chart
$ $ $ .1 1 1010
0 10 10 pesos
10 pesos
1 peso
or $0.10 per peso=÷
÷=
Value inUSDs
Value inMexicanpesos
0.10 5(0.10)=0.50
1 5(1)=5
1
10
2(1) =2
2(10) =20
3.5(1)=3.5
3.5(10)=35
7(1)=7
7(10)=70
10(1)=10
10(10)=100
4. A rate of 1 peso to 0.10 of a USD is determined by the table. This means that for every peso, the value in USDs is $0.10. To nd the amount of USDs an item would cost, take the price given in pesos and multiply by $0.10 . Let d be the number of USDs and let p be the number of pesos.
d = 0.10p
5. No, the point with coordinates (1,250, 12.50) does not represent the correct conversion in USDs for the iron sculpture purchased for 1,250 pesos. Using the graph, if the amount given in USDs is $12.50, its corresponding peso value would be 125 pesos and located at the point with coordinates (125, 12.50). If the sculpture cost 1,250 pesos, the amount of the sculpture given in USDs would be $125 because the value of the peso is the value of the U.S. dollar. Dimensional analysis can be used to determine the amount paid in USDs, as shown below.
1 250 110
, pesos
125 USD×=
USDpesos
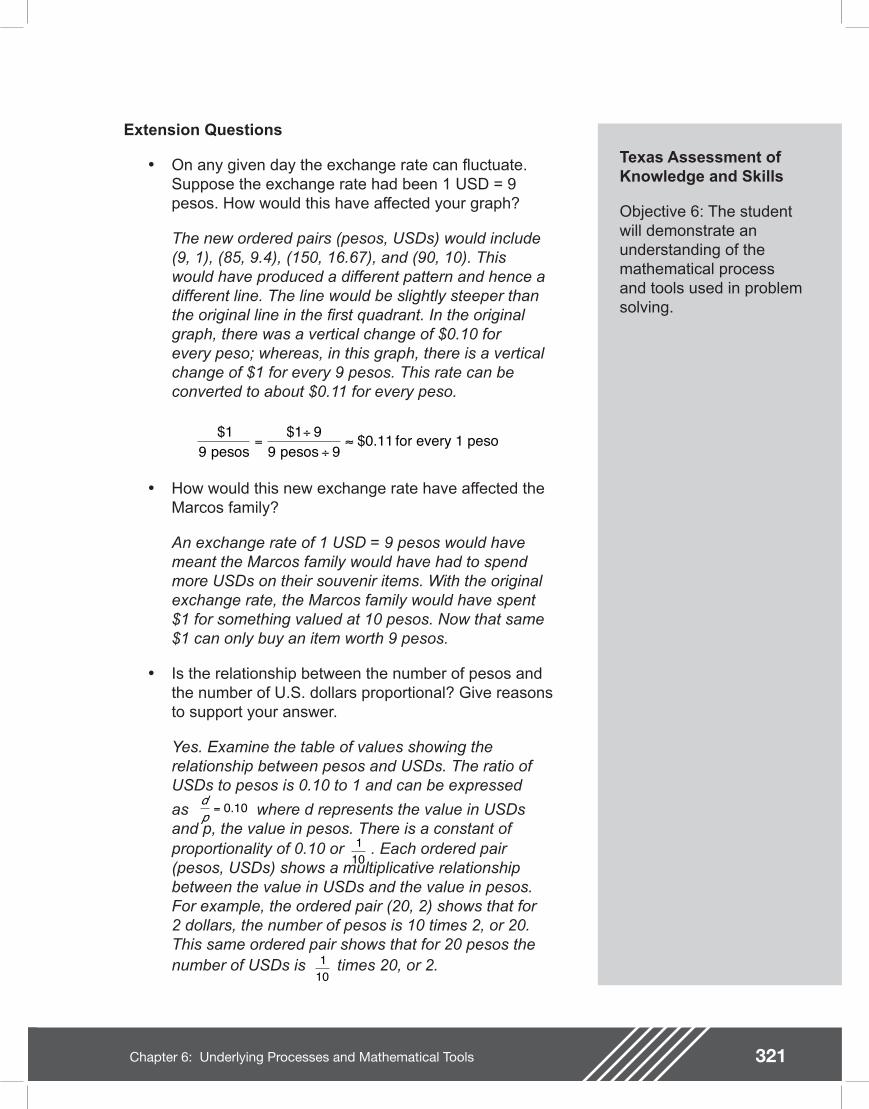
321Chapter 6: Underlying Processes and Mathematical Tools
Texas Assessment of Knowledge and Skills
Objective 6: The student will demonstrate an understanding of the mathematical process and tools used in problem solving.
Extension Questions
�• On any given day the exchange rate can uctuate. Suppose the exchange rate had been 1 USD = 9 pesos. How would this have affected your graph?
The new ordered pairs (pesos, USDs) would include (9, 1), (85, 9.4), (150, 16.67), and (90, 10). This would have produced a different pattern and hence a different line. The line would be slightly steeper than the original line in the rst quadrant. In the original graph, there was a vertical change of $0.10 for every peso; whereas, in this graph, there is a vertical change of $1 for every 9 pesos. This rate can be converted to about $0.11 for every peso.
�• How would this new exchange rate have affected the Marcos family?
An exchange rate of 1 USD = 9 pesos would have meant the Marcos family would have had to spend more USDs on their souvenir items. With the original exchange rate, the Marcos family would have spent $1 for something valued at 10 pesos. Now that same $1 can only buy an item worth 9 pesos.
�• Is the relationship between the number of pesos and the number of U.S. dollars proportional? Give reasons to support your answer.
Yes. Examine the table of values showing the relationship between pesos and USDs. The ratio of USDs to pesos is 0.10 to 1 and can be expressed
as where d represents the value in USDs and p, the value in pesos. There is a constant of proportionality of 0.10 or . Each ordered pair (pesos, USDs) shows a multiplicative relationship between the value in USDs and the value in pesos. For example, the ordered pair (20, 2) shows that for 2 dollars, the number of pesos is 10 times 2, or 20. This same ordered pair shows that for 20 pesos the number of USDs is times 20, or 2.
$ $ $ .19
1 99 9
0 11 pesos pesos
for every 1 peso=÷
÷
dp
= 0 10.
110
110
322 Chapter 6: Underlying Processes and Mathematical Tools
Any pair of related values can be found using another related pair of values as shown in the table.
Value inUSDs
Value inMexicanpesos
0.10 0.50
1 5
1
10
2
20
3.5
35
7
70
10
100
x 5
x 5
x 2
x 2
�• Give two rules that describe the relationship between USDs and pesos in this problem.
Let d represent the amount given in USDs and p represent the amount given in pesos. If the exchange rate is 1 USD = 10 pesos, then
or p = 10dd p=1
10
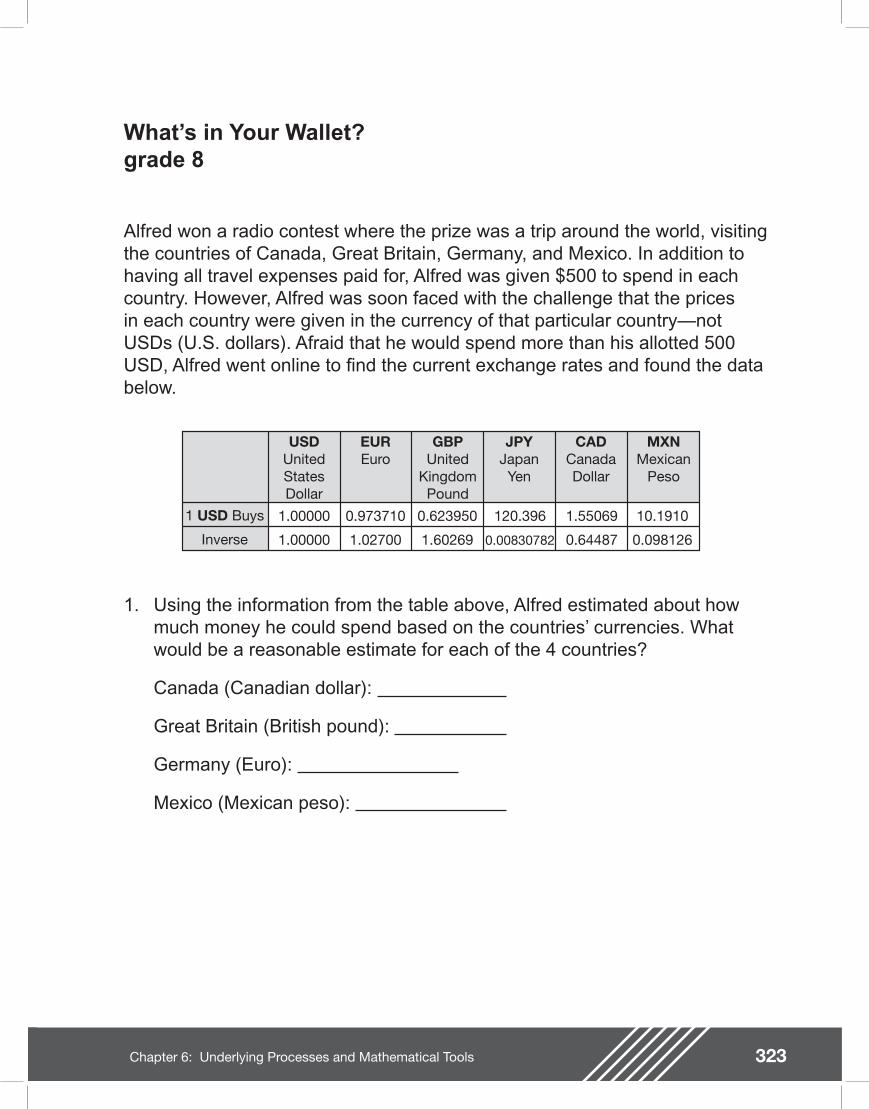
323Chapter 6: Underlying Processes and Mathematical Tools
What�’s in Your Wallet?grade 8
Alfred won a radio contest where the prize was a trip around the world, visiting the countries of Canada, Great Britain, Germany, and Mexico. In addition to having all travel expenses paid for, Alfred was given $500 to spend in each country. However, Alfred was soon faced with the challenge that the prices in each country were given in the currency of that particular country�—not USDs (U.S. dollars). Afraid that he would spend more than his allotted 500 USD, Alfred went online to nd the current exchange rates and found the data below.
1. Using the information from the table above, Alfred estimated about how much money he could spend based on the countries�’ currencies. What would be a reasonable estimate for each of the 4 countries?
Canada (Canadian dollar):
Great Britain (British pound):
Germany (Euro):
Mexico (Mexican peso):
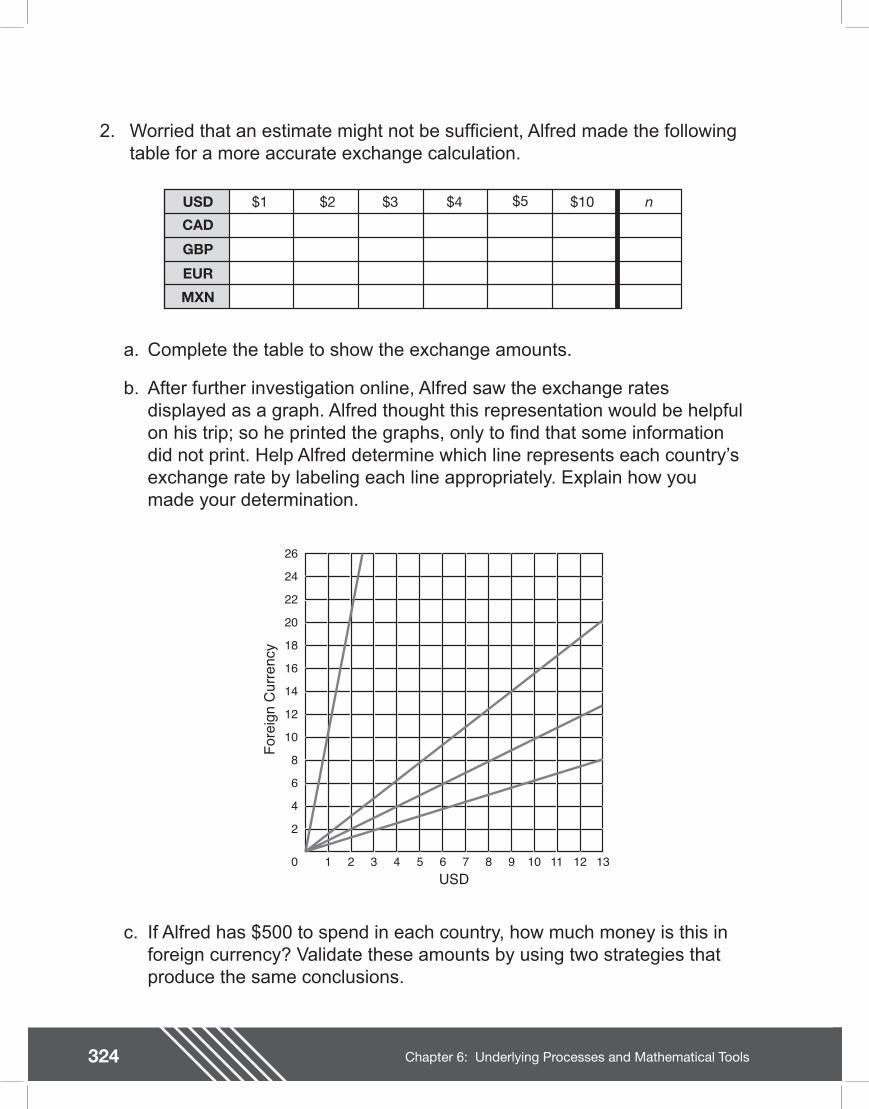
324 Chapter 6: Underlying Processes and Mathematical Tools
2. Worried that an estimate might not be suf cient, Alfred made the followingtable for a more accurate exchange calculation.
USD
CAD
GBP
EUR
MXN
$1 $2 $3 $4 $5 $10 n
a. Complete the table to show the exchange amounts.
b. After further investigation online, Alfred saw the exchange rates displayed as a graph. Alfred thought this representation would be helpful on his trip; so he printed the graphs, only to nd that some information did not print. Help Alfred determine which line represents each country�’s exchange rate by labeling each line appropriately. Explain how you made your determination.
6
2
4
12
8
10
18
14
16
24
20
22
26
31 2 64 5 97 8 1210 11 130
Fore
ign
Cur
renc
y
USD
c. If Alfred has $500 to spend in each country, how much money is this in foreign currency? Validate these amounts by using two strategies that produce the same conclusions.
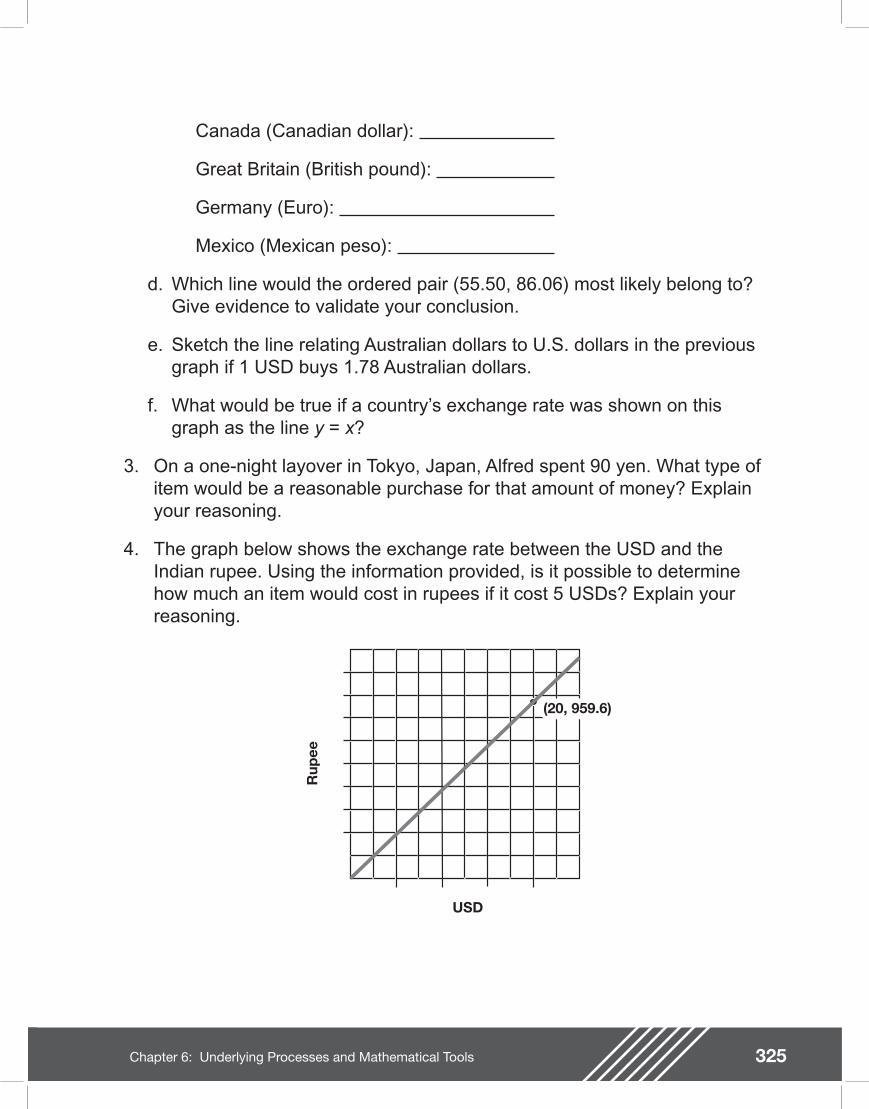
325Chapter 6: Underlying Processes and Mathematical Tools
Canada (Canadian dollar):
Great Britain (British pound):
Germany (Euro):
Mexico (Mexican peso):
d. Which line would the ordered pair (55.50, 86.06) most likely belong to? Give evidence to validate your conclusion.
e. Sketch the line relating Australian dollars to U.S. dollars in the previous graph if 1 USD buys 1.78 Australian dollars.
f. What would be true if a country�’s exchange rate was shown on this graph as the line y = x?
3. On a one-night layover in Tokyo, Japan, Alfred spent 90 yen. What type of item would be a reasonable purchase for that amount of money? Explain your reasoning.
4. The graph below shows the exchange rate between the USD and the Indian rupee. Using the information provided, is it possible to determine how much an item would cost in rupees if it cost 5 USDs? Explain your reasoning.
USD
Rup
ee
(20, 959.6)
326 Chapter 6: Underlying Processes and Mathematical Tools
Teacher Notes
Materials
Graphing calculator
Connections to Middle School TEKS
(8.1) Number, operation, and quantitative reasoning. The student understands that different forms of numbers are appropriate for different situations. The student is expected to:
(B) select and use appropriate forms of rational numbers to solve real-life problems including those involving proportional relationships
(8.2) Number, operation, and quantitative reasoning. The student selects and uses appropriate operations to solve problems and justify solutions. The student is expected to:
(C) evaluate a solution for reasonableness
(D) use multiplication by a constant factor (unit rate) to represent proportional relationships; for example, the arm span of a gibbon is about 1.4 times its height,a = 1.4h
Scaffolding Questions
�• About how much of a Euro does 1 USD buy? 2 USDs? 3 USDs? Repeat question for each of the currencies.
�• How could you use your graphing calculator to help you answer this question?
�• What does the ordered pair (5, 7.75) mean on the graph in the context of the problem?
�• What would that graph look like if the ratio between USDs and a foreign currency was 1 to 1? 1 to 2?
�• What information do you have concerning the relationship between the yen and the USD?
�• How could you describe this relationship in words? In symbols? With a graph?
Sample Solutions
1. One USD buys approximately Canadian dollars. If Alfred had 500 USDs then he could spend 500 groups
of Canadian dollars. This can done mentally by
breaking into two parts, 1 and . One whole group of 500 is 500; half a group of 500 is 250. Adding these parts together gives approximately 750 Canadian dollars for 500 USDs.
The USD buys about 0.62 or 60% of the Great Britain pound. By expressing 60% as 50% + 10% , students can do the computation mentally: 50% of 500 = $250 and 10% of 500 = $50. Combining the parts together gives about 300 pounds for 500 USDs. Sixty percent of 500 is the same as 50% of 500 plus 10% of 500 because there is a proportional relationship between a number and the percentage of that number. As the percentage increases, the percentage of a given number also increases proportionally.
112
112
112
12
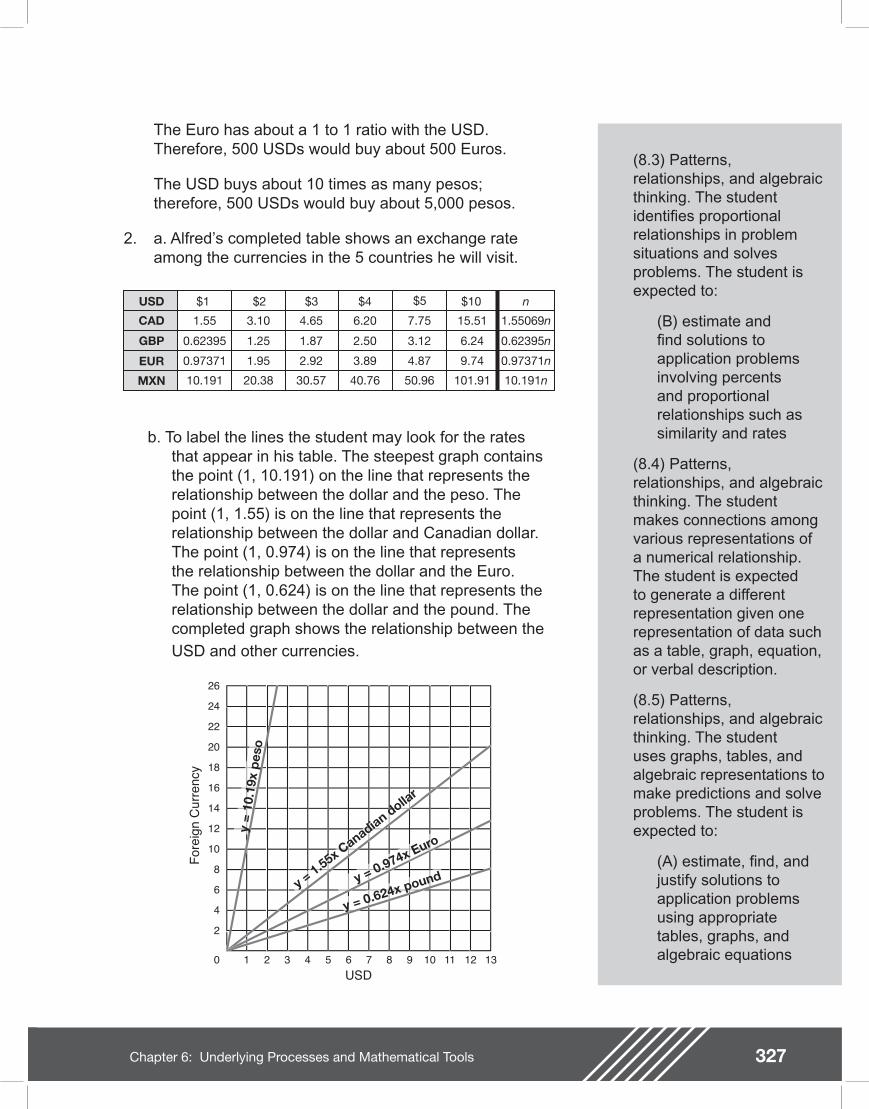
327Chapter 6: Underlying Processes and Mathematical Tools
(8.3) Patterns, relationships, and algebraic thinking. The student identi es proportional relationships in problem situations and solves problems. The student is expected to:
(B) estimate and nd solutions to application problems involving percents and proportional relationships such as similarity and rates
(8.4) Patterns, relationships, and algebraic thinking. The student makes connections among various representations of a numerical relationship. The student is expected to generate a different representation given one representation of data such as a table, graph, equation, or verbal description.
(8.5) Patterns, relationships, and algebraic thinking. The student uses graphs, tables, and algebraic representations to make predictions and solve problems. The student is expected to:
(A) estimate, nd, and justify solutions to application problems using appropriate tables, graphs, and algebraic equations
The Euro has about a 1 to 1 ratio with the USD. Therefore, 500 USDs would buy about 500 Euros.
The USD buys about 10 times as many pesos; therefore, 500 USDs would buy about 5,000 pesos.
2. a. Alfred�’s completed table shows an exchange rate among the currencies in the 5 countries he will visit.
USD
CAD
GBP
EUR
MXN
$1 $2 $3 $4 $5 $10 n
1.55
0.62395
0.97371
10.191
3.10
1.25
1.95
20.38
4.65
1.87
2.92
30.57
6.20
2.50
3.89
40.76
7.75
3.12
4.87
50.96
15.51
6.24
9.74
101.91
1.55069n
0.62395n
0.97371n
10.191n
b. To label the lines the student may look for the rates that appear in his table. The steepest graph contains the point (1, 10.191) on the line that represents the relationship between the dollar and the peso. The point (1, 1.55) is on the line that represents the relationship between the dollar and Canadian dollar. The point (1, 0.974) is on the line that represents the relationship between the dollar and the Euro. The point (1, 0.624) is on the line that represents the relationship between the dollar and the pound. The completed graph shows the relationship between the USD and other currencies.
6
2
4
12
8
10
18
14
16
24
20
22
26
31 2 64 5 97 8 1210 11 130
Fore
ign
Cur
renc
y
USD
y =
10.1
9x p
eso
y = 1.55x Canadian dolla
r
y = 0.974x Euro
y = 0.624x pound
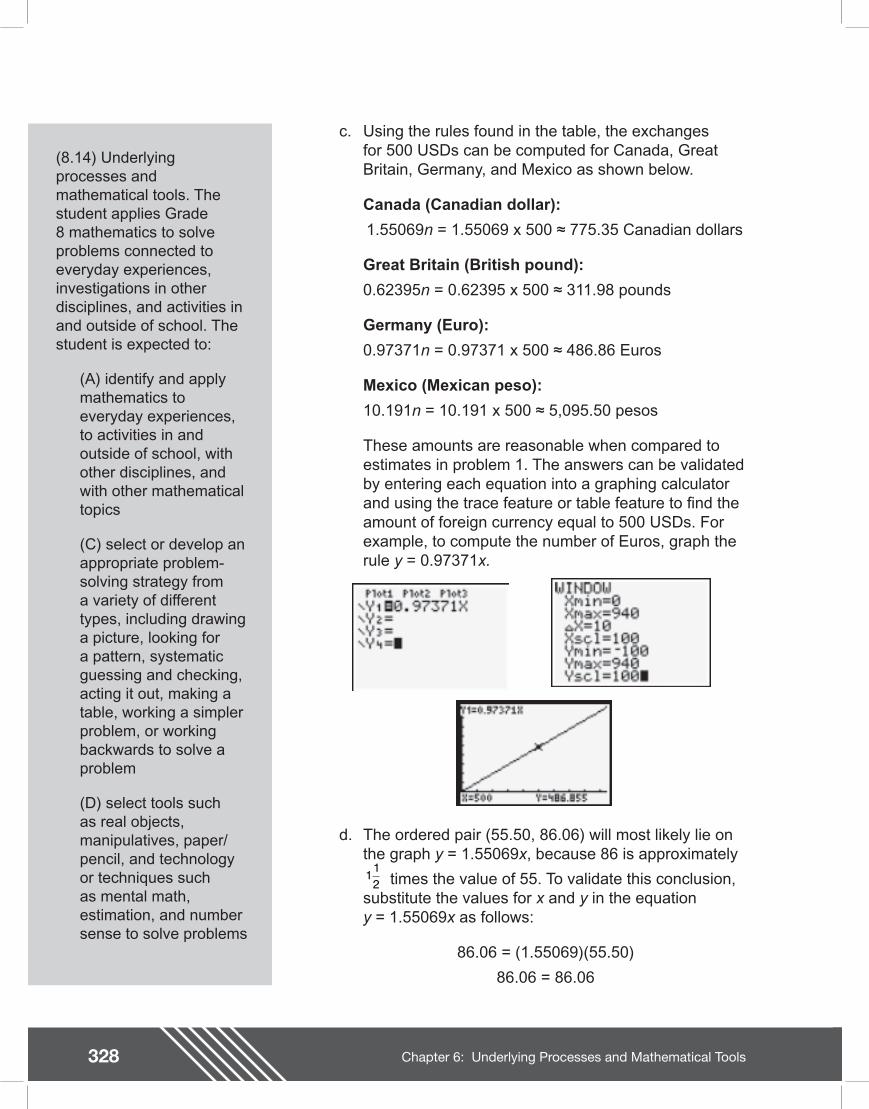
328 Chapter 6: Underlying Processes and Mathematical Tools
Teacher Notes
(8.14) Underlying processes and mathematical tools. The student applies Grade 8 mathematics to solve problems connected to everyday experiences, investigations in other disciplines, and activities in and outside of school. The student is expected to:
(A) identify and apply mathematics to everyday experiences, to activities in and outside of school, with other disciplines, and with other mathematical topics
(C) select or develop an appropriate problem-solving strategy from a variety of different types, including drawing a picture, looking for a pattern, systematic guessing and checking, acting it out, making a table, working a simpler problem, or working backwards to solve a problem
(D) select tools such as real objects, manipulatives, paper/pencil, and technology or techniques such as mental math, estimation, and number sense to solve problems
c. Using the rules found in the table, the exchanges for 500 USDs can be computed for Canada, Great Britain, Germany, and Mexico as shown below.
Canada (Canadian dollar):
1.55069n = 1.55069 x 500 775.35 Canadian dollars
Great Britain (British pound):
0.62395n = 0.62395 x 500 311.98 pounds
Germany (Euro):
0.97371n = 0.97371 x 500 486.86 Euros
Mexico (Mexican peso):
10.191n = 10.191 x 500 5,095.50 pesos
These amounts are reasonable when compared to estimates in problem 1. The answers can be validated by entering each equation into a graphing calculator and using the trace feature or table feature to nd the amount of foreign currency equal to 500 USDs. For example, to compute the number of Euros, graph the rule y = 0.97371x.
d. The ordered pair (55.50, 86.06) will most likely lie on the graph y = 1.55069x, because 86 is approximately
times the value of 55. To validate this conclusion, substitute the values for x and y in the equation y = 1.55069x as follows:
86.06 = (1.55069)(55.50)
86.06 = 86.06
112
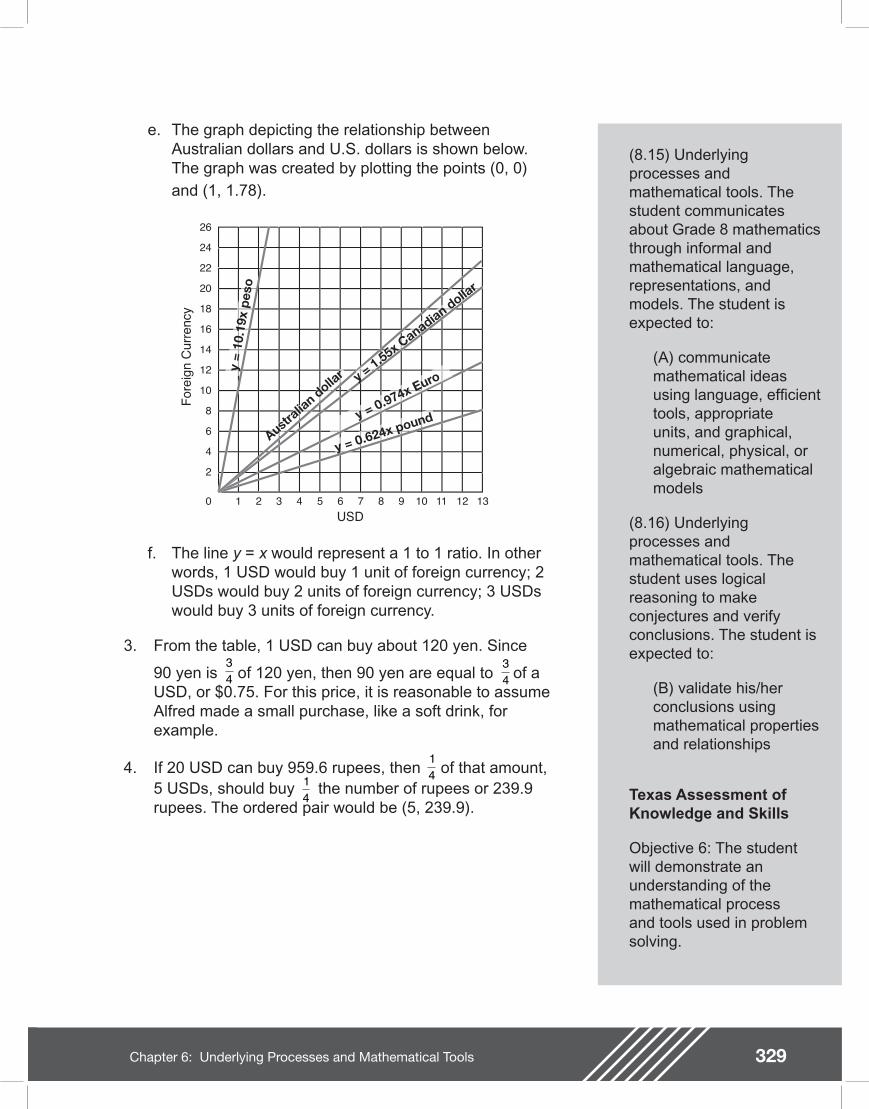
329Chapter 6: Underlying Processes and Mathematical Tools
(8.15) Underlying processes and mathematical tools. The student communicates about Grade 8 mathematics through informal and mathematical language, representations, and models. The student is expected to:
(A) communicate mathematical ideas using language, ef cient tools, appropriate units, and graphical, numerical, physical, or algebraic mathematical models
(8.16) Underlying processes and mathematical tools. The student uses logical reasoning to make conjectures and verify conclusions. The student is expected to:
(B) validate his/her conclusions using mathematical properties and relationships
Texas Assessment of Knowledge and Skills
Objective 6: The student will demonstrate an understanding of the mathematical process and tools used in problem solving.
e. The graph depicting the relationship between Australian dollars and U.S. dollars is shown below. The graph was created by plotting the points (0, 0) and (1, 1.78).
6
2
4
12
8
10
18
14
16
24
20
22
26
31 2 64 5 97 8 1210 11 130
Fore
ign
Cur
renc
y
USD
y =
10.1
9x p
eso
y = 1.55x Canadian dolla
r
y = 0.974x Euro
y = 0.624x poundAustr
alian dolla
r
f. The line y = x would represent a 1 to 1 ratio. In other words, 1 USD would buy 1 unit of foreign currency; 2 USDs would buy 2 units of foreign currency; 3 USDs would buy 3 units of foreign currency.
3. From the table, 1 USD can buy about 120 yen. Since
90 yen is of 120 yen, then 90 yen are equal to of a USD, or $0.75. For this price, it is reasonable to assume Alfred made a small purchase, like a soft drink, for example.
4. If 20 USD can buy 959.6 rupees, then of that amount, 5 USDs, should buy the number of rupees or 239.9 rupees. The ordered pair would be (5, 239.9).
34
34
141
4
330 Chapter 6: Underlying Processes and Mathematical Tools
Extension Questions
�• Why do all the graphs meet at the origin?
The relationships between the USD and the foreign currencies are proportional, and the graphs of the proportional relationships will contain the point (0, 0). In this case the ordered pair (0, 0) means 0 USD will buy 0 units of foreign currency.
�• Exchange rates uctuate daily. If the exchange rate changes so that 1 USD buys 9.9179 pesos, how would this affect its graph? What would this change mean in terms of the buying power of the USD?
The slope of the line would be less steep because the exchange rate is less than it was before, causing the line to increase at a slower rate. For example, on December 20, 2002, 1 USD could purchase more than 10 pesos. However, at the new rate, the same 1 USD could purchase less than 10 pesos (9.9179 pesos).
�• Find a currency converter online. What currency would produce a graph that would lie between the graphs of the Canadian dollar and the Mexican peso?
Answers will vary depending on the market rate. However, students must nd a currency with an exchange rate between 1.55 and 10.191 units per USD.
�• Find a currency converter online. Find the currency that would produce the steepest line in relation to the USD. What does this rate mean in terms of the buying power of the USD?
Answers will vary depending on the market rate. However, the greater the exchange rate the stronger the dollar, meaning you can buy more units of currency per 1 USD.
�• Find the currency that would produce the least steep line in relation to the USD. What does this rate mean in terms of the buying power of the USD?
Answers will vary depending on the market rate. However, the lesser the exchange rate the weaker the dollar, meaning you cannot buy as many units of currency per 1 USD.
331Chapter 6: Underlying Processes and Mathematical Tools
Gone Fishin�’grade 6
The Aqua Shoppe is installing a giant aquarium to house the tropical sh that they sell. The store sells angel sh, clown sh, parrot sh, butter sh, yellow tail damsels, and tetras. Based on demand, the manager requested the tank to be stocked with twice as many angel sh as clown sh; three times as many parrot sh as angel sh; as many butter sh as clown sh, and the same number of tetras as butter sh. Any remaining sh could be stocked as the sales clerk wished as long as every sh the store sold was represented in the tank and the tank contained its recommended quantity of 120 sh.
1. How many of each sh can the sales clerk order? Explain your reasoning.
2. Based on the sales order in question 1, what percentage of the sh in the aquarium will be
a. Angel sh?
b. Clown sh?
c. Parrot sh?
d. Butter sh?
e. Yellow tail damsels?
f. Tetras?
3. What is the maximum number of parrot sh that can be ordered for the tank? Explain.
4. What is the smallest number of parrot sh that can be ordered for the tank? Justify your answer.
5. What is the ratio of angel sh to butter sh? Use mathematical language to explain why this relationship exists.
6. If the sales clerk stocked the tank with 20% parrot sh, how many angel sh were ordered? Explain your answer.
7. When the manager of the Aqua Shoppe asked the sales clerk to leave the sh inventory on his desk, the clerk left the following graphical representations of the order.
12
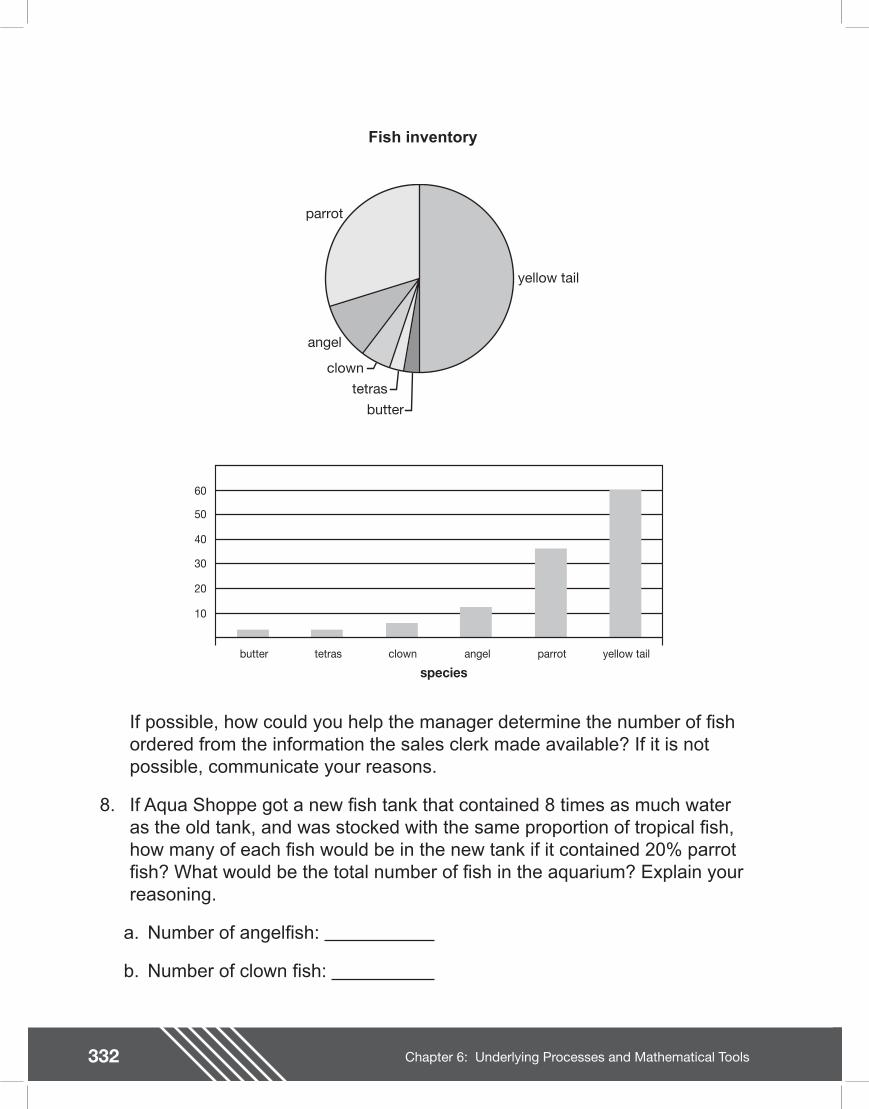
332 Chapter 6: Underlying Processes and Mathematical Tools
butter
tetras
clown
angel
parrot
yellow tail
Fish inventory
butter tetras clown angel parrot yellow tail
species
10
20
30
40
50
60
If possible, how could you help the manager determine the number of sh ordered from the information the sales clerk made available? If it is not possible, communicate your reasons.
8. If Aqua Shoppe got a new sh tank that contained 8 times as much water as the old tank, and was stocked with the same proportion of tropical sh, how many of each sh would be in the new tank if it contained 20% parrot sh? What would be the total number of sh in the aquarium? Explain your reasoning.
a. Number of angel sh:
b. Number of clown sh:
333Chapter 6: Underlying Processes and Mathematical Tools
c. Number of parrot sh:
d. Number of butter sh:
e. Number of tetras:
f. Number of yellow tail damsels:
g. Total number of sh:
334 Chapter 6: Underlying Processes and Mathematical Tools
Teacher Notes
Materials
Grid paper, 10 inches by 12 inches
Multicolored cubes (ample amounts of 6 different colors to represent the 6 different kinds of sh)
Calculator (optional)
Connections to Middle School TEKS
(6.2) Number, operation, and quantitative reasoning. The student adds, subtracts, multiplies, and divides to solve problems and justify solutions. The student is expected to:
(C) use multiplication and division of whole numbers to solve problems including situations involving equivalent ratios and rates
(6.3) Patterns, relationships, and algebraic thinking. The student solves problems involving proportional relationships. The student is expected to:
(A) use ratios to describe proportional situations
Scaffolding Questions
�• What are the conditions that the sales clerk must follow when ordering sh?
�• According to the information, are there more angel sh or clown sh? How do you know?
�• According to the information, are there more butter sh or clown sh? How do you know?
�• If you know how many angel sh you have, how would you determine the number of parrot sh?
�• What is the ratio of angel sh to clown sh? Parrot sh to angel sh? Butter sh to clown sh?
�• How can you use ratios to nd possible combinations of sh that could be ordered?
�• How can you organize all the possible combinations of sh that could be ordered?
�• How can you determine when you have found the correct combinations?
�• Could there be more than one combination that meets the conditions the manager gave the sales clerk? How do you know?
Sample Solutions
1. There are 5 possible solutions to the problem. One option the clerk has is to order the following:
8 angel sh (twice as many as clown)
4 clown sh
24 parrot sh (three times as many as angel)
2 butter sh (half as many as clown)
2 tetras (same number as butter)
80 yellow tail damsels
335Chapter 6: Underlying Processes and Mathematical Tools
(B) represent ratios and percents with concrete models, fractions, and decimals
(C) use ratios to make predictions in proportional situations
(6.10) Probability and statistics. The student uses statistical representations to analyze data. The student is expected to:
(A) draw and compare different graphical representations of the same data
(C) sketch circle graphs to display data
(D) solve problems by collecting, organizing, displaying, and interpreting data
(6.11) Underlying processes and mathematical tools. The student applies Grade 6 mathematics to solve problems connected to everyday experiences, investigations in other disciplines, and activities in and outside of school. The student is expected to:
(A) identify and apply mathematics to everyday experiences, to activities in and
Multicolored cubes can be used to represent the different sh, along with a guess-and-check solution strategy to model this problem. For example: Let one cube
represent a clown sh. Then four clown sh can be represented by four cubes:
Twice as many angel sh can be represented by 8 cubes:
The ratio of angel sh to clown sh is 2 : 1
All possible solutions are given in the table in the table below.
Angelfish Clown fish Parrot fish Butterfish TetrasYellow taildamsels
4
8
12
16
20
2
4
6
8
10
12
24
36
48
60
1
2
3
4
5
1
2
3
4
5
100
80
60
40
20
2. Using the sales clerk�’s order, the tank will contain the following percentages of sh:
8 ÷ 120 = 0.06667 6.67% angel sh
336 Chapter 6: Underlying Processes and Mathematical Tools
Teacher Notes
outside of school, with other disciplines, and with other mathematical topics
(C) select or develop an appropriate problem-solving strategy from a variety of different types, including drawing a picture, looking for a pattern, systematic guessing and checking, acting it out, making a table, working a simpler problem, or working backwards to solve a problem
(D) select tools such as real objects, manipulatives, paper/pencil, and technology or techniques such as mental math, estimation, and number sense to solve problems
(6.12) Underlying processes and mathematical tools. The student communicates about Grade 6 mathematics through informal and mathematical language, representations, and models. The student is expected to:
(A) communicate mathematical ideas
4 ÷ 120 = 0.0333 3.33% clown sh
24 ÷ 120 = 0.2 = 20% parrot sh
2 ÷ 120 = 0.016667 1.67% butter sh
2 ÷ 120 = 0.016667 1.67% tetras
80 ÷ 120 = 0.6667 66.67% yellow tail damsels
This process is used for all the possible combinations.
Angelfish Clown fish Parrot fish Butterfish TetrasYellow taildamsels
4÷120 3.3%
8÷120 6.6%
12÷120 10%
16÷120 13.3%
20÷120 16.7%
2÷120 1.7%
4÷120 3.3%
6÷120 5%
8÷120 6.6%
10÷120 8.3%
12÷120 10%
24÷120 20%
36÷120 30%
48÷120 40%
60÷120 50%
1÷120 0.8%
2÷120 1.7%
3÷120 2.5%
4÷120 3.3%
5÷120 4.2%
1÷120 0.8%
2÷120 1.7%
3÷120 2.5%
4÷120 3.3%
5÷120 4.2%
100÷120 83.3%
80÷120 66.7%
60÷120 50%
40÷120 33.3%
20÷120 16.7%
3. According to the table in number 1, the maximum number of parrot sh that can be ordered is 60. If 72 are ordered, then it would not be possible to order exactly 120 sh and follow the guidelines given by the manager.
4. The smallest number of parrot sh that can be ordered is 12. If fewer than 12 are ordered, then there would only be part of a butter sh according to the constraints of the manager. Ordering fewer than 12 parrot sh is not possible in this situation.
5. The ratio between angel sh and butter sh is 4 to 1. This relationship exists because the manager asked for
�“ as many butter sh as clown sh.�” In other words, for every butter sh there are 2 clown sh.
12
butter
clown
clown
Furthermore, the manger asked for �“twice as many angel sh as clown sh.�” This means that for every clown sh there are 2 angel sh.
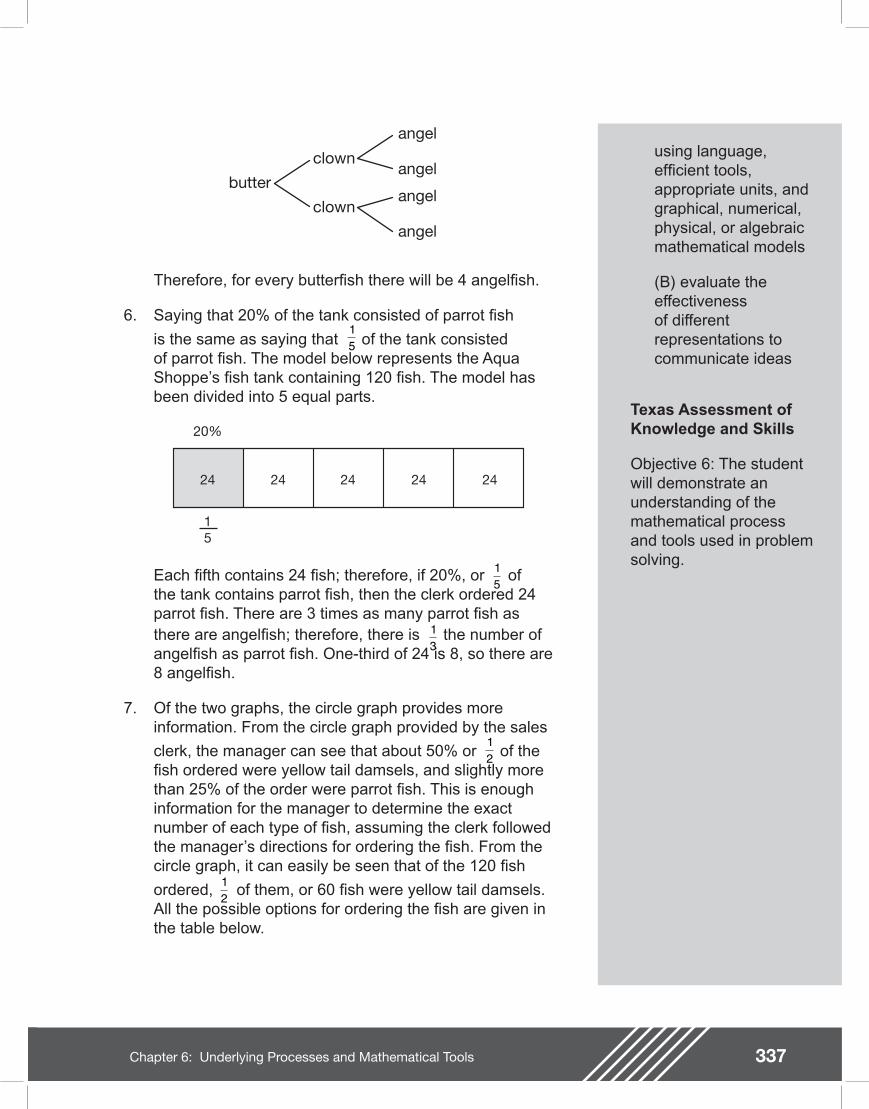
337Chapter 6: Underlying Processes and Mathematical Tools
using language, ef cient tools, appropriate units, and graphical, numerical, physical, or algebraic mathematical models
(B) evaluate the effectiveness of different representations to communicate ideas
Texas Assessment of Knowledge and Skills
Objective 6: The student will demonstrate an understanding of the mathematical process and tools used in problem solving.
Therefore, for every butter sh there will be 4 angel sh.
6. Saying that 20% of the tank consisted of parrot sh
is the same as saying that of the tank consisted of parrot sh. The model below represents the Aqua Shoppe�’s sh tank containing 120 sh. The model has been divided into 5 equal parts.
butter
clown
clownangel
angel
angel
angel
15
20%
15
24 24 24 24 24
Each fth contains 24 sh; therefore, if 20%, or of the tank contains parrot sh, then the clerk ordered 24 parrot sh. There are 3 times as many parrot sh as there are angel sh; therefore, there is the number of angel sh as parrot sh. One-third of 24 is 8, so there are 8 angel sh.
7. Of the two graphs, the circle graph provides more information. From the circle graph provided by the sales
clerk, the manager can see that about 50% or of the sh ordered were yellow tail damsels, and slightly more than 25% of the order were parrot sh. This is enough information for the manager to determine the exact number of each type of sh, assuming the clerk followed the manager�’s directions for ordering the sh. From the circle graph, it can easily be seen that of the 120 sh
ordered, of them, or 60 sh were yellow tail damsels. All the possible options for ordering the sh are given in the table below.
15
13
12
12
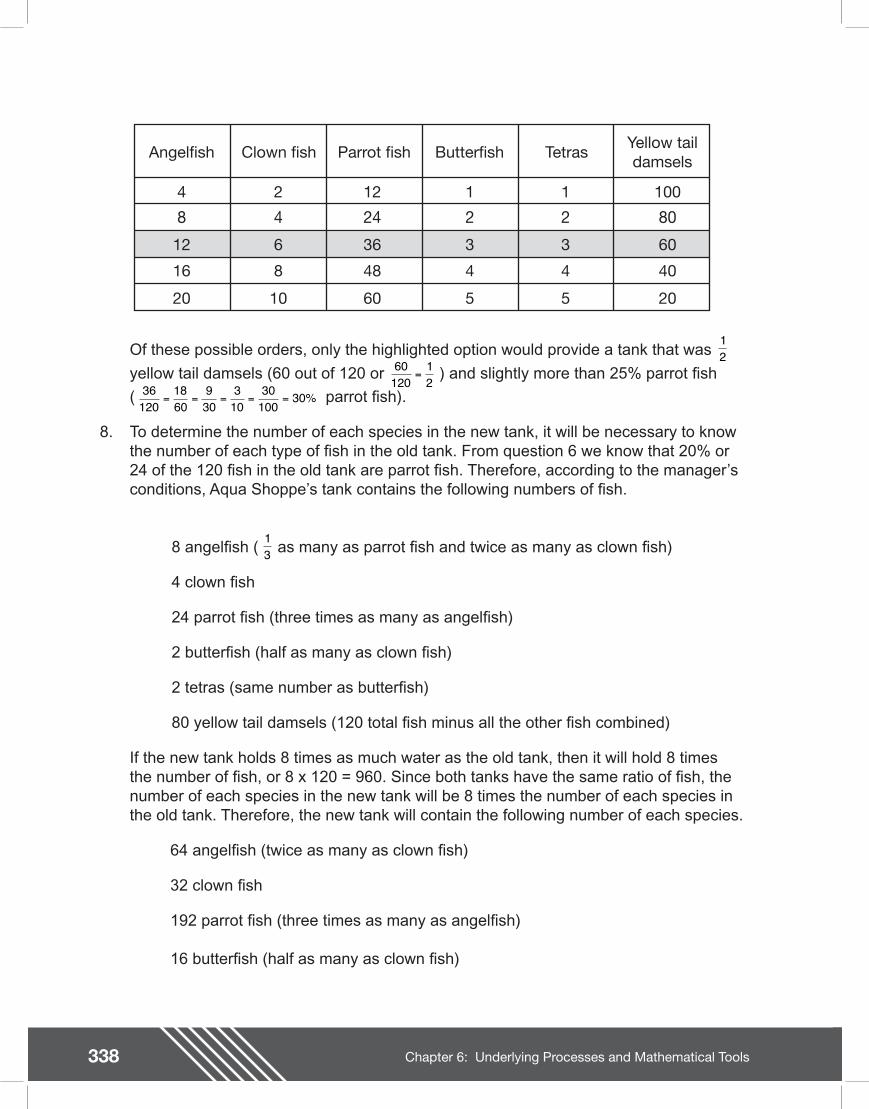
338 Chapter 6: Underlying Processes and Mathematical Tools
Angelfish Clown fish Parrot fish Butterfish TetrasYellow taildamsels
4
8
12
16
20
2
4
6
8
10
12
24
36
48
60
1
2
3
4
5
1
2
3
4
5
100
80
60
40
20
Of these possible orders, only the highlighted option would provide a tank that was
yellow tail damsels (60 out of 120 or ) and slightly more than 25% parrot sh
( parrot sh).
8. To determine the number of each species in the new tank, it will be necessary to know the number of each type of sh in the old tank. From question 6 we know that 20% or 24 of the 120 sh in the old tank are parrot sh. Therefore, according to the manager�’s conditions, Aqua Shoppe�’s tank contains the following numbers of sh.
8 angel sh ( as many as parrot sh and twice as many as clown sh)
4 clown sh
24 parrot sh (three times as many as angel sh)
2 butter sh (half as many as clown sh)
2 tetras (same number as butter sh)
80 yellow tail damsels (120 total sh minus all the other sh combined)
If the new tank holds 8 times as much water as the old tank, then it will hold 8 times the number of sh, or 8 x 120 = 960. Since both tanks have the same ratio of sh, the number of each species in the new tank will be 8 times the number of each species in the old tank. Therefore, the new tank will contain the following number of each species.
64 angel sh (twice as many as clown sh)
32 clown sh
192 parrot sh (three times as many as angel sh)
16 butter sh (half as many as clown sh)
12
60120
12
=36
1201860
930
310
30100
30= = = = = %
13
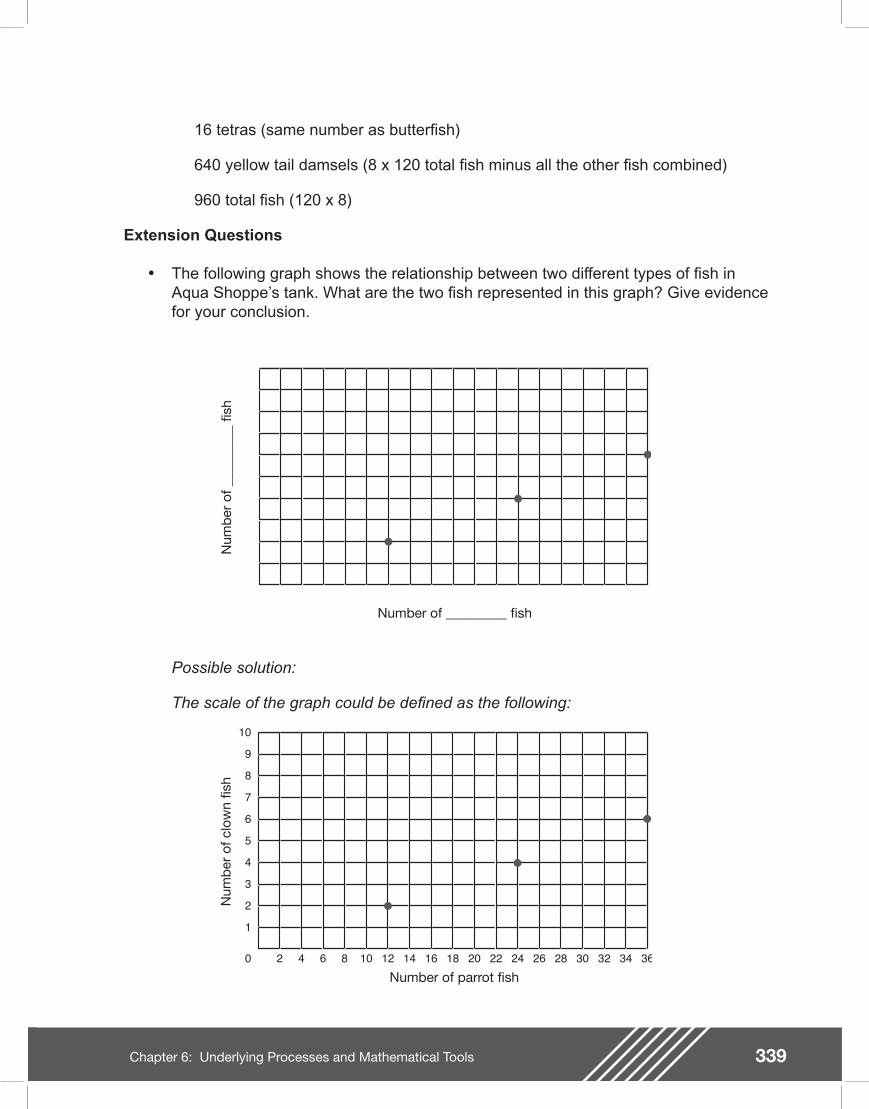
339Chapter 6: Underlying Processes and Mathematical Tools
16 tetras (same number as butter sh)
640 yellow tail damsels (8 x 120 total sh minus all the other sh combined)
960 total sh (120 x 8)
Extension Questions
�• The following graph shows the relationship between two different types of sh in Aqua Shoppe�’s tank. What are the two sh represented in this graph? Give evidence for your conclusion.
Number of _________ fish
Num
ber
of _
____
____
fish
Possible solution:
The scale of the graph could be de ned as the following:
Number of parrot fish
Num
ber
of c
low
n fis
h
3
1
2
6
4
5
9
7
8
10
62 4 128 10 1814 16 2420 22 2826 3430 32 360
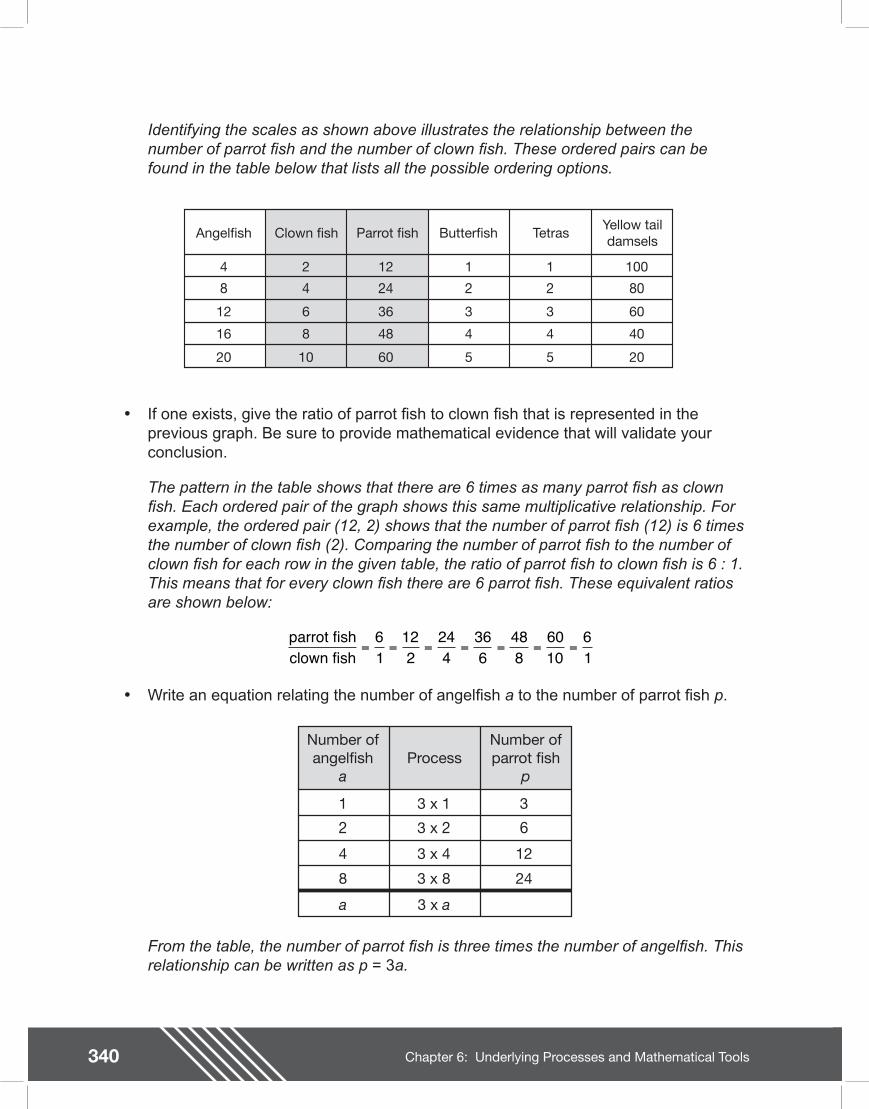
340 Chapter 6: Underlying Processes and Mathematical Tools
Identifying the scales as shown above illustrates the relationship between the number of parrot sh and the number of clown sh. These ordered pairs can be found in the table below that lists all the possible ordering options.
Angelfish Clown fish Parrot fish Butterfish TetrasYellow taildamsels
4
8
12
16
20
2
4
6
8
10
12
24
36
48
60
1
2
3
4
5
1
2
3
4
5
100
80
60
40
20
�• If one exists, give the ratio of parrot sh to clown sh that is represented in the previous graph. Be sure to provide mathematical evidence that will validate your conclusion.
The pattern in the table shows that there are 6 times as many parrot sh as clown sh. Each ordered pair of the graph shows this same multiplicative relationship. For example, the ordered pair (12, 2) shows that the number of parrot sh (12) is 6 times the number of clown sh (2). Comparing the number of parrot sh to the number of clown sh for each row in the given table, the ratio of parrot sh to clown sh is 6 : 1. This means that for every clown sh there are 6 parrot sh. These equivalent ratios are shown below:
�• Write an equation relating the number of angel sh a to the number of parrot sh p.
parrot fishclown fish
= = = = = = =61
122
244
366
488
6010
61
Number ofangelfish
a
Number ofparrot fish
p
1
2
4
8
a
3 x 1
3 x 2
3 x 4
3 x 8
3 x a
3
6
12
24
Process
From the table, the number of parrot sh is three times the number of angel sh. This relationship can be written as p = 3a.
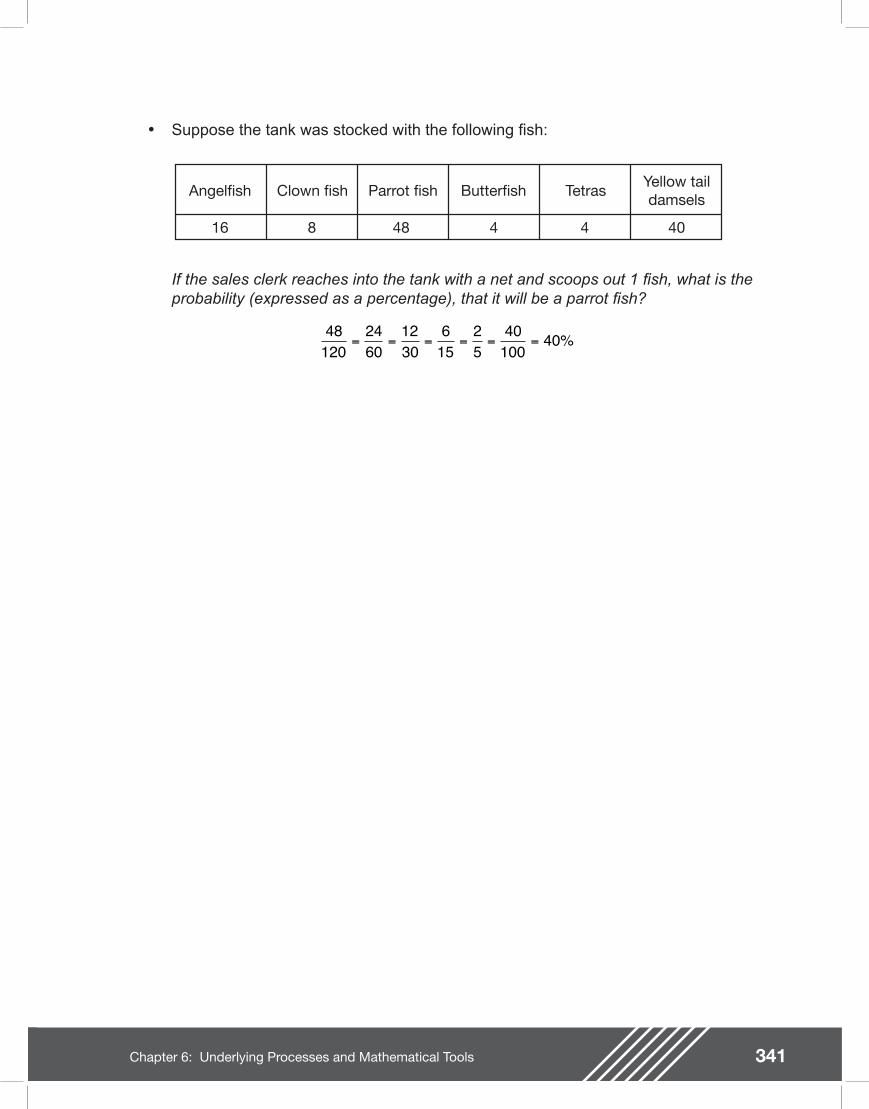
341Chapter 6: Underlying Processes and Mathematical Tools
�• Suppose the tank was stocked with the following sh:
Angelfish Clown fish Parrot fish Butterfish TetrasYellow taildamsels
16 8 48 4 4 40
If the sales clerk reaches into the tank with a net and scoops out 1 sh, what is the probability (expressed as a percentage), that it will be a parrot sh?
48120
2460
1230
615
25
40100
40= = = = = = %

342 Chapter 6: Underlying Processes and Mathematical Tools
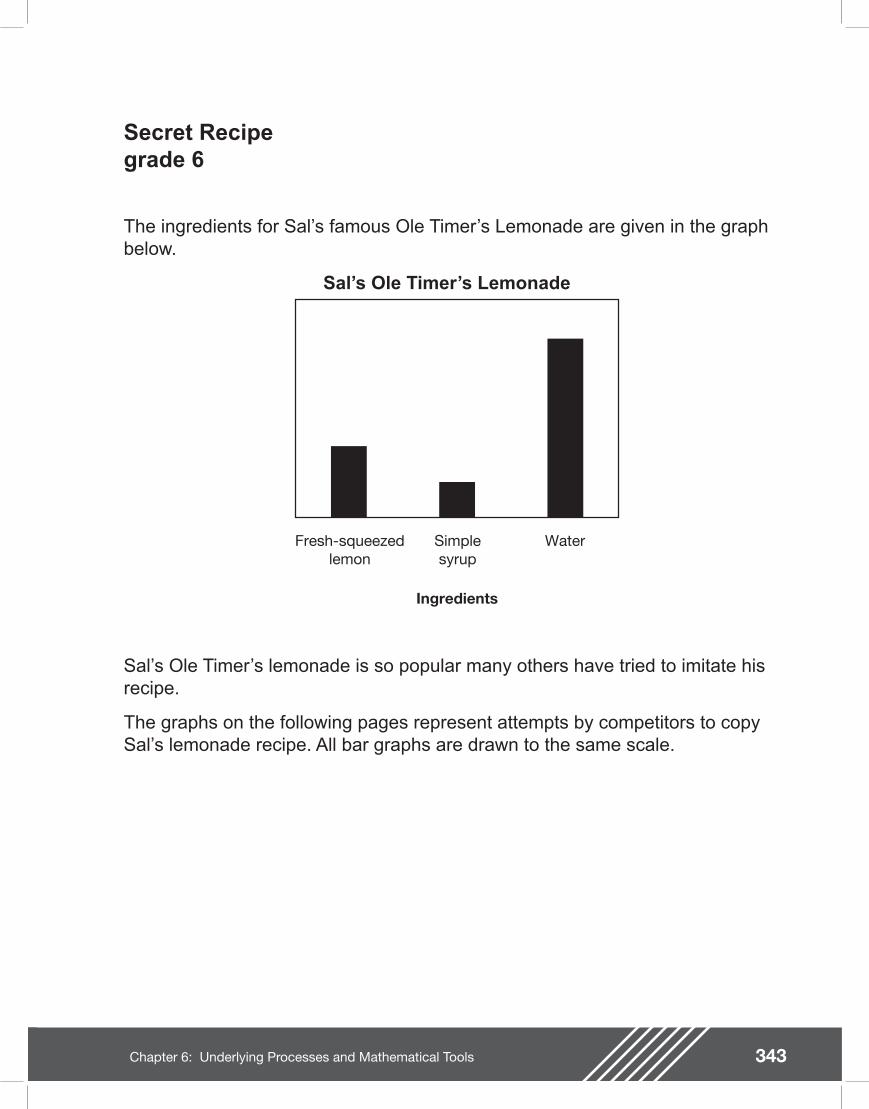
343Chapter 6: Underlying Processes and Mathematical Tools
Secret Recipegrade 6
The ingredients for Sal�’s famous Ole Timer�’s Lemonade are given in the graph below.
Sal�’s Ole Timer�’s Lemonade
Ingredients
Fresh-squeezedlemon
Simplesyrup
Water
Sal�’s Ole Timer�’s lemonade is so popular many others have tried to imitate his recipe.
The graphs on the following pages represent attempts by competitors to copy Sal�’s lemonade recipe. All bar graphs are drawn to the same scale.
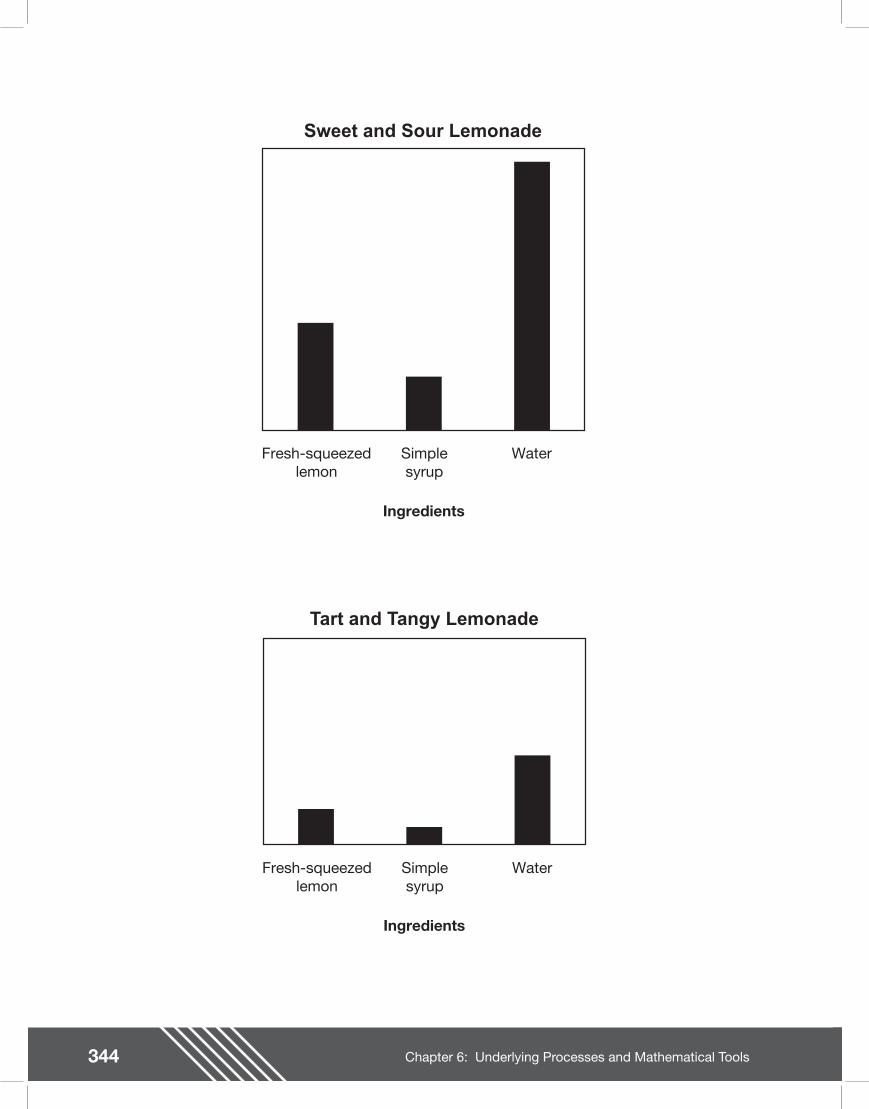
344 Chapter 6: Underlying Processes and Mathematical Tools
Sweet and Sour Lemonade
Ingredients
Fresh-squeezedlemon
Simplesyrup
Water
Ingredients
Fresh-squeezedlemon
Simplesyrup
Water
Tart and Tangy Lemonade
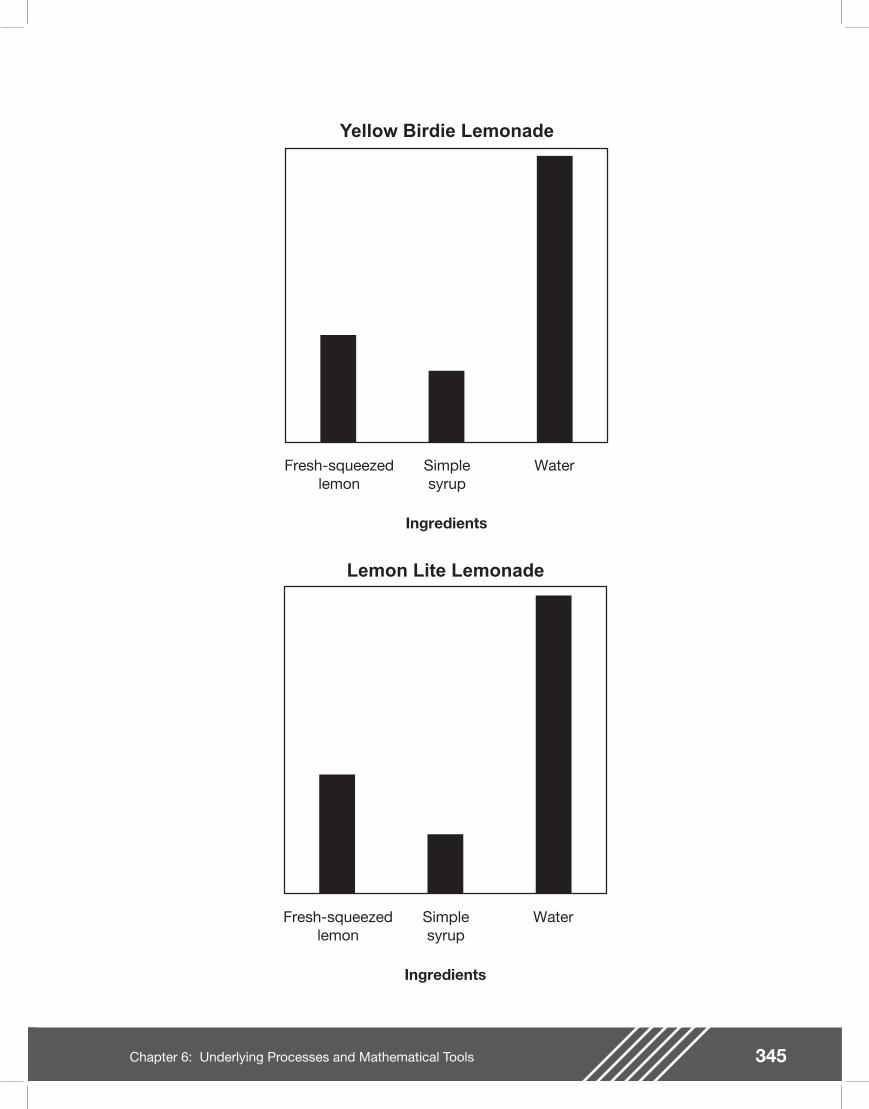
345Chapter 6: Underlying Processes and Mathematical Tools
Lemon Lite Lemonade
Yellow Birdie Lemonade
Ingredients
Fresh-squeezedlemon
Simplesyrup
Water
Ingredients
Fresh-squeezedlemon
Simplesyrup
Water
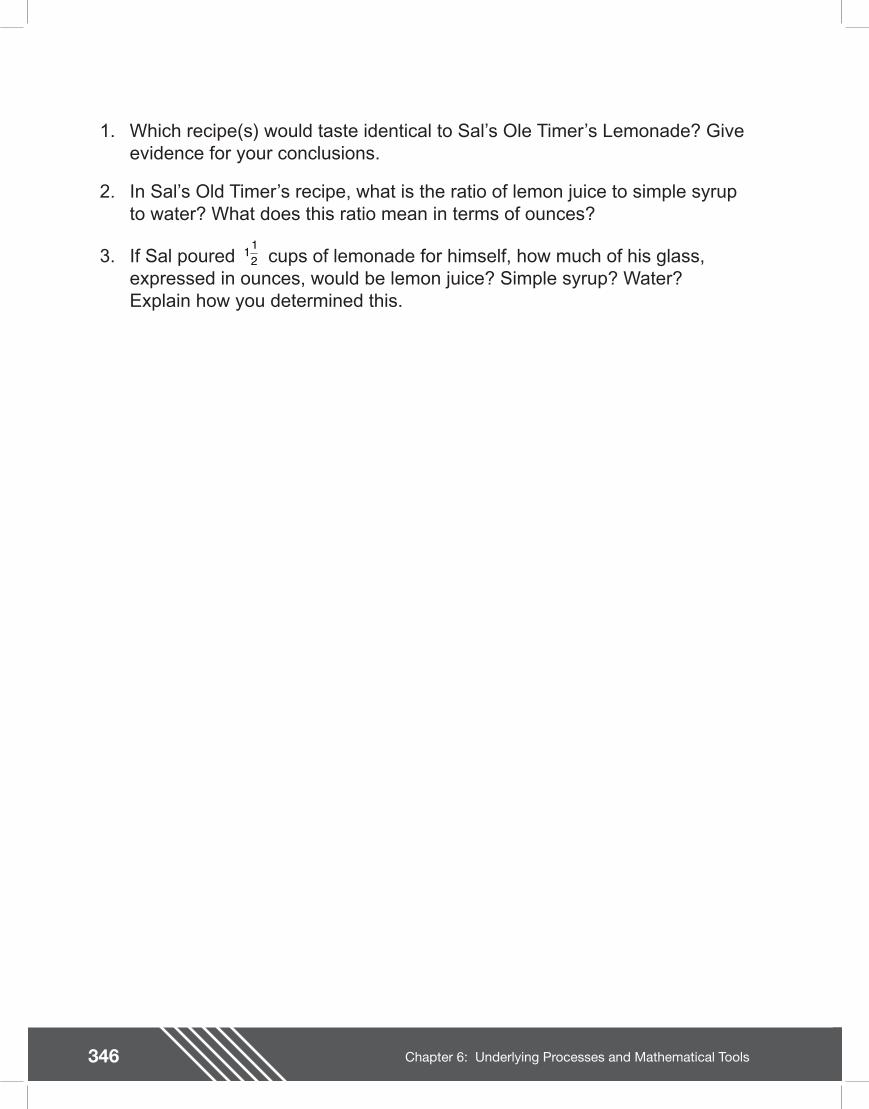
346 Chapter 6: Underlying Processes and Mathematical Tools
1. Which recipe(s) would taste identical to Sal�’s Ole Timer�’s Lemonade? Give evidence for your conclusions.
2. In Sal�’s Old Timer�’s recipe, what is the ratio of lemon juice to simple syrup to water? What does this ratio mean in terms of ounces?
3. If Sal poured cups of lemonade for himself, how much of his glass, expressed in ounces, would be lemon juice? Simple syrup? Water? Explain how you determined this.
112

347Chapter 6: Underlying Processes and Mathematical Tools
348 Chapter 6: Underlying Processes and Mathematical Tools
Teacher NotesMaterials
Measuring tools to select from (ruler, acetate, centimeter graph paper)
Scissors
Transparent grid paper
Connections to Middle School TEKS
(6.3) Patterns, relationships, and algebraic thinking. The student solves problems involving proportional relationships. The student is expected to:
(A) use ratios to describe proportional situations
(B) represent ratios and percents with concrete models, fractions, and decimals
(6.8) Measurement. The student solves application problems involving estimation and measurement of length, area, time, temperature, capacity, weight, and angles. The student is expected to:
(A) estimate measurements and evaluate reasonableness of results
Scaffolding Questions
�• What must be true in order for the different recipes to taste exactly the same?
�• Describe how you would make one glass of lemonade. If you were to make two glasses, how would this affect the amount of ingredients needed?
�• How would the bar graphs for this situation compare?
�• How do the three ingredients in Sal�’s recipe relate to one another?
�• How can you compare the other bar graphs to the Ole Timer�’s Lemonade bar graph?
�• What must be true for a recipe represented by another bar graph to be the same as the Ole Timer�’s Lemonade recipe?
Sample Solutions
1. Sweet and Sour, Tart and Tangy, and Lemon Lite would taste identical to Sal�’s Ole Timer�’s Lemonade. These recipes have the same ratio of cups of fresh-squeezed lemon to cups of simple syrup to cups of water as Sal�’s Ole Timer�’s recipe. This can be determined by examining the relationship between the heights of the bar graphs. Since the number of cups is not shown on any of the bar graphs, the 3 ingredients and their ratios must be compared in a more concrete way. To verify conclusions about these ratios, transparent centimeter grid paper can be used to compare the heights of the bar graphs. The following table shows how the data can be organized for comparisons.
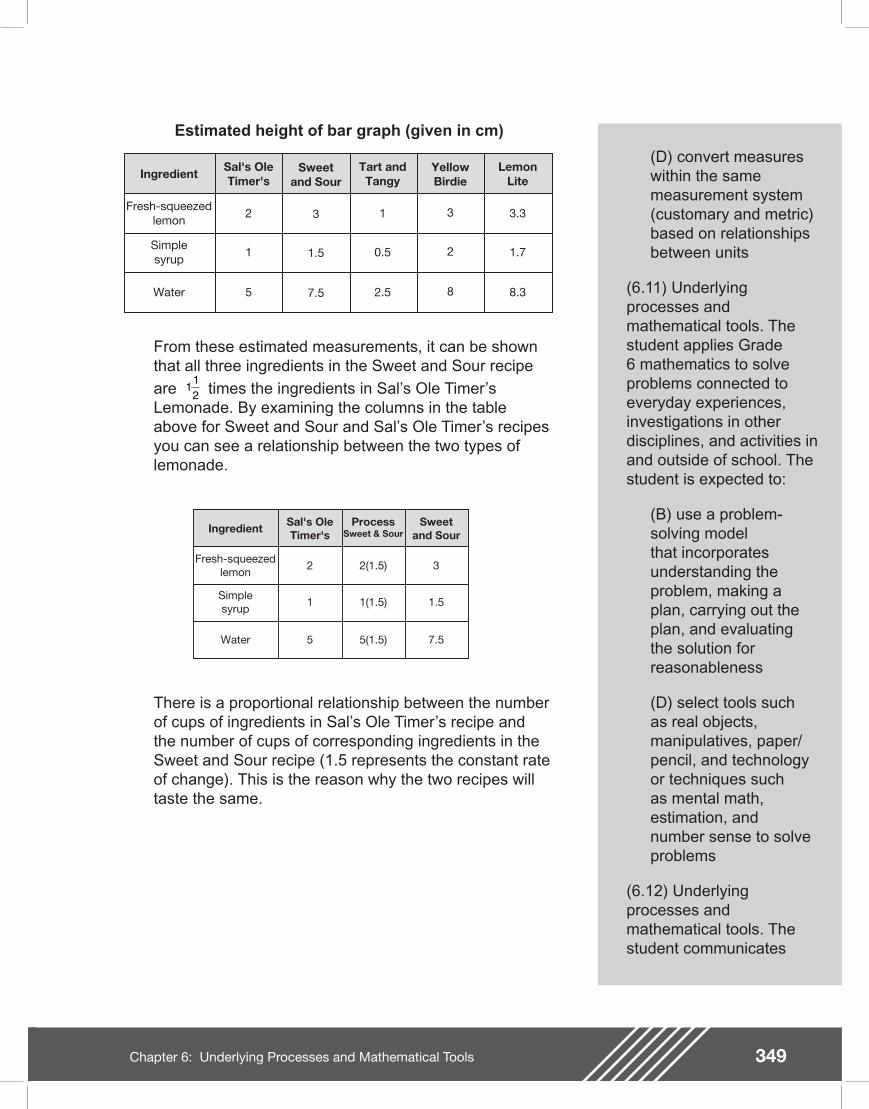
349Chapter 6: Underlying Processes and Mathematical Tools
(D) convert measures within the same measurement system (customary and metric) based on relationships between units
(6.11) Underlying processes and mathematical tools. The student applies Grade 6 mathematics to solve problems connected to everyday experiences, investigations in other disciplines, and activities in and outside of school. The student is expected to:
(B) use a problem-solving model that incorporates understanding the problem, making a plan, carrying out the plan, and evaluating the solution for reasonableness
(D) select tools such as real objects, manipulatives, paper/pencil, and technology or techniques such as mental math, estimation, and number sense to solve problems
(6.12) Underlying processes and mathematical tools. The student communicates
Ingredient Sweetand Sour
YellowBirdie
Tart andTangy
LemonLite
Sal's OleTimer's
Fresh-squeezedlemon 3 31 3.32
Simplesyrup 1.5 20.5 1.71
Water 7.5 82.5 8.35
Estimated height of bar graph (given in cm)
From these estimated measurements, it can be shown that all three ingredients in the Sweet and Sour recipe
are times the ingredients in Sal�’s Ole Timer�’s Lemonade. By examining the columns in the table above for Sweet and Sour and Sal�’s Ole Timer�’s recipes you can see a relationship between the two types of lemonade.
112
Ingredient Sweetand Sour
Sal's OleTimer's
Fresh-squeezedlemon
32
Simplesyrup
1.51
Water 7.55
ProcessSweet & Sour
2(1.5)
1(1.5)
5(1.5)
There is a proportional relationship between the number of cups of ingredients in Sal�’s Ole Timer�’s recipe and the number of cups of corresponding ingredients in the Sweet and Sour recipe (1.5 represents the constant rate of change). This is the reason why the two recipes will taste the same.
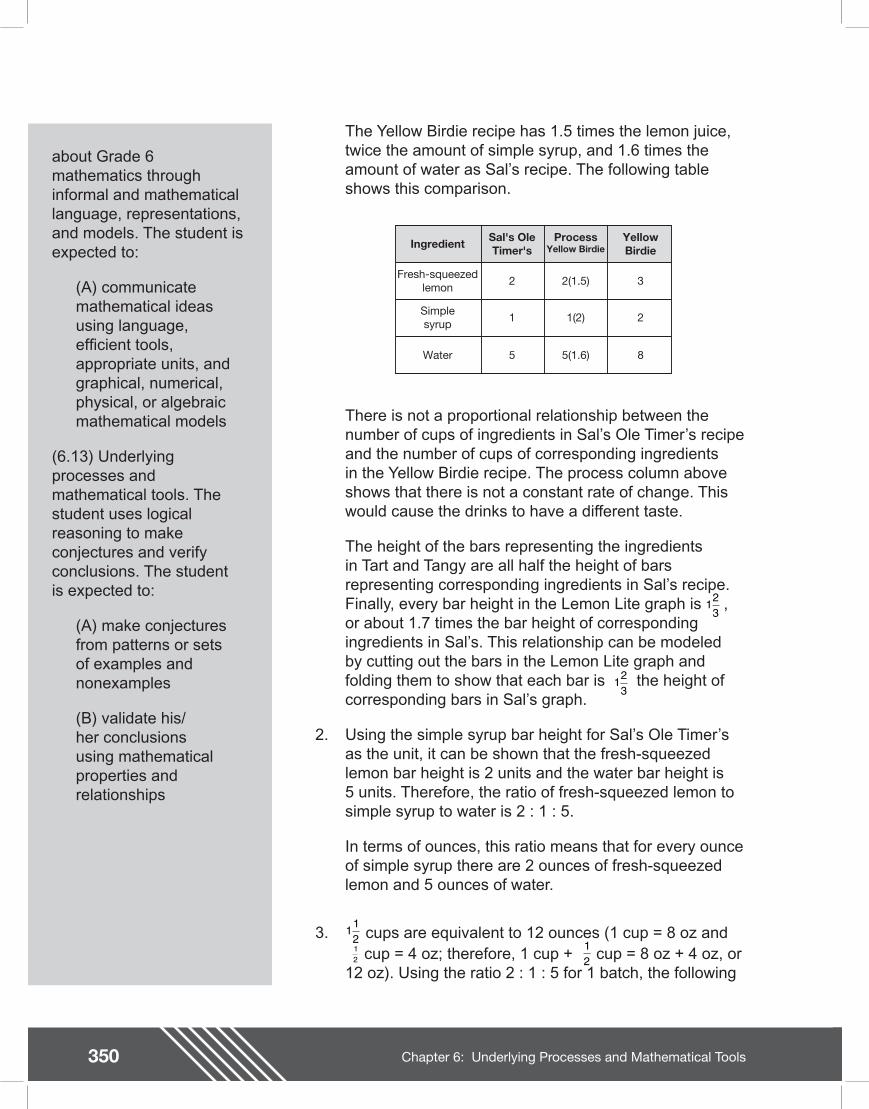
350 Chapter 6: Underlying Processes and Mathematical Tools
Teacher Notes
about Grade 6 mathematics through informal and mathematical language, representations, and models. The student is expected to:
(A) communicate mathematical ideas using language, ef cient tools, appropriate units, and graphical, numerical, physical, or algebraic mathematical models
(6.13) Underlying processes and mathematical tools. The student uses logical reasoning to make conjectures and verify conclusions. The student is expected to:
(A) make conjectures from patterns or sets of examples and nonexamples
(B) validate his/her conclusions using mathematical properties and relationships
The Yellow Birdie recipe has 1.5 times the lemon juice, twice the amount of simple syrup, and 1.6 times the amount of water as Sal�’s recipe. The following table shows this comparison.
Ingredient YellowBirdie
Sal's OleTimer's
Fresh-squeezedlemon
32
Simplesyrup
21
Water 85
ProcessYellow Birdie
2(1.5)
1(2)
5(1.6)
There is not a proportional relationship between the number of cups of ingredients in Sal�’s Ole Timer�’s recipe and the number of cups of corresponding ingredients in the Yellow Birdie recipe. The process column above shows that there is not a constant rate of change. This would cause the drinks to have a different taste.
The height of the bars representing the ingredients in Tart and Tangy are all half the height of bars representing corresponding ingredients in Sal�’s recipe. Finally, every bar height in the Lemon Lite graph is , or about 1.7 times the bar height of corresponding ingredients in Sal�’s. This relationship can be modeled by cutting out the bars in the Lemon Lite graph and folding them to show that each bar is the height of corresponding bars in Sal�’s graph.
2. Using the simple syrup bar height for Sal�’s Ole Timer�’s as the unit, it can be shown that the fresh-squeezed lemon bar height is 2 units and the water bar height is 5 units. Therefore, the ratio of fresh-squeezed lemon to simple syrup to water is 2 : 1 : 5.
In terms of ounces, this ratio means that for every ounce of simple syrup there are 2 ounces of fresh-squeezed lemon and 5 ounces of water.
3. cups are equivalent to 12 ounces (1 cup = 8 oz and cup = 4 oz; therefore, 1 cup + cup = 8 oz + 4 oz, or
12 oz). Using the ratio 2 : 1 : 5 for 1 batch, the following
123
123
112 1
212
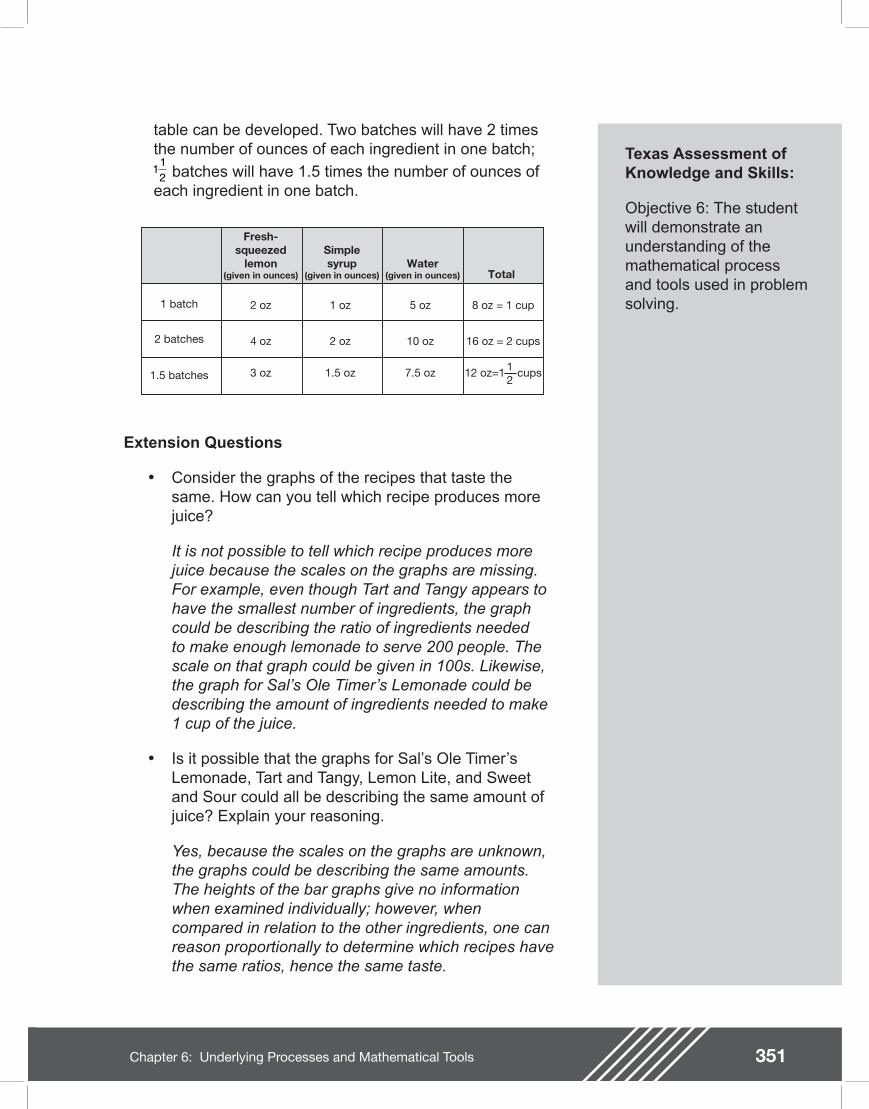
351Chapter 6: Underlying Processes and Mathematical Tools
Texas Assessment of Knowledge and Skills:
Objective 6: The student will demonstrate an understanding of the mathematical process and tools used in problem solving.
table can be developed. Two batches will have 2 times the number of ounces of each ingredient in one batch;
batches will have 1.5 times the number of ounces of each ingredient in one batch.
112
Fresh-squeezed
lemon(given in ounces)
Simplesyrup
(given in ounces)Water
(given in ounces) Total
1 batch
2 batches
1.5 batches
2 oz
4 oz
3 oz
1 oz
2 oz
1.5 oz
5 oz
10 oz
7.5 oz
8 oz = 1 cup
16 oz = 2 cups
12 oz=1 cups12
Extension Questions
�• Consider the graphs of the recipes that taste the same. How can you tell which recipe produces more juice?
It is not possible to tell which recipe produces more juice because the scales on the graphs are missing. For example, even though Tart and Tangy appears to have the smallest number of ingredients, the graph could be describing the ratio of ingredients needed to make enough lemonade to serve 200 people. The scale on that graph could be given in 100s. Likewise, the graph for Sal�’s Ole Timer�’s Lemonade could be describing the amount of ingredients needed to make 1 cup of the juice.
�• Is it possible that the graphs for Sal�’s Ole Timer�’s Lemonade, Tart and Tangy, Lemon Lite, and Sweet and Sour could all be describing the same amount of juice? Explain your reasoning.
Yes, because the scales on the graphs are unknown, the graphs could be describing the same amounts. The heights of the bar graphs give no information when examined individually; however, when compared in relation to the other ingredients, one can reason proportionally to determine which recipes have the same ratios, hence the same taste.

352 Chapter 6: Underlying Processes and Mathematical Tools
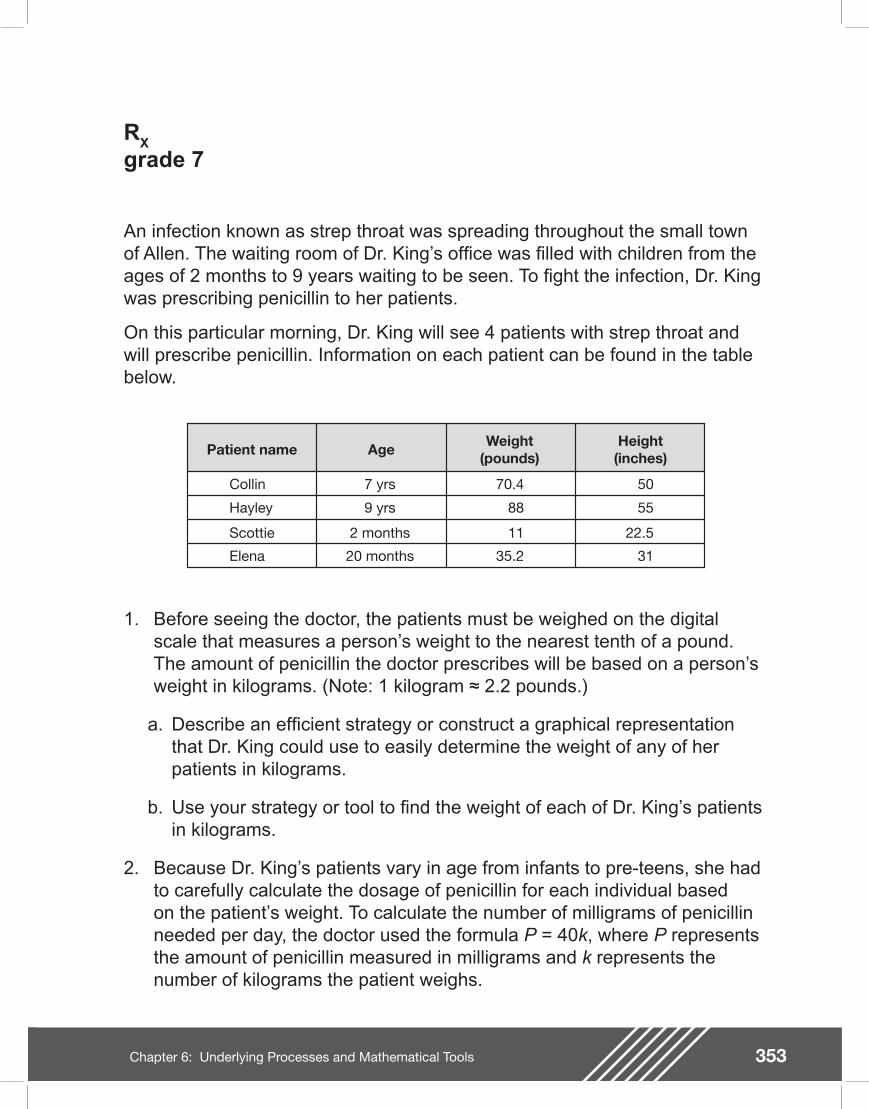
353Chapter 6: Underlying Processes and Mathematical Tools
RX
grade 7
An infection known as strep throat was spreading throughout the small town of Allen. The waiting room of Dr. King�’s of ce was lled with children from the ages of 2 months to 9 years waiting to be seen. To ght the infection, Dr. King was prescribing penicillin to her patients.
On this particular morning, Dr. King will see 4 patients with strep throat and will prescribe penicillin. Information on each patient can be found in the table below.
Patient name Age Weight(pounds)
Height(inches)
Collin
Hayley
Scottie
Elena
7 yrs
9 yrs
2 months
20 months
70.4
88
11
35.2
50
55
22.5
31
1. Before seeing the doctor, the patients must be weighed on the digital scale that measures a person�’s weight to the nearest tenth of a pound. The amount of penicillin the doctor prescribes will be based on a person�’s weight in kilograms. (Note: 1 kilogram 2.2 pounds.)
a. Describe an ef cient strategy or construct a graphical representation that Dr. King could use to easily determine the weight of any of her patients in kilograms.
b. Use your strategy or tool to nd the weight of each of Dr. King�’s patients in kilograms.
2. Because Dr. King�’s patients vary in age from infants to pre-teens, she had to carefully calculate the dosage of penicillin for each individual based on the patient�’s weight. To calculate the number of milligrams of penicillin needed per day, the doctor used the formula P = 40k, where P represents the amount of penicillin measured in milligrams and k represents the number of kilograms the patient weighs.
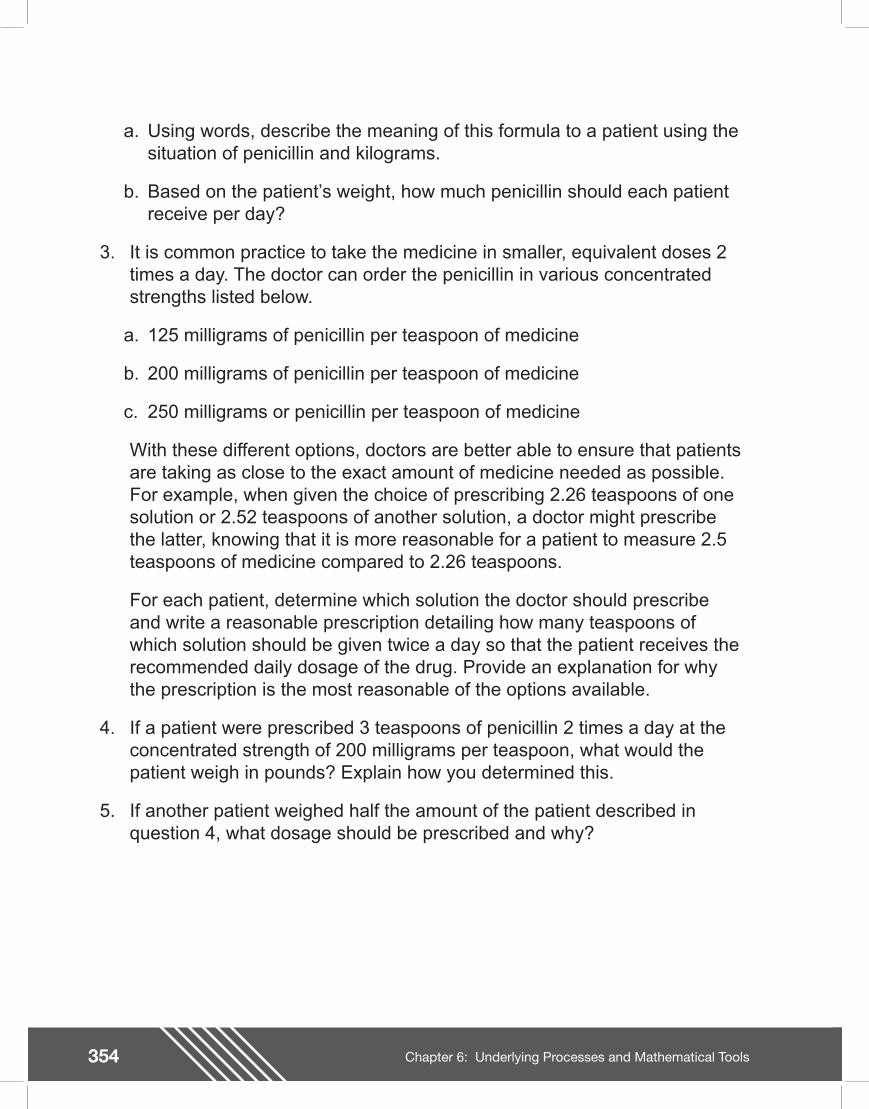
354 Chapter 6: Underlying Processes and Mathematical Tools
a. Using words, describe the meaning of this formula to a patient using the situation of penicillin and kilograms.
b. Based on the patient�’s weight, how much penicillin should each patient receive per day?
3. It is common practice to take the medicine in smaller, equivalent doses 2 times a day. The doctor can order the penicillin in various concentrated strengths listed below.
a. 125 milligrams of penicillin per teaspoon of medicine
b. 200 milligrams of penicillin per teaspoon of medicine
c. 250 milligrams or penicillin per teaspoon of medicine
With these different options, doctors are better able to ensure that patients are taking as close to the exact amount of medicine needed as possible. For example, when given the choice of prescribing 2.26 teaspoons of one solution or 2.52 teaspoons of another solution, a doctor might prescribe the latter, knowing that it is more reasonable for a patient to measure 2.5 teaspoons of medicine compared to 2.26 teaspoons.
For each patient, determine which solution the doctor should prescribe and write a reasonable prescription detailing how many teaspoons of which solution should be given twice a day so that the patient receives the recommended daily dosage of the drug. Provide an explanation for why the prescription is the most reasonable of the options available.
4. If a patient were prescribed 3 teaspoons of penicillin 2 times a day at the concentrated strength of 200 milligrams per teaspoon, what would the patient weigh in pounds? Explain how you determined this.
5. If another patient weighed half the amount of the patient described in question 4, what dosage should be prescribed and why?

355Chapter 6: Underlying Processes and Mathematical Tools
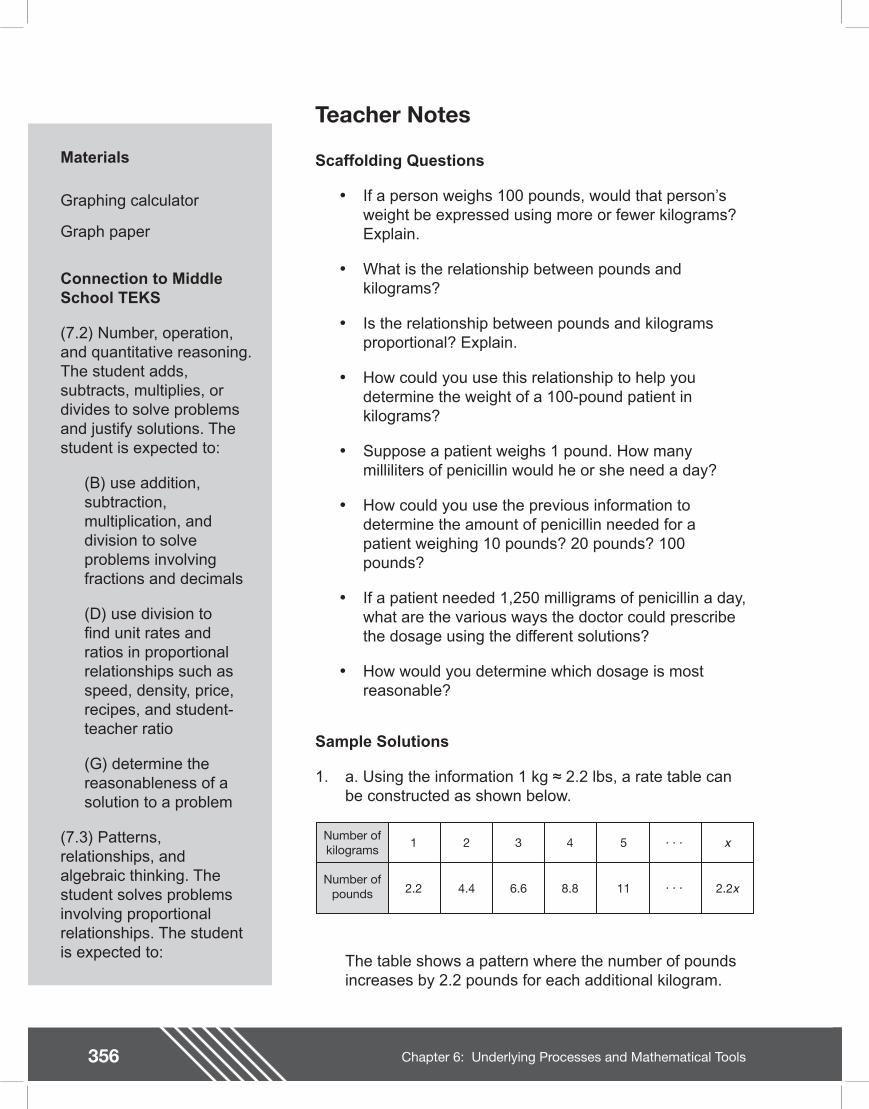
356 Chapter 6: Underlying Processes and Mathematical Tools
Teacher Notes
Materials
Graphing calculator
Graph paper
Connection to Middle School TEKS
(7.2) Number, operation, and quantitative reasoning. The student adds, subtracts, multiplies, or divides to solve problems and justify solutions. The student is expected to:
(B) use addition, subtraction, multiplication, and division to solve problems involving fractions and decimals
(D) use division to nd unit rates and ratios in proportional relationships such as speed, density, price, recipes, and student-teacher ratio
(G) determine the reasonableness of a solution to a problem
(7.3) Patterns, relationships, and algebraic thinking. The student solves problems involving proportional relationships. The student is expected to:
Scaffolding Questions
�• If a person weighs 100 pounds, would that person�’s weight be expressed using more or fewer kilograms? Explain.
�• What is the relationship between pounds and kilograms?
�• Is the relationship between pounds and kilograms proportional? Explain.
�• How could you use this relationship to help you determine the weight of a 100-pound patient in kilograms?
�• Suppose a patient weighs 1 pound. How many milliliters of penicillin would he or she need a day?
�• How could you use the previous information to determine the amount of penicillin needed for a patient weighing 10 pounds? 20 pounds? 100 pounds?
�• If a patient needed 1,250 milligrams of penicillin a day, what are the various ways the doctor could prescribe the dosage using the different solutions?
�• How would you determine which dosage is most reasonable?
Sample Solutions
1. a. Using the information 1 kg 2.2 lbs, a rate table can be constructed as shown below.
. . .
. . .
Number of kilograms
Number of pounds
1
2.2
2
4.4
3
6.6
4
8.8
5
11
x
2.2x
The table shows a pattern where the number of pounds increases by 2.2 pounds for each additional kilogram.
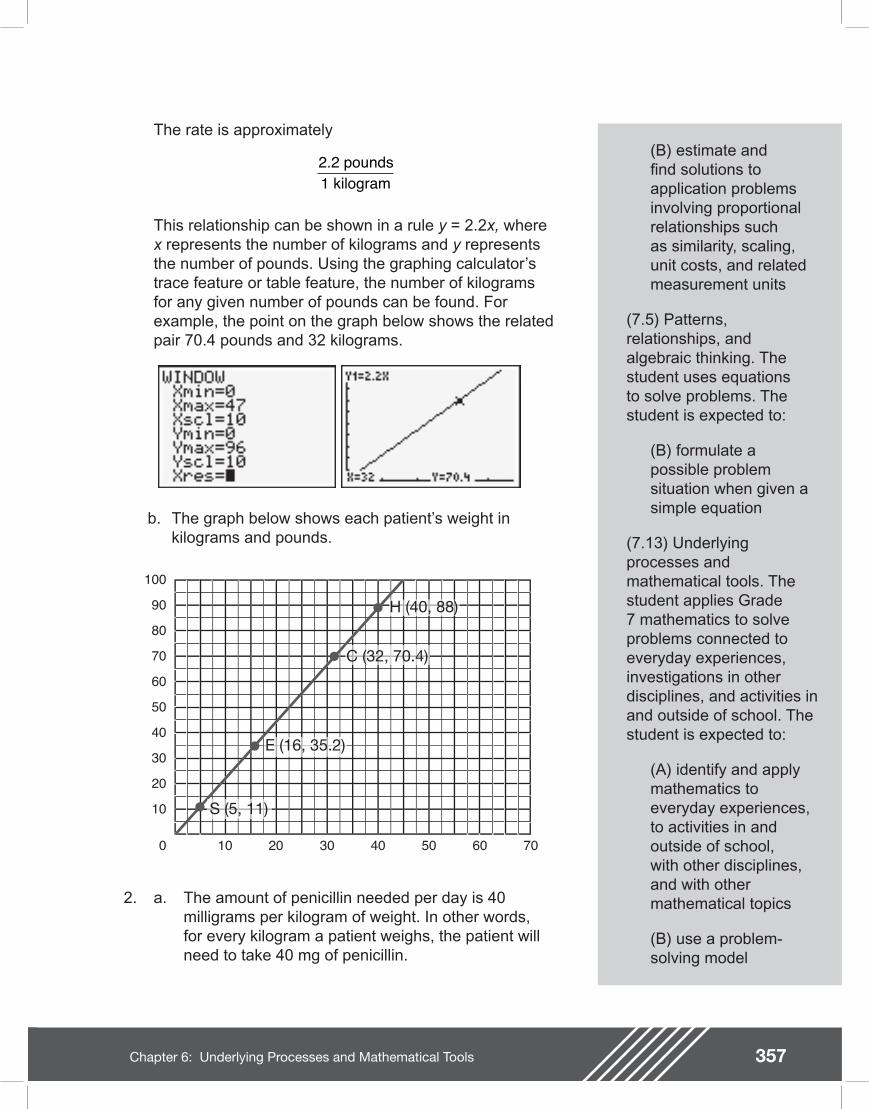
357Chapter 6: Underlying Processes and Mathematical Tools
(B) estimate and nd solutions to application problems involving proportional relationships such as similarity, scaling, unit costs, and related measurement units
(7.5) Patterns, relationships, and algebraic thinking. The student uses equations to solve problems. The student is expected to:
(B) formulate a possible problem situation when given a simple equation
(7.13) Underlying processes and mathematical tools. The student applies Grade 7 mathematics to solve problems connected to everyday experiences, investigations in other disciplines, and activities in and outside of school. The student is expected to:
(A) identify and apply mathematics to everyday experiences, to activities in and outside of school, with other disciplines, and with other mathematical topics
(B) use a problem-solving model
The rate is approximately
This relationship can be shown in a rule y = 2.2x, where x represents the number of kilograms and y represents the number of pounds. Using the graphing calculator�’s trace feature or table feature, the number of kilograms for any given number of pounds can be found. For example, the point on the graph below shows the related pair 70.4 pounds and 32 kilograms.
b. The graph below shows each patient�’s weight in kilograms and pounds.
2.2 pounds1 kilogram
30
10
20
60
40
50
90
70
80
100
10 3020 40 6050 700
S (5, 11)
E (16, 35.2)
C (32, 70.4)
H (40, 88)
2. a. The amount of penicillin needed per day is 40 milligrams per kilogram of weight. In other words, for every kilogram a patient weighs, the patient will need to take 40 mg of penicillin.
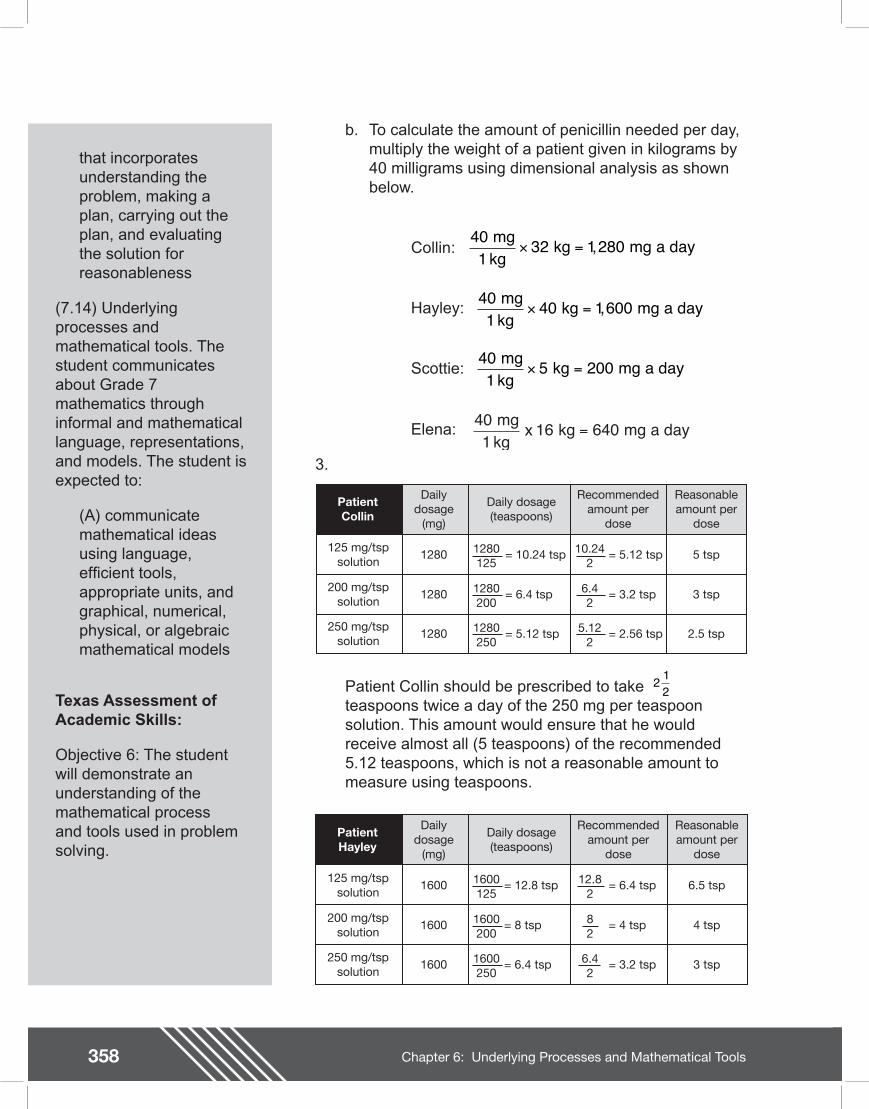
358 Chapter 6: Underlying Processes and Mathematical Tools
Teacher Notes
Patient Collin should be prescribed to take teaspoons twice a day of the 250 mg per teaspoon solution. This amount would ensure that he would receive almost all (5 teaspoons) of the recommended 5.12 teaspoons, which is not a reasonable amount to measure using teaspoons.
that incorporates understanding the problem, making a plan, carrying out the plan, and evaluating the solution for reasonableness
(7.14) Underlying processes and mathematical tools. The student communicates about Grade 7 mathematics through informal and mathematical language, representations, and models. The student is expected to:
(A) communicate mathematical ideas using language, ef cient tools, appropriate units, and graphical, numerical, physical, or algebraic mathematical models
Texas Assessment of Academic Skills:
Objective 6: The student will demonstrate an understanding of the mathematical process and tools used in problem solving.
b. To calculate the amount of penicillin needed per day, multiply the weight of a patient given in kilograms by 40 milligrams using dimensional analysis as shown below.
Collin:
Hayley:
Scottie:
Elena:
3.
401
32 1 280 mg kg
kg mg a day× = ,
401
40 1 600 mg kg
kg mg a day× = ,
401
5 200 mg kg
kg mg a day× =
401
16 640 mg kg
kg mg a day=x
2 12
PatientHayley
Dailydosage
(mg)
Daily dosage(teaspoons)
Recommendedamount per
dose
Reasonableamount per
dose
125 mg/tspsolution
200 mg/tspsolution
250 mg/tspsolution
1600
1600
1600
6.5 tsp
4 tsp
3 tsp
= 12.8 tsp
= 8 tsp
= 6.4 tsp
1600125
1600200
1600250
= 6.4 tsp
= 4 tsp
= 3.2 tsp
12.82
82
6.42
PatientCollin
Dailydosage
(mg)
Daily dosage(teaspoons)
Recommendedamount per
dose
Reasonableamount per
dose
125 mg/tspsolution
200 mg/tspsolution
250 mg/tspsolution
1280
1280
1280
5 tsp
3 tsp
2.5 tsp
= 10.24 tsp
= 6.4 tsp
= 5.12 tsp
1280125
1280200
1280250
= 5.12 tsp
= 3.2 tsp
= 2.56 tsp
10.242
6.42
5.122
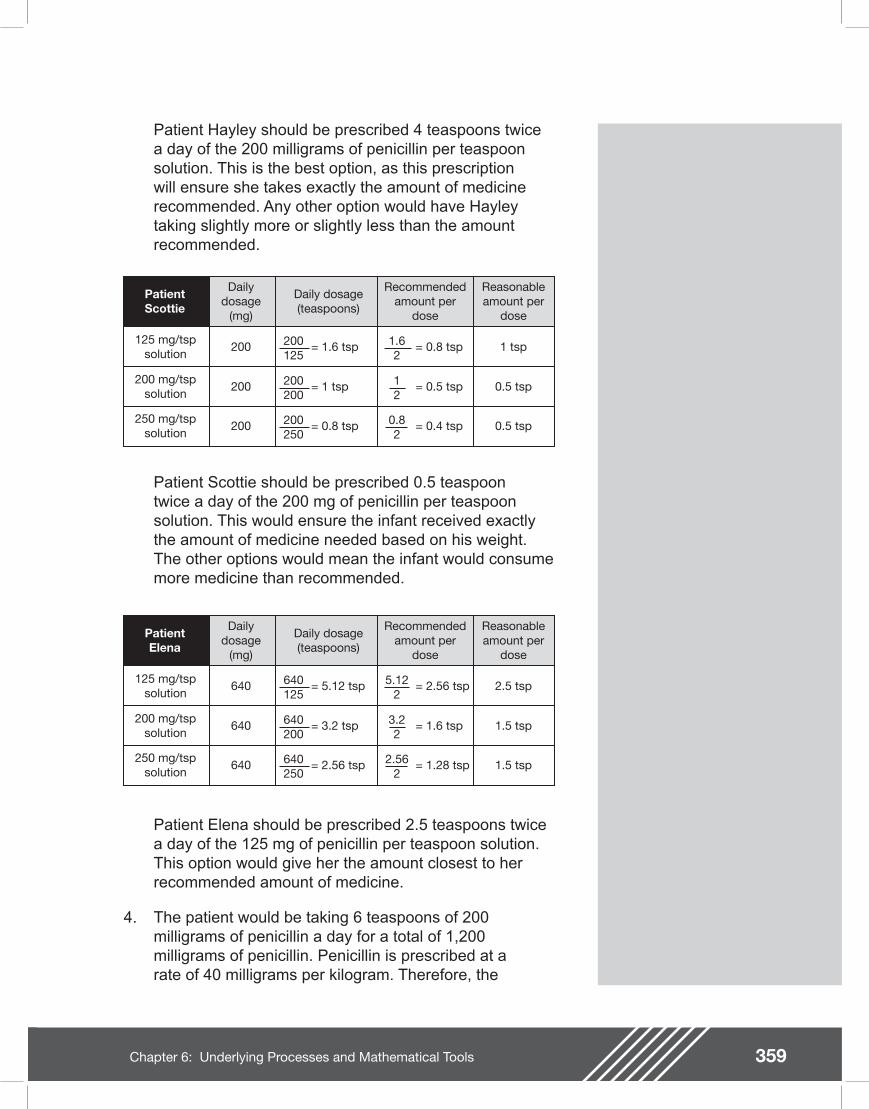
359Chapter 6: Underlying Processes and Mathematical Tools
Patient Hayley should be prescribed 4 teaspoons twice a day of the 200 milligrams of penicillin per teaspoon solution. This is the best option, as this prescription will ensure she takes exactly the amount of medicine recommended. Any other option would have Hayley taking slightly more or slightly less than the amount recommended.
PatientScottie
Dailydosage
(mg)
Daily dosage(teaspoons)
Recommendedamount per
dose
Reasonableamount per
dose
125 mg/tspsolution
200 mg/tspsolution
250 mg/tspsolution
200
200
200
1 tsp
0.5 tsp
0.5 tsp
= 1.6 tsp
= 1 tsp
= 0.8 tsp
200125
200200
200250
= 0.8 tsp
= 0.5 tsp
= 0.4 tsp
1.62
12
0.82
Patient Scottie should be prescribed 0.5 teaspoon twice a day of the 200 mg of penicillin per teaspoon solution. This would ensure the infant received exactly the amount of medicine needed based on his weight. The other options would mean the infant would consume more medicine than recommended.
PatientElena
Dailydosage
(mg)
Daily dosage(teaspoons)
Recommendedamount per
dose
Reasonableamount per
dose
125 mg/tspsolution
200 mg/tspsolution
250 mg/tspsolution
640
640
640
2.5 tsp
1.5 tsp
1.5 tsp
= 5.12 tsp
= 3.2 tsp
= 2.56 tsp
640125
640200
640250
= 2.56 tsp
= 1.6 tsp
= 1.28 tsp
5.122
3.22
2.562
Patient Elena should be prescribed 2.5 teaspoons twice a day of the 125 mg of penicillin per teaspoon solution. This option would give her the amount closest to her recommended amount of medicine.
4. The patient would be taking 6 teaspoons of 200 milligrams of penicillin a day for a total of 1,200 milligrams of penicillin. Penicillin is prescribed at a rate of 40 milligrams per kilogram. Therefore, the
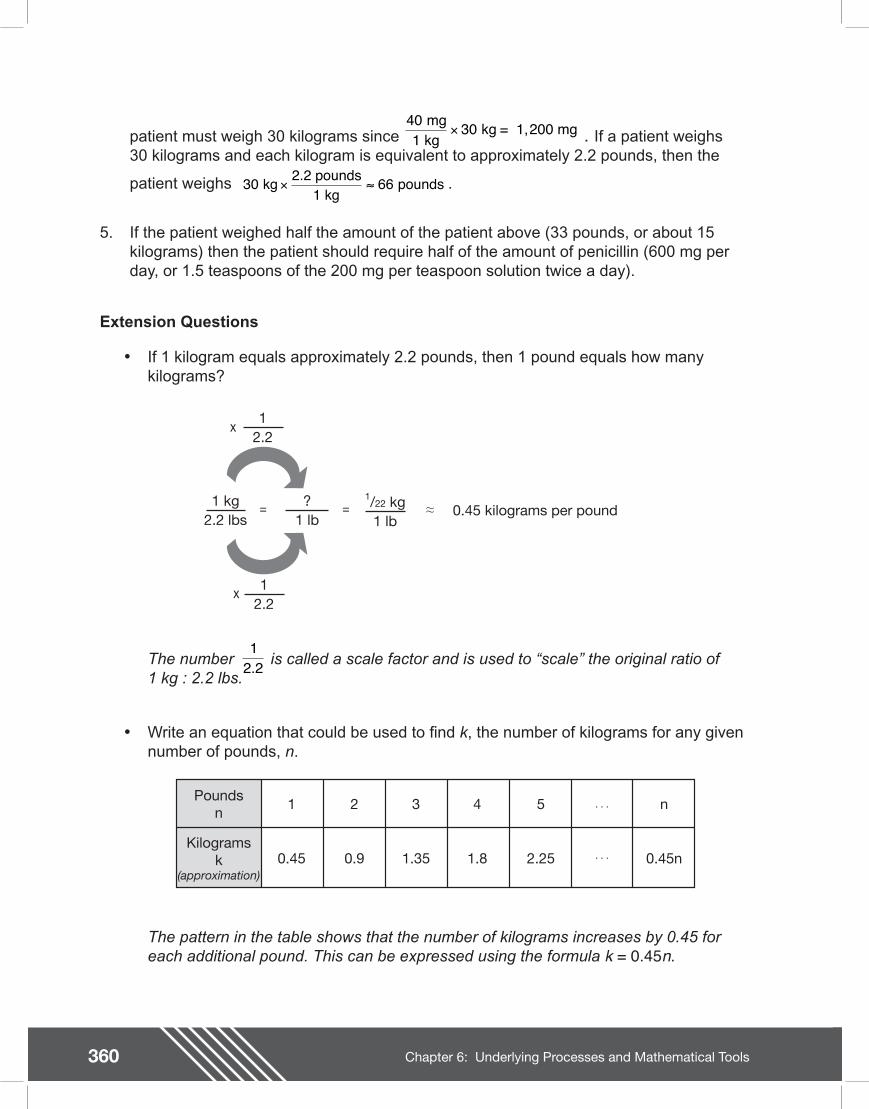
360 Chapter 6: Underlying Processes and Mathematical Tools
patient must weigh 30 kilograms since . If a patient weighs 30 kilograms and each kilogram is equivalent to approximately 2.2 pounds, then the
patient weighs .
5. If the patient weighed half the amount of the patient above (33 pounds, or about 15 kilograms) then the patient should require half of the amount of penicillin (600 mg per day, or 1.5 teaspoons of the 200 mg per teaspoon solution twice a day).
Extension Questions
�• If 1 kilogram equals approximately 2.2 pounds, then 1 pound equals how many kilograms?
40 30 mg1 kg
kg = 1,200 mg×
1 kg2.2 lbs
?1 lb
=1/22 kg
1 lb= 0.45 kilograms per pound
12.2
12.2
x
x
The number is called a scale factor and is used to �“scale�” the original ratio of 1 kg : 2.2 lbs.
�• Write an equation that could be used to nd k, the number of kilograms for any given number of pounds, n.
12 2.
. . .
. . .
Poundsn
Kilogramsk
(approximation)
1
0.45
2
0.9
3
1.35
4
1.8
5
2.25
n
0.45n
The pattern in the table shows that the number of kilograms increases by 0.45 for each additional pound. This can be expressed using the formula k = 0.45n.
30 66 kg 2.2 pounds1 kg
pounds×
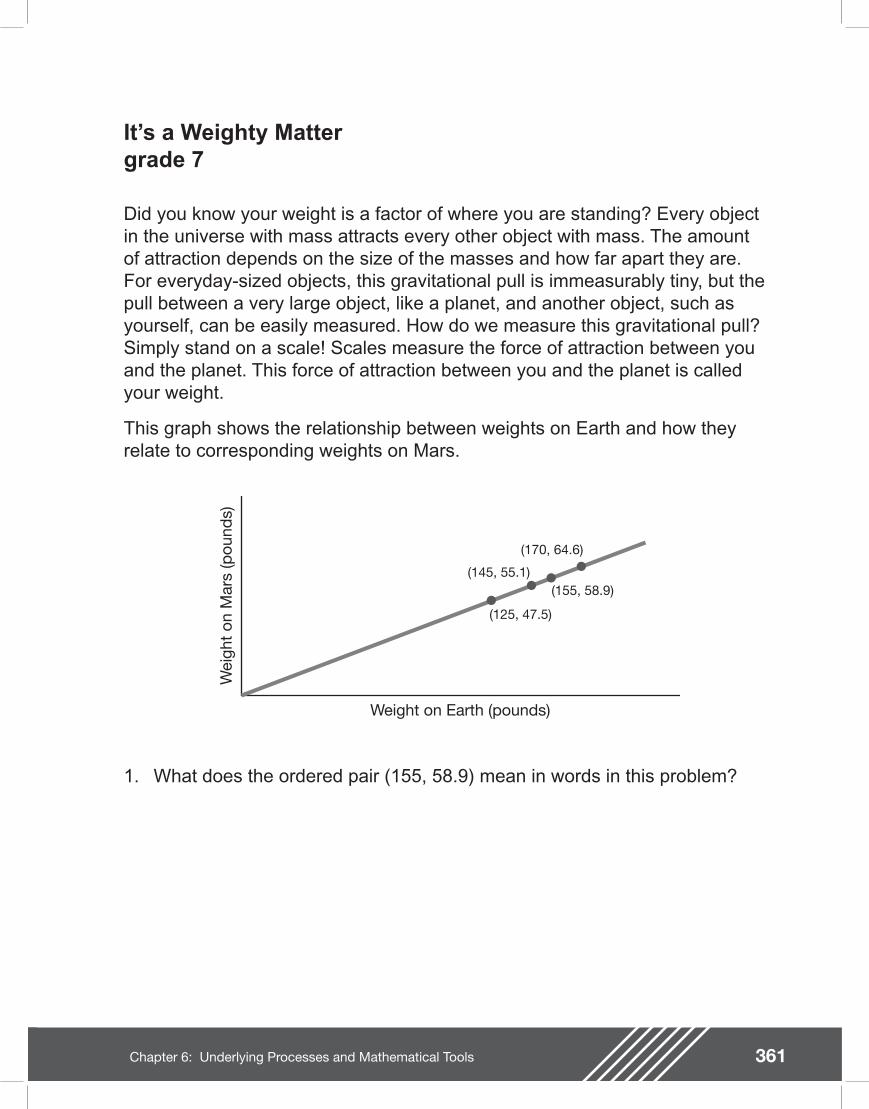
361Chapter 6: Underlying Processes and Mathematical Tools
It�’s a Weighty Mattergrade 7
Did you know your weight is a factor of where you are standing? Every object in the universe with mass attracts every other object with mass. The amount of attraction depends on the size of the masses and how far apart they are. For everyday-sized objects, this gravitational pull is immeasurably tiny, but the pull between a very large object, like a planet, and another object, such as yourself, can be easily measured. How do we measure this gravitational pull? Simply stand on a scale! Scales measure the force of attraction between you and the planet. This force of attraction between you and the planet is called your weight.
This graph shows the relationship between weights on Earth and how they relate to corresponding weights on Mars.
(125, 47.5)
(155, 58.9)
(170, 64.6)
(145, 55.1)
Weight on Earth (pounds)
Wei
ght
on M
ars
(pou
nds)
1. What does the ordered pair (155, 58.9) mean in words in this problem?
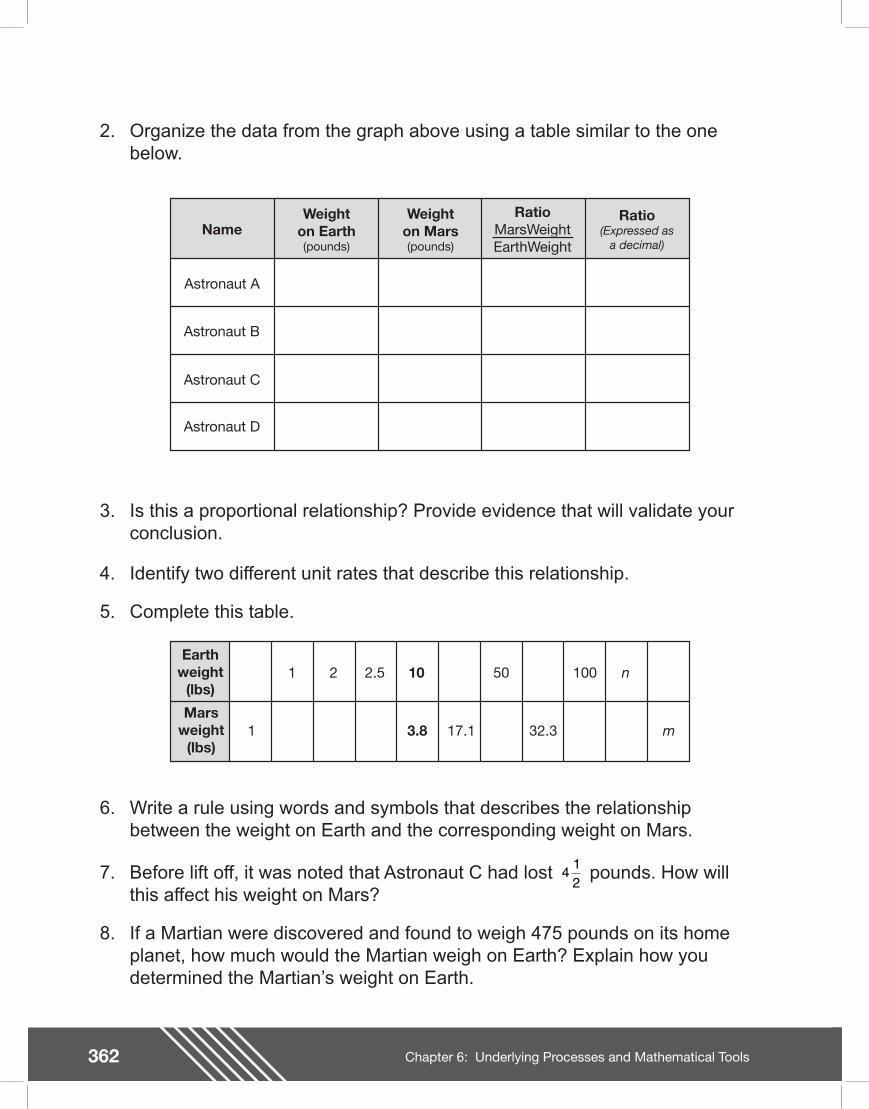
362 Chapter 6: Underlying Processes and Mathematical Tools
2. Organize the data from the graph above using a table similar to the one below.
NameWeight
on Earth(pounds)
Weighton Mars(pounds)
RatioMarsWeightEarthWeight
Ratio(Expressed as
a decimal)
Astronaut A
Astronaut B
Astronaut C
Astronaut D
3. Is this a proportional relationship? Provide evidence that will validate your conclusion.
4. Identify two different unit rates that describe this relationship.
5. Complete this table.
Marsweight
(lbs)
Earthweight
(lbs)
1
1 2 2.5
3.8
10
17.1
50
32.3
100 n
m
6. Write a rule using words and symbols that describes the relationship between the weight on Earth and the corresponding weight on Mars.
7. Before lift off, it was noted that Astronaut C had lost pounds. How will this affect his weight on Mars?
8. If a Martian were discovered and found to weigh 475 pounds on its home planet, how much would the Martian weigh on Earth? Explain how you determined the Martian�’s weight on Earth.
4 12

363Chapter 6: Underlying Processes and Mathematical Tools
364 Chapter 6: Underlying Processes and Mathematical Tools
Teacher NotesMaterials
Graphing calculator
Connections to Middle School TEKS
(7.2) Number, operation, and quantitative reasoning. The student adds, subtracts, multiplies, or divides to solve problems and justify solutions. The student is expected to:
(B) use addition, subtraction, multiplication, and division to solve problems involving fractions and decimals
(D) use division to nd unit rates and ratios in proportional relationships such as speed, density, price, recipes, and student-teacher ratio
(7.3) Patterns, relationships, and algebraic thinking. The student solves problems involving proportional relationships. The student is expected to:
(B) estimate and nd solutions to application problems involving proportional relationships such
Scaffolding Questions
�• What does the ratio weight on Mars : weight on Earth expressed as a decimal mean in this situation?
�• What do the unit rates mean in this situation?
�• Would you weigh more or less or Mars? Describe how your weight would change using a percentage (approximate).
�• What would be the weight of an object on Mars if it weighed 1 pound on Earth?
�• What would be the weight of an object on Earth if it weighed 1 pound on Mars?
�• How would the unit rates be helpful when completing the tables in problems 2 and 4?
�• How can some values in the tables help you think about other missing values in the table? For example, how could knowing 10 pounds on Earth is equivalent to 3.8 pounds on Mars be helpful in nding the weight on Mars related to 100 pounds on Earth? Or 50 pounds on Earth?
�• If Astronaut C lost 1 Earth pound, how would that change his weight on Mars?
Sample Solutions
1. The ordered pair (155, 58.9) means an object that weighs 155 pounds on Earth would weigh 58.9 pounds on Mars.
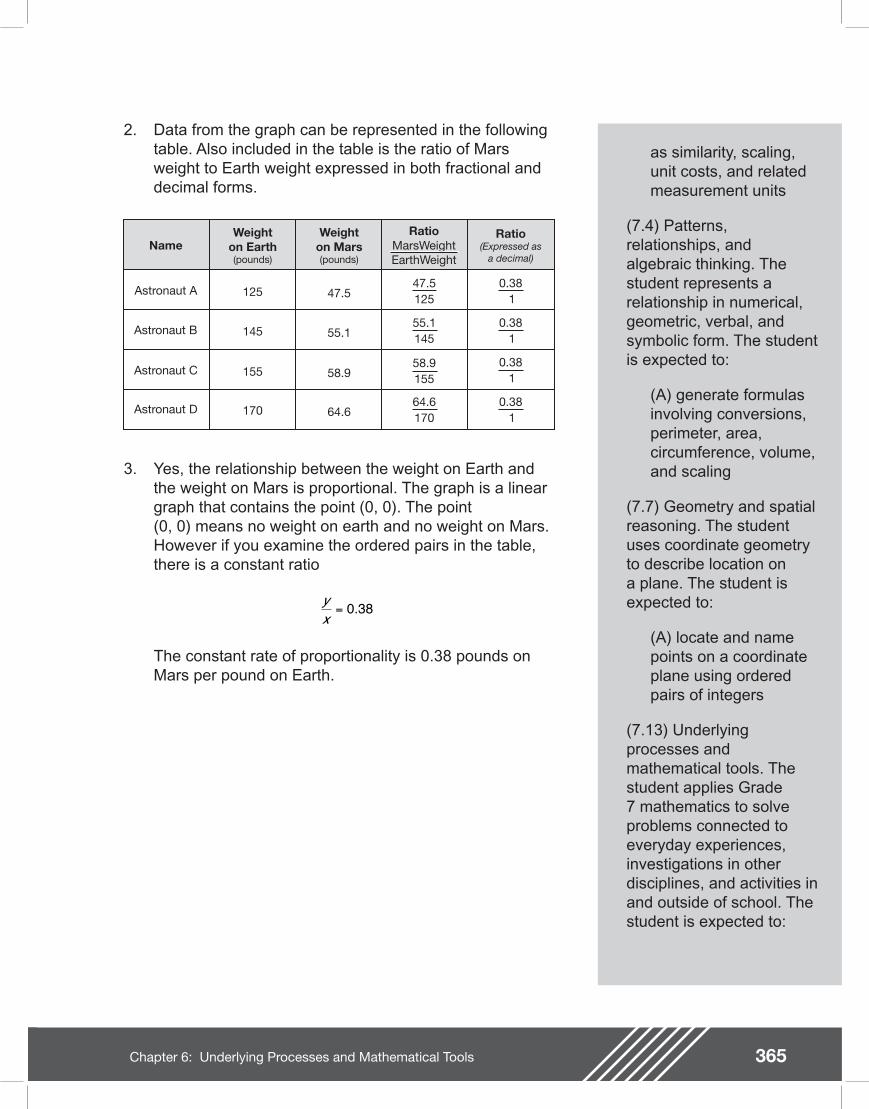
365Chapter 6: Underlying Processes and Mathematical Tools
as similarity, scaling, unit costs, and related measurement units
(7.4) Patterns, relationships, and algebraic thinking. The student represents a relationship in numerical, geometric, verbal, and symbolic form. The student is expected to:
(A) generate formulas involving conversions, perimeter, area, circumference, volume, and scaling
(7.7) Geometry and spatial reasoning. The student uses coordinate geometry to describe location on a plane. The student is expected to:
(A) locate and name points on a coordinate plane using ordered pairs of integers
(7.13) Underlying processes and mathematical tools. The student applies Grade 7 mathematics to solve problems connected to everyday experiences, investigations in other disciplines, and activities in and outside of school. The student is expected to:
NameWeight
on Earth(pounds)
Weighton Mars(pounds)
RatioMarsWeightEarthWeight
Ratio(Expressed as
a decimal)
Astronaut A
Astronaut B
Astronaut C
Astronaut D
125
145
155
170
47.5
55.1
58.9
64.6
0.381
47.5125
55.1145
58.9155
64.6170
0.381
0.381
0.381
2. Data from the graph can be represented in the following table. Also included in the table is the ratio of Mars weight to Earth weight expressed in both fractional and decimal forms.
3. Yes, the relationship between the weight on Earth and the weight on Mars is proportional. The graph is a linear graph that contains the point (0, 0). The point (0, 0) means no weight on earth and no weight on Mars. However if you examine the ordered pairs in the table, there is a constant ratio
The constant rate of proportionality is 0.38 pounds on Mars per pound on Earth.
yx
= 0 38.
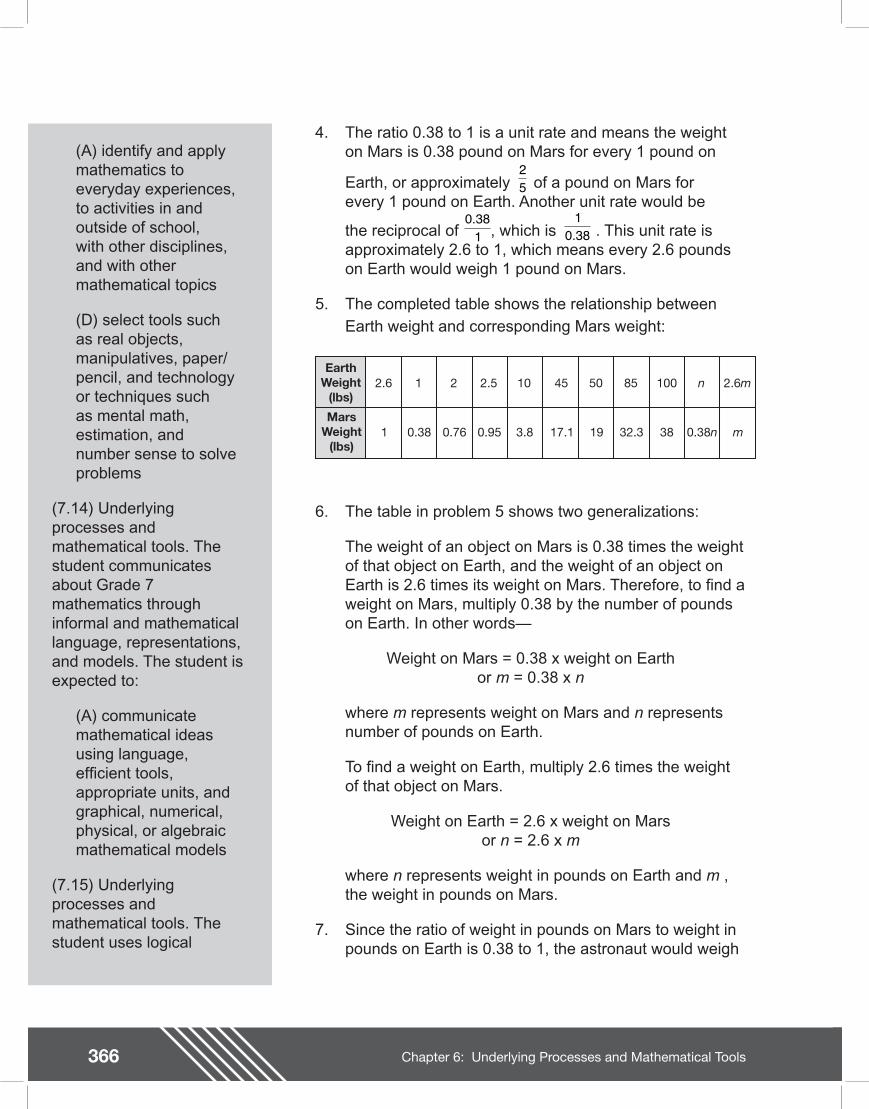
366 Chapter 6: Underlying Processes and Mathematical Tools
Teacher Notes(A) identify and apply mathematics to everyday experiences, to activities in and outside of school, with other disciplines, and with other mathematical topics
(D) select tools such as real objects, manipulatives, paper/pencil, and technology or techniques such as mental math, estimation, and number sense to solve problems
(7.14) Underlying processes and mathematical tools. The student communicates about Grade 7 mathematics through informal and mathematical language, representations, and models. The student is expected to:
(A) communicate mathematical ideas using language, ef cient tools, appropriate units, and graphical, numerical, physical, or algebraic mathematical models
(7.15) Underlying processes and mathematical tools. The student uses logical
4. The ratio 0.38 to 1 is a unit rate and means the weight on Mars is 0.38 pound on Mars for every 1 pound on
Earth, or approximately of a pound on Mars for every 1 pound on Earth. Another unit rate would be
the reciprocal of , which is . This unit rate is approximately 2.6 to 1, which means every 2.6 pounds on Earth would weigh 1 pound on Mars.
5. The completed table shows the relationship between Earth weight and corresponding Mars weight:
25
0 381. 1
0 38.
MarsWeight
(lbs)
EarthWeight
(lbs)
1
2.6
0.38
1
0.76
2
0.95
2.5
3.8
10
17.1
45
19
50
32.3
85
38
100
0.38n
n
m
2.6m
6. The table in problem 5 shows two generalizations:
The weight of an object on Mars is 0.38 times the weight of that object on Earth, and the weight of an object on Earth is 2.6 times its weight on Mars. Therefore, to nd a weight on Mars, multiply 0.38 by the number of pounds on Earth. In other words�—
Weight on Mars = 0.38 x weight on Earthor m = 0.38 x n
where m represents weight on Mars and n represents number of pounds on Earth.
To nd a weight on Earth, multiply 2.6 times the weight of that object on Mars.
Weight on Earth = 2.6 x weight on Marsor n = 2.6 x m
where n represents weight in pounds on Earth and m , the weight in pounds on Mars.
7. Since the ratio of weight in pounds on Mars to weight in pounds on Earth is 0.38 to 1, the astronaut would weigh
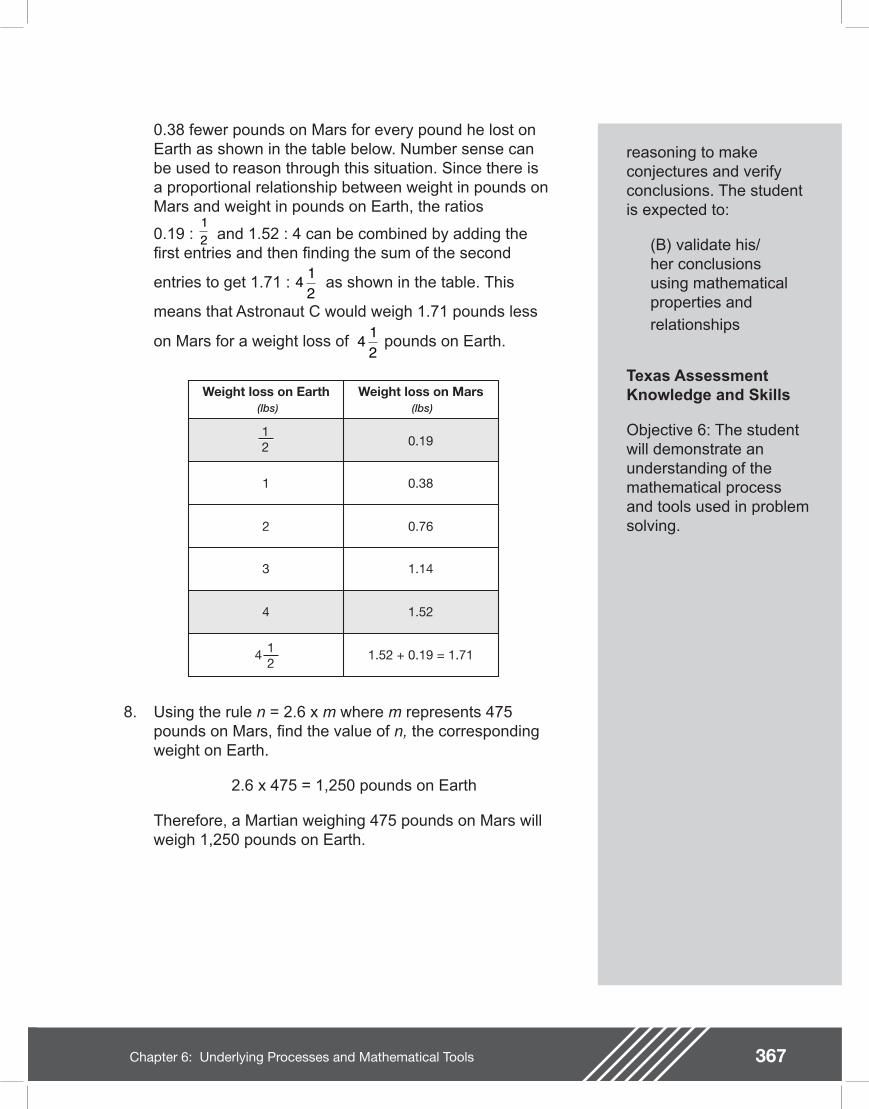
367Chapter 6: Underlying Processes and Mathematical Tools
reasoning to make conjectures and verify conclusions. The student is expected to:
(B) validate his/her conclusions using mathematical properties and relationships
Texas Assessment Knowledge and Skills
Objective 6: The student will demonstrate an understanding of the mathematical process and tools used in problem solving.
0.38 fewer pounds on Mars for every pound he lost on Earth as shown in the table below. Number sense can be used to reason through this situation. Since there is a proportional relationship between weight in pounds on Mars and weight in pounds on Earth, the ratios
0.19 : and 1.52 : 4 can be combined by adding the rst entries and then nding the sum of the second
entries to get 1.71 : as shown in the table. This
means that Astronaut C would weigh 1.71 pounds less
on Mars for a weight loss of pounds on Earth.
12
4 12
Weight loss on Earth Weight loss on Mars(lbs) (lbs)
12
12
0.19
0.381
0.762
1.143
1.524
1.52 + 0.19 = 1.714
8. Using the rule n = 2.6 x m where m represents 475 pounds on Mars, nd the value of n, the corresponding weight on Earth.
2.6 x 475 = 1,250 pounds on Earth
Therefore, a Martian weighing 475 pounds on Mars will weigh 1,250 pounds on Earth.
4 12
368 Chapter 6: Underlying Processes and Mathematical Tools
Extension Questions
�• Does it seem reasonable that the ordered pair (150, 80) would belong on this graph? Explain your reasoning.
No, it is not reasonable for the ordered pair (150, 80) to be a pair of related weights when comparing Earth to Mars. Using the ratio 0.38 pounds on Mars to 1 pound on Earth means that a weight on Mars is approximately 40% the weight on Earth. This ordered pair is relating 80 pounds on Mars to 150 pounds on Earth and 80 is more than 50% of 150.
�• Without using a calculator, estimate the missing value for the ordered pair (200, __).
If an object weighs 200 pounds on Earth, it should weigh about of that weight
on Mars. Using mental math, of 100 is 40, so of 200 is 80. An object on Earth weighing 200 pounds would weigh slightly less than 80 pounds on Mars; therefore, the ordered pair could be (200, 78).
�• Without using a calculator, estimate the missing value for the ordered pair (__, 400).
The ratio 0.38 pounds on Mars to 1 pound on Earth can be expressed as 0.40 : 1 or
: 1 and shows that the weight on Mars is the weight on Earth. Therefore, the
400 pounds on Mars is about of the weight on Earth. Using mental math, if 400
is of Earth�’s weight, then would be 200. If is 200, then or 100% is 1,000. If an object weighed 400 pounds on Mars, then its weight would be approximately 1,000 pounds on Earth.
�• What would an ounce of chocolate weigh on Mars?
The ratio of weight on Mars to weight on Earth is 0.38 to 1. This ratio will hold regardless of the units being measured. An ounce of chocolate on Earth would weigh 0.38 ounces on Mars.
252
525
25
25
252
515
15
55
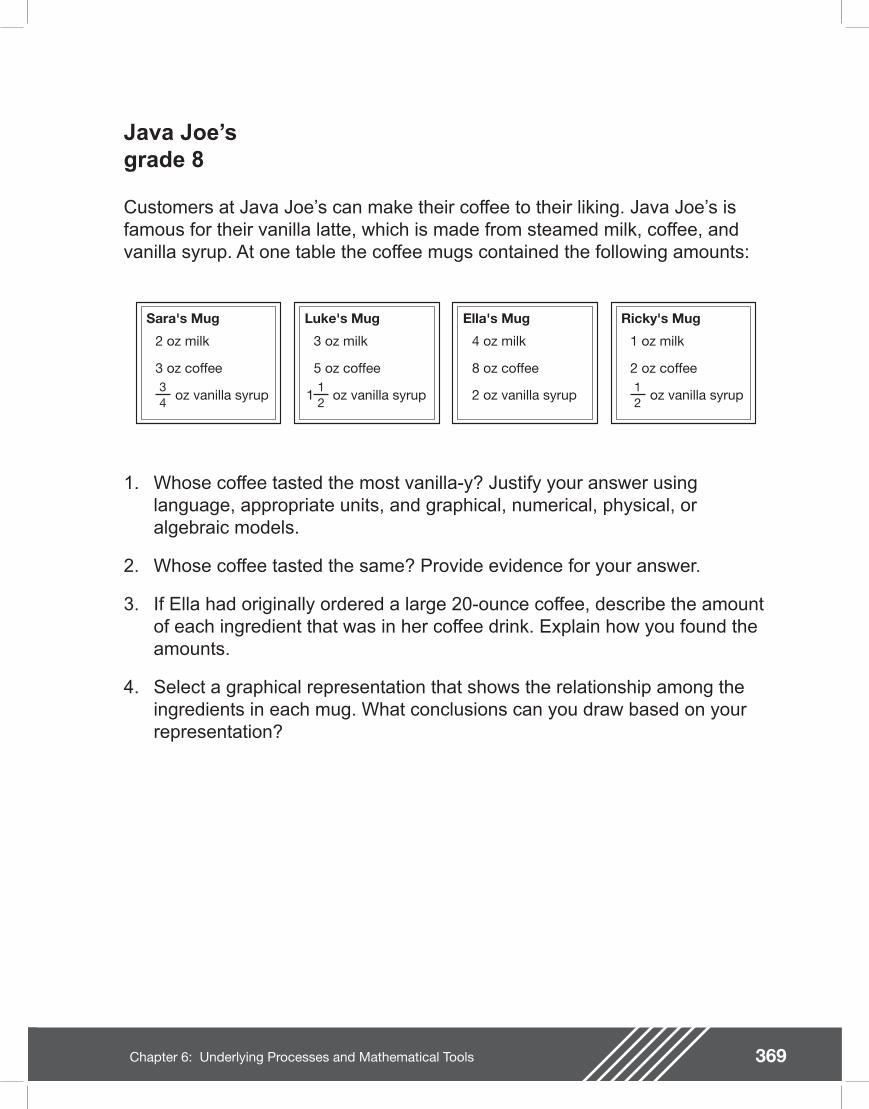
369Chapter 6: Underlying Processes and Mathematical Tools
Java Joe�’sgrade 8
Customers at Java Joe�’s can make their coffee to their liking. Java Joe�’s is famous for their vanilla latte, which is made from steamed milk, coffee, and vanilla syrup. At one table the coffee mugs contained the following amounts:
Sara's Mug
2 oz milk
3 oz coffee
oz vanilla syrup34
Luke's Mug
3 oz milk
5 oz coffee
1 oz vanilla syrup12
Ella's Mug
4 oz milk
8 oz coffee
2 oz vanilla syrup
Ricky's Mug
1 oz milk
2 oz coffee
oz vanilla syrup12
1. Whose coffee tasted the most vanilla-y? Justify your answer using language, appropriate units, and graphical, numerical, physical, or algebraic models.
2. Whose coffee tasted the same? Provide evidence for your answer.
3. If Ella had originally ordered a large 20-ounce coffee, describe the amount of each ingredient that was in her coffee drink. Explain how you found the amounts.
4. Select a graphical representation that shows the relationship among the ingredients in each mug. What conclusions can you draw based on your representation?
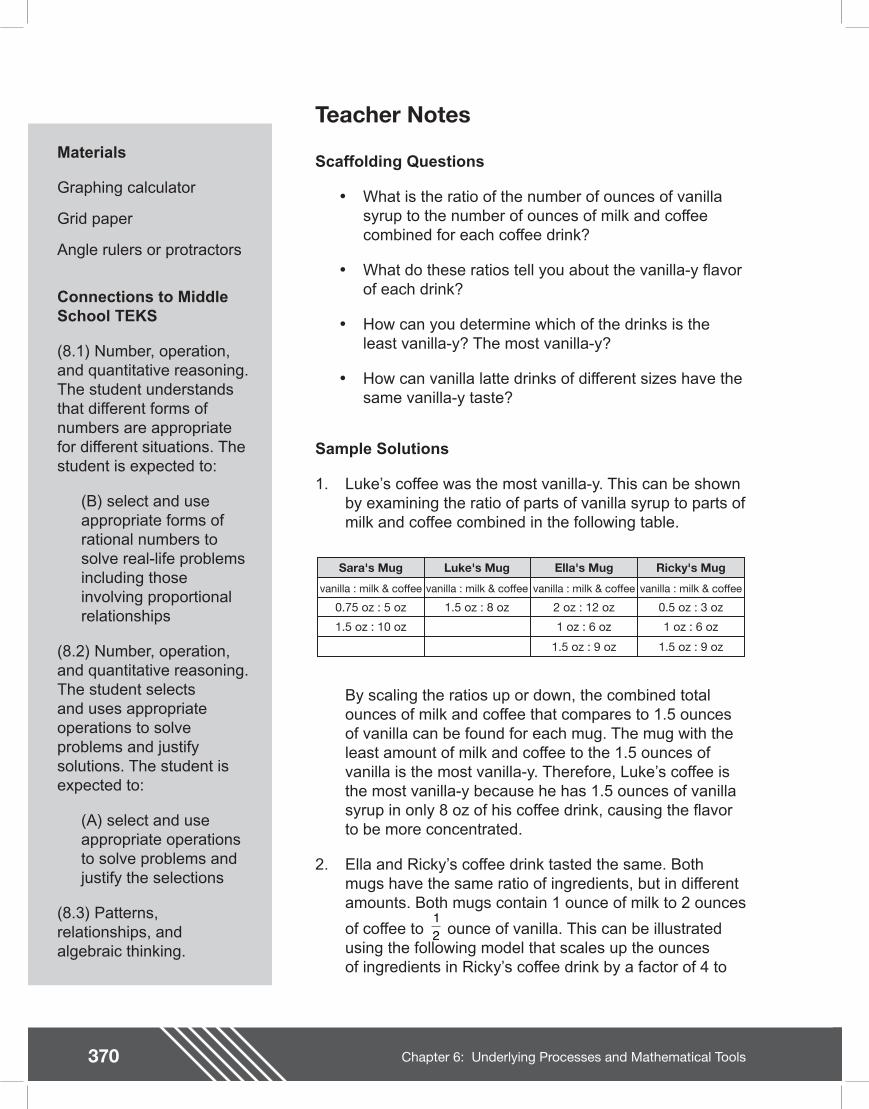
370 Chapter 6: Underlying Processes and Mathematical Tools
Teacher NotesMaterials
Graphing calculator
Grid paper
Angle rulers or protractors
Connections to Middle School TEKS
(8.1) Number, operation, and quantitative reasoning. The student understands that different forms of numbers are appropriate for different situations. The student is expected to:
(B) select and use appropriate forms of rational numbers to solve real-life problems including those involving proportional relationships
(8.2) Number, operation, and quantitative reasoning. The student selects and uses appropriate operations to solve problems and justify solutions. The student is expected to:
(A) select and use appropriate operations to solve problems and justify the selections
(8.3) Patterns, relationships, and algebraic thinking.
Scaffolding Questions
�• What is the ratio of the number of ounces of vanilla syrup to the number of ounces of milk and coffee combined for each coffee drink?
�• What do these ratios tell you about the vanilla-y avor of each drink?
�• How can you determine which of the drinks is the least vanilla-y? The most vanilla-y?
�• How can vanilla latte drinks of different sizes have the same vanilla-y taste?
Sample Solutions
1. Luke�’s coffee was the most vanilla-y. This can be shown by examining the ratio of parts of vanilla syrup to parts of milk and coffee combined in the following table.
Sara's Mug
vanilla : milk & coffee
0.75 oz : 5 oz
1.5 oz : 10 oz
Luke's Mug
vanilla : milk & coffee
1.5 oz : 8 oz
Ella's Mug
vanilla : milk & coffee
2 oz : 12 oz
1 oz : 6 oz
1.5 oz : 9 oz 1.5 oz : 9 oz
Ricky's Mug
vanilla : milk & coffee
0.5 oz : 3 oz
1 oz : 6 oz
By scaling the ratios up or down, the combined total ounces of milk and coffee that compares to 1.5 ounces of vanilla can be found for each mug. The mug with the least amount of milk and coffee to the 1.5 ounces of vanilla is the most vanilla-y. Therefore, Luke�’s coffee is the most vanilla-y because he has 1.5 ounces of vanilla syrup in only 8 oz of his coffee drink, causing the avor to be more concentrated.
2. Ella and Ricky�’s coffee drink tasted the same. Both mugs have the same ratio of ingredients, but in different amounts. Both mugs contain 1 ounce of milk to 2 ounces
of coffee to ounce of vanilla. This can be illustrated using the following model that scales up the ounces of ingredients in Ricky�’s coffee drink by a factor of 4 to
12
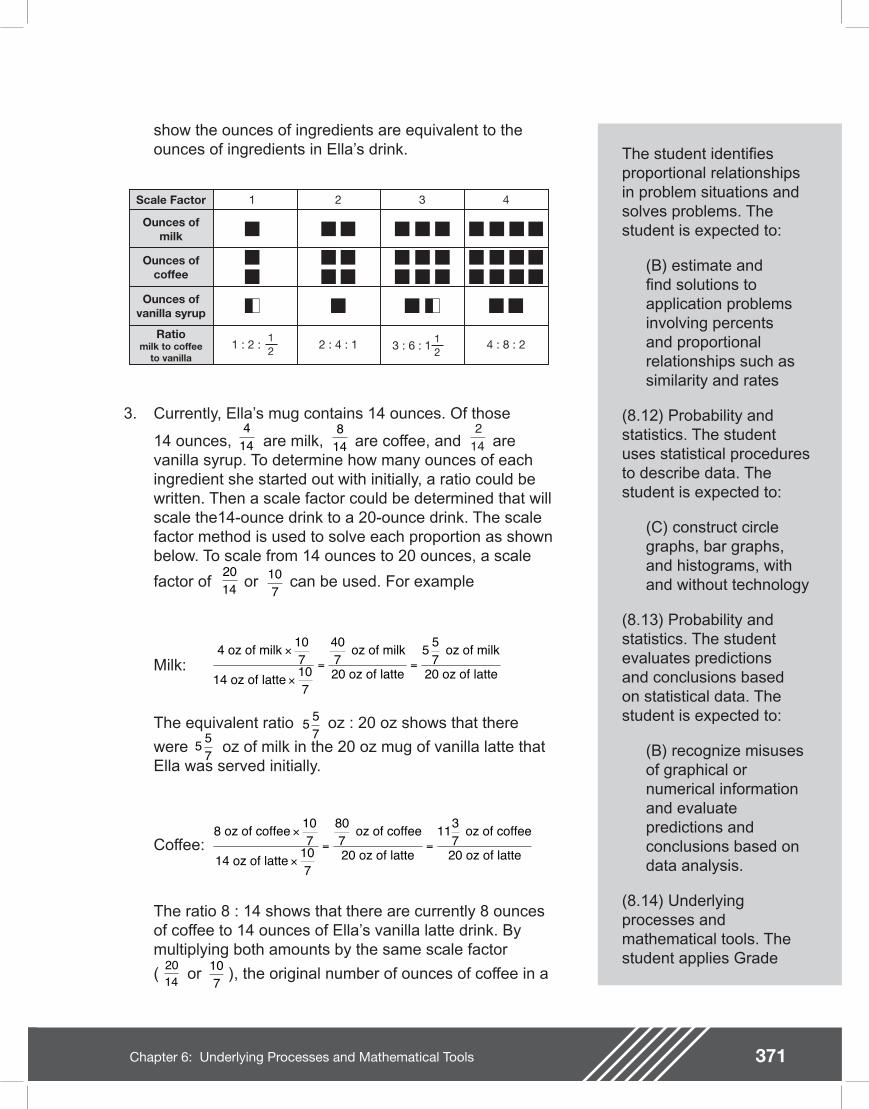
371Chapter 6: Underlying Processes and Mathematical Tools
The ratio 8 : 14 shows that there are currently 8 ounces of coffee to 14 ounces of Ella�’s vanilla latte drink. By multiplying both amounts by the same scale factor
( or ), the original number of ounces of coffee in a
The student identi es proportional relationships in problem situations and solves problems. The student is expected to:
(B) estimate and nd solutions to application problems involving percents and proportional relationships such as similarity and rates
(8.12) Probability and statistics. The student uses statistical procedures to describe data. The student is expected to:
(C) construct circle graphs, bar graphs, and histograms, with and without technology
(8.13) Probability and statistics. The student evaluates predictions and conclusions based on statistical data. The student is expected to:
(B) recognize misuses of graphical or numerical information and evaluate predictions and conclusions based on data analysis.
(8.14) Underlying processes and mathematical tools. The student applies Grade
show the ounces of ingredients are equivalent to the ounces of ingredients in Ella�’s drink.
Scale Factor
Ounces ofmilk
Ounces ofcoffee
Ounces ofvanilla syrup
Ratiomilk to coffee
to vanilla
1 2 3 4
2 : 4 : 1 4 : 8 : 23 : 6 : 112
1 : 2 :12
3. Currently, Ella�’s mug contains 14 ounces. Of those
14 ounces, are milk, are coffee, and are vanilla syrup. To determine how many ounces of each ingredient she started out with initially, a ratio could be written. Then a scale factor could be determined that will scale the14-ounce drink to a 20-ounce drink. The scale factor method is used to solve each proportion as shown below. To scale from 14 ounces to 20 ounces, a scale
factor of or can be used. For example
Milk:
The equivalent ratio oz : 20 oz shows that there
were oz of milk in the 20 oz mug of vanilla latte that Ella was served initially.
Coffee:
414
814
214
2014
107
4 oz of milk 107
14 oz of latte 107
407
oz of milk
20 oz of latte
5 57
oz of milk
20 oz of latte
×
×= =
5 57
5 57
8 oz of coffee 107
14 oz of latte 107
807
oz of coffee
20 oz of latte
1137
oz of coffee
20 oz of latte
×
×= =
107
2014
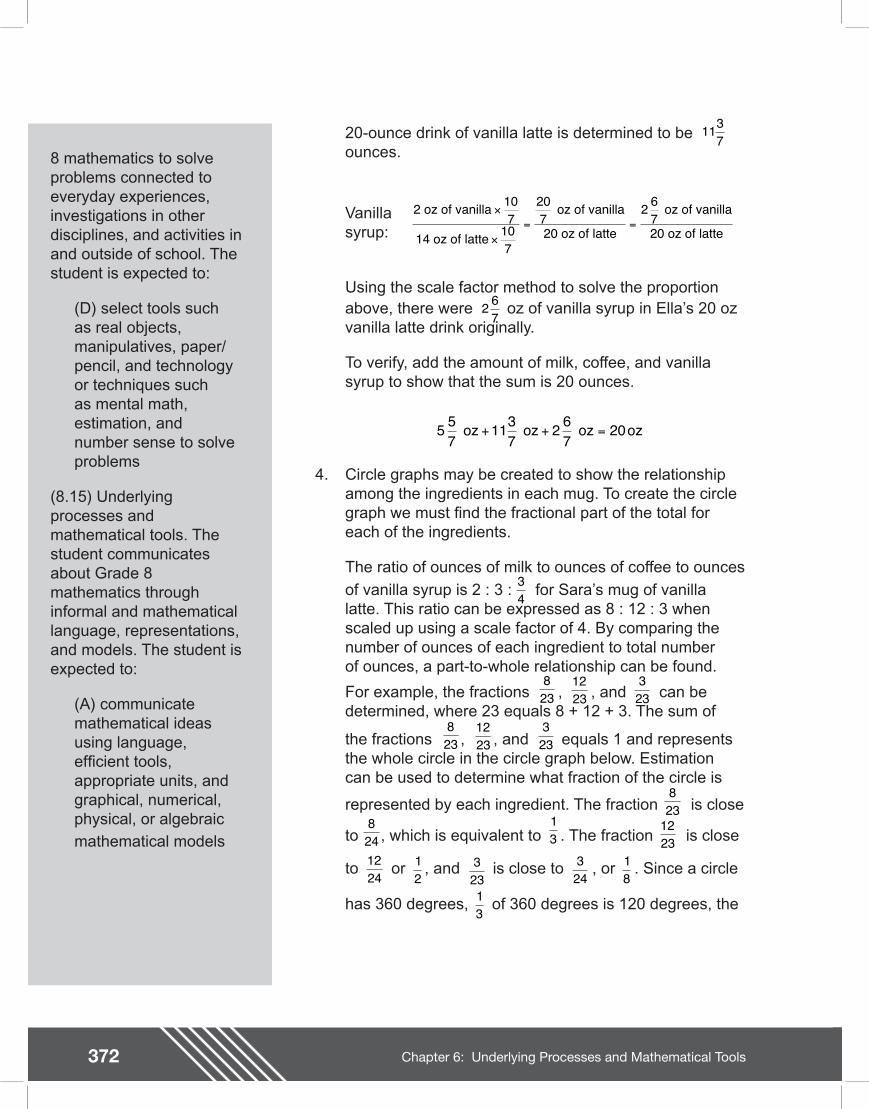
372 Chapter 6: Underlying Processes and Mathematical Tools
Teacher Notes
8 mathematics to solve problems connected to everyday experiences, investigations in other disciplines, and activities in and outside of school. The student is expected to:
(D) select tools such as real objects, manipulatives, paper/pencil, and technology or techniques such as mental math, estimation, and number sense to solve problems
(8.15) Underlying processes and mathematical tools. The student communicates about Grade 8 mathematics through informal and mathematical language, representations, and models. The student is expected to:
(A) communicate mathematical ideas using language, ef cient tools, appropriate units, and graphical, numerical, physical, or algebraic mathematical models
20-ounce drink of vanilla latte is determined to be ounces.
Vanillasyrup:
Using the scale factor method to solve the proportion above, there were oz of vanilla syrup in Ella�’s 20 oz vanilla latte drink originally.
To verify, add the amount of milk, coffee, and vanilla syrup to show that the sum is 20 ounces.
4. Circle graphs may be created to show the relationship among the ingredients in each mug. To create the circle graph we must nd the fractional part of the total for each of the ingredients.
The ratio of ounces of milk to ounces of coffee to ounces
of vanilla syrup is 2 : 3 : for Sara�’s mug of vanilla latte. This ratio can be expressed as 8 : 12 : 3 when scaled up using a scale factor of 4. By comparing the number of ounces of each ingredient to total number of ounces, a part-to-whole relationship can be found.
For example, the fractions , , and can be determined, where 23 equals 8 + 12 + 3. The sum of
the fractions , , and equals 1 and represents the whole circle in the circle graph below. Estimation can be used to determine what fraction of the circle is
represented by each ingredient. The fraction is close
to , which is equivalent to . The fraction is close
1137
2 oz of vanilla 107
14 oz of latte 107
207
oz of vanilla
20 oz of latte
2 67
oz of vanilla
20 oz of latte
×
×= =
2 67
5 57
1137
2 67
20 oz oz oz+ + = oz
34
823
1223
323
823
1223
323
823
824
to or , and is close to , or . Since a circle
has 360 degrees, of 360 degrees is 120 degrees, the
13
1223
1224
12
323
324
18
13
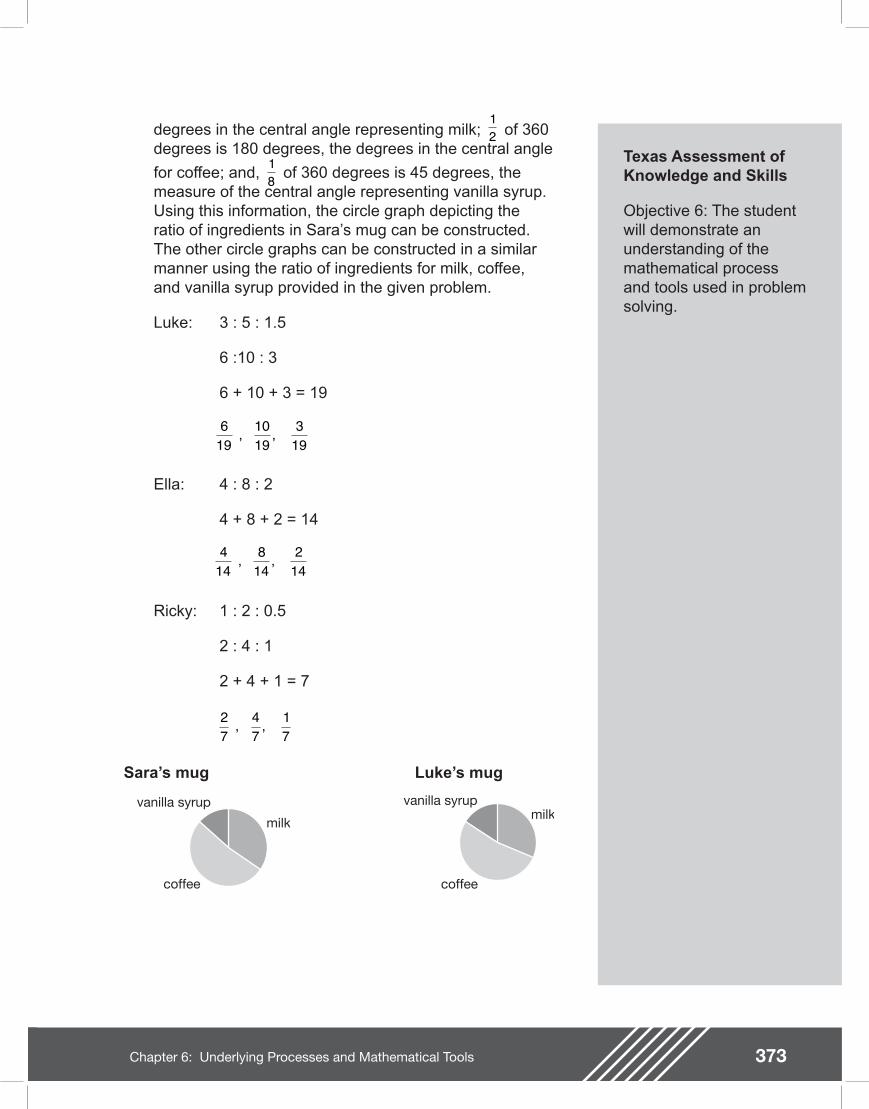
373Chapter 6: Underlying Processes and Mathematical Tools
Texas Assessment of Knowledge and Skills
Objective 6: The student will demonstrate an understanding of the mathematical process and tools used in problem solving.
degrees in the central angle representing milk; of 360 degrees is 180 degrees, the degrees in the central angle
for coffee; and, of 360 degrees is 45 degrees, the measure of the central angle representing vanilla syrup. Using this information, the circle graph depicting the ratio of ingredients in Sara�’s mug can be constructed. The other circle graphs can be constructed in a similar manner using the ratio of ingredients for milk, coffee, and vanilla syrup provided in the given problem.
Luke: 3 : 5 : 1.5
6 :10 : 3
6 + 10 + 3 = 19
Ella: 4 : 8 : 2
4 + 8 + 2 = 14
Ricky: 1 : 2 : 0.5
2 : 4 : 1
2 + 4 + 1 = 7
Sara�’s mug Luke�’s mug
12
18
619
1019
319
, ,
414
814
214
, ,
27
47
17
, ,
milk
coffee
vanilla syrupmilk
coffee
vanilla syrup
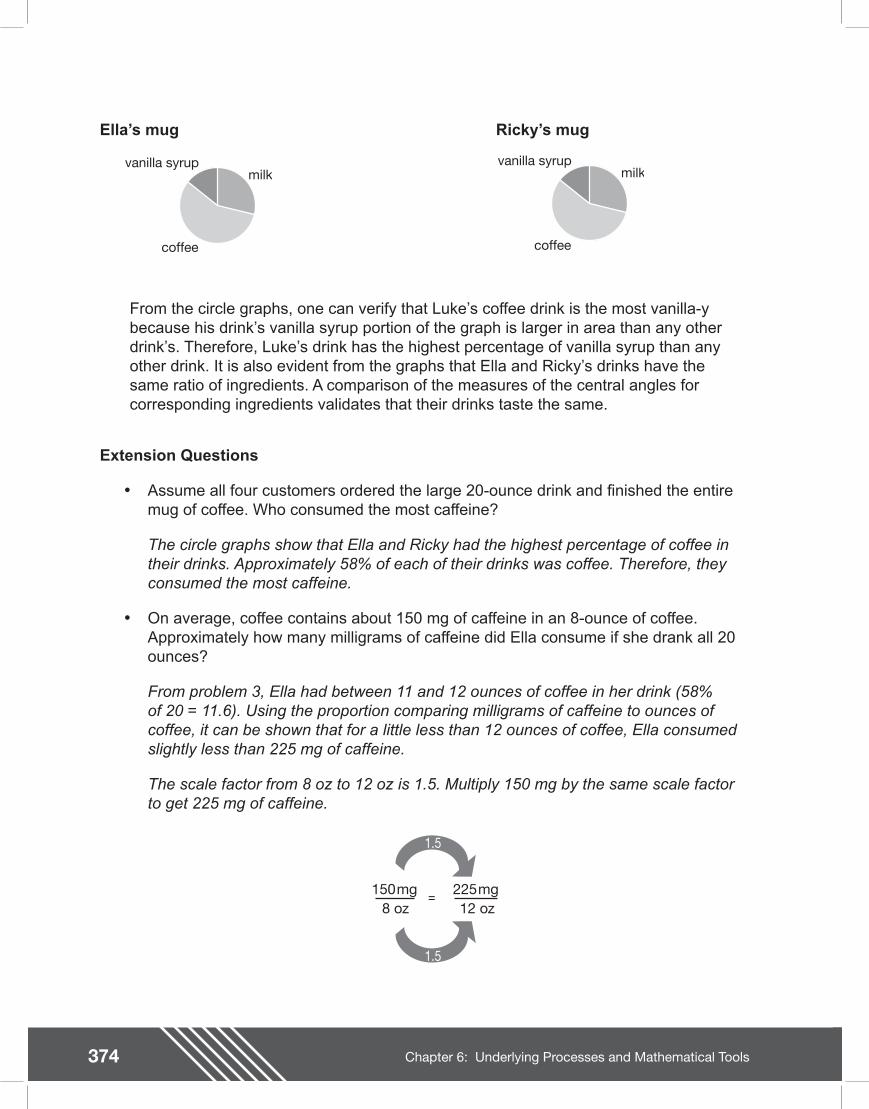
374 Chapter 6: Underlying Processes and Mathematical Tools
Ella�’s mug Ricky�’s mug
milk
coffee
vanilla syrupmilk
coffee
vanilla syrup
From the circle graphs, one can verify that Luke�’s coffee drink is the most vanilla-y because his drink�’s vanilla syrup portion of the graph is larger in area than any other drink�’s. Therefore, Luke�’s drink has the highest percentage of vanilla syrup than any other drink. It is also evident from the graphs that Ella and Ricky�’s drinks have the same ratio of ingredients. A comparison of the measures of the central angles for corresponding ingredients validates that their drinks taste the same.
Extension Questions
�• Assume all four customers ordered the large 20-ounce drink and nished the entire mug of coffee. Who consumed the most caffeine?
The circle graphs show that Ella and Ricky had the highest percentage of coffee in their drinks. Approximately 58% of each of their drinks was coffee. Therefore, they consumed the most caffeine.
�• On average, coffee contains about 150 mg of caffeine in an 8-ounce of coffee. Approximately how many milligrams of caffeine did Ella consume if she drank all 20 ounces?
From problem 3, Ella had between 11 and 12 ounces of coffee in her drink (58% of 20 = 11.6). Using the proportion comparing milligrams of caffeine to ounces of coffee, it can be shown that for a little less than 12 ounces of coffee, Ella consumed slightly less than 225 mg of caffeine.
The scale factor from 8 oz to 12 oz is 1.5. Multiply 150 mg by the same scale factor to get 225 mg of caffeine.
1.5
1.5
150 mg8 oz
225 mg12 oz
=
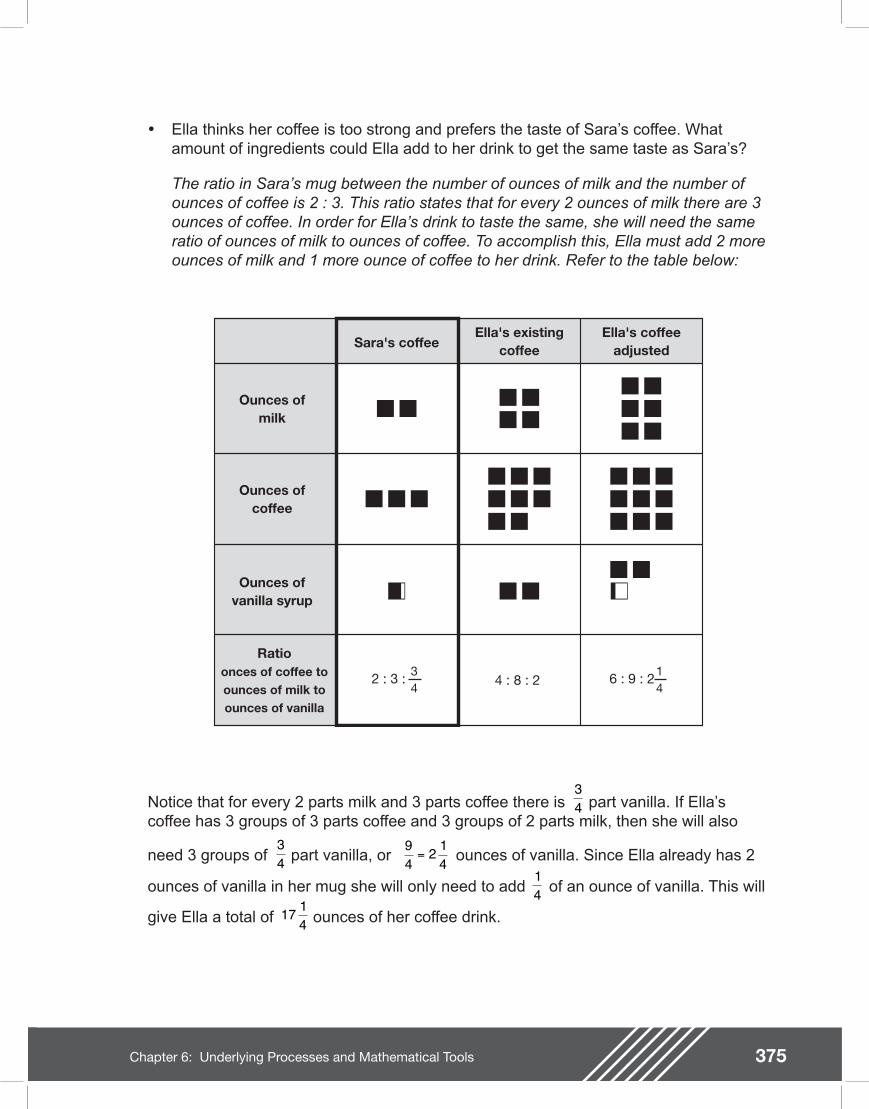
375Chapter 6: Underlying Processes and Mathematical Tools
�• Ella thinks her coffee is too strong and prefers the taste of Sara�’s coffee. What amount of ingredients could Ella add to her drink to get the same taste as Sara�’s?
The ratio in Sara�’s mug between the number of ounces of milk and the number of ounces of coffee is 2 : 3. This ratio states that for every 2 ounces of milk there are 3 ounces of coffee. In order for Ella�’s drink to taste the same, she will need the same ratio of ounces of milk to ounces of coffee. To accomplish this, Ella must add 2 more ounces of milk and 1 more ounce of coffee to her drink. Refer to the table below:
Sara's coffeeElla's existing
coffeeElla's coffee
adjusted
Ounces ofmilk
Ounces ofcoffee
Ounces ofvanilla syrup
Ratioonces of coffee toounces of milk toounces of vanilla
2 : 3 : 34
4 : 8 : 2 6 : 9 : 2 14
Notice that for every 2 parts milk and 3 parts coffee there is part vanilla. If Ella�’s coffee has 3 groups of 3 parts coffee and 3 groups of 2 parts milk, then she will also
need 3 groups of part vanilla, or ounces of vanilla. Since Ella already has 2
ounces of vanilla in her mug she will only need to add of an ounce of vanilla. This will
give Ella a total of ounces of her coffee drink.
34
34
94
2 14
=
14
17 14
376 Chapter 6: Underlying Processes and Mathematical Tools
Student Work Sample
This student�’s work shows the use of multiple ways to nd solutions.
The work exempli es many of the criteria on the solution guide, especially the following:
�• Recognizes and applies proportional relationships
�• Develops and carries out a plan for solving a problem that includes understand the problem, select a strategy, solve the problem, and check
�• Solves problems involving proportional relationships using solution method(s) including equivalent ratios, scale factors, and equations
�• Evaluates the reasonableness or signi cance of the solution in the context of the problem
�• Demonstrates an understanding of mathematical concepts, processes, and skills
�• Uses multiple representations (such as concrete models, tables, graphs, symbols, and verbal descriptions) and makes connections among them
�• Communicates clear, detailed, and organized solution strategy
�• Uses appropriate terminology, notation, and tools
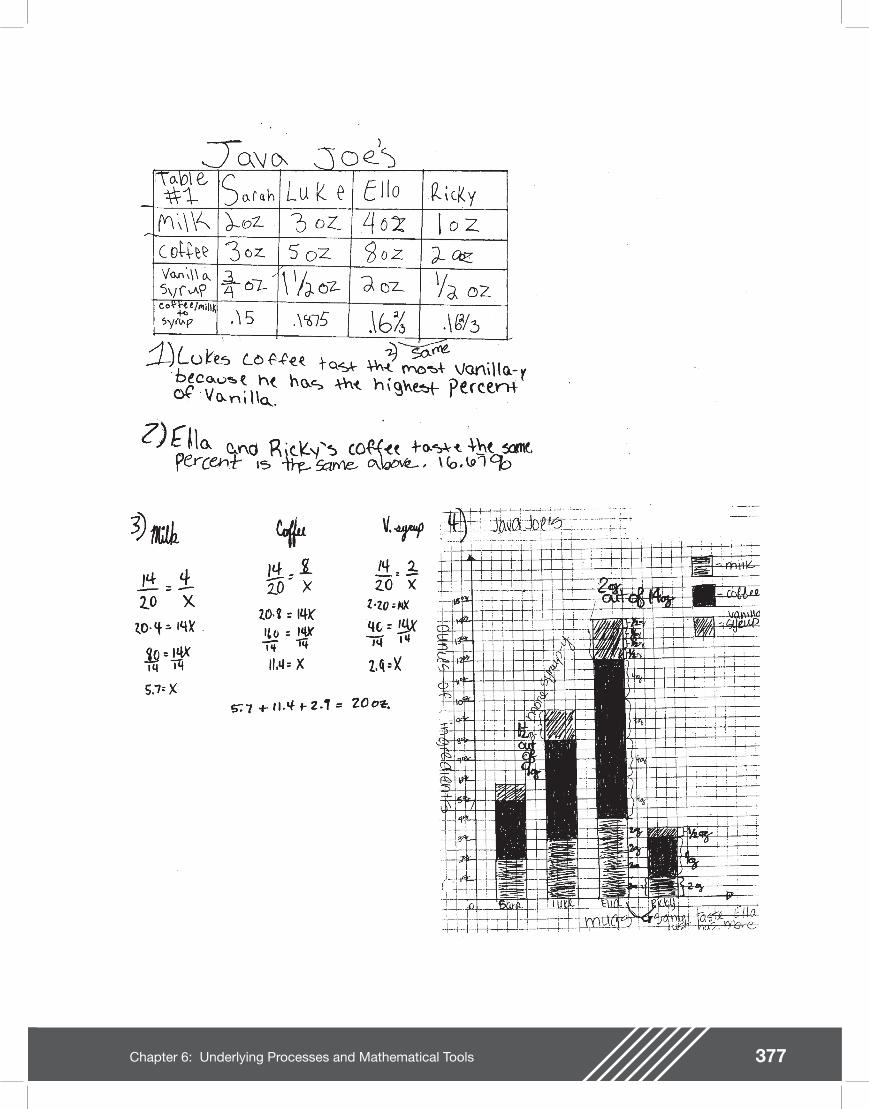
377Chapter 6: Underlying Processes and Mathematical Tools

378 Chapter 6: Underlying Processes and Mathematical Tools

381Chapter 6: Underlying Processes and Mathematical Tools
How Green is Green?grade 8
Three primary elements�—nitrogen, phosphorus, and potassium�—need to be added to your lawn in the form of fertilizer to keep your lawn healthy and appealing. Nitrogen is an important element for grass, as it promotes growth and helps grass get its green color.
Commercial fertilizers that are sold in stores contain all three of these elements. You will commonly see the amounts of these elements displayed on the bags of fertilizer in numbers such as 20-10-6 or 30-15-10. The rst number gives the percentage of nitrogen present; the second, the percentage of phosphorus; and the third, the percentage of potassium. The three numbers represent the total weight of each element per bag. For example, a 100-pound bag of 30-20-10 has a ratio of 3 : 2 : 1, where 30% of the 100-pound bag, or 30 pounds is nitrogen, 20% or 20 pounds is phosphorus, and 10 % or 10 pounds is potassium. The remaining 40%, or 40 pounds are other ingredients often used to help distribute the product.
The Lawn and Garden Store recommends any of the following bags of fertilizer (note the percentages of nitrogen-phosphorus-potassium, as well as the price and size of the bags given on the label). The experts at Lawn and Garden Store recommend applying pound of nitrogen per 1,000 square feet of yard 5 times a year.
379Chapter 6: Underlying Processes and Mathematical Tools
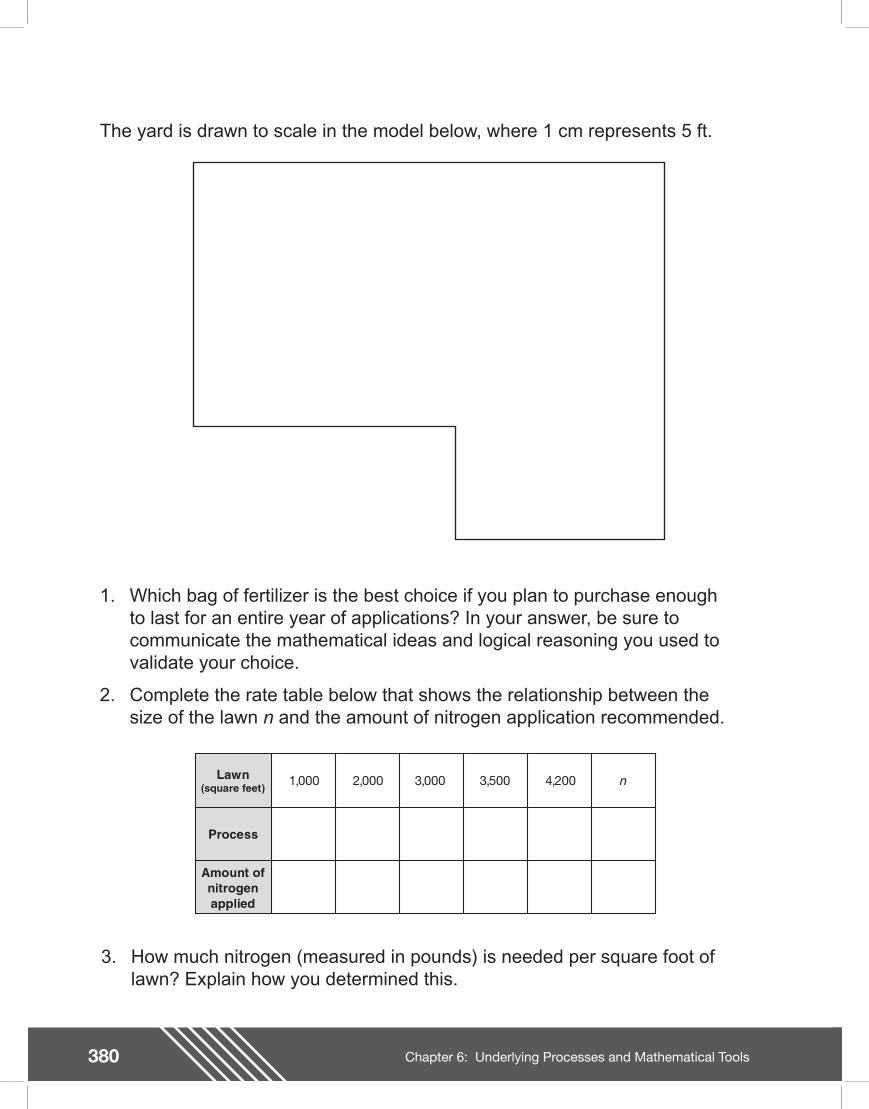
380 Chapter 6: Underlying Processes and Mathematical Tools
Lawn(square feet)
Process
Amount ofnitrogenapplied
1,000 2,000 3,000 3,500 4,200 n
The yard is drawn to scale in the model below, where 1 cm represents 5 ft.
1. Which bag of fertilizer is the best choice if you plan to purchase enough to last for an entire year of applications? In your answer, be sure to communicate the mathematical ideas and logical reasoning you used to validate your choice.
2. Complete the rate table below that shows the relationship between the size of the lawn n and the amount of nitrogen application recommended.
3. How much nitrogen (measured in pounds) is needed per square foot of lawn? Explain how you determined this.
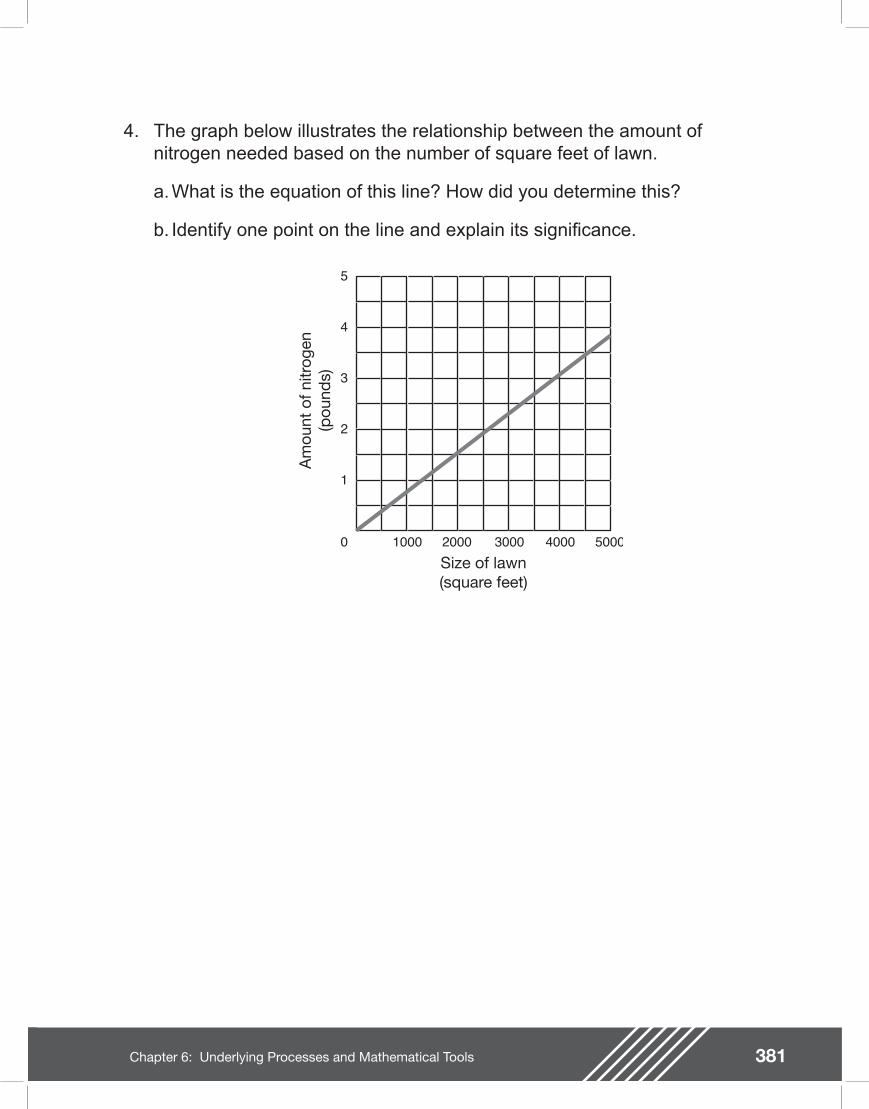
383Chapter 6: Underlying Processes and Mathematical Tools
4. The graph below illustrates the relationship between the amount of nitrogen needed based on the number of square feet of lawn.
a. What is the equation of this line? How did you determine this?
b. Identify one point on the line and explain its signi cance.
1
3
2
4
5
1000 30002000 4000 50000Size of lawn(square feet)
Am
ount
of n
itrog
en(p
ound
s)
381Chapter 6: Underlying Processes and Mathematical Tools
384 Chapter 6: Underlying Processes and Mathematical Tools
Teacher NotesMaterials
Calculator
Centimeter ruler
Connections to Middle School TEKS
(8.1) Number, operation, and quantitative reasoning. The student understands that different forms of numbers are appropriate for different situations. The student is expected to:
(B) select and use appropriate forms of rational numbers to solve real-life problems including those involving proportional relationships
(8.2) Number, operation, and quantitative reasoning. The student selects and uses appropriate operations to solve problems and justify solutions. The student is expected to:
(A) select and use appropriate operations to solve problems and justify the selections
(B) add, subtract, multiply, and divide rational numbers in problem situations
Scaffolding Questions
�• What is the length of the yard in centimeters? In feet?
�• What is the area of the yard as square feet? How did you nd this?
�• About how much nitrogen needs to be applied to this yard for one application?
�• About how much nitrogen will be applied to this yard over the course of a year?
�• What part of the StartUp Rite bag contains nitrogen? What about the Greeny Gro and Grow Best bags?
�• How many pounds of nitrogen are in the StartUp Rite bag? In the Greeny Gro bag? In the Grow Best bag? How do you know?
�• How many bags of StartUp Rite will it be necessary to purchase if you buy enough fertilizer to last the entire year? Of Greeny Gro? Grow Best? Explain.
�• Which bag is the most cost effective? Explain.
�• How do you determine how much fertilizer will be left over?
Sample Solutions
Note: There are many possible solutions based upon a student�’s reasoning. For example, a student may base his or her choice on price, while another student may consider the factor of transporting a large number of bags and their weight.
1. To nd the amount of nitrogen needed for one application, the area of the yard can be found. Each dimension on the diagram is measured and converted to feet by multiplying by 5 feet per centimeter. For example,
.12 5 51
62 5. . cm x ft cm
ft=
382 Chapter 6: Underlying Processes and Mathematical Tools
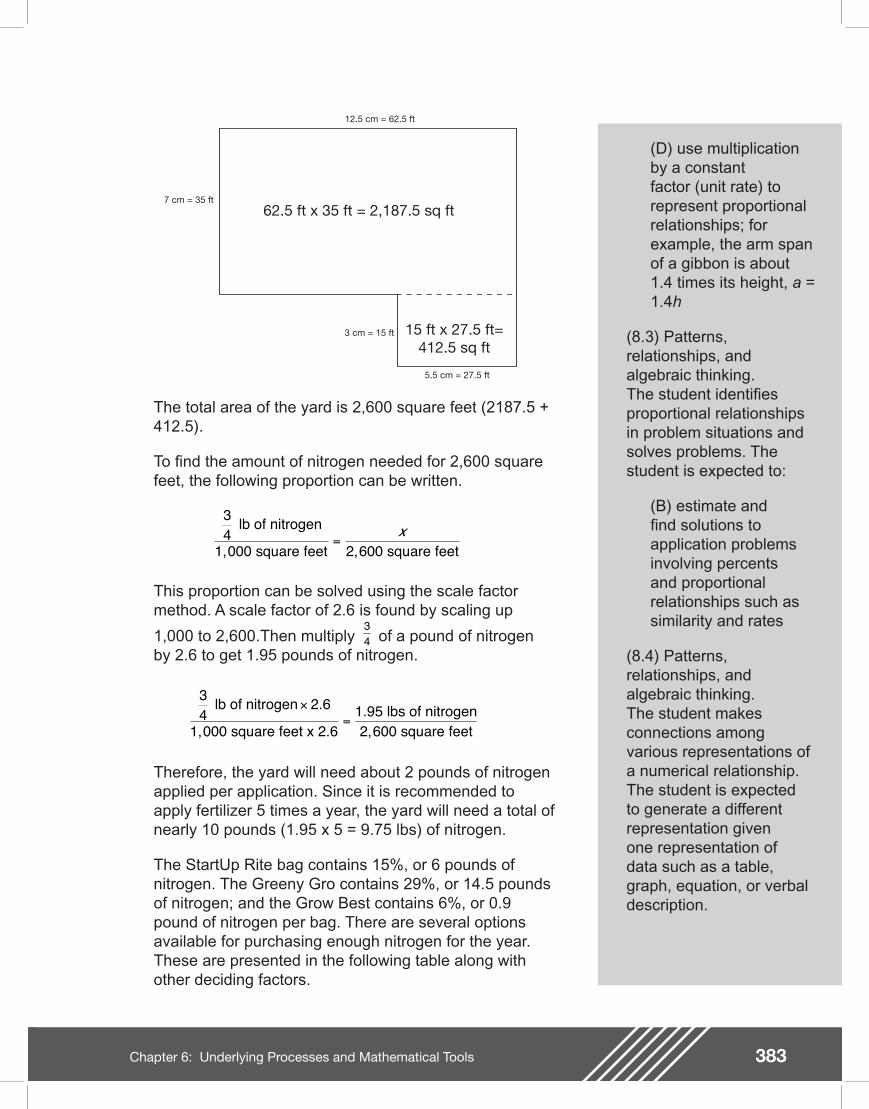
385Chapter 6: Underlying Processes and Mathematical Tools
This proportion can be solved using the scale factor method. A scale factor of 2.6 is found by scaling up
1,000 to 2,600.Then multiply of a pound of nitrogen by 2.6 to get 1.95 pounds of nitrogen.
(D) use multiplication by a constant factor (unit rate) to represent proportional relationships; for example, the arm span of a gibbon is about 1.4 times its height, a = 1.4h
(8.3) Patterns, relationships, and algebraic thinking. The student identi es proportional relationships in problem situations and solves problems. The student is expected to:
(B) estimate and nd solutions to application problems involving percents and proportional relationships such as similarity and rates
(8.4) Patterns, relationships, and algebraic thinking. The student makes connections among various representations of a numerical relationship. The student is expected to generate a different representation given one representation of data such as a table, graph, equation, or verbal description.
The total area of the yard is 2,600 square feet (2187.5 + 412.5).
To nd the amount of nitrogen needed for 2,600 square feet, the following proportion can be written.
34
lb of nitrogen
1,000 square feet 2,600 square feet=
x
34
lb of nitrogen 2.6
1,000 square feet x 2.61.95 lbs of nitrogen2,600 square feet
×=
34
Therefore, the yard will need about 2 pounds of nitrogen applied per application. Since it is recommended to apply fertilizer 5 times a year, the yard will need a total of nearly 10 pounds (1.95 x 5 = 9.75 lbs) of nitrogen.
The StartUp Rite bag contains 15%, or 6 pounds of nitrogen. The Greeny Gro contains 29%, or 14.5 pounds of nitrogen; and the Grow Best contains 6%, or 0.9 pound of nitrogen per bag. There are several options available for purchasing enough nitrogen for the year. These are presented in the following table along with other deciding factors.
383Chapter 6: Underlying Processes and Mathematical Tools
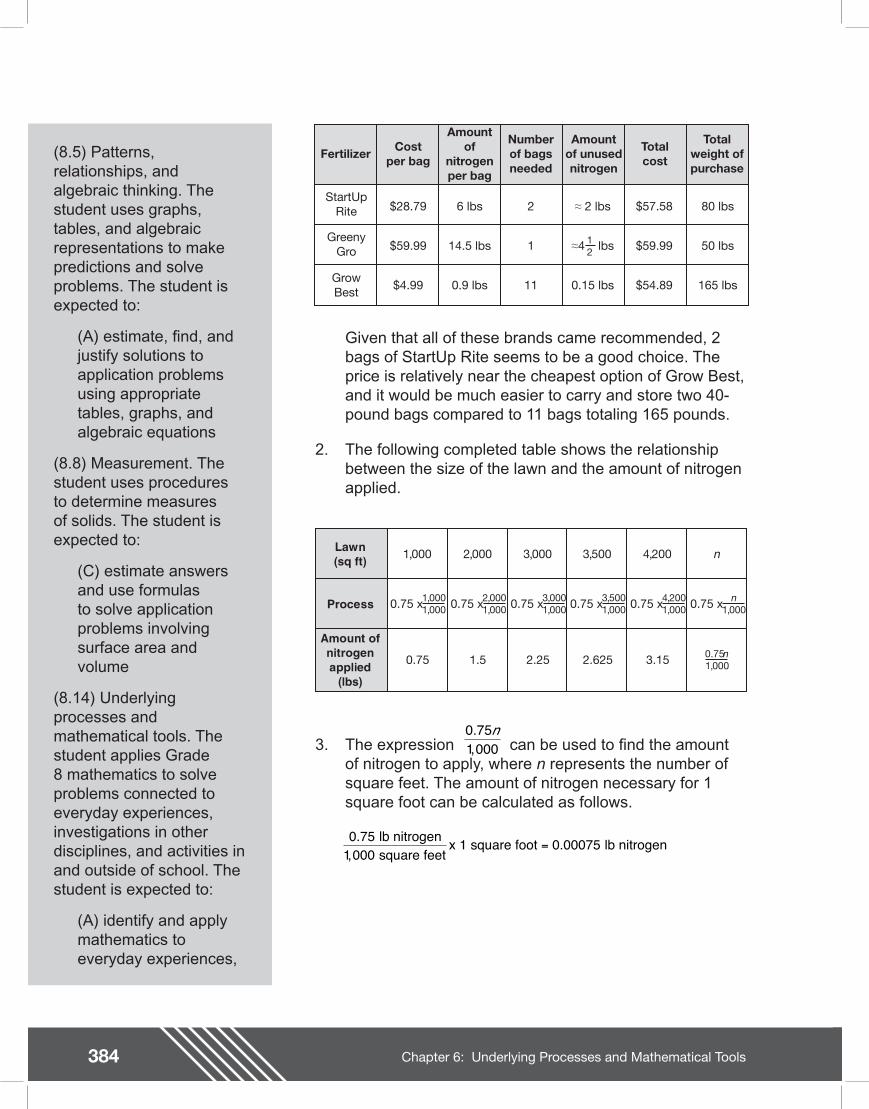
384 Chapter 6: Underlying Processes and Mathematical Tools
Teacher Notes
Given that all of these brands came recommended, 2 bags of StartUp Rite seems to be a good choice. The price is relatively near the cheapest option of Grow Best, and it would be much easier to carry and store two 40-pound bags compared to 11 bags totaling 165 pounds.
2. The following completed table shows the relationship between the size of the lawn and the amount of nitrogen applied.
Fertilizer Costper bag
Amountof
nitrogenper bag
Numberof bagsneeded
Amountof unusednitrogen
Totalcost
Totalweight ofpurchase
StartUpRite
GreenyGro
GrowBest
$28.79
$59.99
$4.99
$57.58
$59.99
$54.89
6 lbs
14.5 lbs
0.9 lbs
80 lbs
50 lbs
165 lbs
2 lbs
4 lbs
0.15 lbs
2
1
11
12
Lawn(sq ft)
Process
Amount ofnitrogenapplied
(lbs)
1,000 2,000 3,000 3,500 4,200 n
0.75 x1,0001,000 0.75 x2,000
1,000 0.75 x3,0001,000 0.75 x3,500
1,000 0.75 x4,2001,000 0.75 x n
1,000
0.75n1,0000.75 1.5 2.25 2.625 3.15
3. The expression can be used to nd the amount of nitrogen to apply, where n represents the number of square feet. The amount of nitrogen necessary for 1 square foot can be calculated as follows.
0 751 000.,
n
0 751 000
0 00075.,
. lb nitrogen square feet
x 1 square foot lb nitrogen=
(8.5) Patterns, relationships, and algebraic thinking. The student uses graphs, tables, and algebraic representations to make predictions and solve problems. The student is expected to:
(A) estimate, nd, and justify solutions to application problems using appropriate tables, graphs, and algebraic equations
(8.8) Measurement. The student uses procedures to determine measures of solids. The student is expected to:
(C) estimate answers and use formulas to solve application problems involving surface area and volume
(8.14) Underlying processes and mathematical tools. The student applies Grade 8 mathematics to solve problems connected to everyday experiences, investigations in other disciplines, and activities in and outside of school. The student is expected to:
(A) identify and apply mathematics to everyday experiences,
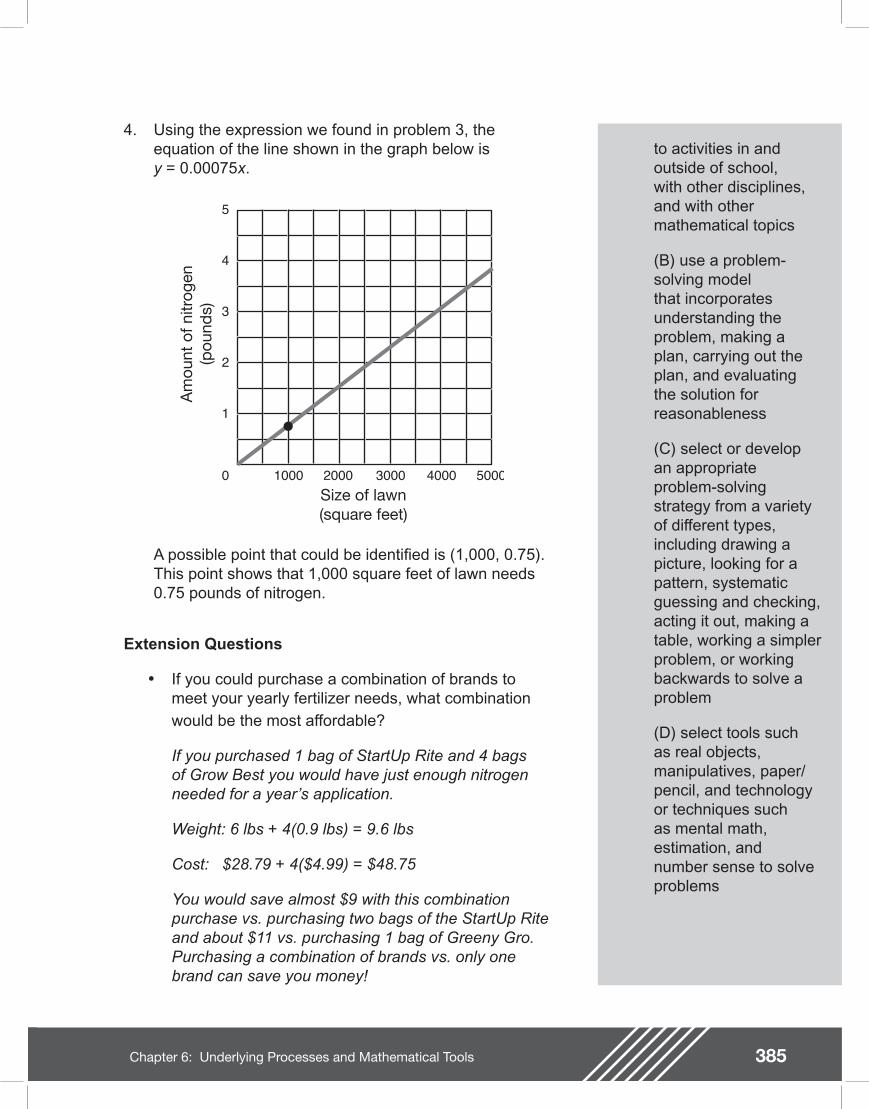
385Chapter 6: Underlying Processes and Mathematical Tools
4. Using the expression we found in problem 3, the equation of the line shown in the graph below isy = 0.00075x.
1
3
2
4
5
1000 30002000 4000 50000Size of lawn(square feet)
Am
ount
of n
itrog
en(p
ound
s)
A possible point that could be identi ed is (1,000, 0.75). This point shows that 1,000 square feet of lawn needs 0.75 pounds of nitrogen.
Extension Questions
�• If you could purchase a combination of brands to meet your yearly fertilizer needs, what combination would be the most affordable?
If you purchased 1 bag of StartUp Rite and 4 bags of Grow Best you would have just enough nitrogen needed for a year�’s application.
Weight: 6 lbs + 4(0.9 lbs) = 9.6 lbs
Cost: $28.79 + 4($4.99) = $48.75
You would save almost $9 with this combination purchase vs. purchasing two bags of the StartUp Rite and about $11 vs. purchasing 1 bag of Greeny Gro. Purchasing a combination of brands vs. only one brand can save you money!
to activities in and outside of school, with other disciplines, and with other mathematical topics
(B) use a problem-solving model that incorporates understanding the problem, making a plan, carrying out the plan, and evaluating the solution for reasonableness
(C) select or develop an appropriate problem-solving strategy from a variety of different types, including drawing a picture, looking for a pattern, systematic guessing and checking, acting it out, making a table, working a simpler problem, or working backwards to solve a problem
(D) select tools such as real objects, manipulatives, paper/pencil, and technology or techniques such as mental math, estimation, and number sense to solve problems
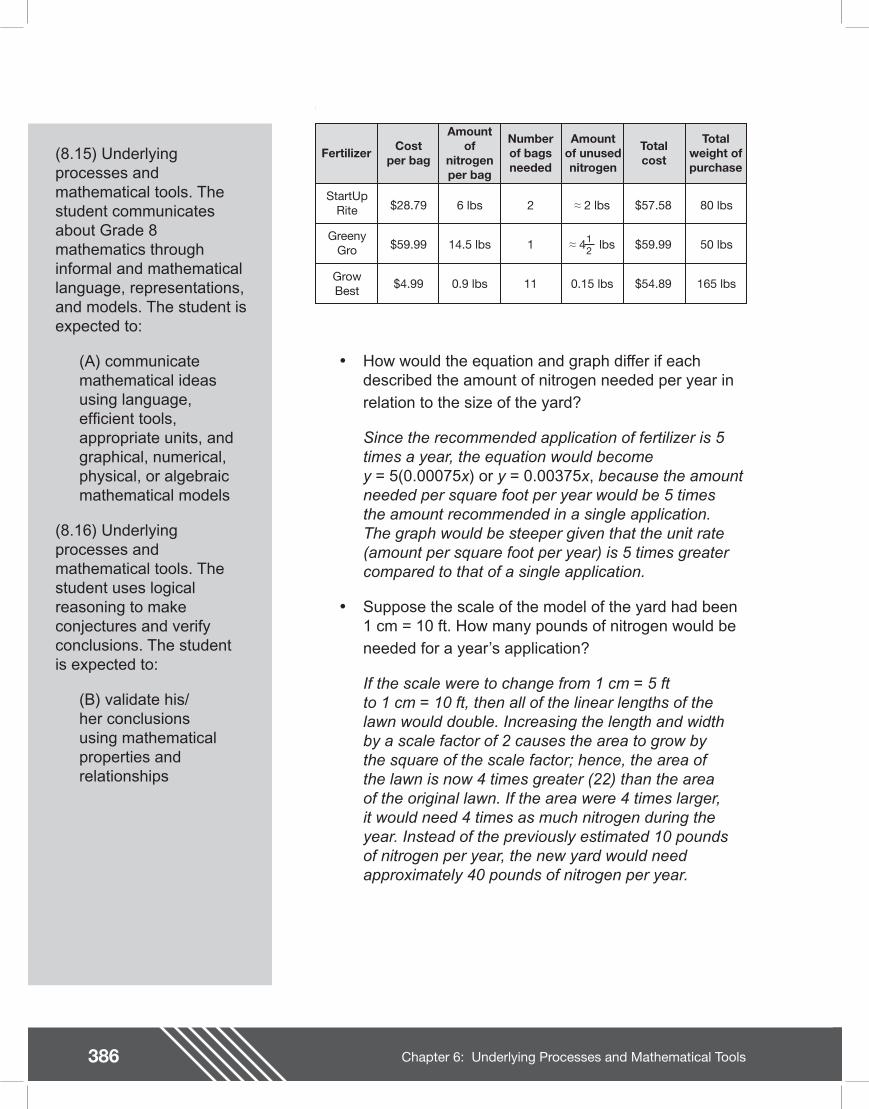
386 Chapter 6: Underlying Processes and Mathematical Tools
Teacher NotesFertilizer Cost
per bag
Amountof
nitrogenper bag
Numberof bagsneeded
Amountof unusednitrogen
Totalcost
Totalweight ofpurchase
StartUpRite
GreenyGro
GrowBest
$28.79
$59.99
$4.99
$57.58
$59.99
$54.89
6 lbs
14.5 lbs
0.9 lbs
80 lbs
50 lbs
165 lbs
2 lbs
4 lbs
0.15 lbs
2
1
11
12
�• How would the equation and graph differ if each described the amount of nitrogen needed per year in relation to the size of the yard?
Since the recommended application of fertilizer is 5 times a year, the equation would become y = 5(0.00075x) or y = 0.00375x, because the amount needed per square foot per year would be 5 times the amount recommended in a single application. The graph would be steeper given that the unit rate (amount per square foot per year) is 5 times greater compared to that of a single application.
�• Suppose the scale of the model of the yard had been 1 cm = 10 ft. How many pounds of nitrogen would be needed for a year�’s application?
If the scale were to change from 1 cm = 5 ft to 1 cm = 10 ft, then all of the linear lengths of the lawn would double. Increasing the length and width by a scale factor of 2 causes the area to grow by the square of the scale factor; hence, the area of the lawn is now 4 times greater (22) than the area of the original lawn. If the area were 4 times larger, it would need 4 times as much nitrogen during the year. Instead of the previously estimated 10 pounds of nitrogen per year, the new yard would need approximately 40 pounds of nitrogen per year.
(8.15) Underlying processes and mathematical tools. The student communicates about Grade 8 mathematics through informal and mathematical language, representations, and models. The student is expected to:
(A) communicate mathematical ideas using language, ef cient tools, appropriate units, and graphical, numerical, physical, or algebraic mathematical models
(8.16) Underlying processes and mathematical tools. The student uses logical reasoning to make conjectures and verify conclusions. The student is expected to:
(B) validate his/her conclusions using mathematical properties and relationships
387Chapter 6: Underlying Processes and Mathematical Tools
Texas Assessment of Knowledge and Skills
Objective 6: The student will demonstrate an understanding of the mathematical process and tools used in problem solving.
388 Chapter 6: Underlying Processes and Mathematical Tools


