Download - Microbial fuel cell based biosensor for in situ monitoring of anaerobic digestion process

Bioresource Technology 102 (2011) 10221–10229
Contents lists available at SciVerse ScienceDirect
Bioresource Technology
journal homepage: www.elsevier .com/locate /bior tech
Microbial fuel cell based biosensor for in situ monitoringof anaerobic digestion process
Zhidan Liu a,b,c, Jing Liu a,⇑, Songping Zhang b, Xin-Hui Xing c, Zhiguo Su b
a Department of Biotechnology, Lund University, Lund SE-221 00, Swedenb National Key Laboratory of Biochemical Engineering, Institute of Process Engineering, Chinese Academy of Sciences, Beijing 100190, Chinac Department of Chemical Engineering, Tsinghua University, Beijing 100084, China
a r t i c l e i n f o
Article history:Received 13 March 2011Received in revised form 10 August 2011Accepted 11 August 2011Available online 1 September 2011
Keywords:Anaerobic digestionBiogasMicrobial fuel cell (MFC)Microbial biosensorElectroactive biofilm
0960-8524/$ - see front matter � 2011 Elsevier Ltd. Adoi:10.1016/j.biortech.2011.08.053
⇑ Corresponding author. Tel.: +46 46 2228347; fax:E-mail address: [email protected] (J. Liu).
a b s t r a c t
A wall-jet microbial fuel cell (MFC) was developed for the monitoring of anaerobic digestion (AD). Thisbiofilm based MFC biosensor had a character of being portable, short hydraulic retention time (HRT)for sample flow through and convenient for continuous operation. The MFC was installed in the recircu-lation loop of an upflow anaerobic fixed-bed (UAFB) reactor in bench-scale where pH of the fermentationbroth and biogas flow were monitored in real time. External disturbances to the AD were added on pur-pose by changing feedstock concentration, as well as process configuration. MFC signals had good corre-lations with online measurements (i.e. pH, gas flow rate) and offline analysis (i.e. COD) over 6-monthoperation. These results suggest that the MFC signal can reflect the dynamic variation of AD and canpotentially be a valuable tool for monitoring and control of bioprocess.
� 2011 Elsevier Ltd. All rights reserved.
1. Introduction
Anaerobic digestion (AD) is an efficient and versatile biologicalapproach for organic wastewater/waste treatment, due to itsadvantages, such as production of bioenergy, conservation ofammonia type fertilizer, and low sludge yield (van Lier et al.,2001). AD, which organic matter is converted into biogas, is a com-plex process typically consisting of four major steps: hydrolysis,acidogenesis, acetogenesis, and methanogenesis (Gerardi, 2003).As a consequence, various microbial communities with differentphysiological characters are involved. The interdependence of thedifferent microbial communities can therefore cause the instabilityof AD and difficulty in the process control by traditional method(Gujer and Zehnder, 1983). In fact, many full-scale biogas plantsare operated far below the maximum design capacity in order tokeep a big safety margin and eliminate the risk of system overload.This is, however, performed at the cost of process efficiency, degreeof capital investment, and operational cost as a whole (Liu et al.,2003). Lack of reliable process dynamic information and robuston-line sensors is one of big problems for the operation of AD sys-tem. To achieve more stable and efficient operation, there areincreasing demands on advanced monitoring and control of ADsystem using reliable sensors (Liu, 2003; Spanjers and van Lier,2006; Ward et al., 2008; Boe et al., 2010). Although various processparameters have investigated to be measured on-line, such as BOD
ll rights reserved.
+46 46 2224713.
monitoring based on biosensor (Liu et al., 2004b), VFA monitoringbased on headspace GC (Boe et al., 2007) and substrate qualityanalysis based on spectroscopy principle (Jacobi et al., 2011), thesesensors are still not commercially available for industrial applica-tion. Based on process information provided by sensors, knowl-edge-based (Scherer et al., 2009; Vaiopoulou et al., 2011) andmodel-based (Morel et al., 2007; Méndez-Acosta et al., 2010) con-trol strategies had been developed via the control of loading rate,temperature or pH. Among the process parameters, VFAs, particu-larly acetate and propionate, as the key intermediates of AD sys-tem, are suggested as an important process indicator due to thereason that system imbalance is accompanied with accumulationof VFAs (Spanjers and van Lier, 2006; Boe et al., 2007, 2010; Wardet al., 2008; Méndez-Acosta et al., 2010).
Microbial fuel cell (MFC) is a device where electrical signals aredirectly conducted from chemical energy stored in organic matter(e.g. acetate and glucose) via microbial catalysis (Potter, 1911; Lo-gan et al., 2006; Pant et al., 2010). Due to its novel transform mech-anism, MFC has received considerable interests and a number ofpotential applications based on its concept have been proposed,particularly in environmental and energy field (Bond et al., 2002;Liu et al., 2004c; Rabaey and Verstraete, 2005; Moon et al., 2006;Logan, 2008; Virdis et al., 2010). MFC, in principle, could also beconsidered as a biosensor, where microorganisms in the anodecompartment act as biological recognition element whereas elec-trodes and proton exchange membrane (optional) serve as a trans-ducer (Kumlanghan et al., 2007). In comparison with other existingsensors (i.e. pH, temperature, and gas flow meter) in AD,
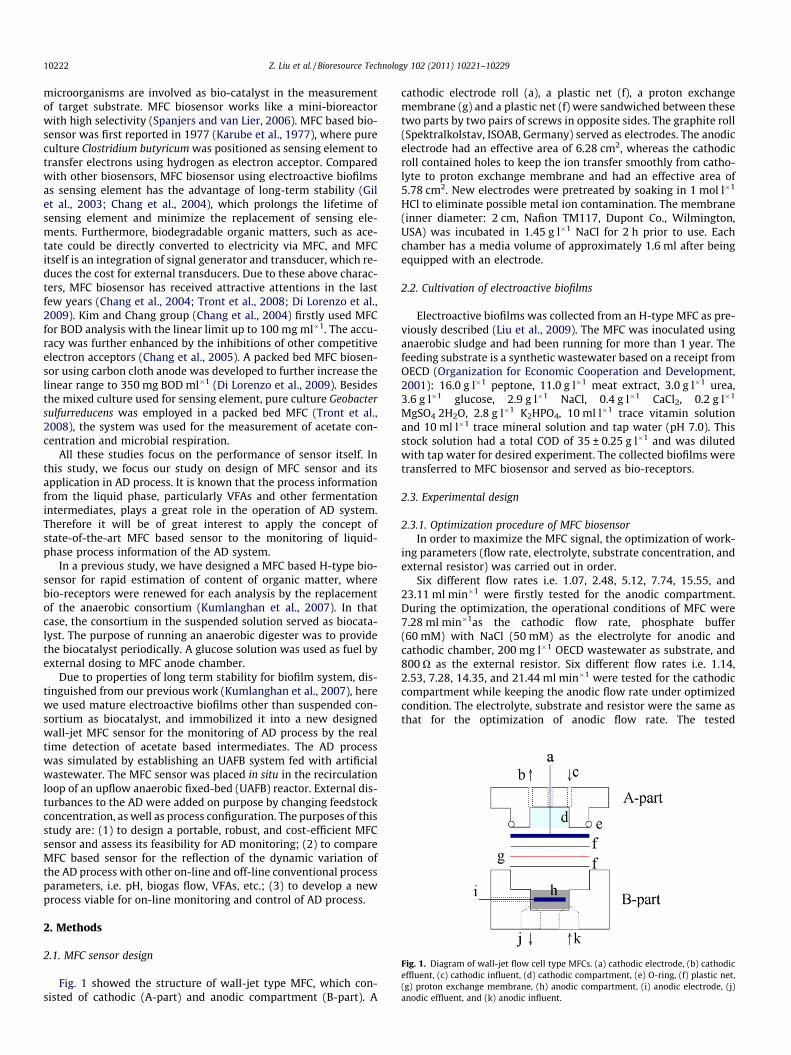
Fig. 1. Diagram of wall-jet flow cell type MFCs. (a) cathodic electrode, (b) cathodiceffluent, (c) cathodic influent, (d) cathodic compartment, (e) O-ring, (f) plastic net,(g) proton exchange membrane, (h) anodic compartment, (i) anodic electrode, (j)anodic effluent, and (k) anodic influent.
10222 Z. Liu et al. / Bioresource Technology 102 (2011) 10221–10229
microorganisms are involved as bio-catalyst in the measurementof target substrate. MFC biosensor works like a mini-bioreactorwith high selectivity (Spanjers and van Lier, 2006). MFC based bio-sensor was first reported in 1977 (Karube et al., 1977), where pureculture Clostridium butyricum was positioned as sensing element totransfer electrons using hydrogen as electron acceptor. Comparedwith other biosensors, MFC biosensor using electroactive biofilmsas sensing element has the advantage of long-term stability (Gilet al., 2003; Chang et al., 2004), which prolongs the lifetime ofsensing element and minimize the replacement of sensing ele-ments. Furthermore, biodegradable organic matters, such as ace-tate could be directly converted to electricity via MFC, and MFCitself is an integration of signal generator and transducer, which re-duces the cost for external transducers. Due to these above charac-ters, MFC biosensor has received attractive attentions in the lastfew years (Chang et al., 2004; Tront et al., 2008; Di Lorenzo et al.,2009). Kim and Chang group (Chang et al., 2004) firstly used MFCfor BOD analysis with the linear limit up to 100 mg ml�1. The accu-racy was further enhanced by the inhibitions of other competitiveelectron acceptors (Chang et al., 2005). A packed bed MFC biosen-sor using carbon cloth anode was developed to further increase thelinear range to 350 mg BOD ml�1 (Di Lorenzo et al., 2009). Besidesthe mixed culture used for sensing element, pure culture Geobactersulfurreducens was employed in a packed bed MFC (Tront et al.,2008), the system was used for the measurement of acetate con-centration and microbial respiration.
All these studies focus on the performance of sensor itself. Inthis study, we focus our study on design of MFC sensor and itsapplication in AD process. It is known that the process informationfrom the liquid phase, particularly VFAs and other fermentationintermediates, plays a great role in the operation of AD system.Therefore it will be of great interest to apply the concept ofstate-of-the-art MFC based sensor to the monitoring of liquid-phase process information of the AD system.
In a previous study, we have designed a MFC based H-type bio-sensor for rapid estimation of content of organic matter, wherebio-receptors were renewed for each analysis by the replacementof the anaerobic consortium (Kumlanghan et al., 2007). In thatcase, the consortium in the suspended solution served as biocata-lyst. The purpose of running an anaerobic digester was to providethe biocatalyst periodically. A glucose solution was used as fuel byexternal dosing to MFC anode chamber.
Due to properties of long term stability for biofilm system, dis-tinguished from our previous work (Kumlanghan et al., 2007), herewe used mature electroactive biofilms other than suspended con-sortium as biocatalyst, and immobilized it into a new designedwall-jet MFC sensor for the monitoring of AD process by the realtime detection of acetate based intermediates. The AD processwas simulated by establishing an UAFB system fed with artificialwastewater. The MFC sensor was placed in situ in the recirculationloop of an upflow anaerobic fixed-bed (UAFB) reactor. External dis-turbances to the AD were added on purpose by changing feedstockconcentration, as well as process configuration. The purposes of thisstudy are: (1) to design a portable, robust, and cost-efficient MFCsensor and assess its feasibility for AD monitoring; (2) to compareMFC based sensor for the reflection of the dynamic variation ofthe AD process with other on-line and off-line conventional processparameters, i.e. pH, biogas flow, VFAs, etc.; (3) to develop a newprocess viable for on-line monitoring and control of AD process.
2. Methods
2.1. MFC sensor design
Fig. 1 showed the structure of wall-jet type MFC, which con-sisted of cathodic (A-part) and anodic compartment (B-part). A
cathodic electrode roll (a), a plastic net (f), a proton exchangemembrane (g) and a plastic net (f) were sandwiched between thesetwo parts by two pairs of screws in opposite sides. The graphite roll(Spektralkolstav, ISOAB, Germany) served as electrodes. The anodicelectrode had an effective area of 6.28 cm2, whereas the cathodicroll contained holes to keep the ion transfer smoothly from catho-lyte to proton exchange membrane and had an effective area of5.78 cm2. New electrodes were pretreated by soaking in 1 mol l�1
HCl to eliminate possible metal ion contamination. The membrane(inner diameter: 2 cm, Nafion TM117, Dupont Co., Wilmington,USA) was incubated in 1.45 g l�1 NaCl for 2 h prior to use. Eachchamber has a media volume of approximately 1.6 ml after beingequipped with an electrode.
2.2. Cultivation of electroactive biofilms
Electroactive biofilms was collected from an H-type MFC as pre-viously described (Liu et al., 2009). The MFC was inoculated usinganaerobic sludge and had been running for more than 1 year. Thefeeding substrate is a synthetic wastewater based on a receipt fromOECD (Organization for Economic Cooperation and Development,2001): 16.0 g l�1 peptone, 11.0 g l�1 meat extract, 3.0 g l�1 urea,3.6 g l�1 glucose, 2.9 g l�1 NaCl, 0.4 g l�1 CaCl2, 0.2 g l�1
MgSO4�2H2O, 2.8 g l�1 K2HPO4, 10 ml l�1 trace vitamin solutionand 10 ml l�1 trace mineral solution and tap water (pH 7.0). Thisstock solution had a total COD of 35 ± 0.25 g l�1 and was dilutedwith tap water for desired experiment. The collected biofilms weretransferred to MFC biosensor and served as bio-receptors.
2.3. Experimental design
2.3.1. Optimization procedure of MFC biosensorIn order to maximize the MFC signal, the optimization of work-
ing parameters (flow rate, electrolyte, substrate concentration, andexternal resistor) was carried out in order.
Six different flow rates i.e. 1.07, 2.48, 5.12, 7.74, 15.55, and23.11 ml min�1 were firstly tested for the anodic compartment.During the optimization, the operational conditions of MFC were7.28 ml min�1as the cathodic flow rate, phosphate buffer(60 mM) with NaCl (50 mM) as the electrolyte for anodic andcathodic chamber, 200 mg l�1 OECD wastewater as substrate, and800 O as the external resistor. Six different flow rates i.e. 1.14,2.53, 7.28, 14.35, and 21.44 ml min�1 were tested for the cathodiccompartment while keeping the anodic flow rate under optimizedcondition. The electrolyte, substrate and resistor were the same asthat for the optimization of anodic flow rate. The tested

Z. Liu et al. / Bioresource Technology 102 (2011) 10221–10229 10223
electrolytes include phosphate buffer (60 mM), phosphate buffer(60 mM) with NaCl (50 mM), HCl solution (1 mM), distilled water,and NaOH (1 mM). During the optimization, substrate was200 mg l�1 OECD wastewater; the external resistor was 800 Owhile the flow rate was kept at the optimal value.
OECD wastewater with concentrations ranging from 0 to8000 mg COD l�1 was tested to investigate the effect of substrateconcentration. During the experiment, the external resistor was800 O, while the flow rate and the electrolyte were kept at theiroptimal value. In order to optimize the resistor, external resistorwas designed to be adjustable in order to plot power curves at dif-ferent resistor loadings. This was performed by simply using aresistor regulator from 11 to 6000 O. The main reason for optimiz-ing the external resistor is to minimize the ohmic losses of MFCsensor system resulted from for example low ionic conductivityof MFC electrolyte During the experiment, substrate was200 mg l�1 OECD wastewater, while the flow rate and the electro-lyte were kept at their optimal value.
2.3.2. Monitoring of ADAn upflow anaerobic fixed bed (UAFB) reactor was used here as
a model AD system according to Liu et al. (2003). This reactor hasbeen running for over 3 years. To create an adapted stable micro-bial community of AD for monitoring, UAFB was fed with OECDwastewater with increased loading. A stable state of UAFB with aorganic loading rate (OLR) of 3.5–4 g COD l�1 d�1 was character-ized by following parameters: methane content, 70%; gas produc-tion rate: 1.5–2.0 l d�1, partial alkalinity: 2500 mg CaCO3 l�1,total alkalinity: 3000–3500 mg CaCO3 l�1, pH: 7.2–7.5.
As illustrated in Fig. 2, the reactor system consists of a cylindri-cal column made from jacketed glass, and a gas–liquid separator.The reactor was kept at 36.5 ± 0.2 �C by heated water bath. The car-rier materials for biofilm are polyethylene tubes (10 mm long and8 mm in diameter) with internal longitudinal walls, which formeda cross inside the carrier and longitudinal fins on the outside toform a large specific area (0.39 m2 l�1). A working volume ofaround 1 l remained after filling the reactor with plastic carriersand attached biomass. The leachate and biogas flowed from anup outlet of the reactor and were separated in the gas–liquidseparator.
Substrate PumpPump
Biogas m
Anaerobic digestion
P
Dosing
h
Water bath for heating
Fig. 2. Scheme of anaerobic biodegradation system integrated with MFC based sensor. Aequipped with data acquisition hardware, data record and analysis software and senorsensor, biogas signal via in-house developed gas flow meter and proton signal via comm
The biogas flow was then monitored by an in-house developedgas flow meter (Liu et al., 2004c). An external recirculation was cre-ated for both coupling to the liquid–gas separation unit and serv-ing as sampling ports for the MFC sensor and pH (Fig. 2). Twosuits of MFCs were employed: one contained an anode with immo-bilized electroactive biofilms (biofilm MFC). The biofilm consor-tium was transferred from an H-type MFC fed with OECDwastewater over a 1-year period (Liu et al., 2009). The biofilmtransfer was performed by scraping the attached bacteria fromthe anode surface of H-type MFC; another MFC served as controlwith the blank anode without any pre-immobilized bacteria (con-trol MFC). Dissolved oxygen (DO) meter (Inolab Oxi level 2, Wis-senschaftlich Technische Wellcstäffen, Germany) was alsoinstalled in cathodic compartment of MFCs to monitor the dis-solved oxygen level of catholyte. Recirculation liquid flow ratewas maintained at 17.6 l h�1 and hydraulic retention time (HRT)of UAFB reactor was as short as 4 min. In this way, fermentation li-quid within UAFB reactor and in the recirculation loop was consid-ered consistent. MFC, pH meter, and gas flow meter wereimplemented as in situ sensors.
A hydrolysis reactor was also included when potato was used asraw substrate instead of OECD wastewater. This hydrolysis reactorconsisted of a cylindrical column made from jacketed glass with atotal volume of 0.2 l. In this case, the hydrolysis reactor and UAFBreactor were operated simultaneously. Fresh potato waste washydrolyzed and converted into volatile fatty acids and other inter-mediates in the first stage. The effluent from this stage was used asfeeding substrate of the second stage (UAFB reactor). Organic con-tent of the effluent from the hydrolysis reactor would vary a lotdue to the nature of hydrolysis process of potato waste. The twostage experiment was designed on purpose to simulate the dy-namic variation of feedstock stream in practice. This experimentwas running for up to 17 days until biogas production in UAFBreactor was significantly decreased, and the potato had been com-pletely degraded in the hydrolysis reactor.
2.4. Chemicals and materials
All chemicals used in this study were analytical reagent grade.Anaerobic sludge was collected from a local wastewater treatment
DAQ
PC
Effluent
pH probe
Gas-liquid separation
Sampling
MFC
Air flow
eter
DO probe
Catholyte
Anode
Cathode
Pump
ump
n upflow anaerobic fixed-bed (UAFB) reactor fed with OECD wastewater, which wasunits for real time on-line monitoring, containing electrical signal via MFC basedercial available pH meter.
10224 Z. Liu et al. / Bioresource Technology 102 (2011) 10221–10229
plant (Ellinge, Sweden) and served as inoculums for the hydrolysisof potato. Fresh potatoes were cut into smaller pieces using a kitch-en blender and 70 g was loaded into the hydrolysis reactor. The po-tato has a total solid (TS) content of 16% and volatile solid (VS)/TS is94%. 119 ml water was added, together with 21 g anaerobic sludgeinoculums. Anaerobic sludge has a TS content of 2.3% and VS/TS is54%.
2.5. Process parameters of AD system
2.5.1. On-line parametersThe closed-circuit potential (U) between the anode and cathode
was measured through an external resistor. During the experimentof sensor optimization, the external resistor is 800 X except whenthe polarization study was carried out using different resistors (0–6000 X). For the online sensor signal recording, the optimizedresistor was defined as 200 X. Current (I) was calculated accordingto Ohm’s law: U = I � R. Coulombic yield was obtained by integrat-ing current over time. pH of UAFB was continuously monitoredwith a commercial available pH probe and meter (Inventron AB,Sweden). Biogas flow rate and biogas volume production weremonitored in real-time using an in-house developed volumetricgas meter (Liu et al., 2004c). Electrical potential of the MFC sensor,pH and gas flow rate of biogas process were recorded in a selectedsampling frequency using an in-house developed computer dataacquisition system.
2.5.2. Off-line analysisChemical oxygen demand (COD), TS and VS were determined
according to standard methods (APHA, 1985). COD removal wascalculated as the ratio between the removed COD and influentCOD. Gas composition was off-line analyzed by GC (Agilent 6890,CA, USA) equipped with a Haysep N 80/100, Molsieve 5A columnand a thermal conductivity detector as previously described (Ngesand Liu, 2009). Gas sample was obtained by syringe from butylrubber sampling port in the position between biogas meter andgas outlet of UFAB reactor. The detected gas compounds wereCH4, CO2, O2, and N2. Alkalinity was evaluated as partial alkalinity(PA) by titration to pH 5.75 and the total alkalinity (TA) by titrationto pH 4.3 with 0.1 M HCl using a titrator (Radiometer, Copenhagen,Denmark) and expressed as mg CaCO3 1�1. Samples for alkalinitymeasurements were centrifuged at 6000 rpm for 3 min beforeanalysis. Volatile fatty acids (VFAs) were analyzed by HPLC (VarianStar 9000, Walnut Creek, USA), with a Biorad column, 125–0115(Biorad, Hercules, USA). The samples were acidified, centrifuged,stored at �20 �C. Before analysis, samples were defrosted and fil-tered to remove particles. The chromatographic column was main-tained at 65 �C, and sulfuric acid (1 mmol l�1) was used as mobilephase at a flow rate of 0.8 ml min�1. The VFAs concentration wasdetected by using UV–vis detector at 208 nm.
3. Result and discussion
3.1. Optimization of the performance of MFC biosensor
Concerning the anodic flow rate, MFC gave a highest signal at7.74 ml min�1 (data not shown). Electrical signal didn’t decreaseremarkably at the flow rate below 7.74 ml min�1, while it de-creased a lot at 23.11 ml min�1(data not shown). This illustratesthat flow rate have double effects on MFC signal, due to masstransfer and stability of biofilms. Regarding the cathodic flow rate,the result showed that the higher the flow rate, the higher the sig-nal and dissolved oxygen (DO). However, DO increased slightlyfrom 7.28 to 7.68 mg l�1 with the flow rate up beyond7.28 ml min�1 (data not shown). Considering both real oxygen sup-
ply needed and the longevity of pump tube, 7.28 ml min�1 waschosen as cathodic flow rate. Sensor signal and pH were greatly im-pacted by the electrolyte type. For either the anolyte or the catho-lyte, the highest sensor signal was observed for phosphate buffer(60 mM) with NaCl (50 mM). NaOH and HCl resulted in worse sig-nal because they disturbed the acid–alkali balance of cathodicreactions. It should be noted that for the online monitoring exper-iment, the anolyte will be replaced with the leachate flowing out ofAD reactor.
The study of the effect of substrate concentration revealed thatsensor signals rose linearly with substrate concentration up to200 mg COD l�1 (data not shown). In the whole tested range, sen-sor signal had a Monod type equation correlation with substrateconcentration. Highest power was achieved at 200 O with theexternal resistors ranging from 11 to 6000 O.
To sum up, the optimized conditions were shown as follows:cathodic flow rate, 7.28 ml min�1; anodic flow rate, 7.74 ml min�1;electrolyte, phosphate buffer with NaCl, and external load, 200 O.
3.2. Online monitoring of AD process
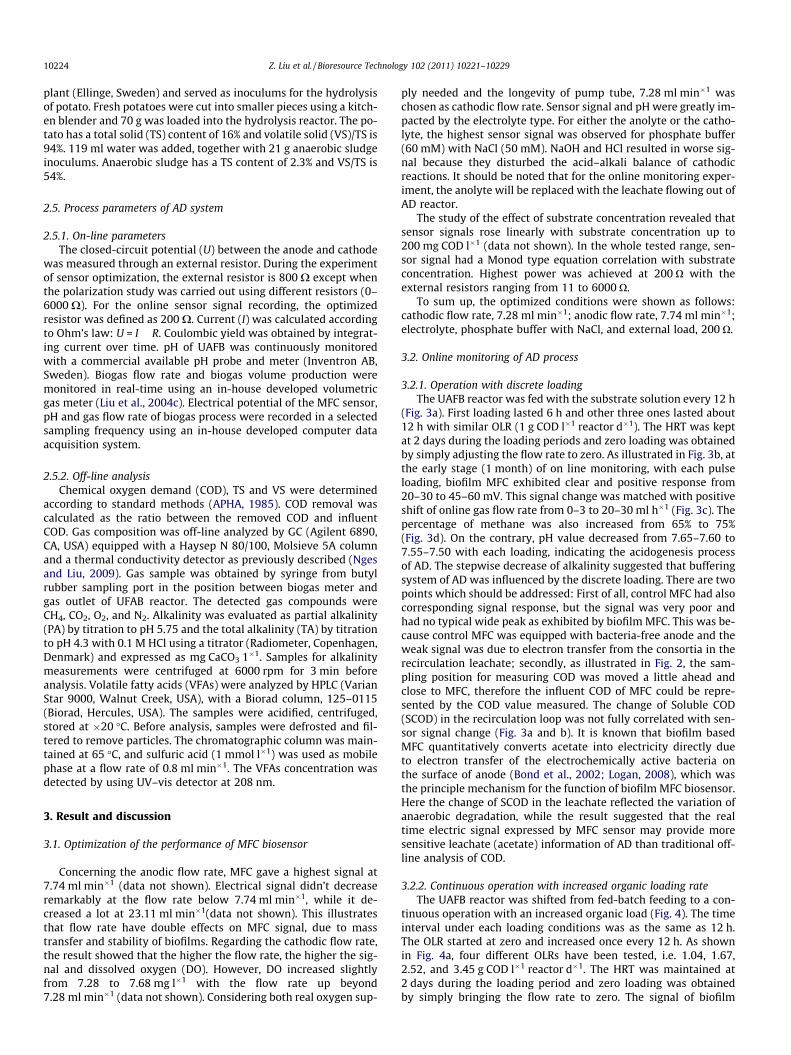
3.2.1. Operation with discrete loadingThe UAFB reactor was fed with the substrate solution every 12 h
(Fig. 3a). First loading lasted 6 h and other three ones lasted about12 h with similar OLR (1 g COD l�1 reactor d�1). The HRT was keptat 2 days during the loading periods and zero loading was obtainedby simply adjusting the flow rate to zero. As illustrated in Fig. 3b, atthe early stage (1 month) of on line monitoring, with each pulseloading, biofilm MFC exhibited clear and positive response from20–30 to 45–60 mV. This signal change was matched with positiveshift of online gas flow rate from 0–3 to 20–30 ml h�1 (Fig. 3c). Thepercentage of methane was also increased from 65% to 75%(Fig. 3d). On the contrary, pH value decreased from 7.65–7.60 to7.55–7.50 with each loading, indicating the acidogenesis processof AD. The stepwise decrease of alkalinity suggested that bufferingsystem of AD was influenced by the discrete loading. There are twopoints which should be addressed: First of all, control MFC had alsocorresponding signal response, but the signal was very poor andhad no typical wide peak as exhibited by biofilm MFC. This was be-cause control MFC was equipped with bacteria-free anode and theweak signal was due to electron transfer from the consortia in therecirculation leachate; secondly, as illustrated in Fig. 2, the sam-pling position for measuring COD was moved a little ahead andclose to MFC, therefore the influent COD of MFC could be repre-sented by the COD value measured. The change of Soluble COD(SCOD) in the recirculation loop was not fully correlated with sen-sor signal change (Fig. 3a and b). It is known that biofilm basedMFC quantitatively converts acetate into electricity directly dueto electron transfer of the electrochemically active bacteria onthe surface of anode (Bond et al., 2002; Logan, 2008), which wasthe principle mechanism for the function of biofilm MFC biosensor.Here the change of SCOD in the leachate reflected the variation ofanaerobic degradation, while the result suggested that the realtime electric signal expressed by MFC sensor may provide moresensitive leachate (acetate) information of AD than traditional off-line analysis of COD.
3.2.2. Continuous operation with increased organic loading rateThe UAFB reactor was shifted from fed-batch feeding to a con-
tinuous operation with an increased organic load (Fig. 4). The timeinterval under each loading conditions was as the same as 12 h.The OLR started at zero and increased once every 12 h. As shownin Fig. 4a, four different OLRs have been tested, i.e. 1.04, 1.67,2.52, and 3.45 g COD l�1 reactor d�1. The HRT was maintained at2 days during the loading period and zero loading was obtainedby simply bringing the flow rate to zero. The signal of biofilm
0 10 20 30 40 50 60 70 80 90-0.5
0.0
0.5
1.0
1.5
2.0
50
100
150
200 OLR
1.02 1.071.090.93
Org
anic
Loa
ding
rat
e (g
CO
D/l/
d)
Time (hour)
SCOD
SC
OD
in th
e re
circ
ulat
ion
stre
ams
(mg
/l)
0 10 20 30 40 50 60 70 80 9020
30
40
50
60
70
7.40
7.45
7.50
7.55
7.60
7.65
7.70 biofilm MFC control MFC
Pote
ntia
l (m
V)
Time (hour)
pH
pH
0 10 20 30 40 50 60 70 80 900
10
20
30
40
50
0
200
400
600
800
1000 Gas flow rate
Gas
flow
rat
e (m
l/h)
Time (hour)
Gas volume
Gas
vol
ume
(ml)
0 10 20 30 40 50 60 70 80 905
10
1560
80
1000
1500
2000
2500
3000
3500
Gas
con
tent
(%)
Time (hour)
CH4% CO2% TA PA
Alk
alin
ity (m
g C
aCO
3/l)
(a)
(b)
(c)
(d)
Fig. 3. System performance at discrete loading of OECD wastewater (a). Responses of on-line signals (potential outputs of MFC and pH (b), gas flow rate and gas volume (c))and off-line analysis (gas content and alkalinity in the recirculation streams (d)).
Z. Liu et al. / Bioresource Technology 102 (2011) 10221–10229 10225
MFC responded positively from 20 to 80 mV with the increase ofOLR up to 2.52 g COD l�1 d�1 (Fig. 4b). Accordingly, gas flow rateincreased from 0–3 to 75 ml h�1 and pH decreased from 7.6 to7.3 (Fig. 4b and c). Control MFC did not exhibit the correspondingincrease as biofilm MFC. Afterward, biofilm MFC achieved satu-rated state (Fig. 4b), which was due to the very limited amountof bio-receptors on the anode, and the censoring speed for MFCwas slower than the substrate delivery speed. It is therefore impor-tant to be aware of this limit when designing MFC biosensor for its
applications. Further improved approaches will be discussed inSection 3.2.4. The decrease of sensor signal at higher loading(3.45 g COD l�1 d�1) was possibly due to the feedback inhibitionof overloaded intermediate or the negative effect from H2S pro-duced during AD process. The increase of alkalinity in this case(Fig. 4d) was due to the effect of buffering chemicals in AD system(NaHCO3, VFAs and ammonia) (Björnsson, 2000). VFAs resultedfrom anaerobic degradation weakens partial alkalinity (PA), whilethe formation of HCO3
� enhances PA. In this experiment, with

(a)
(b)
(c)
(d)
0 10 20 30 400
1
2
3
4
75
100
125
150
1.671.04
3.45
2.52 OLR
Org
anic
load
ing
rate
(g
CO
D/l/
d)Time (hour)
SCOD
SC
OD
in r
ecirc
ula
tion
stre
ams
(mg/
l)
0 10 20 30 4020
40
60
80
100
7.3
7.4
7.5
7.6
7.7
Pot
entia
l (m
V)
Time (hours)
biofilm MFC control MFC pH
pH
0 10 20 30 400
25
50
75
100
125
150
0
500
1000
1500
2000 Gas flow rate
Gas
flo
w r
ate
(ml/h
)
Time (hour)
Gas volume
Gas
vol
ume
(ml)
0 10 20 30 40
10
20
70
80
1000
1500
2000
2500
3000
Gas
con
ten
t (%
)
Time (hour)
CH4% CO2% PA TA
Alk
alin
ity (
mg
CaC
O3/l
)
Fig. 4. System performance at increased loading of OECD wastewater (a). Responses of on-line analysis (potential outputs of MFC and pH (b), gas flow rate and gas volume (c))and off-line signals (gas content and alkalinity in the recirculation streams (d)).
10226 Z. Liu et al. / Bioresource Technology 102 (2011) 10221–10229
the increased OLR, the positive effect from HCO3� on PA was stron-
ger than the negative effect of VFAs, and thus PA was increased.
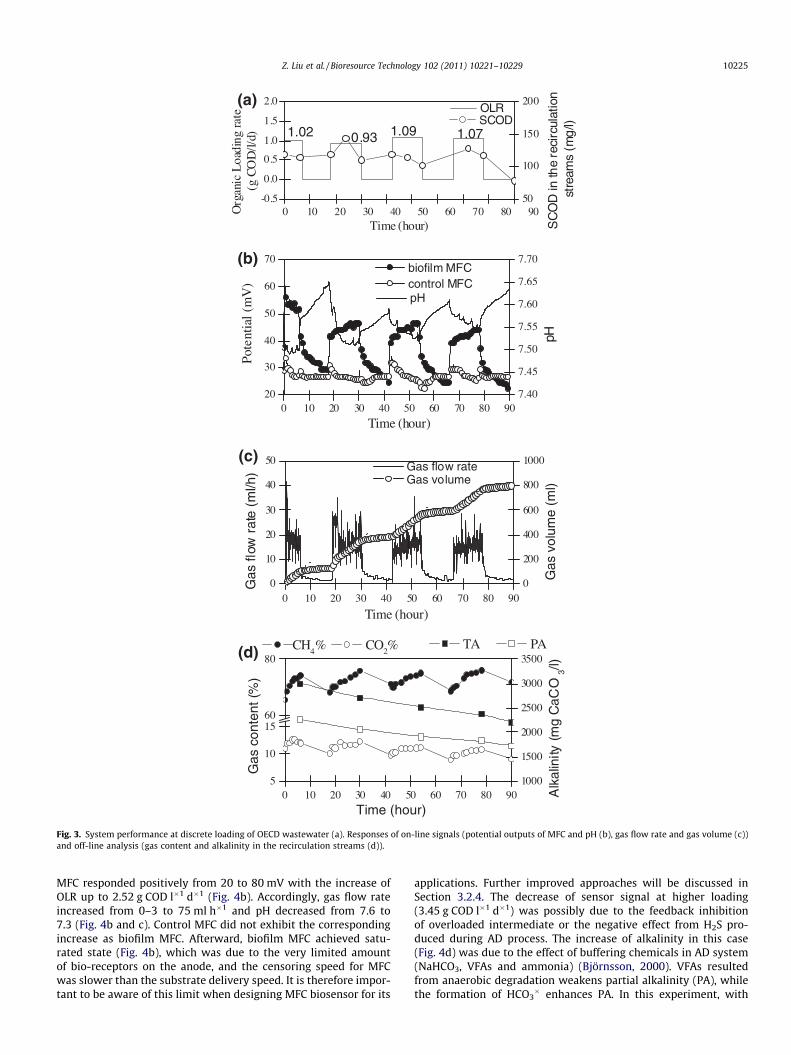
3.2.3. Continuous operation with decreased organic loading rateThe UAFB reactor was shifted from an increased load of contin-
uous feeding to a decreased load (Fig. 5). The time interval undereach loading conditions was the same as 12 h. The OLR started atzero and increased once every 12 h. As shown in Fig. 5a, four differ-ent OLRs have been tested, i.e. 3.45, 2.40, 1.66, and
0.93 g COD l�1 reactor d�1. The HRT was maintained as two daysduring the loading period. Zero loading was obtained by simplybringing the flow rate to zero. The sensor signal of biofilm MFC de-creased from 68 to 31 mV with the decreased OLR (Fig. 5b). Thesewere the same with the changes for the gas flow rate and gas con-tent (Fig. 5c). pH decreased to below 7.0 in the first 35 h, and in-creased to over 7.1 later on, whereas alkalinity gave a oppositereply (Fig. 5d). Control MFC appeared consistently at 25 mV. Theinitial decrease of pH indicated the biological degradation of
(a)
(b)
(c)
(d)
0 10 20 30 40 50 60 700
1
2
3
4
75
100
125
150
0.931.66
2.40
OLR
Org
anic
load
ing
rate
(g
CO
D/l/
d)Time (hour)
3.45 SCOD
SC
OD
in re
circ
ulat
ion
stre
ams
(mg/
l)
0 10 20 30 40 50 60 70
20
30
40
50
60
70
6.9
7.0
7.1
7.2
7.3
7.4
Pot
entia
l (m
V)
Time (hour)
biofilm MFC control MFC pH
pH
0 10 20 30 40 50 60 700
25
50
75
100
125
150
0
500
1000
1500
2000
2500
3000 Gas flow rate
Gas
flow
rate
(ml/h
)
Time (hour)
Gas volume
Gas
vol
um
e (m
l)
0 10 20 30 40 50 60 7010
20
70
80
1000
1500
2000
2500
3000
3500
Gas
con
tent
(%
)
Time (hour)
CH4% CO
2% PA TA
Alk
alin
ity (
mg
CaC
O3/l
)
Fig. 5. System performance at decreased loading of OECD wastewater (a). Responses of on-line analysis (potential outputs of MFC and pH (b), gas flow rate and gas volume(c)) and off-line signals (gas content and alkalinity in the recirculation streams (d)).
Z. Liu et al. / Bioresource Technology 102 (2011) 10221–10229 10227
organic matter, while the increase afterwards indicated the de-pressed biodegradation due to decreased OLR. It should be notedthat the experiment was carried out immediately after the testingin Section 3.2.2, which resulted in the initial increase of alkalinityas shown in Fig. 5d.
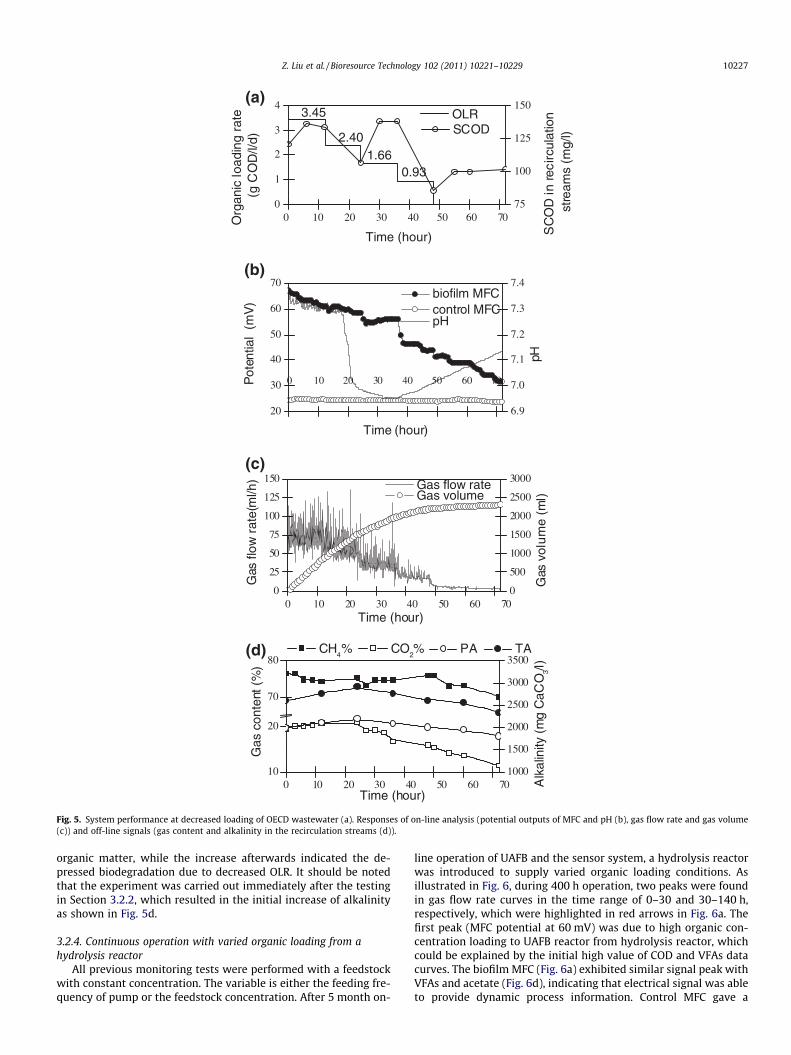
3.2.4. Continuous operation with varied organic loading from ahydrolysis reactor
All previous monitoring tests were performed with a feedstockwith constant concentration. The variable is either the feeding fre-quency of pump or the feedstock concentration. After 5 month on-
line operation of UAFB and the sensor system, a hydrolysis reactorwas introduced to supply varied organic loading conditions. Asillustrated in Fig. 6, during 400 h operation, two peaks were foundin gas flow rate curves in the time range of 0–30 and 30–140 h,respectively, which were highlighted in red arrows in Fig. 6a. Thefirst peak (MFC potential at 60 mV) was due to high organic con-centration loading to UAFB reactor from hydrolysis reactor, whichcould be explained by the initial high value of COD and VFAs datacurves. The biofilm MFC (Fig. 6a) exhibited similar signal peak withVFAs and acetate (Fig. 6d), indicating that electrical signal was ableto provide dynamic process information. Control MFC gave a

0 100 200 300 4000
10
20
30
40
50
60
0
20
40
60
80
Gas
flo
w r
ate
(ml/h
)
Control MFC Biofilm MFC
Po
ten
tial
(m
V)
Time (h)
Gas flow rate
0 100 200 300 4000
2
4
6
8
0
20
40
60
80
100
CO
D (
g/L
)
Time (h)
TCOD SCOD
TCOD removal
SC
OD
rem
ova
l (%
)
0 100 200 300 4000
1000
2000
3000
4000
5000
0
10
20
30
VF
As
in s
trea
ms
fro
m
Hyd
roly
sis
reac
tor
(mg
/l)
Time (h)
TVFAs_H Acetic acid_H TVFAs_B Acetic acid_B
VF
As
in s
trea
ms
fro
m
Bio
gas
rea
cto
r (m
g/l)
0 100 200 300 4000
20
40
60
80
100
4
5
6
7
8
9
Gas
co
nte
nt
(%)
Time (h)
CH4_H CH
4_B
CO2_H CO
2_B
pH_H pH_B
pH
(a)
(b)
(c)
(d)
Fig. 6. On-line signals (potential outputs of MFC and gas flow rate (a)) and off-lineanalysis (COD and COD removal (b), gas content and pH (c), VFAs and acetate acid(d)) in UAFB reactor continuously fed with the leachate from the reactor forhydrolysis of solid potato. H refers to hydrolysis reactor, and B refers to the UAFBbiogas reactor. The positions of two peaks in gas flow rate curves were highlightedin red arrows. (For interpretation of the references to colour in this figure legend,the reader is referred to the web version of this article.)
10228 Z. Liu et al. / Bioresource Technology 102 (2011) 10221–10229
relative delayed signal peak compared with biofilm MFC. The sec-ond peak of MFC sensor curve (30–140 h) had correlations withthat of gas flow rate, VFAs and pH of influent to UAFB reactorand even CO2 content of hydrolysis reactor (Fig. 6b–d). This wasprobably due to the biodegradation of solid potato. Hydrolysiswas almost completed when the pH of hydrolysis reactor wentup to over seven and the CO2 content of hydrolysis reactor de-creased to less than 20% (Fig. 6c). In comparison with gas flow me-ter and control MFC, biofilm MFC displayed a more complex signalvariation for the second peak, which may support the multi-stepcomplex biodegradation process of potato.
VFAs had been considered as one of the best and most promis-ing monitoring parameters since they indicate the metabolic statusand activity of microbial groups in AD system (Björnsson, 2000;Boe et al., 2007, 2010). System imbalance due to organic overloador inhibition of methane production can lead to the accumulationof VFAs (Spanjers and van Lier, 2006). This experiment clearlyshows that the electrical signal from MFC biosensor was highlydependent on the intermediates concentration (mainly acetate)of AD. The metabolic state of AD was monitored by the usage ofthe biofilm respiration in MFC biosensor. Thus, MFC biosensorcould provide important process information for the optimizationand management of AD.
One major limit of current biosensor design is that sensor signalreached saturated state when organic loading rate went beyond3 g l�1 d�1, resulting in the over-accumulation of acetate. The highconcentration of acetate will limit the microbial activity of MFC an-ode (as discussed in Section 3.2.2) although acetate is the true sub-strate of MFC. However, the linearity range of MFC can certainly beenlarged by different approaches, such as design of better electrodematerials with increased surface area (Logan, 2008) and improvedcathode performance with an air cathode (Di Lorenzo et al., 2009).
Compared with our previous work (Kumlanghan et al., 2007),current MFC biosensor exhibited many improvements and differ-ences. Firstly, in principle, instead of using suspended consortiumfrom an anaerobic digester, current MFC biosensor was establishedusing a mature biofilm catalyst. One dominant advantage of bio-film MFC is its long-term stability (Gil et al., 2003). With regardsto the previous work, the experiment on the stability was testedwithin only 12 days, which was due to the reason that the electri-cal signal may be variable during the enrichment of consortium(Kumlanghan et al., 2007). The essential difference of microorgan-isms also influences the performance of sensor. The microbial pop-ulation of mature biofilm system in this study were relativelystable in comparison with that of suspended consortium, thusleading to better accuracy and repeatability of MFC biosensor. Withregards to other sensors based on the electrochemical or physicalprinciples (Spanjers and van Lier, 2006; Jacobi et al., 2011), theywill have more stability than MFC biosensor based on the biochem-ical reactions although current biofilm MFC has the performance oflong-term stability due to the nature of biofilm. One effective wayis to make calibrations of MFC biosensor regularly e.g. every fewmonths. Furthermore, the detected substrate is different. It is wellknown that biofilm MFC can consume acetate like fermentationintermediates due to the ability of electroactive biofilm for quanti-tatively converting acetate into electricity, which was almostimpossible for suspended consortium. The MFC in previous workis just like control MFC of current study, which had to be accumu-lated for a couple of months prior to use for process monitoring.Secondly, it was the first time that MFC concept was reported tobe used for online monitoring of AD. Moreover, quite a numberof online (pH, gas flow rate) and offline (gas content, VFAs) param-eters were measured to justify and evaluate the performance ofMFC. Finally, distinguished from previously used H-type configura-tion, current MFC sensor was designed in a novel flow-throughwall-jet architecture. Several key characters including continuous
operation, portability, stable cathode electrochemical reactionswere taken into account.
One potential advantage of this MFC sensor is low constructioncost. The major cost of MFC comes from proton exchange member(PEM). However, as a sensor device, MFC can be designed as small

Z. Liu et al. / Bioresource Technology 102 (2011) 10221–10229 10229
as possible, therefore the material cost of PEM can be minimized.Furthermore, different from other biosensors, which normally re-quire proper configuration for setting up sensing element andtransducer, these two parts are very well integrated into MFC.
Another advantage is that MFC biosensor is positioned in situ inthe liquid recirculation loop. The independent design makes it pos-sible to compatible with any type of reactors. Besides this, the MFCbiosensor can be set for online monitoring with a sampling fre-quency of 1 min which is much shorter than many other reportedsampling intervals from other online sensors.
Further works are expected by the use of online real time MFCbiosensor. First, MFC biosensor can be tested for the monitoring ofAD in field. It is possible and promising since current MFC sensor isportable and simple. Second, due to the working principle of cur-rent MFC for acetate detection, MFC signals could be used as a pro-cess indicator. The anaerobic degradability of organic substrate canalso be offline evaluated through a manometric system within1 week test (Scaglione et al., 2008), which may provide additionalsubstrate support for MFC sensor participated process analysis.Combined analysis based on different sensors had been proved toprovide crucial support for the process diagnosis and control ofAD (Liu, 2003; Boe et al., 2010). MFC biosensor can be coupled withother measurements, for instance substrate (Jacobi et al., 2011;Scaglione et al., 2008), gas flow (Liu et al., 2004a) and pH, and withdifferent control approaches to seek optimal control strategies forthe operation of AD.
4. Conclusion
Current results demonstrated a novel design of MFC biosensorfor bioprocess monitoring. A stable electrical signal from MFCwas demonstrated to give a comparable result with other com-monly used analysis of AD in the operations of different processconfigurations. The MFC biosensor offers a new approach to reflectthe real time microbial activity of bioprocess by the detection ofacetate and hence indicates valuable process information. Thisstudy introduced MFC concept to the field of monitoring and con-trol of AD, thus expanding the applicability of MFC.
Acknowledgements
The Swedish International Development and CooperationAgency for Swedish Research Link Programme (SIDA-VR) and TheSwedish Institute (Guest Scholarship Programme, No. 05391/2006) were gratefully acknowledged for the financial support. Dr.Songping Zhang acknowledges the support from Scientific Re-search Foundation for the Returned Overseas Chinese Scholars,State Education Ministry (No. 2006-331).
References
APHA, 1985. Standard Methods for the Examination of Water and Wastewater,16th ed. American Public Health Association, Washington DC, USA.
Boe, K., Batstone, D.J., Angelidaki, I., 2007. An innovative online VFA monitoringsystem for the anaerobic process, based on headspace gas chromatography.Biotechnol. Bioeng. 96, 712–721.
Boe, K., Batstone, D.J., Steyer, J.P., Angelidaki, I., 2010. State indicators for monitoringthe anaerobic digestion process. Water Res. 44, 5973–5980.
Björnsson, L., 2000. Intensification of the Biogas Process by Improved ProcessMonitoring and Biomass Retention. PhD Thesis, Lund University, Sweden.
Bond, D.R., Holmes, D.E., Tender, L.M., Lovley, D.R., 2002. Electrode-reducingmicroorganisms that harvest energy from marine sediments. Science 295, 483–485.
Chang, I.S., Jang, J.K., Gil, G.C., Kim, M., Kim, H.J., Cho, B.W., Kim, B.H., 2004.Continuous determination of biochemical oxygen demand using microbial fuelcell type biosensor. Biosens. Bioelectron. 19, 607–613.
Chang, I.S., Moon, H., Jang, J.K., Kim, B.H., 2005. Improvement of a microbial fuel cellperformance as a BOD sensor using respiratory inhibitors. Biosens. Bioelectron.20, 1856–1859.
Di Lorenzo, M., Curtis, T.P., Head, I.M., Scott, K., 2009. A single-chamber microbialfuel cell as a biosensor for wastewaters. Water Res. 43, 3145–3154.
Gerardi, M.H., 2003. The Microbiology of Anaerobic Digestion. John Wiley & SonsInc., New Jersey, USA.
Gil, G.C., Chang, I.S., Kim, B.H., Kim, M., Jang, J.K., Park, H.S., Kim, J., 2003. Operationalparameters affecting the performance of a mediator-less microbial fuel cell.Biosens. Bioelectron. 18, 327–334.
Gujer, W., Zehnder, A.J.B., 1983. Conversion processes in anaerobic digestion. WaterSci. Technol. 15, 127–167.
Jacobi, H.F., Moschner, C.R., Hartung, E., 2011. Use of near infrared spectroscopy inonline-monitoring of feeding substrate quality in anaerobic digestion.Bioresour. Technol. 102, 4688–4696.
Kumlanghan, A., Liu, J., Thavarungkul, P., Kanatharana, P., Mattiasson, B., 2007.Microbial fuel cell-based biosensor for fast analysis of biodegradable organicmatter. Biosens. Bioelectron. 22, 2939–2944.
Karube, I., Matsunaga, T., Mitsuda, S., Suzuki, S., 1977. Microbial electrode BODsensors. Biotechnol. Bioeng. 19, 1535–1547.
Liu, J., 2003. Instrumentation, Control and Automation in Anaerobic Digestion. PhDThesis, Lund University, Sweden.
Liu, J., Olsson, G., Mattiasson, B., 2003. Advanced monitoring and control of ananaerobic up-flow fixed bed reactor for high loading rate operation anddisturbances rejection. Biotechnol. Bioeng. 87, 43–53.
Liu, J., Olsson, G., Mattiasson, B., 2004a. A volumetric meter for monitoring of low gasflow rate from laboratory-scale biogas reactors. Sens. Actuators B 97, 369–372.
Liu, J., Olsson, G., Mattiasson, B., 2004b. On-line monitoring of a two-stage anaerobicdigestion process using a BOD analyzer. J. Biotechnol. 109, 263–275.
Liu, H., Ramnarayanan, R., Logan, B.E., 2004c. Production of electricity duringwastewater treatment using a single chamber microbial fuel cell. Environ. Sci.Technol. 38, 2281–2285.
Liu, Z., Liu, J., Zhang, S., Su, Z., 2009. Study of operational performance and electricalresponse on mediator-less microbial fuel cells fed with carbon- and protein-richsubstrates. Biochem. Eng. J. 45, 185–191.
Logan, B.E., Hamelers, B., Rozendal, R., Schröder, U., Keller, J., Freguia, S., Aelterman,P., Verstraete, W., Rabaey, K., 2006. Microbial fuel cells: methodology andtechnology. Environ. Sci. Technol. 40, 5181–5192.
Logan, B.E., 2008. Microbial Fuel Cell. John Wiley & Sons, New Jersey, USA, ISBN9780470239483.
Méndez-Acosta, H.O., Palacios-Ruiz, B., Alcaraz-Gonzlez, V., González-Álvarez, V.,García-Sandoval, J.P., 2010. A robust control scheme to improve the stability ofanaerobic digestion processes. J. Process Contr. 20, 375–383.
Moon, H., Chang, I.S., Kim, B.H., 2006. Continuous electricity production fromartificial wastewater using a mediator-less microbial fuel cell. Bioresour.Technol. 97, 621–627.
Morel, E., Tartakovsky, B., Perrier, M., Guiot, S.R., 2007. Temperature-based controlof an anaerobic reactor using a multi-model observer-based estimator. Environ.Sci. Technol. 41, 978–983.
Nges, I.A., Liu, J., 2009. Effects of anaerobic pre-treatment on the degradation ofdewatered-sewage sludge. Renew. Energ. 34, 1795–1800.
Organisation for Economic Cooperation, Development (OECD), 2001. Aerobicsewage treatment, activated sludge units. OECD Guidel. Testing Chem. 303,1–38.
Pant, D., Bogaert, G.V., Diels, L., Vanbroekhoven, K., 2010. A review of the substratesused in microbial fuel cells (MFCs) for sustainable energy production. Bioresour.Technol. 101, 1533–1543.
Potter, M.C., 1911. Electrical effects accompanying the decomposition of organiccompounds. Proc. R. Soc. Lond. B 84, 260–276.
Rabaey, K., Verstraete, W., 2005. Microbial fuel cells: novel technology for energyproduction. Trends Biotechnol. 23, 291–298.
Scaglione, D., Caffaz, S., Ficara, E., Malpei, F., Lubello, C., 2008. A simple method toevaluate the short-term biogas yield in anaerobic codigestion of WAS andorganic wastes. Water Sci. Technol. 58, 1615–1622.
Scherer, P., Lehmann, K., Schmidt, O., Demirel, B., 2009. Application of a fuzzy logiccontrol system for continuous anaerobic digestion of low buffered, acidicenergy crops as mono-substrate. Biotechnol. Bioeng. 102, 736–748.
Spanjers, H., van Lier, J.B., 2006. Instrumentation in anaerobic treatment – researchand practice. Water Sci. Technol. 53, 63–76.
Tront, J.M., Fortner, J.D., Plötze, M., Hughes, J.B., Puzrin, A.M., 2008. Microbial fuelcell biosensor for in situ assessment of microbial activity. Biosens. Bioelectron.24, 586–590.
van Lier, J.B., Tilche, A., Ahring, B.K., Macarie, H., Moletta, R., Dohanyos, M., Hulshoff,Pol, L.W., Lens, P., Verstraete, W., 2001. New perspectives in anaerobicdigestion. Water Sci. Technol. 43, 1–18.
Vaiopoulou, E., Melidis, P., Aivasidis, A., 2011. Process control, energy recovery andcost savings in acetic acid wastewater treatment. J. Hazard. Mater. 186, 1141–1146.
Virdis, B., Rabaey, K., Rozendal, R.A., Yuan, Z., Keller, J., 2010. Simultaneousnitrification, denitrification and carbon removal in microbial fuel cells. WaterRes. 44, 2970–2980.
Ward, A.J., Hobbs, P.J., Holliman, P.J., Jones, D.L., 2008. Optimisation of the anaerobicdigestion of agricultural resources. Bioresour. Technol. 99, 7928–7940.


