BIOENERGYAND BIOFUELS
Microbial community structure and dynamicsduring anaerobic digestion of various agriculturalwaste materials
Ayrat M. Ziganshin & Jan Liebetrau & Jürgen Pröter &
Sabine Kleinsteuber
Received: 1 October 2012 /Revised: 18 March 2013 /Accepted: 20 March 2013 /Published online: 28 April 2013# Springer-Verlag Berlin Heidelberg 2013
Abstract The influence of the feedstock type on the microbialcommunities involved in anaerobic digestion was investigatedin laboratory-scale biogas reactors fed with different agricul-tural waste materials. Community composition and dynamicsover 2 months of reactors’ operation were investigated byamplicon sequencing and profiling terminal restriction frag-ment length polymorphisms of 16S rRNA genes. Major bac-terial taxa belonged to the Clostridia and Bacteroidetes,whereas the archaeal community was dominated bymethanogenic archaea of the orders Methanomicrobiales andMethanosarcinales. Correlation analysis revealed that thecommunity composition was mainly influenced by the feed-stock type with the exception of a temperature shift from 38 to55 °C which caused the most pronounced community shifts.Bacterial communities involved in the anaerobic digestion ofconventional substrates such as maize silage combined withcattle manure were relatively stable and similar to each other.In contrast, special waste materials such as chicken manure orJatropha press cake were digested by very distinct and lessdiverse communities, indicating partial ammonia inhibition or
the influence of other inhibiting factors. Anaerobic digestion ofchicken manure relied on syntrophic acetate oxidation as thedominant acetate-consuming process due to the inhibition ofaceticlastic methanogenesis. Jatropha as substrate led to theenrichment of fiber-degrading specialists belonging to thegenera Actinomyces and Fibrobacter.
Keywords Biogas . Co-digestion . 16S rRNA genes .
T-RFLP . Pyrosequencing
Introduction
Accumulation of agricultural, municipal, and industrialwastes results in contamination of the environment. Oneof the most effective and sustainable methods to reduceharmful effects of these wastes on the environment istheir treatment under anaerobic conditions. Anaerobicdigestion destructs the significant portion of organiccontent of waste products and leads to production of arenewable energy source, biogas. While distinct energycrops are used for commercial production of bioethanoland fatty acid methyl esters (biodiesel), biogas produc-tion does not depend on specific energy crops but canalso utilize residual biomass and various organic wastes.Such biowaste treatment reduces the negative effects onthe environment and contributes further to the economicbenefit of this approach. In many cases, digestates canbe used as high-quality organic fertilizers in agriculture(Weiland 2010).
Due to low carbon content, the anaerobic digestion ofmanure results in relatively low biogas yields. This makescommercial production of biogas from manure economicallyunprofitable. Co-digestion of such biowastes with other bio-mass substrates is a very attractive solution for improving thefermentation process, as it results in better distribution of
Electronic supplementary material The online version of this article(doi:10.1007/s00253-013-4867-0) contains supplementary material,which is available to authorized users.
A. M. ZiganshinDepartment of Microbiology, Kazan (Volga Region) FederalUniversity, Kazan 420008, Russia
J. Liebetrau : J. PröterDepartment of Biochemical Conversion, DeutschesBiomasseforschungszentrum (DBFZ), Torgauer Str. 116,04347 Leipzig, Germany
S. Kleinsteuber (*)Department of Environmental Microbiology, Helmholtz Centrefor Environmental Research (UFZ), Permoserstr. 15,04318 Leipzig, Germanye-mail: [email protected]
Appl Microbiol Biotechnol (2013) 97:5161–5174DOI 10.1007/s00253-013-4867-0

nutrients and trace elements in bioreactors, supporting micro-bial activity and providing potential for higher methane yield(Holm-Nielsen et al. 2009; El-Mashad and Zhang 2010).However, the extensive use of maize as energy crop, ascurrently practiced in Germany, has been come under criticismfor its negative effects on agro-ecosystems. To develop moresustainable bioenergy systems, the exploitation of agriculturalwaste material and by-products such as straw or other ligno-cellulosic feedstock not competing with food production is anoption. The cascade usage of biomass for the production ofvarious fuels such as biodiesel, bioethanol, and biogas or othervaluable products improves the ecobalance of energy crops.For instance, stillage from bioethanol production or press cakefrom oil seeds used for biodiesel production still containsconsiderable percentages of organic carbon which can beconverted to methane in anaerobic digestion. However,the composition of such residual biomass is often chal-lenging in anaerobic digestion processes due to imbal-anced C/N ratios, high fiber content, or the presence ofcompounds inhibiting microbial activity. For instance,protein-rich biomass such as stillage or press cake canlead to ammonia or sulfide inhibition, whereas ligno-cellulosic biomass is recalcitrant to anaerobic hydroly-sis. Also animal excrements such as poultry dung aremore problematic than conventional cattle manure dueto the high nitrogen content leading to ammonia inhi-bition. Therefore, the development of adapted conver-sion technologies requires a detailed understanding ofthe microbial processes in anaerobic digestion ofnonconventional biomass.
Anaerobic degradation of biomass with biogas productionoccurs by distinct bacterial and archaeal consortia. Microbialactivity and composition of the biogas depend on the substratetype. The first three phases of anaerobic digestion—hydroly-sis, acidogenesis, and acetogenesis—occur by distinct bacte-rial consortia, while the fourth step of methanogenesis iscarried out by specialized groups of methanogenic archaea.During the last years, various molecular methods have beendescribed to analyze the community structure of differentfunctional groups of microbes. PCR primers were developedtargeting 16S rRNA genes as a phylogenetic marker as well asmetabolic key genes reflecting specific functional groups. Theapplication of these molecular approaches disclosed that mostmicroorganisms in natural habitats as well as in biogas re-actors are still uncultivated. Their isolation and cultivationwould provide a deeper understanding of the ecology andfunctions of these microbial consortia (Narihiro andSekiguchi 2007). Phylogenetic and metabolic marker genesfor studying microbial populations in anaerobic digesters arewidely used, most frequently targeting methanogenic archaea(Lee et al. 2009; O’Reilly et al. 2009; Steinberg and Regan2009). The reason that most community analyses in anaerobicdigesters target methanogenic archaea is that they are less
diverse than bacteria and represent the bottleneck of the wholeprocess under conditions of process failure, due to a lack offunctional redundancy. In contrast to other anaerobic digestionprocesses, the rate-limiting step in the digestion of lignocellu-losic biomass is the hydrolysis due to the poor bioavailabilityof organic carbon within plant fibers under anaerobic condi-tions. Moreover, process failures leading to an inhibition ofmethanogenesis also affect acetogenic bacteria which rely ona syntrophic process with hydrogenotrophic and aceticlasticmethanogens (Demirel and Scherer 2008). Such disturbanceson the level of acetogenesis are reflected by the accumulationof volatile fatty acids in a malfunctioning reactor, a parameterwhich is also used for process control (Gerardi 2003). For bothreasons—the limitation of hydrolysis in the digestion of lig-nocellulosic biomass and the inhibition of acetogenesis underspecific process conditions—community analyses should alsoconsider the bacterial consortia. However, data on qualitativeand quantitative bacterial community shifts depending on thesubstrate type and process parameters are still meager.Therefore, investigation of both bacterial and archaealcommunity dynamics during the digestion of agriculturalby-products in combination with process monitoringshould provide insights into microbial community be-havior and interactions as a prerequisite to improve theanaerobic digestion process. Temporal changes in com-position of microbial consortia in the environment canbe effectively analyzed using molecular techniques suchas terminal restriction fragment length polymorphism (T-RFLP) analysis of phylogenetic and metabolic markergenes (Abdo et al. 2006).
In this study, the impact of substrate type on the efficien-cy of anaerobic digestion and concomitant dynamics of thebacterial and archaeal communities were investigated in 11laboratory-scale continuous stirred biogas reactors. The fol-lowing agricultural waste materials served as feedstock:chicken manure combined with cattle manure, cattle manurealone or in combination with maize straw or distillers grains,and Jatropha press cake. For comparison, cattle manurecombined with maize silage was used as a conventionalfeedstock. Jatropha sp. is a widely used energy plant forcommercial production of biodiesel. After extraction of oilfrom Jatropha nascent, residual biomass was tested here as apossible substrate for biogas generation. Bacteria participat-ing in the anaerobic digestion of Jatropha residues were notyet reported in the literature. The composition and dynamicsof microbial communities during bioreactors operation wereinvestigated by molecular methods targeting 16S rRNAgenes. T-RFLP fingerprinting was performed on 16SrRNA amplicons retrieved at three different sampling times.The correlation of community composition with substratesand process parameters was analyzed by multivariatestatistics to identify the key factors shaping the bacterialand archaeal community structure.
5162 Appl Microbiol Biotechnol (2013) 97:5161–5174
Materials and methods
Lab-scale biogas reactors and running conditions
Table 1 shows the biogas reactors’ running conditions andfeedstock composition. The study was started after all re-actors had been running under stable conditions for at leastthe threefold hydraulic retention time (HRT) to ensure sta-tionary conditions. The reactors were operated at mesophilictemperatures (37–40 °C) with one exception: reactors R 4.5and R 4.6 were shifted to thermophilic conditions (55 °C)between the second and the third sampling points. All re-actors were fed every day, and the digestates were taken outevery day as well. Biogas volume and composition as wellas pH values were measured every day, while acid capacity,volatile fatty acids (VFA), and ammonium concentrationswere determined twice per week. Samples for microbialcommunity analyses were taken at three distinct times: 29September 2009 (day 1), 2 November 2009 (day 35), and 30November 2009 (day 63).
Measurement of process parameters and analytical techniques
Biogas production was measured by using milligascountersMGC-1 and drum-type gas meters TG 05 (Ritter, Germany),whereas biogas composition was analyzed with an infra-redlandfill gas analyzer GA 94 (Ansyco, Germany). For am-monium analysis, Nessler’s reagent (Merck, Germany) wasadded to the liquid phase of the reactor effluents, and sam-ples were then assayed with a DR/2000 spectrophotometerat 425 nm (Hach Company, USA). Acid capacity of theeffluents was determined by titration with 0.025–0.1 MH2SO4 in a pH range of 4.5 and 3.5 using a TitrationExcellence T90 titrator (Mettler-Toledo, Switzerland). VFAwere analyzed on a 5890 series II gas chromatograph(Hewlett Packard, USA) equipped with an Agilent HP-FFAP column (30 m×0.32 mm×0.25 μm) as described byZiganshin et al. (2011). The samples were analyzed afteradding of 0.5 mL of 85 % H3PO4 and 3.0 mL of the aqueouseffluents into 10 mL vials. The vials were then closedtightly, and the gaseous phase was injected into the GC.Acetate, propionate, butyrate, isobutyrate as well as othersodium salts of organic acids were used as standards(Sigma-Aldrich, Germany). All chemicals used in this workwere of analytical or higher grade.
Sequencing and T-RFLP fingerprinting of 16S rRNA genes
From the digester effluent of each reactor, 15 mL sampleswere withdrawn and instantly used for DNA extraction.Samples were sedimented by centrifugation at 20,000×gfor 10 min. DNA was then extracted and purified from0.5 g of sediment using a FastDNA SPIN Kit for soil (MP
Biomedicals, Germany) and quantified with a NanoDrop®ND-1000 UV–vis spectrophotometer (ThermoFisherScientific, Germany).
Bacterial 16S rRNA gene fragments were PCR-amplifiedwith the primers Bac27F (5′-GAG TTT GAT CMT GGCTCA G-3′) and Bac519R (5′-GWA TTA CCG CGG CKGCTG-3′) using the Phire Hot Start II DNA Polymerase(Thermo Scientific). After 25 cycles, additional ten cycleswere performed applying 454 fusion primers tagged withmultiplex identifier sequences. Amplicons were purifiedfrom an agarose gel using the MinElute Gel Extraction Kit(Qiagen) and quality-checked on an Agilent 2100Bioanalyzer. Fluorometric quantitation and preparation ofthe amplicon library were performed as described in the GSJunior Amplicon Library Preparation Method Manual(Roche). Amplicons from 13 samples (one of each reactorat the second sampling time and additionally the third sam-pling times from reactors R 4.5 and R 4.6) were pooled andapplied for emulsion PCR using the Lib-L emPCR Kit(Roche). Pyrosequencing of the library was run on a GSJunior picotiter plate according to the manufacturer’s rec-ommendations. Analysis of raw data and sorting of themultiplex identifiers was done using the GS Junior software.The sequences were further processed using the RDPpyrosequencing pipeline (http://pyro.cme.msu.edu/). TheRDP Classifier was used for the taxonomic assignment(http://rdp.cme.msu.edu).
Archaeal 16S rRNA gene fragments were PCR-amplifiedand cloned as previously described (Ziganshin et al. 2011)with the exception that the forward primer UniArc21F (5′-TTC YGK TTG ATC CYG SCR G-3′) was used for theamplification of archaeal 16S rRNA genes. Recombinantclones were picked up and screened for the suitable insertsize in PCR reactions using the vector-specific primersM13uni(−21) and M13rev(−29). The clone libraries wereanalyzed for restriction fragment length polymorphisms ap-plying the restriction endonuclease HaeIII (New EnglandBiolabs, Germany). Restriction patterns were clusteredusing the Phoretix 1D software (Nonlinear Dynamics,UK). Representative clones from each cluster were partiallysequenced as described by Ziganshin et al. (2011). Thesequences were compared to the NCBI database using thenucleotide Basic Local Alignment Search Tool (BLAST)program (http://www.ncbi.nlm.nih.gov/BLAST) and taxo-nomically assigned according to the RDP Classifier. Datawere checked for chimeric sequences using Bellerophon(http://comp-bio.anu.edu.au/bellerophon/bellerophon.pl).The partial archaeal 16S rRNA gene sequences were depos-ited in the GenBank database under the accession nos.KC412560–KC412633.
T-RFLP analysis of 16S rRNA amplicons was performedas described recently (Ziganshin et al. 2011), using therestriction enzymes HaeIII and RsaI for bacterial amplicons
Appl Microbiol Biotechnol (2013) 97:5161–5174 5163

Tab
le1
Operatin
gcond
ition
sof
thelab-scalebiog
asreactors
atthethreesamplingtim
es(sam
ple1,
29September20
09;sample2,
2Nov
ember20
09;sample3,
30Nov
ember20
09)
Reactor
Sam
ple
Volum
e(L)
Operatin
gtemperature
(°C)
Organic
loading
rate
(gVSL−1day−
1)
Inlet(g
d–1)
Hyd
raulic
retentiontim
e(d)
Cattle
manure
Chicken
manure
DDGS
Maize
silage
aMaize
straw
Jatrop
hapresscake
FerroSorp®
DGb
Sum
c
(mLd−
1)
R3.1
136
.540
1.78
454.0
112.0
––
––
–56
764
.4
22.42
567.0
140.0
––
––
–70
851
.6
32.84
649.0
160.0
––
––
–81
045
.1
R4.5
112
.038
2.43
529.0
––
––
––
530
22.6
28.0
392.45
308.0
––
––
––
333
24.0
38.0
550.50
69.0
––
––
––
333
24.0
R4.6
18.0
382.45
178.6
–11.6
––
––
333
24.0
239
2.45
154.1
–10
.4–
––
–33
324
.0
354
0.50
34.54
–2.4
––
––
333
24.0
R4.8
110
.037
1.50
182.5
––
17.5
––
–40
025
.0
21.50
182.5
––
17.5
––
–40
025
.0
31.50
182.5
––
17.5
––
–40
025
.0
R4.13
130
.038
2.47
723.6
––
–28
.2–
–85
735
.0
22.37
518.7
––
–26
.3–
–85
735
.0
32.39
694.6
––
–26
.3–
–85
735
.0
R4.14
130
.038
2.47
723.6
––
–28
.2–
–85
735
.0
22.37
518.7
––
–26
.3–
–85
735
.0
32.39
694.6
––
–26
.3–
–85
735
.0
R4.15
130
.038
2.40
723.6
––
–83
.7–
–85
735
.0
22.29
518.7
––
–78
.1–
–85
735
.0
32.30
694.6
––
–78
.1–
–85
735
.0
R4.16
130
.038
2.40
723.6
––
–83
.7–
–85
735
.0
22.29
518.7
––
–78
.1–
–85
735
.0
32.30
694.6
––
–78
.1–
–85
735
.0
R4.17
110
0.0
382.00
1000
.0–
–46
5.0
––
–14
6568
.3
22.40
2000
.0–
–40
0.0
––
–24
0041
.7
32.50
1000
.0–
–62
0.0
––
–16
2061
.7
R4.19
19.0
381.84
––
––
–20
.0–
225
40.0
22.00
––
––
–21
.7–
225
40.0
32.20
––
––
–23
.6–
225
40.0
R4.20
19.0
381.84
––
––
–20
.0–
225
40.0
22.00
––
––
–21
.7–
225
40.0
32.20
––
––
–23
.51.4
225
40.0
DDGSDried
distillersgrains
with
solubles
aExtrudedmaize
straw
was
supp
liedin
R4.15
andR4.16
bFerrosorp®DG,apo
wdery
desulfurizationsubstance,was
purchasedfrom
HeG
oBiotec(G
ermany)
cTap
water
was
addedun
tilthefinalinfluent
volumewas
reached
5164 Appl Microbiol Biotechnol (2013) 97:5161–5174

and HaeIII, RsaI, andMseI for archaeal amplicons (all restric-tion enzymes purchased from New England Biolabs). Noiseremoval, peak binning to account for inter-run differences interminal restriction fragment (T-RF) size and normalization ofsignal intensity were performed using an R script (R version2.12.2; http://www.r-project.org/) according to Abdo et al.(2006). Relative abundance of the individual T-RFs was cal-culated based on the relative peak area. Theoretical T-RFvalues of the sequenced clones were calculated using theNEBcutter V2.0 (http://tools.neb.com/NEBcutter2) and con-firmed experimentally by T-RFLP analysis using the corre-sponding clones as templates. Relative T-RF abundances ofrepresentative phylotypes were determined based on therelative peak areas of the corresponding T-RF.
Statistical analysis
A multivariate statistical analysis of the normalized sample-peak tables was performed by means of the R package “veg-an” (Oksanen 2011). Nonmetric multidimensional scaling(NMDS) analyses applying the Bray–Curtis similarity index(regarding the presence/absence as well as relative abundanceof T-RFs) were used to plot the rank order of similarity of T-RFLP profiles in a way that allows distances to be exactlyexpressed on a two-dimensional sheet (greater distances rep-resent greater dissimilarities). The major process parameterscorrelating with the community composition as well as withsingle T-RFs were fitted using the ‘envfit’ algorithm providedwith the ‘vegan’ package. The significance of single processparameters for the NMDS results was tested by means of aMonte Carlo test with 1,000 permutations.
Results
Performance of the biogas reactors
Table 2 shows the process parameters measured at threesampling times during the experimental period of 63 days.
Reactor R 3.1, fed with chicken manure and cattle manure,displayed the highest ammonia concentration (up to 5.93 g L−1
ammonium nitrogen) compared to the other reactors, which isdue to the high ammonia content of the chicken manure.Increasing the organic loading rate (OLR) from 1.78 to2.84 gVSL
−1 day−1 resulted in a drop of the biogas yield andthe accumulation of VFA with up to 9.9 g L−1 acetic acid,4.1 g L−1 propionic acid, 0.3 g L−1 iso-butyric acid, and0.6 g L−1 butyric acid at the third sampling time, indicating astrong inhibition of acetogenesis and methanogenesis.
Reactor R 4.5 fed with cattle manure as monosubstrateyielded lower amounts of biogas compared to reactor R 4.6co-digesting cattle manure and dried distillers grains withsolubles (DDGS) as long as the reactors were run under
mesophilic conditions. Between the second and the thirdsampling points, the temperature in R 4.5 and R 4.6 wasgradually increased from 39 to 55 °C, which was accompa-nied by the accumulation of VFA and a drop in the methanecontent. Therefore, the OLR was reduced from 2.45 to0.5 gVSL
−1 day−1 while maintaining the same HRT of24 days (Table 1).
Co-digestion of cattle manure and maize silage was carriedout in reactors R 4.8 and R 4.17. While a constant OLR of1.5 gVSL
−1 day−1 and a HRT of 25 days were applied inreactor R 4.8, the OLR in reactor R 4.17 was graduallyincreased from 2.0 to 2.5 gVSL
−1 day−1 and the HRT wasgradually decreased from 68.3 to 61.7 days (Table 1). ReactorR 4.17 reached the highest biogas yield with 715 mLNg
−1VS at
the first sampling time. However, reactor R 4.8 producedbiogas with a higher methane content of 58–60 % (Table 2).
Identical reactors R 4.13 and R 4.14 were operated inparallel with a feedstock composed of cattle manure and maizestraw, as well as identical reactors R 4.15 and R 4.16, whichwere supplied with cattle manure and extruded maize straw(Table 1). No significant difference with respect to biogas yieldor methane content was observed depending on the use ofuntreated or extruded straw. Moreover, the differences in per-formance between parallel reactors were the same or evenmore than between the two feedstock variants (Table 2).
Reactors R 4.19 and R 4.20 were run in parallel and fedwith Jatropha press cake as sole substrate. Compared to theother feedstocks, Jatropha press cake delivered biogas witha high methane content of ∼62–65 %. The ammonia levelswere comparably high with up to 3.76 g L−1 ammoniumnitrogen, which might be caused by the high protein contentof the feedstock. Between the second and the third samplingpoints, Ferrosorp® DG was added to R 4.20 to remove toxichydrogen sulfide. Although this additive decreased the hy-drogen sulfide content, it did not exert any significant effecton biogas yield or methane content (Table 2).
Bacterial community composition
The bacterial diversity in the various reactors was investigatedby amplicon sequencing of partial 16S rRNA genes. In total,144,092 quality-filtered reads were gained from the ampliconlibrary consisting of the 13 amplicon samples. Out of thesereads, 141,994 reads passed the RDP Classifier and wereassigned to bacterial 16S rRNA gene sequences. The numberof assigned reads per sample was between 5,115 and 20,056(see Electronic supplementary material (ESM) Table 1 fordetails). Figure 1 shows the relative abundance of the taxacomprising at least 1 % in at least one sample. Between 7 and34 % of the reads per sample were not assigned to any knownphylum (unclassified Bacteria). The most abundant phyla inall reactors were Firmicutes (23–79 %) and Bacteroidetes (8–44 %), with Clostridia (11–50 %) and Bacteroidia (5–30 %)
Appl Microbiol Biotechnol (2013) 97:5161–5174 5165

Tab
le2
Processparametersof
thelab-scalebiogas
reactorsatthethreesamplingtim
es(sam
ple1,
29September2009;sample2,
2Novem
ber2009;sample3,
30Novem
ber2009).Daily
measured
parameters(biogasproductio
n,yield,andcompositio
nas
wellaspH
)arepresentedas
weeklymeanvalues
(3days
beforeand3days
aftersam
pling).Standarddeviations
areshow
nforb
iogasyield(n=7)
Reactor
Sam
ple
Biogasprod
uctio
na
(LNd−
1L−1)
Biogasyielda
(mLNg−
1VS)
Biogascompositio
npH
Volatile
fatty
acids(m
gL−1)
Acidcapacity
(gL−1)
NH4+-N
(gL−1)
CH4(%
)CO2(%
)H2S(ppm
)Acetic
acid
Propionic
acid
Isobutyric
acid
Butyric
acid
R3.1
10.68
390±8
57.5
39.5
1,82
18.04
2,441
595
4616
6.09
5.17
20.77
315±9
57.3
41.8
1,68
27.90
5,430
1,98
818
346
9.57
5.17
30.82
290±21
57.0
41.6
2,98
97.96
9,867
4,05
832
462
015
.36
5.93
R4.5
10.61
253±5
65.5
33.7
~5,000
7.77
121
12b.d.
b.d.
1.46
1.86
20.85
348±49
63.3
36.2
2,67
37.66
ND
ND
ND
ND
1.66
2.01
30.30
593±20
44.2
55.0
2,25
77.51
2,219
405
85113
4.50
1.74
R4.6
11.27
518±22
64.5
34.8
~5,000
7.63
446
b.d.
b.d.
1.46
1.65
21.32
540±83
61.6
37.6
4,91
37.56
ND
ND
ND
ND
0.72
1.63
30.27
534±92
51.7
47.7
3,58
67.21
5,577
640
182
169
8.78
1.62
R4.8
10.51
337±44
58.2
40.2
900
7.65
3825
2b.d.
0.47
1.20
20.57
380±46
58.5
40.6
810
7.35
301
b.d.
b.d.
0.14
0.94
30.57
383±9
60.3
39.2
456
7.30
6311
33
0.45
0.80
R4.13
10.98
400±40
58.7
40.2
3,45
07.63
102
312
31.49
1.20
20.85
360±30
59.8
38.7
2,21
67.50
102
212
b.d.
1.90
1.24
30.80
330±50
55.6
42.9
2,14
57.61
871
126
63
1.80
1.16
R4.14
10.98
400±30
59.3
39.8
4,18
37.66
7114
22
1.42
1.22
20.90
380±40
58.4
40.2
1,92
87.53
250
383
21.66
1.28
30.88
370±50
56.7
42.1
2,09
27.58
445
382
b.d.
1.43
1.31
R4.15
10.95
390±40
58.1
41.1
~5,000
7.75
527
23
1.54
1.47
20.89
390±20
59.3
39.2
2,23
47.56
ND
ND
ND
ND
1.28
1.39
30.89
390±50
56.8
42.6
2,37
37.74
383
281
b.d.
1.37
1.26
R4.16
10.99
410±30
58.6
40.6
4,55
87.76
6816
39
1.51
1.54
20.87
380±30
59.0
40.1
2,05
67.54
145
12b.d.
b.d.
1.53
1.36
30.89
390±50
57.2
41.5
3,15
57.61
357
362
b.d.
1.37
1.27
R4.17
11.43
715±17
51.5
47.5
1,85
57.63
ND
ND
ND
ND
1.54
ND
21.41
588±42
52.6
47.0
3,58
37.47
ND
ND
ND
ND
6.97
ND
31.77
708±18
54.6
44.6
2,57
87.64
ND
ND
ND
ND
2.30
ND
R4.19
10.91
491±7
64.6
34.4
3,41
67.78
ND
ND
ND
ND
2.64
3.22
20.97
483±20
63.2
36.0
2,39
87.75
595
114
42.91
3.22
31.04
475±8
62.4
36.6
2,07
97.78
1,394
154
1711
3.55
3.72
R4.20
10.90
486±13
64.4
34.6
2,63
37.72
ND
ND
ND
ND
2.36
3.22
20.93
464±18
64.0
35.2
2,53
07.71
755
205
53.15
3.36
30.99
450±9
63.5
34.9
377.78
630
663
52.51
3.76
b.d.
below
detectionlim
it,ND
notdeterm
ined
aBiogasprod
uctio
ncorrectedforstandard
cond
ition
s(273
.15K
and10
1.32
5kP
a)
5166 Appl Microbiol Biotechnol (2013) 97:5161–5174
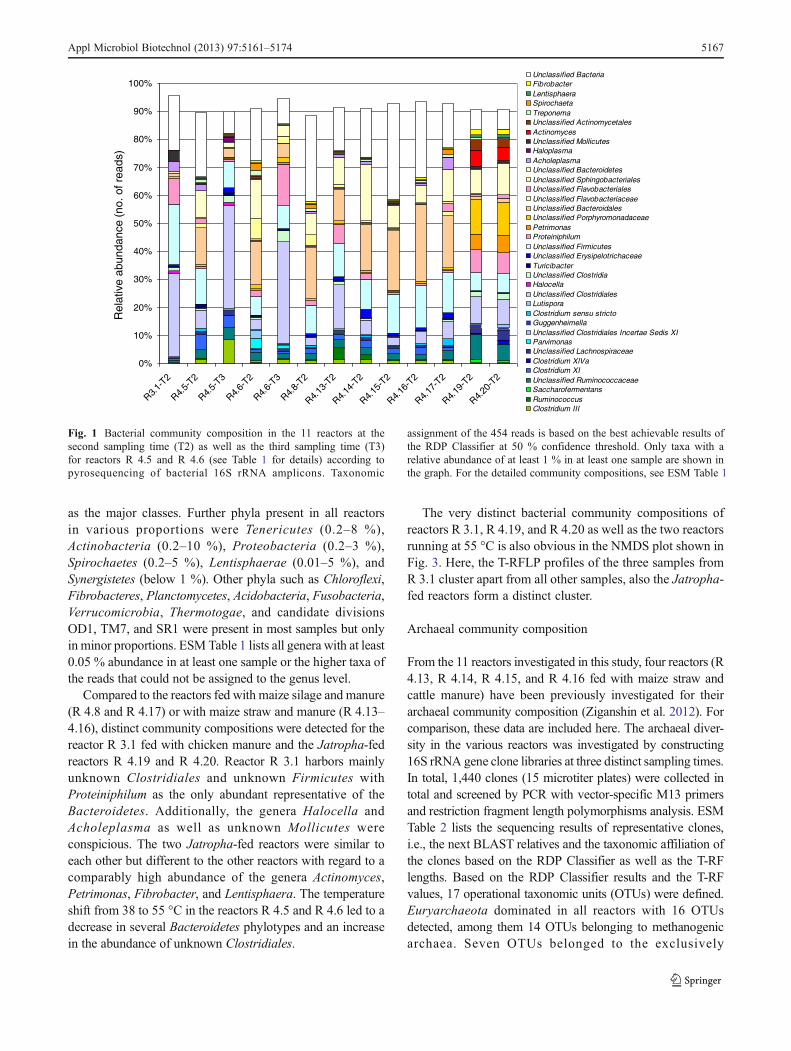
as the major classes. Further phyla present in all reactorsin various proportions were Tenericutes (0.2–8 %),Actinobacteria (0.2–10 %), Proteobacteria (0.2–3 %),Spirochaetes (0.2–5 %), Lentisphaerae (0.01–5 %), andSynergistetes (below 1 %). Other phyla such as Chloroflexi,Fibrobacteres, Planctomycetes, Acidobacteria, Fusobacteria,Verrucomicrobia, Thermotogae, and candidate divisionsOD1, TM7, and SR1 were present in most samples but onlyin minor proportions. ESM Table 1 lists all genera with at least0.05 % abundance in at least one sample or the higher taxa ofthe reads that could not be assigned to the genus level.
Compared to the reactors fed with maize silage and manure(R 4.8 and R 4.17) or with maize straw and manure (R 4.13–4.16), distinct community compositions were detected for thereactor R 3.1 fed with chicken manure and the Jatropha-fedreactors R 4.19 and R 4.20. Reactor R 3.1 harbors mainlyunknown Clostridiales and unknown Firmicutes withProteiniphilum as the only abundant representative of theBacteroidetes. Additionally, the genera Halocella andAcholeplasma as well as unknown Mollicutes wereconspicious. The two Jatropha-fed reactors were similar toeach other but different to the other reactors with regard to acomparably high abundance of the genera Actinomyces,Petrimonas, Fibrobacter, and Lentisphaera. The temperatureshift from 38 to 55 °C in the reactors R 4.5 and R 4.6 led to adecrease in several Bacteroidetes phylotypes and an increasein the abundance of unknown Clostridiales.
The very distinct bacterial community compositions ofreactors R 3.1, R 4.19, and R 4.20 as well as the two reactorsrunning at 55 °C is also obvious in the NMDS plot shown inFig. 3. Here, the T-RFLP profiles of the three samples fromR 3.1 cluster apart from all other samples, also the Jatropha-fed reactors form a distinct cluster.
Archaeal community composition
From the 11 reactors investigated in this study, four reactors (R4.13, R 4.14, R 4.15, and R 4.16 fed with maize straw andcattle manure) have been previously investigated for theirarchaeal community composition (Ziganshin et al. 2012). Forcomparison, these data are included here. The archaeal diver-sity in the various reactors was investigated by constructing16S rRNA gene clone libraries at three distinct sampling times.In total, 1,440 clones (15 microtiter plates) were collected intotal and screened by PCR with vector-specific M13 primersand restriction fragment length polymorphisms analysis. ESMTable 2 lists the sequencing results of representative clones,i.e., the next BLAST relatives and the taxonomic affiliation ofthe clones based on the RDP Classifier as well as the T-RFlengths. Based on the RDP Classifier results and the T-RFvalues, 17 operational taxonomic units (OTUs) were defined.Euryarchaeota dominated in all reactors with 16 OTUsdetected, among them 14 OTUs belonging to methanogenicarchaea. Seven OTUs belonged to the exclusively
Rel
ativ
e ab
unda
nce
(no.
of r
eads
)
0%
10%
20%
30%
40%
50%
60%
70%
80%
90%
100%
R3.1-T
2
R4.5-T
2
R4.5-T
3
R4.6-T
2
R4.6-T
3
R4.8-T
2
R4.13-
T2
R4.14-
T2
R4.15-
T2
R4.16-
T2
R4.17-
T2
R4.19-
T2
R4.20-
T2
Unclassified BacteriaFibrobacterLentisphaeraSpirochaetaTreponemaUnclassified ActinomycetalesActinomycesUnclassified MollicutesHaloplasma AcholeplasmaUnclassified BacteroidetesUnclassified SphingobacterialesUnclassified FlavobacterialesUnclassified FlavobacteriaceaeUnclassified BacteroidalesUnclassified PorphyromonadaceaePetrimonasProteiniphilumUnclassified FirmicutesUnclassified ErysipelotrichaceaeTuricibacterUnclassified ClostridiaHalocellaUnclassified ClostridialesLutisporaClostridium sensu strictoGuggenheimellaUnclassified Clostridiales Incertae Sedis XIParvimonasUnclassified LachnospiraceaeClostridium XlVaClostridium XIUnclassified RuminococcaceaeSaccharofermentansRuminococcusClostridium III
Fig. 1 Bacterial community composition in the 11 reactors at thesecond sampling time (T2) as well as the third sampling time (T3)for reactors R 4.5 and R 4.6 (see Table 1 for details) according topyrosequencing of bacterial 16S rRNA amplicons. Taxonomic
assignment of the 454 reads is based on the best achievable results ofthe RDP Classifier at 50 % confidence threshold. Only taxa with arelative abundance of at least 1 % in at least one sample are shown inthe graph. For the detailed community compositions, see ESM Table 1
Appl Microbiol Biotechnol (2013) 97:5161–5174 5167

hydrogenotrophicMethanomicrobiales and seven OTUs wereaffiliated to the Methanosarcinales comprising aceticlastic,methylotrophic, and mixotrophic methanogens. Withinthe Methanomicrobiales, the genera Methanoculleus,Methanocorpusculum, and Methanospirillum were identifiedwith Methanoculleus being the predominant genus. TheMethanosarcinales comprised representatives of the generaMethanosarcina, Methanosaeta, and Methanomethylovoranswith Methanosarcina and Methanosaeta as abundantgenera. Besides the methanogens, two OTUs comprisedEuryarchaeota affiliated to the Thermoplasmatales and oneOTU represented Crenarchaeota of the Thermoprotei group.
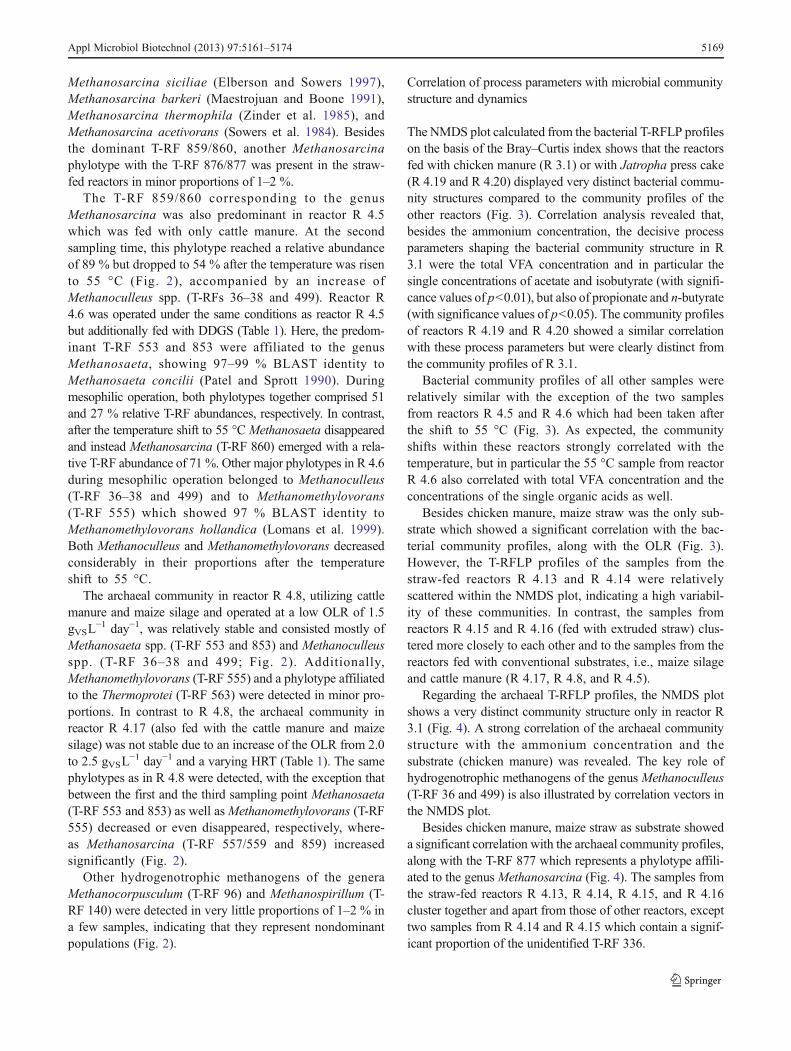
Community composition and dynamics were comparedby T-RFLP analysis applying three different restriction en-zymes—HaeIII, MseI, and RsaI. Figure 2 shows the T-RFLP profiles of the archaeal communities recorded withthe restriction enzyme MseI at the three sampling times. T-RFs were assigned to OTUs based on the sequence datacompiled in ESM Table 2. Most of the T-RFs with signifi-cant relative abundances were identified and it can be as-sumed that they represent the key methanogens in theanaerobic digestion of the various substrates.
The archaeal community in R 3.1 utilizing chicken andcattle manure was less diverse compared to all other reactors
and very stable during the experimental time. The archaealcommunity consisted almost completely of two phylotypesaffiliated to the hydrogenotrophic genus Methanoculleus(represented by the T-RF 36–38 and T-RF 499 in Fig. 2).Accordingly, in the NMDS plot shown in Fig. 4, the T-RFLP patterns of R 3.1 cluster apart from all other commu-nity profiles, illustrating the very distinct community com-position. OTU 1 represented by the T-RF 36–38 showed aBLAST identity of 98–99 % to Methanoculleus bourgensis(Ollivier et al. 1986; Asakawa and Nagaoka 2003) andMethanoculleus chikugoensis (Dianou et al. 2001), whereasthe OTU 2 with the T-RF 499 shared 99 % identity withMethanoculleus receptaculi (Cheng et al. 2008). Both OTUswere found in all reactors but in different proportions,indicating that they are ubiquitous key players ofhydrogenotrophic methanogenesis in biogas reactors.
The straw-fed reactors R 4.13, R 4.14, R 4.15 and R 4.16were dominated by a phylotype affiliated to the genusMethanosarcina, represented by the T-RF 859/860 (Fig. 2).Another OTU of this genus, represented by the T-RF 557/559,was specifically abundant in the Jatropha-fed reactors R 4.19and R 4.20, where it represented the second predominantphylotype besides Methanoculleus. The OTUs with T-RF557/559 and 859/860 shared 97–99 % BLAST identity with
Rel
ativ
e T-
RF
abu
ndan
ce
0%
10%
20%
30%
40%
50%
60%
70%
80%
90%
100%
R31_T1
R31_T2
R31_T3
R413_T
1
R413_T
2
R413_T
3
R414_T
1
R414_T
2
R414_T
3
R415_T
1
R415_T
2
R415_T
3
R416_T
1
R416_T
2
R416_T
3
R417_T
1
R417_T
2
R417_T
3
R419_T
1
R419_T
2
R419_T
3
R420_T
1
R420_T
2
R420_T
3
R45_T1
R45_T2
R45_T3
R46_T1
R46_T2
R46_T3
R48_T1
R48_T2
R48_T3
36-M.culleus 37-M.culleus 38-M.culleus 39-M.culleus 51 8496-M.corpusculum 98 108 119 140-M.spirillum 160162 189 191 205 207 210273 285 314 315 326 335336 387 408 410 412 414-M.culleus499-M.culleus 501-M.culleus 507-M.culleus 508-M.culleus 511 523527 538 549 553-M.saeta 555-M.methylovorans 557-M.sarcina559-M.sarcina 563-Thermoprotei 565 567 816 849850 852 853-M.saeta 854-M.saeta 859-M.sarcina 860-M.sarcina876-M.sarcina 877-M.sarcina
Fig. 2 Archaeal community composition and dynamics in the 11 re-actors at three sampling times (T1, T2, T3; see Table 1 for details)according to T-RFLP profiles of archaeal 16S rRNA ampliconsdigested with the restriction enzyme MseI. Peak areas in the range of35–900 bp were extracted and normalized according to Abdo et al.
(2006), using a cutoff value of six times the standard deviation toremove background noise. Only T-RFs comprising at least 1 % relativeabundance in at least one sample are shown. Identification of T-RFs isbased on partial sequences and experimental T-RF determination ofcloned archaeal 16S rRNA genes (see ESM Table 2)
5168 Appl Microbiol Biotechnol (2013) 97:5161–5174
Methanosarcina siciliae (Elberson and Sowers 1997),Methanosarcina barkeri (Maestrojuan and Boone 1991),Methanosarcina thermophila (Zinder et al. 1985), andMethanosarcina acetivorans (Sowers et al. 1984). Besidesthe dominant T-RF 859/860, another Methanosarcinaphylotype with the T-RF 876/877 was present in the straw-fed reactors in minor proportions of 1–2 %.
The T-RF 859/860 corresponding to the genusMethanosarcina was also predominant in reactor R 4.5which was fed with only cattle manure. At the secondsampling time, this phylotype reached a relative abundanceof 89 % but dropped to 54 % after the temperature was risento 55 °C (Fig. 2), accompanied by an increase ofMethanoculleus spp. (T-RFs 36–38 and 499). Reactor R4.6 was operated under the same conditions as reactor R 4.5but additionally fed with DDGS (Table 1). Here, the predom-inant T-RF 553 and 853 were affiliated to the genusMethanosaeta, showing 97–99 % BLAST identity toMethanosaeta concilii (Patel and Sprott 1990). Duringmesophilic operation, both phylotypes together comprised 51and 27 % relative T-RF abundances, respectively. In contrast,after the temperature shift to 55 °CMethanosaeta disappearedand instead Methanosarcina (T-RF 860) emerged with a rela-tive T-RF abundance of 71 %. Other major phylotypes in R 4.6during mesophilic operation belonged to Methanoculleus(T-RF 36–38 and 499) and to Methanomethylovorans(T-RF 555) which showed 97 % BLAST identity toMethanomethylovorans hollandica (Lomans et al. 1999).Both Methanoculleus and Methanomethylovorans decreasedconsiderably in their proportions after the temperatureshift to 55 °C.
The archaeal community in reactor R 4.8, utilizing cattlemanure and maize silage and operated at a low OLR of 1.5gVSL
−1 day−1, was relatively stable and consisted mostly ofMethanosaeta spp. (T-RF 553 and 853) and Methanoculleusspp. (T-RF 36–38 and 499; Fig. 2). Additionally,Methanomethylovorans (T-RF 555) and a phylotype affiliatedto the Thermoprotei (T-RF 563) were detected in minor pro-portions. In contrast to R 4.8, the archaeal community inreactor R 4.17 (also fed with the cattle manure and maizesilage) was not stable due to an increase of the OLR from 2.0to 2.5 gVSL
−1 day−1 and a varying HRT (Table 1). The samephylotypes as in R 4.8 were detected, with the exception thatbetween the first and the third sampling point Methanosaeta(T-RF 553 and 853) as well asMethanomethylovorans (T-RF555) decreased or even disappeared, respectively, where-as Methanosarcina (T-RF 557/559 and 859) increasedsignificantly (Fig. 2).
Other hydrogenotrophic methanogens of the generaMethanocorpusculum (T-RF 96) and Methanospirillum (T-RF 140) were detected in very little proportions of 1–2 % ina few samples, indicating that they represent nondominantpopulations (Fig. 2).
Correlation of process parameters with microbial communitystructure and dynamics
The NMDS plot calculated from the bacterial T-RFLP profileson the basis of the Bray–Curtis index shows that the reactorsfed with chicken manure (R 3.1) or with Jatropha press cake(R 4.19 and R 4.20) displayed very distinct bacterial commu-nity structures compared to the community profiles of theother reactors (Fig. 3). Correlation analysis revealed that,besides the ammonium concentration, the decisive processparameters shaping the bacterial community structure in R3.1 were the total VFA concentration and in particular thesingle concentrations of acetate and isobutyrate (with signifi-cance values of p<0.01), but also of propionate and n-butyrate(with significance values of p<0.05). The community profilesof reactors R 4.19 and R 4.20 showed a similar correlationwith these process parameters but were clearly distinct fromthe community profiles of R 3.1.
Bacterial community profiles of all other samples wererelatively similar with the exception of the two samplesfrom reactors R 4.5 and R 4.6 which had been taken afterthe shift to 55 °C (Fig. 3). As expected, the communityshifts within these reactors strongly correlated with thetemperature, but in particular the 55 °C sample from reactorR 4.6 also correlated with total VFA concentration and theconcentrations of the single organic acids as well.
Besides chicken manure, maize straw was the only sub-strate which showed a significant correlation with the bac-terial community profiles, along with the OLR (Fig. 3).However, the T-RFLP profiles of the samples from thestraw-fed reactors R 4.13 and R 4.14 were relativelyscattered within the NMDS plot, indicating a high variabil-ity of these communities. In contrast, the samples fromreactors R 4.15 and R 4.16 (fed with extruded straw) clus-tered more closely to each other and to the samples from thereactors fed with conventional substrates, i.e., maize silageand cattle manure (R 4.17, R 4.8, and R 4.5).
Regarding the archaeal T-RFLP profiles, the NMDS plotshows a very distinct community structure only in reactor R3.1 (Fig. 4). A strong correlation of the archaeal communitystructure with the ammonium concentration and thesubstrate (chicken manure) was revealed. The key role ofhydrogenotrophic methanogens of the genus Methanoculleus(T-RF 36 and 499) is also illustrated by correlation vectors inthe NMDS plot.
Besides chicken manure, maize straw as substrate showeda significant correlation with the archaeal community profiles,along with the T-RF 877 which represents a phylotype affili-ated to the genusMethanosarcina (Fig. 4). The samples fromthe straw-fed reactors R 4.13, R 4.14, R 4.15, and R 4.16cluster together and apart from those of other reactors, excepttwo samples from R 4.14 and R 4.15 which contain a signif-icant proportion of the unidentified T-RF 336.
Appl Microbiol Biotechnol (2013) 97:5161–5174 5169

The pronounced community shift after the temperatureshift to 55 °C was reflected in the NMDS plot of the samplesfrom reactors R 4.5 and R 4.6 (Fig. 4). Besides the temper-ature, the parameters biogas yield and CO2 content of thebiogas showed a significant correlation with this communityshift. The key phylotype most clearly related to this phe-nomenon was T-RF 860 representing Methanosarcina.
Phylotypes affiliated to the genusMethanosaeta (T-RF 553and 853) turned out to be key players of the reactor R 4.8 fedwith maize silage. The samples from this reactor clusteredclosely together reflecting the stable community structure,whereas the samples from the nonstable reactor R 4.17 (alsofed with maize silage) were more scattered in the NMDS plot.
Discussion
Microbial communities in lab-scale biogas reactors fed withvarious agricultural waste products were investigated fortheir phylogenetic composition and community dynamics
in dependence on substrate composition and process param-eters. The most abundant bacterial phyla were theFirmicutes (mainly Clostridia) and the Bacteroidetes,whereas the archaeal communities were dominated bymethanogenic Euryarchaeota belonging to the ordersMethanomicrobiales and Methanosarcinales.
Several clostridial phylotypes were present in all digesters,but their proportion varied depending on the process conditions.Clostridia are strict anaerobes and represent the most prevalentbacterial class in full-scale mesophilic biogas plants fed withplant biomass (Klocke et al. 2007; Krause et al. 2008; Kröber etal. 2009). They represent the major group of light-independentfermentative bacteria, which have the ability to produce hydro-gen (Das and Veziroglu 2001). Clostridium thermocellum andClostridium stercorarium were identified as the major playersin the hydrolysis of plant biomass (Zverlov et al. 2010), whereasClostridium thermopalmariumwas found to be the main butyr-ic acid producer in a wastewater treatment system (Kim et al.2010). Some species of the order Clostridiales are known tocreate cellulosomes, which are intensively involved in the
-1.5 -1.0 -0.5 0.0 0.5 1.0
-1.5
-1.0
-0.5
0.0
0.5
1.0
NMDS1
NM
DS
2
- - -
Stress = 12.97
OLR
HRT
Chicken manure
Propionaten-Butyrate
Temperature
Straw
VFAAmmonium
AcetateIsobutyrate
68
230235
238248
255
269
283
299370
55°C
55°C
R3.1 (Chicken manure + CM)
R4.13 (Maize straw + CM)
R4.14 (Maize straw + CM)
R4.15 (Maize straw + CM)
R4.16 (Maize straw + CM)
R4.17 (Maize silage + CM)
R4.19 (Jatropha)
R4.20 (Jatropha)
R4.5 (Cattle manure = CM)
R4.6 (DDGS + CM)
R4.8 (Maize silage + CM)
--
Stress = 12.97
OLR
HRT
Chicken manure
Propionaten-Butyrate
Temperature
Straw
VFAAmmonium
AcetateIsobutyrate
68
230235
238248
255
269
283
299370
55°C
55°C
R3.1 (Chicken manure + CM)
R4.13 (Maize straw + CM)
R3.1 (Chicken manure + CM)
R4.13 (Maize straw + CM)
Fig. 3 NMDS analysis plot of T-RFLP profiles of bacterial 16S rRNAamplicons digested with the restriction enzyme HaeIII. Peak areas inthe range of 50–500 bp were extracted and normalized according toAbdo et al. (2006), using a cutoff value of six times the standarddeviation to remove background noise. Community similarity is basedon the Bray–Curtis index which includes the presence/absence as wellas the relative abundances of T-RFs. Magenta arrows indicate the
correlation vectors of community differences and the process parame-ters with significance factors p<0.01. Blue arrows indicate the corre-lation vectors of community differences and the process parameterswith significance factors 0.01<p<0.05. Black arrows indicate thecorrelation vectors of single T-RFs and the process parameters withsignificance factors p<0.01. Significance was tested by Monte Carlopermutation against 999 random datasets
5170 Appl Microbiol Biotechnol (2013) 97:5161–5174

anaerobic digestion of recalcitrant cellulose, supportingacetogens and methanogens with compounds necessary fortheir growth. Cellulosomes architecture and cellulose metabo-lism were investigated in detail in the cellulolytic bacterium C.thermocellum (Lynd et al. 2002; Fontes and Gilbert 2010).Members of the clostridial family Ruminococcaceae wereabundant in our reactors, in particular in the reactors fed withmaize straw or with Jatropha press cake. These fermentingbacteria are known to hydrolyze a variety of polysaccharidesby different mechanisms, e.g., the production of a cellulosomeenzyme complex and cellulose adhesion proteins (Morrison andMiron 2000). They are able to ferment hexoses as well aspentoses which are the hydrolysis products from cellulose andhemicelluloses. The production of hydrogen by Ruminococcusalbus from sweet sorghum was reported by Ntaikou et al.(2008). Accordingly, the functional role of Ruminococcaceaein our reactors seems to be mainly the cellulolytic digestion ofplant fibers. Additional fiber-degrading specialists related toActinomyces ssp. and Fibrobacter spp. seem to play a key rolein the Jatropha-fed reactors. Similar to Ruminococcaceae,
Fibrobacter ssp. are characteristic cellulolytic rumenbacteria (Béra-Maillet et al. 2004). A key role ofActinomycetaceae in anaerobic digestion of distillersgrains was previously suggested (Ziganshin et al. 2011).
Apart from their role in hydrolysis and acidogenesis, mem-bers of the class Clostridia are also involved in acetogenesisand syntrophic acetate oxidation (SAO). The latter is of specialimportance as an alternative acetate sink when aceticlasticmethanogenesis is inhibited, e.g., due to high ammonia loads(Schnürer and Nordberg 2008). Ammonia in inhibitory con-centrations is formed during anaerobic digestion of high-proteinfeedstock (e.g., slaughterhouse waste) or other nitrogen-richwaste materials like poultry manure. SAO coupled tohydrogenotrophic methanogenesis becomes also favorable atelevated temperatures (Hattori 2008), which was confirmed bycommunity analyses in thermophilic digesters (Goberna et al.2009; Sasaki et al. 2011; Rademacher et al. 2012). Most of theSAO bacteria known so far belong to the Clostridia (Schnüreret al. 1996; Hattori et al. 2000; Westerholm et al. 2010, 2011),but their actual diversity is not yet known.
-2 -1 0 1
-10
12
NMDS1
NM
DS
2
-2 -1 0 1
-10
12
NMDS1
Stress = 12.21
TemperatureBiogas yield
CH4
VFAAcetate
Propionate
Isobutyrate
OLR
HRT
Chicken manure
StrawpH
Ammonium36
38
162273
336
412499
507523
549
850853
859
860
877
R3.1 (Chicken manure + CM)
R4.13 (Maize straw + CM)
R4.14 (Maize straw + CM)
R4.15 (Maize straw + CM)
R4.16 (Maize straw + CM)
R4.17 (Maize silage + CM)
R4.19 (Jatropha)
R4.20 (Jatropha)
R4.5 (Cattle manure = CM)
R4.6 (DDGS + CM)
R4.8 (Maize silage + CM)
553
CO2
501
508
511
55°C
55°C
Fig. 4 NMDS analysis plot of T-RFLP profiles of archaeal 16S rRNAamplicons digested with the restriction enzyme MseI. Peak areas in therange of 35–900 bp were extracted and normalized according to Abdoet al. (2006), using a cutoff value of seven times the standard deviationto remove background noise. Community similarity is based on theBray–Curtis index which includes the presence/absence as well as therelative abundances of T-RFs. Magenta arrows indicate the correlation
vectors of community differences and the process parameters withsignificance factors p<0.01. Blue arrows indicate the correlation vec-tors of community differences and the process parameters with signif-icance factors 0.01<p<0.05. Black arrows indicate the correlationvectors of single T-RFs and the process parameters with significancefactors p<0.01. Significance was tested by Monte Carlo permutationagainst 999 random data sets
Appl Microbiol Biotechnol (2013) 97:5161–5174 5171

Concentrations of 1.7–14 g L−1 ammonium nitrogen havebeen reported to inhibit methanogenic activity (reviewed byChen et al. 2008). The archaeal community in reactor R 3.1 (fedwith chicken manure) consisted almost exclusively ofhydrogenotrophic methanogens belonging to the genusMethanoculleus, indicating a complete inhibition of aceticlasticmethanogenesis in this reactor.Methanoculleuswas reported tobe the predominant methanogenic group in mesophilic biogasreactors with SAO (Schnürer et al. 1999). Schnürer andNordberg (2008) observed a shift to SAO at ammonia concen-trations above 3 g L−1 ammonium nitrogen. Hence, SAO as themain acetate-consuming process can be assumed in reactor R3.1 fed with chicken manure and possibly also in the reactors R4.19 and R 4.20 fed with Jatropha press cake. However, theJatropha-fed reactors contained not only Methanoculleus spp.as the predominant methanogens but alsoMethanosarcina spp.Members of the Methanosarcinaceae are mixotrophicmethanogens and have been described to be involved also inSAO as hydrogenotrophic partners (Karlsson et al. 2012).Based on the present data, it is not known whether acetate isconsumed via aceticlastic methanogenesis by Methanosarcinaspp. or via SAO with a Methanosarcina sp. as thehydrogenotrophic partner in the Jatropha-fed reactors.
After the shift to 55 °C, the bacterial community in R 4.6(fed with cattle manure and DDGS) developed in a similardirection as the communities in the reactors fed with chickenmanure or Jatropha press cake (Fig. 3), along with a drop inmethane content and acetate accumulation which hints to apartial inhibition of methanogenesis. The relative abun-dance of putative SAO bacteria belonging to the genusTepidanaerobacter was higher in the Jatropha-fed reactorsthan in all other reactors, and the temperature shift to 55 °Cled to the emergence of Syntrophaceticus in the reactor R 4.6(ESM Table 1). Further investigations are needed to clarifywhether these organisms actually indicate SAO.
Besides several clostridial phylotypes, Bacteroidetes wereabundant in our reactors. Members of the Bacteroidetes arealso commonly detected in anaerobic waste sludge digesters(Ariesyady et al. 2007; Rivière et al. 2009) and in biogasreactors fed with plant biomass (Krause et al. 2008; Kröberet al. 2009). In digesters fed with protein-rich biomass such asDDGS, they were found to be the prevalent bacterial phylum(Ziganshin et al. 2011).
In conclusion, the bacterial community composition wasmainly influenced by the feedstock besides the temperaturewhich caused the most pronounced community shifts. Thearchaeal community composition was less correlated with thesubstrate composition, except for the reactor fed with chickenmanure which was exclusively colonized by hydrogenotrophicmethanogens, and the reactors fed with maize silage or DDGSwhich specifically contained significant proportions ofMethanosaeta and Methanomethylovorans. The presence ofMethanosaeta indicates that aceticlastic methanogenesis
occurs at low acetate concentrations (Kendall and Boone2006) which holds true for the reactors R 4.8 (maize silage)and R 4.6 (DDGS) at mesophilic conditions. The presence ofMethanomethylovorans indicates that specific methyl com-pounds such as methylamines, dimethyl sulfide, ormethanethiol which were formed from protein-rich biomassare converted directly to methane (Lomans et al. 1999). As thebacterial communities, the archaeal communities were stronglyinfluenced by a temperature shift to 55 °C, leading to theextinction of previously abundant Methanosaeta spp. in thereactor fed with DDGS and cattle manure and their replace-ment by Methanosarcina. The temperature shift was accom-panied by VFA accumulation, in particular accumulation ofacetate. It was demonstrated previously that Methanosaetaspp. are involved in anaerobic digestion of DDGS at lowOLR, whereas at higher OLR (accompanied by higher VFAconcentrations) Methanosaeta spp. are outcompeted byMethanosarcina spp. (Ziganshin et al. 2011).
Bacterial communities involved in the digestion of conven-tional feedstock like maize silage and cattle manure wererelatively stable and similar to each other. In contrast, specialwaste materials such as chickenmanure or Jatropha press cakewere digested by very distinct and less diverse communities,indicating partial ammonia inhibition or the influence of otherinhibiting factors. Consequently, co-digestion with feedstockstabilizing the microbial activity (e.g., cattle manure) couldimprove the process stability and efficiency of anaerobic di-gestion in case of Jatropha press cake. Anaerobic digestion ofchicken manure relied on SAO as the dominant acetate-consuming process due to the inhibition of aceticlasticmethanogenesis, as confirmed by the absence of aceticlasticmethanogens in reactor R 3.1. Jatropha press cake as substratealso led to the enrichment of distinct consortia, probably dom-inated by fiber-degrading specialists. Based on our results,bioaugmentation concepts can be developed aiming at theapplication of such pre-adapted consortia (either to high am-monia load or to fiber-rich press cake) to stabilize the digestionprocess and shorten acclimatization times after substratechange or reactor restart.
Acknowledgments We gratefully acknowledge the technicians andstudents from the Department of Biochemical Conversion (DBFZ) forrunning the reactors and performing chemical analyses. We also thankUte Lohse from the Department of Environmental Microbiology (UFZ)for technical assistance.
References
Abdo Z, Schütte UM, Bent SJ, Williams CJ, Forney LJ, Joyce P(2006) Statistical methods for characterizing diversity of mi-crobial communities by analysis of terminal restriction frag-ment length polymorphisms of 16S rRNA genes. EnvironMicrobiol 8:929–938
5172 Appl Microbiol Biotechnol (2013) 97:5161–5174

Ariesyady HD, Ito T, Okabe S (2007) Functional bacterial and archaealcommunity structures of major trophic groups in a full-scaleanaerobic digester. Water Res 41:1554–1568
Asakawa S, Nagaoka K (2003) Methanoculleus bourgensis,Methanoculleus olentangyi and Methanoculleus oldenburgensis aresubjective synonyms. Int J Syst Evol Microbiol 53:1551–1552
Béra-Maillet C, Ribot Y, Forano E (2004) Fiber-degrading system ofdifferent strains of the genus Fibrobacter. Appl EnvironMicrobiol 70:2172–2179
Chen Y, Cheng JJ, Creamer KS (2008) Inhibition of anaerobic diges-tion process: a review. Bioresour Technol 99:4044–4064
Cheng L, Qiu TL, Li X, Wang WD, Deng Y, Yin XB, Zhang H (2008)Isolation and characterization of Methanoculleus receptaculi sp.nov. from Shengli oil field, China. FEMSMicrobiol Lett 285:65–71
Das D, Veziroglu TN (2001) Hydrogen production by biological pro-cesses: a survey of literature. Int J Hydrogen Energy 26:13–28
Demirel B, Scherer P (2008) The roles of acetotrophic andhydrogenotrophic methanogens during anaerobic conversion ofbiomass to methane: a review. Rev. Environ. Sci Biotechnol7:173–190
Dianou D, Miyaki T, Asakawa S, Morii H, Nagaoka K, Oyaizu H,Matsumoto S (2001) Methanoculleus chikugoensis sp. nov., anovel methanogenic archaeon isolated from paddy field soil inJapan, and DNA-DNA hybridization among Methanoculleus spe-cies. Int J Syst Evol Microbiol 51:1663–1669
Elberson MA, Sowers KR (1997) Isolation of an aceticlastic strain ofMethanosarcina siciliae from marine canyon sediments andemendation of the species description for Methanosarcinasiciliae. Int J Syst Bacteriol 47:1258–1261
El-Mashad HM, Zhang R (2010) Biogas production from co-digestion ofdairy manure and food waste. Bioresour Technol 101:4021–4028
Fontes CM, Gilbert HJ (2010) Cellulosomes: highly efficientnanomachines designed to deconstruct plant cell wall complexcarbohydrates. Annu Rev Biochem 79:655–681
Gerardi MH (2003) The microbiology of anaerobic digesters. Wiley,Hoboken
Goberna M, Insam H, Franke-Whittle IH (2009) Effect of biowastesludge maturation on the diversity of thermophilic bacteria andarchaea in an anaerobic reactor. Appl Environ Microbiol75:2566–2572
Hattori S (2008) Syntrophic acetate-oxidizing microbes inmethanogenic environments. Microbes Environ 2:118–127
Hattori S, Kamagata Y, Hanada S, Shoun H (2000) Thermacetogeniumphaeum gen. nov., sp. nov., a strictly anaerobic, thermophilic,syntrophic acetate-oxidizing bacterium. Int J Syst EvolMicrobiol 50:1601–1609
Holm-Nielsen JB, Al Seadi T, Oleskowicz-Popiel P (2009) The futureof anaerobic digestion and biogas utilization. Bioresour Technol100:5478–5484
Karlsson A, Einarsson P, Schnürer A, Sundberg C, Ejlertsson J,Svensson B (2012) Impact of trace element addition on degrada-tion efficiency of volatile fatty acids, oleic acid and phenyl acetateand on microbial populations in a biogas digester. J Biosci Bioeng114:446–452
Kendall MM, Boone DR (2006) The order Methanosarcinales.Prokaryotes 3:244–256
Kim MD, Song M, Jo M, Shin SG, Khim JH, Hwang S (2010) Growthcondition and bacterial community for maximum hydrolysis ofsuspended organic materials in anaerobic digestion of food waste-recycling wastewater. Appl Microbiol Biotechnol 85:1611–1618
Klocke M, Mähnert P, Mundt K, Souidi K, Linke B (2007) Microbialcommunity analysis of a biogas-producing completely stirred tankreactor fed continuously with fodder beet silage as mono-substrate. Syst Appl Microbiol 30:139–151
Krause L, Diaz NN, Edwards RA, Gartemann KH, Krömeke H, NeuwegerH, Pühler A, Runte KJ, Schlüter A, Stoye J, Szczepanowski R, Tauch
A, Goesmann A (2008) Taxonomic composition and gene content ofa methane-producing microbial community isolated from a biogasreactor. J Biotechnol 136:91–101
Kröber M, Bekel T, Diaz NN, Goesmann A, Jaenicke S, Krause L,Miller D, Runte KJ, Viehöver P, Pühler A, Schlüter A (2009)Phylogenetic characterization of a biogas plant microbial commu-nity integrating clone library 16S-rDNA sequences andmetagenome sequence data obtained by 454-pyrosequencing. JBiotechnol 142:38–49
Lee C, Kim J, Hwang K, O’Flaherty V, Hwang S (2009) Quantitativeanalysis of methanogenic community dynamics in three anaerobicbatch digesters treating different wastewaters. Water Res 43:157–165
Lomans BP, Maas R, Luderer R, Op den Camp HJM, Pol A, van derDrift C, Vogels GD (1999) Isolation and characterization ofMethanomethylovorans hollandica gen. nov., sp. nov., isolatedfrom freshwater sediment, a methylotrophic methanogen able togrow on dimethyl sulfide and methanethiol. Appl EnvironMicrobiol 65:3641–3650
Lynd LR, Weimer PJ, van Zyl WH, Pretorius IS (2002) Microbialcellulose utilization: fundamentals and biotechnology. MicrobiolMol Biol Rev 66:506–577
Maestrojuan GM, Boone DR (1991) Character izat ion ofMethanosarcina barkeri MST and 227, Methanosarcina mazeiS-6T, and Methanosarcina vacuolata Z-761T. Int J Syst Bacteriol41:267–274
Morrison M, Miron J (2000) Adhesion to cellulose by Ruminococcusalbus: a combination of cellulosomes and Pil-proteins? FEMSMicrobiol Lett 185:109–115
Narihiro T, Sekiguchi Y (2007) Microbial communities in anaerobicdigestion processes for waste and wastewater treatment: a micro-biological update. Curr Opin Biotechnol 18:273–278
Ntaikou I, Gavala HN, Kornaros M, Lyberatos G (2008) Hydrogenproduction from sugars and sweet sorghum biomass usingRuminococcus albus. Int J Hydrog Energy 33:1153–1163
O’Reilly J, Lee C, Collins G, Chinalia F, Mahony T, O’Flaherty V(2009) Quantitative and qualitative analysis of methanogeniccommunities in mesophilically and psychrophilically cultivatedanaerobic granular biofilms. Water Res 43:3365–3374
Oksanen J (2011) Multivariate analysis of ecological communities in R:vegan tutorial. Publisher Univ Oulu Comput Serv Cent 83:1–43
Ollivier BM, Mah RA, Garcia JL, Boone DR (1986) Isolation andcharacterization of Methanogenium bourgense sp. nov. Int J SystBacteriol 36:297–301
Patel GB, Sprott GD (1990) Methanosaeta concilii gen. nov., sp. nov.(“Methanothrix concilii”) and Methanosaeta thermoacetophilanom. rev., comb. nov. Int J Syst Bacteriol 40:79–82
Rademacher A, Zakrzewski M, Schlüter A, Schönberg M,Szczepanowski R, Goesmann A, Pühler A, Klocke M (2012)Characterization of microbial biofilms in a thermophilic biogassystem by high-throughput metagenome sequencing. FEMSMicrobiol Ecol 79:785–799
Rivière D, Desvignes V, Pelletier E, Chaussonnerie S, Guermazi S,Weissenbach J, Li T, Camacho P, Sghir A (2009) Towards thedefinition of a core of microorganisms involved in anaerobicdigestion of sludge. ISME J 3:700–714
Sasaki K, Morita M, Hirano S, Ohmura N, Igarashi Y (2011)Decreasing ammonia inhibition in thermophilic methanogenicbioreactors using carbon fiber textiles. Appl MicrobiolBiotechnol 90:1555–1561
Schnürer A, Nordberg A (2008) Ammonia, a selective agent formethane production by syntrophic acetate oxidation at mesophilictemperature. Water Sci Technol 57:735–740
Schnürer A, Schink B, Svensson BH (1996) Clostridium ultunense sp.nov., a mesophilic bacterium oxidizing acetate in syntrophic as-sociation with a hydrogenotrophic methanogenic bacterium. Int JSyst Bacteriol 46:1145–1152
Appl Microbiol Biotechnol (2013) 97:5161–5174 5173

Schnürer A, Zellner G, Svensson BH (1999) Mesophilic syntrophicacetate oxidation during methane formation in biogas reactors.FEMS Microbiol Ecol 29:249–261
Sowers KR, Baron SF, Ferry JG (1984) Methanosarcina acetivoranssp. nov., an acetotrophic methane-producing bacterium isolatedfrom marine sediments. Appl Environ Microbiol 47:971–978
Steinberg LM, Regan JM (2009) mcrA-targeted real-time quantitativePCR method to examine methanogen communities. Appl EnvironMicrobiol 75:4435–4442
Weiland P (2010) Biogas production: current state and perspectives.Appl Microbiol Biotechnol 85:849–860
Westerholm M, Roos S, Schnürer A (2010) Syntrophaceticus schinkiigen. nov., sp. nov., an anaerobic, syntrophic acetate-oxidizingbacterium isolated from a mesophilic anaerobic filter. FEMSMicrobiol Lett 309:100–104
Westerholm M, Roos S, Schnürer A (2011) Tepidanaerobacteracetatoxydans sp. nov., an anaerobic, syntrophic acetate-oxidizing
bacterium isolated from two ammonia-enriched mesophilicmethanogenic processes. Syst Appl Microbiol 34:260–266
Ziganshin AM, Schmidt T, Scholwin F, Il’inskaya ON, Harms H,Kleinsteuber S (2011) Bacteria and archaea involved in anaerobicdigestion of distillers grains with solubles. Appl MicrobiolBiotechnol 89:2039–2052
Ziganshin AM, Ziganshina EE, Kleinsteuber S, Pröter J,Ilinskaya ON (2012) Methanogenic community dynamicsduring anaerobic utilization of agricultural wastes. ActaNaturae 4:91–97
Zinder SH, Sowers KR, Ferry JG (1985) Methanosarcina thermophilasp. nov., a thermophilic, acetotrophic, methane-producing bacte-rium. Int J Syst Bacteriol 35:522–523
Zverlov VV, Hiegl W, Köck DE, Kellermann J, Köllmeier T,Schwarz WH (2010) Hydrolytic bacteria in mesophilic andthermophilic degradation of plant biomass. Eng Life Sci10:528–536
5174 Appl Microbiol Biotechnol (2013) 97:5161–5174


