
Mars Science Laboratory Curiosity Rover MegarippleCrossings up to Sol 710 in Gale Crater
• • • • • • • • • • • • • • • • • • • • • • • • • • • • • • • • • • • •
Raymond E. ArvidsonMcDonnell Center for the Space Sciences, Department of Earth and Planetary Sciences, Washington University in St. Louis, St.Louis, Missouri 63130e-mail: [email protected] D. IagnemmaRobotic Mobility Group, Massachusetts Institute of Technology, Cambridge, Massachusetts 02139e-mail: [email protected] MaimoneCalifornia Institute of Technology/ Jet Propulsion Laboratory, Pasadena, California 91011e-mail: [email protected] A. FraemanDivision of Geological and Planetary Sciences, California Institute of Technology, Pasadena, California 91125e-mail: [email protected] ZhouMcDonnell Center for the Space Sciences, Department of Earth and Planetary Sciences, Washington University in St. Louis, St.Louis, Missouri 63130e-mail: [email protected] C. Heverly and Paolo BelluttaCalifornia Institute of Technology/ Jet Propulsion Laboratory, Pasadena, California 91011e-mail: [email protected], [email protected] RubinDepartment of Earth and Planetary Sciences, University of California at Santa Cruz, Santa Cruz, California 91125e-mail: [email protected] T. SteinMcDonnell Center for the Space Sciences, Department of Earth and Planetary Sciences, Washington University in St. Louis, St.Louis, Missouri 63130e-mail: [email protected] P. GrotzingerDivision of Geological and Planetary Sciences, California Institute of Technology, Pasadena, California 91125e-mail: [email protected] R. VasavadaCalifornia Institute of Technology/ Jet Propulsion Laboratory, Pasadena, California 91011e-mail: [email protected]
Received 5 June 2015; accepted 23 December 2015
After landing in Gale Crater on August 6, 2012, the Mars Science Laboratory Curiosity rover traveled acrossregolith-covered, rock-strewn plains that transitioned into terrains that have been variably eroded, with valleyspartially filled with windblown sands, and intervening plateaus capped by well-cemented sandstones thathave been fractured and shaped by wind into outcrops with numerous sharp rock surfaces. Wheel puncturesand tears caused by sharp rocks while traversing the plateaus led to directing the rover to traverse in valleyswhere sands would cushion wheel loads. This required driving across a megaripple (windblown, sand-sizeddeposit covered by coarser grains) that straddles a narrow gap and several extensive megaripple deposits thataccumulated in low portions of valleys. Traverses across megaripple deposits led to mobility difficulties, with
Direct correspondence to: Raymond Arvidson, e-mail: [email protected]
Journal of Field Robotics, 1–24 (2016) C© 2016 Wiley Periodicals, Inc.View this article online at wileyonlinelibrary.com • DOI: 10.1002/rob.21647

2 • Journal of Field Robotics—2016
sinkage values up to approximately 30% of the 0.50 m wheel diameter, resultant high compaction resistances,and rover-based slip up to 77%. Analysis of imaging and engineering data collected during traverses acrossmegaripples for the first 710 sols (Mars days) of the mission, laboratory-based single-wheel soil experiments,full-scale rover tests at the Dumont Dunes, Mojave Desert, California, and numerical simulations show that acombination of material properties and megaripple geometries explain the high wheel sinkage and slip events.Extensive megaripple deposits have subsequently been avoided and instead traverses have been implementedacross terrains covered with regolith or thin windblown sand covers and megaripples separated by bedrockexposures. C© 2016 Wiley Periodicals, Inc.
1. INTRODUCTION
The NASA Mars Science Laboratory Curiosity rover hasbeen traversing across the northern plains of Gale Craterand the base of Mount Sharp since the vehicle landed onAugust 6, 2012 (Grotzinger et al., 2012; Vasavada et al., 2015)(Figures 1, 2). Data acquired by Curiosity’s remote sensingand in situ instruments show that strata underlying the tra-versed terrains consist of sedimentary rocks deposited in anancient fluvial-deltaic-lacustrine system (Grotzinger et al.,2014; Williams et al., 2013). During the first approximately480 sols (Mars days), the rover mainly traversed across ter-rain called hummocky plains, with a relatively thin, domi-nantly sand- to clay-sized regolith cover over bedrock, withrocks of a variety of sizes dispersed across the landscape(Arvidson et al., 2014). For reference, regolith on Mars isdefined as loose or loosely consolidated particulate mate-rial generated by impact, physical and chemical weatheringof local bedrock, and the addition of windblown granule,sand, silt, and clay-sized particles (Arvidson, Gooding, &Moore, 1989; Moore, 1987).
As Curiosity continued traversing to the southwest onthe way to Mount Sharp the terrain transitioned to plateaus,and intervening valleys formed as wind erosion carved intothe plains. To help define safe traverses, detailed terrainmapping was performed using images from the HiRISEinstrument on the Mars Reconnaissance Orbiter (McEwenet al., 2007), along with digital elevation maps generatedfrom stereo HiRISE data. Mapped units included (a) hum-mocky plains, (b) dissected or rugged terrain dominated byplateaus and intervening valleys, and (c) relatively bright,striated bedrock units typically found on valley floors. Val-ley floors were mapped as covered by regolith, with wind-blown megaripples located in the lowest portions of valleys,and in narrow gaps between plateaus.
Remote sensing and contact science measurementsacquired by Curiosity show that megaripples consist ofloosely consolidated, poorly sorted, angular sand-sized par-ticles of basaltic composition, with a thin armor of coarsegranule-sized to sand-sized particles, variably covered by athin airfall dust deposit (Blake et al., 2013; Fraeman et al.,2015; Sullivan & Zimbelman, 2015). Megaripples are themost common windblown bedform on Mars and formed asthe poorly sorted sediment supply was differentially sortedby winds, leaving coarser grains stranded on ripple surfaces
(Sullivan & Zimbelman, 2015). They likely formed duringrare high-velocity wind events.
Curiosity observations show that the rugged terrainplateaus are capped by well-cemented sandstone bedrockshaped by wind into sharp surfaces. When unavoidablydriven over by Curiosity, the sharp rocks punctured thethin (0.75-mm-thick skin) aluminum wheels at an unaccept-ably high rate. Traverses were then preferentially plannedand implemented in valleys, with the hypothesis that theregolith cover and sand-dominated megaripples on valleyfloors would cushion the wheels and reduce wheel wearand tear rates. This approach occasionally led to traversesacross megaripple deposits that produced high wheel sink-ages (�0.15 m, or �30% of the 0.5 m wheel diameter), in-creased compaction resistances, and rover-based slip values(up to 77%) that exceeded onboard safety thresholds.
This paper focuses on a summary of traverses acrossa single megaripple straddling Dingo Gap, together withtraverses across several areally extensive megaripple de-posits (Figure 2). The paper covers drives through the first710 sols of the Curiosity mission, with an emphasis on un-derstanding the interactions between the vehicle and thetraversed megaripple field geometries and material proper-ties, together with implications for future traverses withinGale Crater. The sol range is appropriate because after sol710 it was decided to drive around extensive megaripplefields to avoid possible embedding events.
2. CURIOSITY ROVER AND OPERATIONS OVERVIEW
Curiosity has a mass of 899 kg and employs six-wheel drive,with the outer four wheels capable of turning about verticalaxes using azimuthal actuators (Figures 1 and 3). The roverhas a rocker-bogie suspension system designed to go overobstacles while maintaining low rover tilts and evenly dis-tributing the loads among the wheels (Bickler, 1988). Wheelsare 0.50 m in diameter, 0.40 m wide, and have 0.00075-m-thick aluminum skins in between 0.007-m-high grousers(Haggert & Waydo, 2008). One section of each wheel has theletters JPL in Morse code cut into the wheel surface, therebyproviding a unique wheel track imprint in deformable ma-terials, such as regolith and windblown sands. Actuatorswere chosen for turning and driving purposes that providetorque values that were estimated to be several times higherthan typically needed.
Journal of Field Robotics DOI 10.1002/rob

Arvidson et al.: Curiosity Rover Megaripple Crossings • 3
Figure 1. Curiosity self-portrait mosaic acquired by the Mars Hand Lens Imager (Edgett et al., 2012) on the robotic arm on sols 868to 884. The rover was located in Pahrump Hills, to the south of the megaripple crossing locations presented in this paper. Bedrockunderlying the rover has been interpreted to have been deposited in an ancient lake environment. The plateau in the upper leftportion of the image is capped by sandstone bedrock interpreted to have formed in a fluvial environment. See Grotzinger et al.(2012) for a description of the other science instruments on Curiosity. Curiosity product IDs in this and other figure captions arelisted in Table I. The products are available from the NASA Planetary Data System.
Drives are accomplished along Ackerman arcs of givenradii of curvature using the azimuthal actuators to set thecurvature, along with appropriate drive actuator currentsto achieve wheel angular velocities needed to maintainthe commanded drive path. Autonavigation using body-mounted hazard avoidance stereo cameras (front and rearHazcams; Maki et al., 2012) can be used to automaticallydetect and move around obstacles (Maimone, Cheng, &Matthies, 2007). Visual odometry, in which periodic stereoimaging of the surrounding terrain taken by the mast-mounted Navcams (Maki et al., 2012), can be used to de-termine actual drive distances and directions, which therover can then use to correct path vectors relative to com-manded values (Maimone et al., 2007). Visual odometry alsoallows calculation of rover-based slip and skid values. Slipin percentage is defined as:
Slip = 100 ∗ (1 − actual distance traveled/
commanded distance) (1)
Slip becomes skid when the actual distance traveledis greater than the commanded distance, with a resultantnegative value. To avoid embedding events, slip values arecomputed onboard and automatically compared to presetthreshold values, as shown in Table II. Traverses are auto-matically stopped if a single, or “fast” slip, value exceeds aset threshold. The rover also stops its traverse if “slow” slipvalues exceed a threshold slip setting over a consecutivenumber (called persistence) of slip measurements. Thresh-old slip values (�70 to 80%) have been set based on expe-rience from driving in sands at the Jet Propulsion Labora-tory’s Mars Yard and the Dumont Dunes, Mojave Desert(Heverly et al., 2013), tempered by the permanent embed-ding (�100% slip) of the Mars Exploration Rover, Spirit, inloose sands in Gusev Crater (Arvidson et al., 2010). Max-imum slip values for each of the traverses discussed inthis paper are shown in Table II. Drives were automat-ically halted by Curiosity on sols 672, 709, and 710 be-cause “fast” slip values exceeded threshold limits set for thetraverses.
Journal of Field Robotics DOI 10.1002/rob

4 • Journal of Field Robotics—2016
Figure 2. A. HiRISE image mosaic showing Curiosity’s traverses (red line) from crossing the single megaripple straddling DingoGap to crossing the extensive megaripple field within Hidden Valley. Boxes delineate areas shown in more detail in subsequentfigures, with ripple crossing sols shown. B. Elevations color-coded onto a THEMIS daytime visible wavelength image mosaic.Elevation range is �5.8 km, with red colors corresponding to high and blue to purple colors to low values. Curiosity landed on theplains to the north of Mount Sharp, �5 km high stack of layered sedimentary rocks. Traverses to the southwest from the landing sitewere toward these rocks, with an intent of using the onboard instruments to make measurements that would allow reconstructionof the past environments of deposition (Grotzinger et al., 2012). For the HiRISE mosaic BGR colors were assigned to bands locatedat 0.4 to 0.6, 0.55 to 0.85, and 0.80 to 1.0 micrometers wavelengths. HiRISE is an imaging system on the Mars Reconnaissance Orbiter(McEwen et al., 2007) and THEMIS is a visible to thermal infrared imaging system on the Mars Odyssey Orbiter (Christensen et al.,2004). For reference, Curiosity had traversed �8.6 km from landing until the sol 710, the last Martian day covered in this paper.Images used in making the mosaics are available through the Planetary Data System.
Figure 3. Schematic side (looking at right-hand wheels) and top views of the Curiosity rover showing the dimensions, rocker andbogie suspension pivot points, and the mast.
Engineering data recorded by Curiosity during itsdrives can be commanded at rates varying from 2 to64 Hz and include time series of rover tilt vectors (usingthe onboard inertial maneuvering unit), rocker and bogie
suspension angles, wheel turns, and wheel actuator cur-rents. In addition, stereo images are acquired using Hazcamand Navcam cameras. These images are typically acquiredat end-of-drive locations to help define paths for next drives.
Journal of Field Robotics DOI 10.1002/rob

Arvidson et al.: Curiosity Rover Megaripple Crossings • 5
Table I. Product IDs for Curiosity observations mentioned inthis paper. All products are archived in the NASA PlanetaryData System (PDS) and may be accessed using the PDS Ana-lyst’s Notebook for Curiosity, https://an.rsl.wustl.edu/msl/.
Figure Product ID
1 0868MH0003900000302175E01_DRCL through0884MH0003900000302635E01_DRCL
6 CX00530ML0260184F444550544VA7 N_R000_0539_EDR027CYPTUB0708_DRIVEM19 FLB_445258003RADLF0260516FHAZ00216M1
RLB_445258030RADLF0260516RHAZ00306M112 CX00672NL0380000F457153643VA13 RLB_457152495RADLF0380000RHAZ00311M1
FLB_457152435RADLF0380000FHAZ00302M115 N_L000_0683_ILT038PER_S_1266_PATH_M118 N_L000_0706_ILT040PER_S_0200_DIRCTM119 FLB_460433170RADLF0400320FHAZ00322M1
RLB_460432413RADLF0400278RHAZ00322M1
Table II. Threshold settings are shown for megaripple cross-ings discussed in this paper for maximum rover slip values setfor the given sols that, if exceeded, would cause Curiosity to au-tomatically stop its traverse. Also shown are actual maximumslip values observed as determined using visual odometry ob-servations.
Sol Fast Slip, % Slow Slip, % Persistence Max Slip, %
533 90 70 3 46535 90 70 3 26538 60 40 2 51672 60 40 2 77683 80 90 4 41709 60 40 2 78710 90 70 4 75
Drive distances have ranged from several meters to approx-imately 100 m, depending on terrain complexity and driveobjectives.
3. DATA ANALYSIS, FIELD EXPERIMENTS,AND NUMERICAL MODELING
Analysis of Curiosity-based imaging and engineering datacollected during traverses within Gale Crater (Figures 1,2), experiments with a single-wheel-soil rig (Senatore et al.,2014), field tests with a Curiosity-scale rover (Heverly et al.,2013), and full-scale rover modeling using the Artemis sim-ulation software tool (Zhou et al., 2014) (Figure 4) wereall employed to understand the terramechanics associatedwith Curiosity’s megaripple crossings (Figure 2).
For the analysis of drives over the megaripples, slip-corrected traverse distances were derived as a function of
Figure 4. A. View of the laboratory apparatus at MIT whereCuriosity single-wheel simulations have been conducted. B.View of the engineering test vehicle, Scarecrow, crossing man-made ripples in the Dumont Dunes, Mojave Desert, California.C. View of an Artemis numerical simulation for the rover driv-ing over realistic topography with spatially varying sand prop-erties. Analysis of Curiosity data, field and laboratory-based ex-periments, and Artemis simulations were used to understandCuriosity’s traverses across megaripples.
rover slip, skid, yaw, pitch, roll, and wheel-drive actuatorcurrents. Relative rover-based elevations were then derivedas a function of slip-corrected distances (both for slip andskid, reported as slip-corrected in this paper), using a com-bination of tilt vectors and suspension angles. The extentof wheel sinkage was estimated using stereo images andassociated digital elevation maps covering wheel tracks inregolith and on the megaripples. Wheel currents were alsoexamined, but lack of temperature-dependent calibration
Journal of Field Robotics DOI 10.1002/rob

6 • Journal of Field Robotics—2016
data to convert to torque values allowed only qualitativeanalysis of these data. Slip-corrected distances, elevation,pitch, and slip and skid data presented in this paper areavailable in digital form from the Planetary Data System(https://an.rsl.wustl.edu/msl/ under Resources).
A spare Curiosity flight wheel was employed at theMIT Robotic Mobility Group terramechanics laboratory todetermine wheel sinkage and associated slip as a functionof commanded angular velocity, load, tilt, and sand prop-erties (Senatore et al., 2014) (Figure 4A). These experimentsallowed us to evaluate single-wheel performance under avariety of situations, including tilted, sand-covered surfaceswith and without superimposed ripples. Another set of ex-periments was conducted using the Scarecrow test rover, avehicle that has three-eighths the mass of Curiosity to simu-late rover loads on Mars. Scarecrow has the same wheels andsuspension system as the flight vehicle, and approximatelythe same center of mass (Figure 4B). Experiments were con-ducted in the Dumont Dunes, Mojave Desert, California, inMay 2012, climbing the face of a dune (Heverly et al., 2013),and again in June 2014, traversing over man-made sandripples with wavelengths similar to those for encounteredMartian megaripples. The latter experiments focused onevaluation of whether Curiosity would encounter mobilityproblems when crossing megaripples during its traversesin valleys. A detailed evaluation of the ripple crossing ex-periments at the Dumont Dunes is presented in a Section 8of this paper.
Artemis is a computationally fast, semiempirical ter-ramechanics software tool for tactical path planning andfirst-order estimation of terrain properties (Figure 4C)(Zhou et al., 2014). Artemis uses the same commands andproduces the same output as engineering data for Curiosity(Arvidson et al., 2014). The model is based on an ADAMSrendition of the rover mechanical system (White et al., 2012),augmented with wheel azimuth and drive actuators in amanner similar to what was done for the Spirit and Op-portunity Artemis models (Zhou et al., 2014). Grousersare included in Artemis because they are part of Curios-ity’s wheels, and they provide additional torque as thewheels move along the surface. Artemis simulates Curios-ity’s drives using digital terrain maps derived from HiRISEand/or Navcam stereo images, with inclusion of spatiallyvarying regolith or sand properties, or traditional ADAMScontact parameters for surfaces (i.e., bedrock). The wheel-regolith or sand interaction model computes the normaland shear stresses for a set of cells in which the wheels arein contact with the regolith or sand surface, and then in-tegrates over the total contact area using small time stepsto determine the torque needed to keep the wheels movingat commanded angular velocities, for example, along speci-fied Ackerman arcs. Normal and shear stresses between thewheels and regolith or sand are modeled using the classi-cal Bekker-Wong-Reece semiempirical terramechanics ex-pressions that describe relationships among normal stress,
sinkage, and shear stress as a function of regolith or sandproperties for plates (e.g., Wong, 2001, 2012):
σ = (ckc + ρgbkφ)( z
b
)n
(2)
τ = (c + σ nφ)(
1 − e− jkx
)(3)
where c, kc, ρ, kφ , and φ are the regolith or sand cohesion, co-hesion modulus, bulk density, frictional modulus, and angleof internal friction. The parameter kx is the shear modulusin the longitudinal or drive direction. The other parametersare g, the gravitational acceleration; b, the wheel width; z,the depth of wheel sinkage; n, a scaling parameter; σ , thenormal stress; j, the slippage value based on wheel sink-age; and τ , the shear stress between the wheel and regolithor sand. These two basic equations have been converted inArtemis to a wheel cylindrical geometry, as summarized innumerous references (e.g., Tehari, Sandu, Taheri, Pinto, &Gorsich, 2015; Wong, 2001, 2012; Zhou et al., 2014).
The exponent for the pressure-sinkage relationship isused in modified form in Artemis to model to first-orderslip-sinkage for cases in which extreme slip leads to regolithor sand excavation beneath the wheel (e.g., Wong, 2001), inaddition to compaction:
n = n0 + n1 |slip| (4)
Acceleration due to gravity, g, is set as appropriate(3.72 m/s2 for Mars and 9.80 m/s2 for Earth) in Artemisto compute forces, and the effects of gravity on regolith orsand self-compression, as shown in the pressure-sinkage re-lationship shown in Eq. (2) (Nakashima & Kobayashi, 2014;Wong, 2012).
Artemis as a simulation tool was validated using theMIT laboratory single-wheel test-bed data (Senatore et al.,2014) and comparisons to field trials on bedrock and dunesin the Dumont Dunes (Stein et al., 2013). The tool was foundto be valid for cases in which wheel sinkage is less thanhalf the wheel diameter, and slip is less than �60 to 70%.Higher slip values can be modeled, but the empirical equa-tion (Eq. (4)) used to simulate slip-sinkage precludes an in-depth understanding of the interaction mechanics betweenwheels, regolith or sands.
Iterative Artemis runs allow, by comparison to field-test data or information from Curiosity’s traverses, first-order estimation of regolith or sand parameters such as co-hesion, angle of internal friction, shear modulus, and thecoefficients associated with pressure-sinkage relationships.Simulations are pursued in this paper for crossing the sin-gle megaripple straddling Dingo Gap, and the extensivemegaripple field in Hidden Valley. The intent is to pro-vide physical insight into how Curiosity interacted withmegaripples during its traverses and not to solve for highfidelity, absolute values for sand properties. The latter isdifficult given the semiempirical nature of the adopted ter-ramechanics expressions (e.g., Tehari et al., 2015), which
Journal of Field Robotics DOI 10.1002/rob

Arvidson et al.: Curiosity Rover Megaripple Crossings • 7
Figure 5. Portion of the HiRISE image mosaic shown in Figure 2 overlain with color-coded elevation data, with a relief of �7 mfrom red (high) to blue (low) color-coding. Prior driving over fractured and eroded sandstone-dominated cap rock on the plateauscaused significant wheel damage, thus directing Curiosity through valleys and sandy areas. A single megaripple straddles DingoGap, and the rover crossed this feature on sols 533 and 535 to get to Moonlight Valley. The sol 538 drive into the valley includedcrossing a megaripple field in a local low area. The rover did not drive during intervening sols. Red line shows actual Curiositytraverse path and crosses represent end of drive locations.
were designed to be computationally fast to support tacti-cal path planning.
4. DINGO GAP MEGARIPPLE
Dingo Gap is a narrow pass between two sandstone-coveredplateaus. It forms the eastern entrance to Moonlight Val-ley and other valleys where regolith and windblown sandspartially cover the valley floors and thus were judged to begood for minimizing further damage to Curiosity’s wheels(Figure 5). Curiosity needed to cross the megaripple thatstraddles Dingo Gap to enter Moonlight Valley (Figure 6).The megaripple is �1 m high, with �7 m wavelength.
The drives over the megaripple were forward (the rovercan drive both forward and backward) and accomplished intwo parts. First the rover was commanded on sol 533 to as-cend the eastern flank, with the front wheels placed near thetop of the ridge. On sol 535, Curiosity crossed the megarip-ple and drove into Moonlight Valley. The drive was biasedto the southern side of the megaripple to avoid the centerand deepest sands. The ascent also included rotating thefront and back wheels 0.082 radians in a counterclockwisedirection about their vertical axes to avoid any clockwiseyaw toward the center of the ridge. Tracks left by the rovershowed wheel sinkage into the sands of up to �0.05 to
0.07 m in depth (Figure 7), implying that pressure-inducedsinkage and associated compaction resistance (e.g., Wong,2001) would need to be included to understand quantita-tively the terramechanics of the drives over the megaripple.
Use of engineering data, coupled with a densely ac-quired set of visual odometry observations, allowed us togenerate plots of rover pitch (tilt along drive direction,which for forward drives is positive when going uphilland negative when going downhill), an elevation profileas sensed by the rover, and slip or skid going up to and thenover the megaripple (Figures 8A-B). On ascent, the roverexperienced slip, whereas on descent it experienced skid.Left rear wheel (trailing) actuator currents peaked at 1.58 A,and right rear wheel values peaked at 0.93 A during ascent,whereas peak values for the two front wheels (leading) were0.70 and 0.80 A, respectively. During descent all values wereless than 0.45 A. Typical current values for the drive actua-tors on flat, regolith-covered terrain range from 0.5 to 0.7 A.As noted, the lack of calibration data precludes derivationof torques from the current data, although the trends areindicative of more work needed for the trailing wheels todrive the rover up the megaripple flank.
Artemis was used to simulate this traverse using asinput the commands sent to the rover to specify drive way-points, a digital elevation map generated from Navcam
Journal of Field Robotics DOI 10.1002/rob

8 • Journal of Field Robotics—2016
Figure 6. Portion of a Mastcam color image mosaic acquired on sol 530 looking toward the west at the Dingo Gap megarippleand Moonlight Valley. The view also includes the megaripple field crossed on sol 538. Mastcam is the mast-mounted multispectralcamera on Curiosity (Bell et al., 2012).
Figure 7. Portion of a Navcam image mosaic taken on sol 539 after crossing the megaripples on sols 533 to 538. Note the darktracks, which are due to disturbing the overlying dusty surface and exposing underlying basaltic sands.
stereo data, and sand property values that were iteratedto have the simulation and Curiosity data conform to oneanother (Table III, Figures 8C-D). Bulk density, cohesion,and angle of internal friction were held to constant valuesin the simulations and correspond to slightly cohesive Mar-tian regolith and windblown sands (Sullivan, Anderson,Biesiadecki, Bond, & Stewart, 2011) (Table III). The cohesionmodulus was also held constant because the product withthe cohesion term is vanishingly small relative to the fric-tional modulus. The frictional modulus, n0 and n1 (Eq. (4)),and the shear modulus were allowed to vary. These free pa-
rameters were iteratively adjusted to find minimum sumsof squares of differences between simulated and actual slipand skid values, while replicating the wheel sinkage valuesderived from stereo imaging from Hazcam and Navcamdata for the leading and trailing wheels. The simulationreplicates increased slip on ascending the megaripple flankas the vehicle pulled against the force of gravity and modestvalues of compaction resistance. Skid was replicated duringthe downhill traverse because of the force of gravity, coun-tering compaction resistance associated with wheel sinkage.Inferred sand properties will be compared to results from
Journal of Field Robotics DOI 10.1002/rob

Arvidson et al.: Curiosity Rover Megaripple Crossings • 9
Figure 8. A. Plot of rover-sensed elevation (solid line) and pitch (dashed line) as a function of slip-corrected distance for the sols 533and 534 traverses across the Dingo Gap megaripple. For these forward drives, positive pitch corresponds to uphill travel, whereasnegative pitch corresponds to downhill travel. Rover icon is shown in correct size relative to the traverse distance. The dip in pitch4.2 m for the Curiosity data is a consequence of a turn in place. B. Plot of slip and skid from discrete stops for visual odometry-basedlocations as a function of slip-corrected distance. Curiosity shifted from slip to skid as it reached the megaripple crest and starteddownhill. C. Artemis-based elevation and pitch are shown for the simulated drive over the megaripple. D. Artemis-based slip isshown for the simulated drive over the megaripple. The dip in slip at 11 m distance is an artifact associated with dividing the sol535 simulation into two segments.
Table III. Numerical values used for megaripples and Dumont Dune sands in Artemis simulations.
ρ (Kg/m3) kc kφ n0 n1 C (kPa) φ, deg kx (mm)
Dingo Gap Sand Ridge 1300 9 201 1.4 0.2 0.4 30 28Hidden Valley Ripples 1300 9 86 1.5 0.3 0.1 30 45Dumont Dunes 1650 9 101 1.5 0.1 0.2 30 32Dumont Ripples 1650 9 151 1.5 0.1 0.2 30 35
other drives across megaripples and the Dumont Dune fieldtests in Sections 8 and 9 of this paper.
5. MOONLIGHT VALLEY MEGARIPPLES
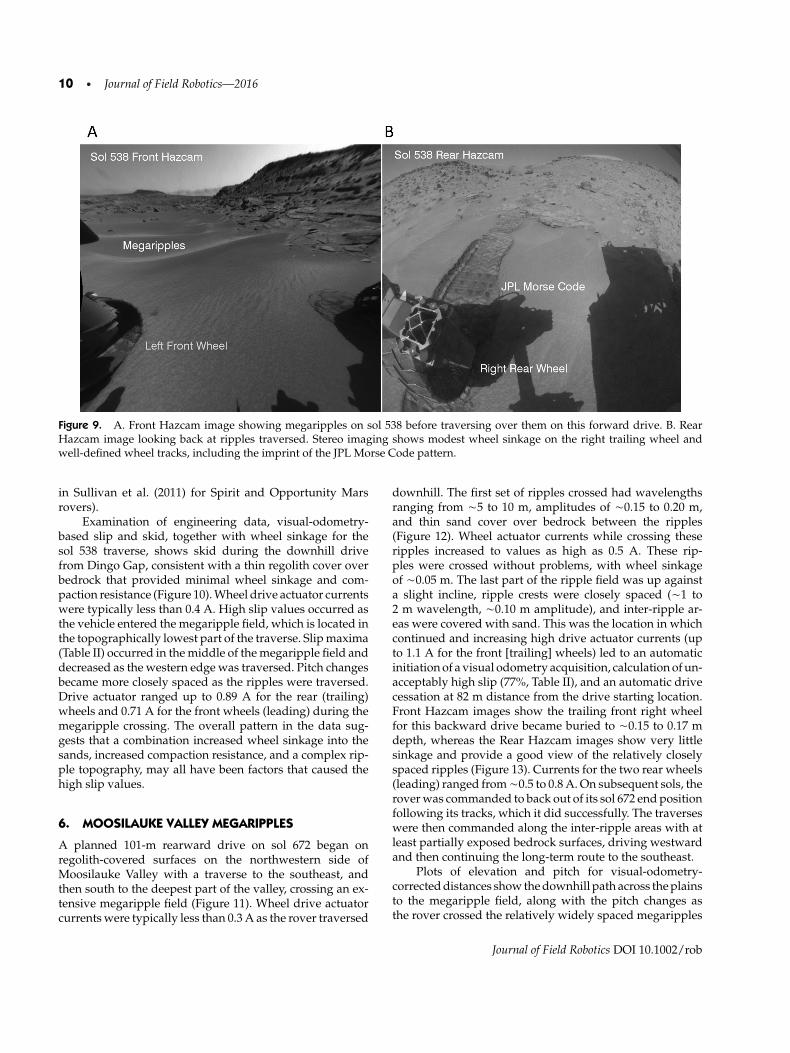
On sol 538 Curiosity traversed across a local low region witha megaripple field in Moonlight Valley (Figure 7). Imagingfrom the Front Hazcams showed slightly cohesive sands,breaking into clods in front of the wheels (Figure 9A). Onthe basis of measurements from HiRISE, Navcam, and Haz-cam data, the megaripples are �0.1 to 0.15 m high, with
wavelengths ranging from �2 to 3 m. The inter-ripple ar-eas are covered with sand, although it is not possible todetermine the depth to bedrock. Wheel sinkage across theripples was �0.04 to 0.07 m, based on Rear Hazcam im-age data (Figure 9B). Wheel grouser and JPL Morse codeimprints were well preserved, with consistent compactionand a lack of slip-sinkage (e.g., Wong, 2001). The imprintsare consistent with the presence of poorly sorted sands inwhich silt and clay-sized particles were pushed into voidsbetween sand-sized grains, providing an apparent cohe-sion and producing high-fidelity imprints (as described
Journal of Field Robotics DOI 10.1002/rob
10 • Journal of Field Robotics—2016
Figure 9. A. Front Hazcam image showing megaripples on sol 538 before traversing over them on this forward drive. B. RearHazcam image looking back at ripples traversed. Stereo imaging shows modest wheel sinkage on the right trailing wheel andwell-defined wheel tracks, including the imprint of the JPL Morse Code pattern.
in Sullivan et al. (2011) for Spirit and Opportunity Marsrovers).
Examination of engineering data, visual-odometry-based slip and skid, together with wheel sinkage for thesol 538 traverse, shows skid during the downhill drivefrom Dingo Gap, consistent with a thin regolith cover overbedrock that provided minimal wheel sinkage and com-paction resistance (Figure 10). Wheel drive actuator currentswere typically less than 0.4 A. High slip values occurred asthe vehicle entered the megaripple field, which is located inthe topographically lowest part of the traverse. Slip maxima(Table II) occurred in the middle of the megaripple field anddecreased as the western edge was traversed. Pitch changesbecame more closely spaced as the ripples were traversed.Drive actuator ranged up to 0.89 A for the rear (trailing)wheels and 0.71 A for the front wheels (leading) during themegaripple crossing. The overall pattern in the data sug-gests that a combination increased wheel sinkage into thesands, increased compaction resistance, and a complex rip-ple topography, may all have been factors that caused thehigh slip values.
6. MOOSILAUKE VALLEY MEGARIPPLES
A planned 101-m rearward drive on sol 672 began onregolith-covered surfaces on the northwestern side ofMoosilauke Valley with a traverse to the southeast, andthen south to the deepest part of the valley, crossing an ex-tensive megaripple field (Figure 11). Wheel drive actuatorcurrents were typically less than 0.3 A as the rover traversed
downhill. The first set of ripples crossed had wavelengthsranging from �5 to 10 m, amplitudes of �0.15 to 0.20 m,and thin sand cover over bedrock between the ripples(Figure 12). Wheel actuator currents while crossing theseripples increased to values as high as 0.5 A. These rip-ples were crossed without problems, with wheel sinkageof �0.05 m. The last part of the ripple field was up againsta slight incline, ripple crests were closely spaced (�1 to2 m wavelength, �0.10 m amplitude), and inter-ripple ar-eas were covered with sand. This was the location in whichcontinued and increasing high drive actuator currents (upto 1.1 A for the front [trailing] wheels) led to an automaticinitiation of a visual odometry acquisition, calculation of un-acceptably high slip (77%, Table II), and an automatic drivecessation at 82 m distance from the drive starting location.Front Hazcam images show the trailing front right wheelfor this backward drive became buried to �0.15 to 0.17 mdepth, whereas the Rear Hazcam images show very littlesinkage and provide a good view of the relatively closelyspaced ripples (Figure 13). Currents for the two rear wheels(leading) ranged from �0.5 to 0.8 A. On subsequent sols, therover was commanded to back out of its sol 672 end positionfollowing its tracks, which it did successfully. The traverseswere then commanded along the inter-ripple areas with atleast partially exposed bedrock surfaces, driving westwardand then continuing the long-term route to the southeast.
Plots of elevation and pitch for visual-odometry-corrected distances show the downhill path across the plainsto the megaripple field, along with the pitch changes asthe rover crossed the relatively widely spaced megaripples
Journal of Field Robotics DOI 10.1002/rob

Arvidson et al.: Curiosity Rover Megaripple Crossings • 11
Figure 10. A. Plot of rover-based elevation and pitch as a function of slip-corrected distance for the sol 538 drive into MoonlightValley, including crossing the megaripple field. Rover icon is shown in correct size relative to the traverse distance. For this forwarddrive, positive pitch corresponds to uphill travel, whereas negative pitch corresponds to downhill travel. B. Plot of slip and skidas a function of slip-corrected distance. Curiosity shifted from skid to slip as it started downhill on regolith-covered surfaces andencountered a local low area with ripples. Slip peaked in the middle of the ripple field.
(Figure 14A). Pitch on this backward drive shows uphill andthen downhill motions as the rover first ascended and thendescended the flanks of these ripples. Visual odometry datawere only occasionally collected but do show modest skidgoing downhill on the plains, followed by slip in the ripplefield (Figure 14B).
After crossing the megaripple straddling Dingo Gap,and the megaripple fields on sols 538 and 672, it was con-sidered important to conduct a controlled experiment witha high density of visual odometry observations and associ-
ated engineering data while crossing a single megaripple inMoosilauke Valley. The reason for choosing a single ripplewas to minimize the number of variables and to evaluatethe magnitude of wheel sinkage, slip on ripple ascent, andskid on descent. A single �6 m wavelength and �0.4 mamplitude ripple was chosen for a frontward crossing onsol 683 and the experiment was successful (Figures 15, 16).Both slip and skid occurred, values were not particularlyhigh (Table II), and reminiscent of the Dingo Gap megarip-ple crossing. The rear wheel (trailing) drive actuator current
Journal of Field Robotics DOI 10.1002/rob

12 • Journal of Field Robotics—2016
Figure 11. Portion of a HiRISE image mosaic shown in Figure 2 overlain with color-coded elevation data, with a relief of �11 mfrom high (red) associated with sandstone-covered plateaus (cap rock) to low (blue and purple) valleys. Megaripple fields werecrossed on sols 672 and 683. The sol 683 single megaripple crossing was an experiment in which a dense suite of engineering andimage data were acquired to better understand ripple crossing dynamics. Red line shows actual Curiosity traverse path.
Figure 12. A. Portion of the sol 672 Navcam mosaic showing megaripples crossed before a 77% slip value led to an automaticcessation of this rearward traverse. B. Topographic map generated from the Navcam stereo image coverage, with bright areascorresponding to higher regions. Relief in the Navcam-based map is �0.5 m. Ripple features are correlated between the image andmap using a set of numbers. As Curiosity approached high slip values the wheel track imprints became disrupted and the JPLMorse code patterns imprinted into the sand became closer together.
Journal of Field Robotics DOI 10.1002/rob

Arvidson et al.: Curiosity Rover Megaripple Crossings • 13
Figure 13. A. Sol 672 Rear Hazcam image showing little wheel sinkage for the leading right wheel on this backward drive. B.Front Hazcam image showing wheel sinkage for the right front wheel.
peaked at 1.42 A during ascent, with values less than 0.4 Afor the front wheel (leading) actuators. Wheel currents dur-ing ripple descent averaged �0.3 A. Wheel sinkage at thecrest of the ripple, based on examination of Rear Hazcamimage data, was �0.03 to 0.07 m. It is likely that the trailingwheels, while helping get the rover across the ripple crest,did not encounter deep sand. Rather, those wheels were onthin sand covering bedrock surfaces, and maintained trac-tion until the leading wheels crested and the rover beganthe descent. Results showed that Curiosity was capable oftraversing across single megaripples without excessive slip,in the same way that occurred for the Dingo Gap megarip-ple, and the several widely spaced megaripples encoun-tered on sol 672 in the northern portion of that ripple field.
7. HIDDEN VALLEY MEGARIPPLES
On sol 706 Curiosity reached the entrance to Hidden Valleyand acquired extensive imaging data to provide terrain in-formation that would allow an assessment as to whether theextensive megaripple field located on the valley floor wouldbe traversable (Figures 17, 18). This field has megarippleswith wavelengths of �2 to 3 m and amplitudes of �0.15 to0.20 m, with smaller ripples in sand-covered inter-rippleregions. The preferred path would have been along thesouthern margin of the megaripple field (nicknamed the“shoreline”), staying on the boundary between the megarip-ples and the southern slope extending downward from thesandstone bedrock on the southern plateau. To get there,the rover was commanded to traverse across the megarip-ple field because large talus blocks precluded starting thedrive on the western portion of the “shoreline” (Figures 17,18).
Driving backward through this complex and deepmegaripple field proved to be problematic, and the vehi-cle sensed continued high motor currents that initiated a
visual odometry session, with a high slip estimation whilein the middle of the ripple field, and driving in a slight (�3o)uphill direction (Figures 18, 19). The high slip values led toan automatic drive cessation (Table II). Wheel drive actua-tor currents at the start of the drive ranged from 0.2 to 0.55A, with the rear wheel (leading) values ending at approxi-mately 0.5 A. The trailing wheel drive actuators at the end ofthe drive had values that ranged from 0.9 to 1.05 A. Imag-ing of the wheels and tracks showed deep sinkage of thetrailing wheels, and a change from detailed wheel imprints(compaction-dominated) to disrupted features, consistentwith disrupting sands in a slip-sinkage mode (Figure 19).Trailing wheels were buried to �0.15 to 0.18 m. Leadingwheels did not show appreciable sinkage, a situation remi-niscent of the sol 672 ripple crossing.
Artemis was used to simulate the drive into HiddenValley, using a digital elevation map generated from Nav-cam stereo data and the drive commands used for the sol 709traverse across the megaripple field (Figure 20). The samesand properties as used for Dingo Gap, with the addition ofcohesion, were adjusted to match slip values observed byCuriosity and the trailing wheel sinkages at the end of thedrive (Figures 19C-D; Table III). Cohesion was added be-cause images of the ripples suggested less cloddy behaviorwhen disturbed, relative to the Dingo Gap megaripple. Thesimulation shows modest skid on the downhill portion ofthe drive, but generally replicates the slip patterns observedby Curiosity (Figure 20). As a comparison, a simulation us-ing Dingo Gap megaripple sand properties (Table III) wasalso conducted using the same elevation data. Slip valuesfor the Dingo Gap sand properties did not exceed thresholdsfor drive cessation. Differences between these two simula-tions suggest, within the limitations of the Artemis mod-eling regime, that the sands in Hidden Valley are morecompressible (thus with more compaction resistance) thanthose encountered while crossing the megaripple straddling
Journal of Field Robotics DOI 10.1002/rob

14 • Journal of Field Robotics—2016
Figure 14. A. Plots of rover-based elevation and pitch as a function of slip-corrected distance for the sol 672 drive. B. Plot of slipas a function of slip-corrected distance. Only a few slip values were planned and acquired during the traverse. Onboard detectionof anomalously high drive actuator currents automatically launched a visual odometry measurement to evaluate slip. The highvalue detected was above the threshold setting (Table II), and the rover stopped its traverse.
Dingo Gap. Further, the shear coefficient for the shear stressslip relationship indicates that the Hidden Valley sandstend to have more slip for given normal and shear stresses(Table III).
On sol 710 the rover was commanded to reverse itspath back to the entrance to Hidden Valley, and analy-sis of telemetry showed high slip values as the rover tra-versed through the sands in an uphill direction (Figure 21).Wheel drive actuator currents ranged from 0.45 to 1.0 A,with higher values for the rear (trailing) wheels. The drive
was planned to traverse along the tracks made during thesol 709 drive, thereby taking advantage of the compressedsand, with less sinkage and associated compaction resis-tance. The rover yawed out of the tracks. The increasedcurrents and slip are interpreted to be due to a combina-tion of working against gravity while driving uphill andincreased compaction resistance as new sands were com-pressed by wheel loads. Continued high currents again ledto an automatic drive cessation. Two drives later the roverreached the entrance to Hidden Valley.
Journal of Field Robotics DOI 10.1002/rob

Arvidson et al.: Curiosity Rover Megaripple Crossings • 15
Figure 15. Portion of a sol 683 Navcam mosaic looking back at the megaripple traversed as part of a ripple crossing experimentin which a dense array of engineering data was collected. The majority of the traverse was across regolith-covered plains strewnwith rocks.
A decision was made after the Hidden Valley drives toavoid extensive megaripple fields and to drive in valleyscovered by regolith, relatively thin windblown sand cov-ers, and single megaripples. Drives were also accomplishedwhen needed on the sandstone-dominated plateau surfaces,biased toward local low areas where thin sand depositswould cushion the wheels from further punctures and tearsfrom sharp rocks. For example, after exiting Hidden Valley,Curiosity was commanded to drive to the north and westover plateau surfaces (Figure 17). This approach proved tobe successful and Curiosity reached the base of Mount Sharpin Pahrump Hills on sol 753 to conduct an extensive set ofscientific measurements on the exposed fluvial-lacustrinerock strata (Vasavada et al., 2015).
8. CURIOSITY DATA COMPARED TO SCARECROWEXPERIMENTS ON DUNES AND ARTIFICIALRIPPLES AT THE DUMONT DUNE FIELD
Curiosity telemetry data show that slip values greater than�50%, along with enhanced trailing wheel drive actuatorcurrents, occurred during crossing the extensive megarip-ple fields on sol 538, 672, 709, and 710 (Table II). A plot ofslip as a function of rover tilt shows a wide range of slip val-ues for these crossings (Figure 22). However, the traversesacross the Dingo Gap megaripple, the sol 683 megaripple,and drives across valley floors with bedrock partially cov-ered by regolith or thin covers of windblown sand, showed
the more classic increase in slip with increasing tilt, andskid while driving downhill (Figure 22). The classic patternof increased slip with increased tilt includes results fromfield tests using the Scarecrow rover in 2012 generated whiledriving up the flank of a large dune in the Dumont Dunes(Heverly et al., 2013). Overall results suggest that the mate-rial properties of sands in deep, extensive megaripple fields,together with megaripple geometries, were both involvedin generation of high wheel sinkage, increased actuator cur-rents for the trailing wheels, and high slip values.
To better understand how Curiosity interacted withmegaripples during its crossings Scarecrow was rede-ployed to the Dumont Dunes in June 2014. Artificial rip-ples (not megaripples because coarse-grained monolayerwas not present) were constructed with approximately thesame wavelengths as found for the megaripples Curiositycrossed, and was expected to cross, if and when furthercrossings were planned (Figure 23). Amplitudes were pur-posely set higher than found for the megaripple fields in or-der to provide worst-case scenarios. Scarecrow was drivenforward in the morning and then backward in the afternoonover these ripples, and slip was monitored on a continuousbasis using the same monitoring systems used during the2012 tests (Heverly et al., 2013). After each run, the rippleswere rebuilt using shovels, with a noticeable shift to steeperripples by the afternoon backward runs. Slip and skid asa function of rover pitch show a wide range of slip val-ues, even though wheel sinkage visually determined was
Journal of Field Robotics DOI 10.1002/rob

16 • Journal of Field Robotics—2016
Figure 16. A. Plot of rover-based elevation and pitch for the sol 683 drive, in which pitch changes ascending and descending thesingle megaripple are evident over the first 15 m of the traverse. B. Plot of slip and skid as a function of slip-corrected distance.Note the transition from slip to skid as Curiosity crested the megaripple.
typically less than �0.05 m (Figure 24A). Slip approached�95% in some cases, for both forward and backward drives.The leading wheels typically excavated the ripple crests un-til the pitch decreased enough for the rover to continueits drive. The pattern of slip as a function of pitch wasmuch more complex than the relatively simple increasein slip with increasing pitch associated with climbing theflanks of the Dumont Dunes (Figure 24A), and reminiscentof the pattern observed while Curiosity traversed exten-sive, deep megaripple fields on sols 538, 672, 709, and 710(Figure 22).
9. SINGLE-WHEEL EXPERIMENTS AND ARTEMISSIMULATIONS TRAVERSING ACROSS DUMONTDUNE RIPPLES
To further understand the underlying causes of high slipsituations while crossing megaripples, single-wheel testsusing the MIT wheel-soil rig with a spare Curiosity wheel(details of the rig set-up and sand properties in Senatoreet al. (2014)) were run with tilted, sand-covered surfaces,with and without superimposed sand ripples. Ripple am-plitudes were set to be comparable to those crossed by Cu-riosity. Results showed that increasing slope on a tilted,
Journal of Field Robotics DOI 10.1002/rob

Arvidson et al.: Curiosity Rover Megaripple Crossings • 17
Figure 17. Portion of a HiRISE image mosaic shown in Figure 2 overlain with color-coded elevation data, and centered overHidden Valley, with a relief of �10 m from high (red) associated with sandstone-covered cap rock plateaus, to low (blue andpurple) values in Hidden Valley. The sol 709 backwards drive was an attempt to cross the megaripple field in Hidden Valley andled to an automatic drive cessation when high slip values were measured. Red line shows actual Curiosity traverse path.
Figure 18. Portion of a sol 706 Navcam mosaic looking into the megaripple field in Hidden Valley, with the approximate sol 709drive path across the ripple field shown. The drive was planned to cross the ripple field to get to the southern “shoreline” and tothen continue along the southern valley wall.
sand-covered surface produced a slip vs pitch curve muchlike the one found for climbing the Dumont Dune flank. Onthe other hand, placing �0.10 m high ripple on the tiltedsurface increased slip significantly, and a working hypoth-esis was that the increased pitch of the local surface movedthe interactions further along the slip-pitch curve.
The single-wheel experiments were exploratory andhinted at one of the reasons for increased slip when cross-
ing megaripple fields. However, the complex slip, skid,and tilt patterns evident for both the Dumont ripple andMars megaripple crossings suggested that a more com-plicated explanation was needed. To that end, a series ofArtemis simulations were conducted across simulated Du-mont Dunes ripples of varying amplitudes. These runs pro-duced slip, skid, and pitch patterns similar to those evidentfor the Scarecrow ripple and Curiosity megaripple crossings
Journal of Field Robotics DOI 10.1002/rob

18 • Journal of Field Robotics—2016
Figure 19. A. Sol 709 Rear Hazcam image showing little wheel sinkage for right rear (leading) wheel during the traverse into themegaripple field in Hidden Valley. Also note the lack of bedrock exposures in the inter-ripple areas. B. Sol 709 Front Hazcam imagelooking back at tracks produced during entry into Hidden Valley. Note track imprint disruptions and deeply buried right fronttrailing wheel.
Figure 20. A. Plot of rover-based elevation and pitch as a function of slip-corrected distance for the sol 709 backward drive inHidden Valley. B. Plot of rover-based elevation as a function of slip. While driving downhill slip as opposed to skid dominated thedrive because of the retarding effects of sandy megaripples, that is, increased wheel sinkage and associated compaction resistance.The drive was automatically stopped when slip exceeded the threshold value (Table II). C. Plot from Artemis simulation of rover-based elevation and pitch as a function of slip-corrected distance. D. Plot from Artemis simulation of slip and skid as a function ofslip-corrected distance.
Journal of Field Robotics DOI 10.1002/rob

Arvidson et al.: Curiosity Rover Megaripple Crossings • 19
Figure 21. A. Plots of elevation, pitch for the sol 710 drive out of Hidden Valley. B. Slip as a function of slip-corrected distance.High slip values occurred during this uphill drive over ripples, both because of the downhill pull due to gravity and yawing outof the sol 709 tracks.
Journal of Field Robotics DOI 10.1002/rob

20 • Journal of Field Robotics—2016
Figure 22. Plot of slip, skid, and rover tilt for the Curiosity data presented in this paper, along with an uphill traverse during the2012 field tests on a Dumont Dunes dune face. Tilt rather than pitch is used for the abscissa because slip and skid did not alwaysoccur along the pitch direction. Note that the regolith-covered plains and the Dingo Gap megaripple data occupy the lower portionof the data swarm, whereas the crossings of extensive megaripple fields have higher slip values and are more variable. Data arecolor-coded by sol traversed and by symbols. Dumont data are approximated by a polynomial fit to data reported in Heverly et al.(2013).
(Figure 24B). For both backward and forward drives, thehigh slip situations were associated with poses in whichthe rover needed to increase wheel drive actuator currents(and thus torque) to propel one or more wheels up andover ripple flanks and/or crests (Figures 25 and 26). Simu-lated wheel sinkage patterns are complex and proportionalto static loads associated with specific poses as the rovertraversed across the ripples (Figures 25 and 26). Skid oc-curred in the Artemis runs when one or more wheels weredescending the ripple flanks. More skid is evident in theArtemis models than found for the Dumont and Mars rip-ple data. This is interpreted to be associated with an ob-servation during Dumont Dune ripple crossings in whichleading wheels excavated the ripple crests until the roverwas able to continue its drives, thereby negating the skidportion of the drives. A similar phenomenon may have
occurred during the Moosilauke Valley and Hidden Val-ley megaripple crossings. This phenomenon was difficult toreproduce using Artemis. Overall, the similarities betweenmegaripple and ripple crossings also demonstrate that thecoarse-grained monolayer that distinguishes megaripplesfrom ripples does not influence the terramechanics associ-ated with crossing megaripples.
Artemis was also run using its contact model in whichthe surfaces were assumed to be nondeformable and char-acterized by static and dynamic coefficients of friction andtransition velocities used for simulations of an Opportu-nity rover drive over bedrock on the Endurance Crater rim(Zhou et al., 2014). Results show the same patterns of slipand skid as a function of rover pitch, with more abrupt tran-sitions that are smoothed out by use of the deformable sandmodel shown in Figures 25 and 26. Thus, both the geometry
Journal of Field Robotics DOI 10.1002/rob

Arvidson et al.: Curiosity Rover Megaripple Crossings • 21
Figure 23. A. Rover icon scaled to the ripple distance for artificial ripples made in the Dumont Dunes. B. Plot of a topographicprofile for the manmade ripples, fit with a cubic spline. Plot also shows a topographic profile for the Hidden Valley megaripplesgenerated from topographic data extracted from the sol 709 Navcam stereo images. Note that the Hidden Valley ripples haveapproximately the same wavelengths but much smaller amplitudes as compared to the Dumont ripples. C. Scarecrow rover isshown during one of its traverses across the ripples.
Figure 24. A. Plot of slip and skid as a function of pitch for forward and backward Scarecrow drives across the Dumont ripples,with ripple amplitudes ranging from 0.35 to 0.40 m and a mean wavelength of 1.73 m. B. Plot of slip, skid, as a function of pitchfor Artemis simulations across ripples of constant 1.73 m wavelength and varying amplitudes. Sand properties for the dune faceascent were based on Zhou et al. (2014), whereas the cohesion, frictional modulus, shear modulus, n0 and n1 were adjusted tomatch slip and sinkage values observed during Dumont Dune ripple crossings (Table III).
Journal of Field Robotics DOI 10.1002/rob

22 • Journal of Field Robotics—2016
Figure 25. A. Artemis-based rover pose for maximum slip for a forward drive over 1.73 m wavelength and 0.30 m high ripples.B. Artemis-based rover pose for maximum skid for a forward drive over 1.73 m wavelength and 0.30 m high ripples. C. Slip, skid,and total wheel drive actuator power consumption are plotted as a function of simulation time. Dark vertical line is shown for thetime for which the rover pose is shown in Figure 25A (slip). Gray line is shown for the pose shown in Figure 25B (skid). D. Wheelsinkage values are plotted as a function of simulation time, with the same vertical lines as shown in Figure 25C. Sand parameterswere used from Table III for the Dumont ripples.
Figure 26. A. Artemis-based rover pose for maximum slip for a backward drive over 1.73 m wavelength and 0.30 m high ripples.B. Artemis-based rover pose for maximum skid for a backward drive over 1.73 m wavelength and 0.30 m high ripples. C. Slip, skid,and total wheel drive actuator power consumption are plotted as a function of simulation time. Dark vertical line is shown for thetime for which the rover pose is shown in Figure 26A (slip). Gray line is shown for the pose shown in Figure 26B (skid). D. Wheelsinkage values are plotted as a function of simulation time, with the same vertical lines as shown in Figure 25C. Sand parameterswere used from Table III for the Dumont ripples.
Journal of Field Robotics DOI 10.1002/rob

Arvidson et al.: Curiosity Rover Megaripple Crossings • 23
of the megaripples and sand material properties are inter-preted to have influenced the terramechanics of Curiosity’smegaripple crossings.
10. CONCLUSIONS AND IMPLICATIONS
This paper examined the ability of the Curiosity rover totraverse across windblown, sand-dominated megaripples,including high slip and wheel sinkage events associatedwith crossing megaripple fields that are extensive and deepenough to cover the underlying bedrock and regolith com-pletely. Crossing bedrock, regolith-covered bedrock, andsingle megaripples, including one straddling Dingo Gap,showed the classic slip as a function of tilt while drivinguphill and skid as a function of tilt while driving downhill.Traversing extensive megaripple fields, with ripple crestsseparated by wavelengths comparable to the front-to-backwheel distances, produced complex slip as a function ofrover tilt, with extreme slip values up to 77%, and trailingwheel sinkages up to �0.15 to 0.17 m or �30% of the wheeldiameter. Single-wheel tests, experiments conducted witha three-eighths mass rover over artificial ripples at the Du-mont Dune Field, Mojave Desert, and numerical modeling,indicate that this complex pattern with high and variableslip values is associated with rover traverses in sands inwhich one or more wheels are trying to ascend the megarip-ple flanks. The increased drive actuator power needed toascend megaripple flanks led to increased wheel actuatorcurrents, increased slip, and in cases where one or more ofthe wheels carried more load, increased wheel sinkage andassociated compaction resistance. Curiosity has since beendirected to avoid these complex megaripple fields duringits traverses.
The mobility difficulties experienced crossing complexmegaripple fields were unexpected, and fortunately only ahandful of sols were lost to automatic cessation of drives.The need to avoid these fields after the aborted HiddenValley drives increased the time to reach Pahrump Hills, asite for which extensive scientific measurements were made(Vasavada et al., 2015), by �30%, relative to what werethought to be relatively easy drives through valleys withmegaripples. The Hidden Valley megaripple field is locatedin a transitional zone, whereas closer to Mount Sharp theextensive and active Bagnold Dune field will need to bedetoured around and crossed where the dune sand is mini-mal. It remains to be seen how the rover will respond duringthese crossings. To prepare Artemis for more realistic highslip simulations of any future megaripple and dune cross-ings, the classical terramechanics model for wheel-sand in-teractions are being updated with more realistic discreteelement method approaches (Johnson et al., 2015).
The problems associated with crossing megaripplefields have been acknowledged and are being studied byNASA’s 2020 Mars Rover Team, in addition to considera-tion of updating Curiosity-style wheels for the 2020 rover
with a thicker skin to minimize damage while driving oversharp rocks. Tests are also being conducted for both Curios-ity and the 2020 rover using new ways of driving throughmegaripple and dune fields, including varying wheel cur-rents based on sensed patterns associated with wheel burialand increased compaction resistance. Finally, the 2020 MarsRover landing site selection team is including megaripplefields as likely hazards to avoid landing on and traversingacross.
ACKNOWLEDGMENTS
We thank the Mars Exploration Program, Mars Science Lab-oratory (Curiosity rover mission), for support for the workpresented in this paper. We also thank the many engineersand scientists associated with the Curiosity mission whohave helped in one way or another to make the mission asuccess. We thank Fred Calef, JPL, for extensive work onHiRISE mosaic generation and co-registration with digitalelevation maps generated from HiRISE stereo pair images.
REFERENCES
Arvidson, R. E., Gooding, J. L., & Moore, H. (1989). The Martiansurface as imaged, sampled, and analyzed by the VikingLanders. Reviews of Geophysics, 27, 39–60.
Arvidson, R. E., Bell, J. F. III, Bellutta, P., Cabrol, N. A., Cata-lano, J. G., Crumpler, L., et al. (2010). Spirit Mars RoverMission: Overview and selected results from the north-ern Home Plate Winter Haven to the side of Scaman-der Crater. Journal of Geophysical Research Planets, 115,E00F03, doi:10.1029/2010JE003633
Arvidson, R., Bellutta, P., Calef, F., Fraeman, A., Garvin, J., Gas-nault, O., et al. (2014). Terrain physical properties derivedfrom orbital data and the first 360 sols of Mars ScienceLaboratory Curiosity Rover Observations in Gale Crater.Journal of Geophysical Research Planets, 119, 1322–1344,doi:10.1002/2013JE004605
Bell, J. F. III, Malin, M. C., Caplinger, M. A., Ravine, M. A.,Godber, A. S., Jungers, M. C., et al. (2012). Mastcam mul-tispectral imaging on the Mars Science Laboratory Rover:Wavelength coverage and imaging strategies at the GaleCrater site. Lunar Planet. Sci. XLIII abstract 2541.
Bickler, D. B. (1988). Articulated suspension system, UnitedStates Patent US4840394 (A).
Christensen, P., Jakosky, B., Kieffer, H., Malin, M., McSween,H. Jr., Nealson, K., et al. (2004). The Thermal EmissionImaging System (THEMIS) for the Mars 2001 Odyssey Mis-sion. In C. Russell (Ed.), 2001 Mars Odyssey (pp. 85–130),Netherlands, Dordrecht: Springer.
Blake, D., Morris, R., Kocurek, G., Morrison, S., Downs, R., Bish,D. et al. (2013). Curiosity at Gale Crater, Mars: Characteri-zation and analysis of the Rocknest sand shadow. Science,341, 1239505-1–1239505-7, doi:10.1126/science.1239505
Edgett, K., Yingst, R., Ravine, M., Caplinger, M., Maki, J.,Ghaemi, F. et al. (2012). Curiosity’s Mars Hand Lens
Journal of Field Robotics DOI 10.1002/rob

24 • Journal of Field Robotics—2016
Imager (MAHLI) investigation. Space Science Reviews,170(1-4), 259–317, doi:10.1007/s11214-012-9910-4
Fraeman, A., Arvidson, R. E., Ehlmann, B., Bridges, N., Clark,B., Cousin, A., et al. (2015). Physical and material prop-erties of Gale Crater sandy deposits: From Rocknest toPahrump. Lunar Planet. Sci. XLVI abstract 1682.
Grotzinger, J., Crisp, J., Vasavada, A., Anderson, R., Baker, C.,Barry, R. et al. (2012). Mars Science Laboratory Missionand science investigation. Space Science Reviews, 170(1-4), 5–56, doi:10.1007/s11214-012-9892-2
Grotzinger, J., Summer, D., Kah, L., Stack, K., Gupta, S., Edgar,L., et al. (2014). A habitable fluvio-lacustrine environ-ment at Yellowknife Bay, Gale Crater, Mars. Science, 343,1242777-1–1242777-14, doi:10.1126/science.1242777
Haggert, S., & Waydo, J. (2008). The mobility system wheeldesign for NASA’s Mars Science Laboratory Mission. 11thEuropean International Society Terrain Vehicle SystemsMeeting, Torino, Italy.
Heverly, M., Matthews, J., Lin, J., Fuller, D., Maimone, M., Biesi-adecki, J. et al. (2013). Traverse performance characteriza-tion for the Mars Science Laboratory Rover. Journal ofField Robotics, 30(6), 835–846, doi:10.1002/rob.21481
Johnson, J., Kulchitsky, A., Duvoy, P., Iagnemma, K., Sena-tore, C., Arvidson, R., & Moore, J. (2015). Discrete el-ement method simulations of Mars Exploration Roverwheel performance. Journal of Terramechanics, 31–41, doi:10.1016/j.jterra.2015.02.004.
Maimone, M., Cheng, Y., & Matthies, L. (2007). Two years ofvisual odometry on the Mars Exploration Rovers. Journalof Field Robotics, 24(3), 169–186, doi:10.1002/rob.20184
Maki, J., Theissen, D., Pourangi, A., Kobzeff, P., Litwin, T.,Scherr, L., et al. (2012). The Mars Science Laboratory en-gineering cameras. Space Science Reviews, 170, 77–93,doi:10.1007/s11214-012-9882-4
McEwen, A., Eliason, E., Bergstrom, J., Bridges, N., Hansen, C.,Delamere, W., et al. (2007). Mars Reconnaissance Orbiter’sHigh Resolution Imaging Science Experiment (HiRISE).Journal of Geophysical Research Planets, 112, E05S02,doi:10.1029/2005JE002605
Moore, H. J. (1987). Physical properties of the surface mate-rials at the Viking Landing sites on Mars. United StatesGeological Survey Professional Paper 1389, 222 p.
Nakashima, H., & Kobayashi, T. (2014). Effects of grav-ity on rigid rover wheel sinkage and motion resis-tance assessed using two-dimensional discrete elementmethod. Journal of Terramechanics, 53, 37–45, doi:10.1016/j.jterra.2014.03.004
Senatore, C., Stein, N., Zhou, F., Bennett, K., Arvidson, R.,Trease, B., et al. (2014). Modeling and validation of mobil-ity characteristics of the Mars Science Laboratory CuriosityRover. Paper presented at 2014 i-SAIRAS, Montreal, June2014.
Stein, N., Arvidson, R., Heverly, M., Lindemann, R., Trease,B., Iagnemma, K., & Senatore, C. (2013). Validation ofArtemis mobility simulations for the Spirit, Opportunity,and Curiosity Mars rovers. American Geophysical UnionFall Meeting, Abstract P51G-1826.
Sullivan, R., Anderson, R., Biesiadecki, J., Bond, T., & Stew-art, H. (2011). Cohesions, friction angles, and otherphysical properties of Martian regolith from MarsExploration Rover wheel trenches and wheel scuffs.Journal of Geophysical Research Planets, 116, E02006,doi:10.1029/2010JE003625
Sullivan, R., & Zimbelman, J. (2015). Megaripples and theirsedimentary deposits on Earth and Mars. Lunar PlanetSci. XLVI abstract 2762.
Tehari, S. H., Sandu, C., Taheri, S., Pinto, E., & Gorsich, D.(2015). A technical survey on terramechanics models fortire–terrain interaction used in modeling and simulationof wheeled vehicles. Journal of Terramechanics, 57, 1–22,doi:10.1016/j.jterra.2014.08.003
Vasavada, A., & Science Team, M. S. L. (2015). Lat-est results from the Mars Science Laboratory Missionand Curiosity Rover. Lunar Planet Sci. XLVI abstract2715.
White, C., Antoun, G., Brugarolas, P., Lih, S., Peng, C., Phan,L., San Martin, A., et al. (2012). System verification of MSLSkycrane using an integrated ADAMS simulation. Paperpresented at proceedings of 2012 IEEE Aerospace Confer-ence, March 2012, doi:10.1109/AERO.2012.6186994
Williams, R., Grotzinger, J., Dietrich, W., Gupta, S., Sumner,D., Wiens, R., Mangold, N., et al. (2013). Martian flu-vial conglomerates at Gale Crater. Science, 340, 1068–1072,doi:10.1126/science.1237317
Wong, J. (2001). Theory of ground vehicles (3rd ed.). New York:John Wiley & Sons.
Wong, J. (2012). Predicting the performances of rigid roverwheels on extraterrestrial surfaces based on test resultsobtained on earth. Journal of Terramechanics, 49, 49–61,doi:10.1016/j.jterra.2011.11.002
Zhou, F., Arvidson, R., Bennett, K., Trease, B., Lindemann,R., Bellutta, P., et al. (2014). Simulations of Mars rovertraverses. Journal of Field Robotics, 31(1), 141–160,doi:10.1002/rob.21483
Journal of Field Robotics DOI 10.1002/rob


