Download - Malek Mohamadi
:عنوان سخنرانياستفاده از آلتراسونيك اتوماتيك و ساير روش هاي پيشرفته
تست غير مخرب ؛كاهش هزينه وافزايش بهره وري
حامد ملك محمديشركت كاركيا

Rotoscan System3rd Iran Pipetech Conference, 24 May 2011
Applying AUT & other Advanced NDT techniques;Reducing costs, Increasing efficiency
لتراسونيک اتوماتيک و ساير روش هاي پيشرفته تست غيرمخرب؛ کاهش ٓافزايش ,هزينهاستفاده از ا
بهره وري
Presented By: Hamed Malekmohammadi
ForewordAdvanced UT techniques TOFD Mapping Phased Array AUT (Automated Ultrasonic Testing) AUT in Iran Codes and standards Conclusion
Contents

Now a days there is a high demand of using technology and new developments on different industries specifically NDT field.
NDT is one of the most critical fields which can affect directly on the quality of equipments/structures/etc., life time and indirectly on costs and environment
This presentation will introduce some advanced techniques of NDT, their capabilities and advantages, and will show you their impact on quality, costs and timeline of projects.
Foreword

Time Of Flight Diffraction(TOFD)
Techniques
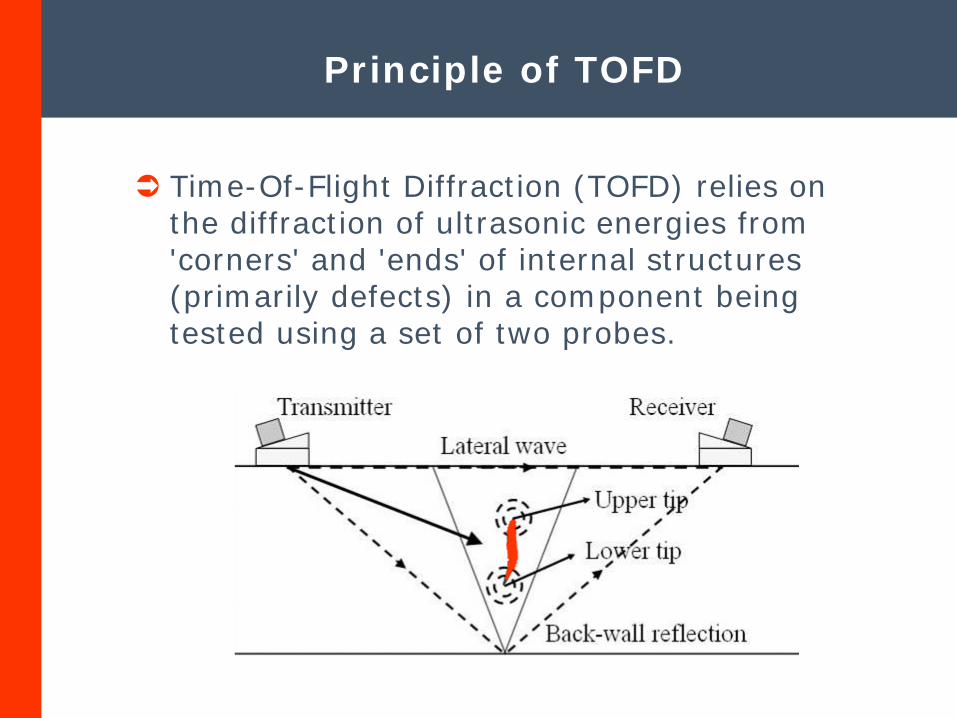
Time-Of-Flight Diffraction (TOFD) relies on the diffraction of ultrasonic energies from 'corners' and 'ends' of internal structures (primarily defects) in a component being tested using a set of two probes.
Principle of TOFD
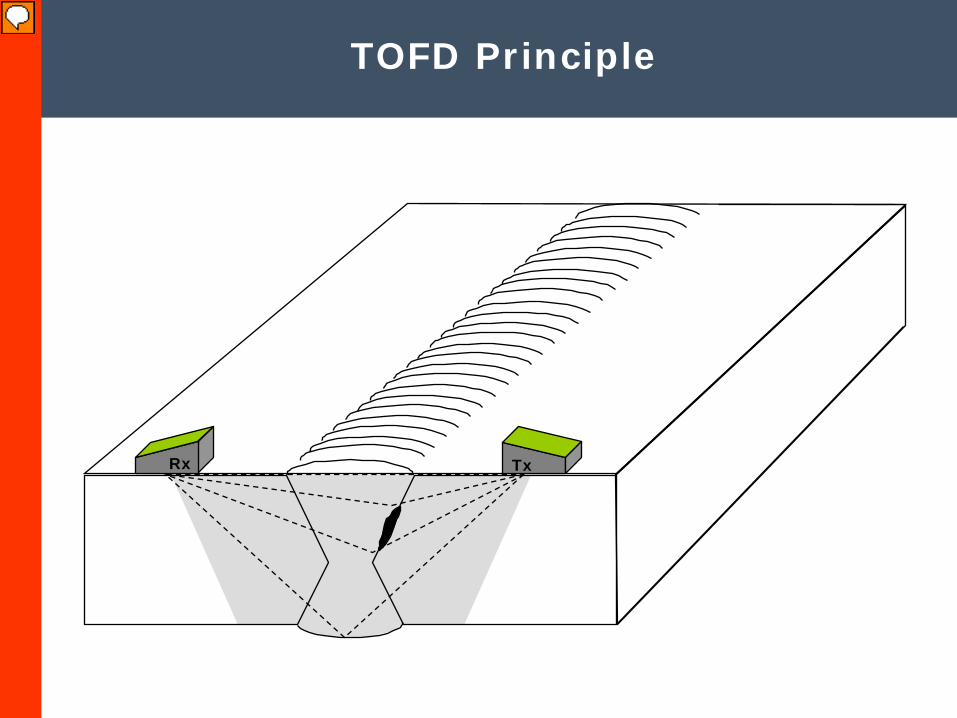
TxRx
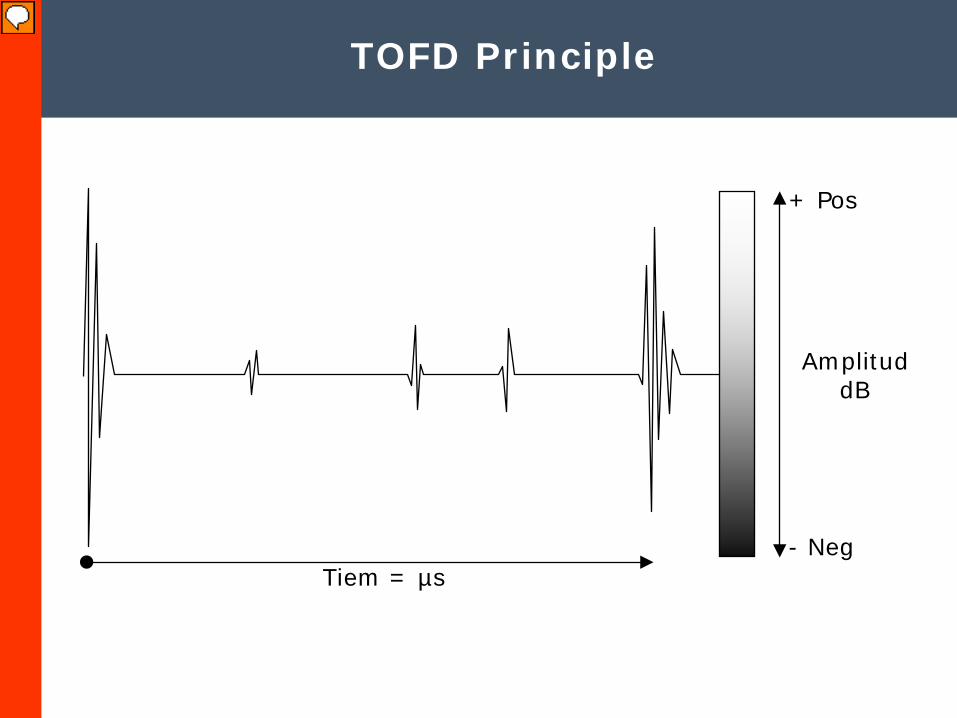
TOFD Principle
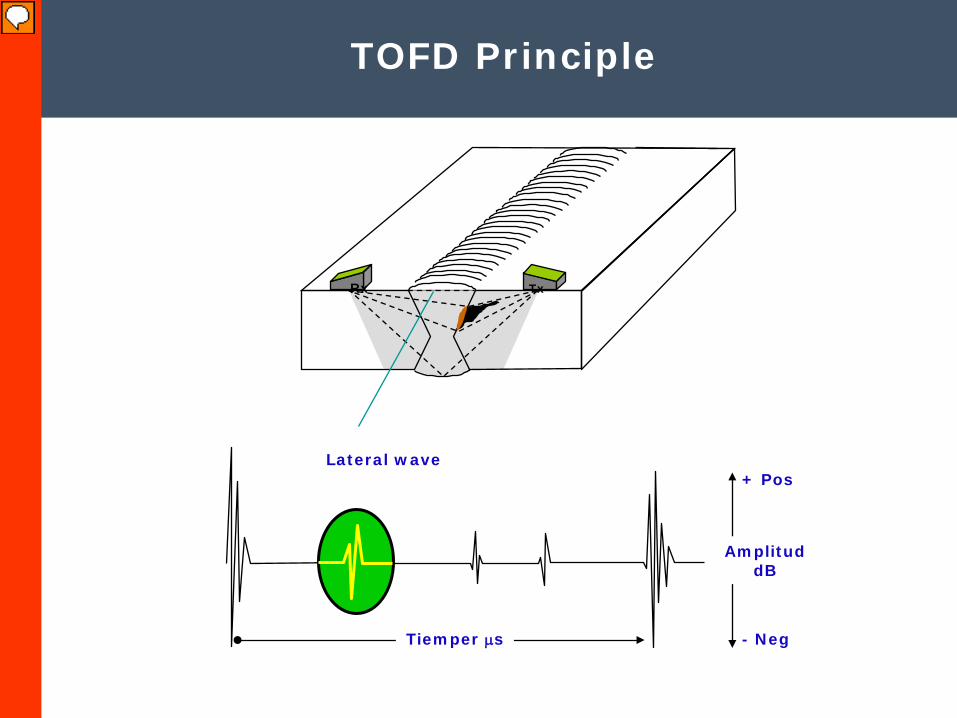
Tiemper µs
AmplituddB
+ Pos
- Neg
TxRx
Lateral wave
TOFD Principle
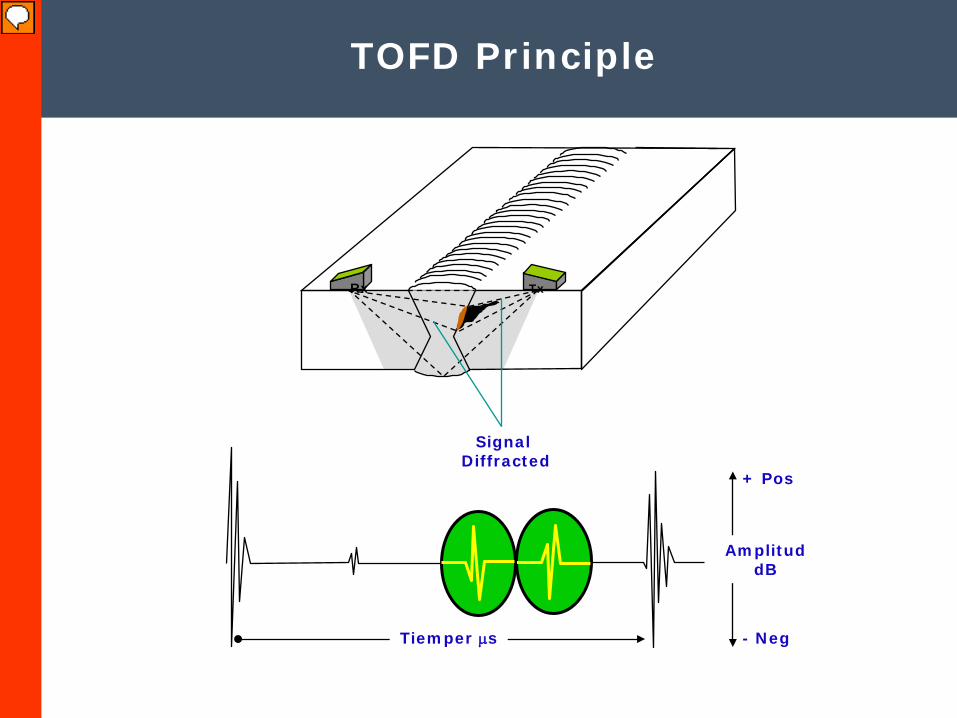
TxRx
Tiemper µs
AmplituddB
+ Pos
- Neg
Signal Diffracted
TOFD Principle
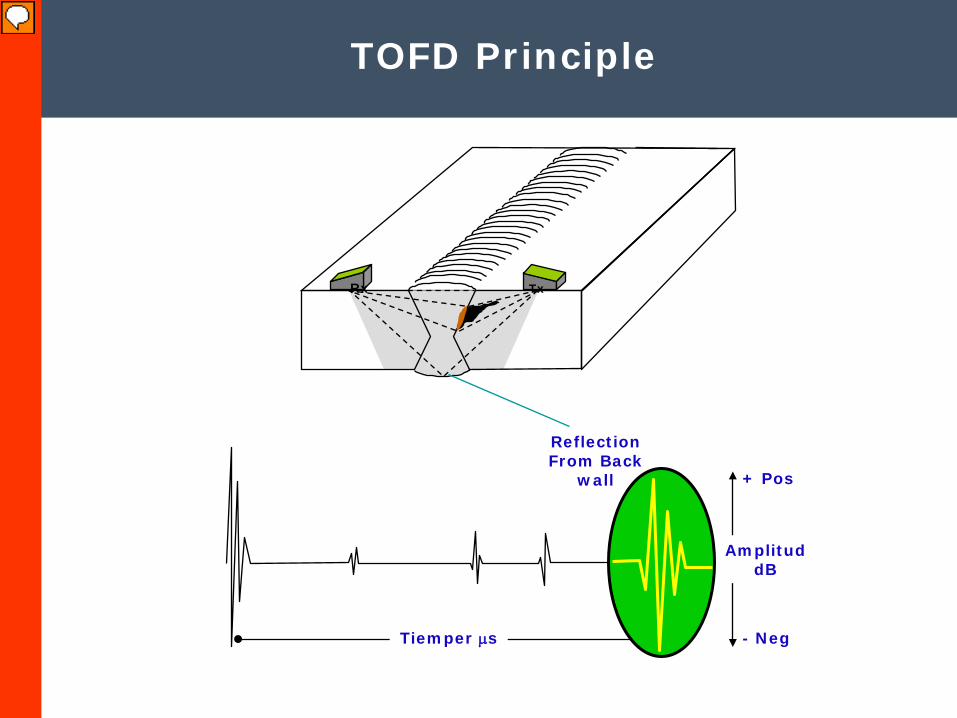
Tiemper µs
AmplituddB
+ Pos
- Neg
TxRx
Reflection From Back
wall
TOFD Principle
1
6
5
4
3
2
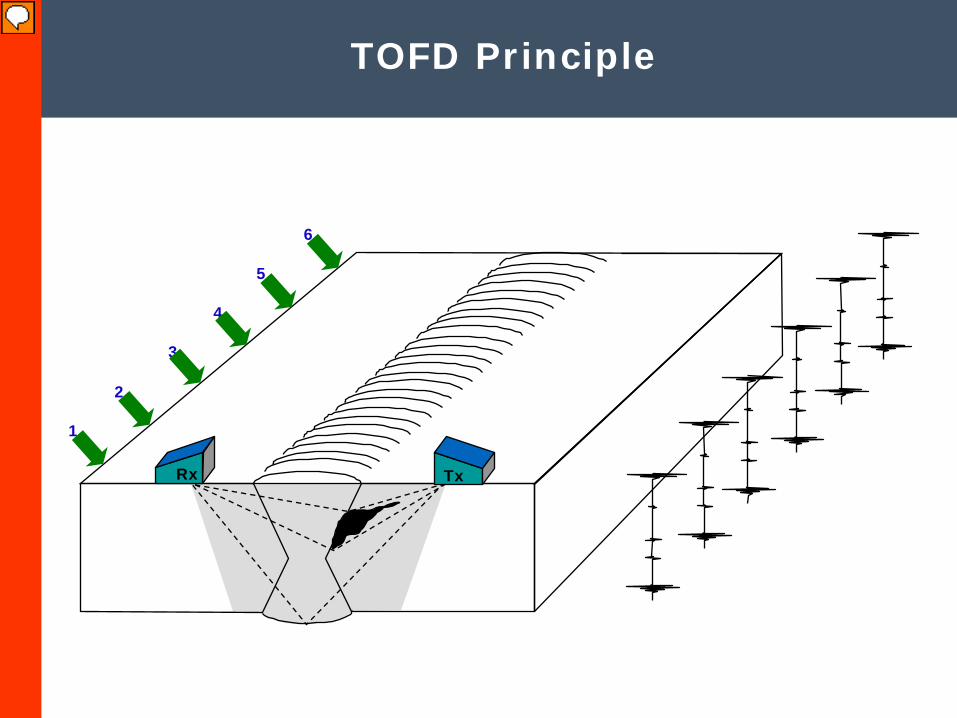
TxRx
TOFD Principle
Tiem = µs
AmplituddB
+ Pos
- Neg
TOFD Principle
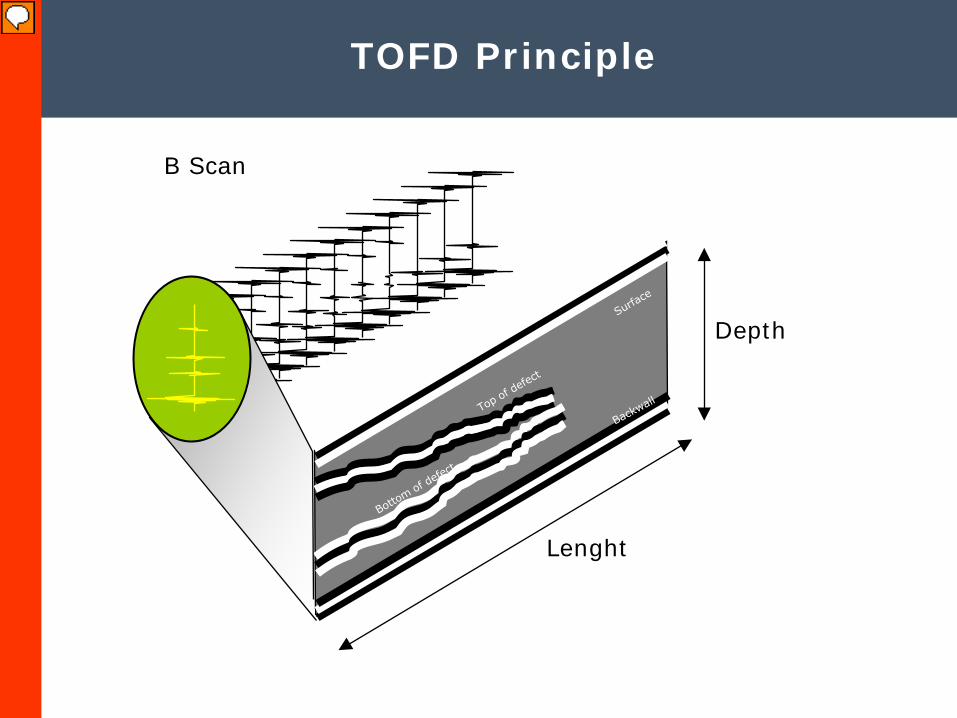
Lenght
Depth
B Scan
TOFD Principle
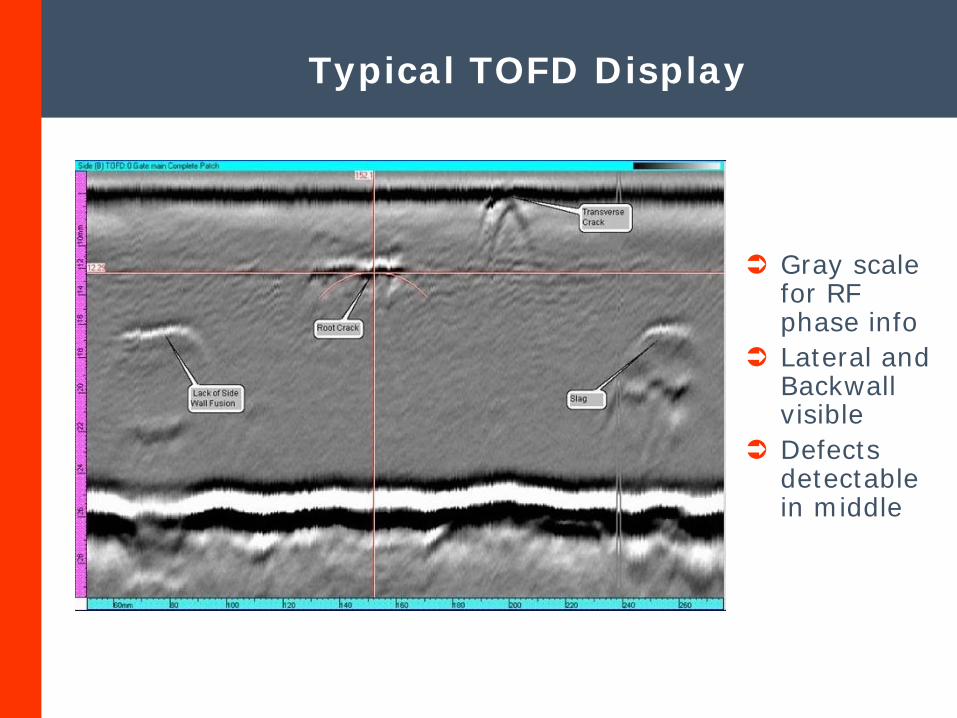
Gray scale for RF phase info
Lateral and Backwall visible
Defects detectable in middle
Typical TOFD Display
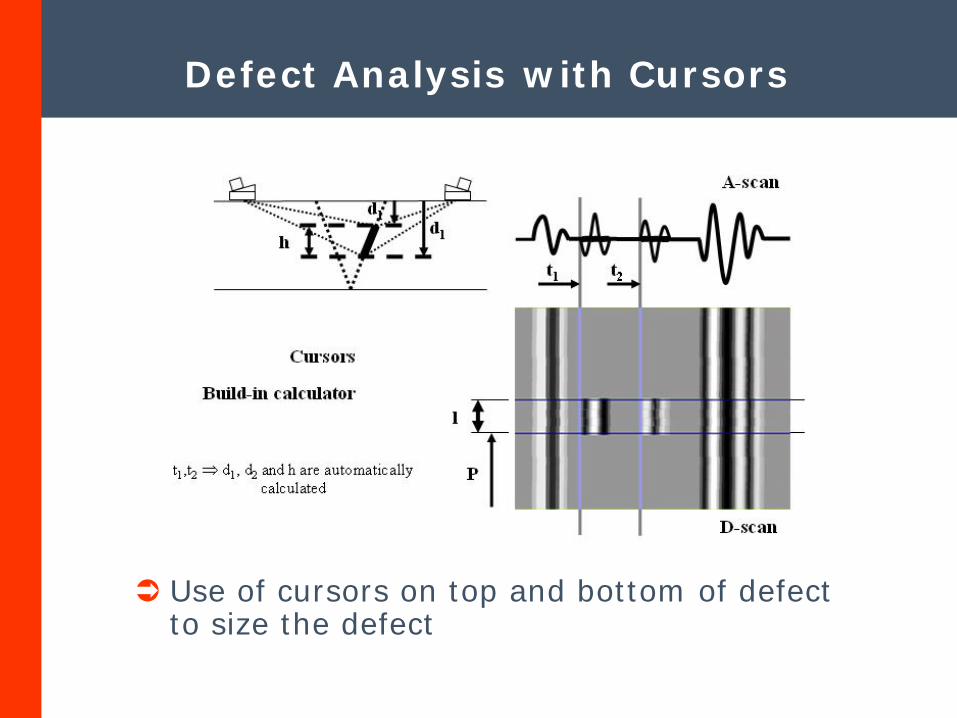
Use of cursors on top and bottom of defect to size the defect
Defect Analysis with Cursors
Phased Array
Techniques
Phased Array Concept
An “Array” of transducers (Piezo) elements in which the timing of elements’ excitation can be individually controlled to produce certain desired effects, such as steering the beam axis or focusing the beam
Each element has its own connector, time delay circuit and A/D converter
Elements are acoustically insulated from each other
Elements are pulsed in groups with pre-calculated time delays for each element; “Phasing”
Phased Array
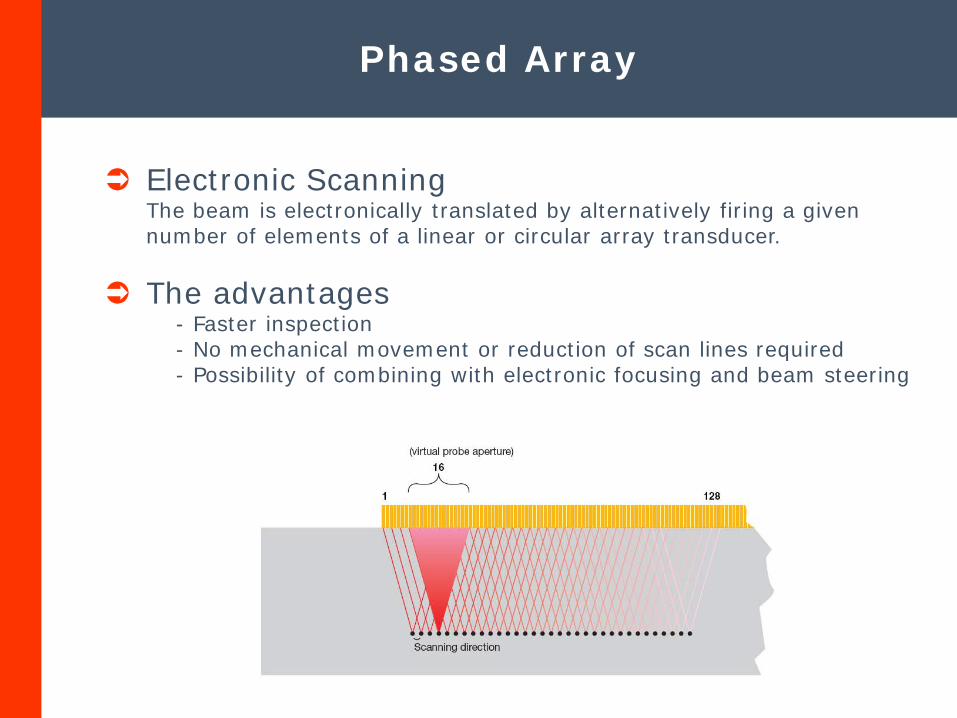
Electronic ScanningThe beam is electronically translated by alternatively firing a given number of elements of a linear or circular array transducer.
The advantages- Faster inspection- No mechanical movement or reduction of scan lines required- Possibility of combining with electronic focusing and beam steering
Phased Array
Beam FocusingThe beam is electronically focused by applying symmetrical delay laws to the different elements of a linear or annular phased array transducer.
The advantages- Only one probe can focus at each depth- Faster inspection of complete volume of thick pieces with dynamic focusing- Electronic focusing can compensate focusing aberrations due to cylindrical interfaces
Phased Array
Beam SteeringThe beam is electronically deflected by applying delay laws to different elements of a linear, circular or matrix array. Linear and circular arrays allow for 2D beam steering
The advantages- Only one transducer required for inspection at variable angle- Faster inspection of complex geometry pieces- The advantage of this technique can be combined with the advantages of electronic focusing
Phased Array
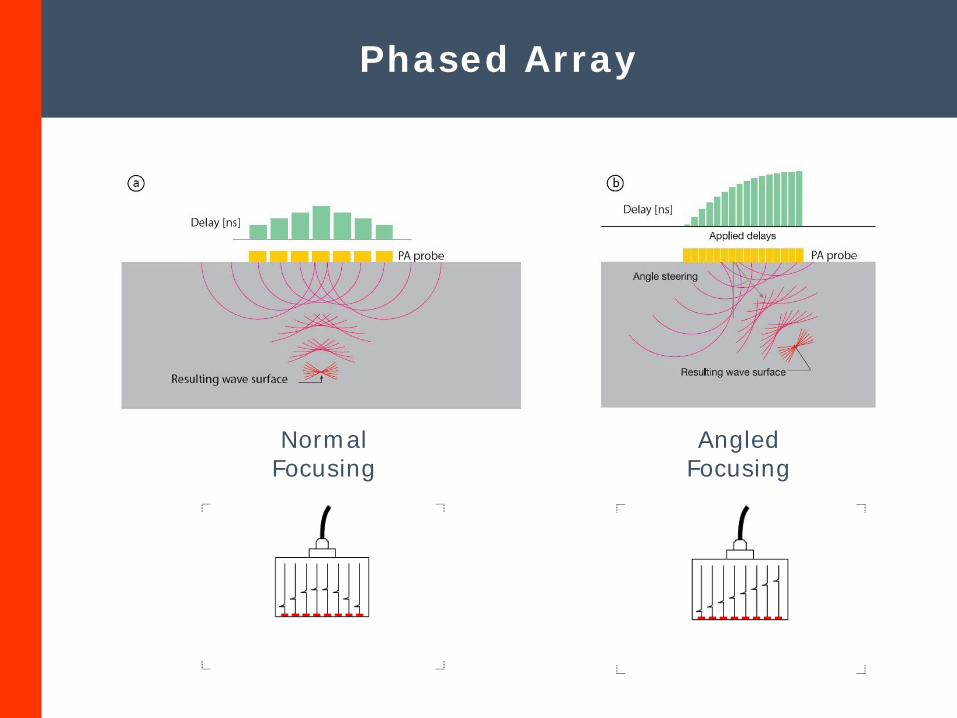
Normal Focusing
Angled Focusing
Phased Array
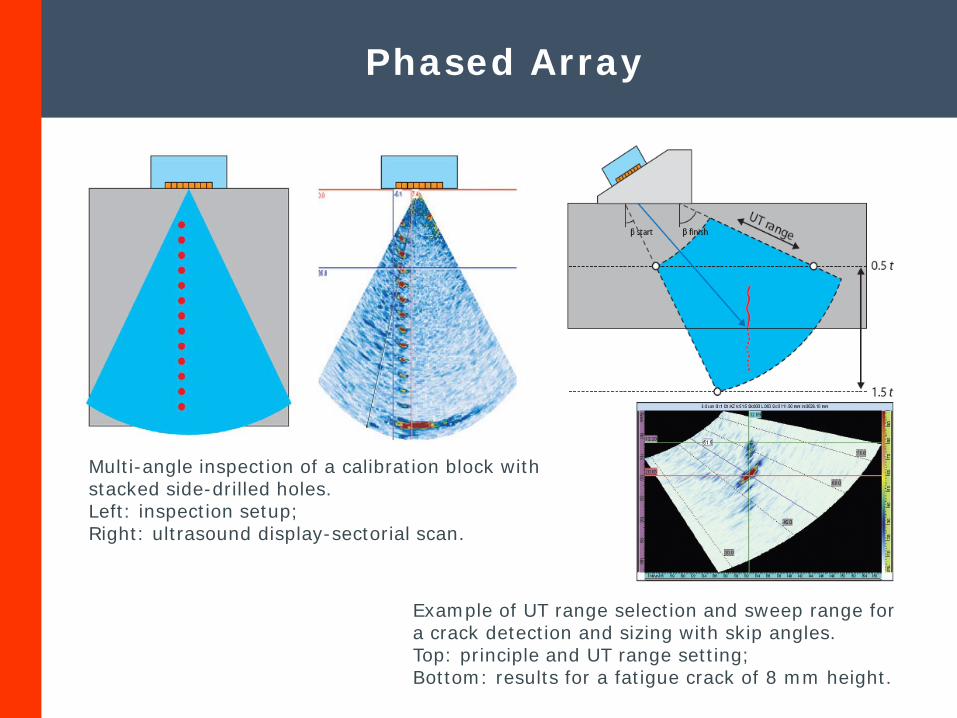
Multi-angle inspection of a calibration block with stacked side-drilled holes.Left: inspection setup; Right: ultrasound display-sectorial scan.
Example of UT range selection and sweep range for a crack detection and sizing with skip angles.Top: principle and UT range setting; Bottom: results for a fatigue crack of 8 mm height.
Ultrasonic Mapping
Techniques
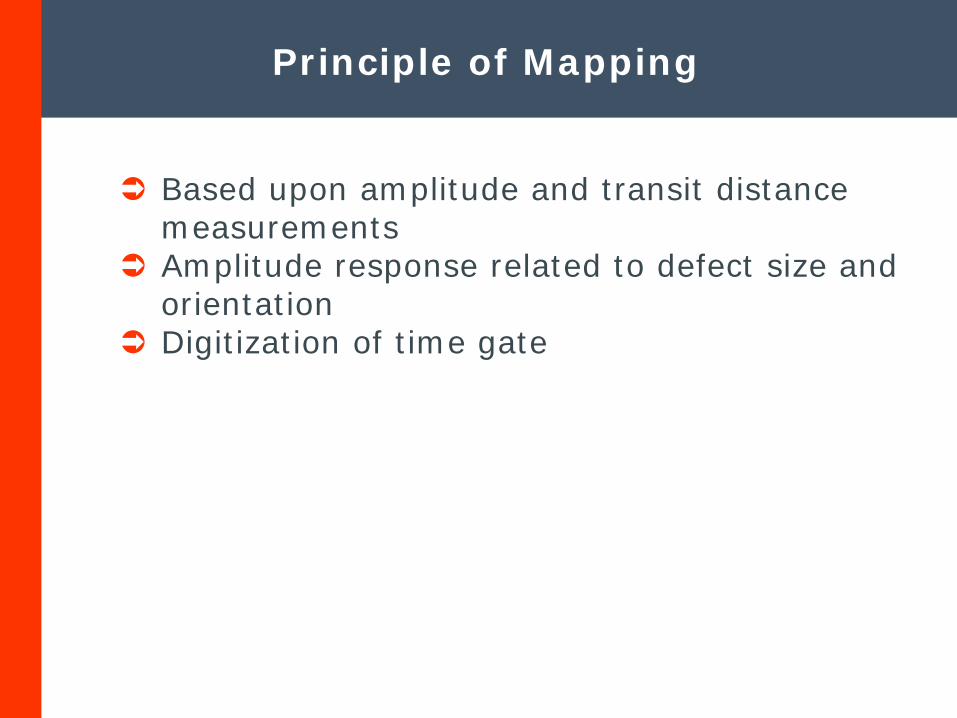
Based upon amplitude and transit distance measurements
Amplitude response related to defect size and orientation
Digitization of time gate
Principle of Mapping
The mapping feature enables the system to visualise the presence of the geometrical welding features such as the position of the weld cap and root penetration, which minimises the possibility of the system generating false calls. Furthermore this feature enables the system to cope with most existing UT procedures and acceptance criteria, because of its capability to detect and, to a certain extent, quantify volumetric defects.
Principle of Mapping
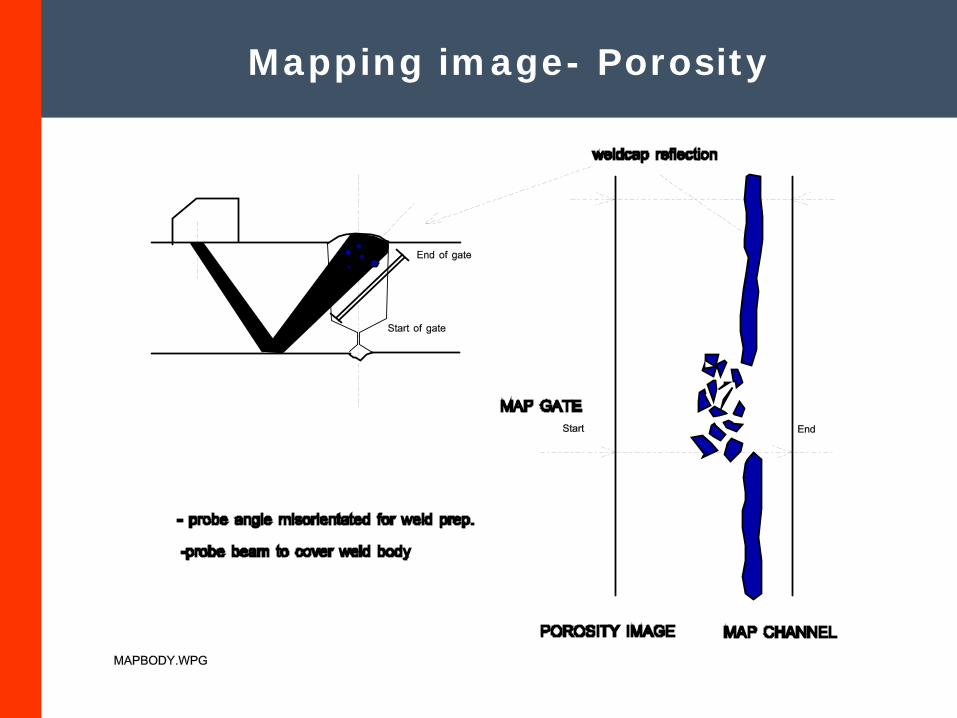
Mapping image- Porosity
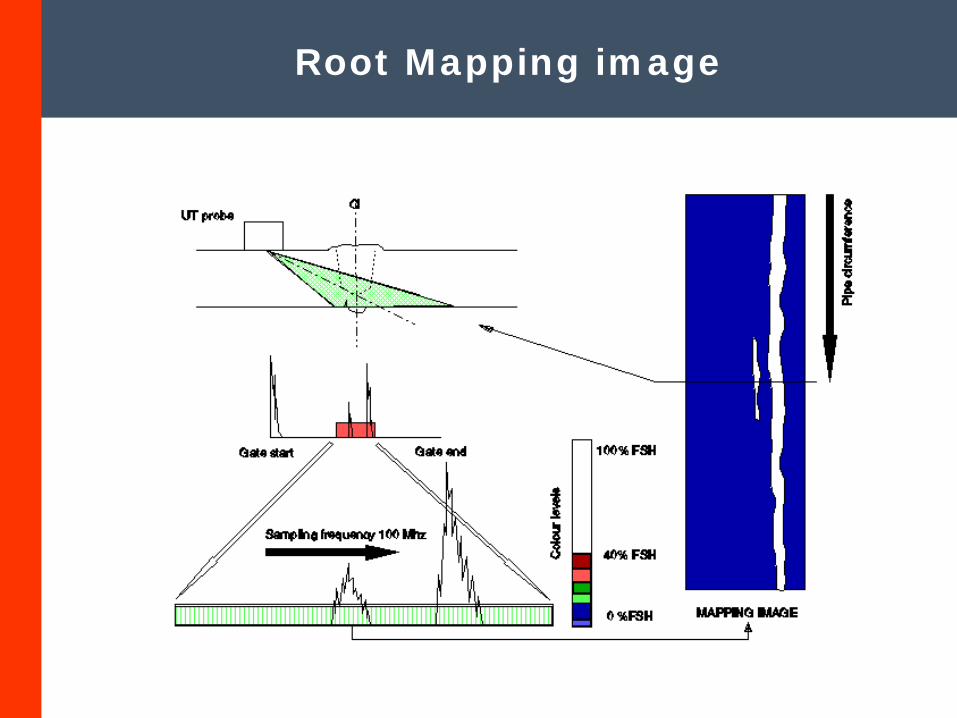
Root Mapping image
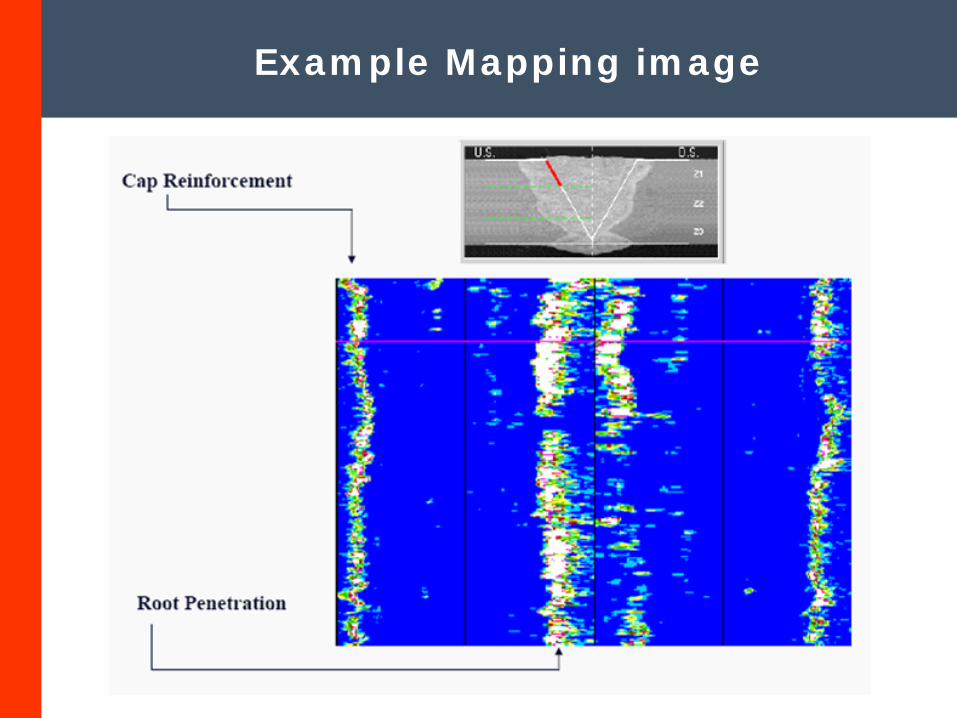
Example Mapping image
Advantages of mapping:
Increase of inspection integrity Reducing of false calls Characterization of defects Can be combined with pulse-echo technique
Principle of Mapping
Automated Ultrasonic Test(AUT)
Techniques
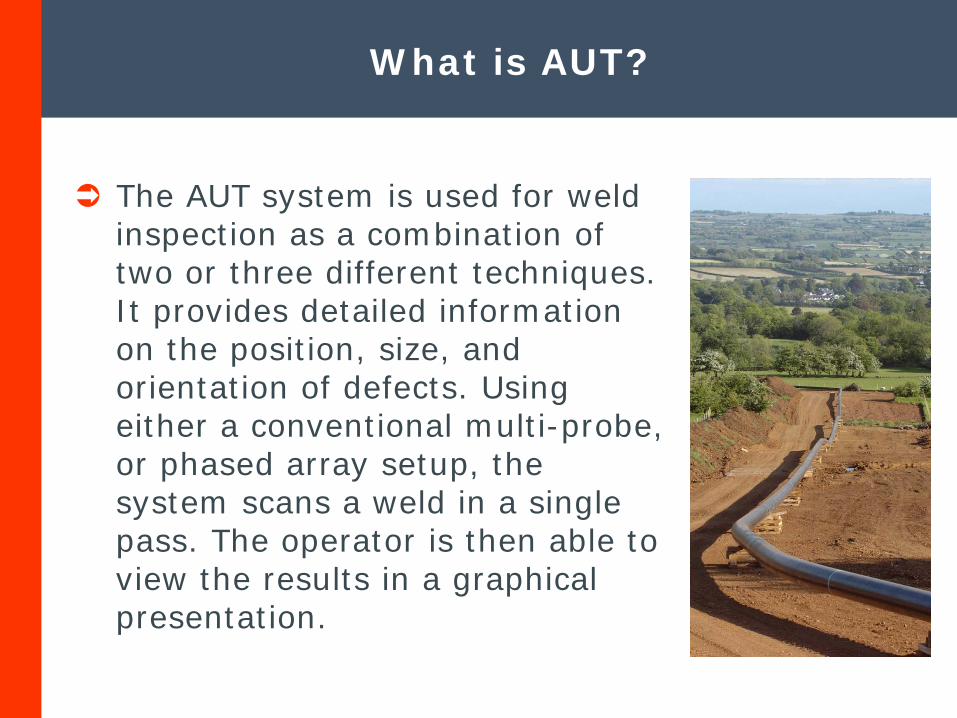
What is AUT?
The AUT system is used for weld inspection as a combination of two or three different techniques. It provides detailed information on the position, size, and orientation of defects. Using either a conventional multi-probe, or phased array setup, the system scans a weld in a single pass. The operator is then able to view the results in a graphical presentation.
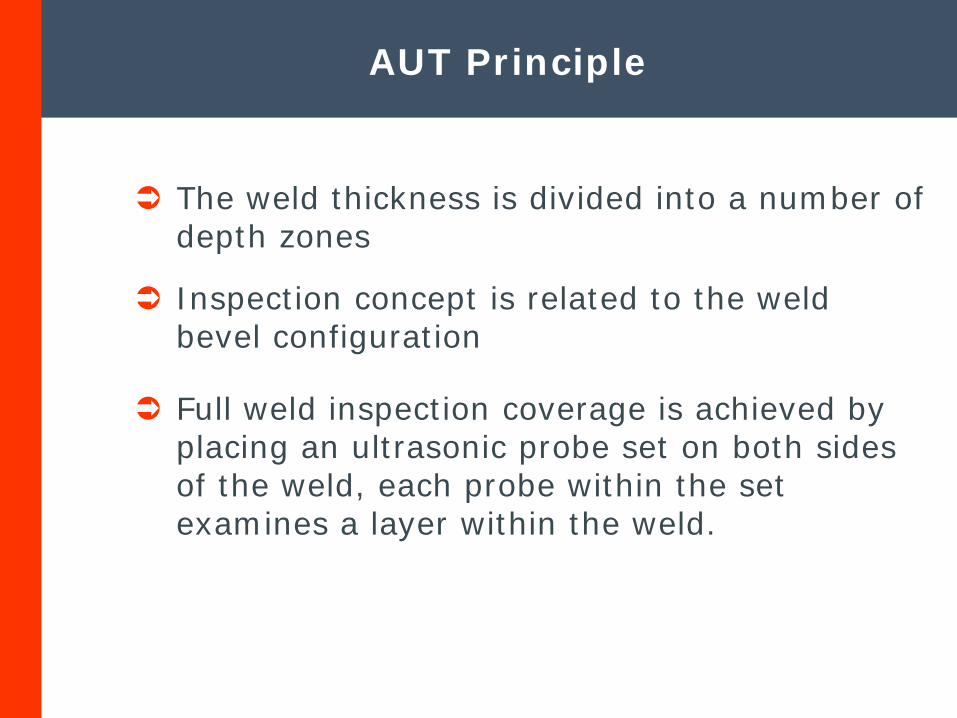
The weld thickness is divided into a number of depth zones
AUT Principle
Full weld inspection coverage is achieved by placing an ultrasonic probe set on both sides of the weld, each probe within the set examines a layer within the weld.
Inspection concept is related to the weld bevel configuration
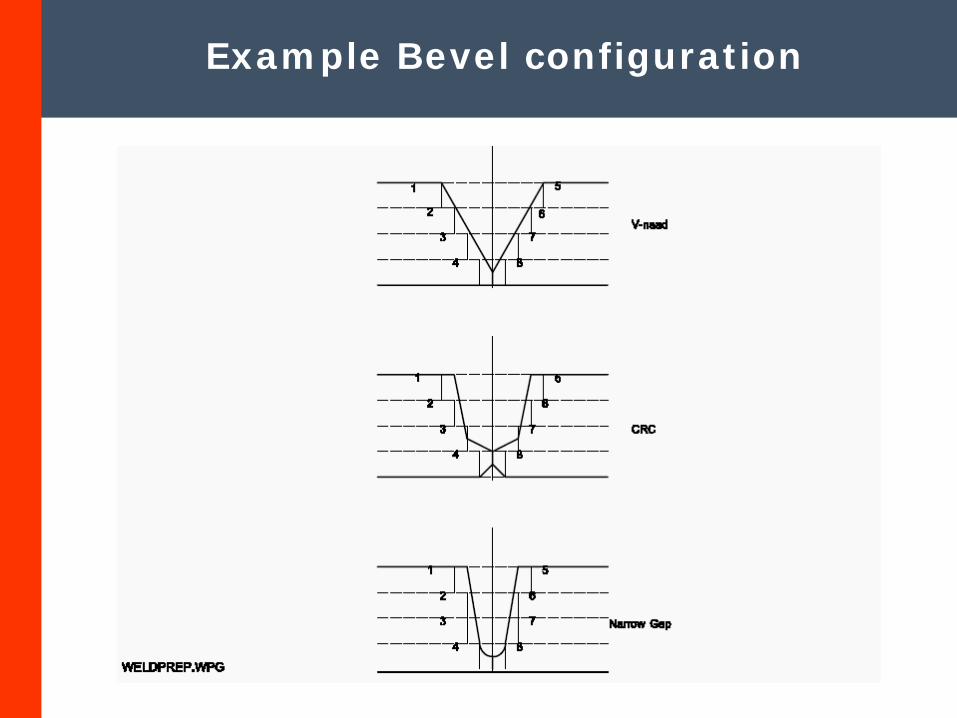
Example Bevel configuration
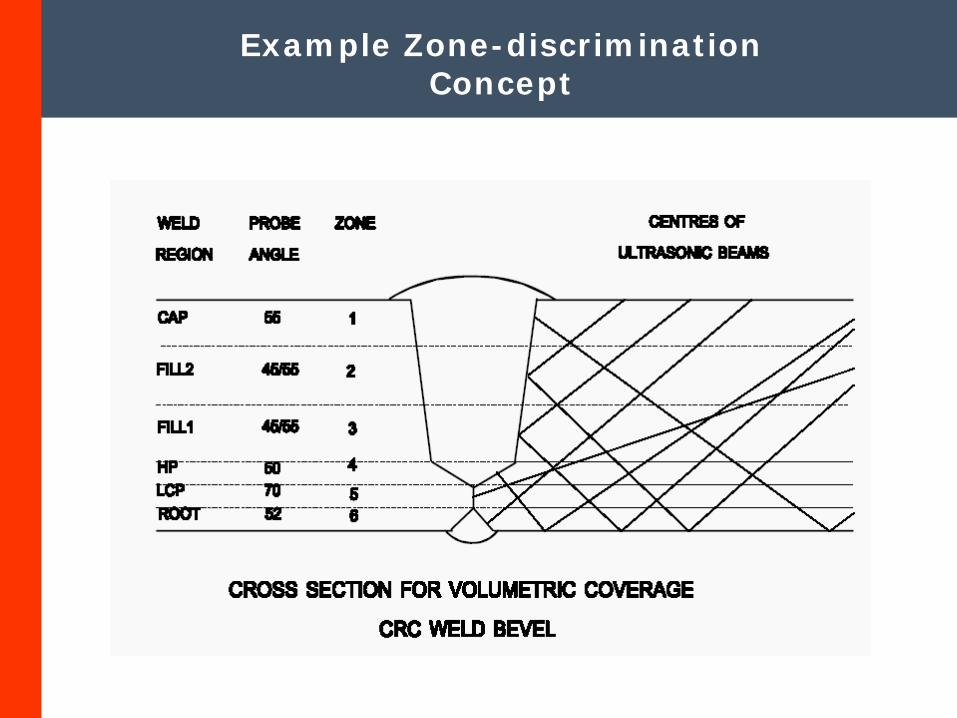
Example Zone-discrimination Concept
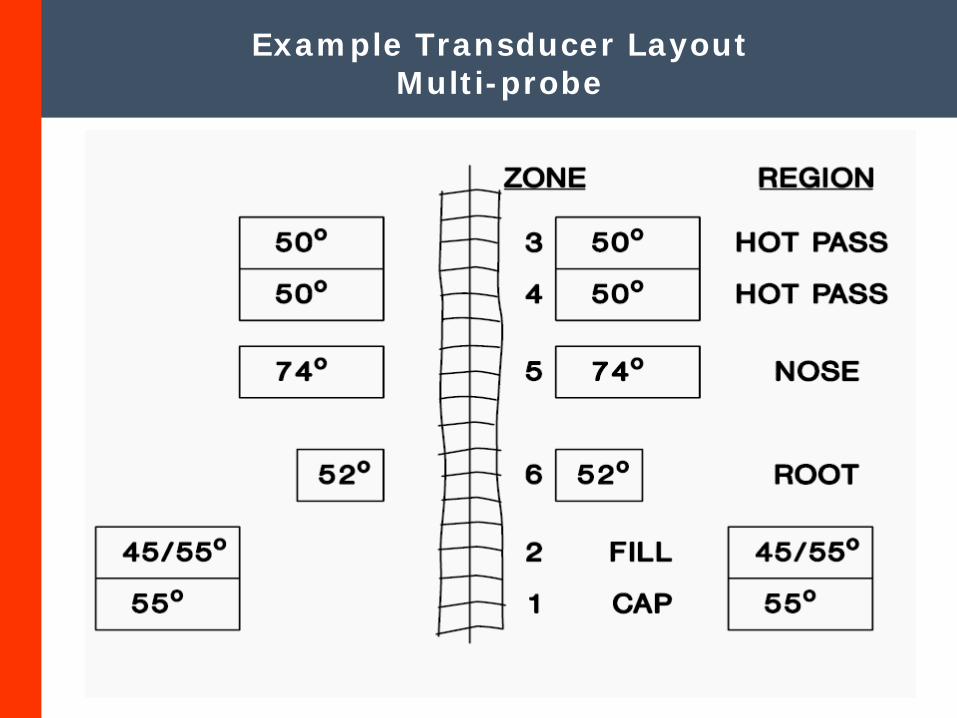
Example Transducer Layout Multi-probe
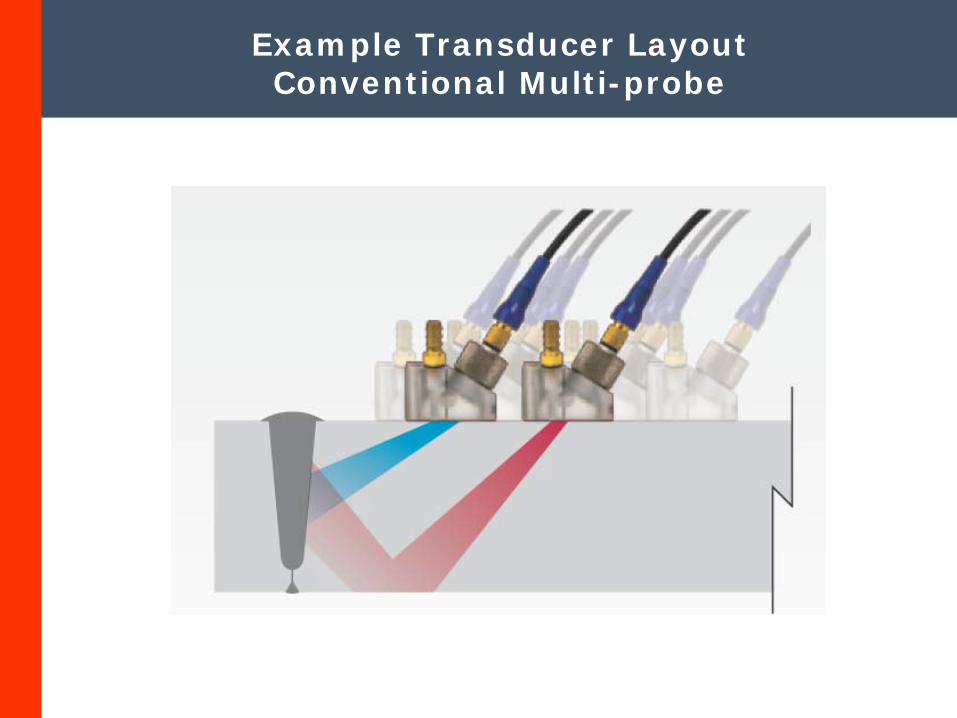
Example Transducer Layout Conventional Multi-probe
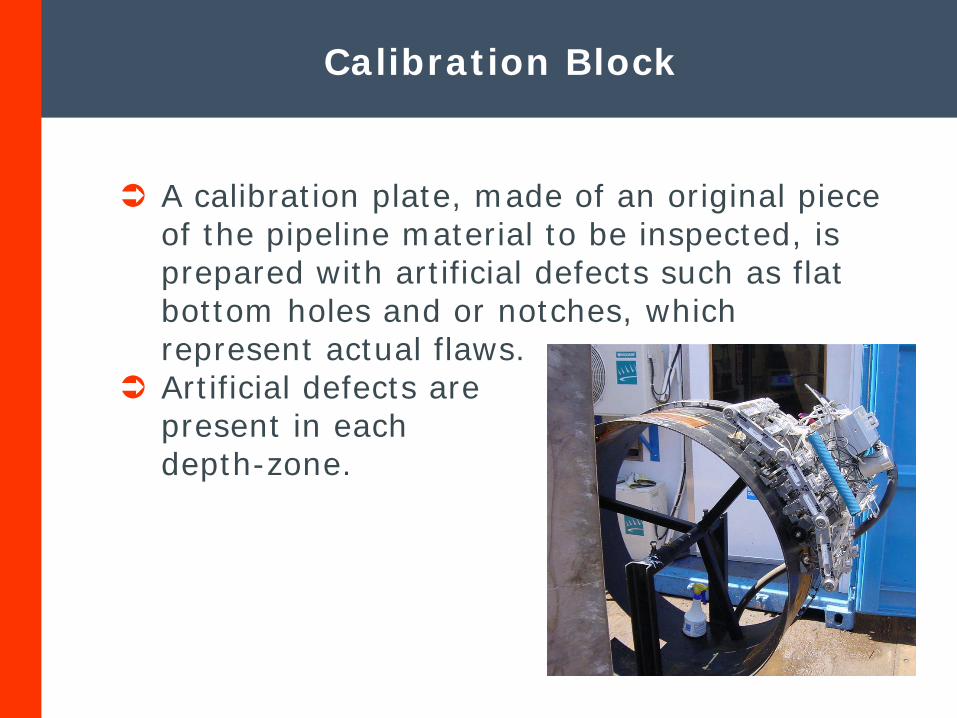
A calibration plate, made of an original piece of the pipeline material to be inspected, is prepared with artificial defects such as flat bottom holes and or notches, which represent actual flaws.
Artificial defects are present in each depth-zone.
Calibration Block
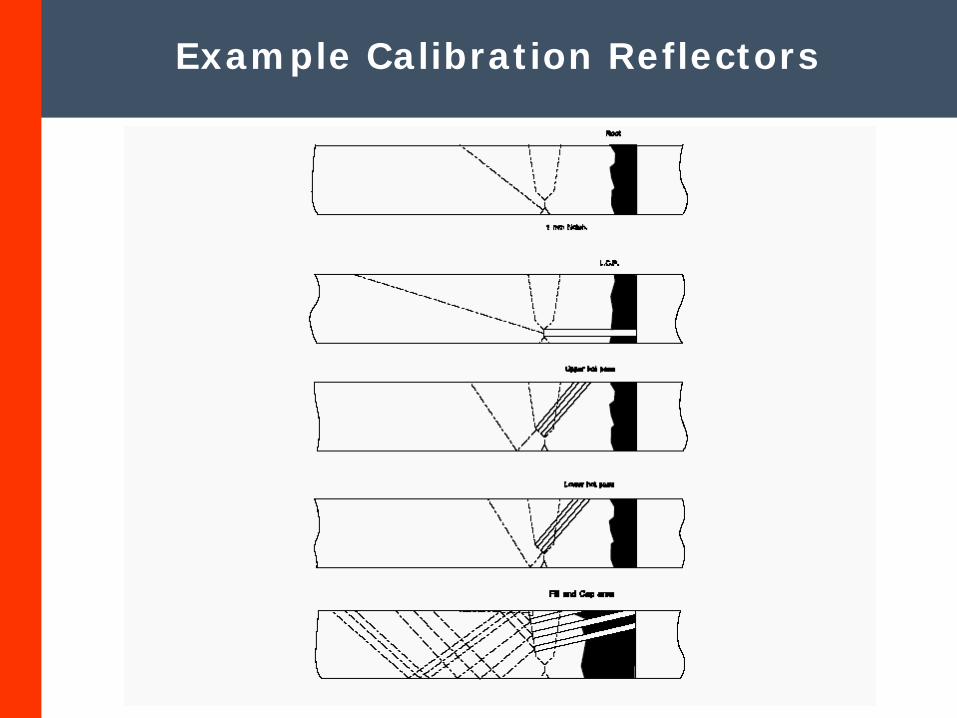
Example Calibration Reflectors
Can be used On and Offshore
AUT Advantages
Hot and cold operating temperatures
No equipment inside pipe
No chemicals and films
No radiation hazard
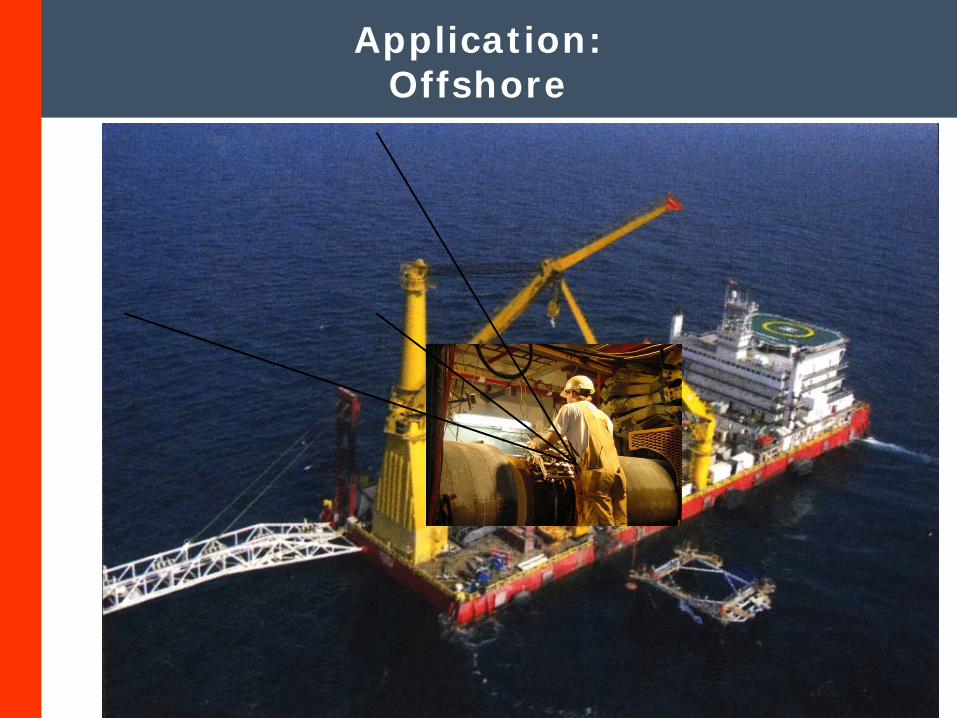
Application: Offshore
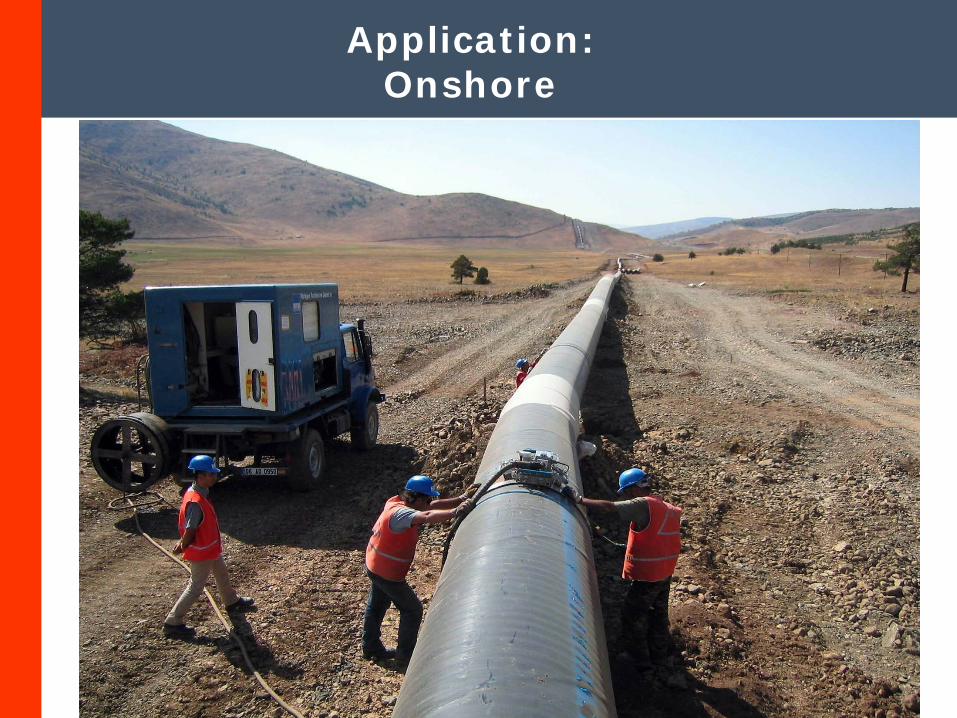
Application: Onshore
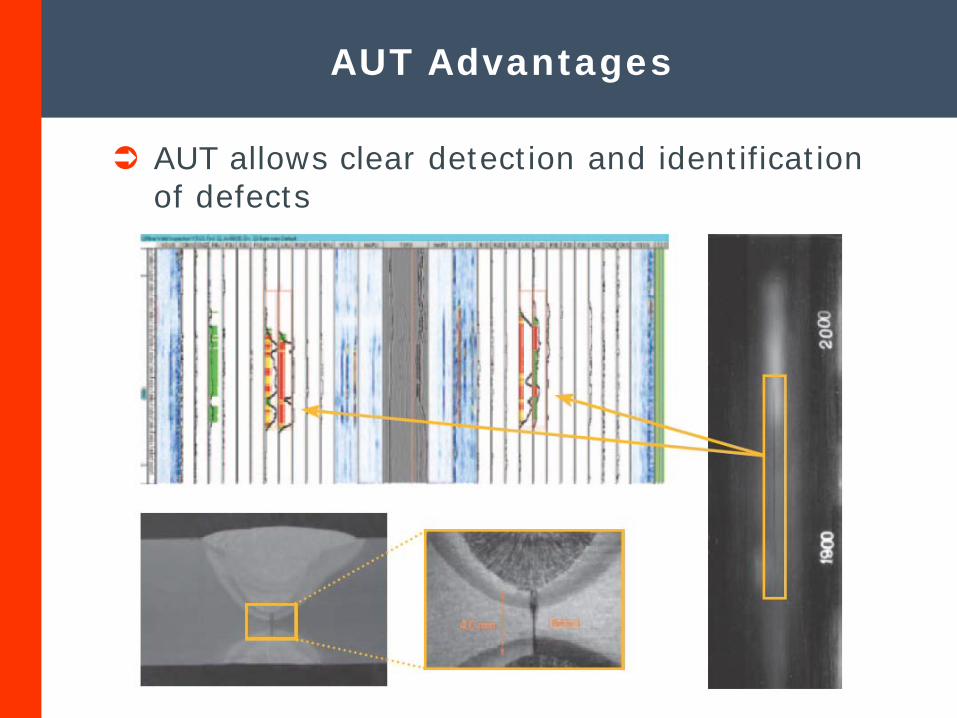
AUT Advantages
AUT allows clear detection and identification of defects
>100 welds/day onshore and>150 welds/day offshore
Advantages
Inspection speed >80mm/sec
Digital and real-time results, final report on a DVD
Instantaneous recording and evaluation of results
Provides immediate feedback to the welders
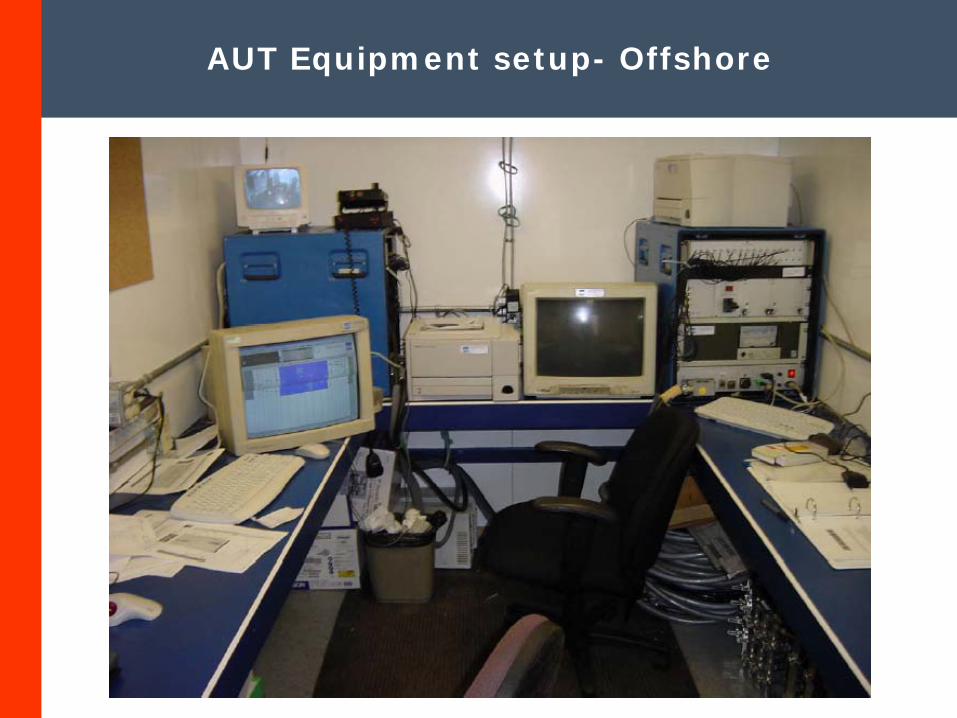
AUT Equipment setup- Offshore
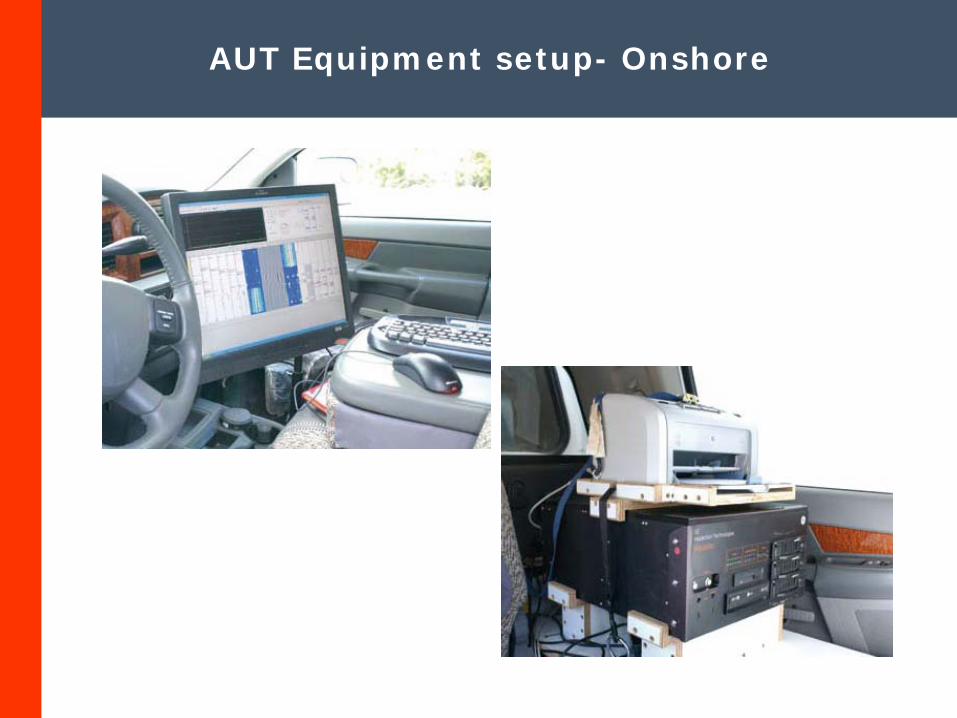
AUT Equipment setup- Onshore
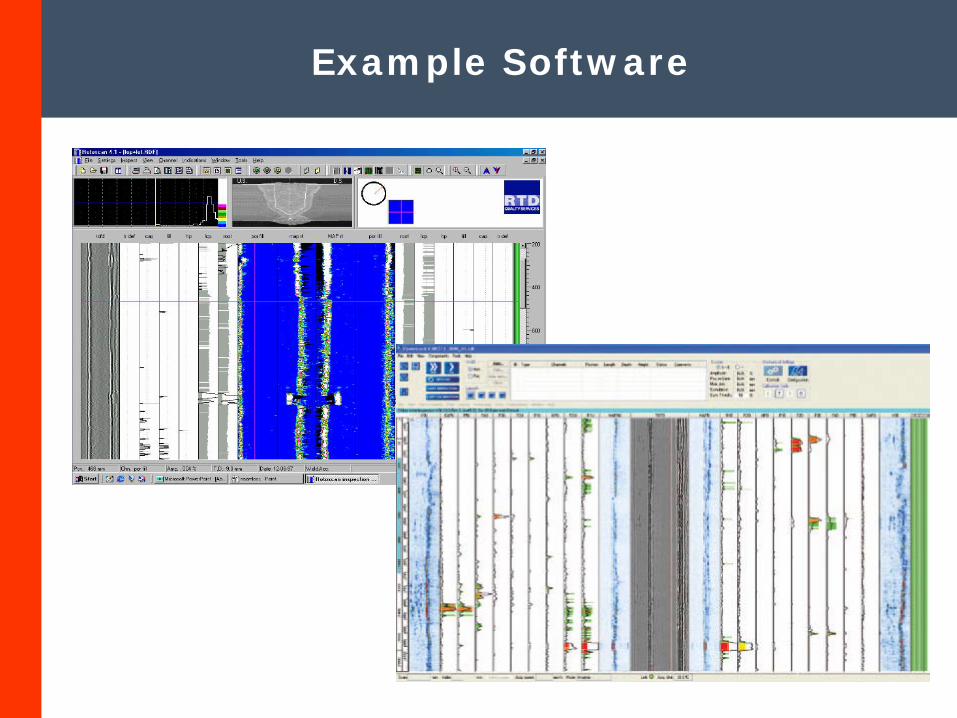
Example Software
Capable of inspecting welds at elevated temperatures
Advantages
Acceptance criteria can be related to ECA criteria, less repairs (fitness for purpose)
All ambient temperatures, and conditions
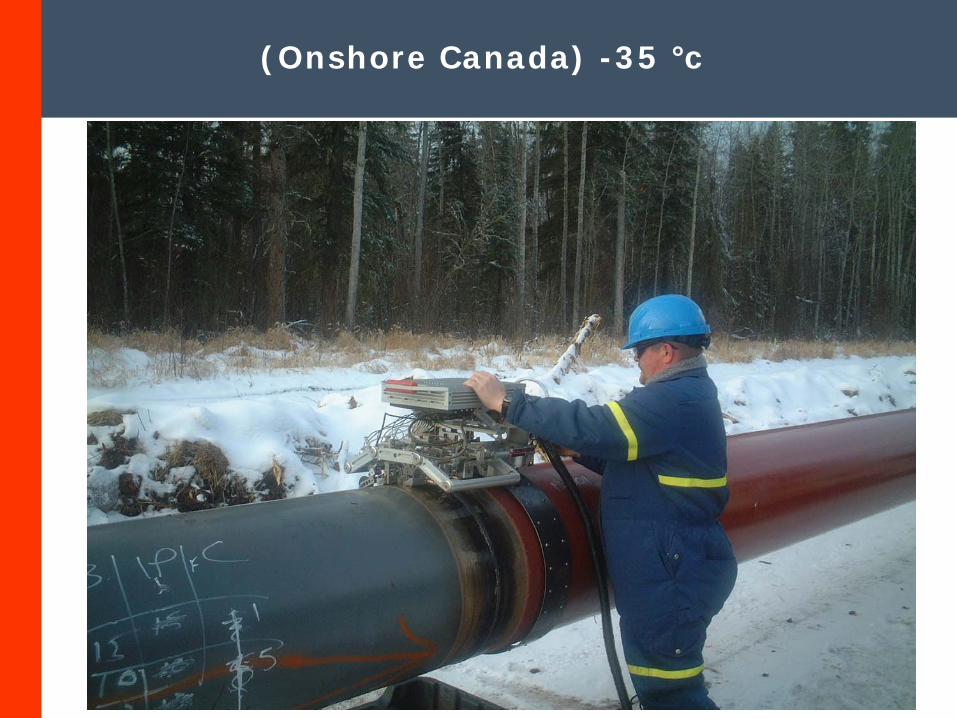
(Onshore Canada) -35 °c
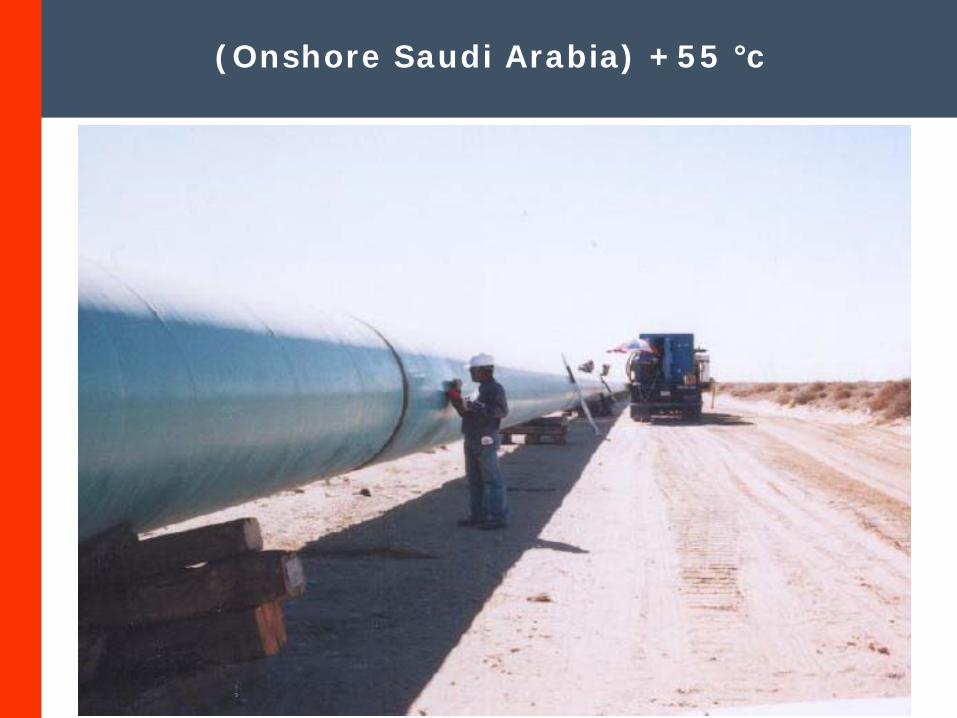
(Onshore Saudi Arabia) +55 °c
Diameter range 14” up to 56” (Onshore)
Capabilities
Single weld inspection Habitat environments
Diameter range 2” up to 48” (Offshore)
Computerised data storage and display with dedicated software, offering colour enhanced user-friendly and coherent presentation enabling quick and unambiguous interpretation of inspection results.
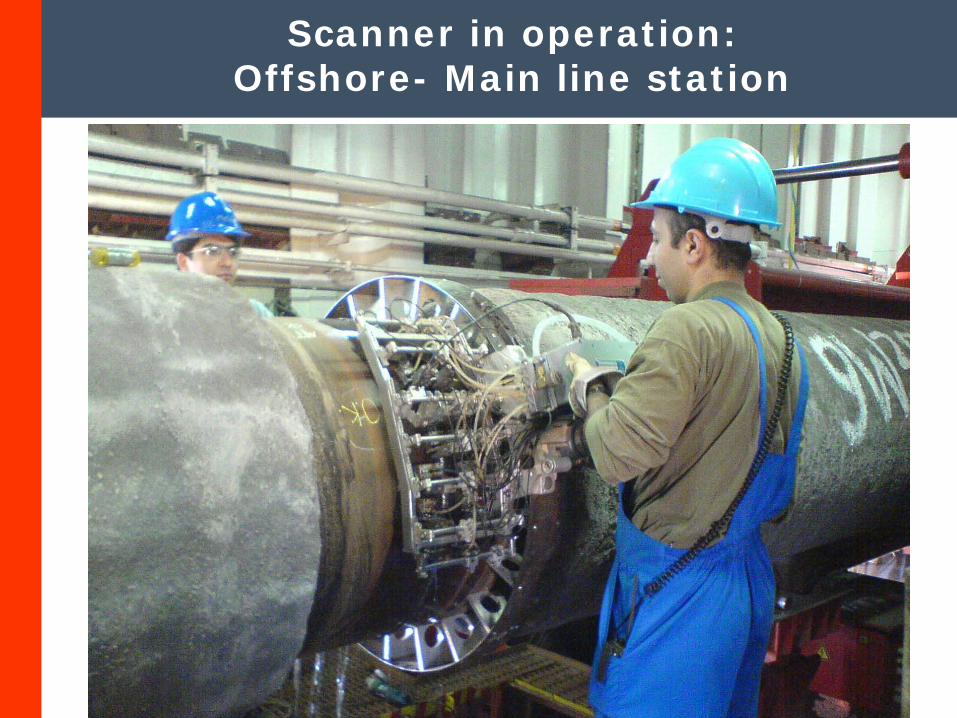
Scanner in operation: Offshore- Main line station
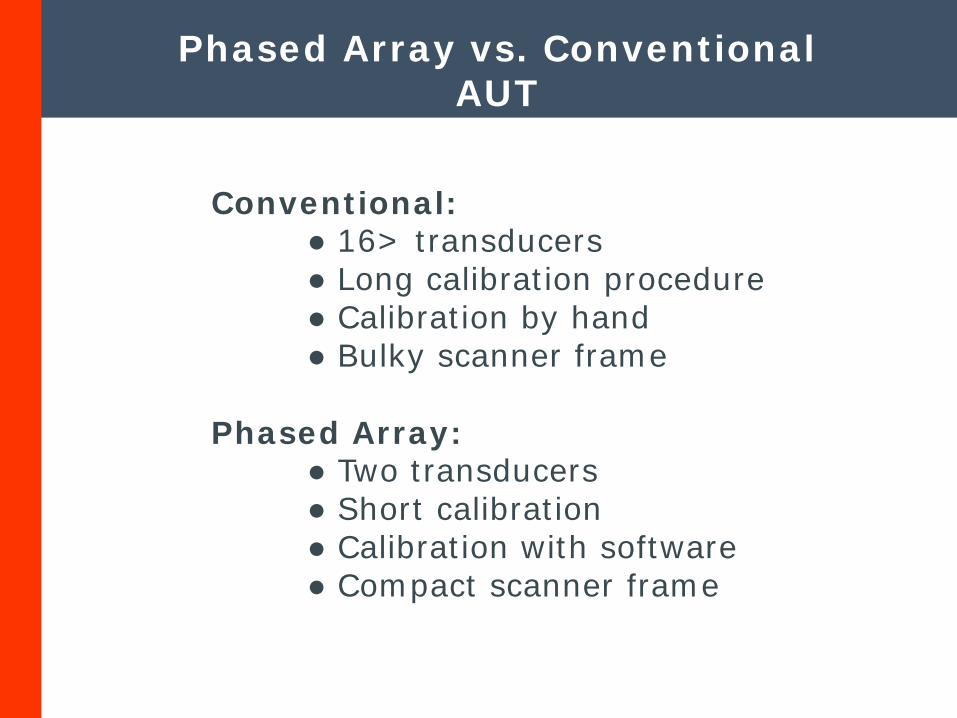
Phased Array vs. Conventional AUT
Conventional:● 16> transducers● Long calibration procedure● Calibration by hand● Bulky scanner frame
Phased Array:● Two transducers● Short calibration● Calibration with software● Compact scanner frame
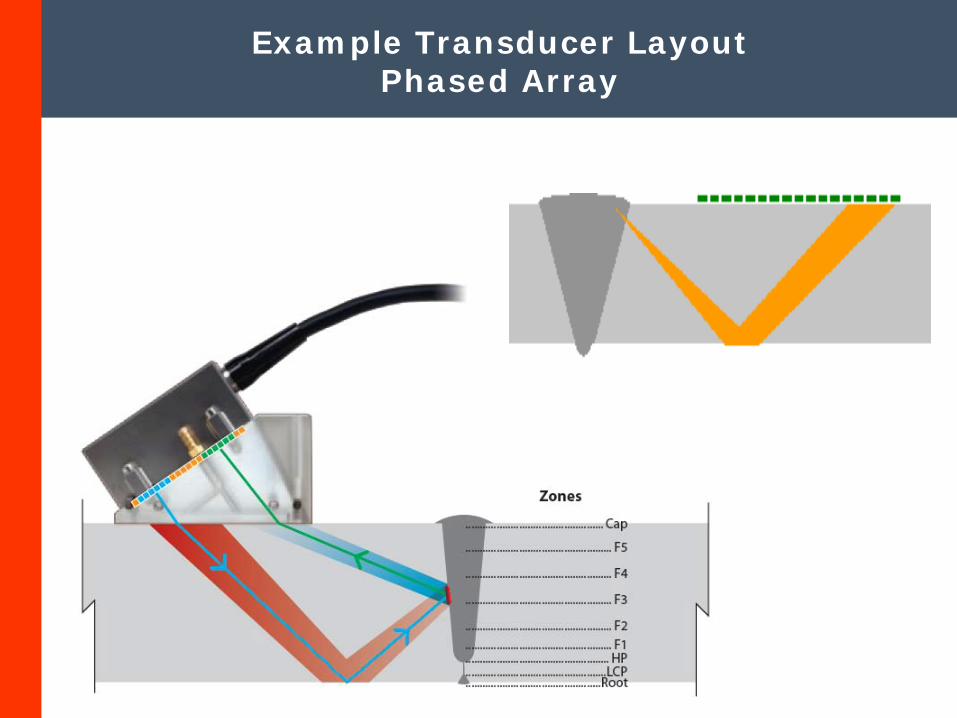
Example Transducer Layout Phased Array
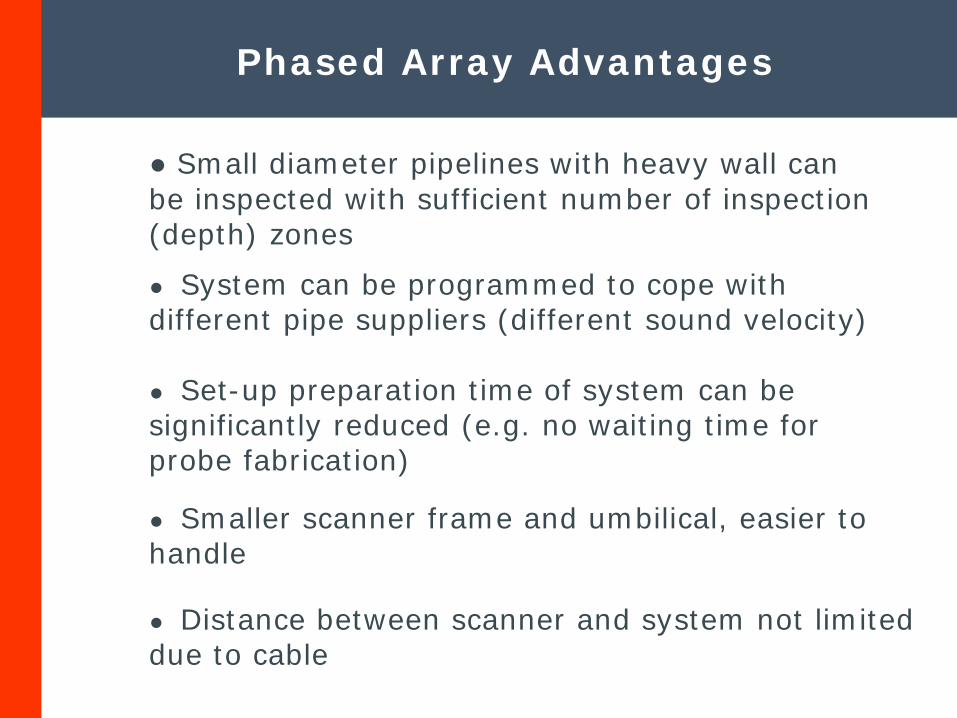
Phased Array Advantages
● Small diameter pipelines with heavy wall can be inspected with sufficient number of inspection (depth) zones
● Distance between scanner and system not limited due to cable
● Smaller scanner frame and umbilical, easier to handle
● Set-up preparation time of system can be significantly reduced (e.g. no waiting time for probe fabrication)
● System can be programmed to cope with different pipe suppliers (different sound velocity)
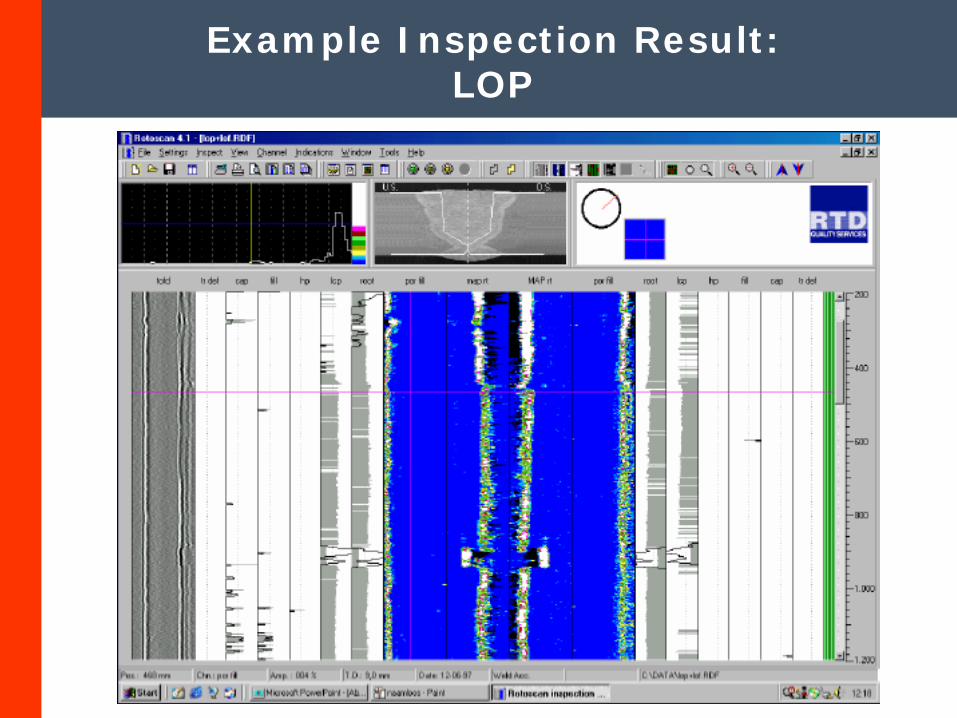
Example Inspection Result: LOP
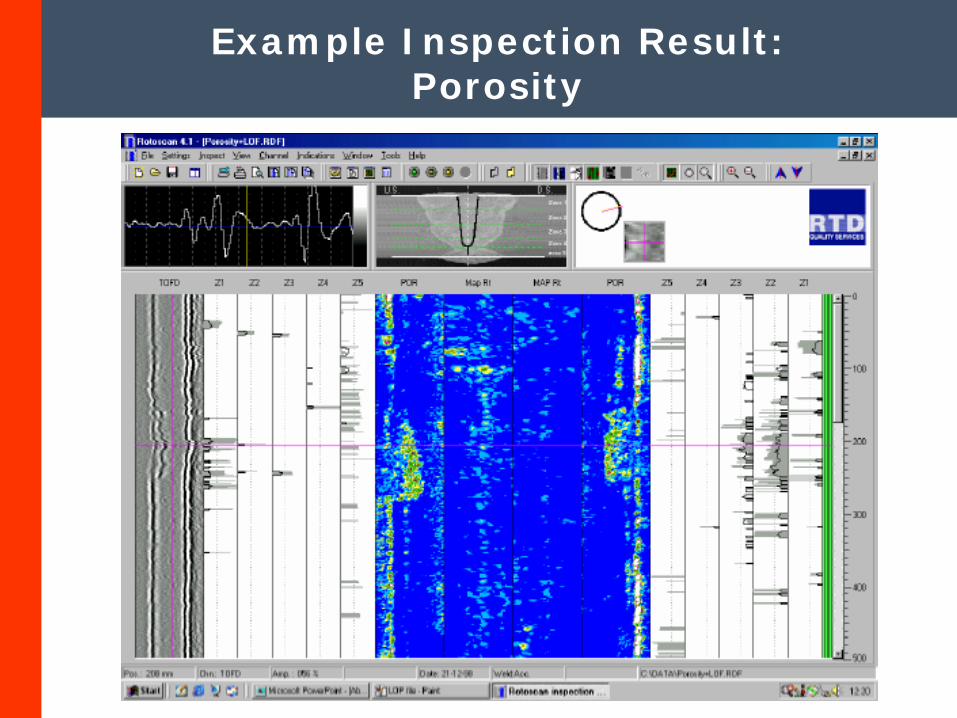
Example Inspection Result: Porosity
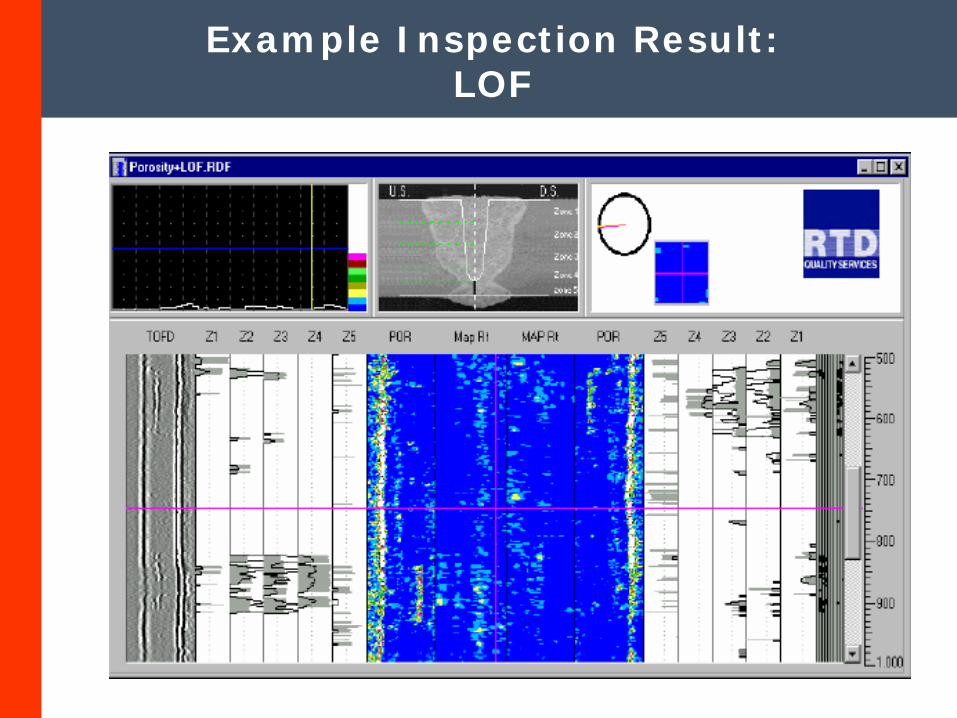
Example Inspection Result: LOF
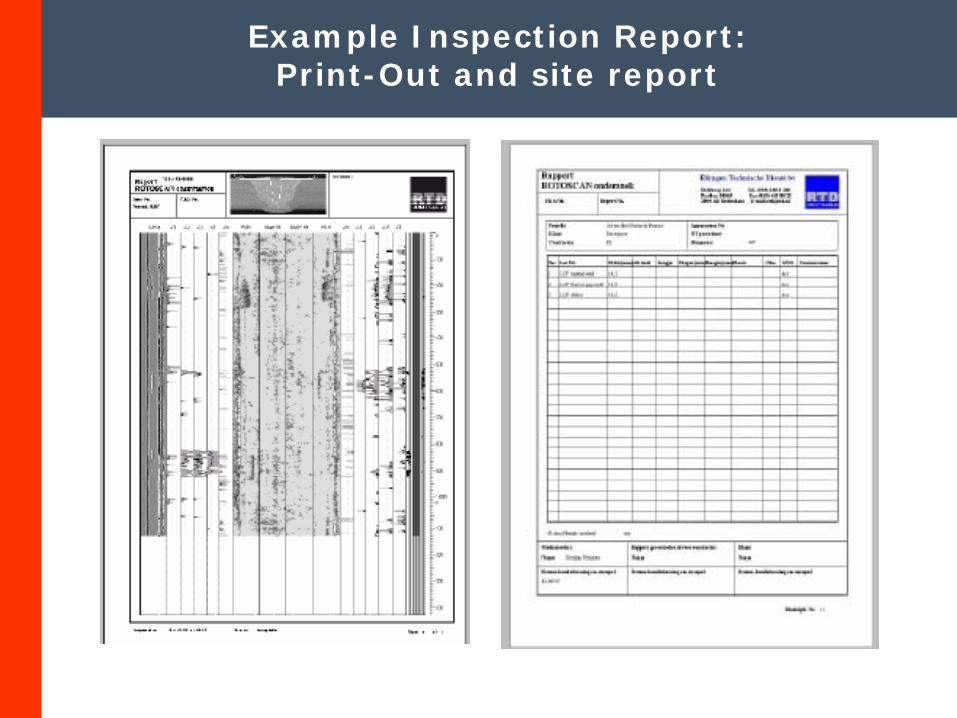
Example Inspection Report: Print-Out and site report
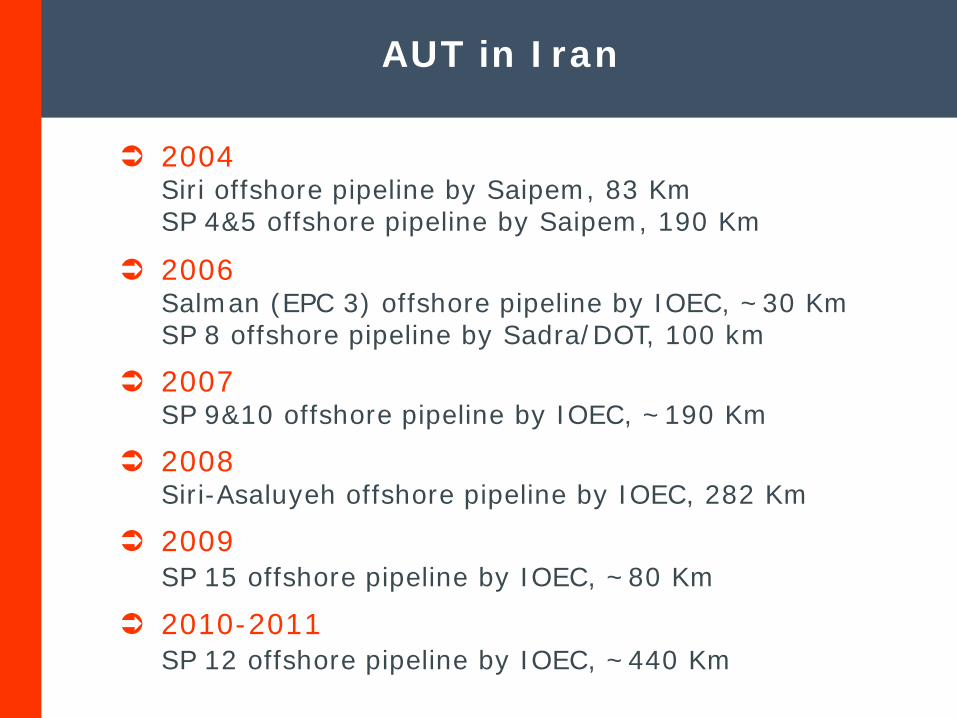
AUT in Iran
2004Siri offshore pipeline by Saipem, 83 KmSP 4&5 offshore pipeline by Saipem, 190 Km
2006Salman (EPC 3) offshore pipeline by IOEC, ~30 KmSP 8 offshore pipeline by Sadra/DOT, 100 km
2007SP 9&10 offshore pipeline by IOEC, ~190 Km
2008Siri-Asaluyeh offshore pipeline by IOEC, 282 Km
2009SP 15 offshore pipeline by IOEC, ~80 Km
2010-2011SP 12 offshore pipeline by IOEC, ~440 Km
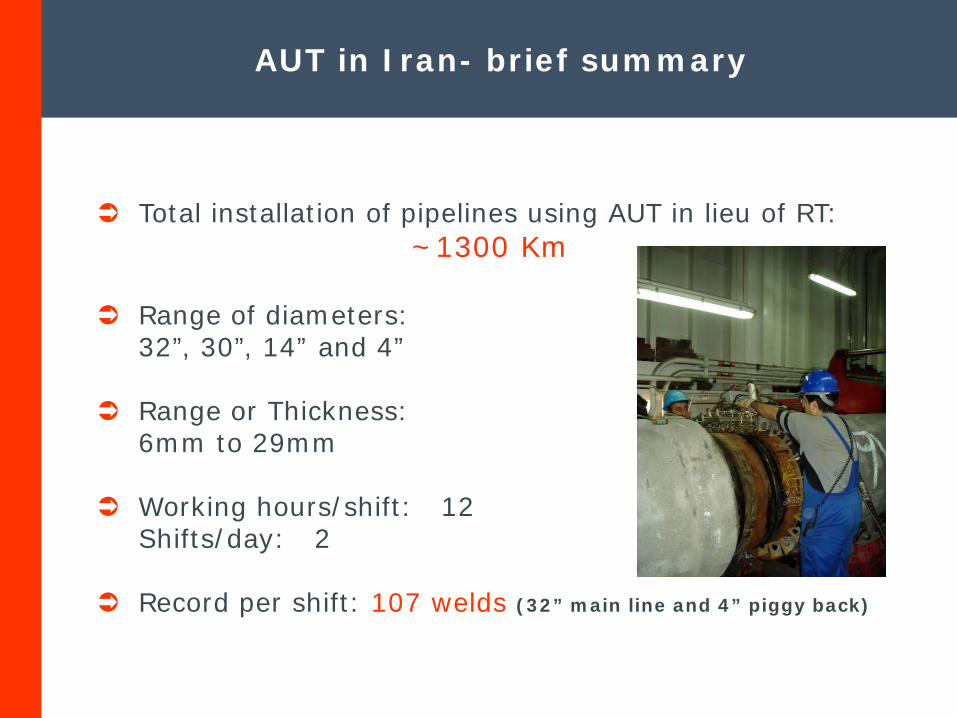
AUT in Iran- brief summary
Total installation of pipelines using AUT in lieu of RT:~1300 Km
Range of diameters:32”, 30”, 14” and 4”
Range or Thickness:6mm to 29mm
Working hours/shift: 12Shifts/day: 2
Record per shift: 107 welds (32” main line and 4” piggy back)
Codes and standards
In 1998, the ASTM published the E-1961-98 code (reapproved in 2003), which covers key elements of AUT of girth welds – zone discrimination, rapid data interpretation, specialized calibration blocks, and configuration procedures. The E-1961 code is designed for ECA. Similarly, in 1999, the American Petroleum Institute (API) published the 19th edition of Standard 1104, which covers mechanized ultrasonic testing and radiography of girth welds.
Other codes: DNV OS-F101, BS 4515-1 2009
TOFD Acceptance codes:European norms: BS7706 and EN583_6ASTM E-2373-04ASME CC 2235-1
TOFD, AUT and PA are acceptable to be used in lieu of RT
Conclusion
Can reduce time in operation
Increase the quality of weld because of higher POD with respect to conventional techniques e.g. RT
Can help contractor to save time and money on overall project execution
Can increase the safety of operation by preventing use of Radio-active on site
Shorten time schedule in pipeline installation and maintenance projects
Advanced Techniques:
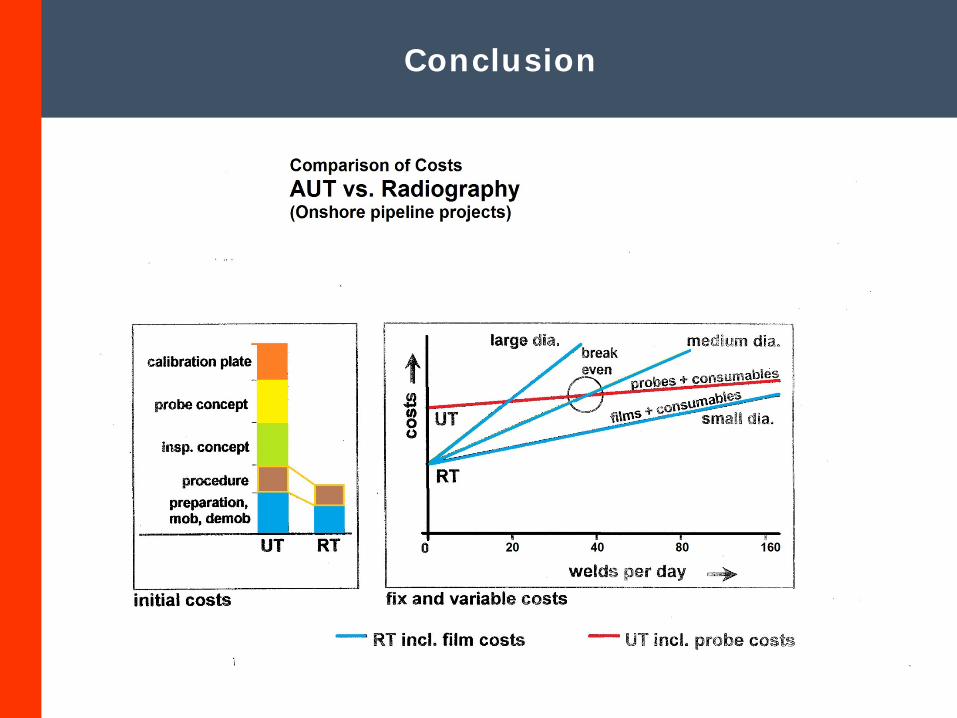
Conclusion
Conclusion
More reliability in maintenance inspection
Much less restriction on thickness issues specifically in maintenance inspection
No safety impact on personnel and timing, no environmental issues
More sensitive on critical defects, so higher safety factor in welds during or after construction
Structural integrity on assets and installations
Advanced Techniques:
Thanks for your time!
Contact us for more information at:
Mailing Address: Unit 19, No 39, First Lane, Behrooz St., Mirdamad Blvd., Tehran- Iran
Tel/Fax: +98-21-2222 3991
E-mail: [email protected]
Internet: www.karkia-ind.com
Rotoscan System


