Download - Laboratory scale examination of the effects of overloading on the anaerobic digestion by glycerol
Bioresource Technology 102 (2011) 5270–5275
Contents lists available at ScienceDirect
Bioresource Technology
journal homepage: www.elsevier .com/locate /bior tech
Case Study
Laboratory scale examination of the effects of overloading on the anaerobicdigestion by glycerol
Tamás Rétfalvi a,⇑, Annamária Tukacs-Hájos b, Levente Albert a, Béla Marosvölgyi c
a Institute of Chemistry, Faculty for Forestry, University of West Hungary, H-9400 Sopron, Bajcsy-Zs. u.4., Hungaryb GázInnov Ltd, H-9400 Sopron, Asszonyvásár d}ul}o 31., Hungaryc Cooperation Research Centre Non-profit Ltd., University of West Hungary, H-9400 Sopron, Bajcsy-Zs. u. 4., Hungary
a r t i c l e i n f o a b s t r a c t
Article history:Received 26 November 2010Received in revised form 2 February 2011Accepted 4 February 2011Available online 1 March 2011
Keyword:Anaerobic digestionGlycerolOverloadVolatile fatty acid
0960-8524/$ - see front matter � 2011 Elsevier Ltd. Adoi:10.1016/j.biortech.2011.02.020
⇑ Corresponding author. Tel.: +36 99 518 176; fax:E-mail address: [email protected] (T. Rétfalv
The anaerobic digestion of pure glycerol, which produces a baseline acetic acid to propionic acid ratio of0.2, was studied in laboratory scale reactors (3 l working volume) at mesophilic temperature (37 �C) with3000 mg chemical oxygen demand (COD) l�1d�1. During the experiment tVFA and C2-C6 VFA analysisand daily biogas yield measurement were carried out. Following 10 days of a 15% d�1 increase in theorganic loading rate (OLR) of 3.0–10.5 g COD l�1d�1, the concentration of propionic acid increased to6200–8000 mg l�1. Then the inoculum was divided into three parts feeding with 100% glycerol, 50% glyc-erol + 50% acetic acid, and 50% glycerol + 50% thick stillage, (presented in % of 2.60 g COD l�1d�1 OLR),respectively. The application of co-substrates reduced the recovery period by 5 days compared to feedingwith pure glycerol. When the reactors were loaded with glycerol again (10% OLR raise per day) the pre-viously applied co-substrates had a positive effect on the VFA composition and the biogas yield as well.
� 2011 Elsevier Ltd. All rights reserved.
1. Introduction
The production and utilisation of renewable energy sourcescould be a solution to increase the energy independence of regionswith few fossil fuel resources (Chum and Overend, 2001; Sovacool,2007). Biofuels production seems to be a good alternative for coun-tries with high agricultural potential (Gupta et al., 2010; Sordaet al., 2010). The main by-products of biodiesel production are im-pure glycerol and soap water. The rise of the biodiesel industry re-sulted in a surplus on the glycerol market and the price of crudeglycerol decreased (Yazdani and Gonzalez, 2007). Local use of thisby-product for energy production could be a good solution for bio-diesel factories. Glycerol phase (g-phase) is commonly used forbiogas production as a co-substrate but not as a main substrate(Fountoulakis and Manios, 2009; Siles et al., 2010). The anaerobicdigestion of g-phase as a main substrate is problematic becauseof its high potassium content and the low acetic acid to propionicacid ratio of the fermentation sludge (Silez and Martín, 2009).
The inhibitory effect of propionic acid accumulation on metha-nogenesis has been discussed in many publications (Chen et al.,2008; Demirel and Yenigun, 2002; Wang et al., 2009). Tolerablelevels of propionic acid fall in the range of 1000–6000 mg l�1
(Gallert and Winter, 2008; Ma et al., 2009). The slowly degradable
ll rights reserved.
+36 99 518 249.i).
iso-fatty acids (isobutyric acid, isovaleric acid), which are producedduring the fermentation process, also have an inhibitory effect onmethane production (Aguilar et al., 1995, Chen et al., 2008).
A methanogenic process that is inhibited will respond sensi-tively to changes in the organic loading rate (OLR), particularly toincreases (Chua et al., 1997). Because acidogenesis is less sensitiveto fermentation conditions, rapid acid accumulation can still ad-versely affect base-inhibited methanogenesis (Rincón et al., 2008;Schoen et al., 2009; Siegert and Banks, 2005). The negative effectis intensified when the ratio of acetic acid to propionic acid dropsbelow the optimal level (Li et al., 2008; Mechichi and Sayadi, 2005).The presence of a high VFA content relating to diminution of thebiogas yield requires an immediately intervention in the operationof the biogas plant. The most common treatment is the drastic de-crease of the OLR (Gallert and Winter, 2008). At the same time,from an economical point of view, the reduction of the recoverystage has a primal importance.
We present the response of a glycerol fed anaerobic fermenta-tion process in case of drastic OLR raise and co-substrate treatmentin the recovery period. As a co-substrate, feeding acetic acid or ace-tic acid-producing agent (thick stillage) (Kim et al., 2010) couldtherefore have a beneficial effect on the conditions of methane pro-duction. It is possible, however, that the positive effect of aceticacid may result not from the improvement of the acetic acid to pro-pionic acid ratio but from another mechanism. Thick stillage is aby-product of the bio-ethanol production and a cost-efficient solu-tion for the industry.
T. Rétfalvi et al. / Bioresource Technology 102 (2011) 5270–5275 5271
We show that the previously applied co-substrate treatmenthas an influence on the biogas yield and acid content (tVFA, VFAcomposition) during reload period.
2. Methods
2.1. Reactors and anaerobic digestion of glycerol
During the overloading period, the experiment was conducted in3 l working volume anaerobic reactor (5000 ml capacity volumethreaded brown bottle, Merck & Co., Germany). Following the max-imum chemical oxygen demand (COD) load, the sludge was dividedinto three parts and drawn through a plastic pipe to three 1 l work-ing volume bottles (2500 ml capacity volume threaded brown bot-tle, Merck & Co., Germany) for the recovery stage. Each of thebottles was equipped with two glass connections, one for loadingof raw materials and the other for a gas measurement kit. The head-spaces of the digesters were flushed with nitrogen for 4 min afterclosing the screw caps. The reactors were operated without mechan-ical mixing. The content of the reactors were sporadically (threetimes per day) manually stirred and sedimentation was not ob-served at all. Each digester was maintained in a water bath (Memm-ert WNB 14 Basic, Memmert GmbH. & Co.) at constant temperature(37 �C). The volume of the biogas produced each day was measuredwith micro gas measurement equipment (Euro Open Ltd., Hungary)connected to each reactor. An oil displacement method was used tomeasure the biogas volume. The biogas yield was recalculated to thestandard condition for temperature and pressure.
2.2. Inoculum and substrates
Anaerobic digester sludge was obtained from a biogas plant (Su-gar factory, Kaposvár, Hungary). The sludge was adapted to glyc-erol over a six-month period before the beginning of theexperiment. The pure glycerol contained 83% total solids (TS), theCOD value was 1628 g l�1, and the pH value was 5.6. The thick stil-lage originated from a bio-ethanol plant (Enviral A.S., Leopoldov,Slovakia) and contained 35.8% TS, 8.1 g l�1 N, and 6.9 g l�1 P, witha COD value of 604 g l�1 and a pH value of 3.6. Acetic acid (usedas a 0.2 M solution, 147 g l�1 COD) and urea were obtained fromSigma–Aldrich Co. A trace elements supplement solution consist-ing of 1625 mg zinc, 10875 mg manganese, 93 mg boron, 163 mgcopper, 20000 mg cobalt, 138 mg molybdenum and 113 mg sele-nium in organic complex form per litre of solution (42.2% TS),was also used.
2.3. Analysis methods
Each day of the experiment, 15 ml samples of inoculum werecollected and centrifuged for 10 min at 3420 RCF (EBA 21, A. Het-tich Co., Germany). The supernatant was divided into two parts.Five (5.0) millilitres were used for determination of the tVFA level,and the rest was centrifuged at 18,111 RCF for 10 min and then fil-tered through a 0.2 lm nylon membrane (Pall Co.).
Volatile fatty acid (VFA) levels were analysed by HPLC. Theinstrument consisted of a Gynkotek M 480 pump, a TOSOH 6040UV detector (210 nm), a Rheodyne 8125 injector with a 20 ll loop,and an Aminex HPX-87H column (300 � 7.8 mm; 5 lm) (BioRadCo., USA) (Wagner et al., 2010). The mobile phase was 0.005 MH2SO4 applied at a 600 ll min�1 flow rate and 60 �C column tem-perature. The injected analyte volume was 20 ll. Quantitativeanalysis for C2-C6 VFAs (Sigma–Aldrich Co.) was carried out by5-point calibration.
The titration method described below is commonly used fortVFA determination in Hungarian biogas plants. The sample was
prepared by first adding 45 ml distilled water to the supernatantsample for a total sample volume of 50 ml. The pH value of thissolution was decreased by adding 0.1 M HCl with continuous mix-ing until a pH of 2.2 was reached, followed by 15 min of stirring toeliminate CO2. The pH value was then raised above 5.0 with 0.1 MNaOH. The tVFA was determined with the following equation:
tVFA ðmg acetic acid l�1Þ ¼ VNaoHpH5:0 � VNaoHpH4:0 � fNaOH � 200Vsample
� 60
where VNaOHpH5.0 is the volume of the NaOH until pH 5.0 (ml, at1 atm, 25 �C); VNaOHpH4.0 is the volume of the NaOH until pH 4.0(ml, at 1 atm, 25 �C); fNaOH is the ratio of the actual concentrationand the nominal (0.1 M) concentration of the NaOH solution; 200is an empirical coefficient; 60 is the molar weight of the acetic acid(mg mol�1) and Vsample is the volume of the sample (ml, at 1 atm,25 �C).
COD determination was carried out according to the Hungarianstandard protocol (MSZ ISO 6060). The method based on the oxida-tion of the oxidizable organic matter by an excess amount of potas-sium dichromate solution at the presence of HgSO4 and Ag catalyst.The excess potassium dichromate is titrated with ferrous ammo-nium sulphate. The COD value is calculated by the reduced amountof the Cr3+.
2.4. Experimental procedure
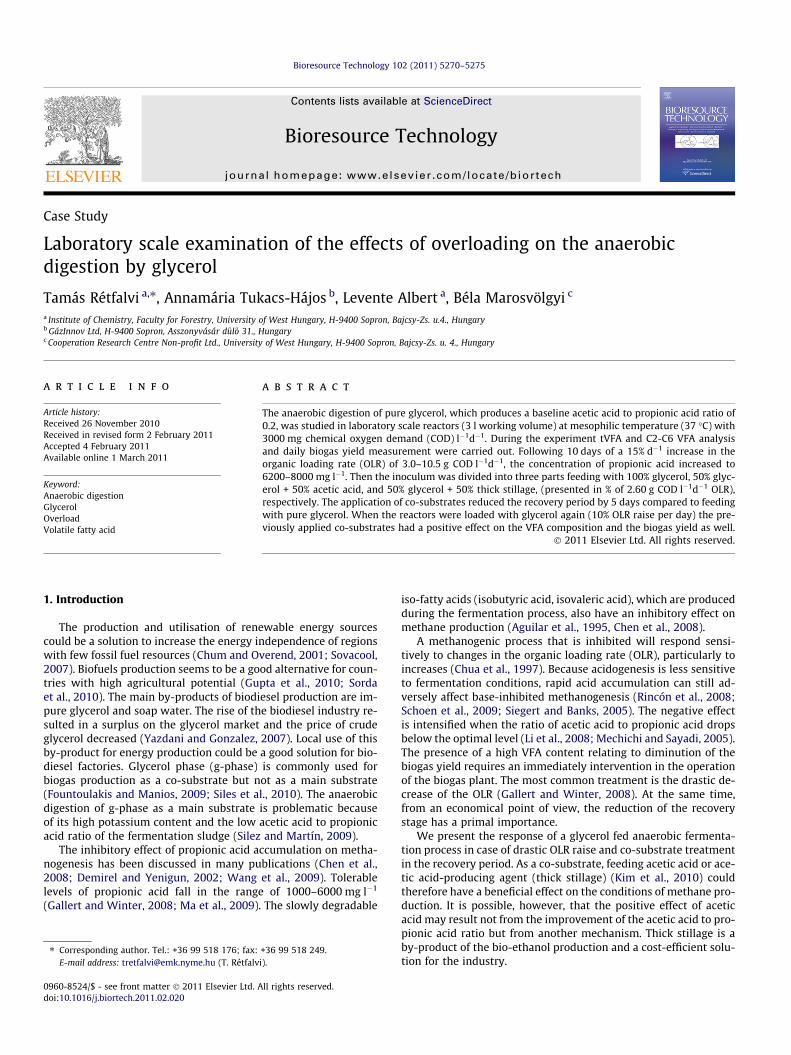
The glycerol-adapted sludge was fed with glycerol at a stableOLR of 2.6 g COD l�1d�1 for 30 days with a 0.2 ratio of acetic acidto propionic acid. Silez and Martín (2009) were able to run stableglycerol fed fermentation with a similar OLR (2.6 g COD l�1d�1).Beginning with the first day of the experimental period, the OLRwas increased by 15% d�1. When an OLR of 10.5 g COD l�1d�1 hadbeen reached, the sludge was divided into three equal volumesfor the recovery stage of the experiment. During the recovery stage,each portion of the sludge was treated with a different substratemixture at the original OLR of 2.6 g COD l�1d�1. The substrate mix-tures (presented in % of the original OLR) were 100% glycerol (A di-gester), 50% glycerol + 50% acetic acid (B digester), and 50% glycerol+ 50% thick stillage (C digester). The recovery stage lasted untilmeasured tVFA values reached 1000 mg l�1. In the following stageeach reactor was fed with 100% glycerol at the same OLR as in theprevious stage for 7 days and 2 days in case of B, C and A reactors,respectively. After this short stable phase the OLR was raised againby 10% d�1 until the biogas yield exceeded 2.0 l l�1 sludge d�1. Thisoccurred at an OLR of 4.68 g COD l�1d�1, after which the OLR wasmaintained at that value for the rest of the experiment (Fig. 1).
3. Results and discussion
As an aid to practical interpretation, the results are separated byexperimental period.
3.1. Experiment 1
During the 30-day period before the overloading stage, thesludge had a VFA (acetic acid, propionic acid, and isobutyric acid)concentration of 237 mg l�1. The average biogas yield during thepre-overload period was 1.2 l l�1 sludge d�1 (SD = 0.14). Duringthe first 5 days of experiment 1/a, the biogas yield increased by13% d�1, but the VFA concentration was not significantly altered.From the 7th day onward, the tVFA and VFA concentrations in-creased rapidly, primarily due to a rise in the concentrations of ace-tic acid and propionic acid, whereas the daily biogas yielddiminished slowly.
0
2
4
6
8
10
12
1 3 5 7 9 11 13 15 17 19 21 23 25 27 29 31 33 37 39
Day
OL
R (
g l-1
d-1
)
1/b1/a 2/a 2/b
Fig. 1. Organic loading rate (OLR) periods of the experiment: 1/a, 15% overloading; 1/b, recovery stage; 2/a, 10% loading; 2/b, stable run.
5272 T. Rétfalvi et al. / Bioresource Technology 102 (2011) 5270–5275
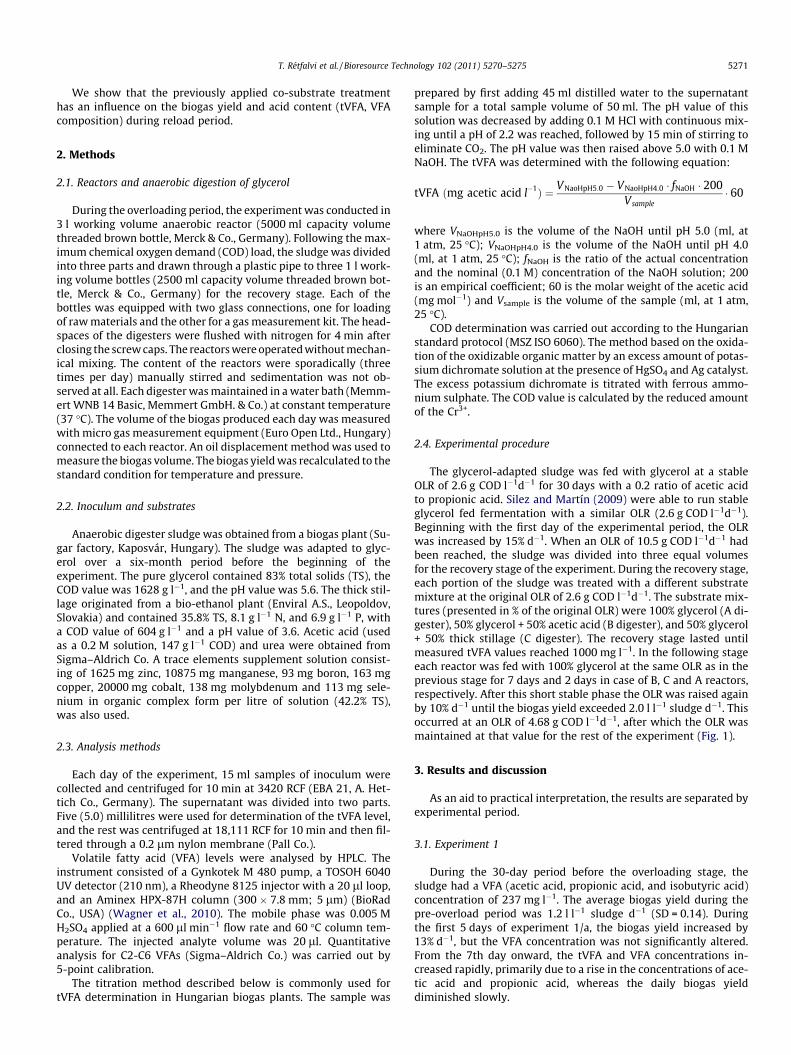
During experiment 1/a, the first sign of overload was a fast in-crease of the acetic acid concentration, which was followed by anincrease of the propionic acid concentration after a 1 day delay.The concentrations of acetic acid and propionic acid both reachedtheir maxima during experiment 1/b, and the propionic acid con-centration peaked 2 days after the acetic acid concentration. Themaximum amount of propionic acid was 4–5 times higher thanthe maximum amount of acetic acid (Figs. 2A, 2B and 2C).
The maxima VFA concentrations on Figs. 2A, 2B, and 2C are sim-ilar to the detected values during the restart of a bio-waste fedindustrial biogas plant (Gallert and Winter, 2008). Although theconcentrations of butyric acid, isobutyric acid, and valeric aciddid rise during experiment 1/a, they did not increase as greatlyor as rapidly as the concentrations of acetic acid and propionic acidin this period (acetic acid: 7644%, propionic acid: 4790%, butyricacid: 240%, isobutyric acid: 105%, valeric acid: 435%).
0
2000
4000
6000
8000
10000
12000
14000
1 2 3 4 5 6 7 8 9 10 11 13 15 17 18 19 20 2
Da
Aci
d co
ncen
trat
ion
(mg
l-1)
Acetic acid Propionic acid Isobutyric acid Buty
Fig. 2A. Gas production yield and organic
The differences between the methods we tested were soonobvious. After a 2–3-day delay, the effect of the immediate, drasticOLR decrease first appeared as a reduction in the tVFA and then areduction in the total VFA. At the end of experiment 1/a, the biogasyield from each of the three test digesters immediately dropped;after the acid content values reached their maxima, the biogasyield increased as the acid content decreased.
In each case in experiment 1/b, the acetic acid concentration de-creased faster than the propionic acid concentration, causing adrop in the acetic acid to propionic acid ratio.
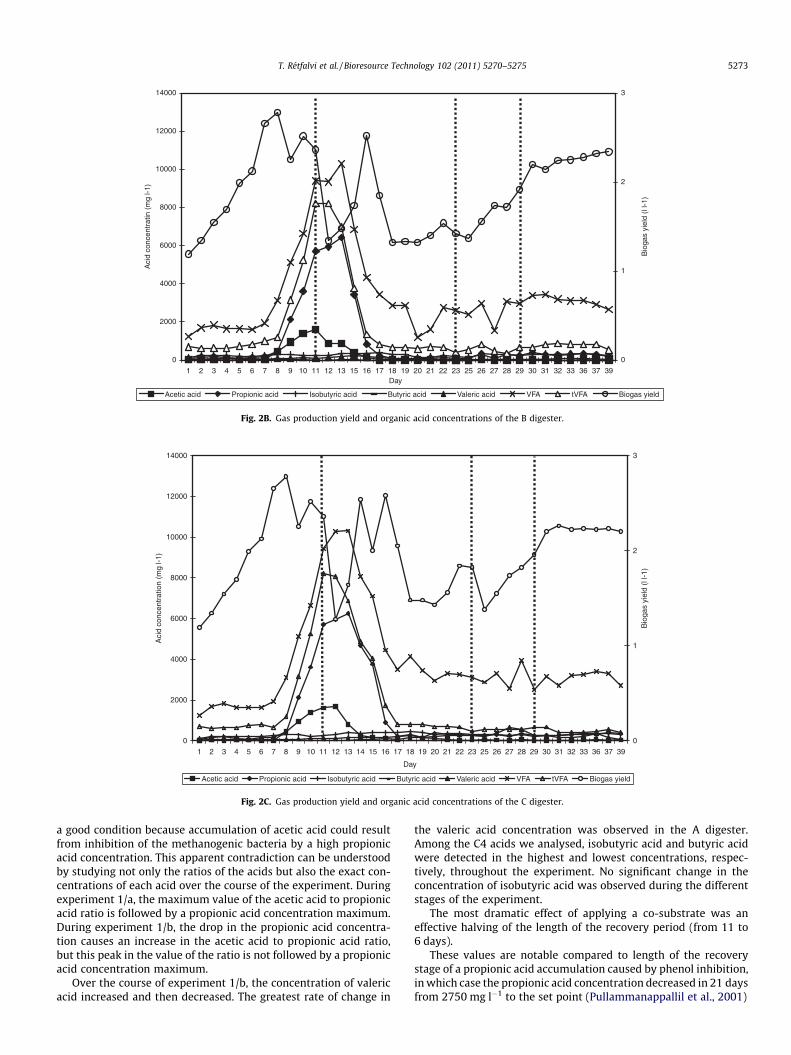
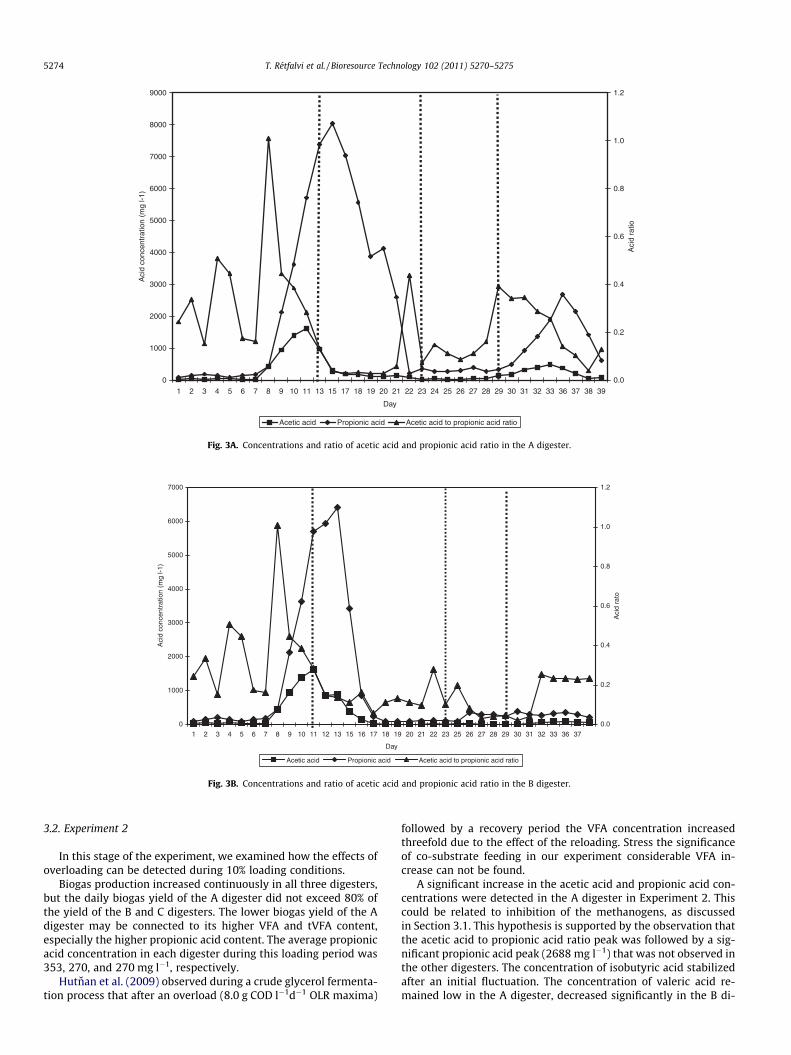
An analysis of the changes in the acetic acid to propionic acidratio aids understanding of this process (Figs. 3A, 3B and 3C). Weobserved that the acetic acid treatment in the B reactor resultedin a slower decrease of the acetic acid to propionic acid ratio thanwe observed in the other two reactors. In these experiments, thehigher acetic acid to propionic acid ratio by itself does not indicate
1 22 23 24 25 26 27 28 29 30 31 32 33 36 37 38 39
y
0
1
2
3
Bio
gas
yiel
d (l
l-1)
ric acid Valeric acid VFA tVFA Biogas yield
acid concentrations of the A digester.
0
2000
4000
6000
8000
10000
12000
14000
1 2 3 4 5 6 7 8 9 10 11 12 13 15 16 17 18 19 20 21 22 23 25 26 27 28 29 30 31 32 33 36 37 39Day
Aci
d co
ncen
trat
in (
mg
l-1)
0
1
2
3
Bio
gas
yiel
d (l
l-1)
Acetic acid Propionic acid Isobutyric acid Butyric acid Valeric acid VFA tVFA Biogas yield
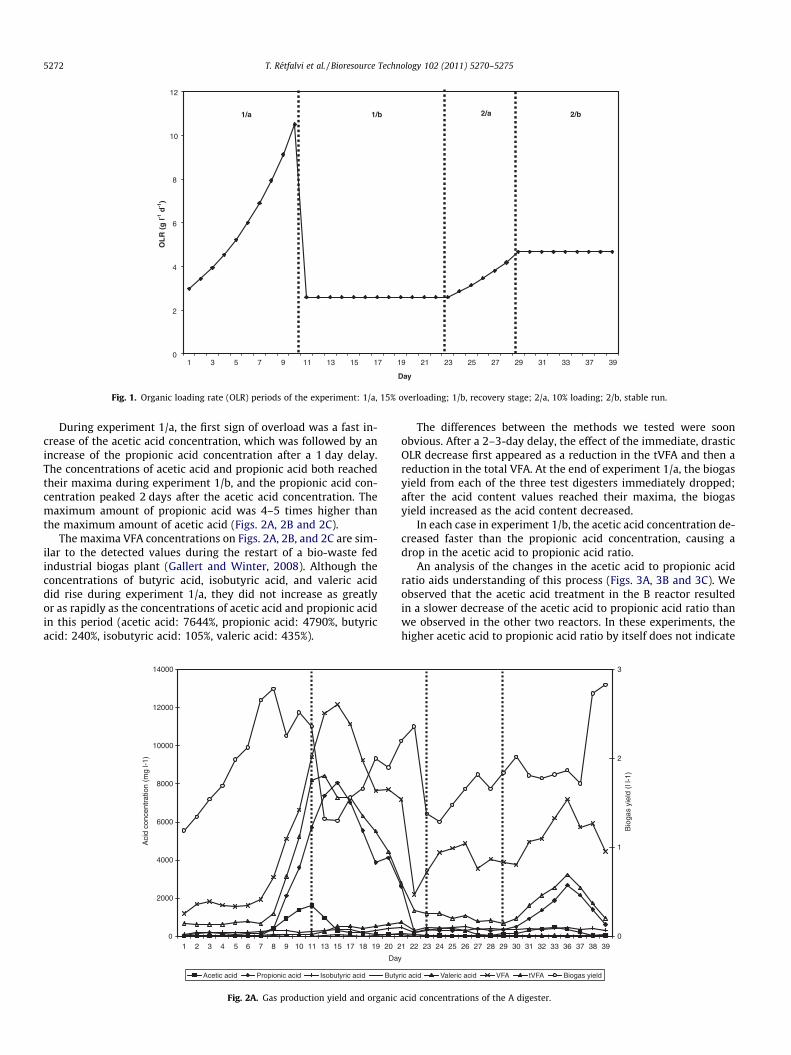
Fig. 2B. Gas production yield and organic acid concentrations of the B digester.
0
2000
4000
6000
8000
10000
12000
14000
1 2 3 4 5 6 7 8 9 10 11 12 13 14 15 16 17 18 19 20 21 22 23 25 26 27 28 29 30 31 32 33 36 37 39
Day
Aci
d co
ncen
trat
ion
(mg
l-1)
0
1
2
3
Bio
gas
yiel
d (l
l-1)
Acetic acid Propionic acid Isobutyric acid Butyric acid Valeric acid VFA tVFA Biogas yield
Fig. 2C. Gas production yield and organic acid concentrations of the C digester.
T. Rétfalvi et al. / Bioresource Technology 102 (2011) 5270–5275 5273
a good condition because accumulation of acetic acid could resultfrom inhibition of the methanogenic bacteria by a high propionicacid concentration. This apparent contradiction can be understoodby studying not only the ratios of the acids but also the exact con-centrations of each acid over the course of the experiment. Duringexperiment 1/a, the maximum value of the acetic acid to propionicacid ratio is followed by a propionic acid concentration maximum.During experiment 1/b, the drop in the propionic acid concentra-tion causes an increase in the acetic acid to propionic acid ratio,but this peak in the value of the ratio is not followed by a propionicacid concentration maximum.
Over the course of experiment 1/b, the concentration of valericacid increased and then decreased. The greatest rate of change in
the valeric acid concentration was observed in the A digester.Among the C4 acids we analysed, isobutyric acid and butyric acidwere detected in the highest and lowest concentrations, respec-tively, throughout the experiment. No significant change in theconcentration of isobutyric acid was observed during the differentstages of the experiment.
The most dramatic effect of applying a co-substrate was aneffective halving of the length of the recovery period (from 11 to6 days).
These values are notable compared to length of the recoverystage of a propionic acid accumulation caused by phenol inhibition,in which case the propionic acid concentration decreased in 21 daysfrom 2750 mg l�1 to the set point (Pullammanappallil et al., 2001)
0
1000
2000
3000
4000
5000
6000
7000
8000
9000
1 2 3 4 5 6 7 8 9 10 11 13 15 17 18 19 20 21 22 23 24 25 26 27 28 29 30 31 32 33 36 37 38 39
Day
Aci
d co
ncen
trat
ion
(mg
l-1)
0.0
0.2
0.4
0.6
0.8
1.0
1.2
Aci
d ra
tio
Acetic acid Propionic acid Acetic acid to propionic acid ratio
Fig. 3A. Concentrations and ratio of acetic acid and propionic acid ratio in the A digester.
0
1000
2000
3000
4000
5000
6000
7000
1 2 3 4 5 6 7 8 9 10 11 12 13 15 16 17 18 19 20 21 22 23 25 26 27 28 29 30 31 32 33 36 37
Day
Aci
d co
ncen
trat
ion
(mg
l-1)
0.0
0.2
0.4
0.6
0.8
1.0
1.2
Aci
d ra
to
Acetic acid Propionic acid Acetic acid to propionic acid ratio
Fig. 3B. Concentrations and ratio of acetic acid and propionic acid ratio in the B digester.
5274 T. Rétfalvi et al. / Bioresource Technology 102 (2011) 5270–5275
3.2. Experiment 2
In this stage of the experiment, we examined how the effects ofoverloading can be detected during 10% loading conditions.
Biogas production increased continuously in all three digesters,but the daily biogas yield of the A digester did not exceed 80% ofthe yield of the B and C digesters. The lower biogas yield of the Adigester may be connected to its higher VFA and tVFA content,especially the higher propionic acid content. The average propionicacid concentration in each digester during this loading period was353, 270, and 270 mg l�1, respectively.
Hutnan et al. (2009) observed during a crude glycerol fermenta-tion process that after an overload (8.0 g COD l�1d�1 OLR maxima)
followed by a recovery period the VFA concentration increasedthreefold due to the effect of the reloading. Stress the significanceof co-substrate feeding in our experiment considerable VFA in-crease can not be found.
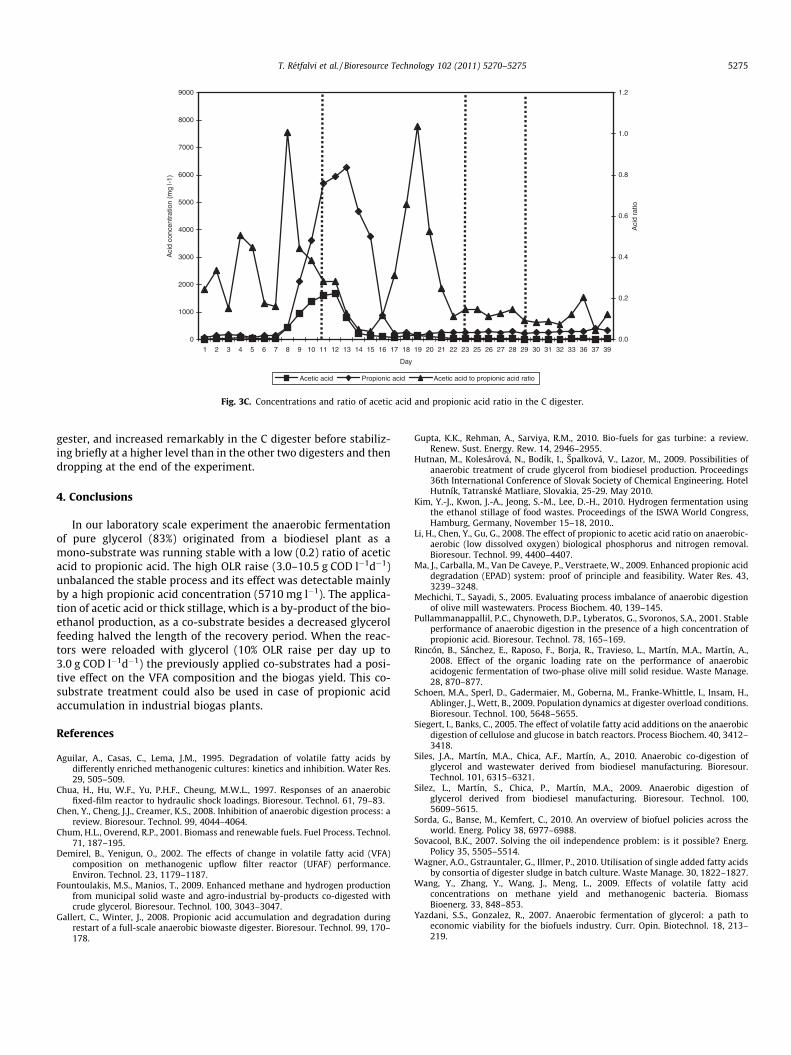
A significant increase in the acetic acid and propionic acid con-centrations were detected in the A digester in Experiment 2. Thiscould be related to inhibition of the methanogens, as discussedin Section 3.1. This hypothesis is supported by the observation thatthe acetic acid to propionic acid ratio peak was followed by a sig-nificant propionic acid peak (2688 mg l�1) that was not observed inthe other digesters. The concentration of isobutyric acid stabilizedafter an initial fluctuation. The concentration of valeric acid re-mained low in the A digester, decreased significantly in the B di-
0
1000
2000
3000
4000
5000
6000
7000
8000
9000
1 2 3 4 5 6 7 8 9 10 11 12 13 14 15 16 17 18 19 20 21 22 23 25 26 27 28 29 30 31 32 33 36 37 39
Day
Aci
d co
ncen
trat
ion
(mg
l-1)
0.0
0.2
0.4
0.6
0.8
1.0
1.2
Aci
d ra
tio
Acetic acid Propionic acid Acetic acid to propionic acid ratio
Fig. 3C. Concentrations and ratio of acetic acid and propionic acid ratio in the C digester.
T. Rétfalvi et al. / Bioresource Technology 102 (2011) 5270–5275 5275
gester, and increased remarkably in the C digester before stabiliz-ing briefly at a higher level than in the other two digesters and thendropping at the end of the experiment.
4. Conclusions
In our laboratory scale experiment the anaerobic fermentationof pure glycerol (83%) originated from a biodiesel plant as amono-substrate was running stable with a low (0.2) ratio of aceticacid to propionic acid. The high OLR raise (3.0–10.5 g COD l�1d�1)unbalanced the stable process and its effect was detectable mainlyby a high propionic acid concentration (5710 mg l�1). The applica-tion of acetic acid or thick stillage, which is a by-product of the bio-ethanol production, as a co-substrate besides a decreased glycerolfeeding halved the length of the recovery period. When the reac-tors were reloaded with glycerol (10% OLR raise per day up to3.0 g COD l�1d�1) the previously applied co-substrates had a posi-tive effect on the VFA composition and the biogas yield. This co-substrate treatment could also be used in case of propionic acidaccumulation in industrial biogas plants.
References
Aguilar, A., Casas, C., Lema, J.M., 1995. Degradation of volatile fatty acids bydifferently enriched methanogenic cultures: kinetics and inhibition. Water Res.29, 505–509.
Chua, H., Hu, W.F., Yu, P.H.F., Cheung, M.W.L., 1997. Responses of an anaerobicfixed-film reactor to hydraulic shock loadings. Bioresour. Technol. 61, 79–83.
Chen, Y., Cheng, J.J., Creamer, K.S., 2008. Inhibition of anaerobic digestion process: areview. Bioresour. Technol. 99, 4044–4064.
Chum, H.L., Overend, R.P., 2001. Biomass and renewable fuels. Fuel Process. Technol.71, 187–195.
Demirel, B., Yenigun, O., 2002. The effects of change in volatile fatty acid (VFA)composition on methanogenic upflow filter reactor (UFAF) performance.Environ. Technol. 23, 1179–1187.
Fountoulakis, M.S., Manios, T., 2009. Enhanced methane and hydrogen productionfrom municipal solid waste and agro-industrial by-products co-digested withcrude glycerol. Bioresour. Technol. 100, 3043–3047.
Gallert, C., Winter, J., 2008. Propionic acid accumulation and degradation duringrestart of a full-scale anaerobic biowaste digester. Bioresour. Technol. 99, 170–178.
Gupta, K.K., Rehman, A., Sarviya, R.M., 2010. Bio-fuels for gas turbine: a review.Renew. Sust. Energy. Rew. 14, 2946–2955.
Hutnan, M., Kolesárová, N., Bodík, I., Špalková, V., Lazor, M., 2009. Possibilities ofanaerobic treatment of crude glycerol from biodiesel production. Proceedings36th International Conference of Slovak Society of Chemical Engineering. HotelHutník, Tatranské Matliare, Slovakia, 25-29. May 2010.
Kim, Y.-J., Kwon, J.-A., Jeong, S.-M., Lee, D.-H., 2010. Hydrogen fermentation usingthe ethanol stillage of food wastes. Proceedings of the ISWA World Congress,Hamburg, Germany, November 15–18, 2010..
Li, H., Chen, Y., Gu, G., 2008. The effect of propionic to acetic acid ratio on anaerobic-aerobic (low dissolved oxygen) biological phosphorus and nitrogen removal.Bioresour. Technol. 99, 4400–4407.
Ma, J., Carballa, M., Van De Caveye, P., Verstraete, W., 2009. Enhanced propionic aciddegradation (EPAD) system: proof of principle and feasibility. Water Res. 43,3239–3248.
Mechichi, T., Sayadi, S., 2005. Evaluating process imbalance of anaerobic digestionof olive mill wastewaters. Process Biochem. 40, 139–145.
Pullammanappallil, P.C., Chynoweth, D.P., Lyberatos, G., Svoronos, S.A., 2001. Stableperformance of anaerobic digestion in the presence of a high concentration ofpropionic acid. Bioresour. Technol. 78, 165–169.
Rincón, B., Sánchez, E., Raposo, F., Borja, R., Travieso, L., Martín, M.A., Martín, A.,2008. Effect of the organic loading rate on the performance of anaerobicacidogenic fermentation of two-phase olive mill solid residue. Waste Manage.28, 870–877.
Schoen, M.A., Sperl, D., Gadermaier, M., Goberna, M., Franke-Whittle, I., Insam, H.,Ablinger, J., Wett, B., 2009. Population dynamics at digester overload conditions.Bioresour. Technol. 100, 5648–5655.
Siegert, I., Banks, C., 2005. The effect of volatile fatty acid additions on the anaerobicdigestion of cellulose and glucose in batch reactors. Process Biochem. 40, 3412–3418.
Siles, J.A., Martín, M.A., Chica, A.F., Martín, A., 2010. Anaerobic co-digestion ofglycerol and wastewater derived from biodiesel manufacturing. Bioresour.Technol. 101, 6315–6321.
Silez, L., Martín, S., Chica, P., Martín, M.A., 2009. Anaerobic digestion ofglycerol derived from biodiesel manufacturing. Bioresour. Technol. 100,5609–5615.
Sorda, G., Banse, M., Kemfert, C., 2010. An overview of biofuel policies across theworld. Energ. Policy 38, 6977–6988.
Sovacool, B.K., 2007. Solving the oil independence problem: is it possible? Energ.Policy 35, 5505–5514.
Wagner, A.O., Gstrauntaler, G., Illmer, P., 2010. Utilisation of single added fatty acidsby consortia of digester sludge in batch culture. Waste Manage. 30, 1822–1827.
Wang, Y., Zhang, Y., Wang, J., Meng, L., 2009. Effects of volatile fatty acidconcentrations on methane yield and methanogenic bacteria. BiomassBioenerg. 33, 848–853.
Yazdani, S.S., Gonzalez, R., 2007. Anaerobic fermentation of glycerol: a path toeconomic viability for the biofuels industry. Curr. Opin. Biotechnol. 18, 213–219.


