Kantoor of Koffiebar
Alain SwolfsMarket Unit Leader Banking & Insurance
Bessenveldstraat
Brussels, Belgium
Mobile:+32 (0)494 32 13 85
>> 0 >> 1 >> 2 >> 3 >> 4 >>
Japan
Taiwan
Philippines
Malaysia
Singapore
VietnamIndia
People’s Republic of
China
United Arab
Emirates
Saudi Arabia
All of Europe
Morocco
South AfricaArgentina
Chile
BrazilColombia
Guatemala
Mexico
United States
Canada
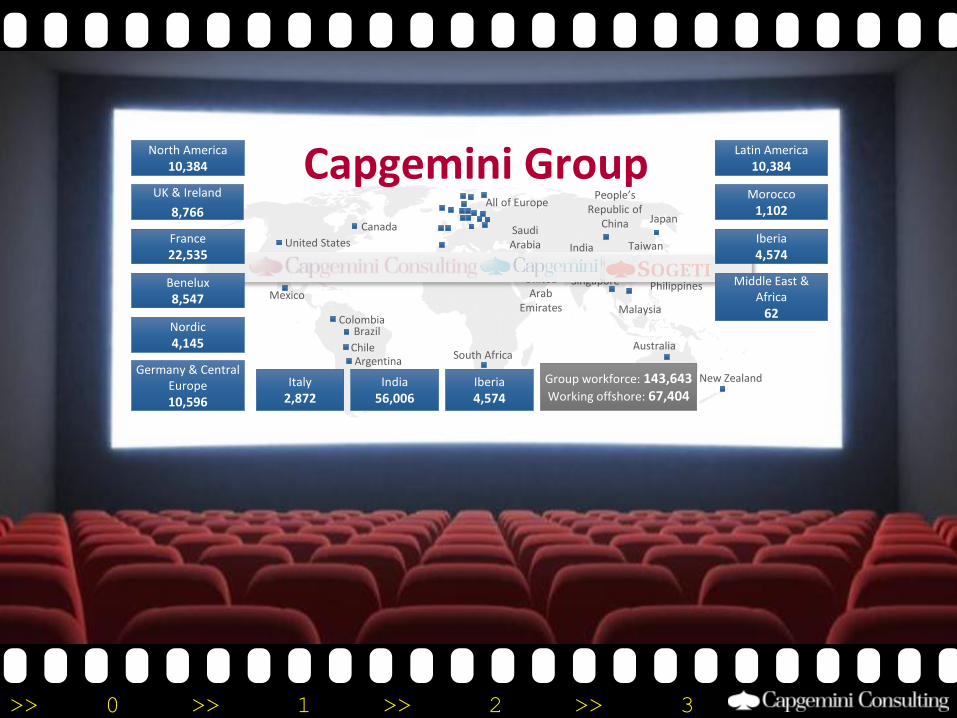
Capgemini Group
Australia
New Zealand
North America
10,384
UK & Ireland
8,766
Nordic
4,145
Germany & Central Europe
10,596
Latin America
10,384
Morocco
1,102
Iberia
4,574India
56,006Italy
2,872
Group workforce: 143,643Working offshore: 67,404
France
22,535
Benelux
8,547
Iberia
4,574
Middle East & Africa
62
>> 0 >> 1 >> 2 >> 3 >> 4 >>
>> 0 >> 1 >> 2 >> 3 >> 4 >>
>> 0 >> 1 >> 2 >> 3 >> 4 >>
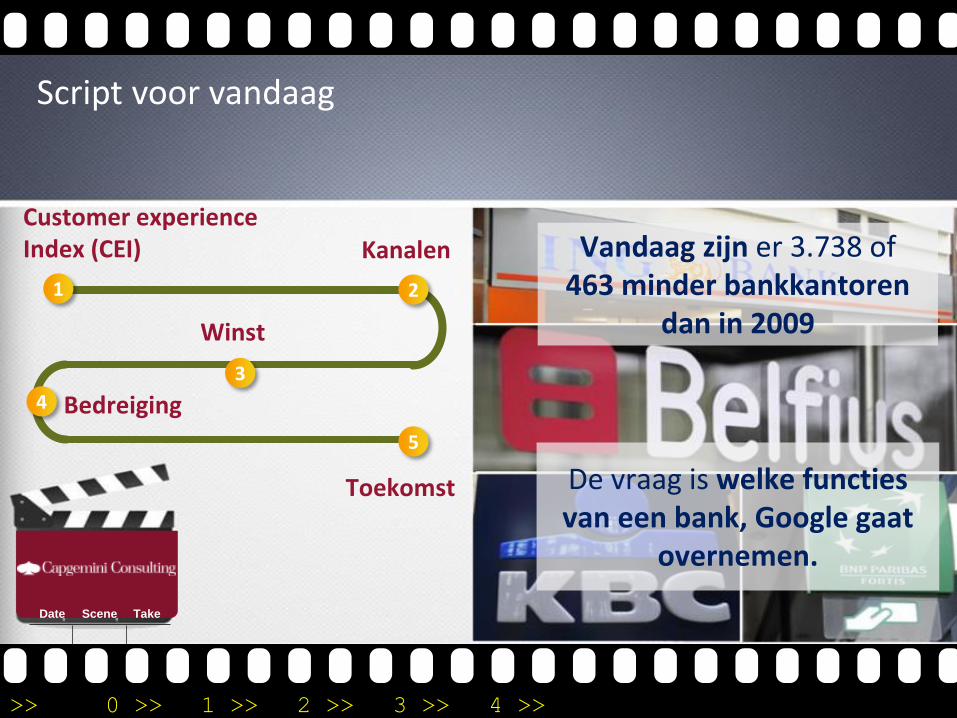
Script voor vandaag
Date Scene Take
De vraag is welke functies van een bank, Google gaat
overnemen.
Vandaag zijn er 3.738 of 463 minder bankkantoren
dan in 2009
Customer experience Index (CEI) Kanalen
Winst
Bedreiging
Toekomst
1 2
3
4
5
>> 0 >> 1 >> 2 >> 3 >> 4 >>
>> 0 >> 1 >> 2 >> 3 >> 4 >>
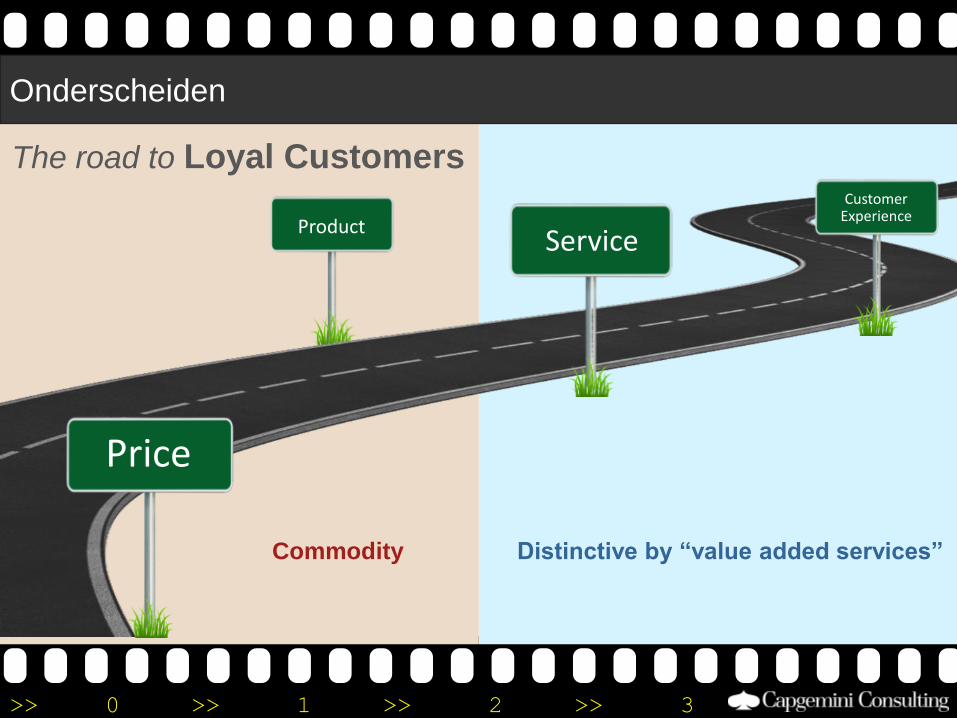
Onderscheiden
The road to Loyal Customers
Price
ServiceProduct
Customer Experience
Distinctive by “value added services”Commodity
>> 0 >> 1 >> 2 >> 3 >> 4 >>
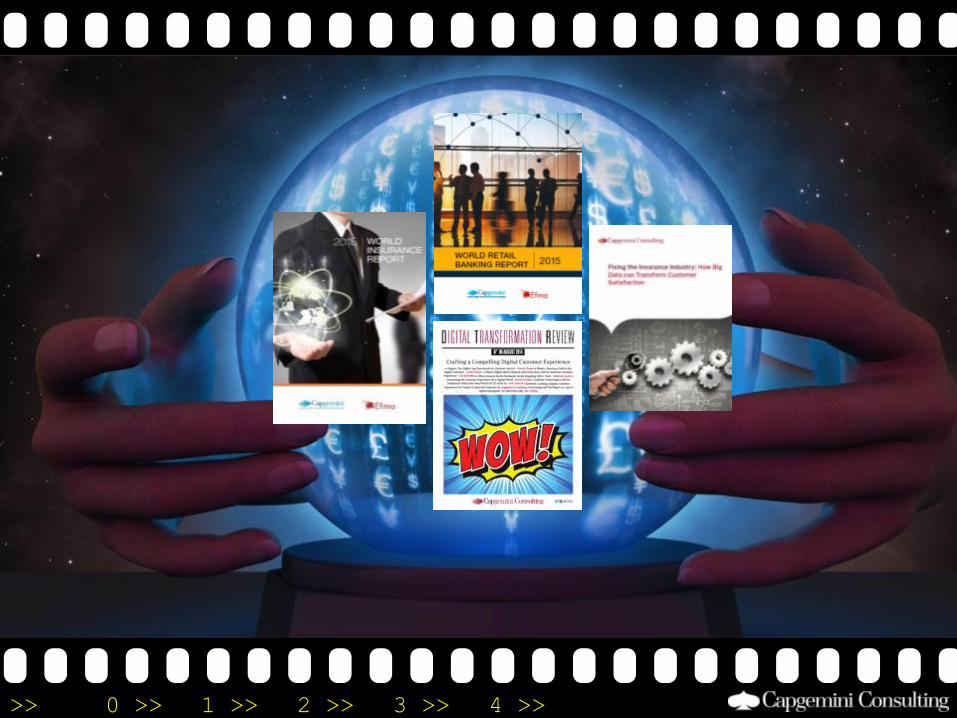
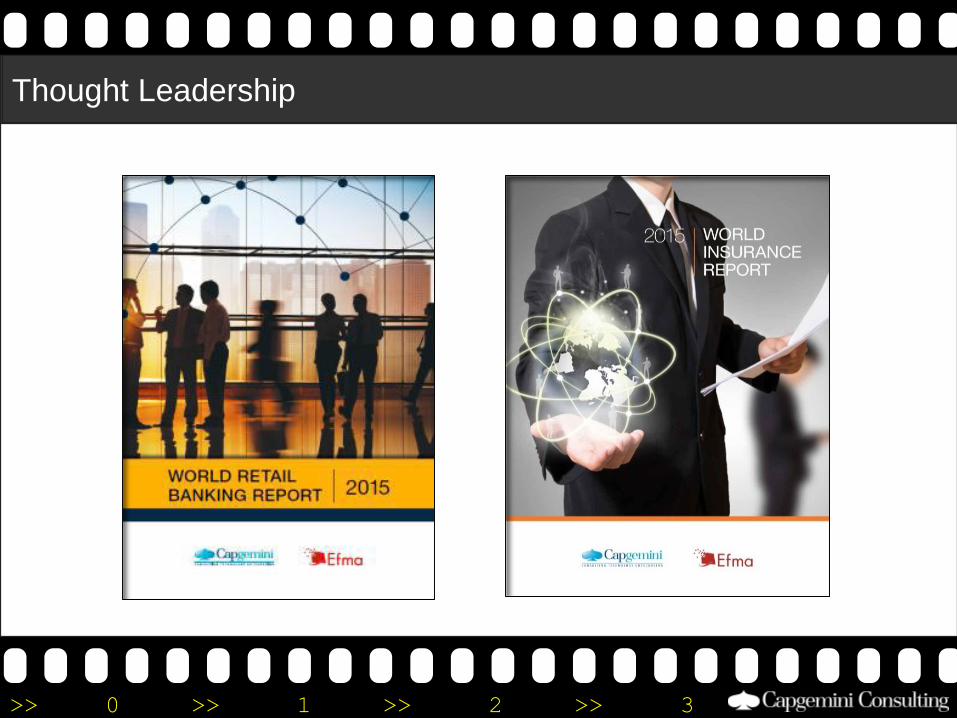
Thought Leadership
>> 0 >> 1 >> 2 >> 3 >> 4 >>
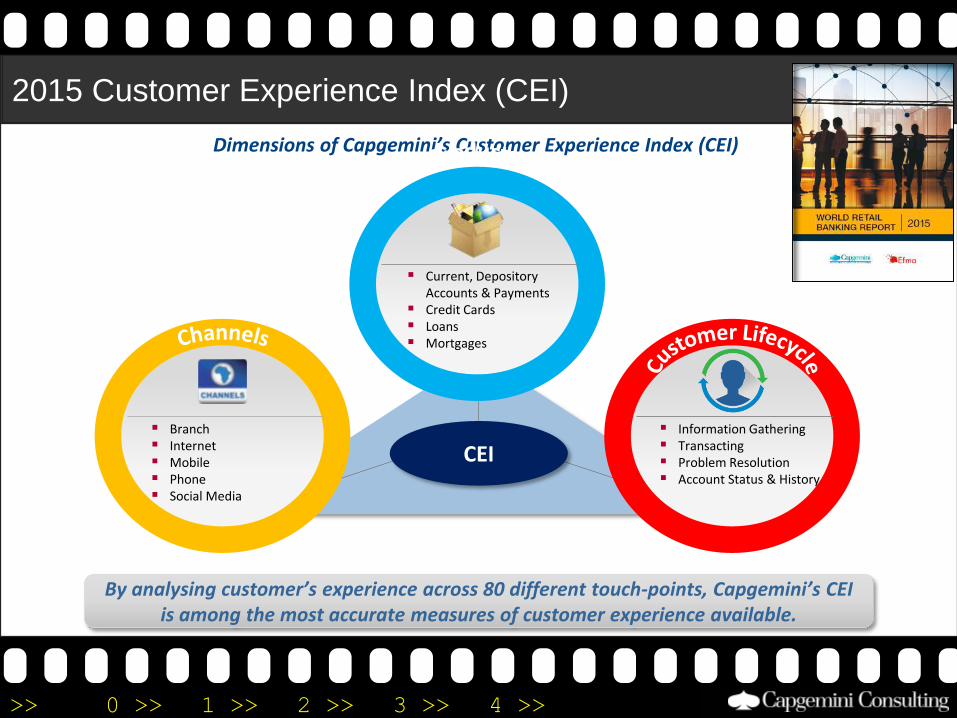
By analysing customer’s experience across 80 different touch-points, Capgemini’s CEI is among the most accurate measures of customer experience available.
Dimensions of Capgemini’s Customer Experience Index (CEI)
CEI
Current, Depository Accounts & Payments
Credit Cards Loans Mortgages
Information Gathering Transacting Problem Resolution Account Status & History
Branch Internet Mobile Phone Social Media
2015 Customer Experience Index (CEI)
>> 0 >> 1 >> 2 >> 3 >> 4 >>
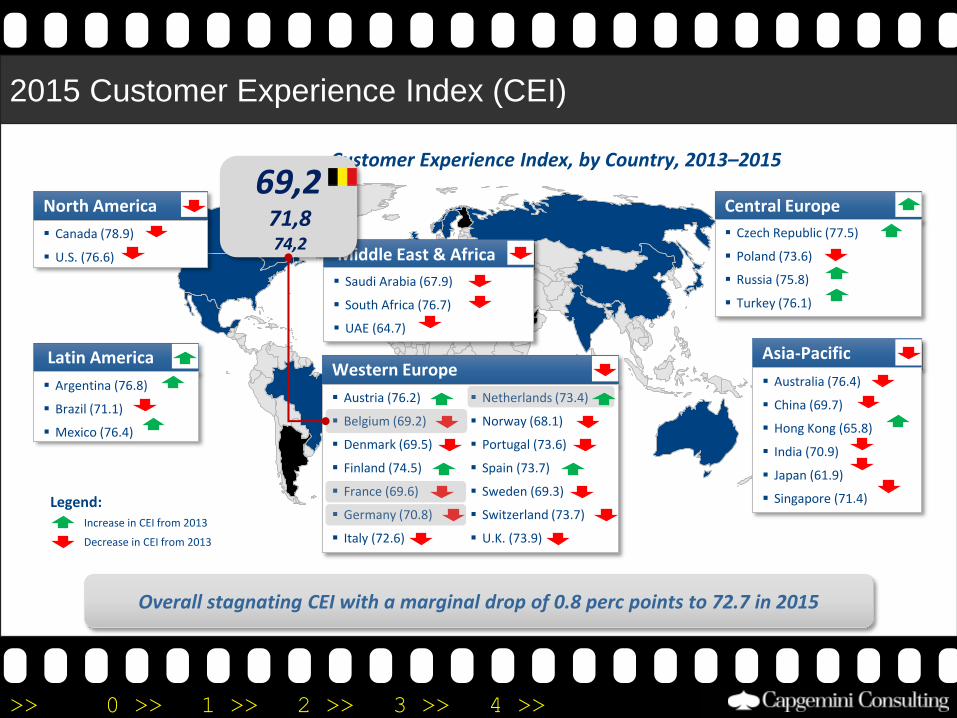
2015 Customer Experience Index (CEI)
Western Europe
Austria (76.2)
Belgium (69.2)
Denmark (69.5)
Finland (74.5)
France (69.6)
Germany (70.8)
Italy (72.6)
Netherlands (73.4)
Norway (68.1)
Portugal (73.6)
Spain (73.7)
Sweden (69.3)
Switzerland (73.7)
U.K. (73.9)
Middle East & Africa
Saudi Arabia (67.9)
South Africa (76.7)
UAE (64.7)
Increase in CEI from 2013
Legend:
Decrease in CEI from 2013
Latin America
Argentina (76.8)
Brazil (71.1)
Mexico (76.4)
North America
Canada (78.9)
U.S. (76.6)
Asia-Pacific
Australia (76.4)
China (69.7)
Hong Kong (65.8)
India (70.9)
Japan (61.9)
Singapore (71.4)
Central Europe
Czech Republic (77.5)
Poland (73.6)
Russia (75.8)
Turkey (76.1)
Overall stagnating CEI with a marginal drop of 0.8 perc points to 72.7 in 2015
Customer Experience Index, by Country, 2013–2015
69,271,874,2
>> 0 >> 1 >> 2 >> 3 >> 4 >>
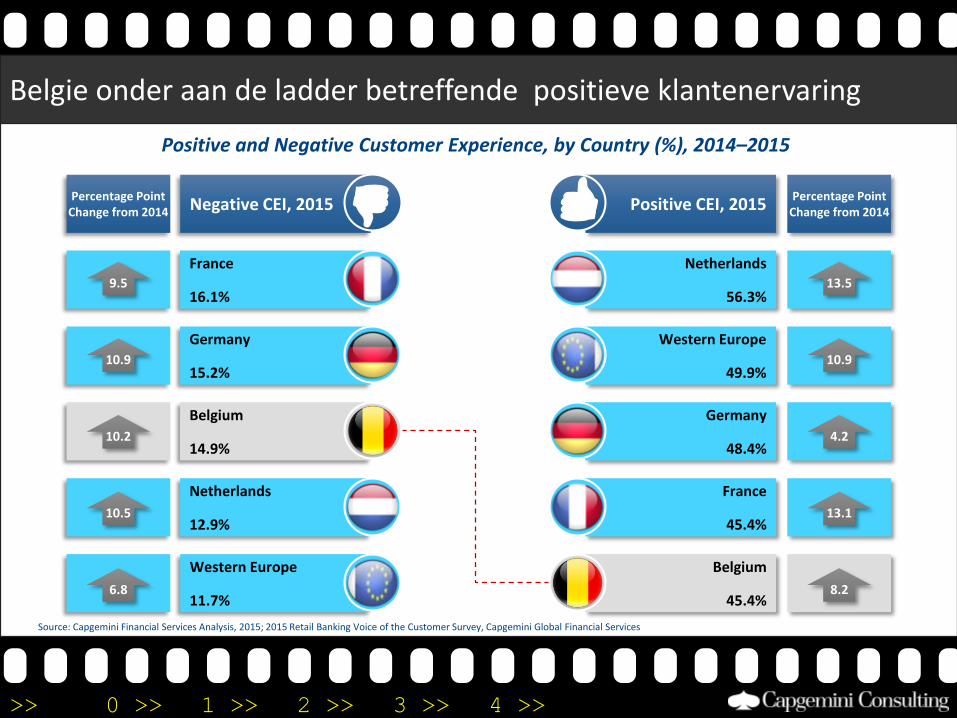
Percentage Point Change from 2014
Netherlands
56.3%
Germany
48.4%
France
45.4%
Positive CEI, 2015
Western Europe
49.9%
Western Europe
11.7%
Netherlands
12.9%
Germany
15.2%
France
16.1%
Negative CEI, 2015
9.5
10.9
10.2
10.5
6.8
13.5
10.9
4.2
13.1
8.2
Percentage Point Change from 2014
Belgie onder aan de ladder betreffende positieve klantenervaring
Source: Capgemini Financial Services Analysis, 2015; 2015 Retail Banking Voice of the Customer Survey, Capgemini Global Financial Services
Positive and Negative Customer Experience, by Country (%), 2014–2015
Belgium
14.9%
Belgium
45.4%
>> 0 >> 1 >> 2 >> 3 >> 4 >>
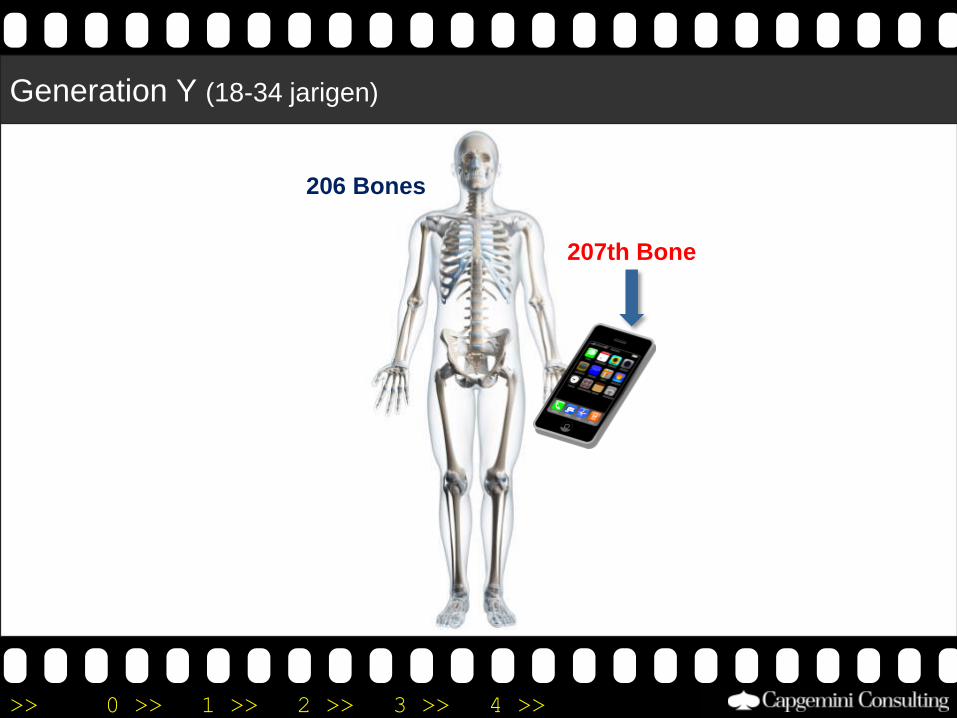
Generation Y (18-34 jarigen)
206 Bones
207th Bone
>> 0 >> 1 >> 2 >> 3 >> 4 >>
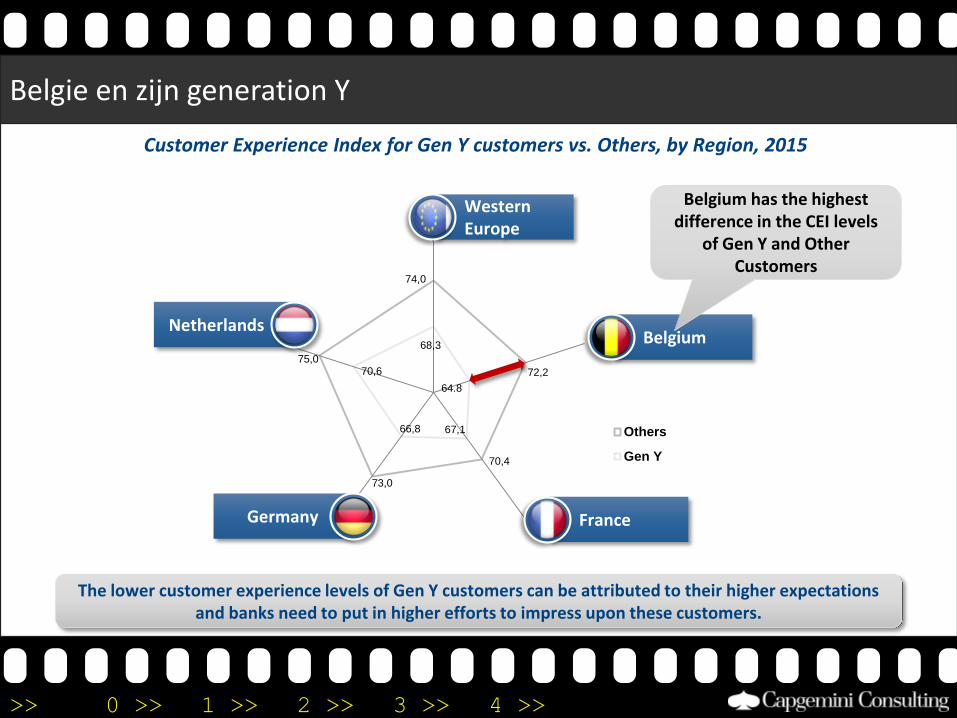
74,0
72,2
70,4
73,0
75,0
68,3
67,166,8
70,6
Others
Gen Y
Belgie en zijn generation Y
BelgiumNetherlands
Germany France
WesternEurope
The lower customer experience levels of Gen Y customers can be attributed to their higher expectations and banks need to put in higher efforts to impress upon these customers.
Belgium has the highest difference in the CEI levels
of Gen Y and Other Customers
Customer Experience Index for Gen Y customers vs. Others, by Region, 2015
64.8
>> 0 >> 1 >> 2 >> 3 >> 4 >>
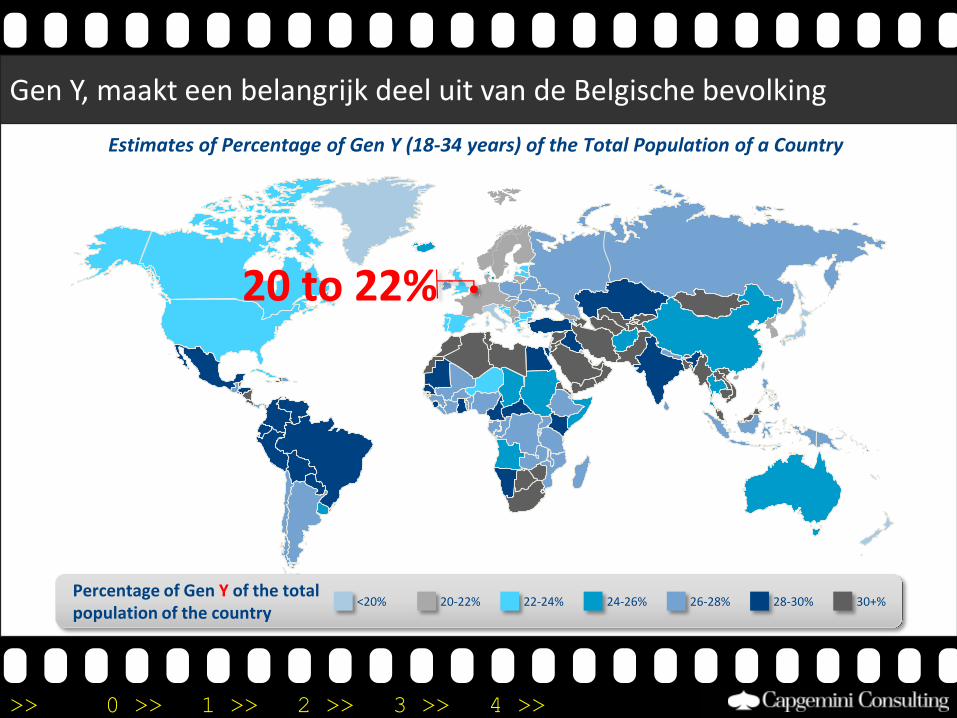
Gen Y, maakt een belangrijk deel uit van de Belgische bevolking
Percentage of Gen Y of the total population of the country
28-30%24-26%<20% 20-22% 22-24% 26-28% 30+%
Estimates of Percentage of Gen Y (18-34 years) of the Total Population of a Country
20 to 22%
>> 0 >> 1 >> 2 >> 3 >> 4 >>
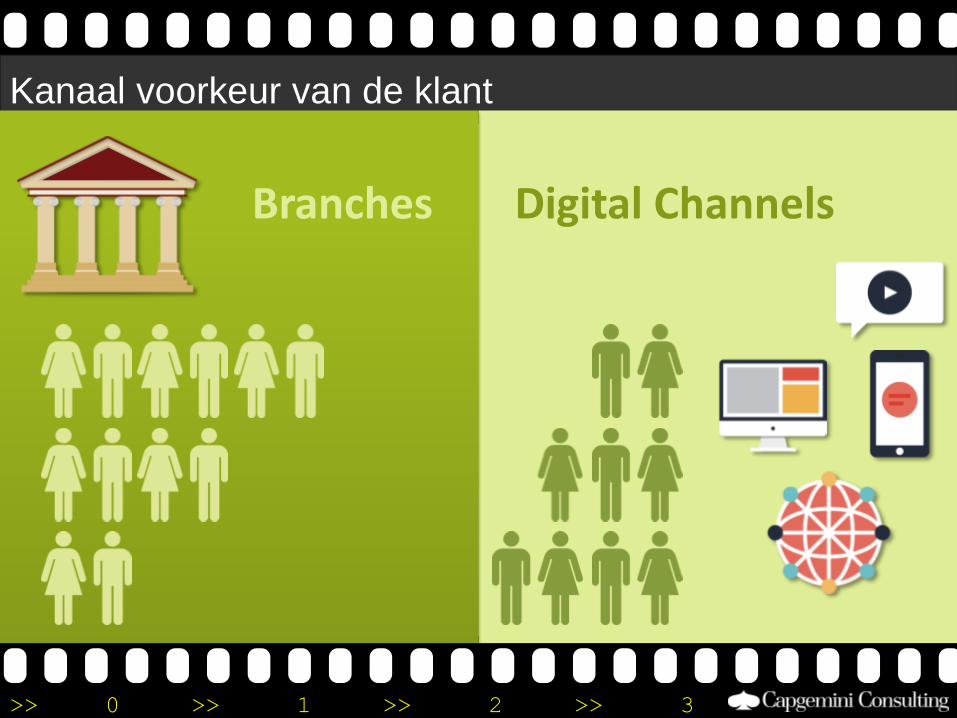
Kanaal voorkeur van de klant
Branches Digital Channels
>> 0 >> 1 >> 2 >> 3 >> 4 >>
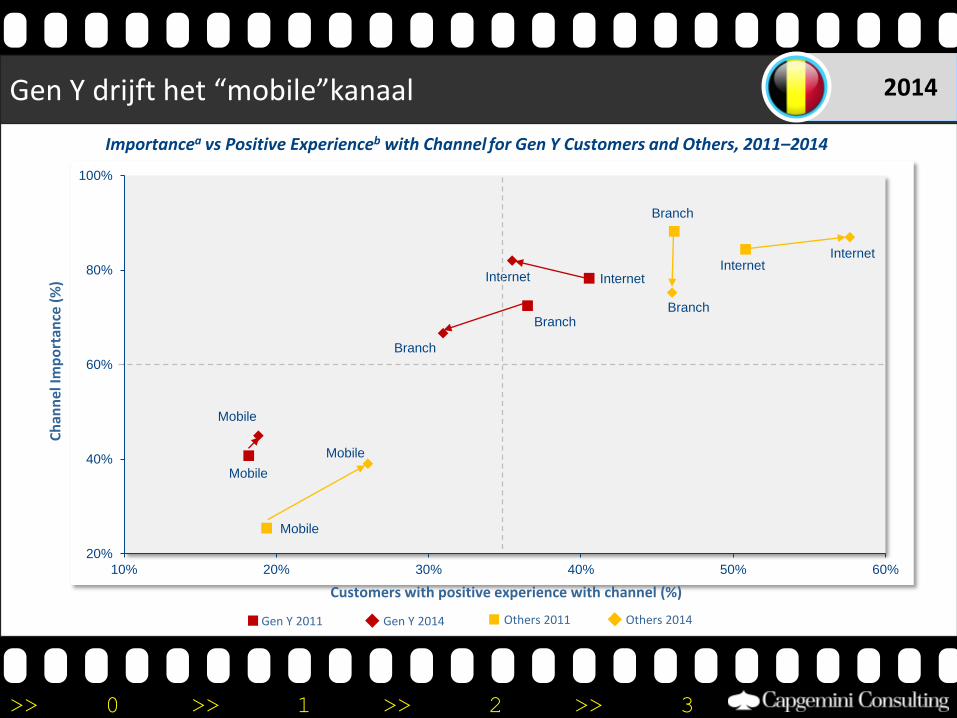
Gen Y drijft het “mobile”kanaal 2014
Branch
Internet
Mobile
Branch
Internet
Mobile
Branch
Internet
Mobile
Branch
Internet
Mobile
20%
40%
60%
80%
100%
10% 20% 30% 40% 50% 60%
Importancea vs Positive Experienceb with Channel for Gen Y Customers and Others, 2011–2014
Customers with positive experience with channel (%)
Ch
ann
el Im
po
rtan
ce (
%)
Gen Y 2014 Others 2014Gen Y 2011 Others 2011
>> 0 >> 1 >> 2 >> 3 >> 4 >>
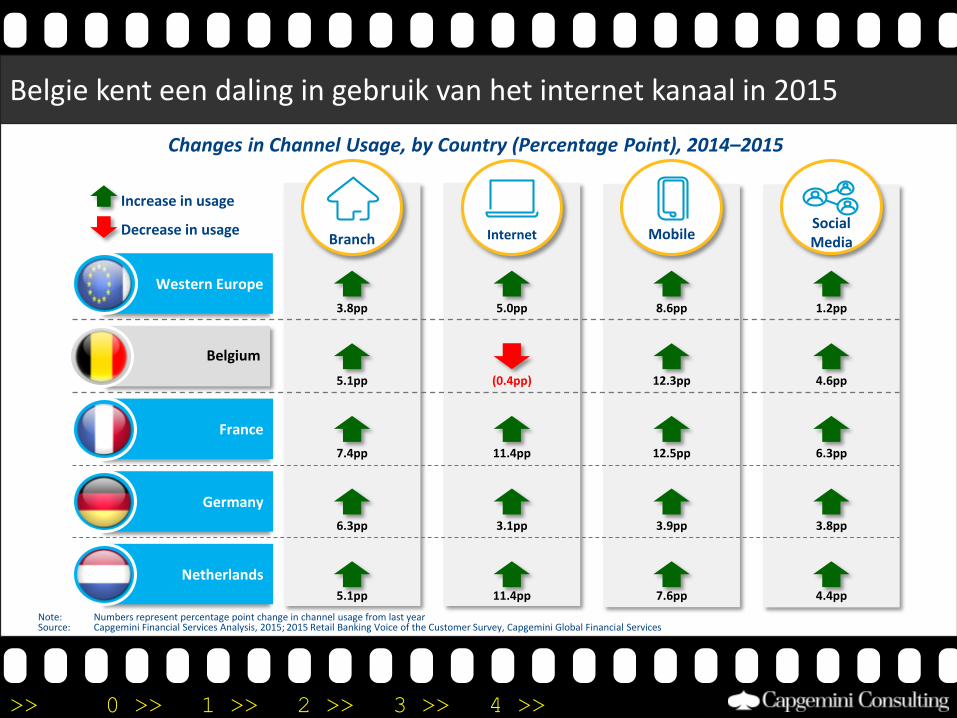
Belgie kent een daling in gebruik van het internet kanaal in 2015
Branch
3.8pp
5.1pp
7.4pp
6.3pp
5.1pp
Internet
5.0pp
(0.4pp)
11.4pp
3.1pp
11.4pp
Mobile
8.6pp
12.3pp
12.5pp
3.9pp
7.6pp
Social Media
1.2pp
4.6pp
6.3pp
3.8pp
4.4pp
Germany
France
Western Europe
Netherlands
Changes in Channel Usage, by Country (Percentage Point), 2014–2015
Increase in usage
Decrease in usage
Note: Numbers represent percentage point change in channel usage from last yearSource: Capgemini Financial Services Analysis, 2015; 2015 Retail Banking Voice of the Customer Survey, Capgemini Global Financial Services
Belgium
>> 0 >> 1 >> 2 >> 3 >> 4 >>
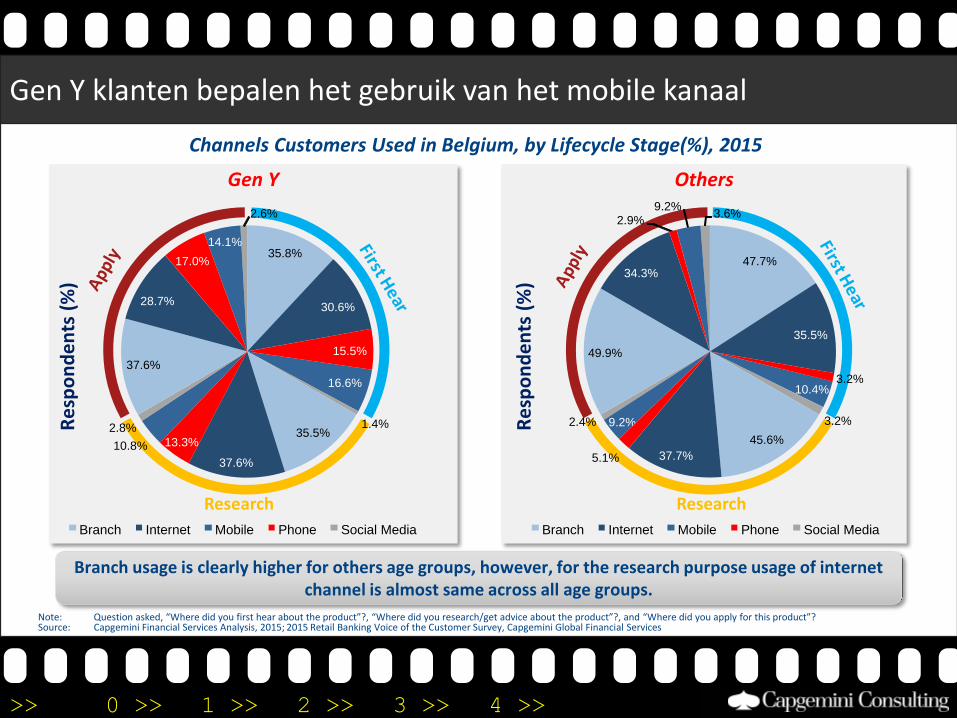
Gen Y klanten bepalen het gebruik van het mobile kanaal
Gen Y Others
Re
spo
nd
en
ts (
%)
Re
spo
nd
en
ts (
%)
Branch usage is clearly higher for others age groups, however, for the research purpose usage of internet channel is almost same across all age groups.
Note: Question asked, “Where did you first hear about the product”?, “Where did you research/get advice about the product”?, and “Where did you apply for this product”? Source: Capgemini Financial Services Analysis, 2015; 2015 Retail Banking Voice of the Customer Survey, Capgemini Global Financial Services
Channels Customers Used in Belgium, by Lifecycle Stage(%), 2015
47.7%
35.5%
3.2%
45.6%
37.7%
2.4%
49.9%
34.3%
3.6%
Branch Internet Mobile Phone Social Media
Research
35.8%
30.6%
1.4%35.5%
37.6%
2.8%
37.6%
28.7%
2.6%
Branch Internet Mobile Phone Social Media
Research
16.6%
10.8%
10.4%
9.2%
9.2%
14.1%
3.2%
5.1%
2.9%
15.5%
13.3%
17.0%
>> 0 >> 1 >> 2 >> 3 >> 4 >>
De Impact van klanten gedrag op de winstgevendheid
>> 0 >> 1 >> 2 >> 3 >> 4 >>
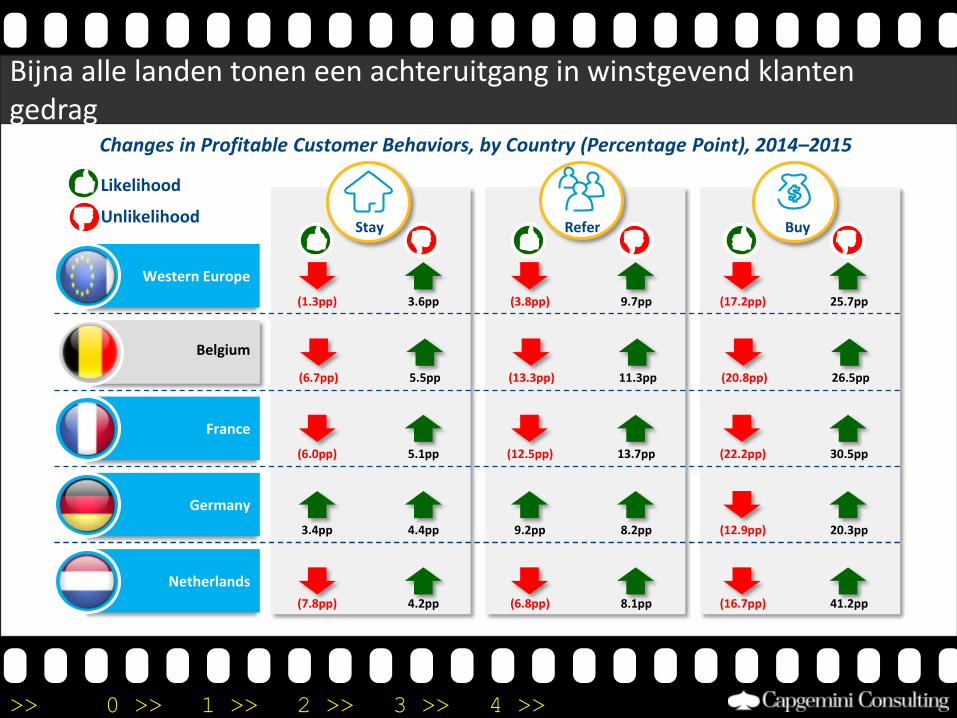
Bijna alle landen tonen een achteruitgang in winstgevend klanten gedrag
Stay Refer Buy
Likelihood
Unlikelihood
(6.7pp) 5.5pp (13.3pp) 11.3pp (20.8pp) 26.5pp
(6.0pp) 5.1pp (12.5pp) 13.7pp (22.2pp) 30.5pp
Germany
France
Western Europe
Netherlands
3.4pp 4.4pp 9.2pp 8.2pp (12.9pp) 20.3pp
(7.8pp) 4.2pp (6.8pp) 8.1pp (16.7pp) 41.2pp
(1.3pp) 3.6pp (3.8pp) 9.7pp (17.2pp) 25.7pp
Changes in Profitable Customer Behaviors, by Country (Percentage Point), 2014–2015
Belgium
>> 0 >> 1 >> 2 >> 3 >> 4 >>
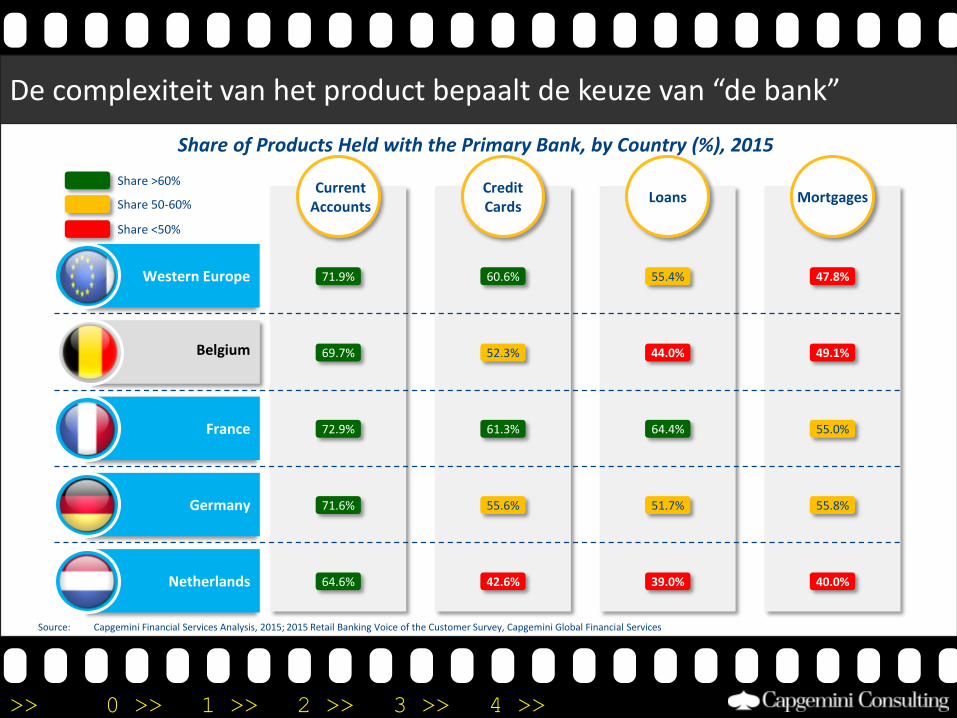
De complexiteit van het product bepaalt de keuze van “de bank”
71.9%
Current Accounts
MortgagesCredit Cards
Loans
60.6% 55.4% 47.8%
52.3% 44.0% 49.1%
72.9% 61.3% 64.4% 55.0%
71.6% 55.6% 51.7% 55.8%
64.6% 42.6% 39.0% 40.0%
69.7%
Share >60%
Share 50-60%
Share <50%
Share of Products Held with the Primary Bank, by Country (%), 2015
Germany
France
Western Europe
Netherlands
Source: Capgemini Financial Services Analysis, 2015; 2015 Retail Banking Voice of the Customer Survey, Capgemini Global Financial Services
Belgium
>> 0 >> 1 >> 2 >> 3 >> 4 >>
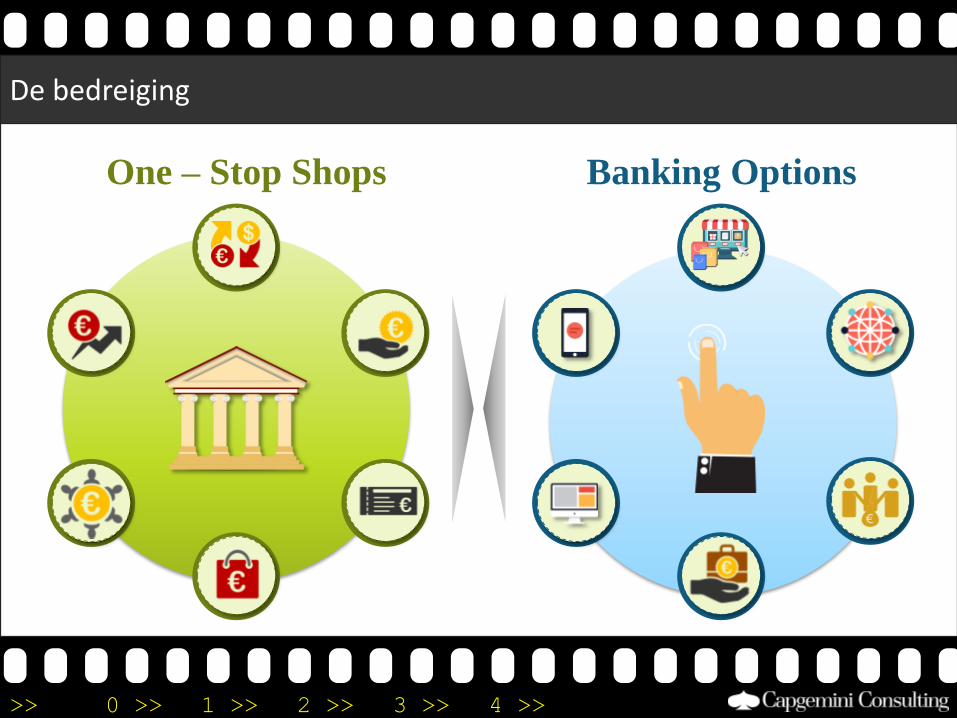
Banking Options
De bedreiging
One – Stop Shops
>> 0 >> 1 >> 2 >> 3 >> 4 >>
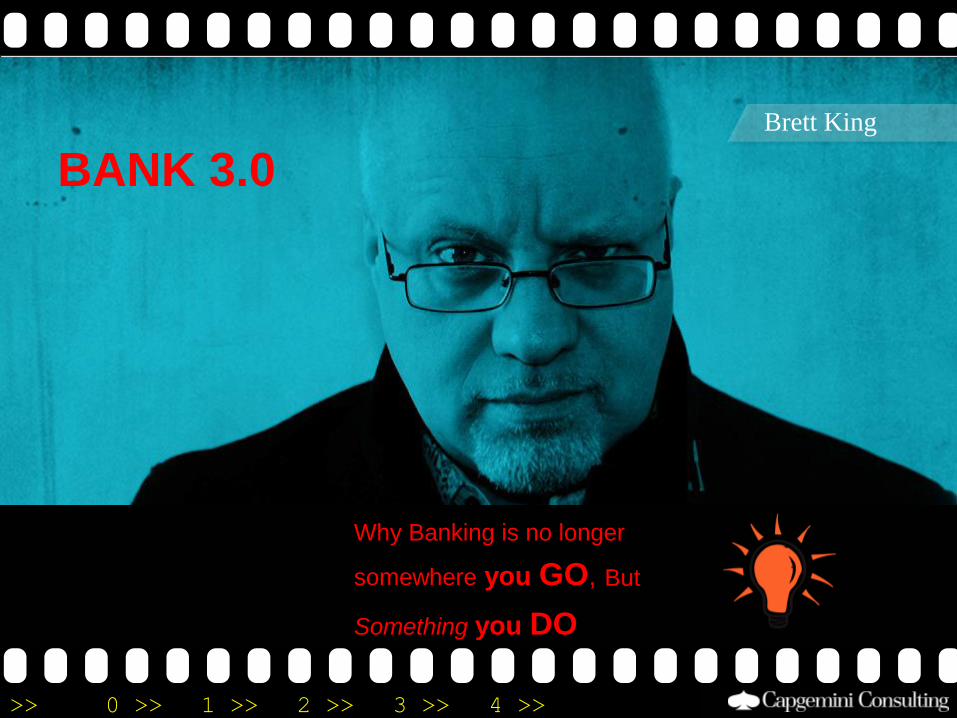
Brett King
BANK 3.0
Why Banking is no longer
somewhere you GO, But
Something you DO
>> 0 >> 1 >> 2 >> 3 >> 4 >>
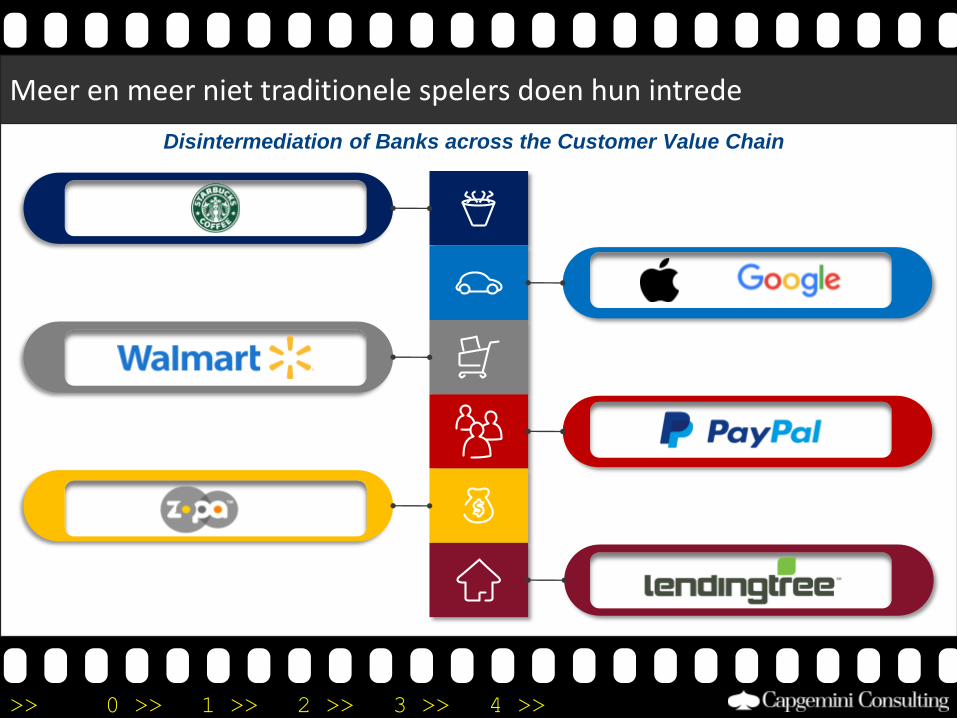
Meer en meer niet traditionele spelers doen hun intrede
Disintermediation of Banks across the Customer Value Chain
>> 0 >> 1 >> 2 >> 3 >> 4 >>
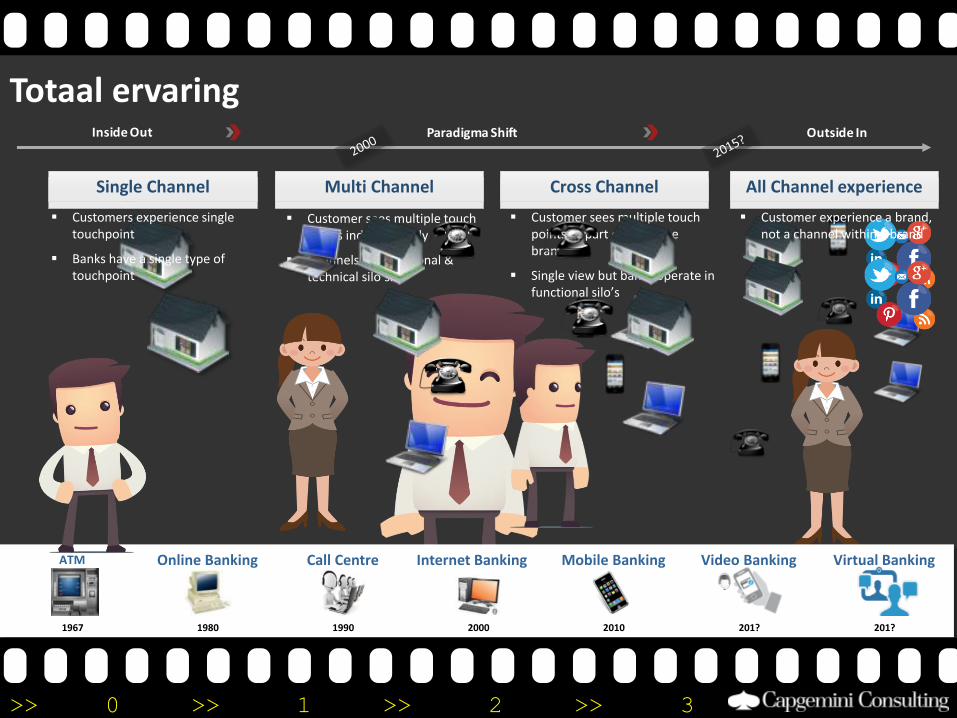
Customer sees multiple touch points as part of the same brand.
Single view but banks operate in functional silo’s
Customer sees multiple touch points independently
Channels are functional & technical silo’s.
Totaal ervaring
Single Channel Multi Channel Cross Channel All Channel experience
ATM Call CentreOnline Banking Internet Banking Video Banking Virtual BankingMobile Banking
1967 1980 1990 2000 201? 201?2010
Single Channel
Customers experience single touchpoint
Banks have a single type of touchpoint
Inside Out Paradigma Shift Outside InInside Out Paradigma Shift Outside InInside Out Paradigma Shift Outside In
Multi Channel Cross Channel All Channel experience
Customer experience a brand, not a channel within a brand
>> 0 >> 1 >> 2 >> 3 >> 4 >>
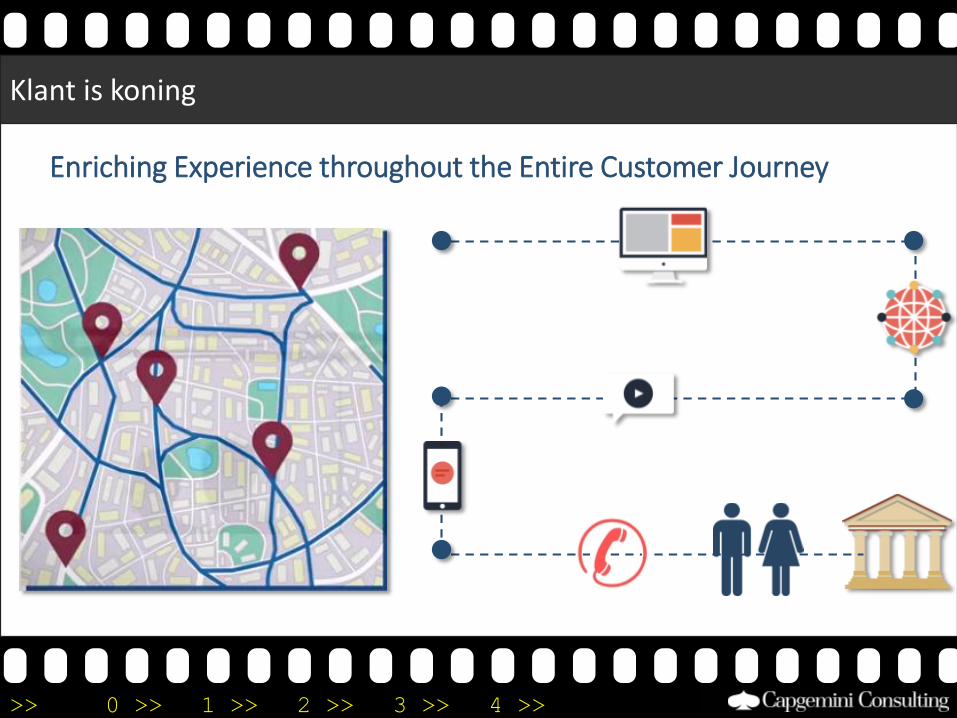
Klant is koning
Enriching Experience throughout the Entire Customer Journey
>> 0 >> 1 >> 2 >> 3 >> 4 >>
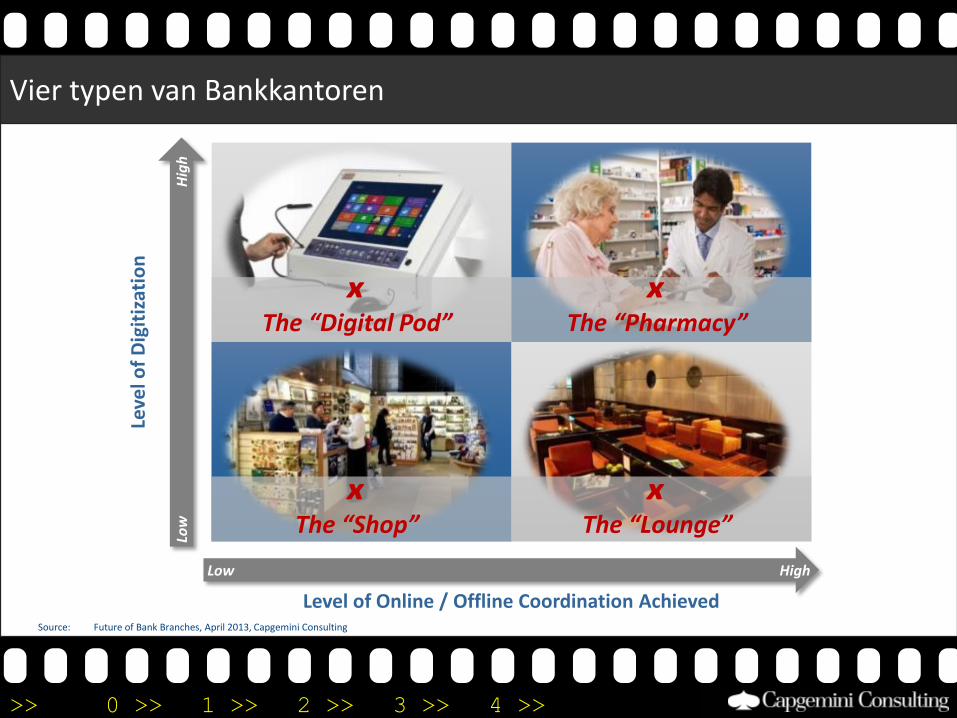
Source: Future of Bank Branches, April 2013, Capgemini Consulting
Leve
l of
Dig
itiz
atio
n
Hig
hLo
w
Low High
Level of Online / Offline Coordination Achieved
ₓThe “Shop”
ₓThe “Digital Pod”
ₓThe “Pharmacy”
ₓThe “Lounge”
Vier typen van Bankkantoren
>> 0 >> 1 >> 2 >> 3 >> 4 >>
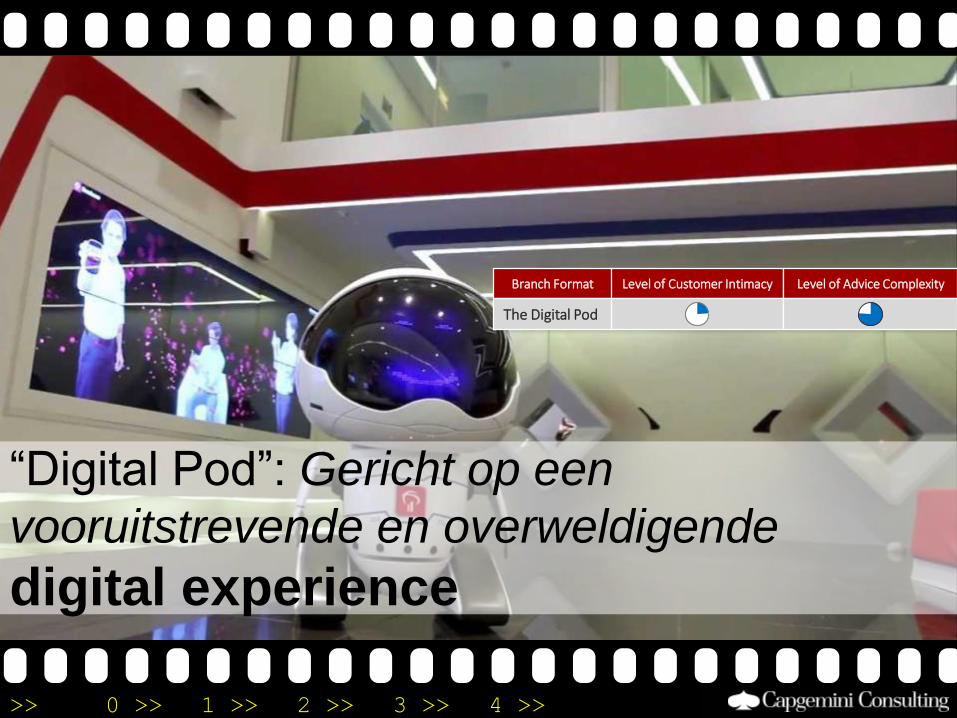
“Digital Pod”: Gericht op een
vooruitstrevende en overweldigende
digital experience
Level of Customer Intimacy Level of Advice ComplexityBranch Format
The Digital Pod
>> 0 >> 1 >> 2 >> 3 >> 4 >>
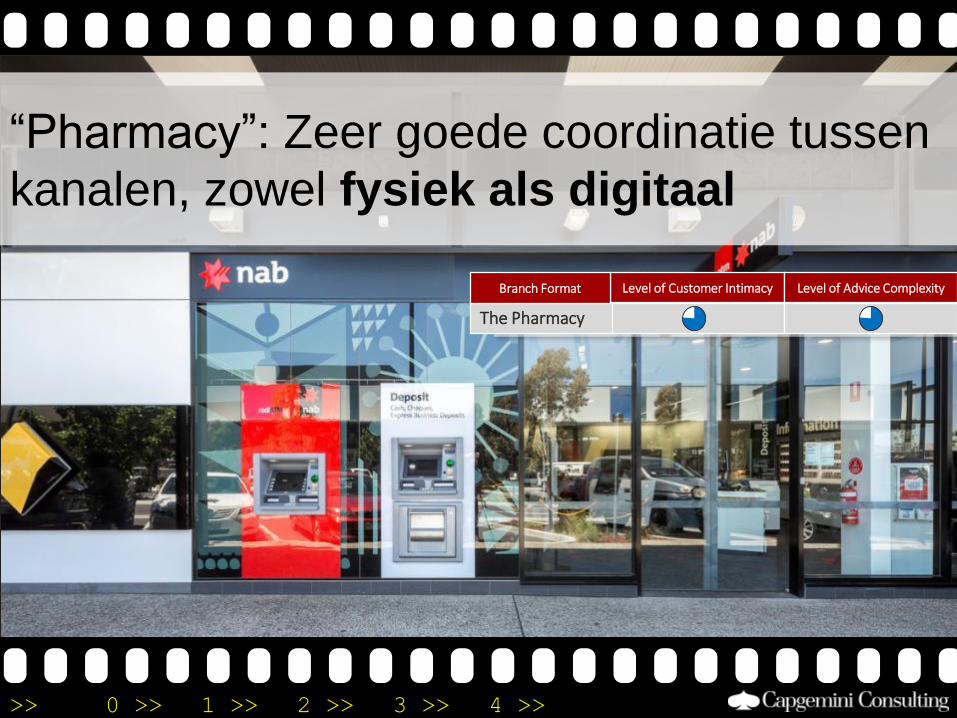
“Pharmacy”: Zeer goede coordinatie tussen
kanalen, zowel fysiek als digitaal
Level of Customer Intimacy Level of Advice Complexity
The Pharmacy
Branch Format

>> 0 >> 1 >> 2 >> 3 >> 4 >>
“Shop”: Ideaal voor studenten, nieuwe – en
bestaande klanten met standaard
behoeften
Level of Customer Intimacy Level of Advice ComplexityBranch Format
The Shop
>> 0 >> 1 >> 2 >> 3 >> 4 >>
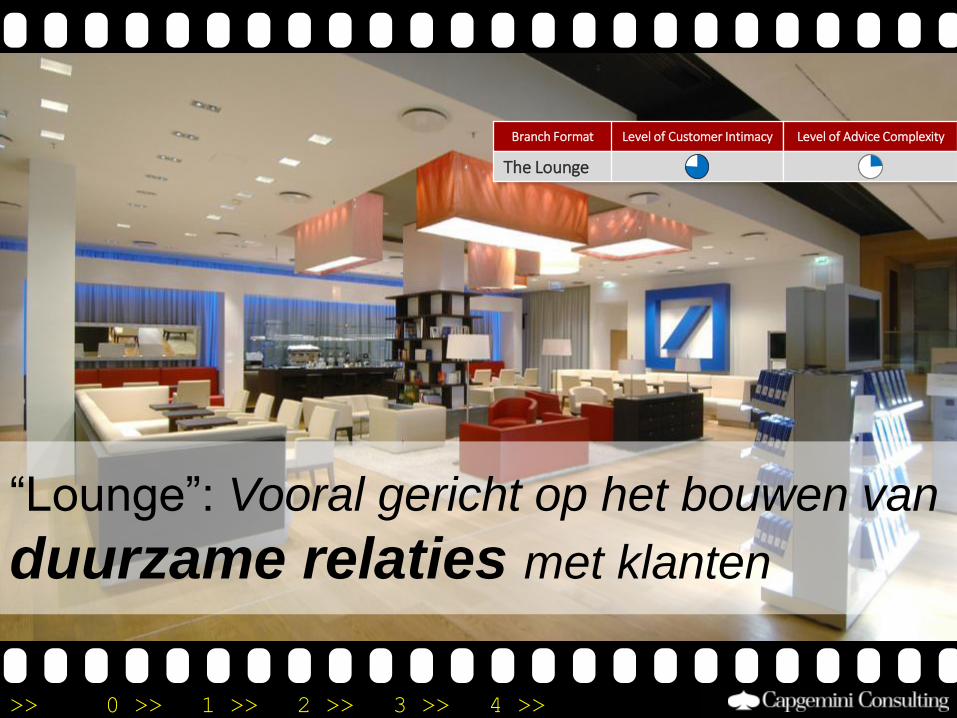
“Lounge”: Vooral gericht op het bouwen van
duurzame relaties met klanten
Level of Customer Intimacy Level of Advice ComplexityBranch Format
The Lounge
>> 0 >> 1 >> 2 >> 3 >> 4 >>
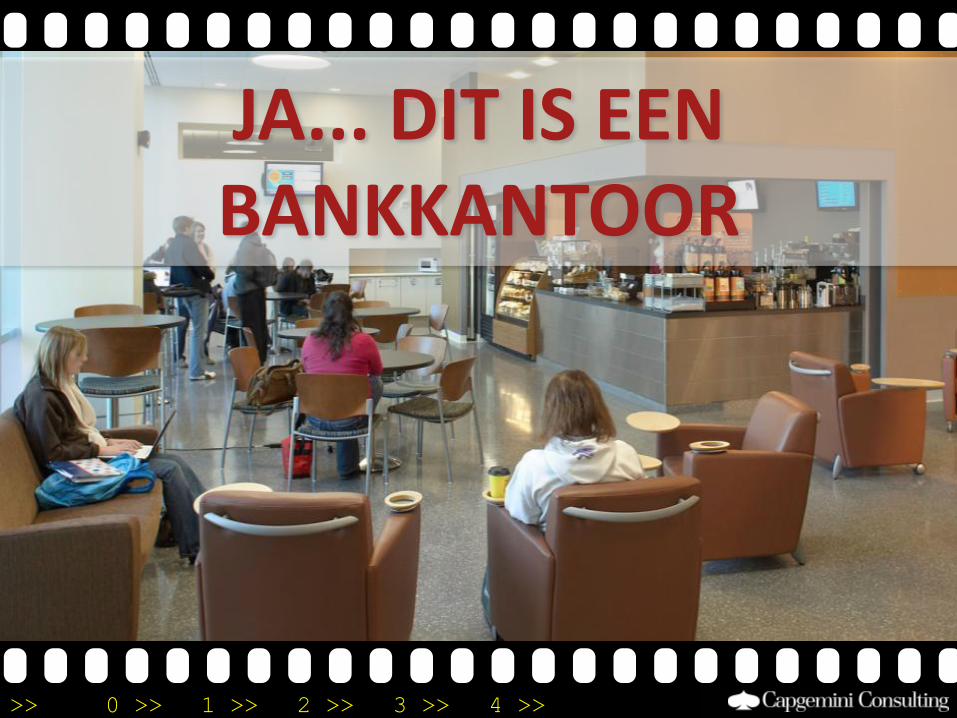
JA... DIT IS EEN BANKKANTOOR

>> 0 >> 1 >> 2 >> 3 >> 4 >>
May The
Force
Be With You


