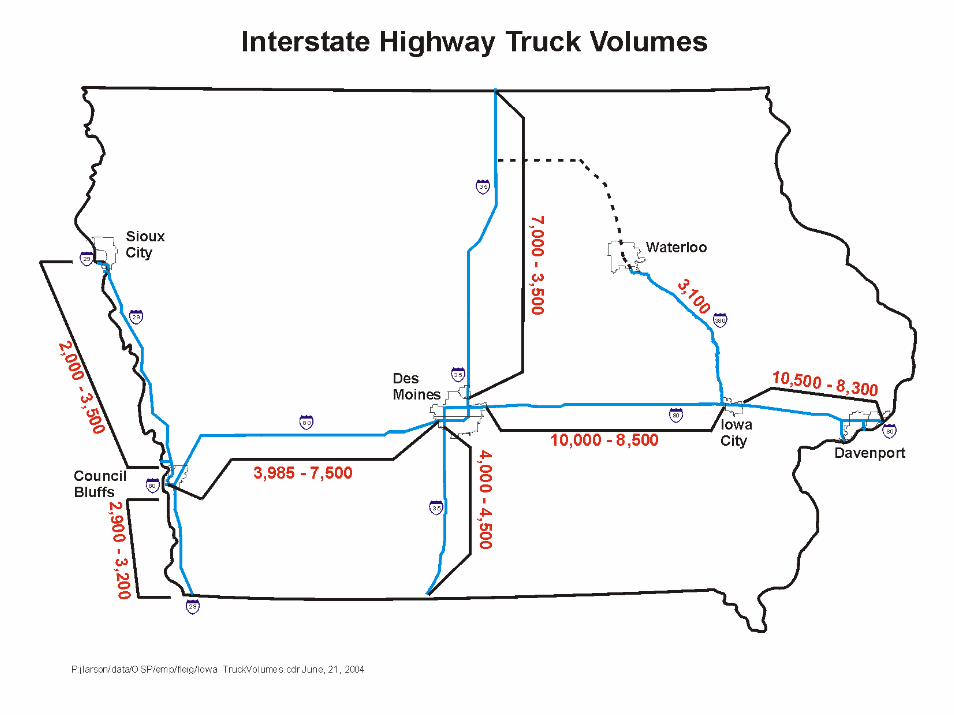
Interstate HighwayTruckVolumes
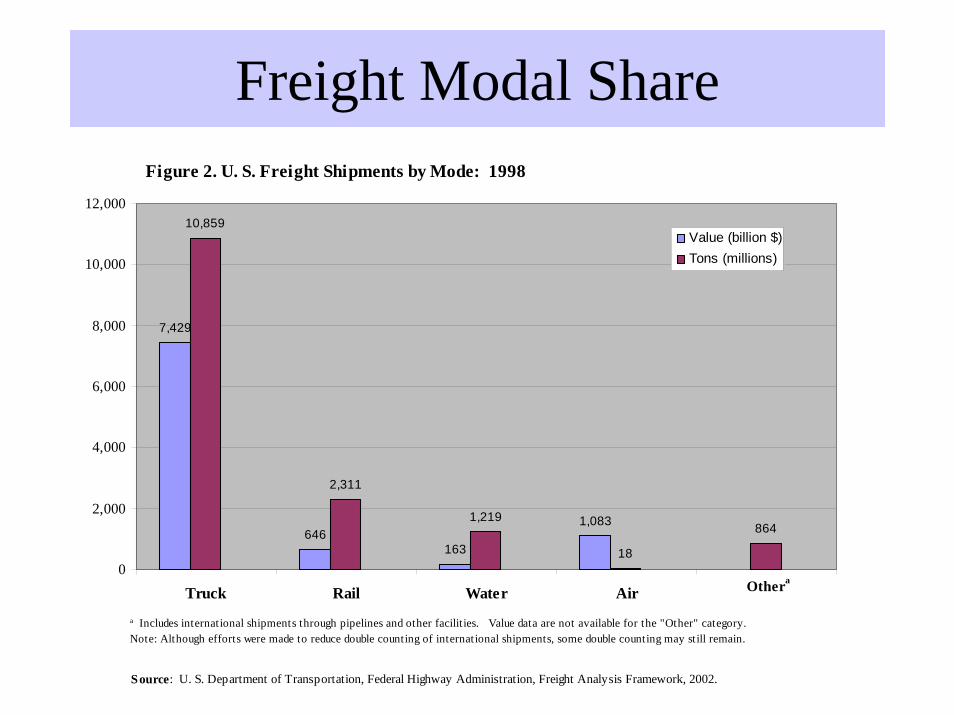
Freight Modal ShareFigure 2. U. S. Freight Shipments by Mode: 1998
7,429
646163
1,083
10,859
2,311
1,219
18
864
0
2,000
4,000
6,000
8,000
10,000
12,000
Truck Rail Water Air
Value (billion $)Tons (millions)
Source: U. S. Department of Transportation, Federal Highway Administration, Freight Analysis Framework, 2002.
Othera
a Includes international shipments through pipelines and other facilit ies. Value data are not available for the "Other" category.Note: Although efforts were made to reduce double counting of international shipments, some double counting may still remain.
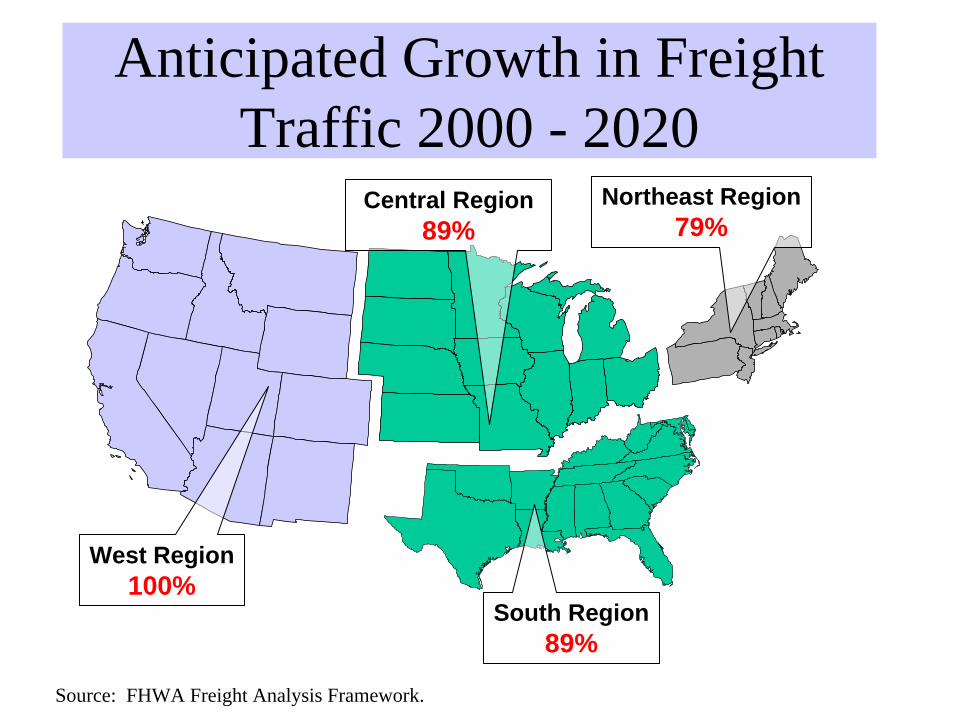
Anticipated Growth in Freight Traffic 2000 - 2020
South Region89%
Northeast Region79%
Central Region89%
West Region100%
Source: FHWA Freight Analysis Framework.
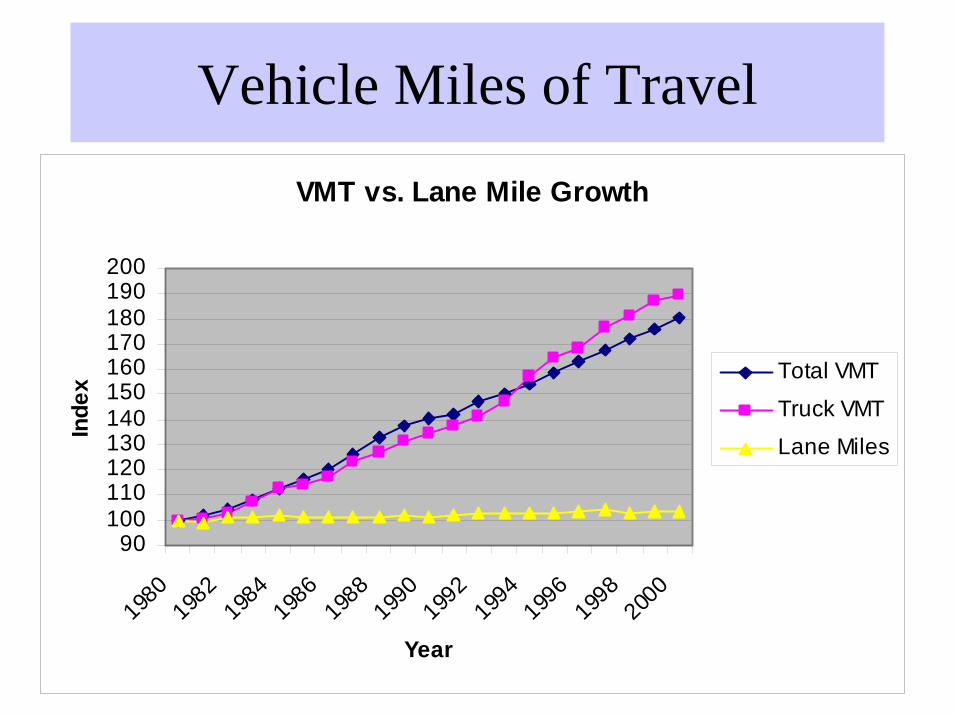
Vehicle Miles of Travel
VMT vs. Lane Mile Growth
90100110120130140150160170180190200
1980
1982
1984
1986
1988
1990
1992
1994
1996
1998
2000
Year
Inde
x Total VMT
Truck VMT
Lane Miles
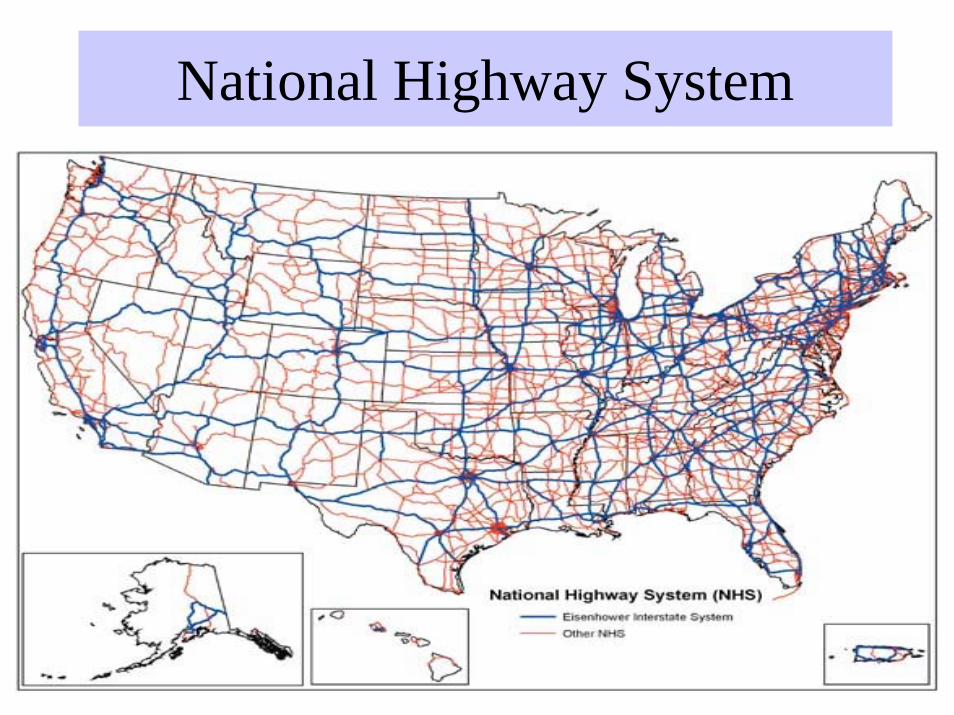
National Highway System
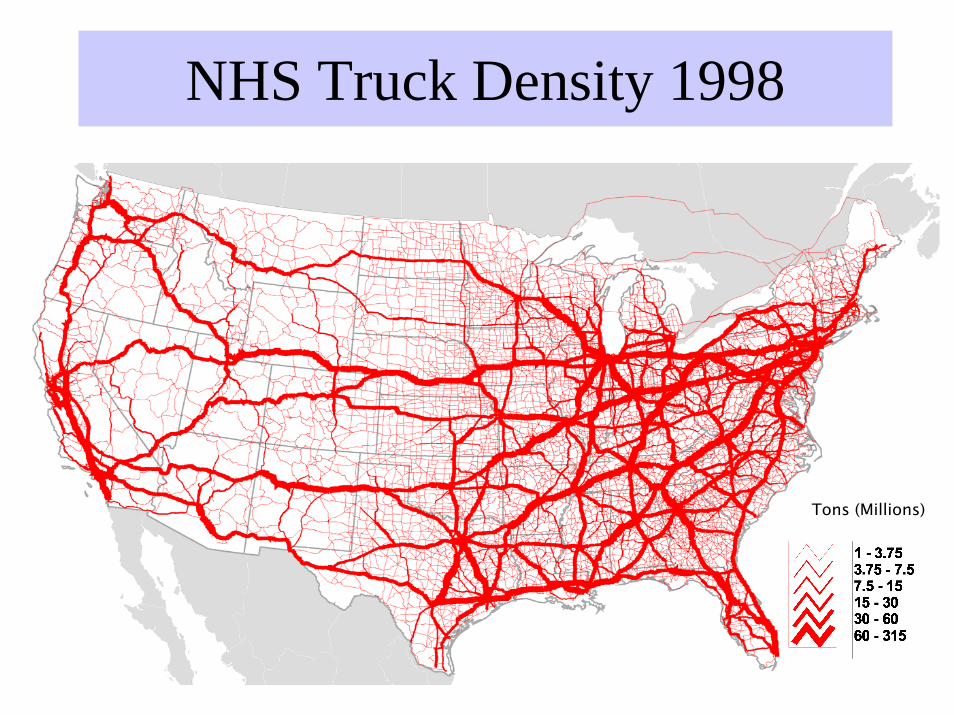
NHS Truck Density 1998
Tons (Millions)
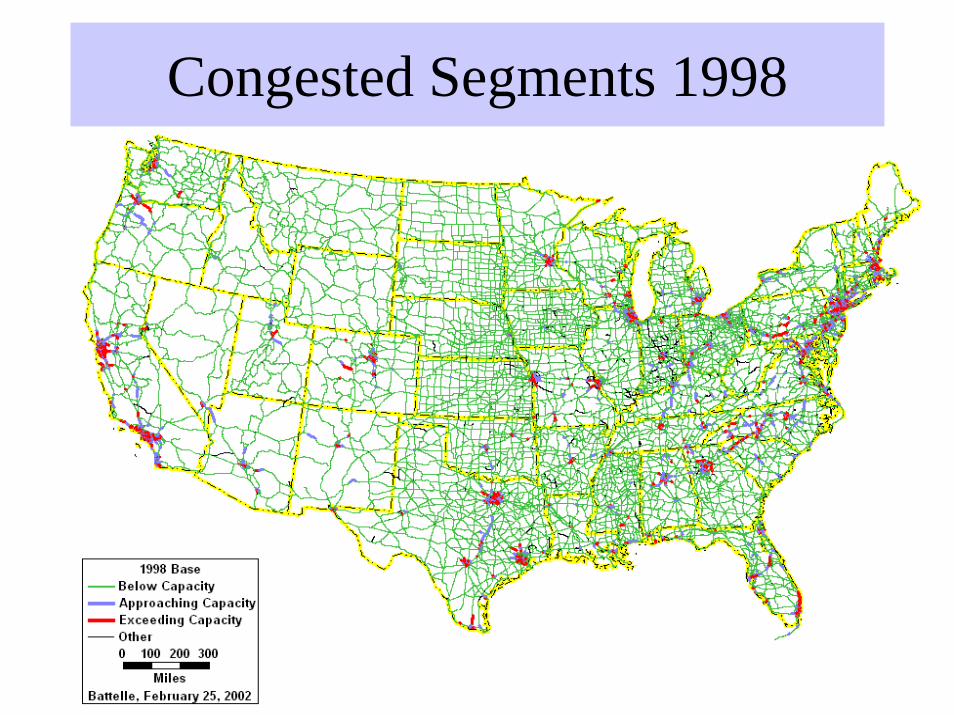
Congested Segments 1998
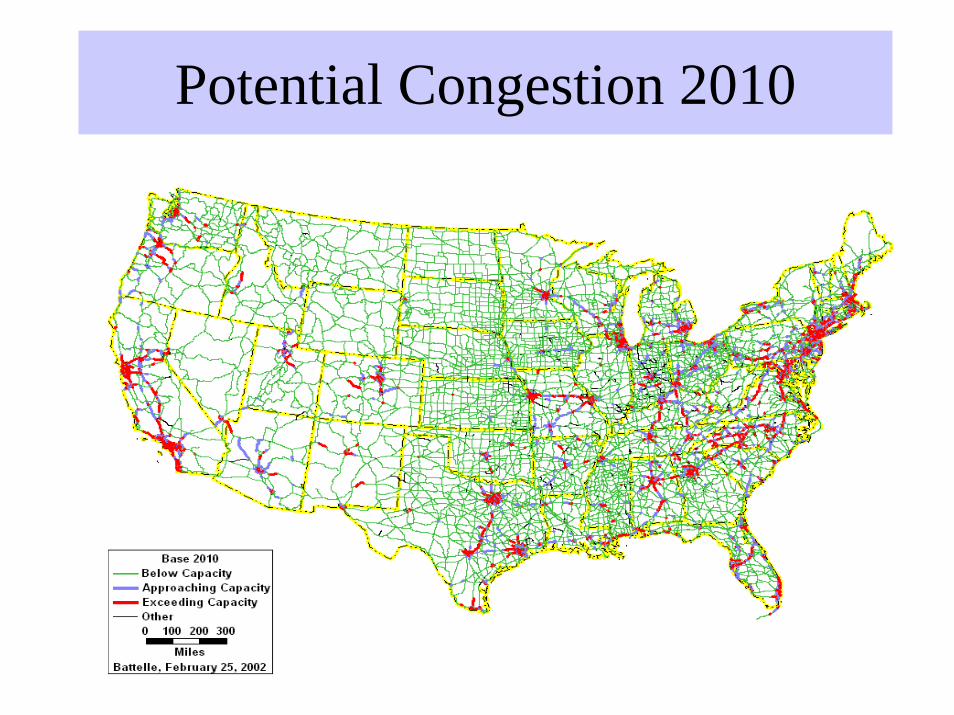
Potential Congestion 2010
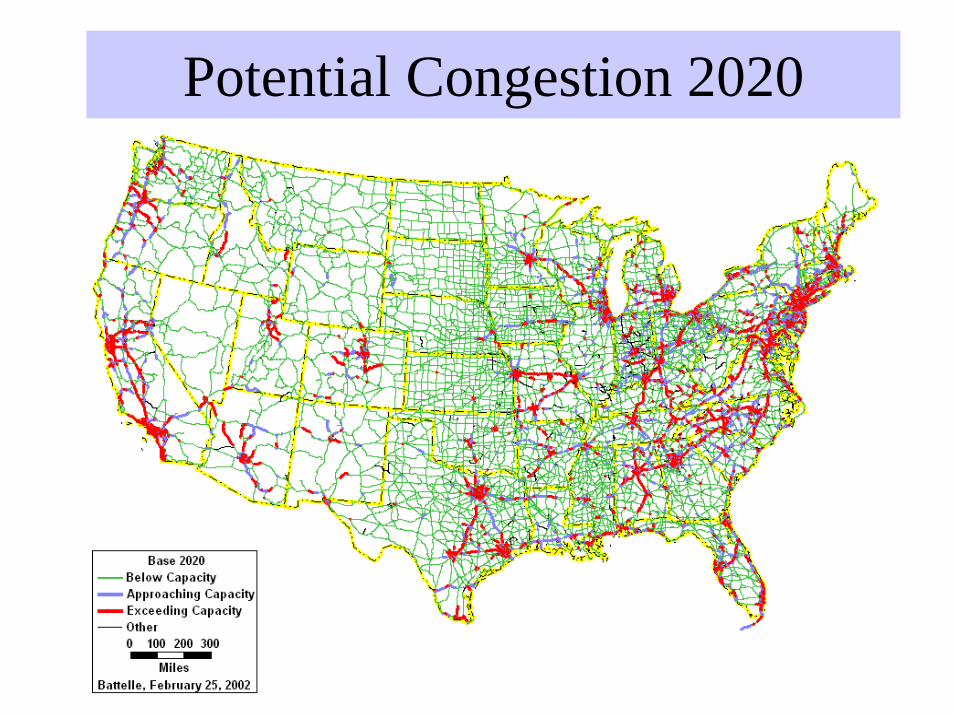
Potential Congestion 2020
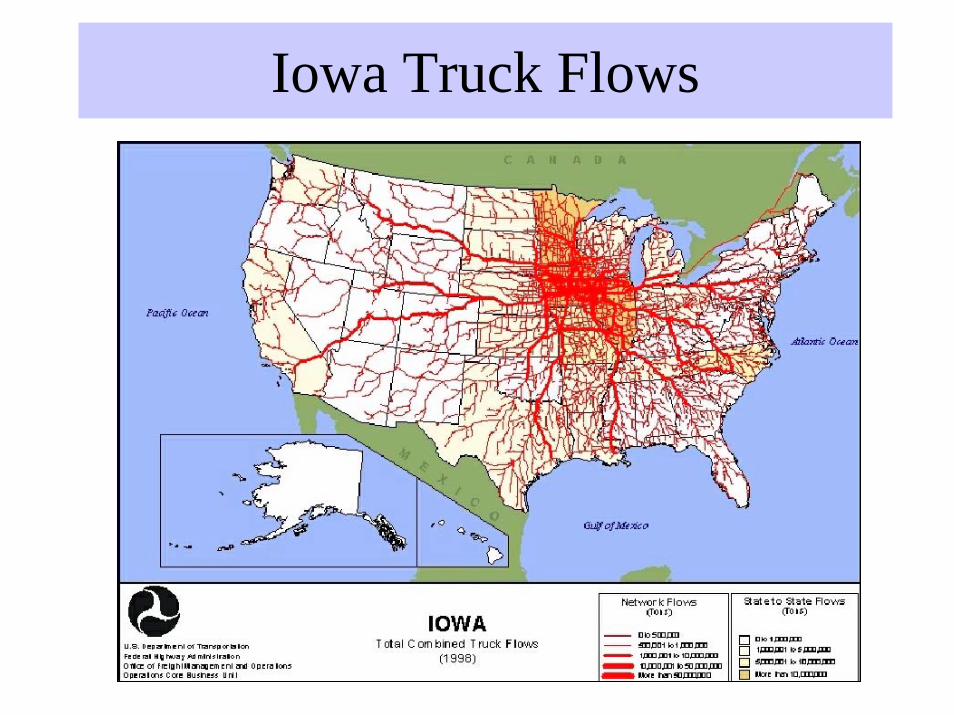
Iowa Truck Flows
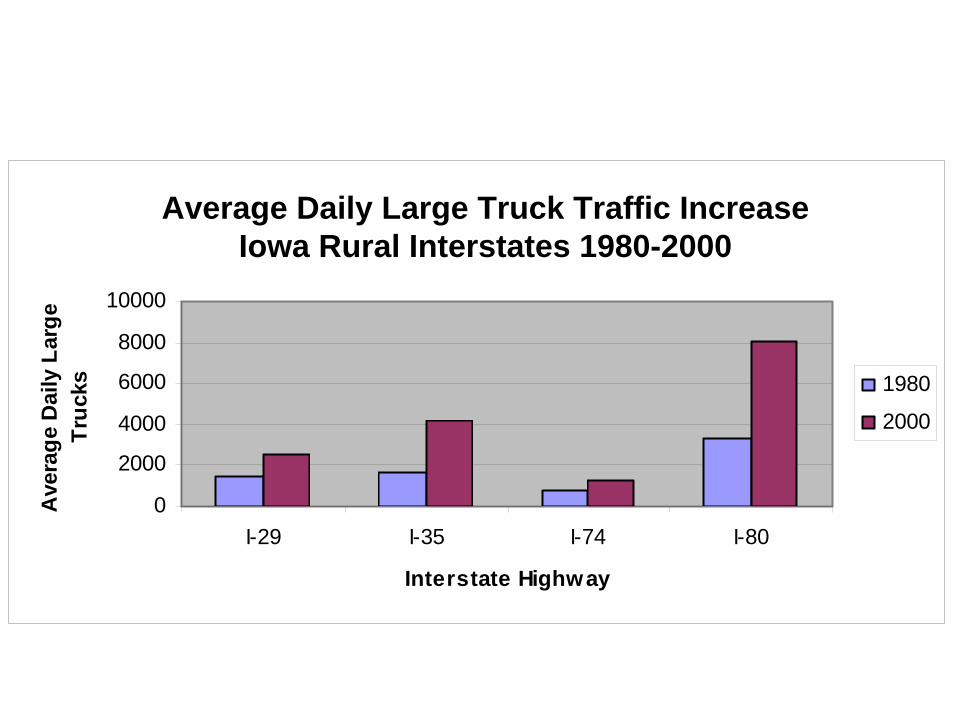
Average Daily Large Truck Trafic IncreaseIowa Rural Interstates 1980-2000
0
2000
4000
6000
8000
10000
I-29 I-35 I-74 I-80
Interstate Highway
Ave
rage
Dai
ly L
arge
Tr
ucks 1980
2000
Average Daily Large Truck Traffic IncreaseIowa Rural Interstates 1980-2000
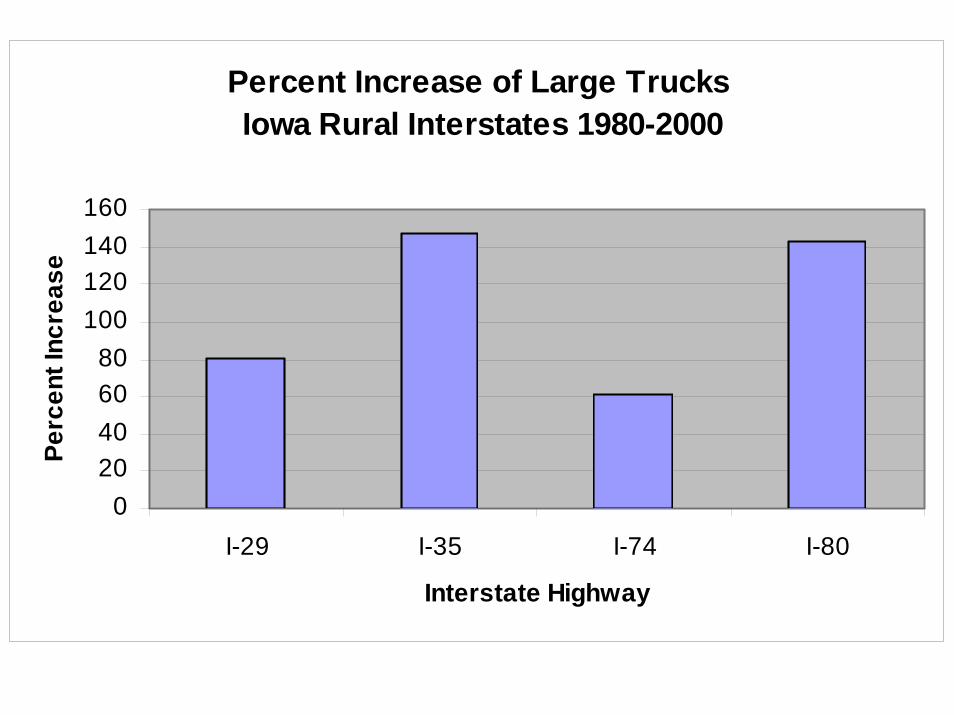
Percent Increase of Large Trucks Iowa Rural Interstates 1980-2000
020406080
100120140160
I-29 I-35 I-74 I-80
Interstate Highway
Perc
ent I
ncre
ase
Source: American Trucking AssociationsSource: American Trucking Associations
55
75
95
115
135
155
175Ja
n-85
Jan-
86Ja
n-87
Jan-
88Ja
n-89
Jan-
90Ja
n-91
Jan-
92Ja
n-93
Jan-
94Ja
n-95
Jan-
96Ja
n-97
Jan-
98Ja
n-99
Jan-
00Ja
n-01
Jan-
02Ja
n-03
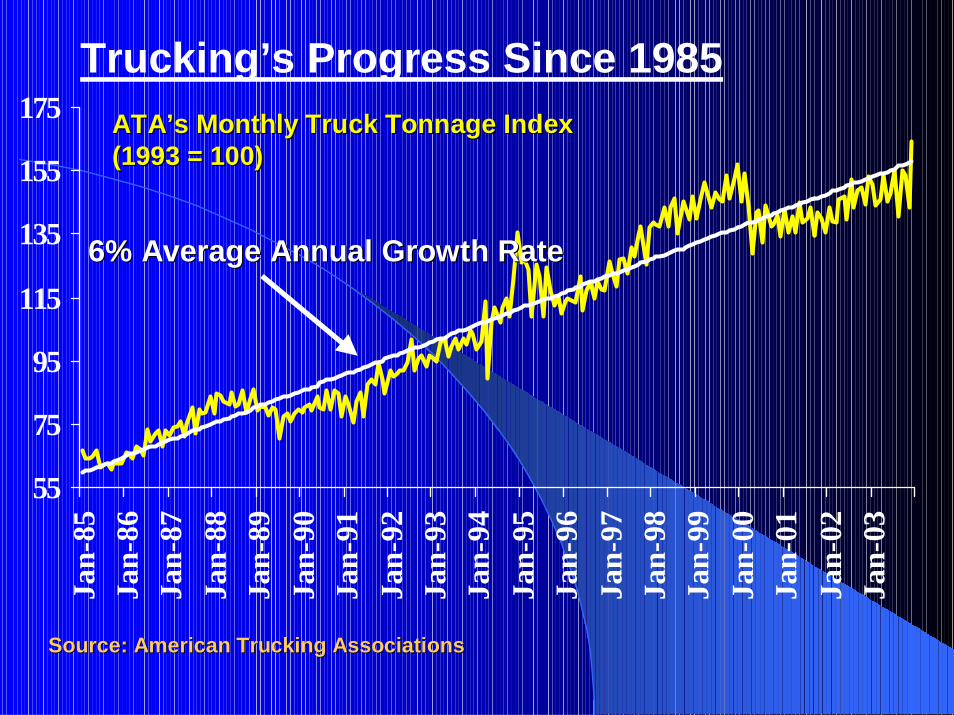
Trucking’s Progress Since 1985
6% Average Annual Growth Rate6% Average Annual Growth Rate
ATA’sATA’s Monthly Truck Tonnage IndexMonthly Truck Tonnage Index(1993 = 100)(1993 = 100)
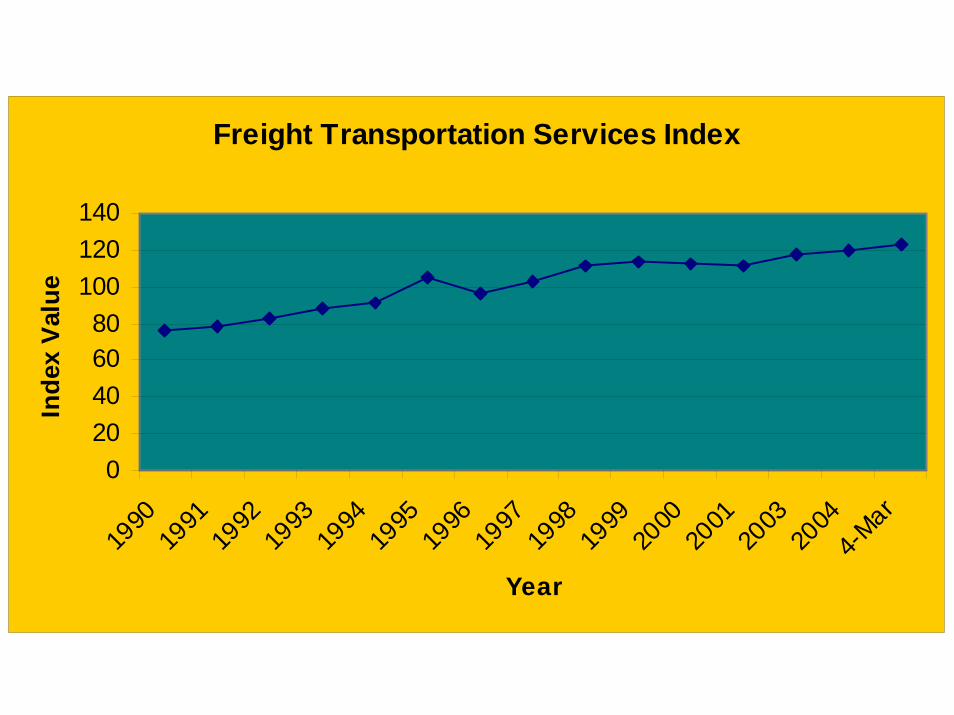
Freight Transportation Services Index
020406080
100120140
1990
1991
1992
1993
1994
1995
1996
1997
1998
1999
2000
2001
2003
2004
4-Mar
Year
Inde
x Va
lue
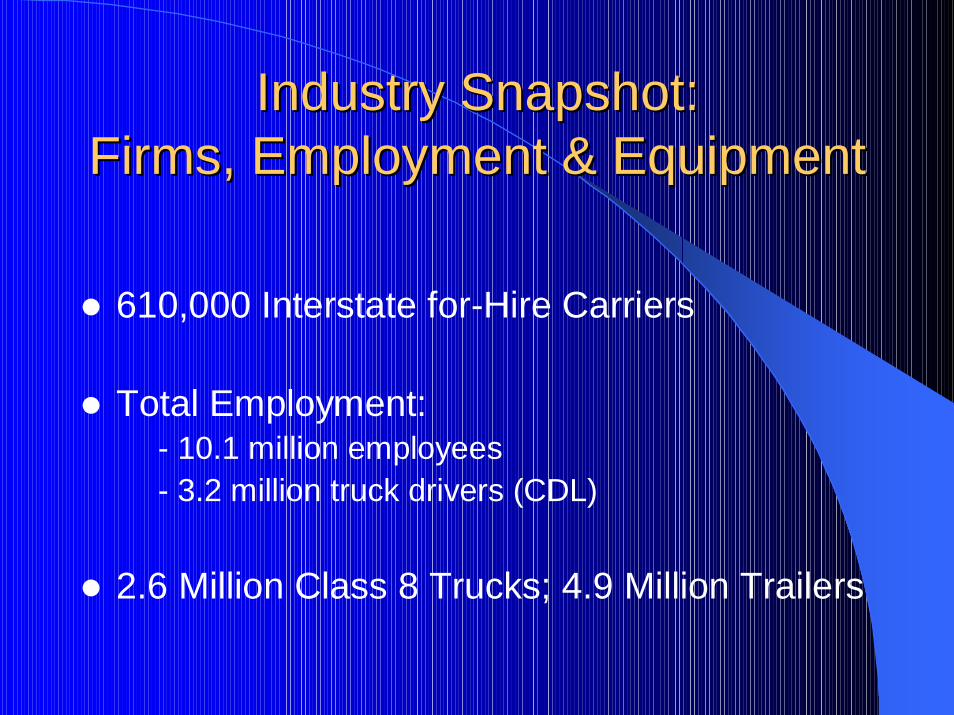
Industry Snapshot:Industry Snapshot:Firms, Employment & EquipmentFirms, Employment & Equipment
610,000 Interstate for-Hire Carriers
Total Employment:- 10.1 million employees- 3.2 million truck drivers (CDL)
2.6 Million Class 8 Trucks; 4.9 Million Trailers
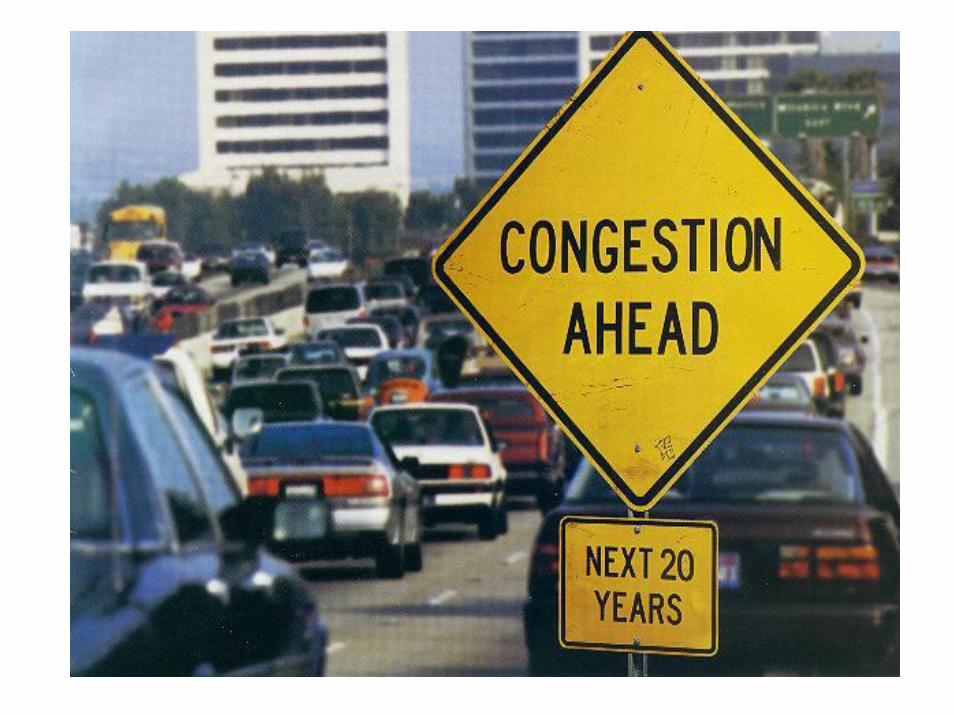
6/18/2004 16
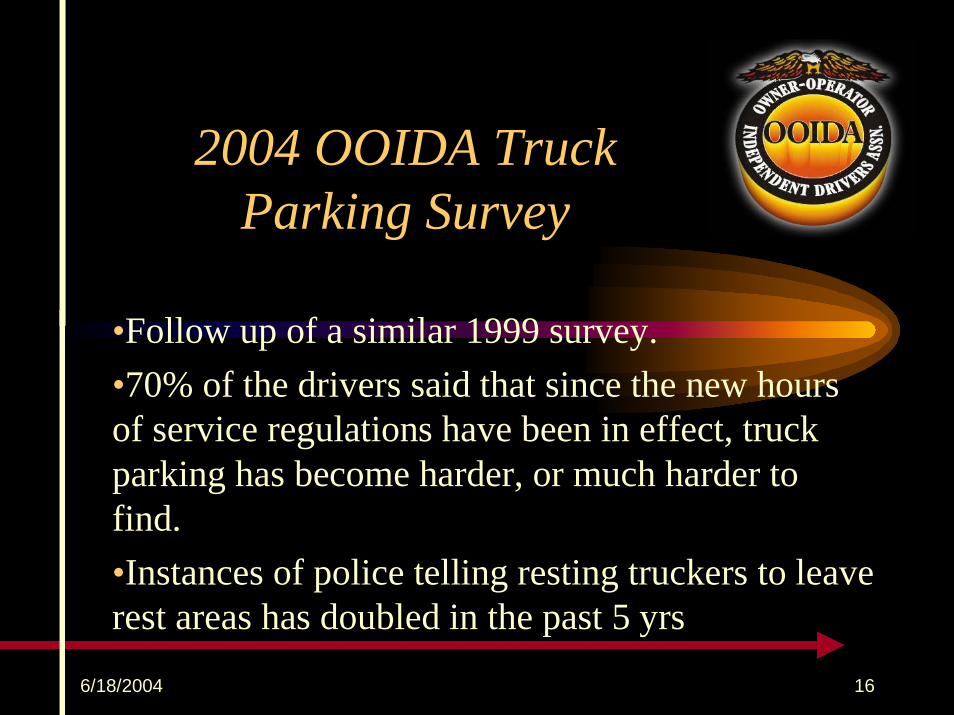
2004 OOIDA Truck Parking Survey
•Follow up of a similar 1999 survey.•70% of the drivers said that since the new hours of service regulations have been in effect, truck parking has become harder, or much harder to find.•Instances of police telling resting truckers to leave rest areas has doubled in the past 5 yrs
6/18/2004 17
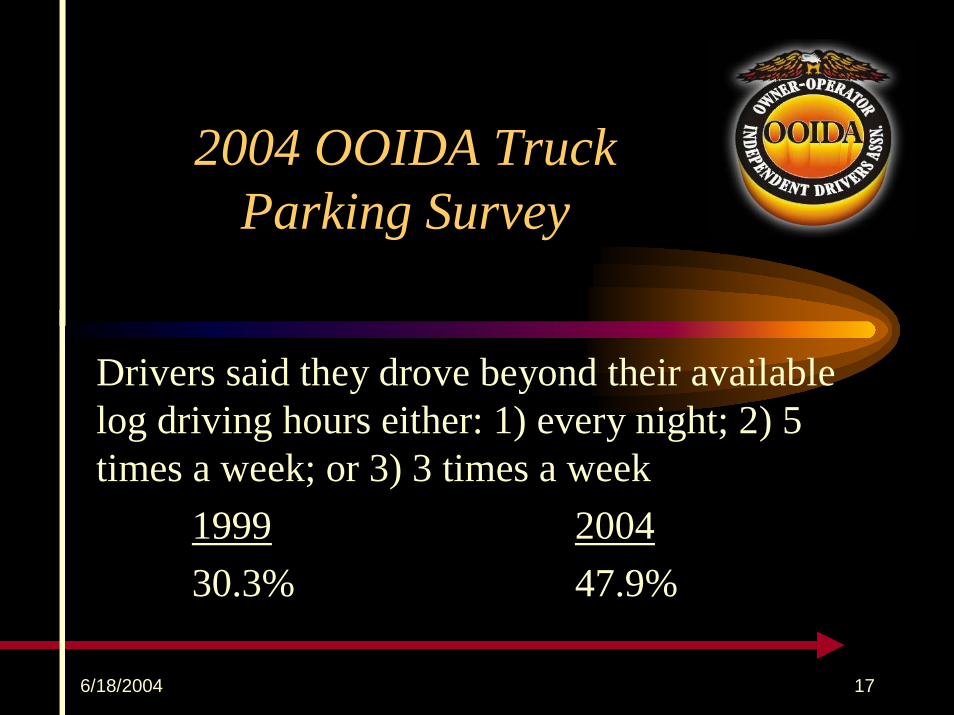
2004 OOIDA Truck Parking Survey
Drivers said they drove beyond their available log driving hours either: 1) every night; 2) 5 times a week; or 3) 3 times a week
1999 200430.3% 47.9%
6/18/2004 18
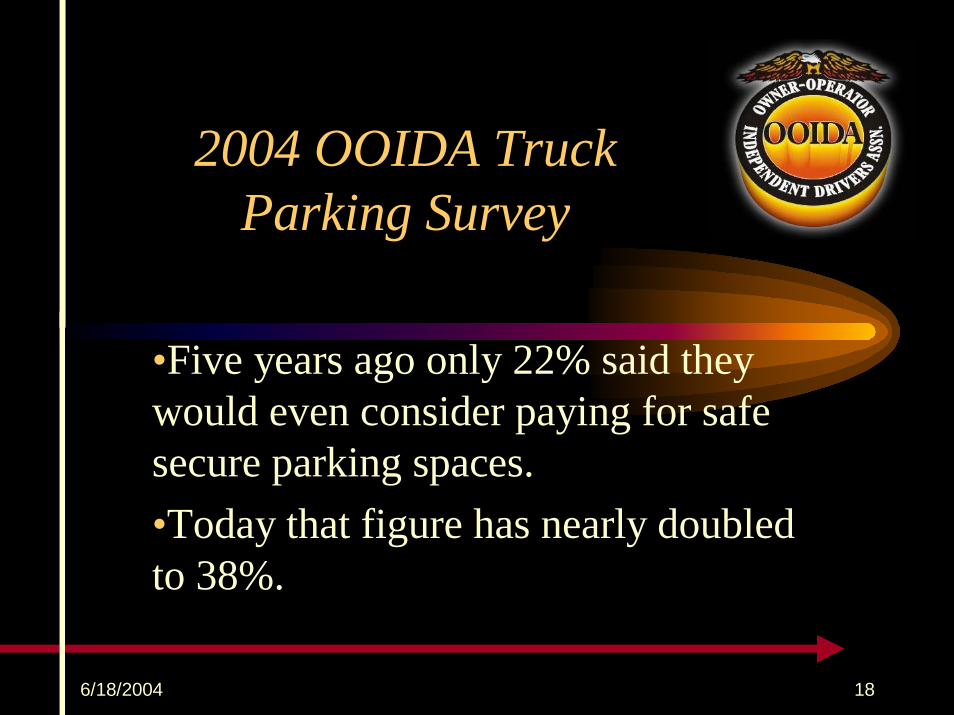
2004 OOIDA Truck Parking Survey
•Five years ago only 22% said they would even consider paying for safe secure parking spaces.•Today that figure has nearly doubled to 38%.
http://www.ops.fhwa.dot.gov/freight/index.cfm
FHWA Office of Freight Management and Operations


