Computers & Geoseiences Vol. 19, No. 2, pp. 141-147, 1993 0098-3004/93 $6.00 + 0.00 Printed in Great Britain. All rights reserved Copyright ~':, 1993 Pergamon Press Ltd
INTERACTIVE AND SEMIAUTOMATIC DATA-ANALYSIS PROCEDURES
M. MUSlL Geophysical Institute, Czechoslovak Academy of Science, 141 31 Prague, Czechoslovakia
Abstract--A 'C' computer program for interactive and semiautomatic processing of digital signals in seismology is presented. The program enables the detection of seismic wave groups of all types, semi- automatic reading of amplitudes and periods, preprocessing of signal, and fundamental semiautomatic frequency, polarization and Complex Seismic Trace analysis.
Emphasis is put on the universality and easy orientation in the processed seismograms. The program enables the analyst to work effectively with continuous or triggered signals from a higher number of multichannel seismic stations. It is appropriate for both small and large data sets.
The advantages of the combination of interactive and automatic data-processing procedures are demonstrated.
Key Words: Interactive and semiautomatic analysis, Polarization, Complex Seismic Trace analysis.
INTRODUCTION taneous plotting of the motion in all three basic
EVENT was developed as a PC program for planes togetherwithautomat iccomputat ionofpolar- ization parameters by the method of eigenvectors. interactive and semiautomatic analyses of digital
seismological data of any length. Its fundamental Complex seismic trace analysis enables the analyst procedures make use of parts of the VISUAL pro- to monitor the phase properties of selected portions gram developed by the Lennartz Electronic GmbH of the signal. The analytic signal is computed and
visualized in the complex space, together with its (1986). With EVENT, however, it is possible to do more efficient and complete first interpretation of envelope and instantaneous frequency.
digital seismograms. Particle motion analysis EVENT can be used for the interpretation of
The seismic wave field is a superposition of many multichannel data from single stations as well as from networks. Data in ASCII or ESSTF formats overlapping wave groups with different polarization.
For full analysis and interpretation, it is essential to can be processed. All the data handling procedures use sequential reading of small data blocks. A Menu separate and identify these waves.
Given the seismograms Xz(t),Xn(t),Xe(t ) of a enables the analyst to select a variety of data analysis procedures: three-component station recording in the right-
handed vertical~east-north system with the basis --interactive determination of onset times vectors {ez, e,, ee}, the three orthogonal p!anes of --semiautomatic evaluation of amplitudes and projection can be defined by taking the basis vectors
periods of selected wavegroups as the normal vectors. The axes can be rotated to --seismogram integration and frequency filtering other orthogonal systems. One of most widely used is ---causal restoration of the true ground motion the local wave coordinate system, defined as (L) - - ro ta t ion of seismograms longitudinal, (T) transverse and (Q), which is orthog- - -advanced particle motion analysis onal to L and T. Longitudinal axis is defined as --spectrum analysis direction of wave propagation, T is the orthogonal -----complex seismic trace analysis (processing of axis in the horizontal plane and Q is the orthogonal
analytic signals), axis in the vertical plane. In isotropic media the particle motion of a P-wave The semiautomatic procedures consist of fast auto-
matic estimation of seismological parameters and of has its largest principal axis oriented in the direction their interactive correction, of propagation. We can define this direction by two
angles: (i) incidence angle measured from the normal to the horizontal plane and (a) back-azimuth, which SPECIAL PROCEDURES is measured from station to epicentre. We can deter-
In this section we focus on several special features mine (i) and (a) interactively from orthogonal planes of EVENT with great potential for aiding the seismic of projection, or compute them automatically. analyst as well as the research seismologist. Three- The basic method for automatic determination of dimensional particle motion analysis involves simul- rectilinearity and direction of particle motion was
141
142 M. MUSIL
e u e n t : U O 0 1 8 ~ - 0 1 - 0 7 f r a a e : 1 d e e : I a z i e ~ u t h = 6 9 i n c i d e n c e : 14
P A R T I C L E l l O T I O H P A R T I C L E M O T I O N P A R T I C L E M O T I O N CHAH: 2 / 0
I ! ! I ! I ! I
2 ~ U a C . . . . . . . i-
N l I I I
',pc
11 1 U J l 2
z
S G
~ a c
E
I ] I I 1 17: 3 5 : O~ 1 7 1 3 S : O~
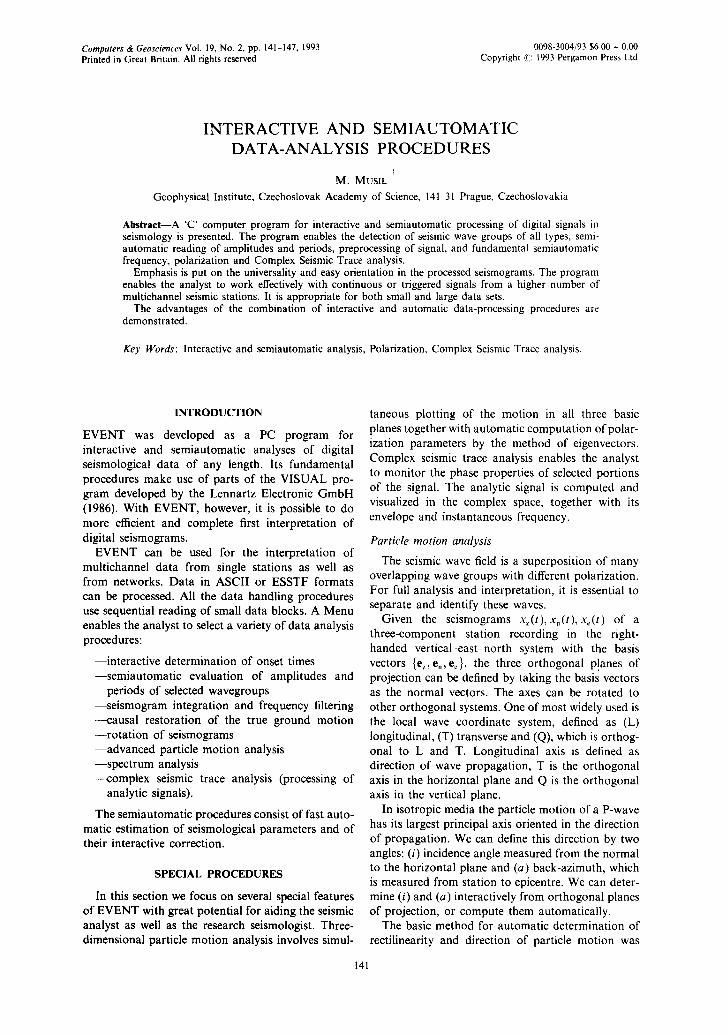
Figure I. Three-component particle motion analysis of Pg onset at station VAC. Azimuth (69 °) and incidence angle (14 c') were determined automatically and confirmed interactively. Azimuth was depicted in right projection (axis N, E) and incidence angle in left rotated projection (axis Z, R). R is axis situated in horizontal plane in direction of wave propagation and T is orthogonal. Seismogram is in first data block
(frame: 1) and without decimation (dec: 1).
presented first and discussed by Flinn (1965). This The connection between visual graphics-oriented well-known algorithm depends on computation of and faster automatic processing makes it possible to eigenvalues and eigenvectors of the positive semi- take advantages of these different approacl~es and, definite covariance matric C (3 x 3). C is computed for example to calculate corrections for free surface for a set of N points of the three orthogonal records, conversion ((~erven), Molotkov, and Pgen~ik, 1977; The direction of the principal axis of polarization Evans 1984). then is determined with the eigenvector correspond- Figures 1-4 show semiautomatic interpretation ing to the largest eigenvalue. Unfortunately, this steps for a local seismic event. The presented seismo- method works well only for seismograms with high gram of ground velocity was selected from the signal to noise ratio and for nearly linearly polarized catalogue of seismic events in Western Bohemia waves. 1985/1986 (Kolfi~ and Vavry6uk, 1990). The event
Some modifications make it possible to compute was recorded at the local seismic stations Vackov and and handle the elliptical component of polarization Tisov~t on 7 January 1986. by the use of the analytic signal (Vidale, 1986), but Local seismic events exhibit a complex time history especially for local seismic events (which give more of their polarization which, in comparison with tele- complicated polarization diagrams) there is consider- seisms, is influenced by inhomogeneities of the local able danger of misinterpretation. One effective way of structure and expressively elliptic. The changes of the reducing this danger consists in combining interactive polarization properties occur already in time intervals and automatic processing of digital data. shorter than the predominant wavelength of the
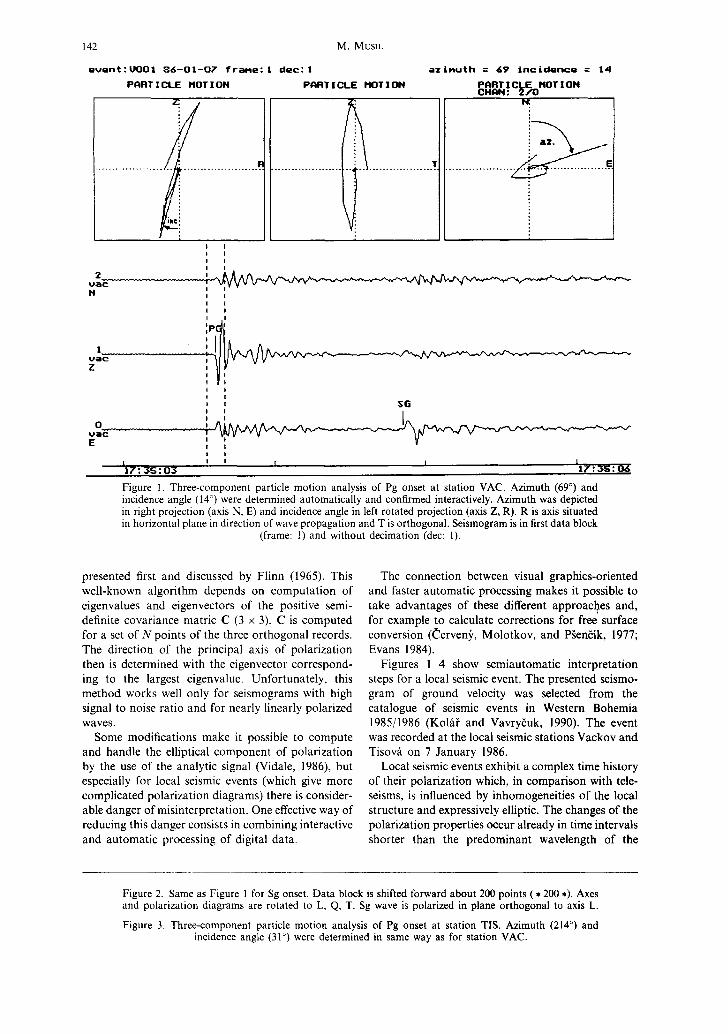
Figure 2. Same as Figure 1 for Sg onset. Data block is shifted forward about 200 points ( * 200 *). Axes and polarization diagrams are rotated to L, Q, T. Sg wave is polarized in plane orthogonal to axis L.
Figure 3. Three-component particle motion analysis of Pg onset at station TIS. Azimuth (214 °) and incidence angle (31 °) were determined in same way as for station VAC.
Interactive and semiautomatic data-analysis procedures 143
e v e n t l U O 0 1 8 6 - 0 1 - 0 7 f r a m e : 1 d e e : I t t 2 O O N '~ A C T U A L T I M E : 1 7 : 3 5 : 0 4 . 9 S 3
P R R T I C L E MOT I OH P R R T l C L E HOT I OH P R R T l C U E HOT I OH CHRH : 1 / 2 CHCiH : $ / 0 CHCtH : 2 , , "0
L: L: T:
l
, |
I I i I I I I
.
L i i i i
~ G
I I 0 ,
rl
i 1 17: 3 5 : 0 5 t 7 : 3 5 : 0 ~
Figure 2. (Caption on previous page).
e v e n t : T O 0 1 8 6 - 0 1 - 0 7 f r a m e : l d e c : l a z i m u t h = 2 1 4 i n c i d e n c e : 3 1
P A R T 1 C L E MOT ] 01t P A R T I C L E I10T I ON P A R T 1 C L E I10T 1 ON CHAN : 1 / 2
7, 7: I~
: . . . . . . . . . . . . . . . . . . . . . . . . . . . . . . . . . . . t . E
inc. i
i I I S l ~ 2
I I I
' $ I S 2 i
I
I
z I ,,, t I I I I
| 7 : 3 S : O S | 7 : 3 S : 0 8
F i g u r e 3. ( C a p t i o n on p r e v i o u s p a g e ) .
144 M. MUSIL
e v e n t : T O O 1 8 6 - 0 1 - 0 7 f r a e ~ e : l dem: I N2OON ACTUAL T I M E : 1 7 : : 3 S : 0 ~ . 9 6 ~
PART I CLE HOT 1 011 PART l CLE HOT I ON PART l CLE HOT I OH CHAH: 0 / ' 1 CI-kletl1:0,/2 CHAH: I / 2
7" I : K
I I
I I
t i E
I I I I
:s, s~ I I
,I H
I I I
s
t z
I I
I ! I I I I I 1 7 : . ~ ; : O& 1 7 : 3 S : tO
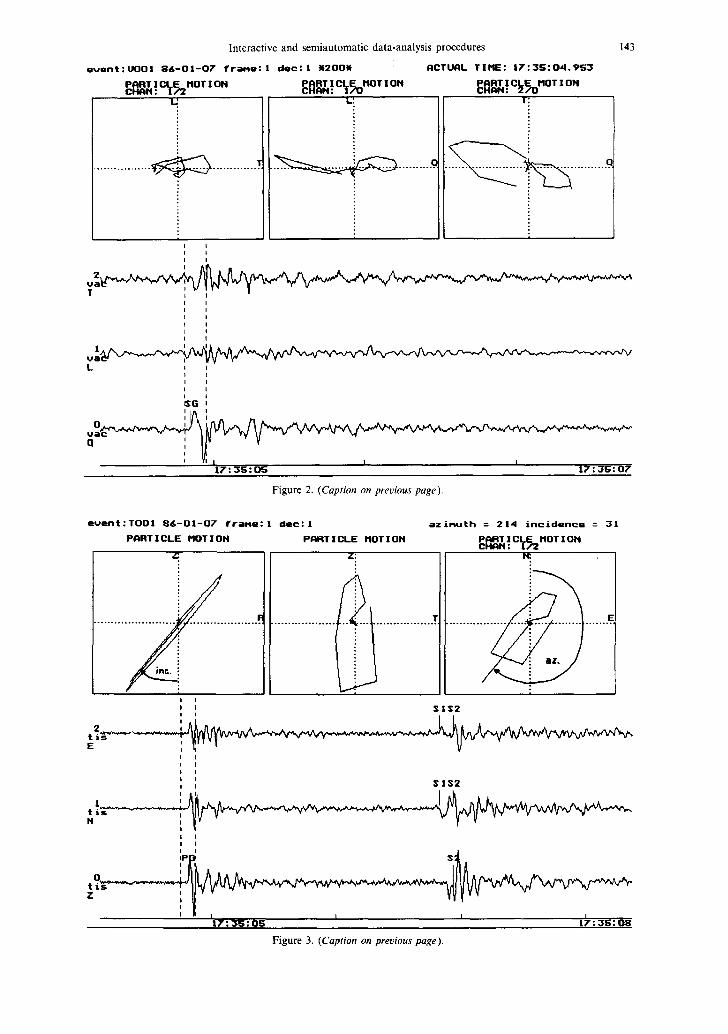
Figure 4. Same as Figure 3 for S1 and $2 onsets. S1 and $2 polarization projections are mutually approximately orthogonal and parallel to axis of effective anisotropy.
investigated signal. This complicates the polarization complex trace is termed the analytical signal. Trans- analysis of, especially, S-waves. The results of the formations of data from one form to another are automatic interpretation are distorted not only by usual in signal analysis to extract significant infor- seismic noise and Pcoda, but also by the effects of mation from time series. The transformation of seis- S-wave splitting in the instance ofeffectiveanisotropy, mic data from the time domain to the frequency
For the Western Bohemia earthquake swarm area, domain is the usual example. from which the selected event stems, effective Complex trace analysis allows a natural separation anisotropy with axis of symmetry in the azimuth 31 ° of amplitude and phase information. is characteristic (Vavry~uk, 1991). As a consequence The complex trace (F) is defined as of the small time delay between the S1 and $2 waves at the station VAC the S-wave splitting is not evident F(t) = f ( t ) + j f * ( t ) = A (t)exp[j4~(t)] (1)
and superposition of Sl, $2 is recorded as an Sg wave. where f ( t) is a seismic trace (i.e. the real part) and In the situation of the more distant and differently f * ( t ) is its Hilbert transform, the imaginary part of oriented station TIS the splitting of the S wave into the analytical signal. SI and S2 is clearly visible,
A(t) = [f2(t) +7"2(t)]1'2 = I f ( t ) l (2) Complex seismic trace analysis and
The seismic trace can be viewed as the real corn- ~ ( t ) = tan-l[f*(t)/f(t)] (3) ponent of a complex trace. The imaginary component can be calculated under usualcondit ions asi ts Hilbert are the "envelope" and "instantaneous phase", transform (Taner, Koehler, and Sheriff, 1979). The respectively.
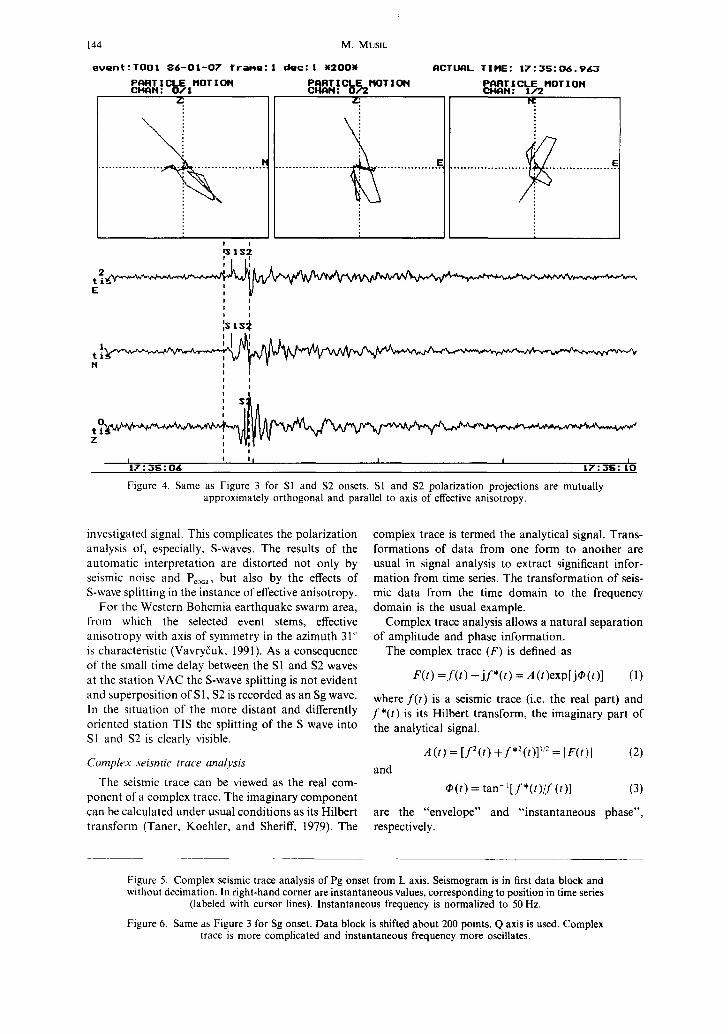
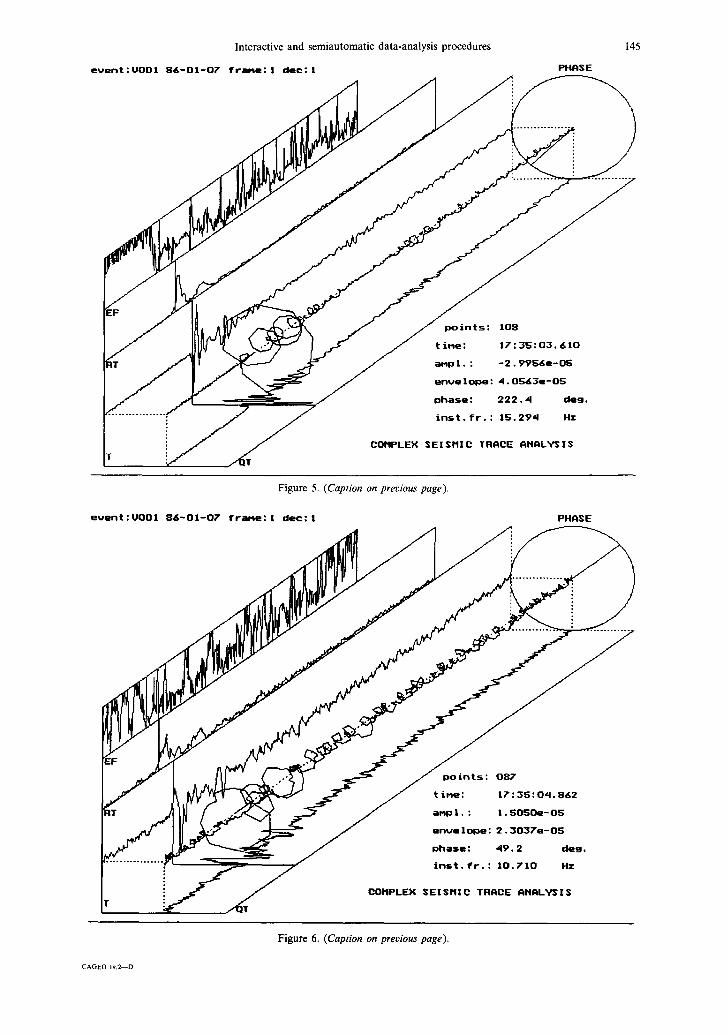
Figure 5. Complex seismic trace analysis of Pg onset from L axis. Seismogram is in first data block and without decimation. In right-hand corner are instantaneous values, corresponding to position in time series
(labeled with cursor lines). Instantaneous frequency is normalized to 50 Hz.
Figure 6. Same as Figure 3 for Sg onset. Data block is shifted about 200 points. Q axis is used. Complex trace is more complicated and instantaneous frequency more oscillates.
Interactive and semiautomatic data-analysis procedures 145
e v e n t l U O 0 | 8 6 - - 0 1 - 0 7 f r a l ~ e : I d e ( : : I PHASE
p o i n t s : 108
t i n e : 1 7 : 3 5 : 0 3 . 6 1 0
a ~ p l . : - 2 . ~ e - O S
e n v e l o p e : 4 . 0 ~ & 3 e - 0 5
p h a s e : 2 2 2 . 4 d e g .
t n s t . f r . : 1 5 . 2 9 4 Hz
COHPLEX S E I S M I C TRRCE A H A L ~ 3 I $
Figure 5. (Caption on previous page).
e v e n t : U O O l 8 8 - 0 1 - 0 7 f r a n e : I d e c : I PHIq~E
= ~ p o i n t s : 0 8 7
~ t i n e : l Z : 3 5 " O R . 8 ~ 2
amp I . : l . 5 0 5 0 e - O E
e n v e l o p e : 2 . 3 0 3 7 e - 0 S
p h a s e : q 9 , 2 d e s ,
| n s t . f r . : 1 0 . 7 1 0 Hz
CONPLEX ~ ;EISPI IC TRACE A H A L ~ I $
Figure 6. (Caption on previous page).
CAGEO 19,2--D
146 M. MUSIL
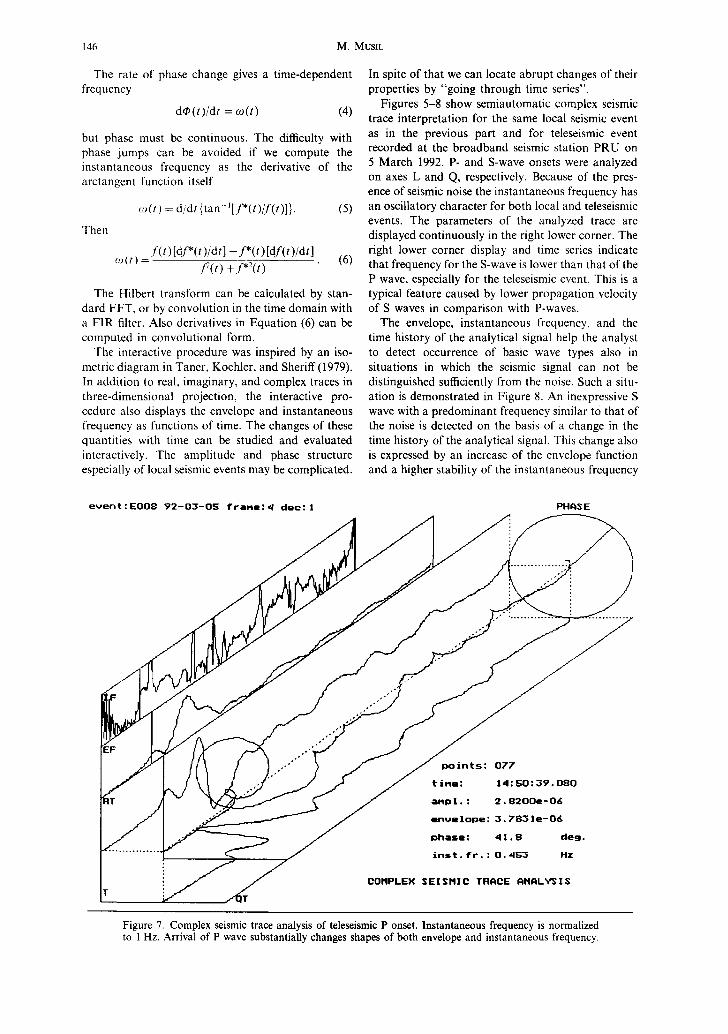
The rate of phase change gives a time-dependent In spite of that we can locate abrupt changes of their frequency properties by "going through time series".
dq~(t)/dt = og(t) (4) Figures 5-8 show semiautomatic complex seismic trace interpretation for the same local seismic event
but phase must be continuous. The difficulty with as in the previous part and for teleseismic event phase jumps can be avoided if we compute the recorded at the broadband seismic station PRU on instantaneous frequency as the derivative of the 5 March 1992. P- and S-wave onsets were analyzed arctangent function itself on axes L and Q, respectively. Because of the pres-
ence of seismic noise the instantaneous frequency has ~o(t) = d/dt {tan-l[f*(t)/f(t)]}. (5) an oscillatory character for both local and teleseismic
events. The parameters of the analyzed trace are Then displayed continuously in the right lower corner. The
f ( t )[df*( t) /dt]- f*( t )[df( t ) /dt] right lower corner display and time series indicate co(t) - J~(t) +f*2(t) (6) that frequency for the S-wave is lower than that of the
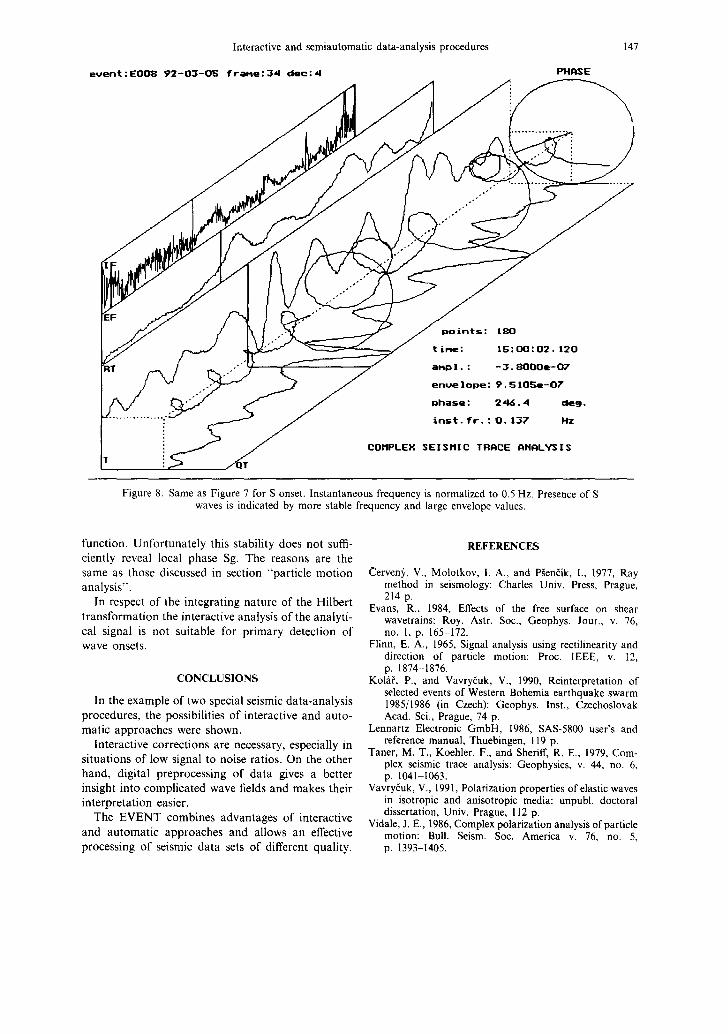
P wave, especially for the teleseismic event. This is a The Hilbert transform can be calculated by stan- typical feature caused by lower propagation velocity
dard FFT, or by convolution in the time domain with of S waves in comparison with P-waves. a F1R filter. Also derivatives in Equation (6) can be The envelope, instantaneous frequency, and the computed in convolutional form. time history of the analytical signal help the analyst
The interactive procedure was inspired by an iso- to detect occurrence of basic wave types also in metric diagram in Taner, Koehler, and Sheriff(1979). situations in which the seismic signal can not be In addition to real, imaginary, and complex traces in distinguished sufficiently from the noise. Such a situ- three-dimensional projection, the interactive pro- ation is demonstrated in Figure 8. An inexpressive S cedure also displays the envelope and instantaneous wave with a predominant frequency similar tO that of frequency as functions of time. The changes of these the noise is detected on the basis of a change in the quantities with time can be studied and evaluated time history of the analytical signal. This change also interactively. The amplitude and phase structure is expressed by an increase of the envelope function especially of local seismic events may be complicated, and a higher stability of the instantaneous frequency
e u e n t : E O 0 8 7 2 - 0 3 - 0 ~ f r a n e : < d e c : t PHf iSE
fU (J ,nts: °,,
"' / 1 - J . . ° , . . , . 8 2 0 0 . - 0 ,
J I J .°o.,o°. ......... 1 / j ° , . _ . , , . 8 , . , .
i n s t , f r . : O , 4 5 3 Hz
T i T
Figure 7. Complex seismic trace analysis of teleseismic P onset. Instantaneous frequency is normalized to 1 Hz. Arrival of P wave substantially changes shapes of both envelope and instantaneous frequency.
Interactive and semiautomatic data-analysis procedures 147
e u e n t : E O O 8 9 2 - 0 3 - 0 ~ ; f r a m e : ;$4 d e c : 4 PH~E
p o i n t s : 1 8 0
t i n e : I S : 0 0 : 0 2 , 1 2 0
RT "" ~ / anp !, : -3. 8000e-07 / ~ Qnve lope : 9,5 | O ~ Q - O 7
S phase: 246,4 d e e .
• ~ inst . f r . " O, 137 Hz
COIIPLEX $Er$11][C TRACE ANRL%/~][$ r . ~--
Figure 8. Same as Figure 7 for S onset. Instantaneous frequency is normalized to 0.5 Hz. Presence of S waves is indicated by more stable frequency and large envelope values.
function. Unfortunately this stability does not suffi- REFERENCES ciently reveal local phase Sg. The reasons are the same as those discussed in section "particle motion (~erven~, V., Molotkov, I. A., and P~en~ik, I., 1977, Ray analysis", method in seismology: Charles Univ. Press, Prague,
214 p. In respect of the integrating nature of the Hilbert Evans, R., 1984, Effects of the free surface on shear
transformation the interactive analysis of the analyti- wavetrains: Roy. Astr. Soc., Geophys. Jour., v. 76, cal signal is not suitable for primary detection of no. l, p. 165-172. wave onsets. Flinn, E. A., 1965, Signal analysis using rectilinearity and
direction of particle motion: Proc. IEEE, v. 12, p. 1874-1876.
CONCLUSIONS KolhL P., and Vavry6uk, V., 1990, Reinterpretation of selected events of Western Bohemia earthquake swarm
In the example of two special seismic data-analysis 1985/1986 (in Czech): Geophys. Inst., Czechoslovak procedures, the possibilities of interactive and auto- Acad. Sci., Prague, 74 p. matic approaches were shown. Lennartz Electronic GmbH, 1986, SAS-5800 user's and
Interactive corrections are necessary, especially in reference manual, Thuebingen, 119 p. Taner, M. T., Koehler, F., and Sheriff, R. E., 1979, Com-
situations of low signal to noise ratios. On the other plex seismic trace analysis: Geophysics, v. 44, no. 6, hand, digital preprocessing of data gives a better p. 1041-1063. insight into complicated wave fields and makes their Vavry~uk, V., 1991, Polarization properties of elastic waves interpretation easier, in isotropic and anisotropic media: unpubl, doctoral
The EVENT combines advantages of interactive dissertation, Univ. Prague, 112 p. Vidale, J. E., 1986, Complex polarization analysis of particle
and automatic approaches and allows an effective motion: Bull. Seism. Soc. America v. 76, no. 5, processing of seismic data sets of different quality, p. 1393-1405.


