Inspiring Clinical Safety Excellence Owning and Accounting for Clinical Risk
Across the Board to Influence Culture
Agenda
2
Introducing The Risk Authority Stanford’s Advanced Risk Management System Workshop 1 Influence Culture & Duty of Candour Workshop 2
3
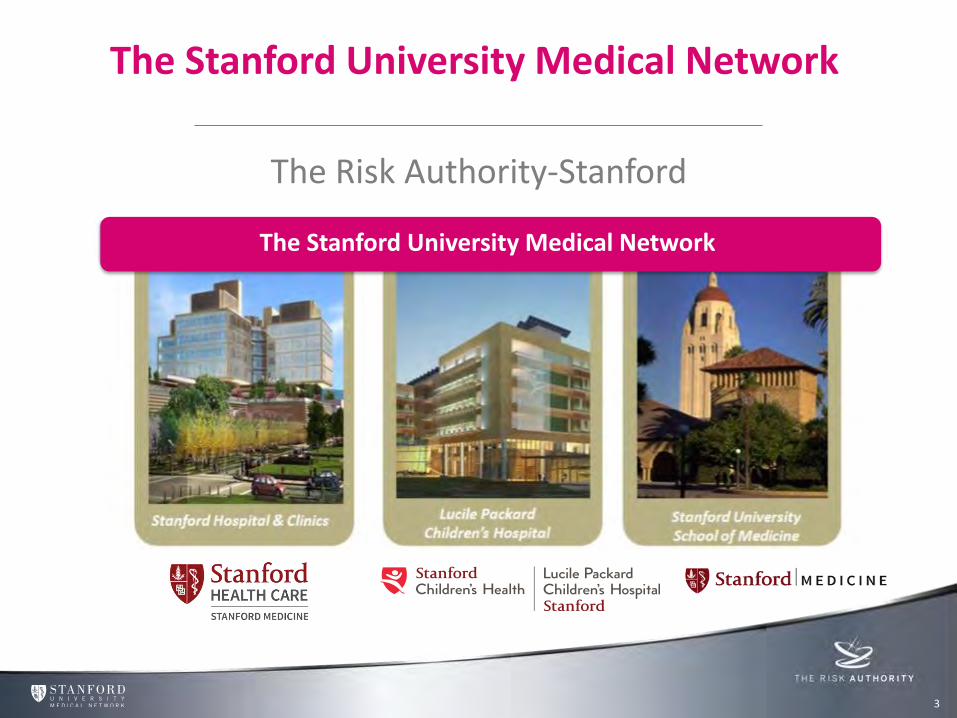
The Stanford University Medical Network
The Risk Authority-Stanford
The Stanford University Medical Network
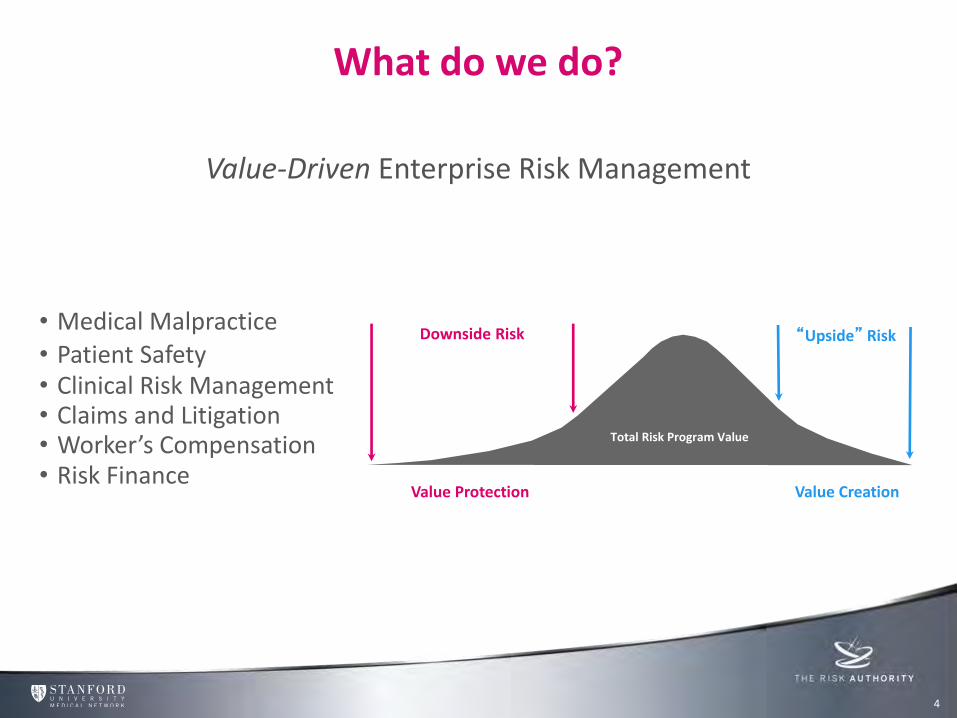
What do we do?
Value-Driven Enterprise Risk Management
• Medical Malpractice • Patient Safety • Clinical Risk Management • Claims and Litigation • Worker’s Compensation • Risk Finance
Total Risk Program Value
Downside Risk
Value Protection
“Upside” Risk
Value Creation
4
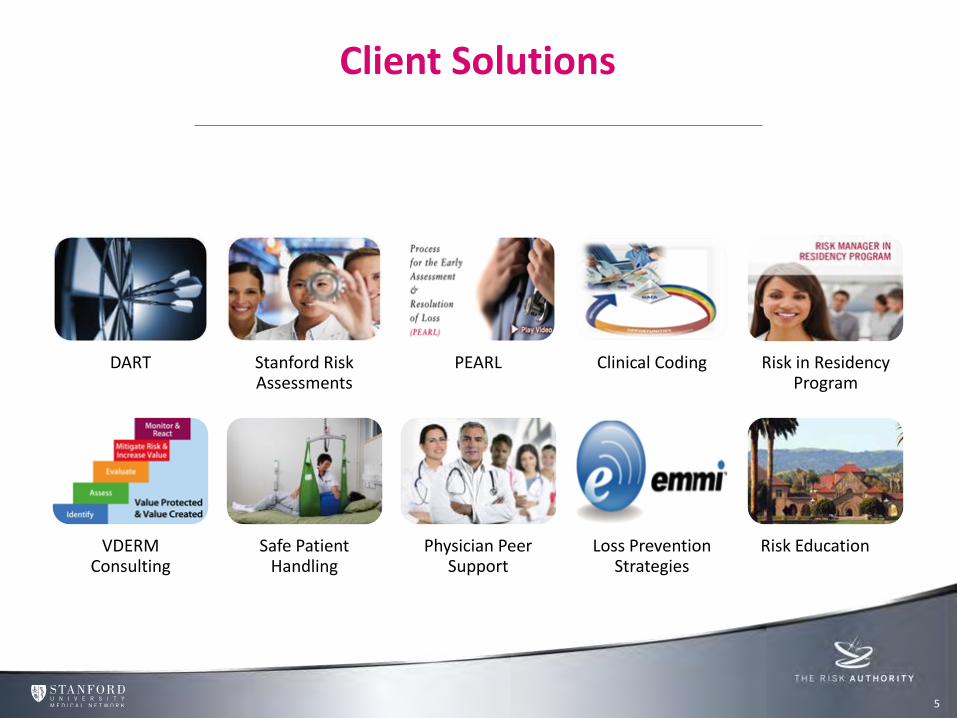
Client Solutions
5
DART Stanford Risk Assessments
PEARL Clinical Coding Risk in Residency Program
VDERM Consulting
Safe Patient Handling
Physician Peer Support
Loss Prevention Strategies
Risk Education
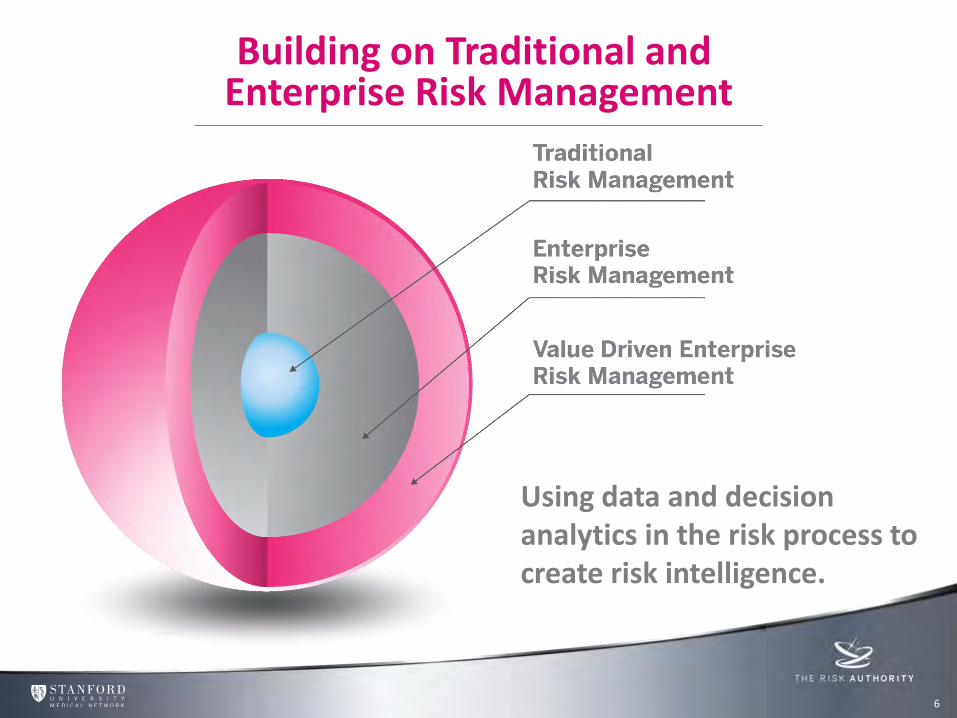
Building on Traditional and Enterprise Risk Management
6
Using data and decision analytics in the risk process to create risk intelligence.

Agenda
7
Introducing The Risk Authority Stanford’s Advanced Risk Management System Workshop 1 Influence Culture & Duty of Candour Workshop 2
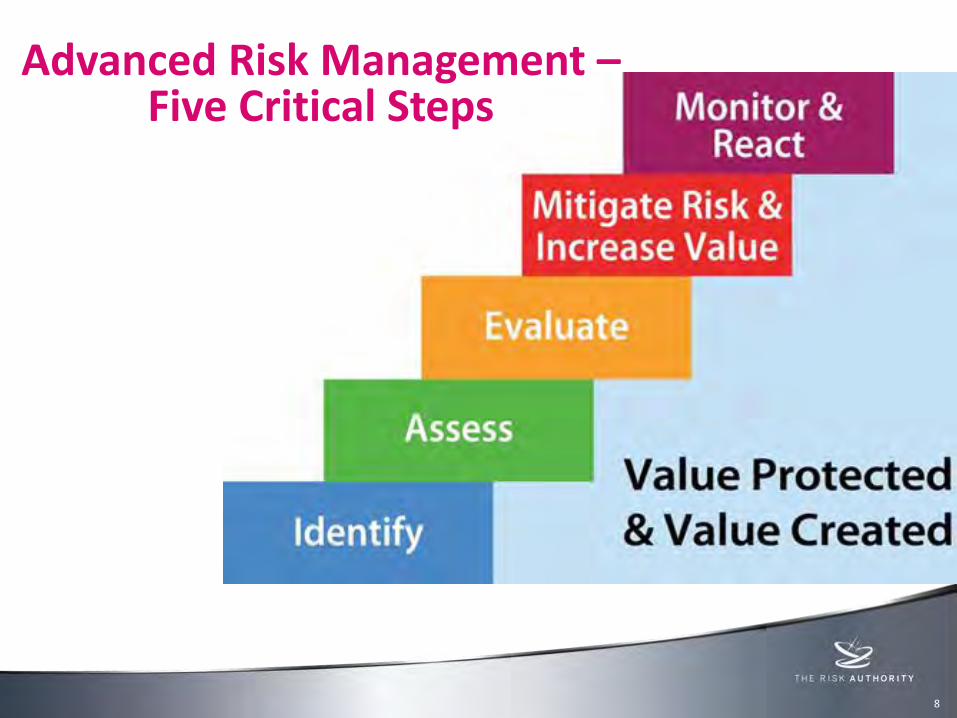
Advanced Risk Management – Five Critical Steps
8
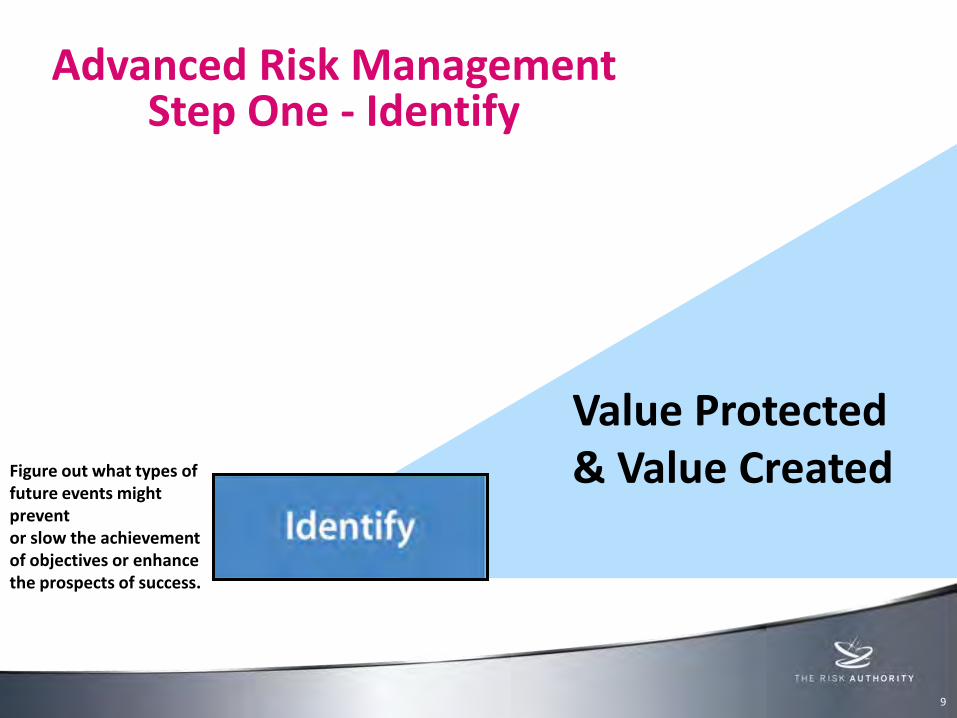
Value Protected & Value Created Figure out what types of
future events might prevent or slow the achievement of objectives or enhance the prospects of success.
Advanced Risk Management Step One - Identify
9
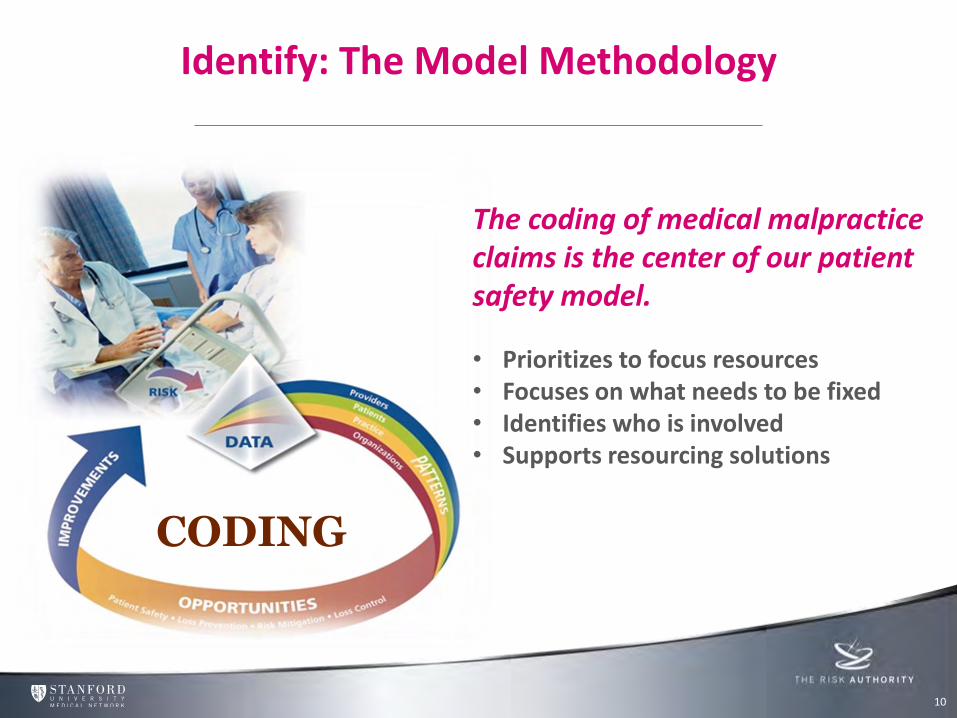
The coding of medical malpractice claims is the center of our patient safety model.
• Prioritizes to focus resources • Focuses on what needs to be fixed • Identifies who is involved • Supports resourcing solutions
CODING
Identify: The Model Methodology
10 10
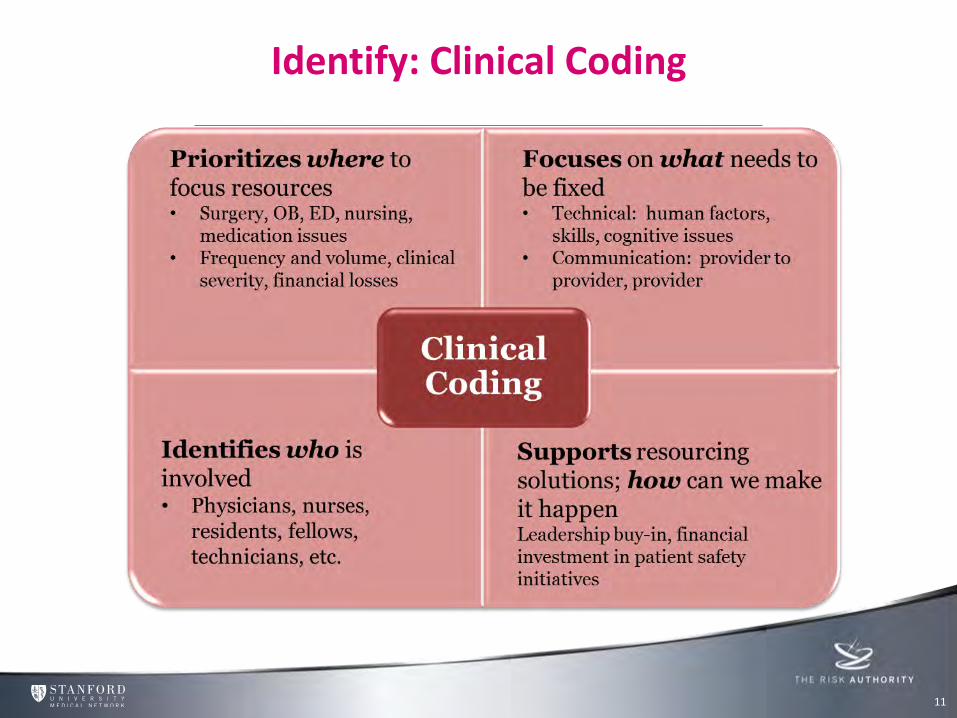
Identify: Clinical Coding
11 11

Identify: Using an Accident Causation Taxonomy
12 12
High Level Trended Data
13 13
0
10
20
30
40
50
60
1998
1999
2000
2001
2002
2003
2004
2005
2006
2007
2008
2009
2010
2011
2012
NU
MB
ER
OF
CA
SE
S Entity 1 Entity 2
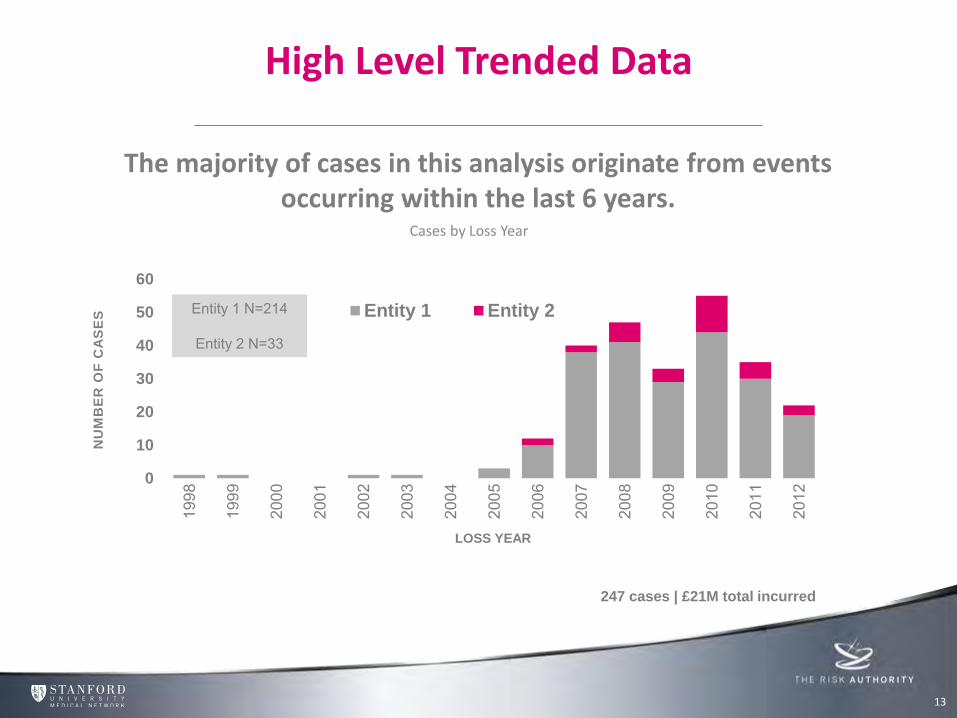
Cases by Loss Year
The majority of cases in this analysis originate from events occurring within the last 6 years.
LOSS YEAR
247 cases | £21M total incurred
Entity 1 N=214
Entity 2 N=33
14 14
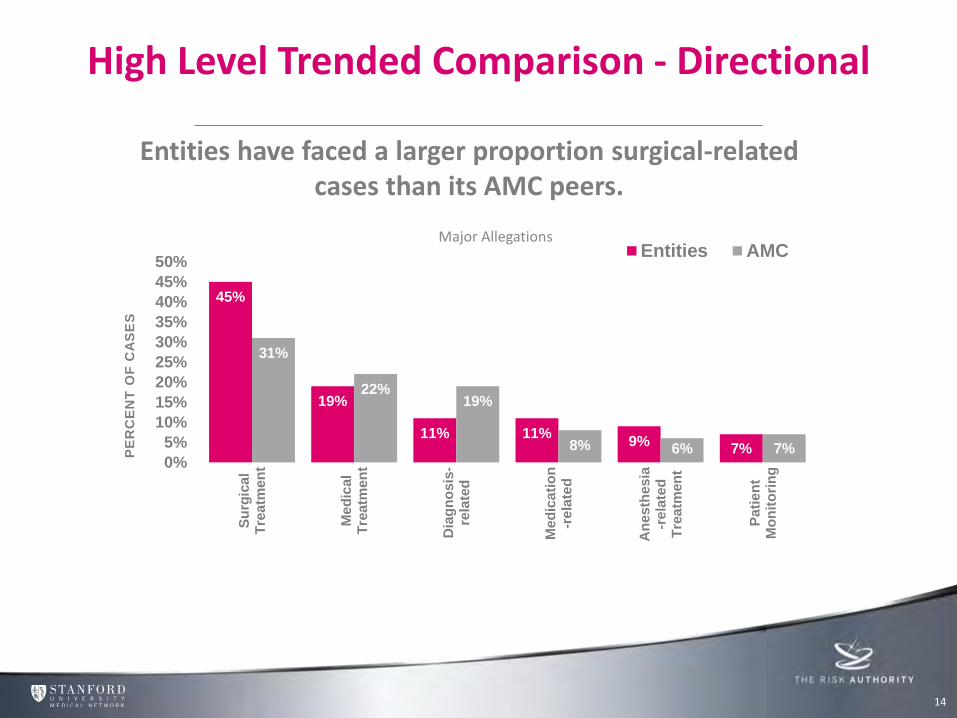
High Level Trended Comparison - Directional
Entities have faced a larger proportion surgical-related cases than its AMC peers.
45%
19%
11% 11% 9%
7%
31%
22% 19%
8% 6% 7% 0%
5%
10%
15%
20%
25%
30%
35%
40%
45%
50%S
urg
ica
lT
rea
tmen
t
Me
dic
al
Tre
atm
en
t
Dia
gn
osis
-re
late
d
Me
dic
ati
on
-re
late
d
An
es
thes
ia-r
ela
ted
Tre
atm
en
t
Pa
tie
nt
Mo
nit
ori
ng
PE
RC
EN
T O
F C
AS
ES
Entities AMCMajor Allegations
15 15
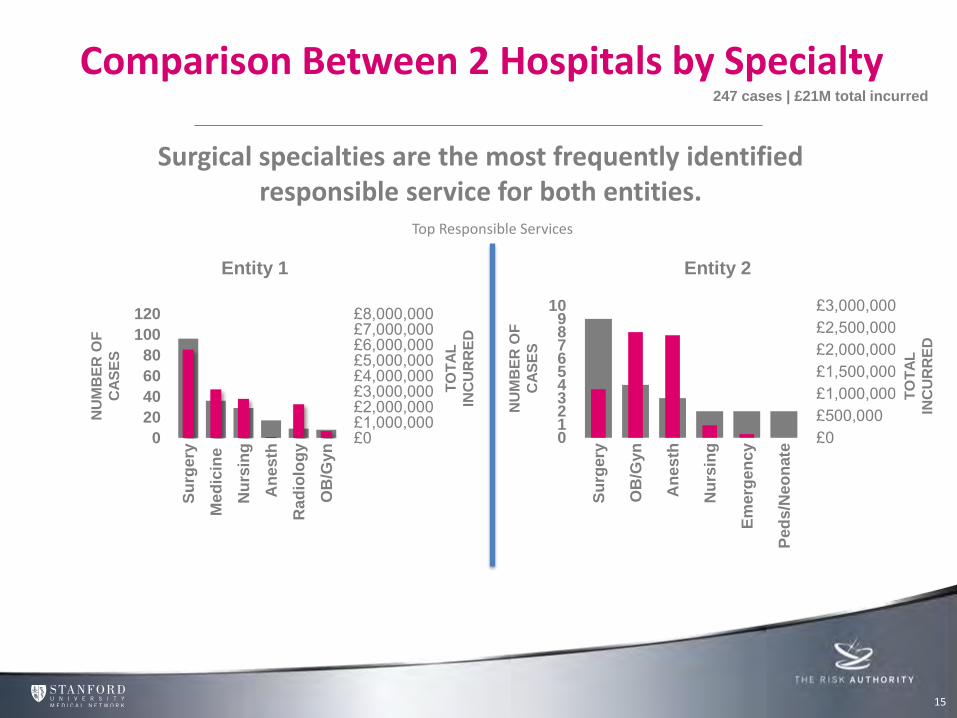
Comparison Between 2 Hospitals by Specialty
£0£1,000,000£2,000,000£3,000,000£4,000,000£5,000,000£6,000,000£7,000,000£8,000,000
0
20
40
60
80
100
120
Su
rgery
Me
dic
ine
Nu
rsin
g
An
es
th
Rad
iolo
gy
OB
/Gyn
Top Responsible Services
Surgical specialties are the most frequently identified responsible service for both entities.
247 cases | £21M total incurred
£0£500,000£1,000,000£1,500,000£2,000,000£2,500,000£3,000,000
0123456789
10
Su
rgery
OB
/Gyn
An
es
th
Nu
rsin
g
Em
erg
en
cy
Ped
s/N
eo
nate
Entity 1 Entity 2
NU
MB
ER
OF
CA
SE
S
NU
MB
ER
OF
CA
SE
S
TO
TA
L
INC
UR
RE
D
TO
TA
L
INC
UR
RE
D
16 16
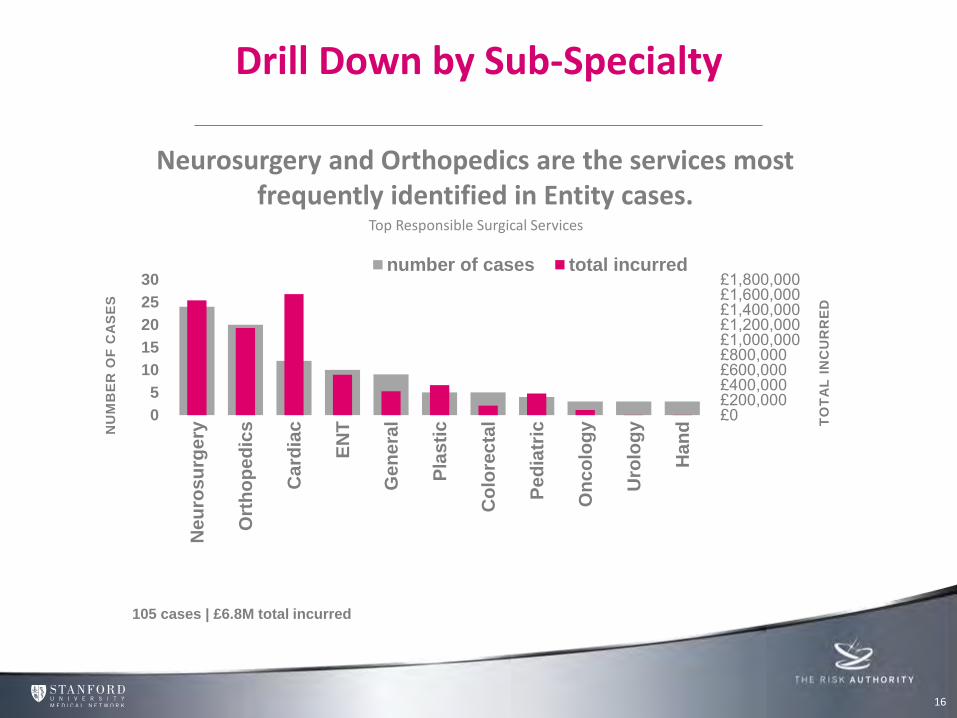
Drill Down by Sub-Specialty
£0£200,000£400,000£600,000£800,000£1,000,000£1,200,000£1,400,000£1,600,000£1,800,000
0
5
10
15
20
25
30
Ne
uro
su
rge
ry
Ort
ho
pe
dic
s
Ca
rdia
c
EN
T
Ge
ne
ral
Pla
sti
c
Co
lore
cta
l
Pe
dia
tric
On
co
log
y
Uro
log
y
Ha
nd T
OT
AL
IN
CU
RR
ED
NU
MB
ER
OF
CA
SE
S
number of cases total incurred
Top Responsible Surgical Services
Neurosurgery and Orthopedics are the services most frequently identified in Entity cases.
105 cases | £6.8M total incurred
17 17
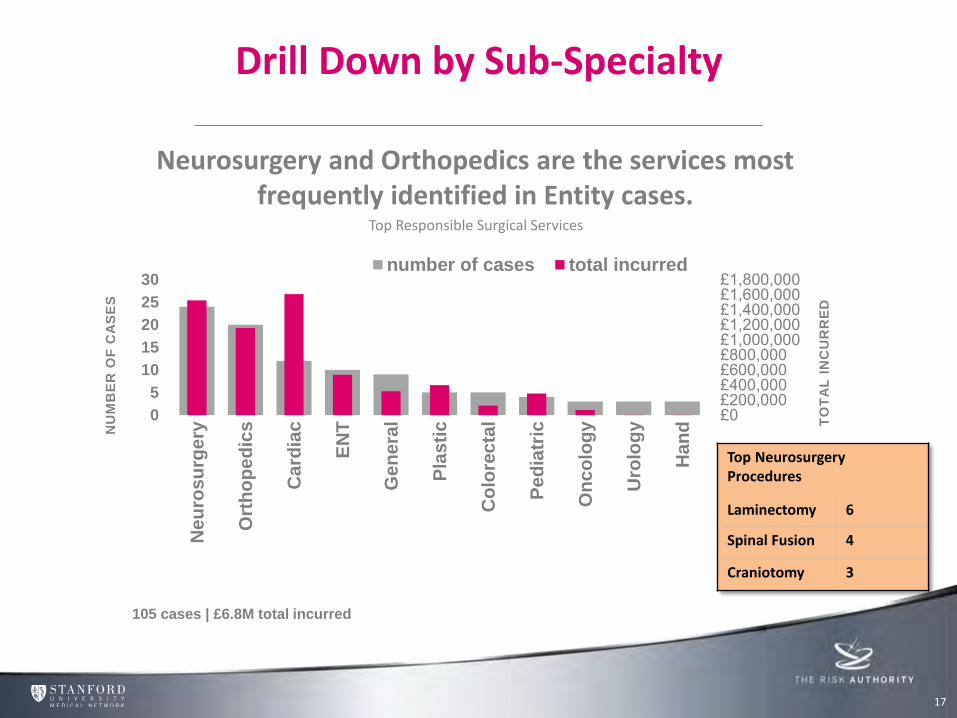
Drill Down by Sub-Specialty
£0£200,000£400,000£600,000£800,000£1,000,000£1,200,000£1,400,000£1,600,000£1,800,000
0
5
10
15
20
25
30
Ne
uro
su
rge
ry
Ort
ho
pe
dic
s
Ca
rdia
c
EN
T
Ge
ne
ral
Pla
sti
c
Co
lore
cta
l
Pe
dia
tric
On
co
log
y
Uro
log
y
Ha
nd T
OT
AL
IN
CU
RR
ED
NU
MB
ER
OF
CA
SE
S
number of cases total incurred
Top Responsible Surgical Services
Neurosurgery and Orthopedics are the services most frequently identified in Entity cases.
105 cases | £6.8M total incurred
Top Neurosurgery Procedures
Laminectomy 6
Spinal Fusion 4
Craniotomy 3
18 18
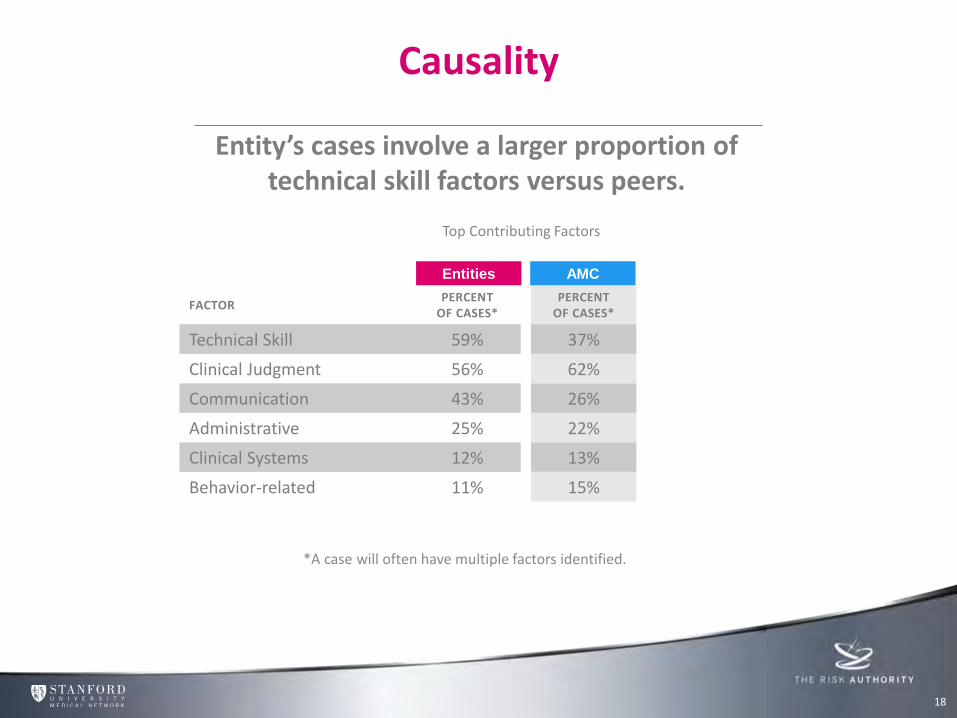
Causality
PERCENT OF CASES*
37%
62%
26%
22%
13%
15%
AMC
*A case will often have multiple factors identified.
Entity’s cases involve a larger proportion of technical skill factors versus peers.
Top Contributing Factors
FACTOR PERCENT
OF CASES*
Technical Skill 59%
Clinical Judgment 56%
Communication 43%
Administrative 25%
Clinical Systems 12%
Behavior-related 11%
Entities
19 19
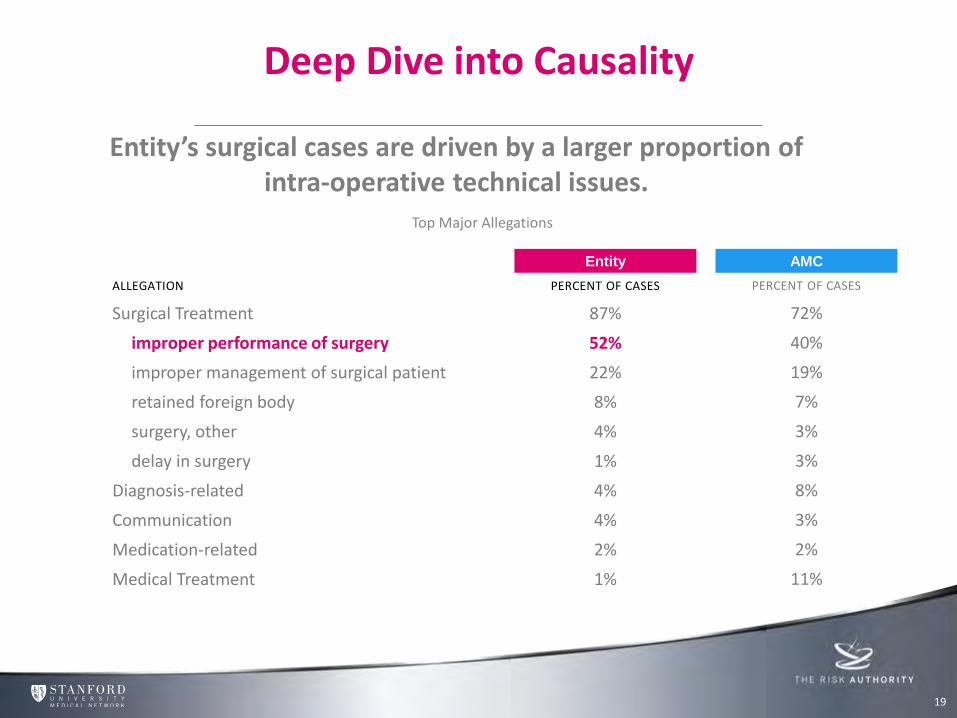
Deep Dive into Causality
Entity’s surgical cases are driven by a larger proportion of intra-operative technical issues.
Top Major Allegations
ALLEGATION PERCENT OF CASES
Surgical Treatment 87%
improper performance of surgery 52%
improper management of surgical patient 22%
retained foreign body 8%
surgery, other 4%
delay in surgery 1%
Diagnosis-related 4%
Communication 4%
Medication-related 2%
Medical Treatment 1%
AMC Entity
PERCENT OF CASES
72%
40%
19%
7%
3%
3%
8%
3%
2%
11%
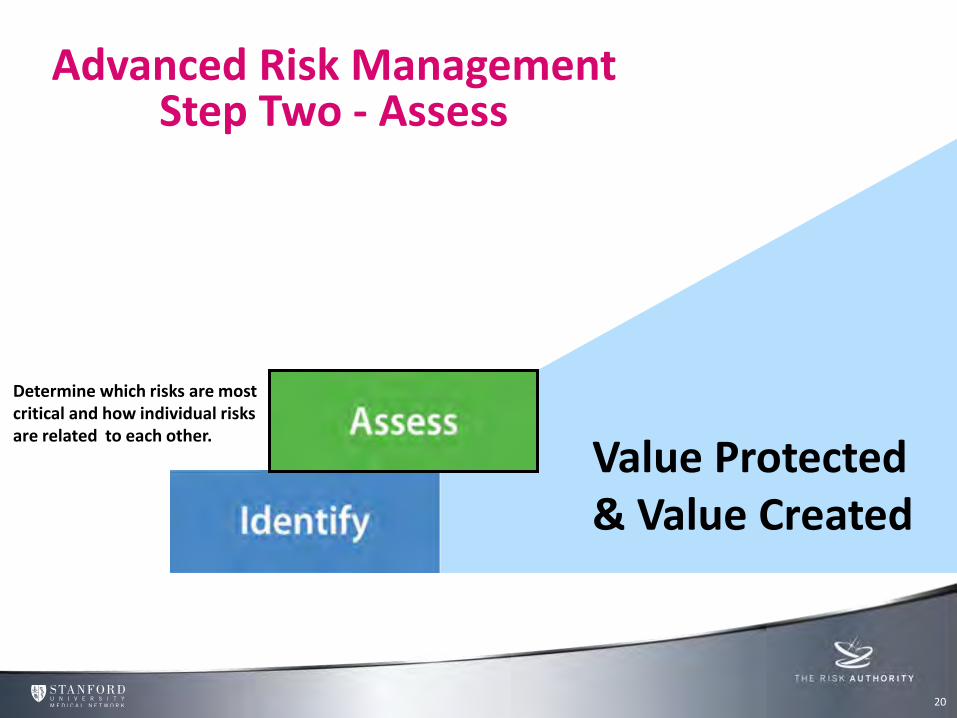
Determine which risks are most critical and how individual risks are related to each other.
Value Protected & Value Created
Advanced Risk Management Step Two - Assess
20
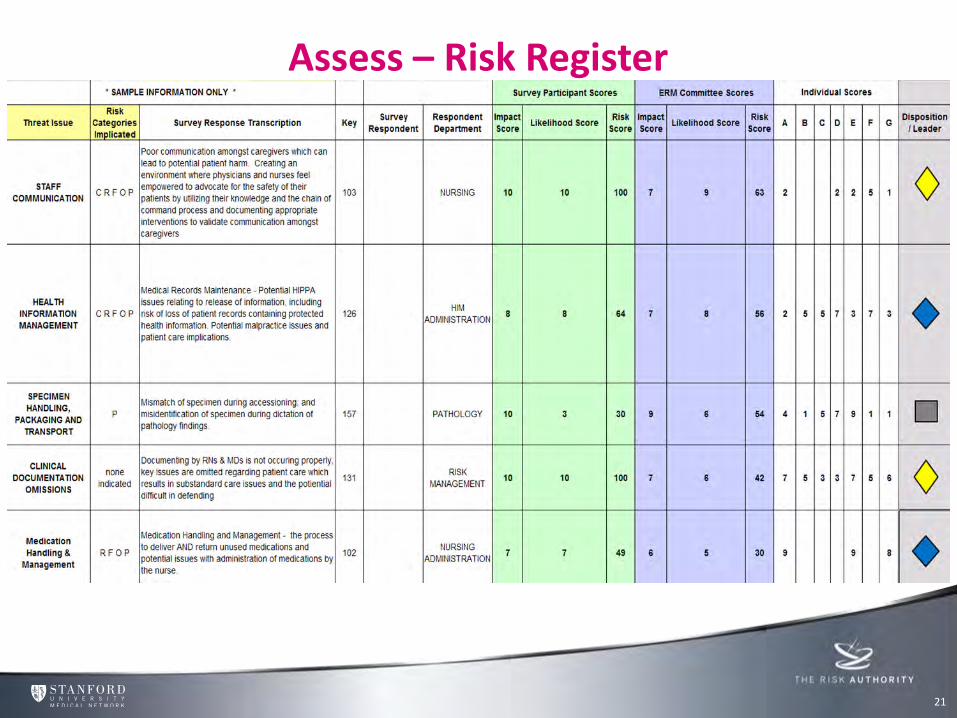
Assess – Risk Register
21
Value Protected & Value Created Identify
Assess
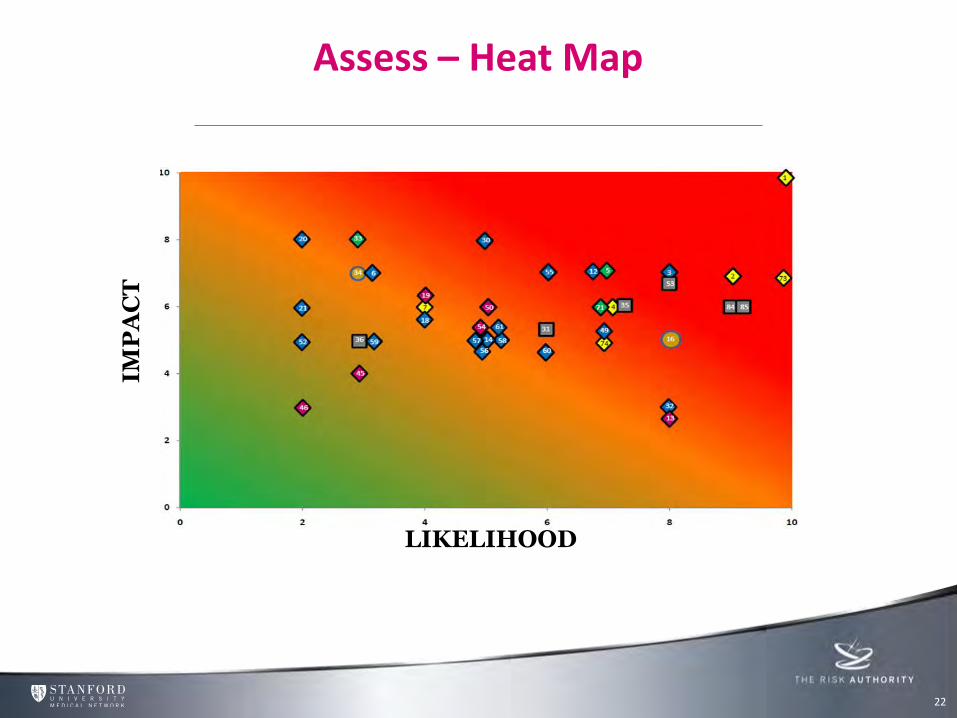
Assess – Heat Map
22
Value Protected & Value Created Identify
Assess
IMP
AC
T
LIKELIHOOD
Value Protected & Value Created
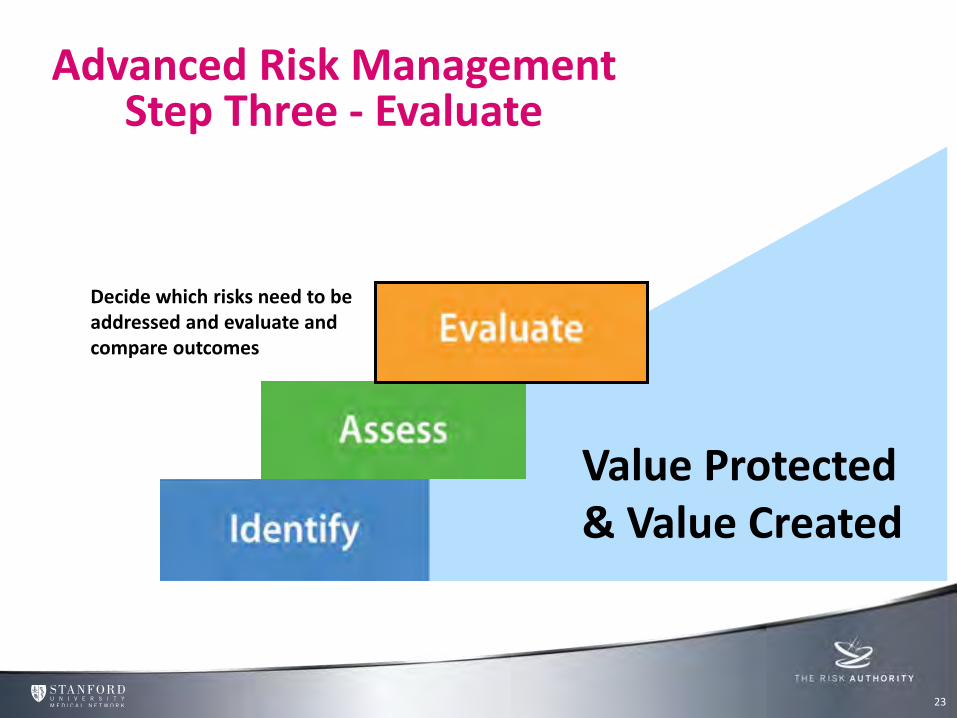
Advanced Risk Management Step Three - Evaluate
Decide which risks need to be addressed and evaluate and compare outcomes
23
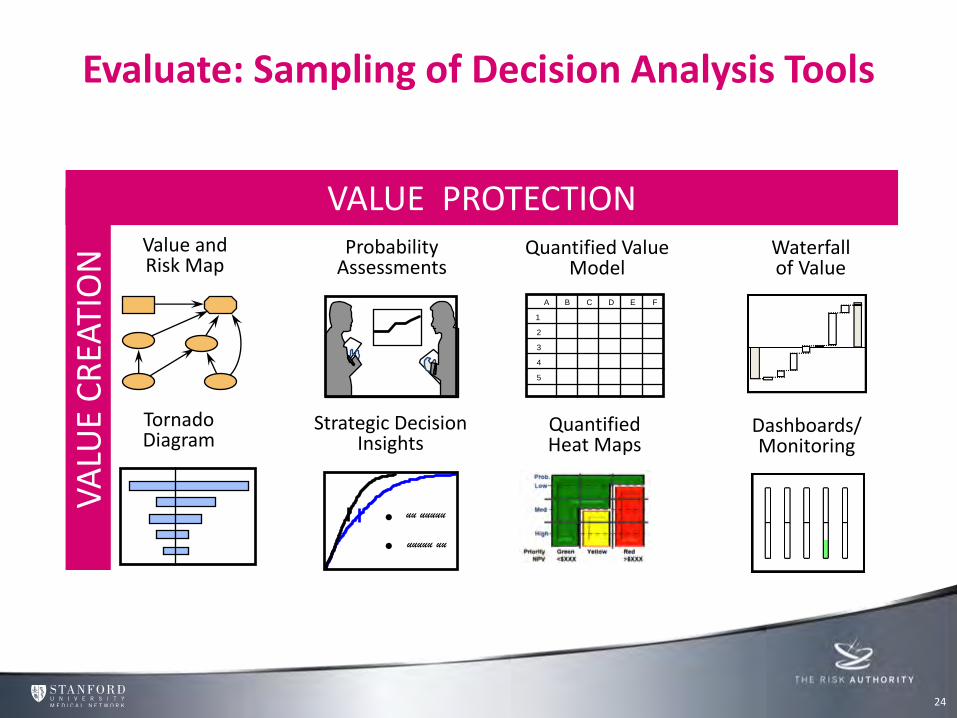
Value and Risk Map
Probability Assessments
Quantified Value Model
Waterfall of Value
Tornado Diagram
Strategic Decision Insights
Dashboards/ Monitoring
A B C D E F
1
2
3
4
5
uu uuuuu
uuuuu uu
• •
Quantified Heat Maps
VA
LUE
CR
EATI
ON
VALUE PROTECTION
Evaluate: Sampling of Decision Analysis Tools
24
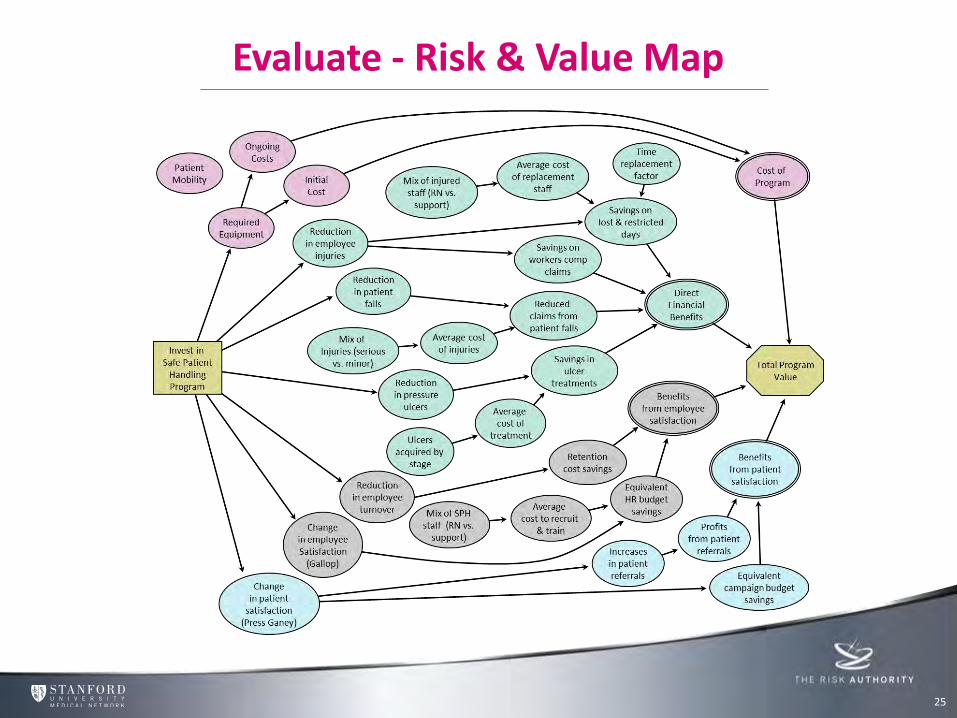
Evaluate - Risk & Value Map
25
Value Protected & Value Created Identify
Assess
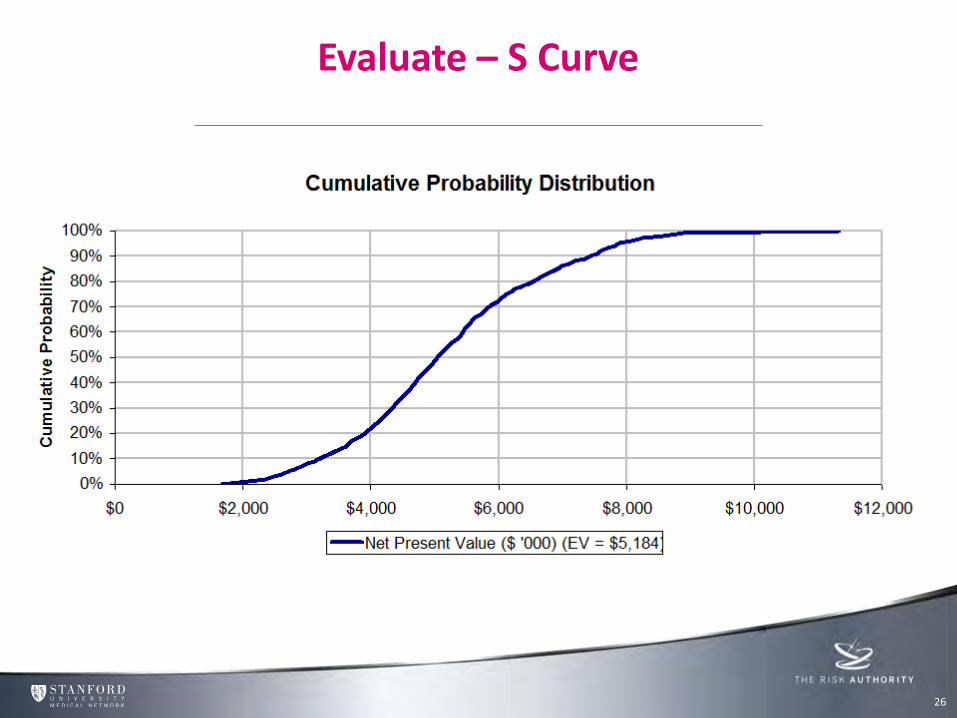
Evaluate – S Curve
26
Value Protected & Value Created Identify
Assess

Evaluate – Tornado
27
Value Protected & Value Created Identify
Assess
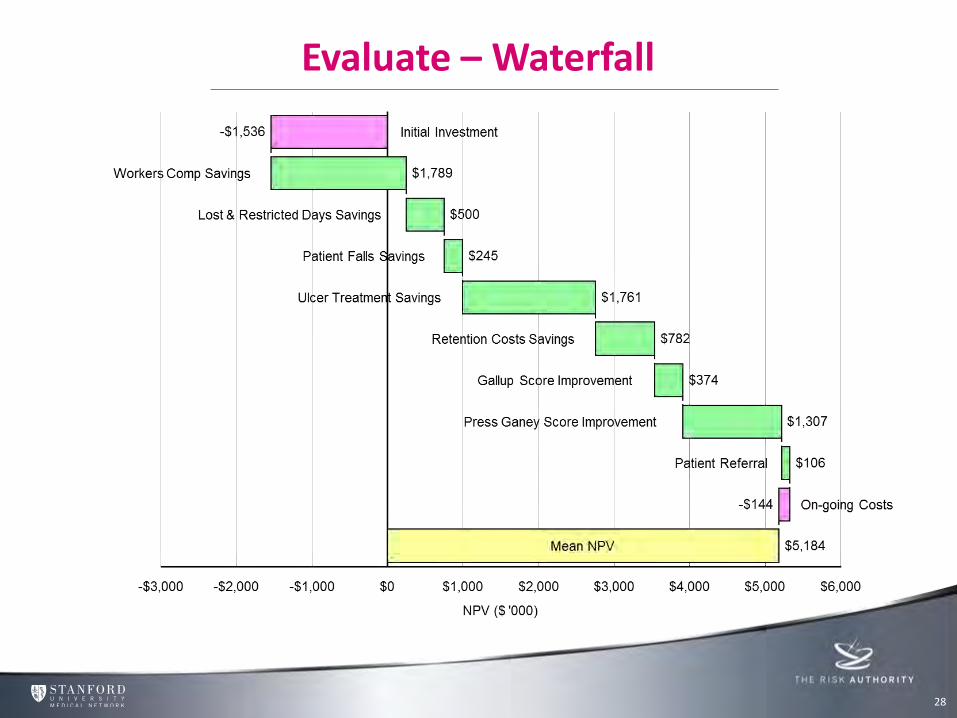
Evaluate – Waterfall
28
Value Protected & Value Created Identify
Assess
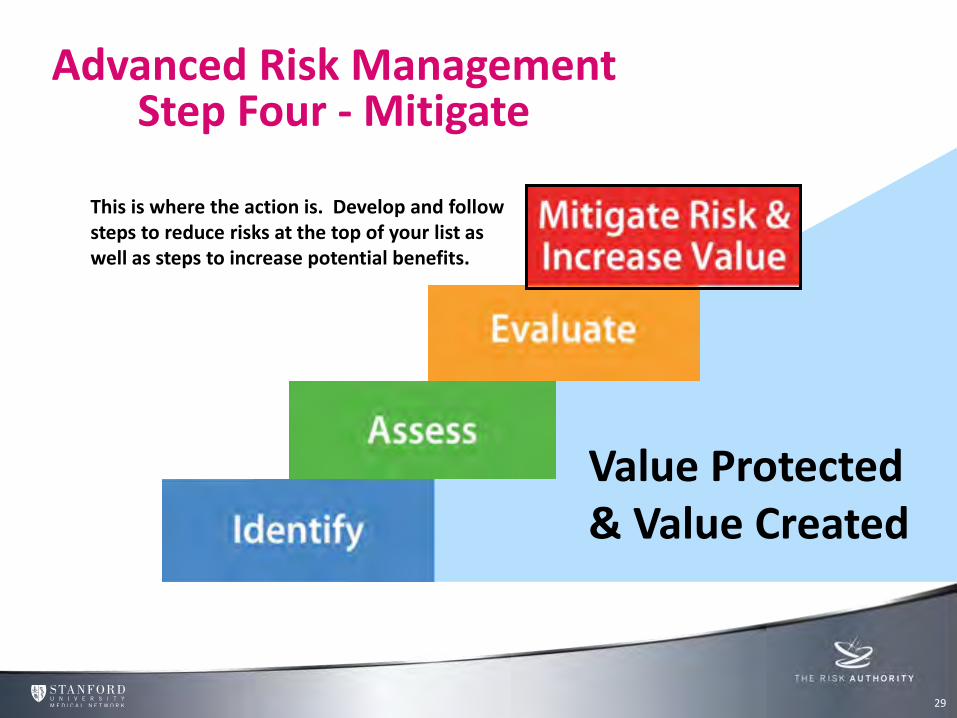
Value Protected & Value Created
Advanced Risk Management Step Four - Mitigate
This is where the action is. Develop and follow steps to reduce risks at the top of your list as well as steps to increase potential benefits.
29

MITIGATE
30
“The goal is to turn data into information, and information
into insight.”
Carly Fiorina Former CEO of HP
Data Coding • Analytics • Communication
Data Analytics
• Risk Intelligence • Risk Mitigation and Prevention Strategies
Data Based Solutions
• Simulation • Education • Process Improvements • Peer Review
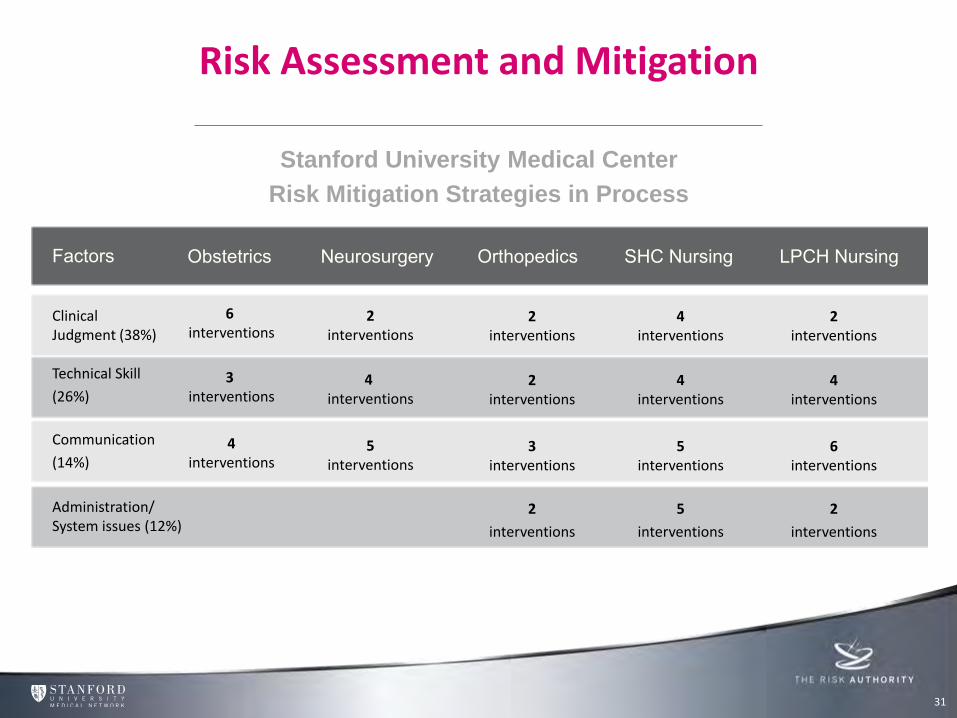
Risk Assessment and Mitigation
31
Stanford University Medical Center
Risk Mitigation Strategies in Process
Factors Obstetrics Neurosurgery Orthopedics SHC Nursing LPCH Nursing
Clinical Judgment (38%)
Technical Skill
(26%)
Communication
(14%)
Administration/ System issues (12%)
6 interventions
3 interventions
4 interventions
2 interventions
4 interventions
5 interventions
2 interventions
2 interventions
3 interventions
2
interventions
4 interventions
4 interventions
5 interventions
5
interventions
2 interventions
4 interventions
6 interventions
2
interventions
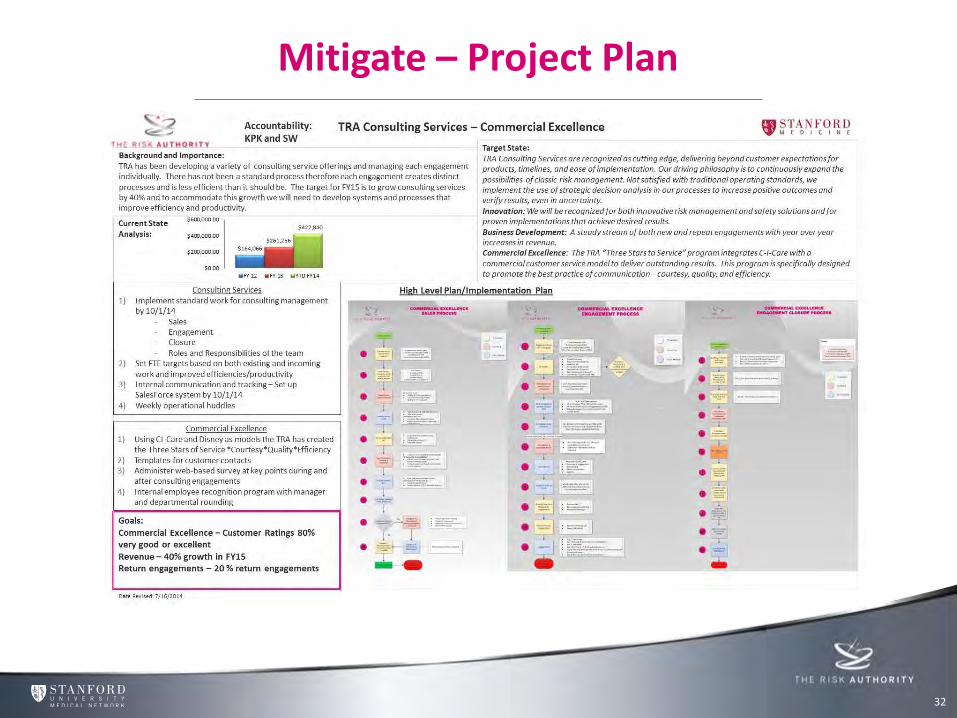
Mitigate – Project Plan
32
Value Protected & Value Created Identify
Assess
Value Protected & Value Created
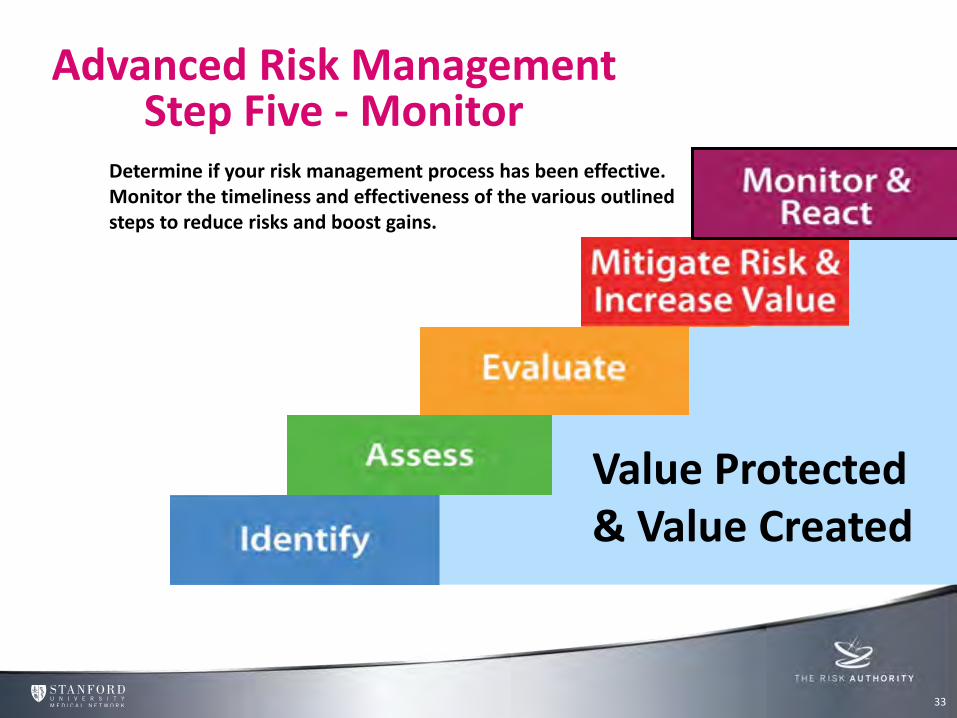
Advanced Risk Management Step Five - Monitor
Determine if your risk management process has been effective. Monitor the timeliness and effectiveness of the various outlined steps to reduce risks and boost gains.
33
34
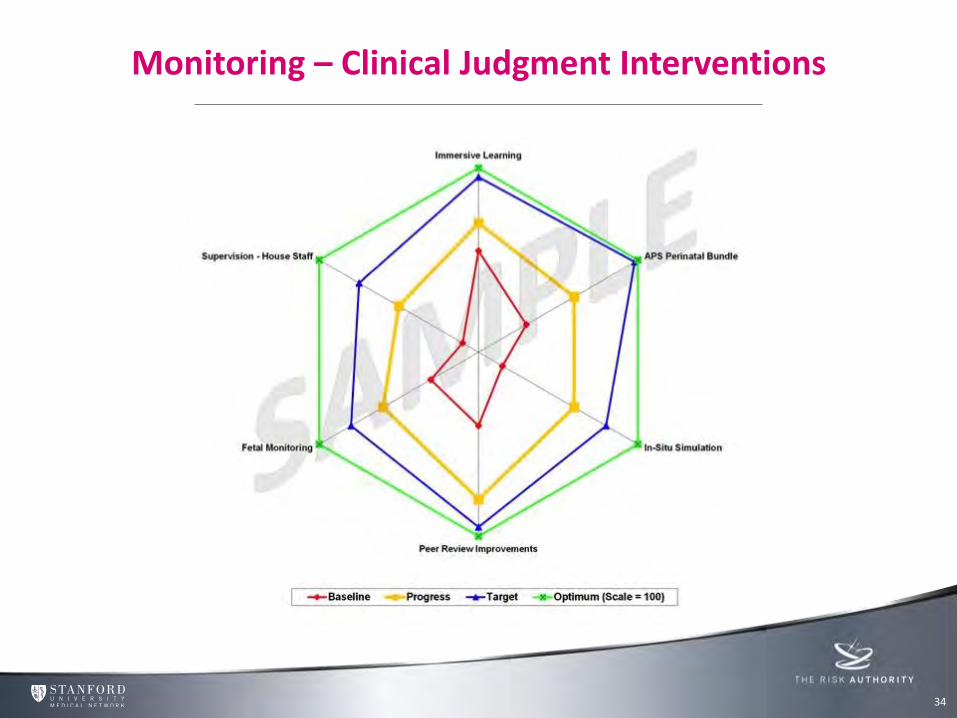
Monitoring – Clinical Judgment Interventions
34
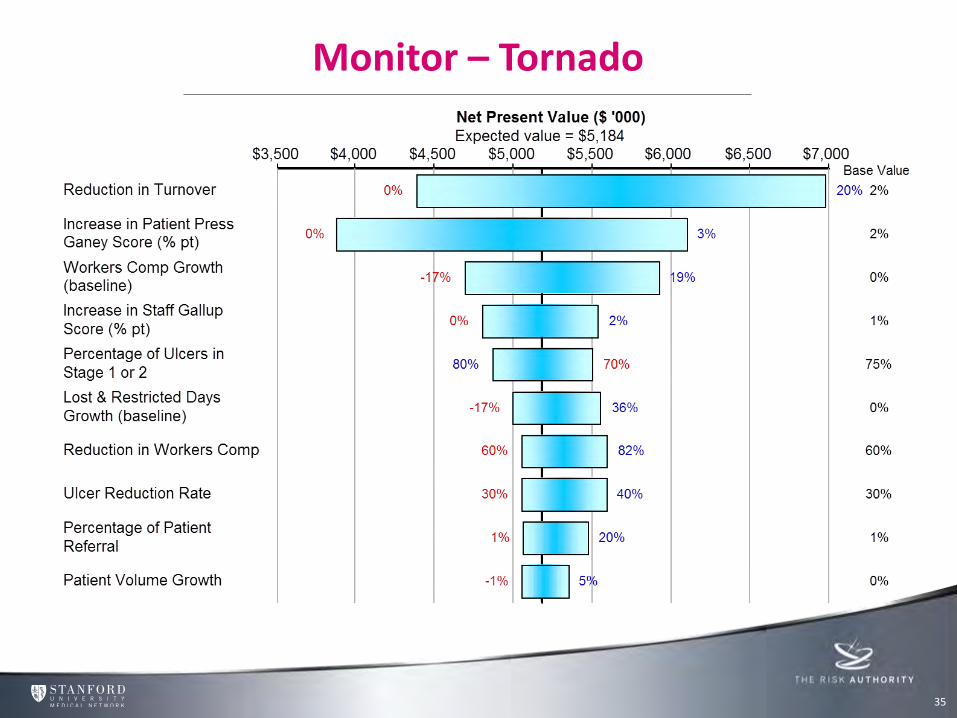
Monitor – Tornado
35
Value Protected & Value Created Identify
Assess
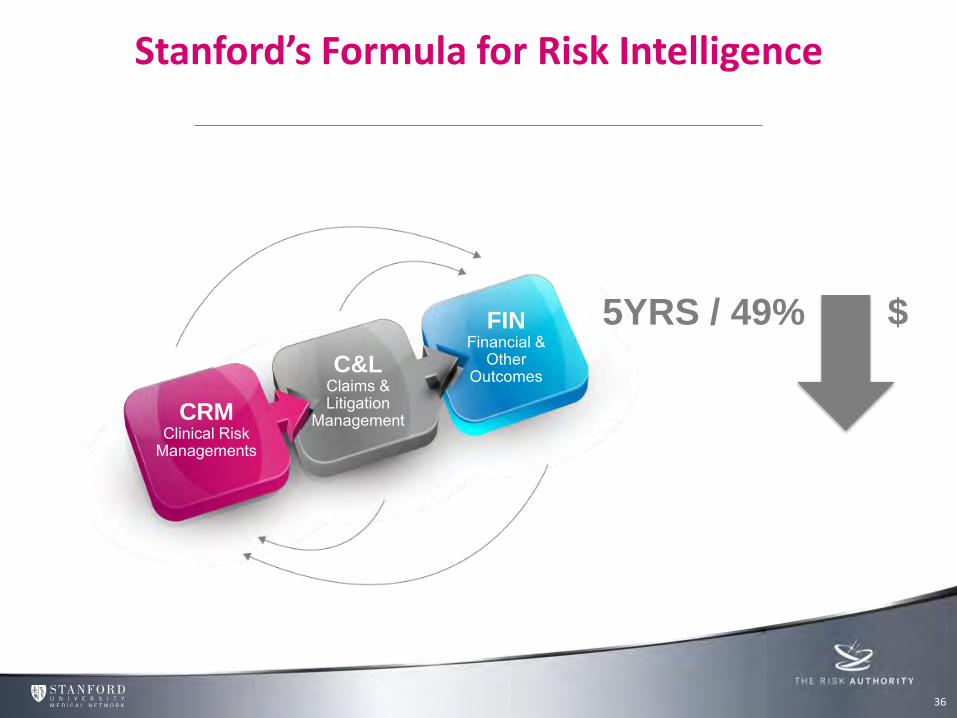
Stanford’s Formula for Risk Intelligence
5YRS / 49% $ FIN Financial &
Other Outcomes C&L
Claims & Litigation
Management CRM Clinical Risk
Managements
36
Results
37
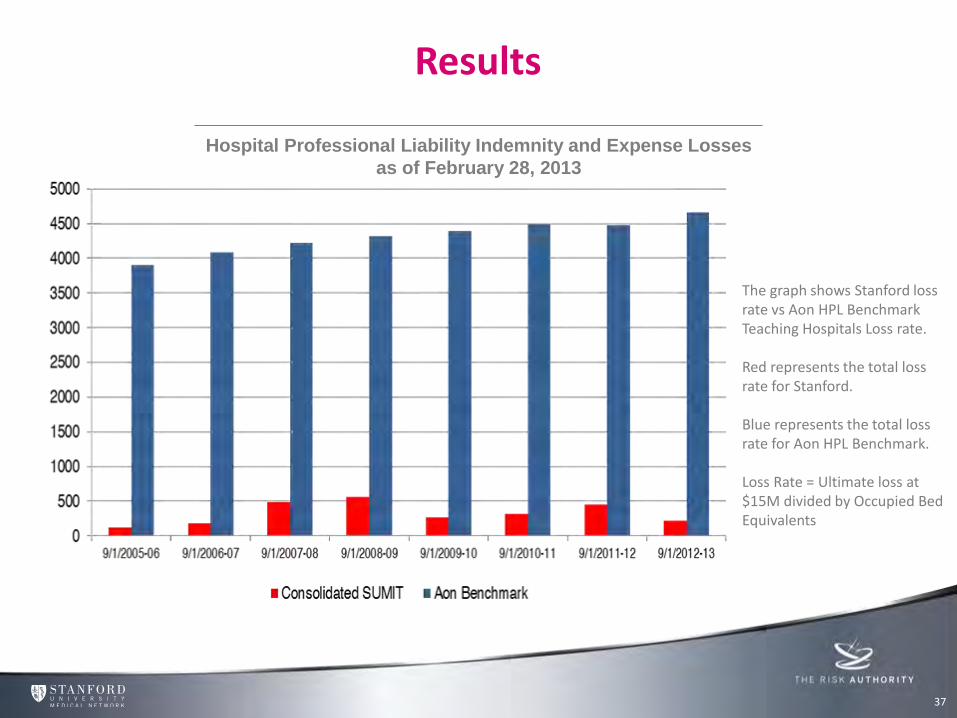
The graph shows Stanford loss rate vs Aon HPL Benchmark Teaching Hospitals Loss rate. Red represents the total loss rate for Stanford. Blue represents the total loss rate for Aon HPL Benchmark. Loss Rate = Ultimate loss at $15M divided by Occupied Bed Equivalents
Hospital Professional Liability Indemnity and Expense Losses
as of February 28, 2013
Results
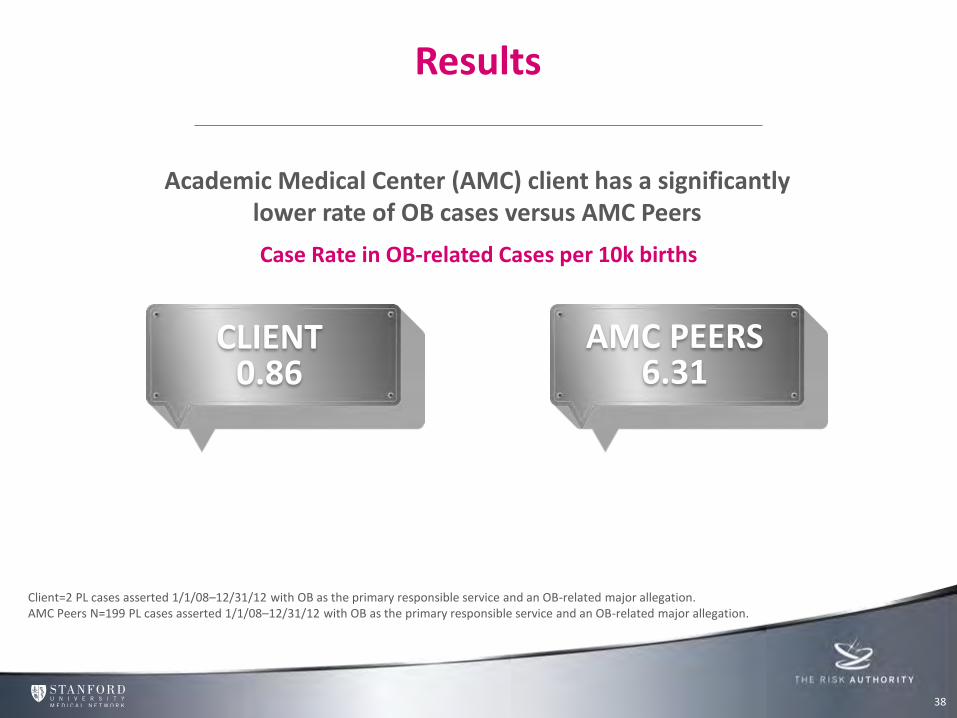
Academic Medical Center (AMC) client has a significantly lower rate of OB cases versus AMC Peers
Case Rate in OB-related Cases per 10k births
Client=2 PL cases asserted 1/1/08–12/31/12 with OB as the primary responsible service and an OB-related major allegation. AMC Peers N=199 PL cases asserted 1/1/08–12/31/12 with OB as the primary responsible service and an OB-related major allegation.
38
CLIENT 0.86
AMC PEERS 6.31

Agenda
Introducing The Risk Authority Stanford’s Advanced Risk Management System Workshop 1 Influence Culture & Duty of Candour Workshop 2
39
Data Workshop
40
• Your hospital has dedicated many years to reduce the total cost of clinical negligence claims.
• The claim amounts in the last few years have been stable but you would like to install more loss prevention strategies.
• The information that you have available to you is provided.
Exercise
41
Using the data provided, recommend where you are going to focus risk mitigation strategies
Demonstrate how you can use the 5 steps and tools in Stanford’s Advanced Risk Management System to drive improvements
42
© 2014 CRICO Strategies, all rights reserved. See terms of use.
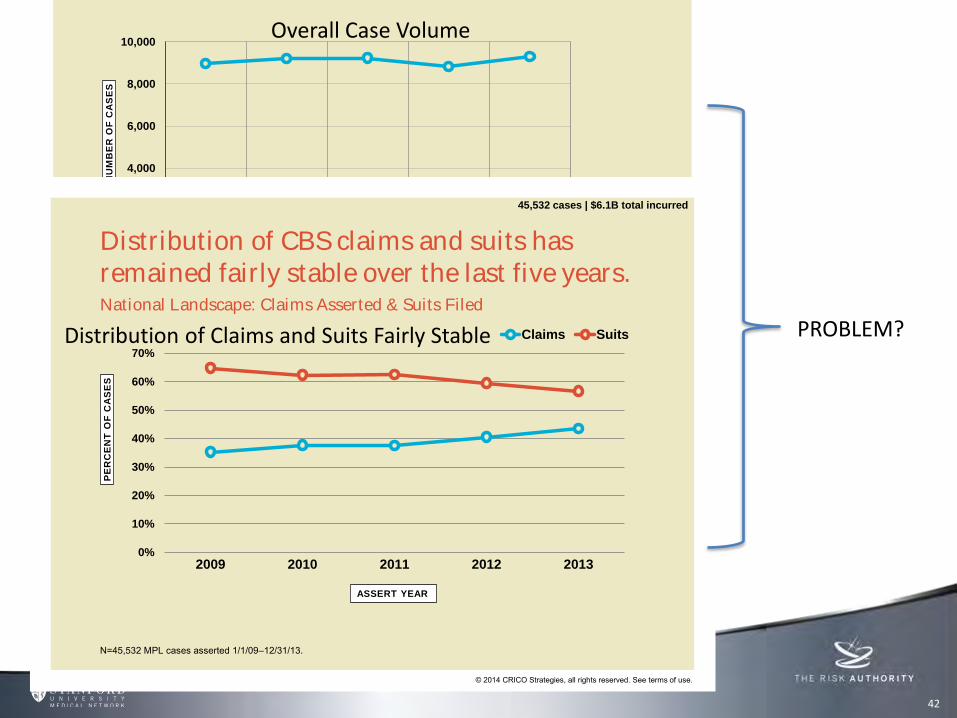
The overall case volume in CBS has remained consistent over the past five years.
0
2,000
4,000
6,000
8,000
10,000
2009 2010 2011 2012 2013
NU
MB
ER
OF
CA
SE
S
ASSERT YEAR
number of cases
N=45,532 MPL cases asserted 1/1/09–12/31/13.
45,532 cases | $6.1B total incurred
Overall Case Volume
© 2014 CRICO Strategies, all rights reserved. See terms of use.
0%
10%
20%
30%
40%
50%
60%
70%
2009 2010 2011 2012 2013
PE
RC
EN
T O
F C
AS
ES
Claims Suits
National Landscape: Claims Asserted & Suits Filed
N=45,532 MPL cases asserted 1/1/09–12/31/13.
Distribution of CBS claims and suits has remained fairly stable over the last five years.
45,532 cases | $6.1B total incurred
ASSERT YEAR
Distribution of Claims and Suits Fairly Stable PROBLEM?
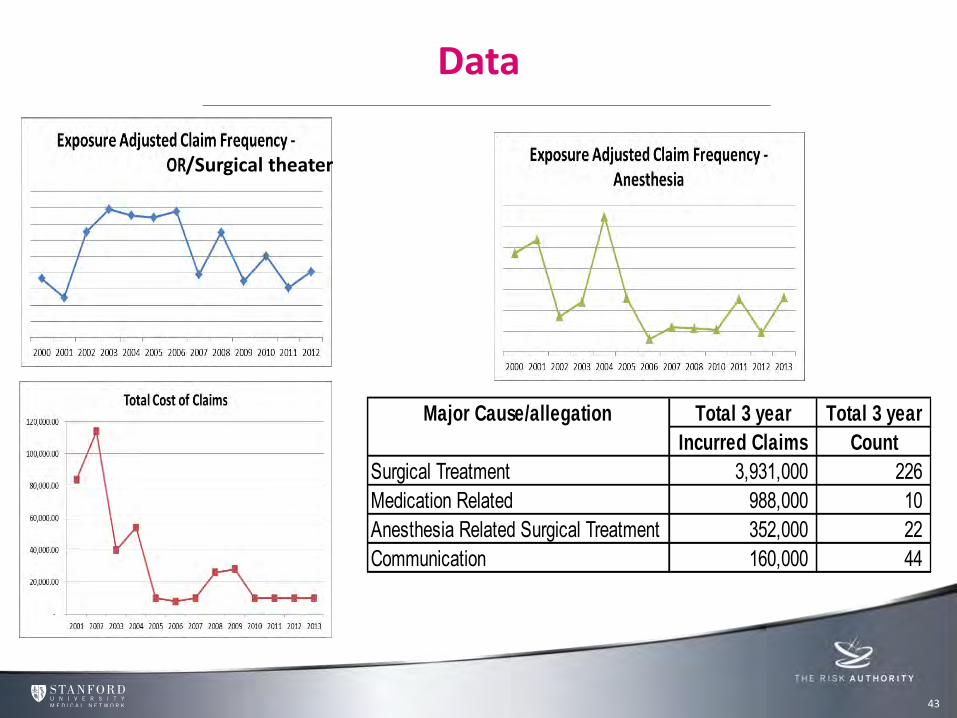
Data
43
Total 3 year Total 3 year
Incurred Claims Count
Surgical Treatment 3,931,000 226 Medication Related 988,000 10 Anesthesia Related Surgical Treatment 352,000 22 Communication 160,000 44
Major Cause/allegation
/Surgical theater
44
© 2014 CRICO Strategies, all rights reserved. See terms of use.
$0
$100,000,000
$200,000,000
$300,000,000
$400,000,000
$500,000,000
$600,000,000
$700,000,000
$800,000,000
$900,000,000
$1,000,000,000
0
1,000
2,000
3,000
4,000
5,000
6,000
7,000
8,000
Su
rgery
Med
icin
e
OB
/Gyn
Nu
rsin
g
An
esth
esio
log
y
Em
erg
en
cy
Ora
l S
urg
/Den
t
Rad
iolo
gy
Psyc
hia
try
Ped
s/N
eo
nate
Path
olo
gy
Ph
arm
ac
y
Oth
er*
TO
TA
L I
NC
UR
RE
D
NU
MB
ER
OF
CA
SE
S
number of cases total incurred
*Other includes Allied Health and non-clinical.Surgery includes General Surgery and all surgical subspecialties. | Medicine includes General Medicine and all medical subspecialties.
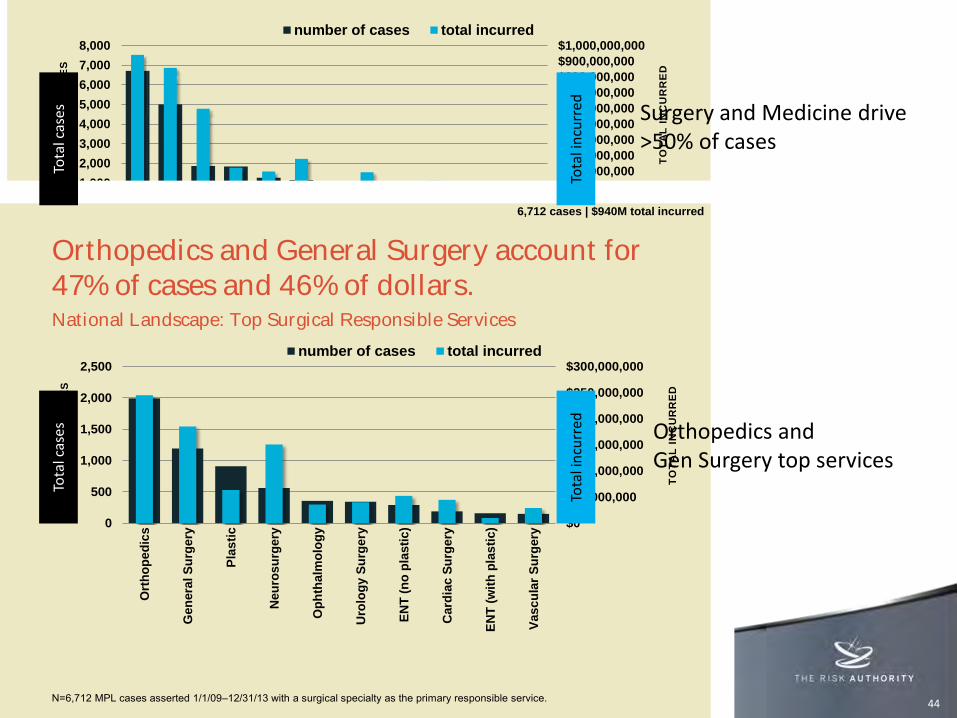
Surgery and Medicine are identified as the primary clinical service in more than 50% of the cases.
21,184 cases | $3.6B total incurred
Responsible service categorizes cases by the primary clinical service.
© 2014 CRICO Strategies, all rights reserved. See terms of use.
$0
$50,000,000
$100,000,000
$150,000,000
$200,000,000
$250,000,000
$300,000,000
0
500
1,000
1,500
2,000
2,500
Ort
ho
pe
dic
s
Gen
era
l S
urg
ery
Pla
sti
c
Neu
ros
urg
ery
Op
hth
alm
olo
gy
Uro
log
y S
urg
ery
EN
T (
no
pla
sti
c)
Card
iac S
urg
ery
EN
T (
wit
h p
las
tic)
Vasc
ula
r S
urg
ery
TO
TA
L I
NC
UR
RE
D
NU
MB
ER
OF
CA
SE
S
number of cases total incurred
National Landscape: Top Surgical Responsible Services
N=6,712 MPL cases asserted 1/1/09–12/31/13 with a surgical specialty as the primary responsible service.
Orthopedics and General Surgery account for 47% of cases and 46% of dollars.
6,712 cases | $940M total incurred
Surgery and Medicine drive >50% of cases
Orthopedics and Gen Surgery top services
Tota
l in
curr
ed
Tota
l in
curr
ed
Tota
l cas
es
Tota
l cas
es
45
© 2014 CRICO Strategies, all rights reserved. See terms of use.
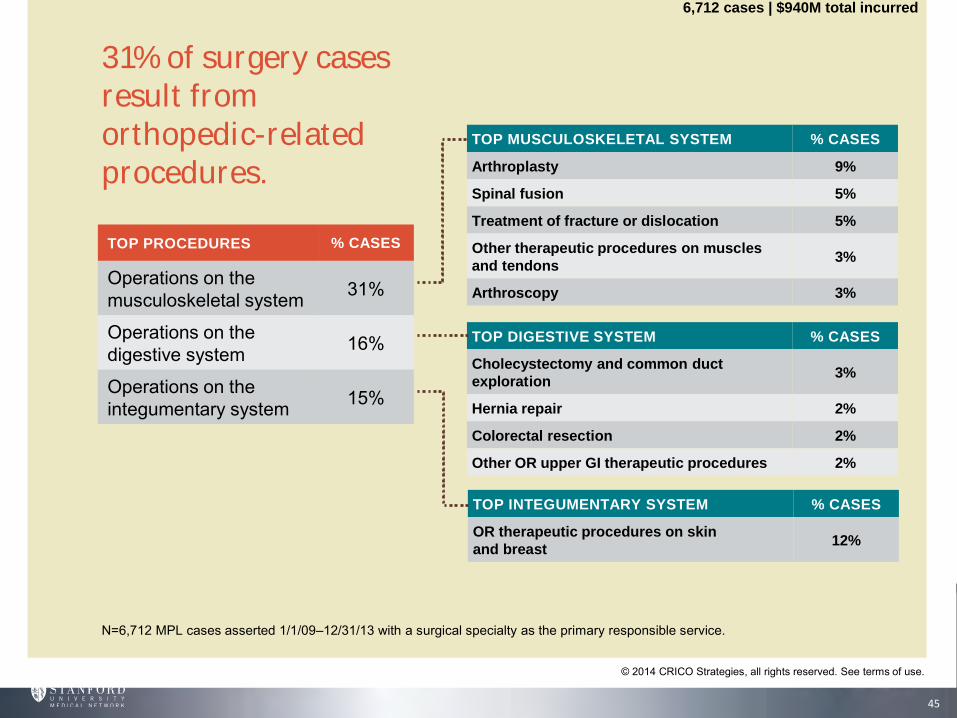
31% of surgery cases result from orthopedic-related procedures.
N=6,712 MPL cases asserted 1/1/09–12/31/13 with a surgical specialty as the primary responsible service.
TOP PROCEDURES % CASES
Operations on the musculoskeletal system 31%
Operations on the digestive system 16%
Operations on the integumentary system 15%
TOP DIGESTIVE SYSTEM % CASES
Cholecystectomy and common duct
exploration3%
Hernia repair 2%
Colorectal resection 2%
Other OR upper GI therapeutic procedures 2%
TOP INTEGUMENTARY SYSTEM % CASES
OR therapeutic procedures on skin
and breast 12%
TOP MUSCULOSKELETAL SYSTEM % CASES
Arthroplasty 9%
Spinal fusion 5%
Treatment of fracture or dislocation 5%
Other therapeutic procedures on muscles
and tendons3%
Arthroscopy 3%
6,712 cases | $940M total incurred

46
© 2014 CRICO Strategies, all rights reserved. See terms of use.
CONTRIBUTING
FACTOR CATEGORY % CASES*
Technical Skill 53%
Clinical Judgment 41%
Behavior-related 28%
Communication 23%
Documentation 12%
Administration 10%
Technical skill and clinical judgment factors are most prevalent in surgery-related cases.
*A case will often have multiple factors identified.
TOP CLINICAL JUDGMENT FACTORS % CASES*
Selection/management therapy—surgical/invasive
procedures13%
Pt assess—failure/delay in ordering diagnostic test 8%
Pt assessment—narrow dx focus—failure to
establish differential diagnosis5%
TOP BEHAVIORAL FACTORS % CASES*
Patient factors—seeking other providers due to
dissatisfaction w/care14%
Patient factors—noncompliance with treatment
regimen6%
Patient factors—noncompliance with follow up
call/appointment4%
TOP TECHNICAL SKILL FACTORS % CASES*
Technical performance—possible technical problem 35%
Technical performance—poor technique 7%
Retained foreign body(material/instruments) 4%
Technical performance—misidentification of an
anatomical structure3%
6,712 cases | $940M total incurred
N=6,712 MPL cases asserted 1/1/09–12/31/13 with a surgical specialty as the primary responsible service.

Work Sheet
47
Steps Actions
Identify
Assess
Evaluate
Mitigate
Monitor
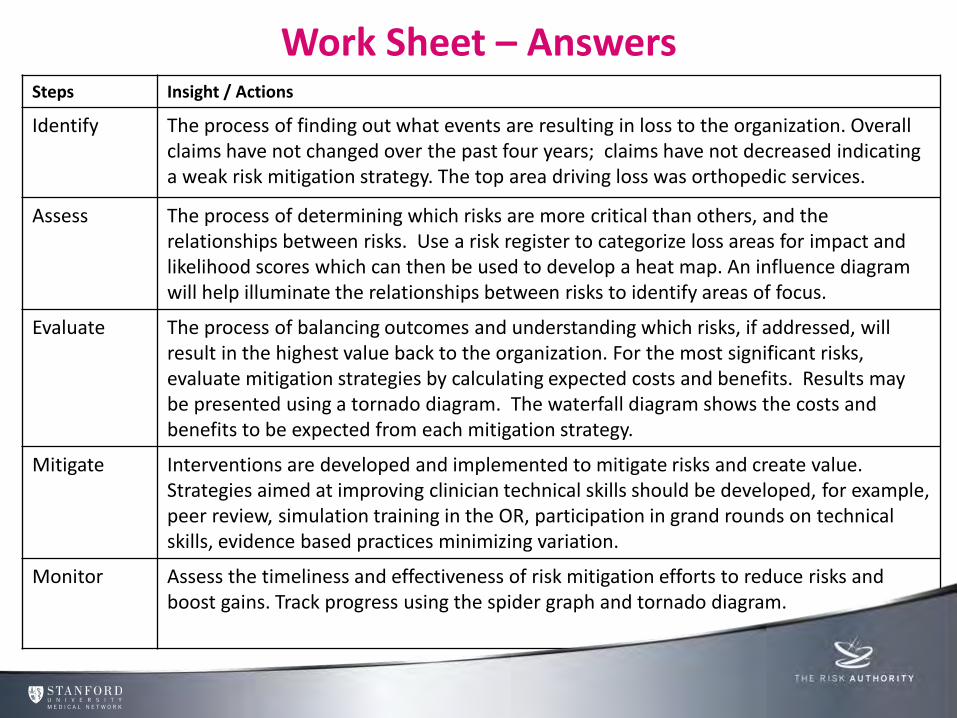
Work Sheet – Answers
48
Steps Insight / Actions
Identify The process of finding out what events are resulting in loss to the organization. Overall claims have not changed over the past four years; claims have not decreased indicating a weak risk mitigation strategy. The top area driving loss was orthopedic services.
Assess The process of determining which risks are more critical than others, and the relationships between risks. Use a risk register to categorize loss areas for impact and likelihood scores which can then be used to develop a heat map. An influence diagram will help illuminate the relationships between risks to identify areas of focus.
Evaluate The process of balancing outcomes and understanding which risks, if addressed, will result in the highest value back to the organization. For the most significant risks, evaluate mitigation strategies by calculating expected costs and benefits. Results may be presented using a tornado diagram. The waterfall diagram shows the costs and benefits to be expected from each mitigation strategy.
Mitigate Interventions are developed and implemented to mitigate risks and create value. Strategies aimed at improving clinician technical skills should be developed, for example, peer review, simulation training in the OR, participation in grand rounds on technical skills, evidence based practices minimizing variation.
Monitor Assess the timeliness and effectiveness of risk mitigation efforts to reduce risks and boost gains. Track progress using the spider graph and tornado diagram.

Agenda
Introducing The Risk Authority Stanford’s Advanced Risk Management System Workshop 1 Influence Culture & Duty of Candour Workshop 2
49
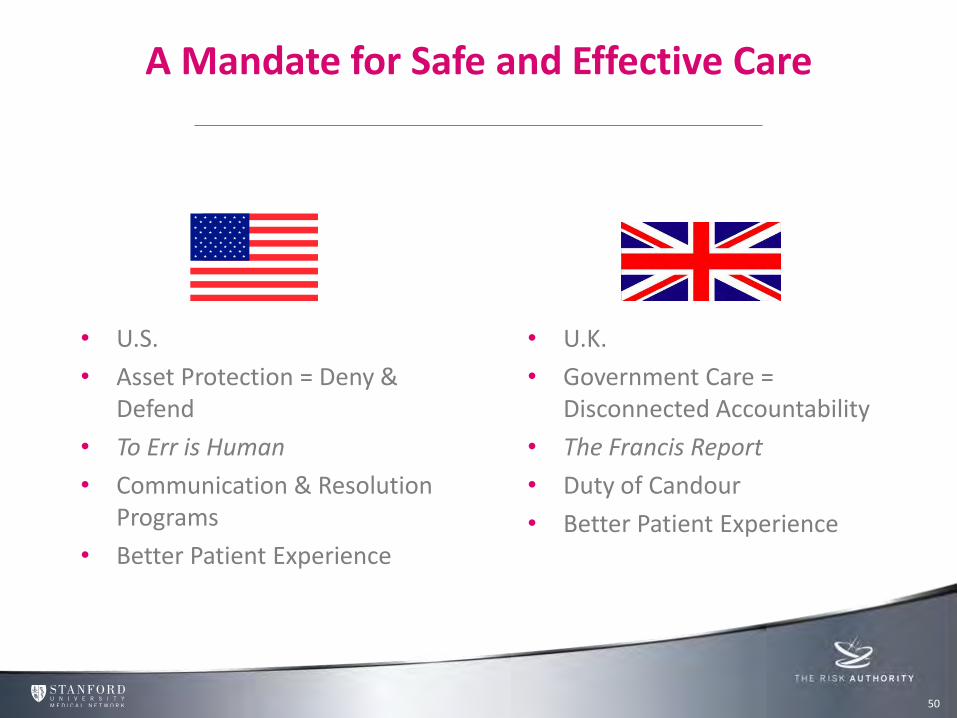
A Mandate for Safe and Effective Care
50
• U.S.
• Asset Protection = Deny & Defend
• To Err is Human
• Communication & Resolution Programs
• Better Patient Experience
• U.K.
• Government Care = Disconnected Accountability
• The Francis Report
• Duty of Candour
• Better Patient Experience
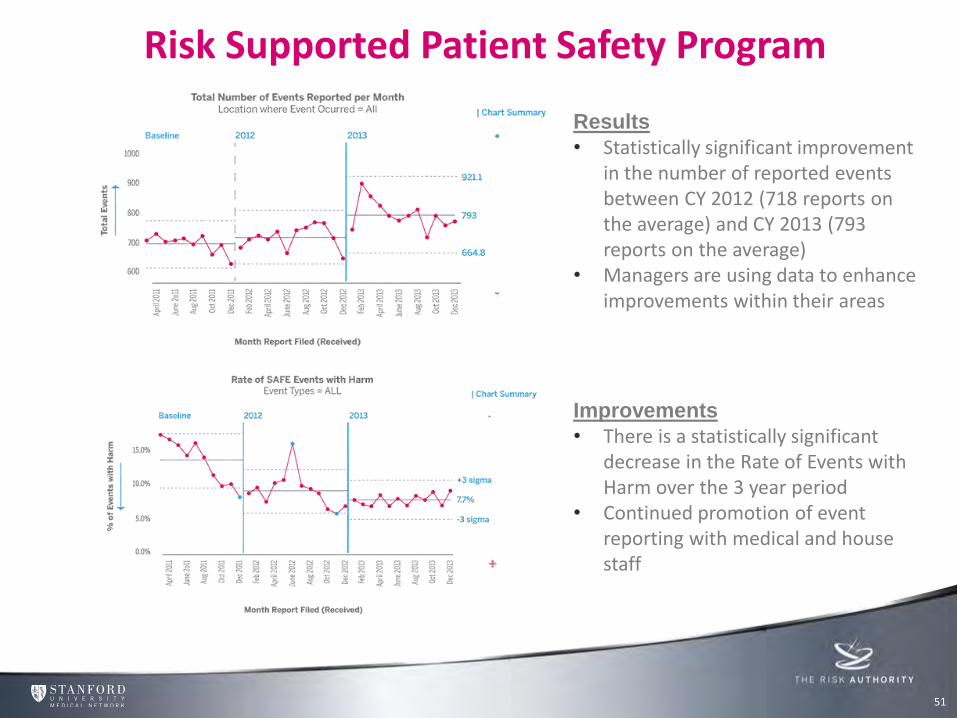
Risk Supported Patient Safety Program
Results • Statistically significant improvement
in the number of reported events between CY 2012 (718 reports on the average) and CY 2013 (793 reports on the average)
• Managers are using data to enhance improvements within their areas
Improvements • There is a statistically significant
decrease in the Rate of Events with Harm over the 3 year period
• Continued promotion of event reporting with medical and house staff
51
52
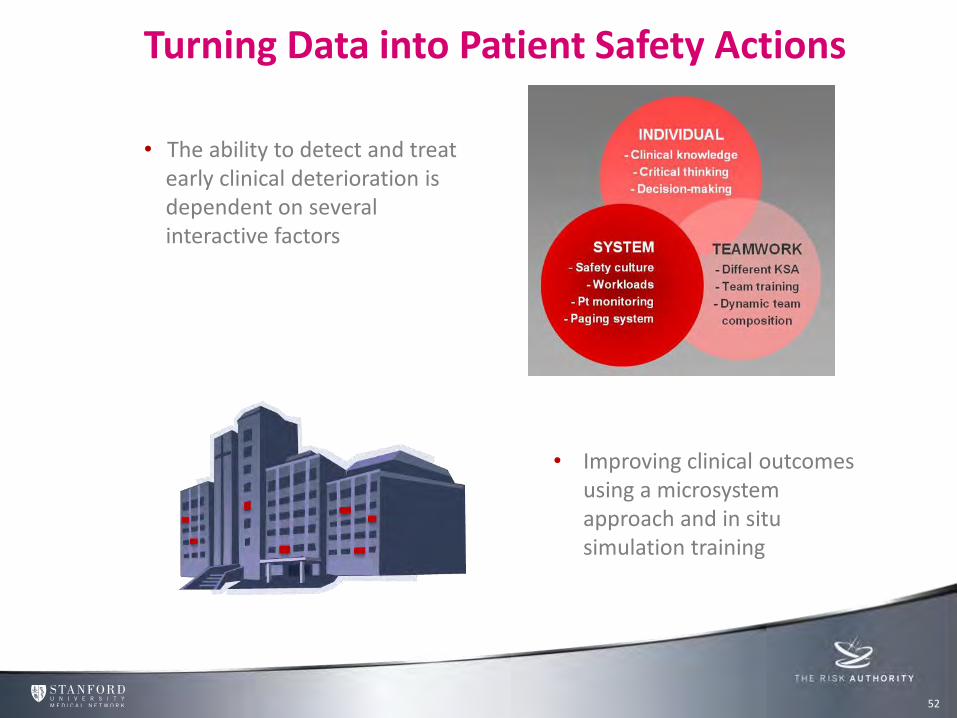
Turning Data into Patient Safety Actions
• Improving clinical outcomes using a microsystem approach and in situ simulation training
• The ability to detect and treat early clinical deterioration is dependent on several interactive factors
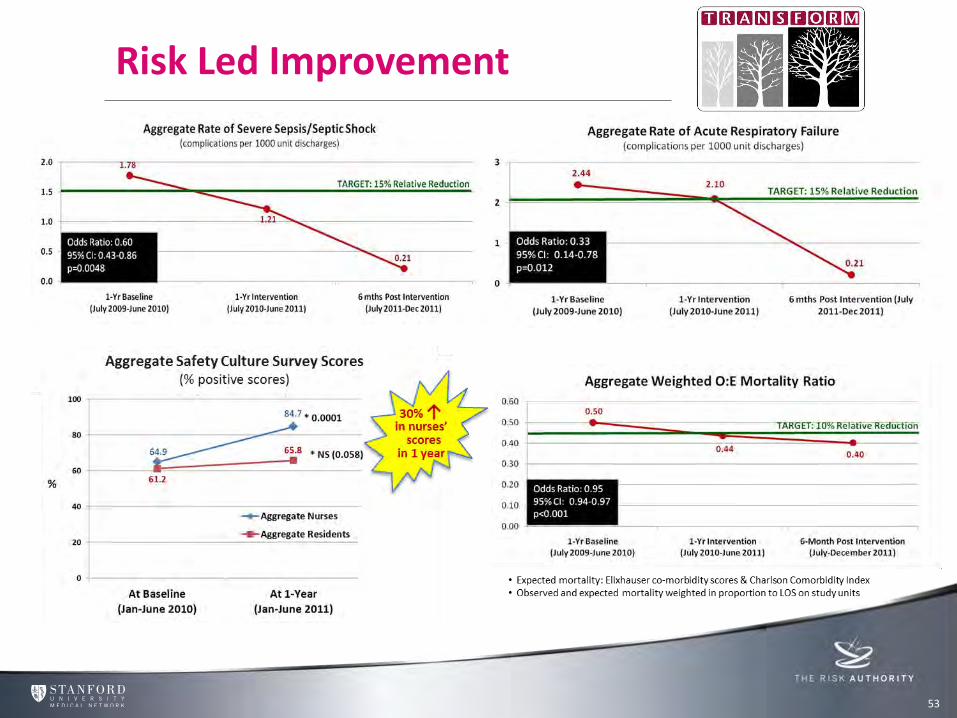
53
Risk Led Improvement
Patient Safety Takes Center Stage
54
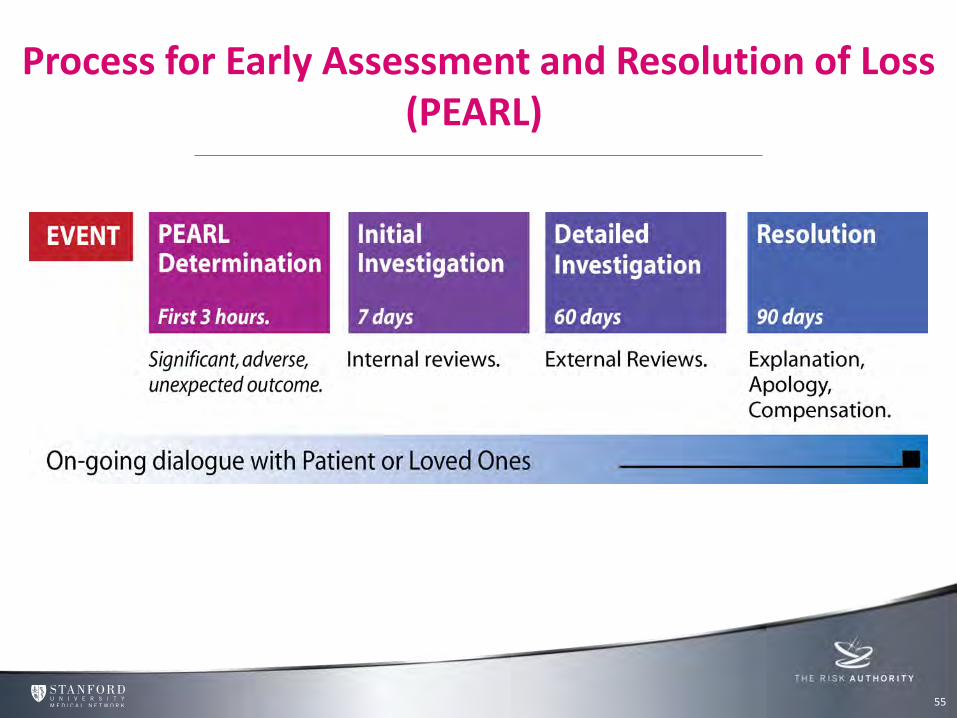
Process for Early Assessment and Resolution of Loss (PEARL)
55

Agenda
Introducing The Risk Authority Stanford’s Advanced Risk Management System Workshop 1 Influence Culture & Duty of Candour Workshop 2
56
Exercise
Review the case
Analyze the facts and review recommendations
Craft a communication to the patient/family
Present your communication to the group
57
Case Study
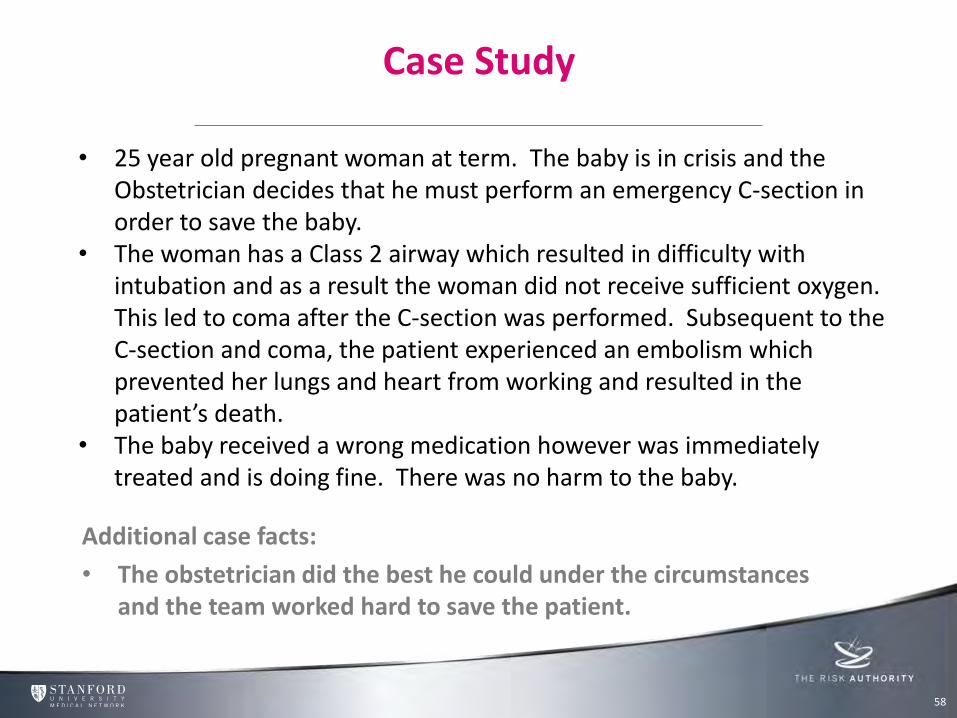
Additional case facts:
• The obstetrician did the best he could under the circumstances and the team worked hard to save the patient.
58
• 25 year old pregnant woman at term. The baby is in crisis and the Obstetrician decides that he must perform an emergency C-section in order to save the baby.
• The woman has a Class 2 airway which resulted in difficulty with intubation and as a result the woman did not receive sufficient oxygen. This led to coma after the C-section was performed. Subsequent to the C-section and coma, the patient experienced an embolism which prevented her lungs and heart from working and resulted in the patient’s death.
• The baby received a wrong medication however was immediately treated and is doing fine. There was no harm to the baby.
Case Study – Group 1
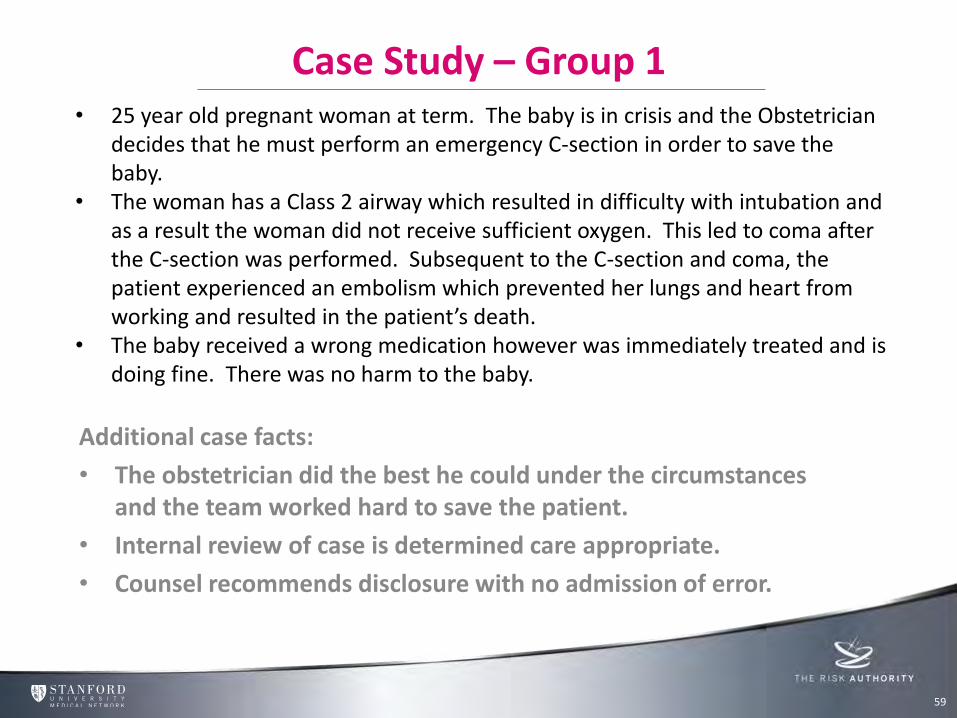
Additional case facts:
• The obstetrician did the best he could under the circumstances and the team worked hard to save the patient.
• Internal review of case is determined care appropriate.
• Counsel recommends disclosure with no admission of error.
59
• 25 year old pregnant woman at term. The baby is in crisis and the Obstetrician decides that he must perform an emergency C-section in order to save the baby.
• The woman has a Class 2 airway which resulted in difficulty with intubation and as a result the woman did not receive sufficient oxygen. This led to coma after the C-section was performed. Subsequent to the C-section and coma, the patient experienced an embolism which prevented her lungs and heart from working and resulted in the patient’s death.
• The baby received a wrong medication however was immediately treated and is doing fine. There was no harm to the baby.

Case Study – Group 2
Additional case facts:
• The obstetrician did the best he could under the circumstances and the team worked hard to save the patient.
• Internal review of case is determined care appropriate.
• External review of case is determined to have improvement opportunity.
• Counsel recommends disclosure with simple apology for outcome.
60
• 25 year old pregnant woman at term. The baby is in crisis and the Obstetrician decides that he must perform an emergency C-section in order to save the baby.
• The woman has a Class 2 airway which resulted in difficulty with intubation and as a result the woman did not receive sufficient oxygen. This led to coma after the C-section was performed. Subsequent to the C-section and coma, the patient experienced an embolism which prevented her lungs and heart from working and resulted in the patient’s death.
• The baby received a wrong medication however was immediately treated and is doing fine. There was no harm to the baby.
Case Study – Group 3
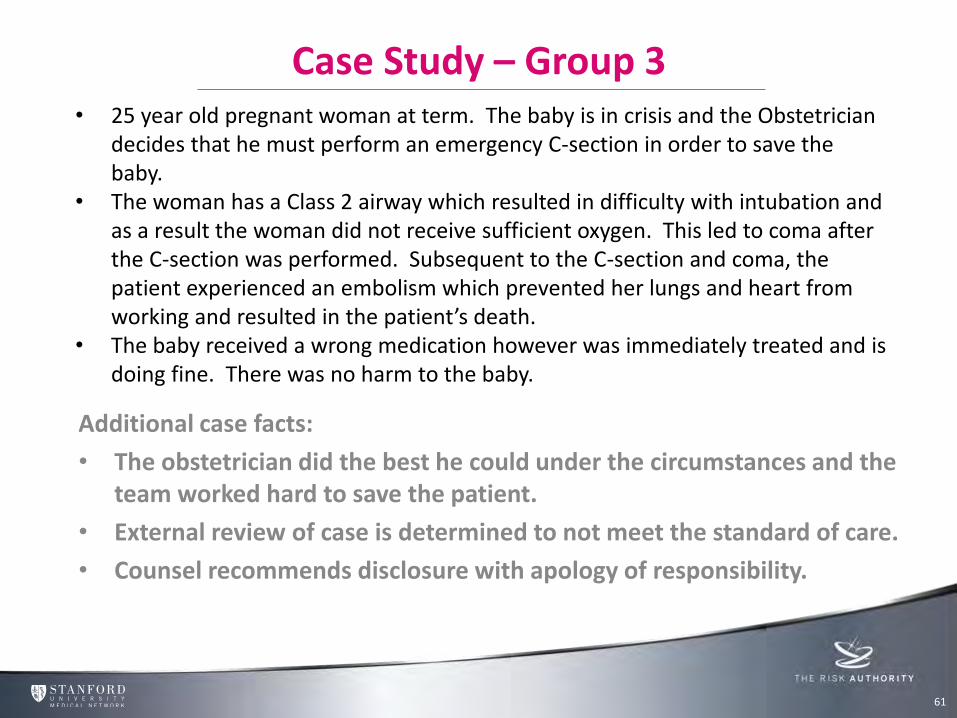
Additional case facts:
• The obstetrician did the best he could under the circumstances and the team worked hard to save the patient.
• External review of case is determined to not meet the standard of care.
• Counsel recommends disclosure with apology of responsibility.
61
• 25 year old pregnant woman at term. The baby is in crisis and the Obstetrician decides that he must perform an emergency C-section in order to save the baby.
• The woman has a Class 2 airway which resulted in difficulty with intubation and as a result the woman did not receive sufficient oxygen. This led to coma after the C-section was performed. Subsequent to the C-section and coma, the patient experienced an embolism which prevented her lungs and heart from working and resulted in the patient’s death.
• The baby received a wrong medication however was immediately treated and is doing fine. There was no harm to the baby.
Video 2: Disclosure with Apology of Sympathy
63
http://youtu.be/yZB773dHyjE
Video 3: Disclosure with Apology of Responsibility
64
http://youtu.be/ngCZAsh2wD8

Inspiring Clinical Safety Excellence Concluding Remarks


