Ooredoo Maldives Investor Presentation 1
Initial Public Offering of Ooredoo Maldives Plc
IPO Opens on April 30, 2017
LEAD FINANCIAL ADVISOR AND MANAGER TO THE OFFER
Ooredoo Maldives Investor Presentation 2
This Presentation (the “Presentation”) has been prepared by Ooredoo Maldives Plc (“OMPL” or the “Company”) solely for use with
professional or institutional investors. This Presentation is strictly confidential and is furnished to you solely for your information. It
should not be treated as giving investment advice and may not be copied, reproduced, distributed or otherwise made available (in
whole or in part) to any other person (including any member of the press) and it may not be published, in whole or in part, by any
medium for any purpose. No specific investment objectives, financial situation or particular needs of any recipient have been taken into
consideration in connection with the preparation of this Presentation.
The information contained in this presentation has not been independently verified. No representation or warranty, express or implied, is
made as to, and no reliance should be placed on, the fairness, accuracy, completeness or correctness of the information or opinions
contained in this Presentation. None of the Company, its advisors or any of their respective representatives or affiliates undertakes to
update, complete, revise or amend the information contained in this Presentation subsequent to the date hereof. Furthermore, none of
the Company, its advisors or any of their respective representatives or affiliates shall have any liability whatsoever (in negligence or
otherwise) for any loss, whether direct or indirect, howsoever arising from any use of this Presentation or its contents or otherwise
arising in connection with this Presentation.
This Presentation contains certain “forward-looking statements” that speak only as of the date of this Presentation. Such statements are
made on the basis of assumptions and expectations that the Company currently believes are reasonable, but could in the future prove
to be wrong. All forward-looking statements are subject to risks, uncertainties and assumptions that could cause actual outcomes to
differ materially from those contemplated by the relevant forward-looking statement. Important factors that could cause actual results to
differ materially from the Company assumptions and expectations include, among others: The Company’s ability to manage domestic
and international growth and maintain a high level of customer service; future sales growth; market acceptance of the Company product
and service offerings; the Company’s ability to secure adequate financing or equity capital to fund its operations; network expansion;
performance of the Company network and equipment; cooperation of incumbent local exchange carriers in provisioning lines and
interconnecting the Company’s equipment; regulatory approval processes; changes in technology; price competition and other market
conditions and associated political risks. The risks referred to above are morefully described in Section 12 of the IPO Prospectus.
This Presentation does not constitute an offering of securities or otherwise constitute an invitation or inducement to any person to
underwrite, subscribe for or otherwise acquire or dispose of securities in the Company.
By accepting this Presentation the recipient agrees to be bound by the foregoing limitations.
Disclaimer
Ooredoo Maldives Investor Presentation 3
1. The Offer
2. The Company
3. Outlook for the Market and the Company
4. Key Assumptions and Financial Forecasts
5. Valuation
6. Subscription Process
7. Annexures
8. Abbreviations
Contents
Ooredoo Maldives Investor Presentation 4
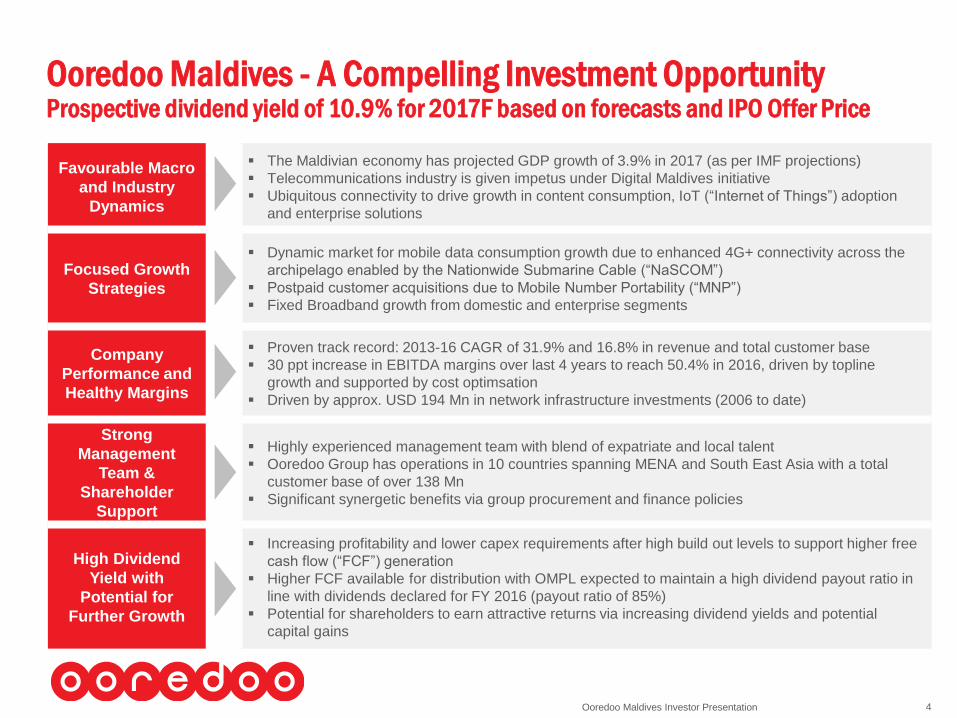
Ooredoo Maldives - A Compelling Investment OpportunityProspective dividend yield of 10.9% for 2017F based on forecasts and IPO Offer Price
Favourable Macro
and Industry
Dynamics
The Maldivian economy has projected GDP growth of 3.9% in 2017 (as per IMF projections)
Telecommunications industry is given impetus under Digital Maldives initiative
Ubiquitous connectivity to drive growth in content consumption, IoT (“Internet of Things”) adoption
and enterprise solutions
Focused Growth
Strategies
Dynamic market for mobile data consumption growth due to enhanced 4G+ connectivity across the
archipelago enabled by the Nationwide Submarine Cable (“NaSCOM”)
Postpaid customer acquisitions due to Mobile Number Portability (“MNP”)
Fixed Broadband growth from domestic and enterprise segments
Company
Performance and
Healthy Margins
Proven track record: 2013-16 CAGR of 31.9% and 16.8% in revenue and total customer base
30 ppt increase in EBITDA margins over last 4 years to reach 50.4% in 2016, driven by topline
growth and supported by cost optimsation
Driven by approx. USD 194 Mn in network infrastructure investments (2006 to date)
Strong
Management
Team &
Shareholder
Support
Highly experienced management team with blend of expatriate and local talent
Ooredoo Group has operations in 10 countries spanning MENA and South East Asia with a total
customer base of over 138 Mn
Significant synergetic benefits via group procurement and finance policies
High Dividend
Yield with
Potential for
Further Growth
Increasing profitability and lower capex requirements after high build out levels to support higher free
cash flow (“FCF”) generation
Higher FCF available for distribution with OMPL expected to maintain a high dividend payout ratio in
line with dividends declared for FY 2016 (payout ratio of 85%)
Potential for shareholders to earn attractive returns via increasing dividend yields and potential
capital gains
Ooredoo Maldives Investor Presentation 5
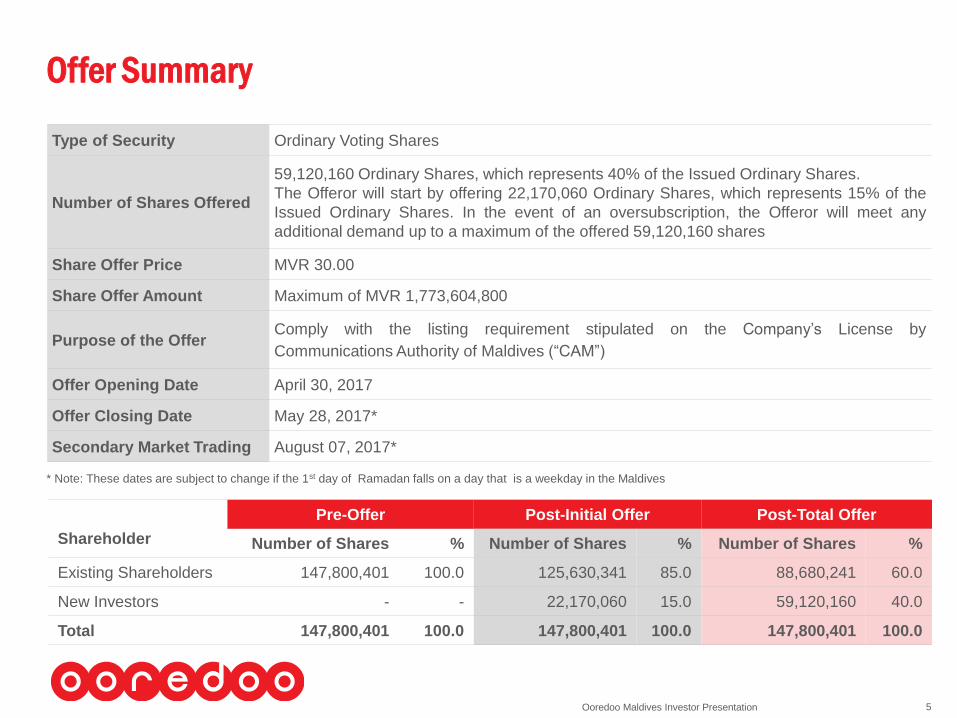
Offer Summary
Type of Security Ordinary Voting Shares
Number of Shares Offered
59,120,160 Ordinary Shares, which represents 40% of the Issued Ordinary Shares.
The Offeror will start by offering 22,170,060 Ordinary Shares, which represents 15% of the
Issued Ordinary Shares. In the event of an oversubscription, the Offeror will meet any
additional demand up to a maximum of the offered 59,120,160 shares
Share Offer Price MVR 30.00
Share Offer Amount Maximum of MVR 1,773,604,800
Purpose of the OfferComply with the listing requirement stipulated on the Company’s License by
Communications Authority of Maldives (“CAM”)
Offer Opening Date April 30, 2017
Offer Closing Date May 28, 2017*
Secondary Market Trading August 07, 2017*
Shareholder
Pre-Offer Post-Initial Offer Post-Total Offer
Number of Shares % Number of Shares % Number of Shares %
Existing Shareholders 147,800,401 100.0 125,630,341 85.0 88,680,241 60.0
New Investors - - 22,170,060 15.0 59,120,160 40.0
Total 147,800,401 100.0 147,800,401 100.0 147,800,401 100.0
* Note: These dates are subject to change if the 1st day of Ramadan falls on a day that is a weekday in the Maldives
Ooredoo Maldives Investor Presentation 6
1. The Offer
2. The Company
3. Outlook for the Market and the Company
4. Key Assumptions and Financial Forecasts
5. Valuation
6. Subscription Process
7. Annexures
8. Abbreviations
Contents
Ooredoo Maldives Investor Presentation 7
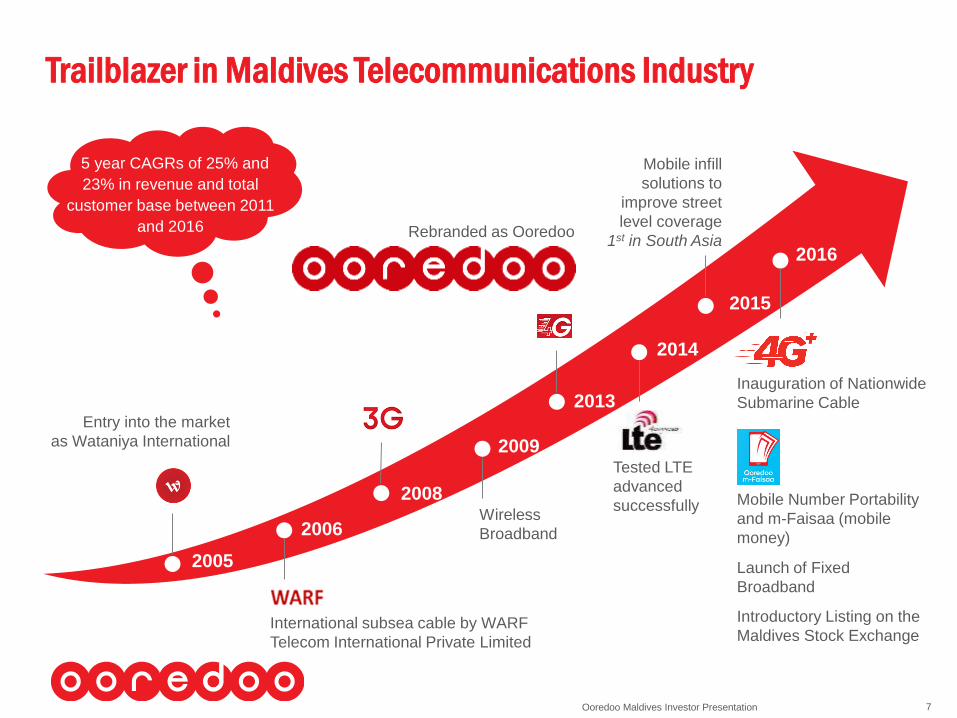
Trailblazer in Maldives Telecommunications Industry
Inauguration of Nationwide
Submarine Cable
Mobile infill
solutions to
improve street
level coverage
1st in South Asia
Wireless
Broadband
2005
Entry into the market
as Wataniya International
2006
International subsea cable by WARF
Telecom International Private Limited
2008
2009
2013
Rebranded as Ooredoo
2014
Tested LTE
advanced
successfully
2015
2016
Mobile Number Portability
and m-Faisaa (mobile
money)
Launch of Fixed
Broadband
Introductory Listing on the
Maldives Stock Exchange
5 year CAGRs of 25% and
23% in revenue and total
customer base between 2011
and 2016
Ooredoo Maldives Investor Presentation 8
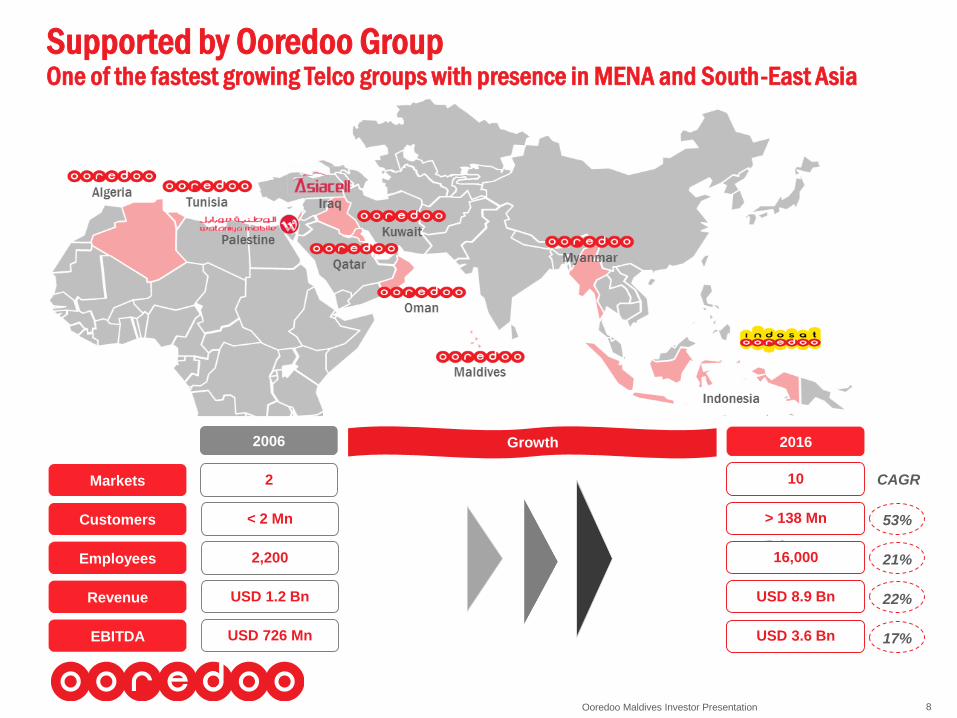
Supported by Ooredoo GroupOne of the fastest growing Telco groups with presence in MENA and South-East Asia
CAGR
22%
17%
53%
21%
Revenue
EBITDA
Customers
Employees
Markets
USD 1.2 Bn
USD 726 Mn
< 2 Mn
2,200
2
2006
USD 8.9 Bn
USD 3.6 Bn
> 138 Mn
16,000
10
2016Growth
Ooredoo Maldives Investor Presentation 9
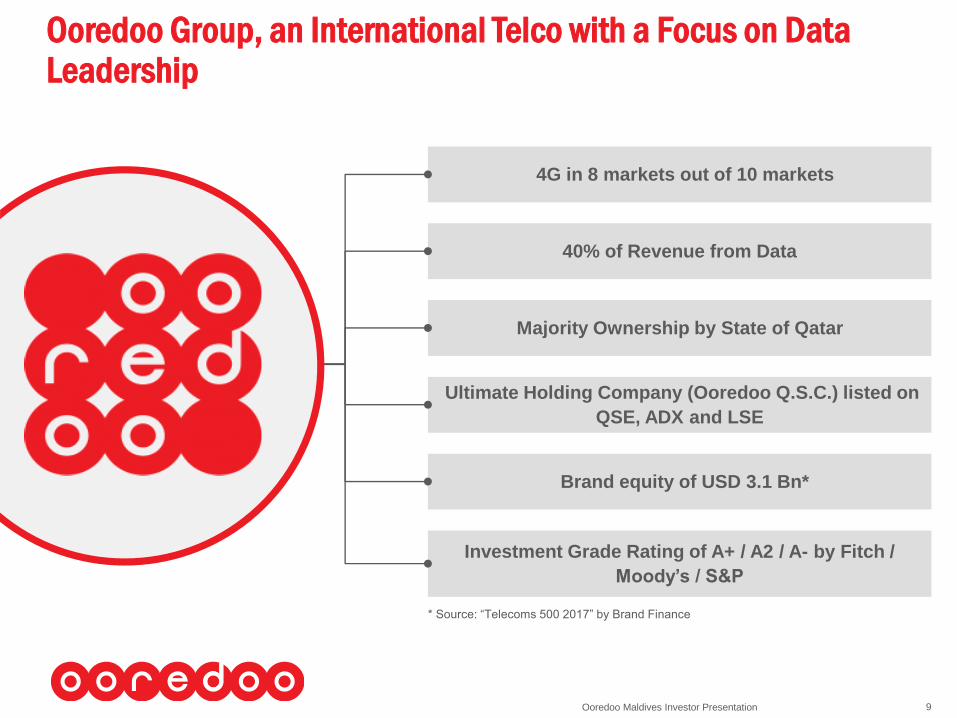
4G in 8 markets out of 10 markets
40% of Revenue from Data
Majority Ownership by State of Qatar
Ultimate Holding Company (Ooredoo Q.S.C.) listed on
QSE, ADX and LSE
Brand equity of USD 3.1 Bn*
Investment Grade Rating of A+ / A2 / A- by Fitch /
Moody’s / S&P
Ooredoo Group, an International Telco with a Focus on Data Leadership
* Source: “Telecoms 500 2017” by Brand Finance
Ooredoo Maldives Investor Presentation 10
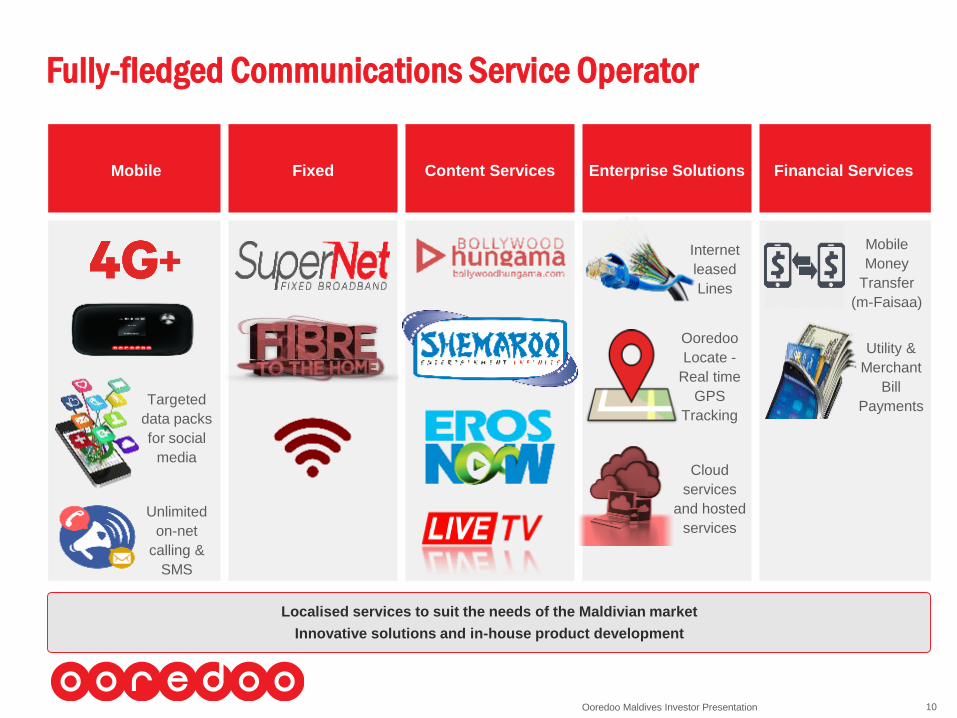
Fully-fledged Communications Service Operator
Mobile Fixed Content Services Enterprise Solutions Financial Services
Localised services to suit the needs of the Maldivian market
Innovative solutions and in-house product development
Unlimited
on-net
calling &
SMS
Targeted
data packs
for social
media
Internet
leased
Lines
Ooredoo
Locate -
Real time
GPS
Tracking
Cloud
services
and hosted
services
Utility &
Merchant
Bill
Payments
Mobile
Money
Transfer
(m-Faisaa)
Ooredoo Maldives Investor Presentation 11
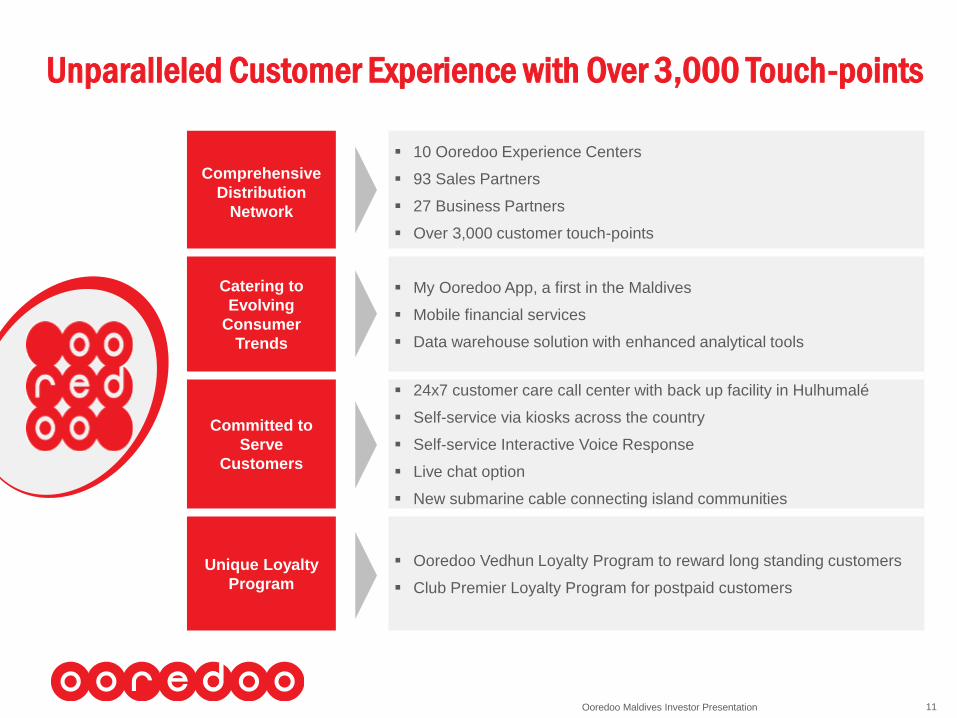
Unparalleled Customer Experience with Over 3,000 Touch-points
Comprehensive
Distribution
Network
10 Ooredoo Experience Centers
93 Sales Partners
27 Business Partners
Over 3,000 customer touch-points
Catering to
Evolving
Consumer
Trends
My Ooredoo App, a first in the Maldives
Mobile financial services
Data warehouse solution with enhanced analytical tools
Committed to
Serve
Customers
24x7 customer care call center with back up facility in Hulhumalé
Self-service via kiosks across the country
Self-service Interactive Voice Response
Live chat option
New submarine cable connecting island communities
Unique Loyalty
Program
Ooredoo Vedhun Loyalty Program to reward long standing customers
Club Premier Loyalty Program for postpaid customers
Ooredoo Maldives Investor Presentation 12
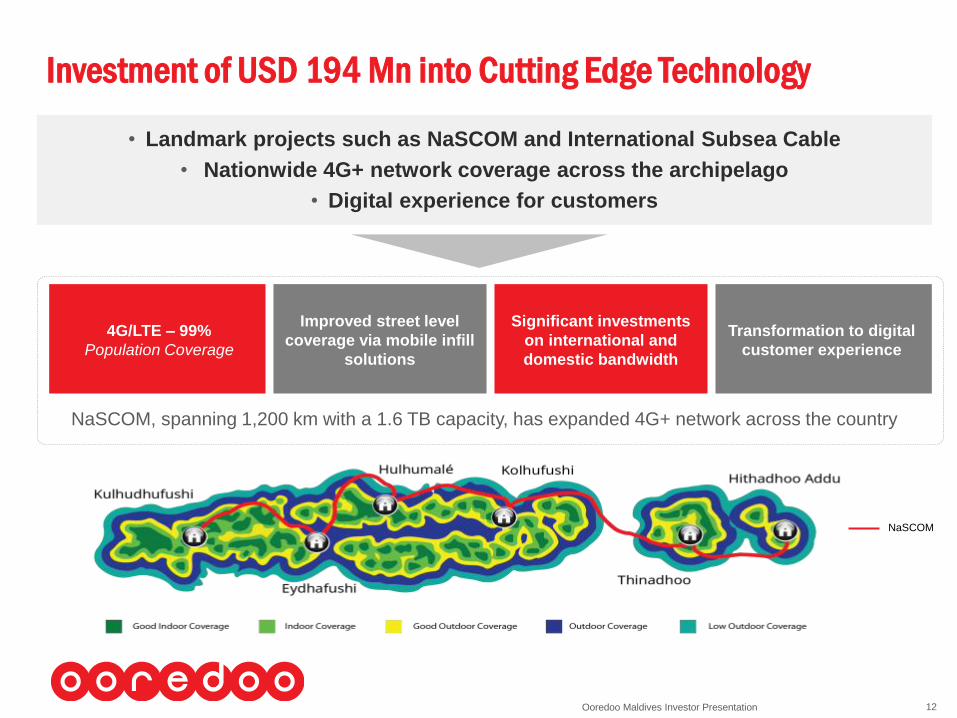
Investment of USD 194 Mn into Cutting Edge Technology
4G/LTE – 99%
Population Coverage
Improved street level
coverage via mobile infill
solutions
Significant investments
on international and
domestic bandwidth
Transformation to digital
customer experience
NaSCOM, spanning 1,200 km with a 1.6 TB capacity, has expanded 4G+ network across the country
• Landmark projects such as NaSCOM and International Subsea Cable
• Nationwide 4G+ network coverage across the archipelago
• Digital experience for customers
NaSCOM

Ooredoo Maldives Investor Presentation 13
High Calibre Executive Leadership (1/3)
Mr. Vikram Sinha Managing Director / Executive Director
Mr. Najib KhanChief Executive Officer / Executive Director
Mr. Ramanathan Sivakumar Chief Financial Officer / Executive Director
>17 years in telecom, media and
FMCG
Served as CEO of Ooredoo
Maldives from April 2014 to April
2017. Former Managing Director
of Airtel Seychelles and COO at
Airtel Brazzaville, Congo
Holds a Bachelor of Business
Management (Marketing) degree
and an MBA
>25 years in telecom with
expertise in managing Enterprise,
Wholesale and B2C commercial
activities
Former Senior Director –
Commercial at Ooredoo Group
and CXO at Bharti Airtel India
Holds a Bachelor of Science in
Industrial Electronics Engineering
from Mumbai University
>25 years in telecom and
manufacturing
Former Financial Controller of
Ooredoo Kuwait
A Commerce Graduate from the
University of Madras, India and a
Fellow Chartered Accountant
from the Institute of Chartered
Accountants of India

Ooredoo Maldives Investor Presentation 14
High Calibre Executive Leadership (2/3)
Mr. M. S. TanwarChief Technology Officer
Mr. Balaji SrinivasanChief Commercial Officer
Mr. Mohamed ShahidDirector – HR and Administration
>25 years in telecom
Expertise in R&D, network
engineering, projects, operations
and business development
Holds a Bachelor’s degree in
Electronics and Communications
Engineering and an MBA in
Operations Management
>23 years
of commercial experience
Former Director of Marketing and
Customer Experience at Essar
Telecom Kenya and VP –
Marketing at IDEA Cellular
Holds a Bachelor of Commerce
Degree
>14 years
of industry experience
Managed the Operations,
Training and HR departments at
MNDF
Holds an MBA with a major in
Entrepreneurship

Ooredoo Maldives Investor Presentation 15
High Calibre Executive Leadership (3/3)
Mr. Sunil MishraHead of Strategy and PMO
Ms. Gulnaz MahirHead of Customer Care
Mr. Hussain NiyazHead of Sales
>12 years
in telecom, manufacturing and
e-commerce
Experienced in business strategy
and planning, ERM and project
management at Airtel, Flipkart and
Toyota
Mechanical Engineering Graduate,
Post-Graduate in Business
Management and Project
Management Professional
>8 years of experience
Prior expertise in Finance and
Commercial fields
Holds a BA Honors and a
Master’s Degree in Economics
and Finance
>23 years in telecom
Held key posts in networks,
network planning and sales
within OMPL
Holds an Executive Masters in
Telecom Management
Ooredoo Maldives Investor Presentation 16
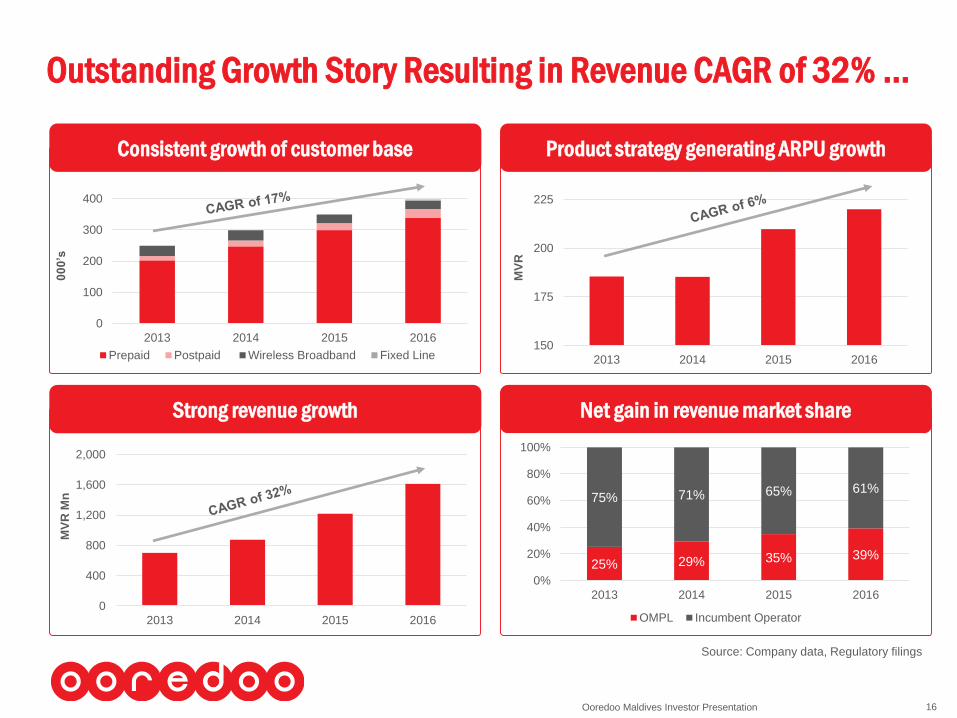
Consistent growth of customer base Product strategy generating ARPU growth
Outstanding Growth Story Resulting in Revenue CAGR of 32% ...
Strong revenue growth Net gain in revenue market share
0
100
200
300
400
2013 2014 2015 2016
00
0’s
Prepaid Postpaid Wireless Broadband Fixed Line150
175
200
225
2013 2014 2015 2016
MV
R
0
400
800
1,200
1,600
2,000
2013 2014 2015 2016
MV
R M
n
25% 29% 35% 39%
75% 71% 65% 61%
0%
20%
40%
60%
80%
100%
2013 2014 2015 2016
OMPL Incumbent Operator
Source: Company data, Regulatory filings
Ooredoo Maldives Investor Presentation 17
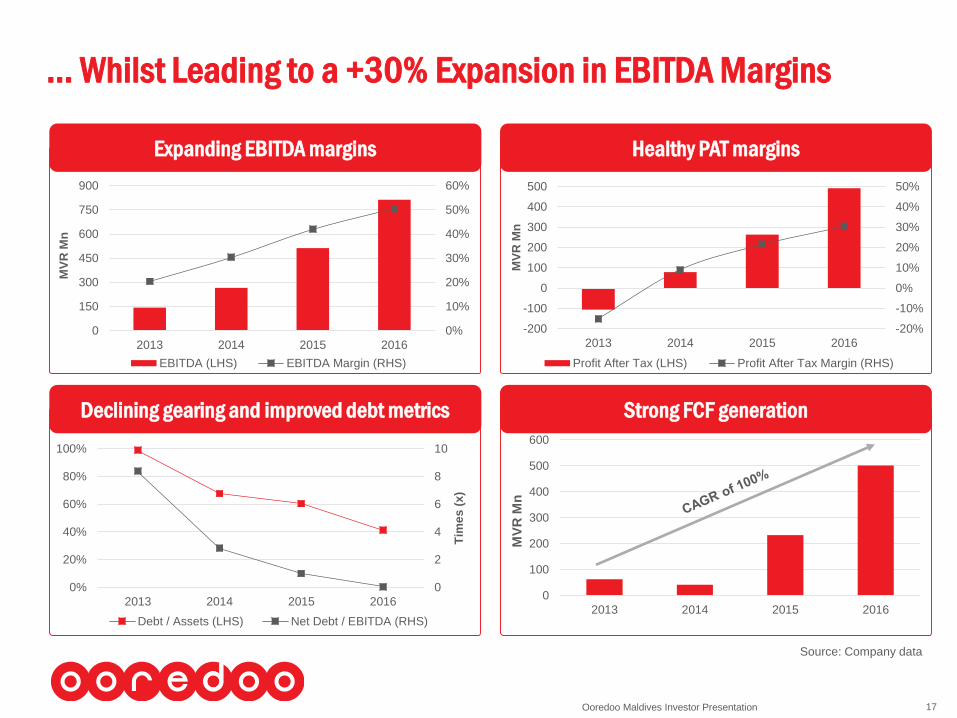
Healthy PAT margins
… Whilst Leading to a +30% Expansion in EBITDA Margins
Strong FCF generation
0%
10%
20%
30%
40%
50%
60%
0
150
300
450
600
750
900
2013 2014 2015 2016
MV
R M
n
EBITDA (LHS) EBITDA Margin (RHS)
-20%
-10%
0%
10%
20%
30%
40%
50%
-200
-100
0
100
200
300
400
500
2013 2014 2015 2016
MV
R M
n
Profit After Tax (LHS) Profit After Tax Margin (RHS)
0
2
4
6
8
10
0%
20%
40%
60%
80%
100%
2013 2014 2015 2016
Tim
es
(x
)
Debt / Assets (LHS) Net Debt / EBITDA (RHS)
0
100
200
300
400
500
600
2013 2014 2015 2016
MV
R M
n
Expanding EBITDA margins
Declining gearing and improved debt metrics
Source: Company data
Ooredoo Maldives Investor Presentation 18
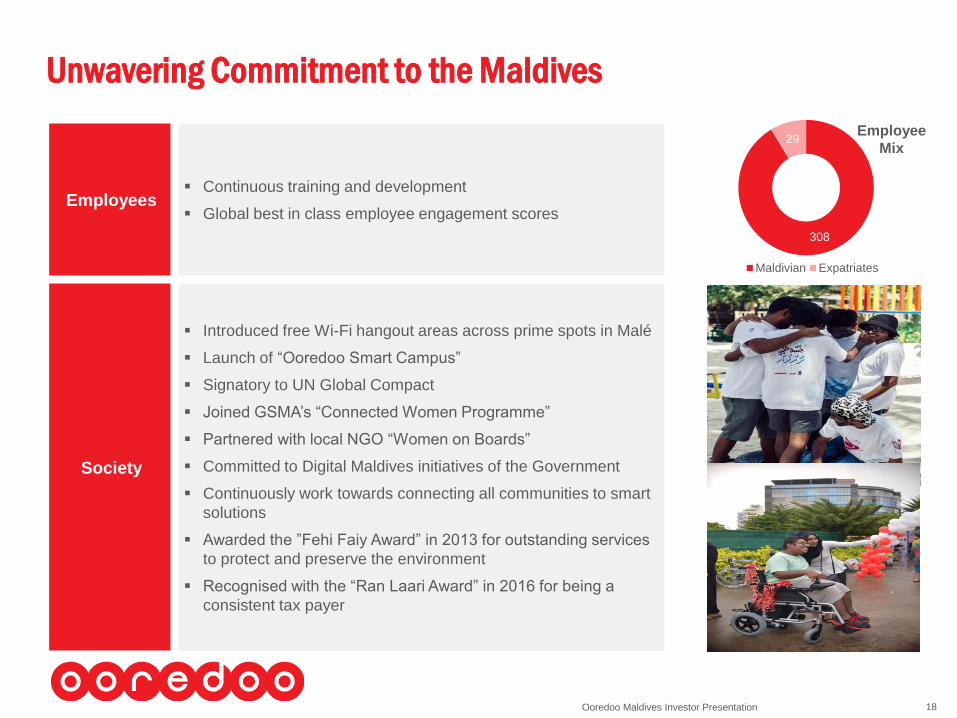
Unwavering Commitment to the Maldives
Employees Continuous training and development
Global best in class employee engagement scores
Society
Introduced free Wi-Fi hangout areas across prime spots in Malé
Launch of “Ooredoo Smart Campus”
Signatory to UN Global Compact
Joined GSMA’s “Connected Women Programme”
Partnered with local NGO “Women on Boards”
Committed to Digital Maldives initiatives of the Government
Continuously work towards connecting all communities to smart
solutions
Awarded the ”Fehi Faiy Award” in 2013 for outstanding services
to protect and preserve the environment
Recognised with the “Ran Laari Award” in 2016 for being a
consistent tax payer
308
29
Maldivian Expatriates
Employee
Mix
Ooredoo Maldives Investor Presentation 19
1. The Offer
2. The Company
3. Outlook for the Market and the Company
4. Key Assumptions and Financial Forecasts
5. Valuation
6. Subscription Process
7. Annexures
8. Abbreviations
Contents
Ooredoo Maldives Investor Presentation 20
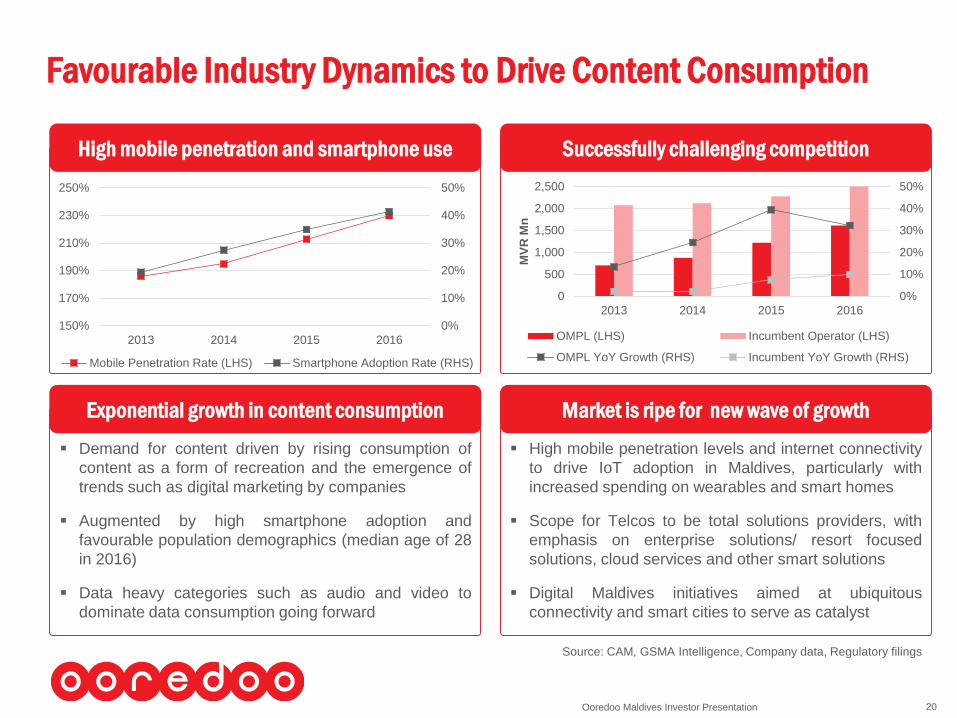
Successfully challenging competition
Favourable Industry Dynamics to Drive Content Consumption
Market is ripe for new wave of growth
Demand for content driven by rising consumption of
content as a form of recreation and the emergence of
trends such as digital marketing by companies
Augmented by high smartphone adoption and
favourable population demographics (median age of 28
in 2016)
Data heavy categories such as audio and video to
dominate data consumption going forward
High mobile penetration levels and internet connectivity
to drive IoT adoption in Maldives, particularly with
increased spending on wearables and smart homes
Scope for Telcos to be total solutions providers, with
emphasis on enterprise solutions/ resort focused
solutions, cloud services and other smart solutions
Digital Maldives initiatives aimed at ubiquitous
connectivity and smart cities to serve as catalyst
0%
10%
20%
30%
40%
50%
150%
170%
190%
210%
230%
250%
2013 2014 2015 2016
Mobile Penetration Rate (LHS) Smartphone Adoption Rate (RHS)
High mobile penetration and smartphone use
Exponential growth in content consumption
0%
10%
20%
30%
40%
50%
0
500
1,000
1,500
2,000
2,500
2013 2014 2015 2016
MV
R M
n
OMPL (LHS) Incumbent Operator (LHS)
OMPL YoY Growth (RHS) Incumbent YoY Growth (RHS)
Source: CAM, GSMA Intelligence, Company data, Regulatory filings
Ooredoo Maldives Investor Presentation 21
Value Accretive Strategies Leading to Margin Expansion
Cost optimisation leading to margin expansion
NaSCOM to boost data revenue via superior 4G+
coverage
Data consumption to be driven by demand for content
and increasing smartphone usage
Recently acquired ISP license expected to create high
growth revenue stream via fixed broadband services
Postpaid segment benefits from MNP
Emergence of NaSCOM to reduce network costs
leading to significant cost efficiencies
Continuous benefits in optimising capex via group
procurement strengths
Multiple initiatives to further optimise costs and expand
EBITDA and PAT margins
Data leadership focused growth strategies
Ooredoo Maldives Investor Presentation 22
Growing Cash Flows Available for Distribution
Increasing FCF available for distribution
Drop in forecast capex to sales ratio expected due to
significant investments made over the past few years
Average forecast capex to sales as per business plan
to be approx. 17% compared to an average of 24%
between 2013 and 2016
FCF is forecasted to continue its growth trajectory
driven by improving profitability and optimisation of
capex
Expected to result in attractive returns to shareholders
with the ability to maintain high dividend payouts while
investing for growth
Moderate future capex requirements
Ooredoo Maldives Investor Presentation 23
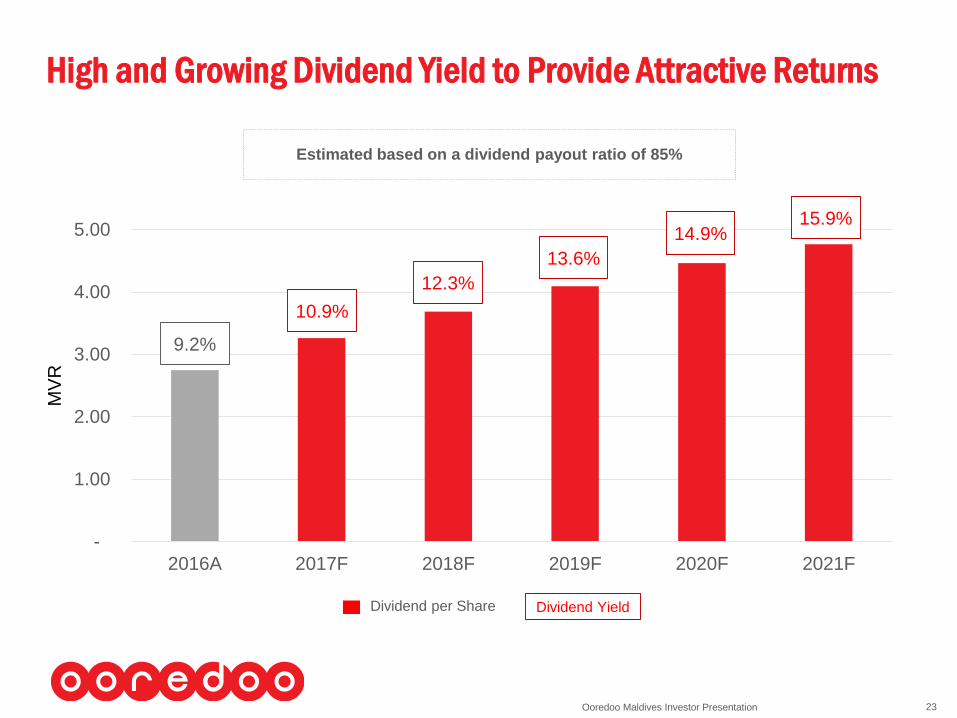
High and Growing Dividend Yield to Provide Attractive Returns
-
1.00
2.00
3.00
4.00
5.00
2016A 2017F 2018F 2019F 2020F 2021F
MV
R
9.2%
13.6%
12.3%
15.9%14.9%
10.9%
Estimated based on a dividend payout ratio of 85%
Dividend YieldDividend per Share
Ooredoo Maldives Investor Presentation 24
1. The Offer
2. The Company
3. Outlook for the Market and the Company
4. Key Assumptions and Financial Forecasts
5. Valuation
6. Subscription Process
7. Annexures
8. Abbreviations
Contents
Ooredoo Maldives Investor Presentation 25
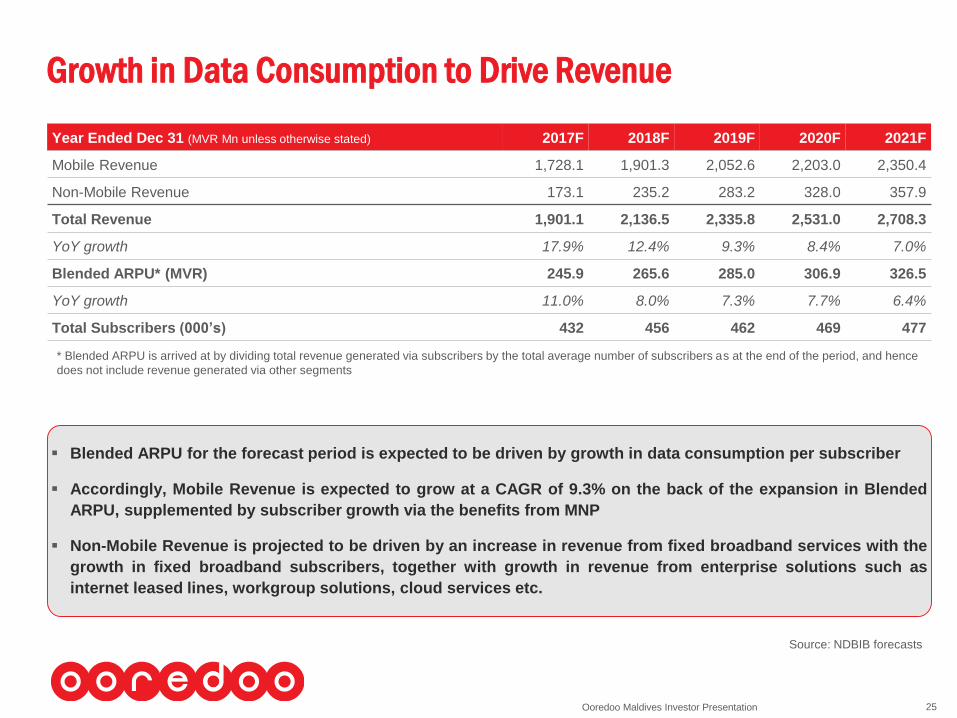
Growth in Data Consumption to Drive Revenue
Year Ended Dec 31 (MVR Mn unless otherwise stated) 2017F 2018F 2019F 2020F 2021F
Mobile Revenue 1,728.1 1,901.3 2,052.6 2,203.0 2,350.4
Non-Mobile Revenue 173.1 235.2 283.2 328.0 357.9
Total Revenue 1,901.1 2,136.5 2,335.8 2,531.0 2,708.3
YoY growth 17.9% 12.4% 9.3% 8.4% 7.0%
Blended ARPU* (MVR) 245.9 265.6 285.0 306.9 326.5
YoY growth 11.0% 8.0% 7.3% 7.7% 6.4%
Total Subscribers (000’s) 432 456 462 469 477
* Blended ARPU is arrived at by dividing total revenue generated via subscribers by the total average number of subscribers as at the end of the period, and hence
does not include revenue generated via other segments
Blended ARPU for the forecast period is expected to be driven by growth in data consumption per subscriber
Accordingly, Mobile Revenue is expected to grow at a CAGR of 9.3% on the back of the expansion in Blended
ARPU, supplemented by subscriber growth via the benefits from MNP
Non-Mobile Revenue is projected to be driven by an increase in revenue from fixed broadband services with the
growth in fixed broadband subscribers, together with growth in revenue from enterprise solutions such as
internet leased lines, workgroup solutions, cloud services etc.
Source: NDBIB forecasts
Ooredoo Maldives Investor Presentation 26
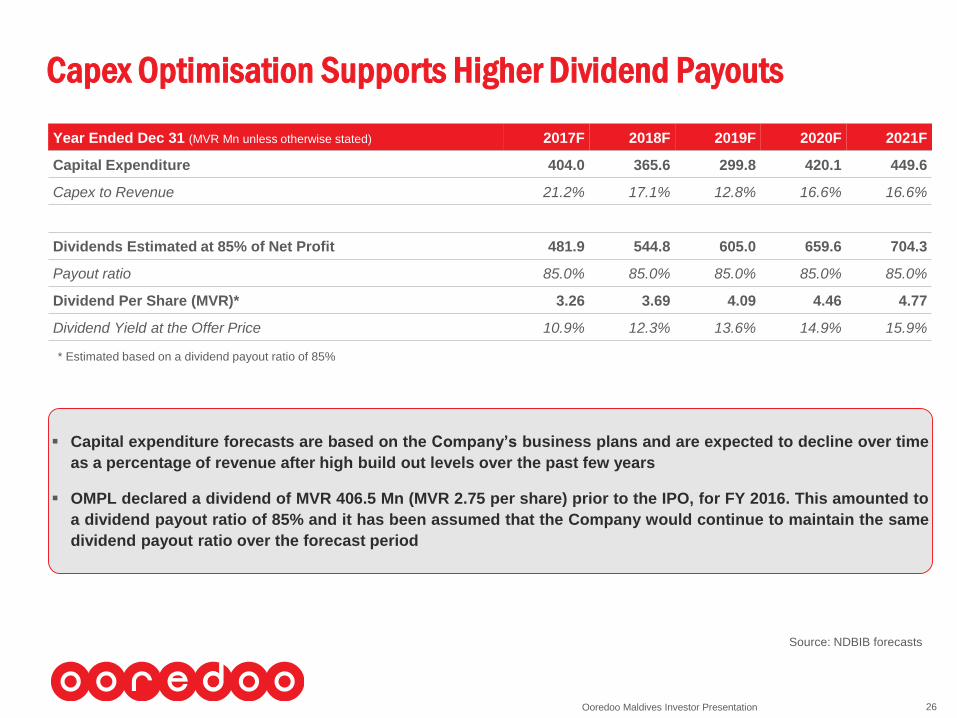
Capex Optimisation Supports Higher Dividend Payouts
Year Ended Dec 31 (MVR Mn unless otherwise stated) 2017F 2018F 2019F 2020F 2021F
Capital Expenditure 404.0 365.6 299.8 420.1 449.6
Capex to Revenue 21.2% 17.1% 12.8% 16.6% 16.6%
Dividends Estimated at 85% of Net Profit 481.9 544.8 605.0 659.6 704.3
Payout ratio 85.0% 85.0% 85.0% 85.0% 85.0%
Dividend Per Share (MVR)* 3.26 3.69 4.09 4.46 4.77
Dividend Yield at the Offer Price 10.9% 12.3% 13.6% 14.9% 15.9%
* Estimated based on a dividend payout ratio of 85%
Capital expenditure forecasts are based on the Company’s business plans and are expected to decline over time
as a percentage of revenue after high build out levels over the past few years
OMPL declared a dividend of MVR 406.5 Mn (MVR 2.75 per share) prior to the IPO, for FY 2016. This amounted to
a dividend payout ratio of 85% and it has been assumed that the Company would continue to maintain the same
dividend payout ratio over the forecast period
Source: NDBIB forecasts
Ooredoo Maldives Investor Presentation 27
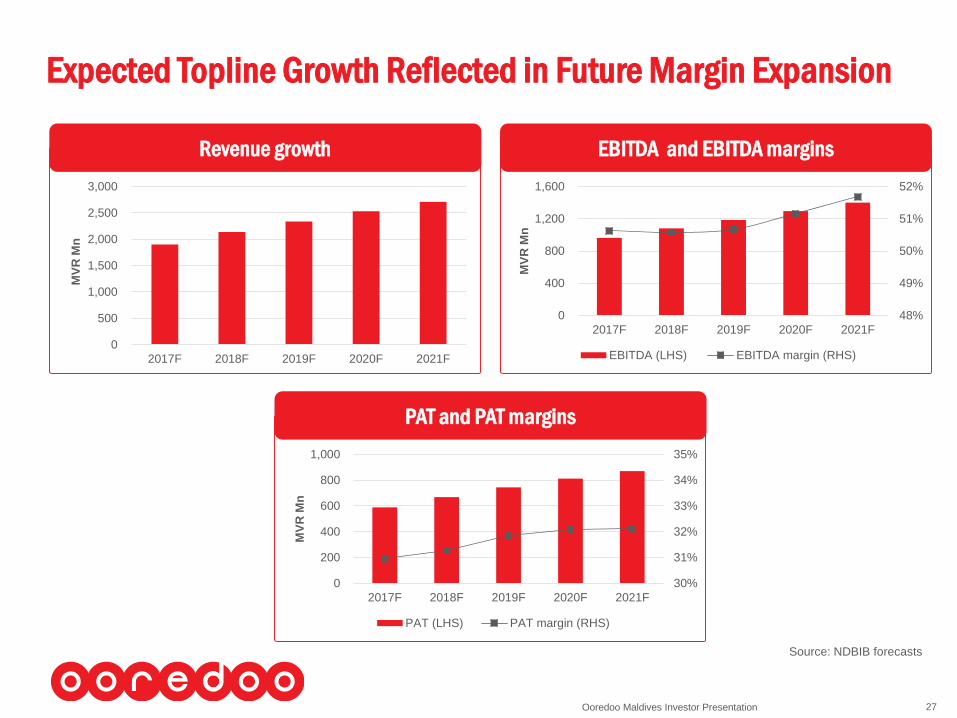
Revenue growth EBITDA and EBITDA margins
Expected Topline Growth Reflected in Future Margin Expansion
PAT and PAT margins
0
500
1,000
1,500
2,000
2,500
3,000
2017F 2018F 2019F 2020F 2021F
MV
R M
n
48%
49%
50%
51%
52%
0
400
800
1,200
1,600
2017F 2018F 2019F 2020F 2021F
MV
R M
n
EBITDA (LHS) EBITDA margin (RHS)
30%
31%
32%
33%
34%
35%
0
200
400
600
800
1,000
2017F 2018F 2019F 2020F 2021F
MV
R M
n
PAT (LHS) PAT margin (RHS)
Source: NDBIB forecasts
Ooredoo Maldives Investor Presentation 28
1. The Offer
2. The Company
3. Outlook for the Market and the Company
4. Key Assumptions and Financial Forecasts
5. Valuation
6. Subscription Process
7. Annexures
8. Abbreviations
Contents
Ooredoo Maldives Investor Presentation 29
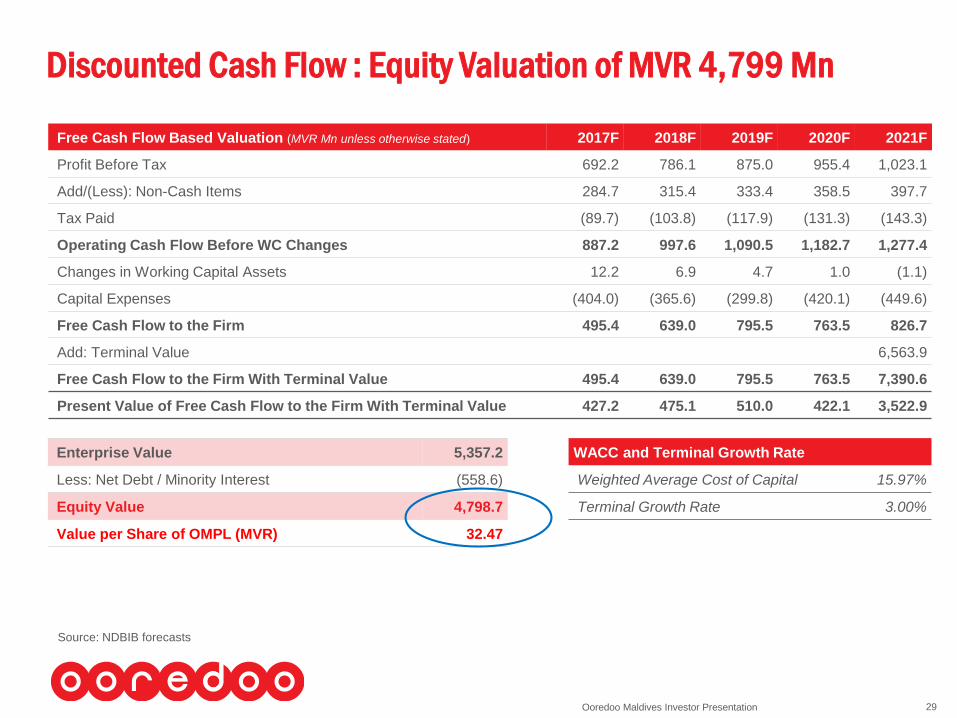
Discounted Cash Flow : Equity Valuation of MVR 4,799 Mn
Free Cash Flow Based Valuation (MVR Mn unless otherwise stated) 2017F 2018F 2019F 2020F 2021F
Profit Before Tax 692.2 786.1 875.0 955.4 1,023.1
Add/(Less): Non-Cash Items 284.7 315.4 333.4 358.5 397.7
Tax Paid (89.7) (103.8) (117.9) (131.3) (143.3)
Operating Cash Flow Before WC Changes 887.2 997.6 1,090.5 1,182.7 1,277.4
Changes in Working Capital Assets 12.2 6.9 4.7 1.0 (1.1)
Capital Expenses (404.0) (365.6) (299.8) (420.1) (449.6)
Free Cash Flow to the Firm 495.4 639.0 795.5 763.5 826.7
Add: Terminal Value 6,563.9
Free Cash Flow to the Firm With Terminal Value 495.4 639.0 795.5 763.5 7,390.6
Present Value of Free Cash Flow to the Firm With Terminal Value 427.2 475.1 510.0 422.1 3,522.9
WACC and Terminal Growth Rate
Weighted Average Cost of Capital 15.97%
Terminal Growth Rate 3.00%
Enterprise Value 5,357.2
Less: Net Debt / Minority Interest (558.6)
Equity Value 4,798.7
Value per Share of OMPL (MVR) 32.47
Source: NDBIB forecasts
Ooredoo Maldives Investor Presentation 30
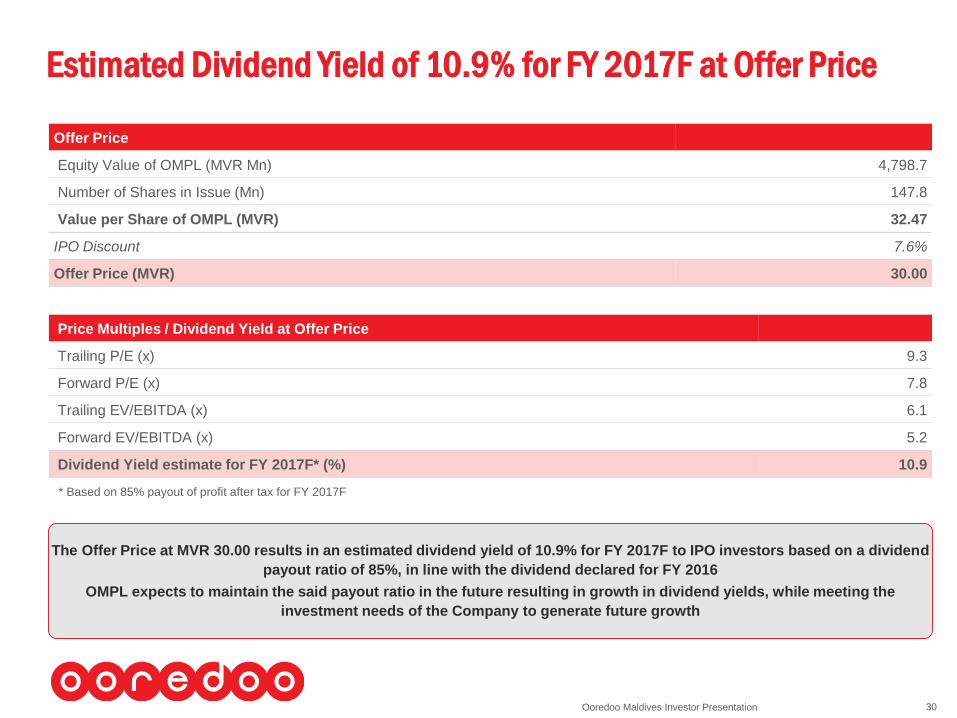
Estimated Dividend Yield of 10.9% for FY 2017F at Offer Price
The Offer Price at MVR 30.00 results in an estimated dividend yield of 10.9% for FY 2017F to IPO investors based on a dividend
payout ratio of 85%, in line with the dividend declared for FY 2016
OMPL expects to maintain the said payout ratio in the future resulting in growth in dividend yields, while meeting the
investment needs of the Company to generate future growth
Price Multiples / Dividend Yield at Offer Price
Trailing P/E (x) 9.3
Forward P/E (x) 7.8
Trailing EV/EBITDA (x) 6.1
Forward EV/EBITDA (x) 5.2
Dividend Yield estimate for FY 2017F* (%) 10.9
Offer Price
Equity Value of OMPL (MVR Mn) 4,798.7
Number of Shares in Issue (Mn) 147.8
Value per Share of OMPL (MVR) 32.47
IPO Discount 7.6%
Offer Price (MVR) 30.00
* Based on 85% payout of profit after tax for FY 2017F
Ooredoo Maldives Investor Presentation 31
1. The Offer
2. The Company
3. Outlook for the Market and the Company
4. Key Assumptions and Financial Forecasts
5. Valuation
6. Subscription Process
7. Annexures
8. Abbreviations
Contents
Ooredoo Maldives Investor Presentation 32
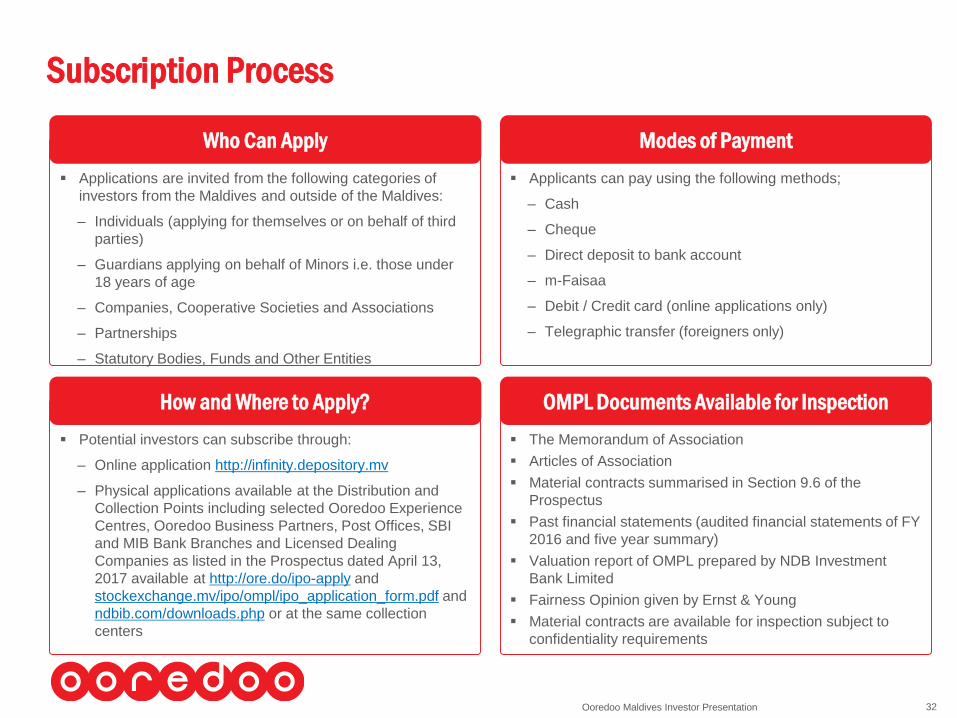
Modes of Payment
Subscription Process
OMPL Documents Available for Inspection
Potential investors can subscribe through:
– Online application http://infinity.depository.mv
– Physical applications available at the Distribution and
Collection Points including selected Ooredoo Experience
Centres, Ooredoo Business Partners, Post Offices, SBI
and MIB Bank Branches and Licensed Dealing
Companies as listed in the Prospectus dated April 13,
2017 available at http://ore.do/ipo-apply and
stockexchange.mv/ipo/ompl/ipo_application_form.pdf and
ndbib.com/downloads.php or at the same collection
centers
The Memorandum of Association
Articles of Association
Material contracts summarised in Section 9.6 of the
Prospectus
Past financial statements (audited financial statements of FY
2016 and five year summary)
Valuation report of OMPL prepared by NDB Investment
Bank Limited
Fairness Opinion given by Ernst & Young
Material contracts are available for inspection subject to
confidentiality requirements
Applications are invited from the following categories of
investors from the Maldives and outside of the Maldives:
– Individuals (applying for themselves or on behalf of third
parties)
– Guardians applying on behalf of Minors i.e. those under
18 years of age
– Companies, Cooperative Societies and Associations
– Partnerships
– Statutory Bodies, Funds and Other Entities
Applicants can pay using the following methods;
– Cash
– Cheque
– Direct deposit to bank account
– m-Faisaa
– Debit / Credit card (online applications only)
– Telegraphic transfer (foreigners only)
Who Can Apply
How and Where to Apply?
Ooredoo Maldives Investor Presentation 33
1. The Offer
2. The Company
3. Outlook for the Market and the Company
4. Key Assumptions and Financial Forecasts
5. Valuation
6. Subscription Process
7. Annexures
8. Abbreviations
Contents
Ooredoo Maldives Investor Presentation 34
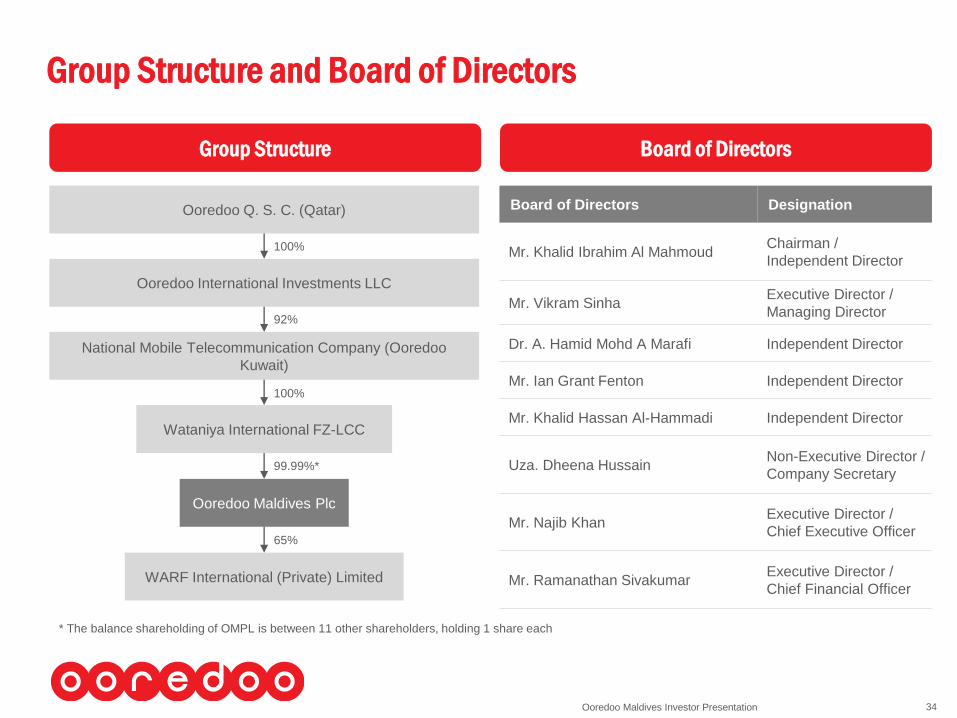
Group Structure Board of Directors
Group Structure and Board of Directors
Ooredoo Maldives Plc
Wataniya International FZ-LCC
National Mobile Telecommunication Company (Ooredoo
Kuwait)
Ooredoo International Investments LLC
Ooredoo Q. S. C. (Qatar)
65%
WARF International (Private) Limited
99.99%*
100%
92%
100%
Board of Directors Designation
Mr. Khalid Ibrahim Al MahmoudChairman /
Independent Director
Mr. Vikram SinhaExecutive Director /
Managing Director
Dr. A. Hamid Mohd A Marafi Independent Director
Mr. Ian Grant Fenton Independent Director
Mr. Khalid Hassan Al-Hammadi Independent Director
Uza. Dheena HussainNon-Executive Director /
Company Secretary
Mr. Najib KhanExecutive Director /
Chief Executive Officer
Mr. Ramanathan SivakumarExecutive Director /
Chief Financial Officer
* The balance shareholding of OMPL is between 11 other shareholders, holding 1 share each
Ooredoo Maldives Investor Presentation 35
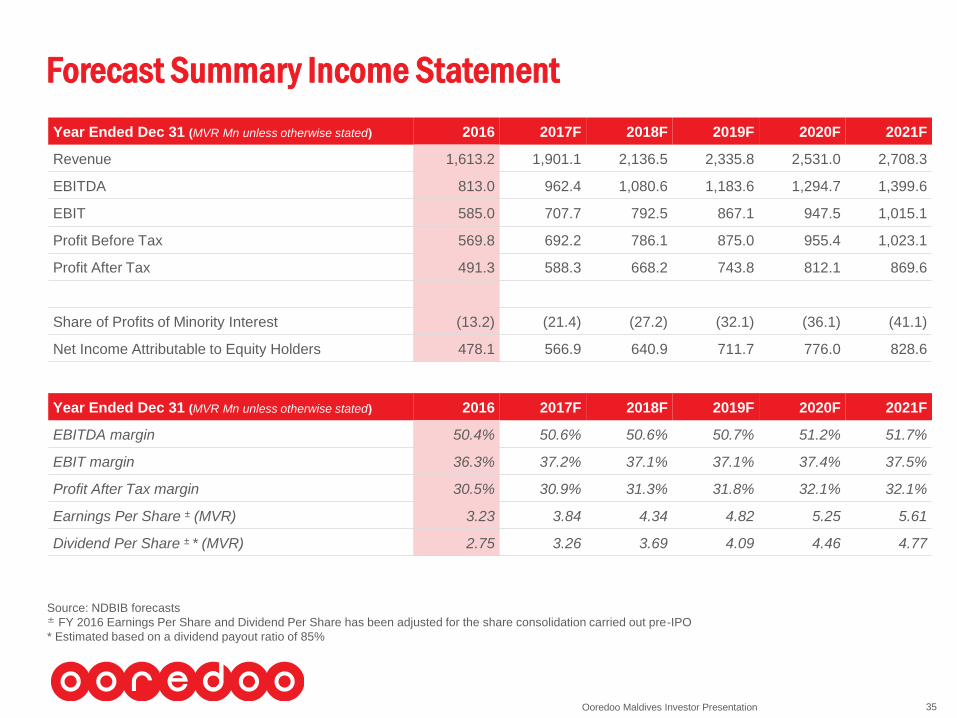
Forecast Summary Income Statement
Year Ended Dec 31 (MVR Mn unless otherwise stated) 2016 2017F 2018F 2019F 2020F 2021F
Revenue 1,613.2 1,901.1 2,136.5 2,335.8 2,531.0 2,708.3
EBITDA 813.0 962.4 1,080.6 1,183.6 1,294.7 1,399.6
EBIT 585.0 707.7 792.5 867.1 947.5 1,015.1
Profit Before Tax 569.8 692.2 786.1 875.0 955.4 1,023.1
Profit After Tax 491.3 588.3 668.2 743.8 812.1 869.6
Share of Profits of Minority Interest (13.2) (21.4) (27.2) (32.1) (36.1) (41.1)
Net Income Attributable to Equity Holders 478.1 566.9 640.9 711.7 776.0 828.6
Year Ended Dec 31 (MVR Mn unless otherwise stated) 2016 2017F 2018F 2019F 2020F 2021F
EBITDA margin 50.4% 50.6% 50.6% 50.7% 51.2% 51.7%
EBIT margin 36.3% 37.2% 37.1% 37.1% 37.4% 37.5%
Profit After Tax margin 30.5% 30.9% 31.3% 31.8% 32.1% 32.1%
Earnings Per Share ± (MVR) 3.23 3.84 4.34 4.82 5.25 5.61
Dividend Per Share ± * (MVR) 2.75 3.26 3.69 4.09 4.46 4.77
Source: NDBIB forecasts± FY 2016 Earnings Per Share and Dividend Per Share has been adjusted for the share consolidation carried out pre-IPO
* Estimated based on a dividend payout ratio of 85%
Ooredoo Maldives Investor Presentation 36
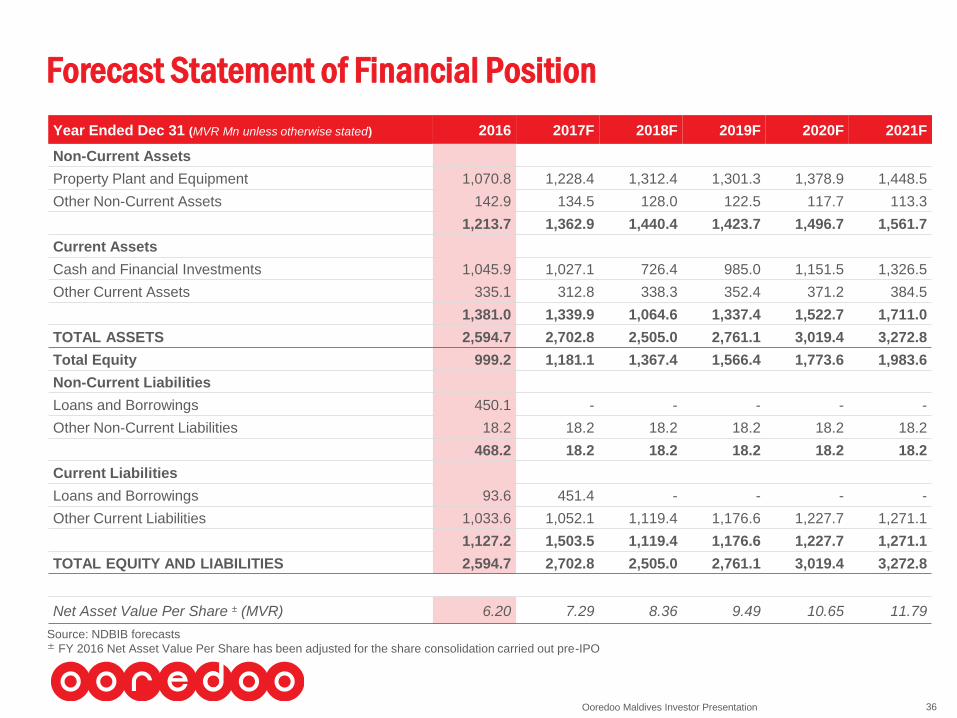
Forecast Statement of Financial Position
Source: NDBIB forecasts± FY 2016 Net Asset Value Per Share has been adjusted for the share consolidation carried out pre-IPO
Year Ended Dec 31 (MVR Mn unless otherwise stated) 2016 2017F 2018F 2019F 2020F 2021F
Non-Current Assets
Property Plant and Equipment 1,070.8 1,228.4 1,312.4 1,301.3 1,378.9 1,448.5
Other Non-Current Assets 142.9 134.5 128.0 122.5 117.7 113.3
1,213.7 1,362.9 1,440.4 1,423.7 1,496.7 1,561.7
Current Assets
Cash and Financial Investments 1,045.9 1,027.1 726.4 985.0 1,151.5 1,326.5
Other Current Assets 335.1 312.8 338.3 352.4 371.2 384.5
1,381.0 1,339.9 1,064.6 1,337.4 1,522.7 1,711.0
TOTAL ASSETS 2,594.7 2,702.8 2,505.0 2,761.1 3,019.4 3,272.8
Total Equity 999.2 1,181.1 1,367.4 1,566.4 1,773.6 1,983.6
Non-Current Liabilities
Loans and Borrowings 450.1 - - - - -
Other Non-Current Liabilities 18.2 18.2 18.2 18.2 18.2 18.2
468.2 18.2 18.2 18.2 18.2 18.2
Current Liabilities
Loans and Borrowings 93.6 451.4 - - - -
Other Current Liabilities 1,033.6 1,052.1 1,119.4 1,176.6 1,227.7 1,271.1
1,127.2 1,503.5 1,119.4 1,176.6 1,227.7 1,271.1
TOTAL EQUITY AND LIABILITIES 2,594.7 2,702.8 2,505.0 2,761.1 3,019.4 3,272.8
Net Asset Value Per Share ± (MVR) 6.20 7.29 8.36 9.49 10.65 11.79
Ooredoo Maldives Investor Presentation 37
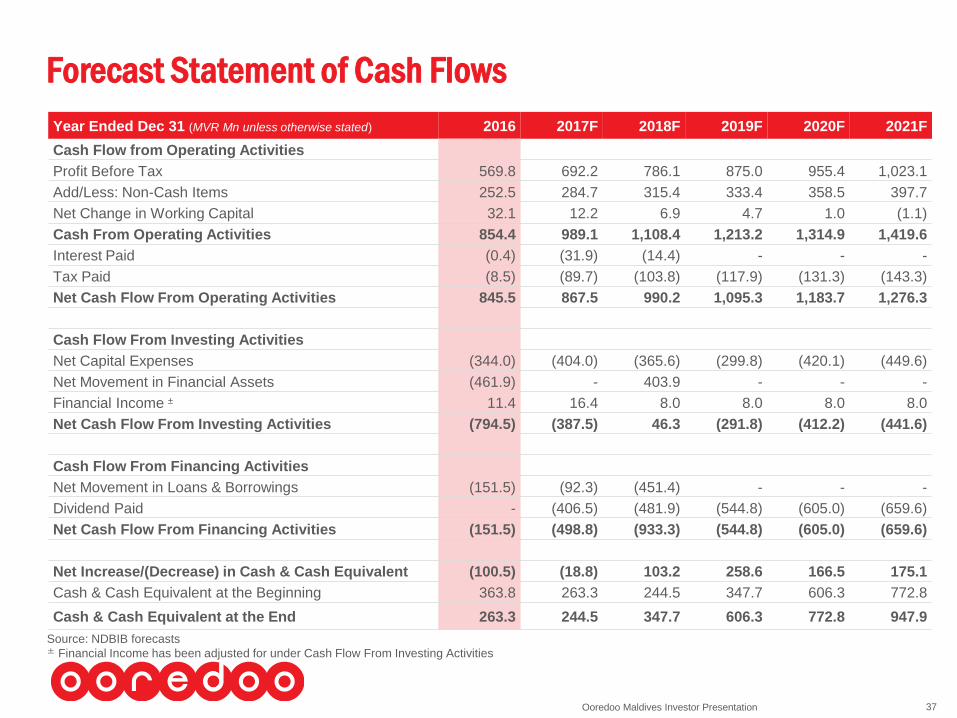
Forecast Statement of Cash Flows
Year Ended Dec 31 (MVR Mn unless otherwise stated) 2016 2017F 2018F 2019F 2020F 2021F
Cash Flow from Operating Activities
Profit Before Tax 569.8 692.2 786.1 875.0 955.4 1,023.1
Add/Less: Non-Cash Items 252.5 284.7 315.4 333.4 358.5 397.7
Net Change in Working Capital 32.1 12.2 6.9 4.7 1.0 (1.1)
Cash From Operating Activities 854.4 989.1 1,108.4 1,213.2 1,314.9 1,419.6
Interest Paid (0.4) (31.9) (14.4) - - -
Tax Paid (8.5) (89.7) (103.8) (117.9) (131.3) (143.3)
Net Cash Flow From Operating Activities 845.5 867.5 990.2 1,095.3 1,183.7 1,276.3
Cash Flow From Investing Activities
Net Capital Expenses (344.0) (404.0) (365.6) (299.8) (420.1) (449.6)
Net Movement in Financial Assets (461.9) - 403.9 - - -
Financial Income ± 11.4 16.4 8.0 8.0 8.0 8.0
Net Cash Flow From Investing Activities (794.5) (387.5) 46.3 (291.8) (412.2) (441.6)
Cash Flow From Financing Activities
Net Movement in Loans & Borrowings (151.5) (92.3) (451.4) - - -
Dividend Paid - (406.5) (481.9) (544.8) (605.0) (659.6)
Net Cash Flow From Financing Activities (151.5) (498.8) (933.3) (544.8) (605.0) (659.6)
Net Increase/(Decrease) in Cash & Cash Equivalent (100.5) (18.8) 103.2 258.6 166.5 175.1
Cash & Cash Equivalent at the Beginning 363.8 263.3 244.5 347.7 606.3 772.8
Cash & Cash Equivalent at the End 263.3 244.5 347.7 606.3 772.8 947.9
Source: NDBIB forecasts± Financial Income has been adjusted for under Cash Flow From Investing Activities
Ooredoo Maldives Investor Presentation 38
1. The Offer
2. The Company
3. Outlook for the Market and the Company
4. Key Assumptions and Financial Forecasts
5. Valuation
6. Subscription Process
7. Annexures
8. Abbreviations
Contents
Ooredoo Maldives Investor Presentation 39
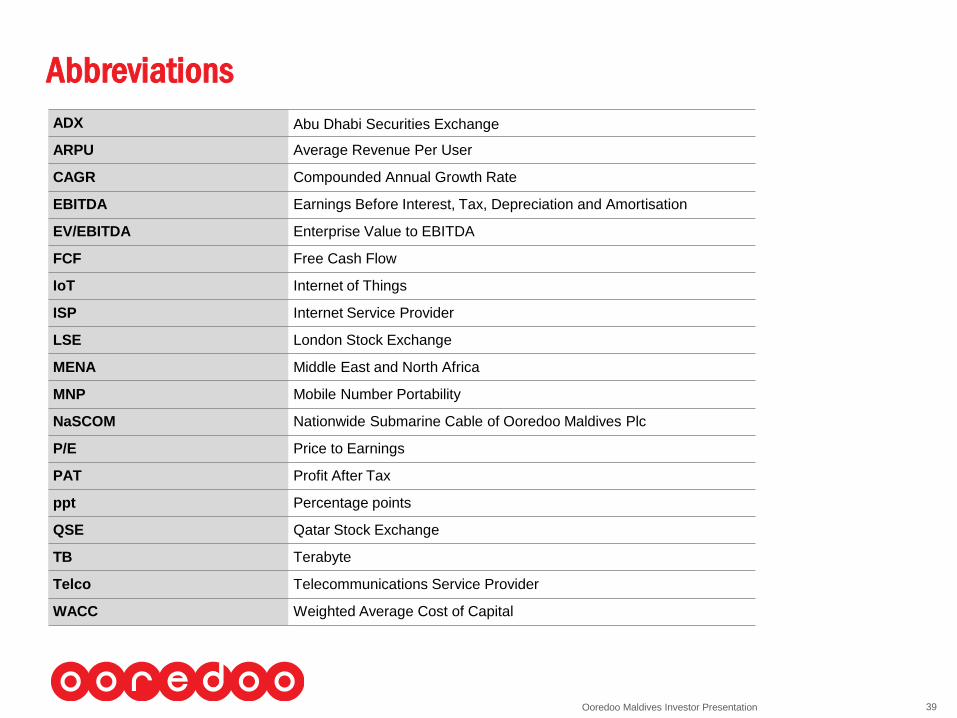
Abbreviations
ADX Abu Dhabi Securities Exchange
ARPU Average Revenue Per User
CAGR Compounded Annual Growth Rate
EBITDA Earnings Before Interest, Tax, Depreciation and Amortisation
EV/EBITDA Enterprise Value to EBITDA
FCF Free Cash Flow
IoT Internet of Things
ISP Internet Service Provider
LSE London Stock Exchange
MENA Middle East and North Africa
MNP Mobile Number Portability
NaSCOM Nationwide Submarine Cable of Ooredoo Maldives Plc
P/E Price to Earnings
PAT Profit After Tax
ppt Percentage points
QSE Qatar Stock Exchange
TB Terabyte
Telco Telecommunications Service Provider
WACC Weighted Average Cost of Capital

Ooredoo Maldives Investor Presentation 40
Thank You
Website: ooredoo.mv
Email: [email protected]
Twitter: @ooredoomaldives
Facebook: facebook.com/ooredoomaldives
Follow us


