Informal Cross-Border Trade: Who participates and what is the impact of participation on
income?
A Case Study in Entikong, Indonesia
A Research Paper presented by:
RISTI’ANA MALIK JANI JALEHA
(Indonesia)
in partial fulfillment of the requirements for obtaining the degree of
MASTER OF ARTS IN DEVELOPMENT STUDIES
Major:
Economic of Development
(ECD)
Members of the Examining Committee:
Dr. Natascha Wagner
Dr. Howard Nicholas
The Hague, The Netherlands
i
Disclaimer:
This document represents part of the author’s study programme while at the Institute
of Social Studies. The views stated therein are those of the author and not necessarily
those of the Institute.
Research papers are not made available for circulation outside of the Institute.
Inquiries:
Postal address: Institute of Social Studies P.O. Box 29776 2502 LT The Hague The Netherlands
Location: Kortenaerkade 12 2518 AX The Hague The Netherlands
Telephone: +31 70 426 0460
Fax: +31 70 426 07
ii
Acknowledgment
“ It always seems impossible until it’s done”
(Nelson Mandela)
That is the proverb that has always encouraged me since I first set my foot in the
Netherlands a year ago. Leaving my beloved family away in Indonesia has been their
invaluable sacrifice that is continuously spurring me to keep going through my
academic journey until I finally get to the end of the road – that is the writing of this
research paper. The writing of it has involved the work and the help of many people
to whom I am very grateful. That is why I would like to express my thankfulness to
those who have assisted me during the completion of this paper.
My deepest gratitude goes to my supervisor, Dr. Natascha Wagner, for her willingness
to supervise my research. The guidance, the support, the advice, the patience and the
scholarly insights she has given me have been a source of energy for me throughout
the writing of this paper. It is a really great opportunity to know her and being under
her supervision.
I am also indebted to my second reader, Dr. Howard Nicholas, for his precious
comments, inputs, feedbacks and guidance. He is an inspiring figure from whom I
have learnt a lot during my study at ISS, not only on the academic knowledge, but also
on scientific research skills. I am very proud of being under his guidance.
I am very grateful to all ISS teaching staff for their warm encouragement and
suggestions. Other staff members and librarians are those who also deserve my
appreciation for their sincere support and cooperation.
My special thanks are due to my family who have ceaselessly prayed for me and
encouraged me to pursue my goal. I thank my beloved husband, Akhmad Faozan, for
his endless love and patience, and my thanks are also expressed to my adorable
children, M. Fadhli Hafiz Fauzan and Sabrina Alya Faizah, for their affection.
Last but not least, I wish to thank all of my friends at ISS and Dorus Rijkersplein for
their help and togetherness during our stay here. We have always been hand-in- hand
to face the ups and downs, and being with you all is a nice remedy for my
homesickness. I really enjoy my time spent with you all.
iii
Contents
Acknowledgment ............................................................................................................................ ii
List of Tables ................................................................................................................................. v
List of Figures ................................................................................................................................ v
List of Maps .................................................................................................................................. v
List of Appendices .......................................................................................................................... v
List of Acronyms .......................................................................................................................... vi
Abstract ....................................................................................................................................... vii
Chapter 1 .............................................................................................................. 1
Introduction ......................................................................................................... 1
1.1. Background ..................................................................................................................... 1
1.2. Justification ..................................................................................................................... 2
1.3. Research objectives and questions .............................................................................. 4
1.4. Scope and limitations of the research ......................................................................... 4
1.5. Structure of the research ............................................................................................... 5
Chapter 2 ............................................................................................................. 6
Definition of Informality, Literature and Empirical Evidence ........................... 6
2.1. Introduction .................................................................................................................... 6
2.2. Definition of the informal economy ........................................................................... 6
2.3. Literature review .......................................................................................................... 11
2.3.1. Who gets involved in informal work? ................................................................ 11
2.3.2. Understanding the opportunities offered in informal work ........................... 14
2.4. Empirical findings ........................................................................................................ 16
Chapter 3 ........................................................................................................... 19
Overview of Entikong, the Informal Cross-Border Trade Activities and Policies
towards it ........................................................................................................... 19
3.1. Introduction .................................................................................................................. 19
3.2. General and Socio-Economic Overview of Entikong, West Kalimantan .......... 19
3.3. The Scope and Nature of Informal Cross-Border Trade ...................................... 21
3.4. Government Policy towards Informal Cross-Border Trade ................................. 23
Chapter 4 ........................................................................................................... 26
Research Methodology ...................................................................................... 26
4.1. Introduction .................................................................................................................. 26
iv
4.2. Set up of the survey and quantitative analysis ......................................................... 26
4.3. Qualitative and Secondary Data ................................................................................ 28
4.4. Ethical considerations pertaining to the survey ...................................................... 29
4.5. Hypothesis .................................................................................................................... 29
Chapter 5 ........................................................................................................... 30
Analysis .............................................................................................................. 30
5.1. Introduction .................................................................................................................. 30
5.2. Descriptive statistics .................................................................................................... 30
5.3. The determinants of participation in informal cross-border trade ...................... 35
5.4. The impact of participation in informal cross-border trade on household
revenues ......................................................................................................................... 37
5.5. Goods traded through informal cross-border trade ............................................... 40
Chapter 6 ........................................................................................................... 43
Conclusion and Policy Implications ................................................................. 43
References ..................................................................................................................................... 45
v
List of Tables Table 1 The Number of KILB in Entikong, 2014 – 2015 …………………... 23
Table 2 Demographic Characteristics and T-Test (Mean Comparison Test) ... 32
Table 3 Logit regression of the determinants of participation in ICBT ……... 36
Table 4 OLS regression of the impact of ICBT participation on revenues …. 38
List of Figures Figure 1 The relationship between informal, underground, illegal, and
household sector…………………………………………………..
8
Figure 2 The scheme of ICBT in Entikong ………………………………... 23
Figure 3 Hours spent on ICBT per day ……………………………….......... 36
Figure 4 The purposes for engaging in ICBT …………………………….... 39
Figure 5 The reasons in the decision to engage in ICBT ……………............ 40
Figure 6 The exported commodities in ICBT ………………………............. 41
Figure 7 The imported commodities in ICBT ……………………………... 42
Figure 8 Utilization of ICBT income at household level ……………............. 42
List of Maps Map 1 Map of Entikong, West Kalimantan, Indonesia …………………... 20
List of Appendices Appendix 1 Questionnaire …………………………………………........... 50
vi
List of Acronyms ICBT Informal Cross-Border Trade
BTA Border Trade Agreement
BCA Border Crossing Agreement
PLB Pas Lintas Batas (Border Crossing Pas)
KILB Kartu Identitas Lintas Batas (Identity of Border Crossing Card)
BPS Badan Pusat Statistik (The Central Bureau of Statistics)
SNA System of National Accounts
GDP Gross Domestic Products
ILO International Labor Organization
CPI Corruption Perceptions Index
PREALC Programa Regional del Empleo the América Latina y el Caribe
EAC East African Community
PNAD Pesquisa National porAmostra de Domicilios
MENA Middle East and North African
GCC Gulf Corporation Council
CGSS Chinese General Social Survey
MNL Multinomial Logit
OLS Ordinary Least Square
VHLSS Vietnam Household Living Standard Survey
MALINDO Malaysia- Indonesia
BNPP Badan Nasional Pengelolaan Perbatasan (the National Board of Border Management)
UBOS Uganda Bureau of Statistics
UP3LB Unit Pengelola Pos Pemeriksaan Lintas Batas (the Management Unit of Cross-Border Checkpoint)
vii
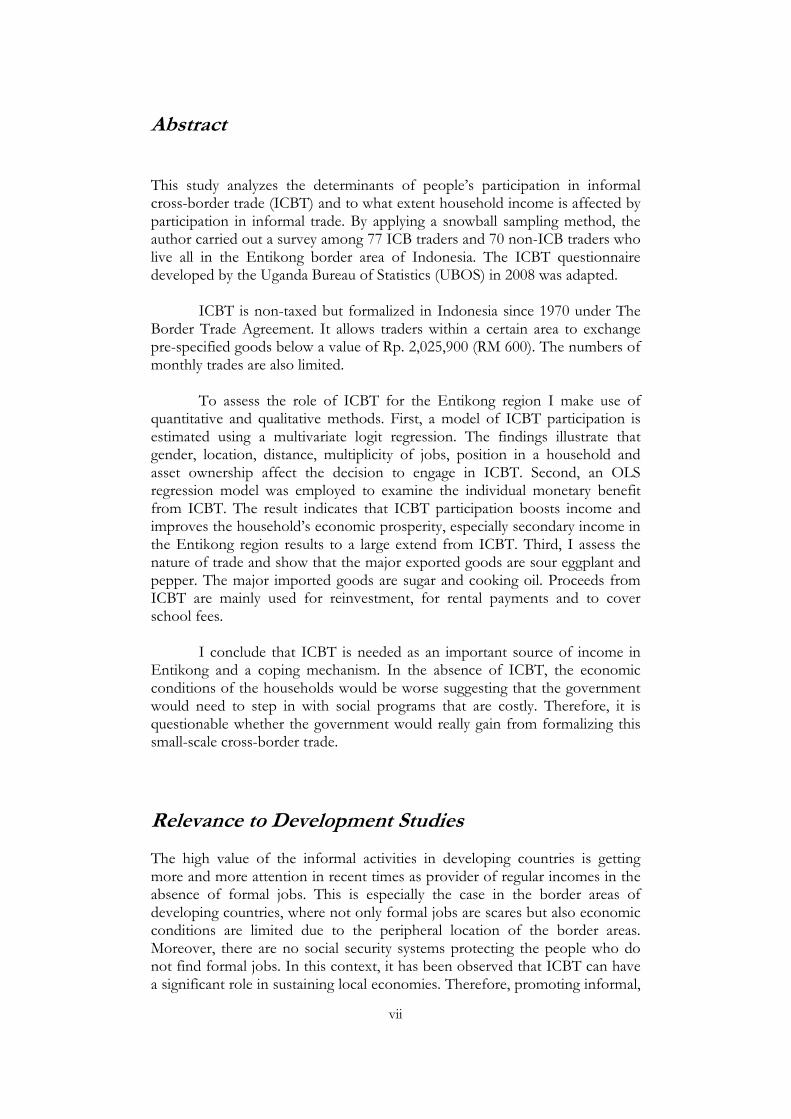
Abstract
This study analyzes the determinants of people’s participation in informal cross-border trade (ICBT) and to what extent household income is affected by participation in informal trade. By applying a snowball sampling method, the author carried out a survey among 77 ICB traders and 70 non-ICB traders who live all in the Entikong border area of Indonesia. The ICBT questionnaire developed by the Uganda Bureau of Statistics (UBOS) in 2008 was adapted.
ICBT is non-taxed but formalized in Indonesia since 1970 under The
Border Trade Agreement. It allows traders within a certain area to exchange pre-specified goods below a value of Rp. 2,025,900 (RM 600). The numbers of monthly trades are also limited.
To assess the role of ICBT for the Entikong region I make use of
quantitative and qualitative methods. First, a model of ICBT participation is estimated using a multivariate logit regression. The findings illustrate that gender, location, distance, multiplicity of jobs, position in a household and asset ownership affect the decision to engage in ICBT. Second, an OLS regression model was employed to examine the individual monetary benefit from ICBT. The result indicates that ICBT participation boosts income and improves the household’s economic prosperity, especially secondary income in the Entikong region results to a large extend from ICBT. Third, I assess the nature of trade and show that the major exported goods are sour eggplant and pepper. The major imported goods are sugar and cooking oil. Proceeds from ICBT are mainly used for reinvestment, for rental payments and to cover school fees.
I conclude that ICBT is needed as an important source of income in
Entikong and a coping mechanism. In the absence of ICBT, the economic conditions of the households would be worse suggesting that the government would need to step in with social programs that are costly. Therefore, it is questionable whether the government would really gain from formalizing this small-scale cross-border trade.
Relevance to Development Studies
The high value of the informal activities in developing countries is getting more and more attention in recent times as provider of regular incomes in the absence of formal jobs. This is especially the case in the border areas of developing countries, where not only formal jobs are scares but also economic conditions are limited due to the peripheral location of the border areas. Moreover, there are no social security systems protecting the people who do not find formal jobs. In this context, it has been observed that ICBT can have a significant role in sustaining local economies. Therefore, promoting informal,
viii
i.e. untaxed not illegal, trade can be considered a possible mechanism to improve household welfare in the border areas since it is compatible with the economic structure and resources that are available in these areas. I study informal trade in Entikong -a border area between West Kalimantan (Indonesia) and Serawak (Malaysia)- to get a better perceptivity about the current conditions under which ICBT operates and generates revenues. The study focuses on micro-level dynamics taking into account household demographics. Results are intended to facilitate the decisions of policy makers with regard to the existing trade policy. The results provide evidence that can be used to ensure that the region will benefit even more from this cross-border activity.
Keywords Informal Cross-Border Trade, Participation, Income, Indonesia, Multivariate Analysis
1
Chapter 1
Introduction
1.1. Background
The high value of the informal activities in the economic system has started to get more and more attention by a growing number of scholars in recent times. According to social and labor market specialists, the informal sector becomes the main source of income and job opportunities for most people in developing countries, where formal job opportunities and social security systems are limited (Barberia, Johnson, and Kaufmann 1997, Bernabe 2002, Clarke 1999b, Leonard 2000, Skoufias 2003, Yakubovich 1999).Onthe one hand, the informal sector can benefit society by improving the livelihood of the concerned people. On the other hand, from a finance, law, and national accounting point of view, the informal sector can lead to lower government revenues as a result of the unrecorded activities, which occur outside the country’s regulation or taxation frameworks. In this sense, “the informal sector undermines the government’s ability to intervene in the economy, provide social security, and invest in public goods” (Bernabe, 2002:3). Notwithstanding, in the case of countries that have high levels of corruption and a demanding bureaucracy, the informal sector offers positive opportunities to spur economic growth offsetting the issue of tax avoidance (Bernabe, 2002:4).
As an example of a situation where formal job opportunities and comprehensive social security systems are scarce, the national border between Indonesia and Malaysia is considered. On Kalimantan Island, Indonesia has more than 2000 kilometers land border with Malaysia. In this border area, both countries have established dozens of official entry and exit points and many more unregistered cross-border points that accommodate the traffic of people and goods between the two countries. Of all these cross-borderpoints, Entikong is the oldest and most important cross-borderpoint; it has been operating since 1991 and has been recorded as the busiest cross-borderpoint so far (Prasojo 2013:422, The National Boardof Border Management/BNPP 2014)
Consequently, in the border area, the informal activities succeed due to it is a remote and undeveloped region compared to other regions in Indonesia. The main informal activity people are engaged in is ICBT. ICBT can provide a significant economic opportunity for households since it can diminish poverty, enhance household ‘well-being’, reinforce‘food security’, produce job opportunities, and raise incomes (Africa and Ajumbo 2012, Awang et al. 2013,Lesser and Leeman 2009, Pisani and Richardson 2012). ICBT is used by some local entrepreneurs to provide “staple food commodities” and “low quality consumer goods” from the neighboring country to the local communities (Lesser and Moise-Leeman, 2009:5).
2
The study at hand will zoom in on ICBT in and around Entikong. The ICBT between Entikong (Indonesia) and Tebedu (Malaysia) has existed for hundreds of years before the formation of the concept of state-nations in both countries (Wulandari, 2012:11). The majority of Entikong’s inhabitants are of ‘Dayak’ ethnic origin with various sub-groups who mainly work in the agricultural sector (Rahardjo, 2013:75). Generally, they sell their agricultural products to Malaysia and purchase consumption goods for their daily needs, which are challenging to acquire from the distant capital of the province, Pontianak. In 1970, Indonesia and Malaysia established the BTA which consists of an identification of the demarcation line between Indonesia and Malaysia, and regulated the ICBT between the two countries by allowing the people from both regions, the Indonesian and the Malaysian border area, to get involved in ICBT. Nonetheless, only specific goods and services are authorised to be traded and the total value is limited to a fixed amount. In order to control the informal trade between Indonesia – Malaysia, only traders who have a Border Crossing Pass (Pas Lintas Batas/PLB) and an Identity of Border Crossing Card (Kartu Identitas Lintas Batas/KILB) can engage in informal trade and exclude from tax obligation. Likewise, “with the cross-border agreement, trader’s movements are limited to within 30 km of the border areas” (Awang et al, 2013:168).
The research at hand is a micro-level analysis resting on 147 interviews of residents of the broader Entikong area. I interviewed both individuals who are engaged in ICBT and those who are not. By comparing the perceptions designated by the two categories, I will assess the individual-level drivers for participation in ICBT and the economic returns associated with this activity to contribute to a better understanding of the individual-level dynamics underlying this informal activity.
1.2. Justification
The participation in ICBT has shown to be an income generating activity and a way to earn one’s livelihood for people who live in the border area. According to the collected survey information, the average monthly income of individuals who engage in ICBT is greater than the regional minimum wage rate in the district in 2015. On average, informal trade generates a monthly income of Rp. 2,330,282 (see Table 2), whilst the ‘minimum wage’ in the district is only Rp. 1,635,000 (West Kalimantan Governor Decree No.526/Nakertrans/2014). These primary statistics represent that the ICBT can be a more promising activity than formal sector employment. Moreover, the formal sector is not strong enough to promote economic development in this region due to the limited economic activities that can be carried out in this predominately rural area, which further limit the number of formal job opportunities as well. In consequence of its poorly economic performances, the sub-district has a difficulty in providing social services for its people, which is shown by the decreasing number of health professionals (doctors, nurses, midwives, and non-medical personnel) who have been working in Entikong in the last three years (The Central Bureau of Statistics, 2014). Another example
3
for the backwardness of the region is the high student-teacher at all educational levels, which indicates that the availability of teachers is very restricted (The Central Bureau of Statistics, 2014).
Moreoever, existing evidences suggests a positive relation between ICBT and economic performance. It has further been shown that the informal work is more resilient against economic crises than the formal work. As a matter of fact during Indonesia’s monetary crisis in 1997, Entikong did not experience its negative impacts. Instead of loss and economic struggles due to the depreciation of the ‘local currency’, the border residents experienced advantages from their cross-border trading activities since in this area ‘foreign currency’ is used as the means of exchange. The ‘foreign exchange’ attracts local traders as they see the opportunity to market their goods in Malaysia. Nevertheless, not only regional traders, informal trading in the border area is enlivened by non-local traders from Bandung, Tangerang, and Pontianak (Siburian, 2002:90). Therefore, the agricultural sector is also benefitting from the trade opportunities and tries to penetrate the foreign market. The marketing distributions of pepper, as a main agricultural product, is constantly increasing. In addition to currency disparities between Ringgit and Rupiah, there are additional economic gains due to the geographical proximity that lead the local traders to permeate the Malaysia’s market (Raharjo, 2013:75). Informal trading enables individuals to remain economically prosperous in times of crisis. Therefore, Entikong is recognized as ”the area without the economic crisis” (Siburian, 2002:87).
In border areas of developing countries, where formal job opportunities and social security insurance are insufficient, it has been observed that ICBT can have a significant role in driving local economic development. It has been shown that the informal sector of many developing countries should not just be considered as one with marginal activities within the economic system (Floridi, 2014). To the contrary, informal activities in the Entikong border area should be given further attention since the ICB trading volume is quite high. Kurniadi (2009)exhibited that the amount of the realized value of ICBT during the six years of 2001 to 2006 is US $ 10,456,121 or US $ 1,742,686,96 on average. Whilst, as stated by the Ministry of Trade, in 2010-2013, the official export and imports through Entikong Border Point are US $ 14,225,135 or US $ 3,556, 328.75 on average. Corresponding to this, neglecting the inflation rate, the size of informal trading is approximately at 33% from formal trading. It reveals a significant proportion of informal trading in border area, particularly in Entikong. Therefore, promoting the informal sector can be considered as an important approach to boost economic growth in the border area since it is compatible with the economic structure and resources that are available in this area.
Thus,by assessing the motivations of actors who participate in ICBT, this research will try to improve our understanding about the current conditions of the informal sector in Entikong, which is meant to help policy makers to
4
improve the existing trade policy to ensure that the region will even benefit more from this cross-border activity. For that reason, this study will investigate the level of participation of local people in ICBT and estimate the individual monetary benefit which is generated from the cross-border trade in Entikong, West Kalimantan, Indonesia. The study brings in a micro-level perspective by comparing individuals who engage in informal cross border trade with those who do not. Thus, the study is a first attempt to establish the drivers and impacts of ICBT on individuals and the households they reside in.
1.3. Research objectives and questions
This study is intended to analyze the determinants of participation in ICBT and to what extent household income is affected by the participation in ICBT.
In order to resolve these intention, this study formulates the following two research questions:
1. Is an informal cross-border trader different from an individual who lives in the same area, but does not participate in ICBT?
2. To what extent is household income affected by the participation in ICBT?
1.4. Scope and limitations of the research
The study takes an empirical approach resting on 147 interviews carried out by the researcher. The study will evaluate the influence of participation in ICBT on household welfare. The study focuses on micro-level dynamics taking into account household demographics. Due to the lack of documentation and surveys among ICB traders, the researcher has to rely on a small dataset that is not nationally representative. Due to restricted time for data collection, the sample is limited to residents in Entikong and the surrounding area. The sample consists of a cross-section of people who get involved in ICBT and people who do not.
Furthermore, income data are self-reported. Thus, the identification of economic prosperity derives from the perspective of the respondents. This study will only focus on the participation in ICBT and income for the year 2015. The impact assessment is mitigated by the fact that we do not observe the ICB traders before they engaged in this activity. Therefore, a control group of individuals who do not engage in ICBT needs to be constructed and tested for its properness.
It would have been fascinating to study the macro-economic impact of ICBT. However, there is no sistematic macro-level data on informal trading and national accounting data is equally incomplete. Consequently, this study cannot describe the trend of ICBT in the long term but provides a snapshot of the current situation.
5
1.5. Structure of the research
In order to present an inclusive picture of ICBT in Entikong and its consequences on income at the micro level, the study will be divided into six chapters. Chapter one provides the background of this study, including justification, objectives, questions, scope and limitations. Chapter two will elaborate the basic concepts of informal economies and some empirical evidences about the drivers and its impact on income. Chapter three gives an overview of the overview of Entikong, the ICBT activities and policies towards it. Chapter four outlines the research methodology used and hypotheses derivatives in this study. Chapter five provides and discusses the estimation result. Lastly, chapter six will sum up the discussions into a conclusion.
6
Chapter 2
Definition of Informality, Literature and Empirical Evidence
2.1. Introduction
This chapter elaborates on the theoretical perspectives of economic informality and is divided into two sections. The first section will discuss the literature on the informal economy; it also includes the definition of the informal economy, the people who participate, and the opportunities offered there. These concepts will be reviewed and criticized through various relevant literatures. The second section will present empirical findings about the determinants of the people participating in the informal economic sectors. Moreover, the empirical evidence will also highlight the economic benefits provided by the informal sectors.
2.2. Definition of the informal economy
There has been no general agreement on the description of informal economic activities across countries. According to Bernabe (2002), the concept of informal work is understood differently among developing, transition and Western industrialized countries. Further, he underlined that informality in developing countries is related to income generating activities and employment opportunities for households. In contrast, this term is often associated with negative connotations that hinder economic growth through tax evasion in ‘Western industrialized countries’. Indeed, the divergence of informal sector perspectives are regarded as a result of different units of observation and definition criteria. There are four possible units of observation, i.e.: ‘enterprises’, ‘activities’, ‘incomes’, and ‘people’, and three criteria of informality, i.e.: ‘registration’, ‘measurement’, and ‘regulation’, which are generally used to describe an informal activity (Bernabe, 2002:26). Instead of relying on the diversity of spesifications, the abstraction of ‘informal work’ involves to be clearly defined in the context of this paper. Therefore, I rely on the System of National Accounts (SNA1) 1993 as it collects the concepts and definitions that are used in Indonesia.
According to the system, the determination of informality is regarded as “units engaged in the production of goods or services with the primary objective of
1 The System of National Accounts (SNA) consists of “a coherent, consistent and integrated set of macroeconomic accounts; balance sheets and tables based on a set of internationally agreed concepts, definitions, classifications and accounting rules. It provides a comprehensive accounting framework within which economic data can be compiled and presented in a format that is designed for purposes of economic analysis, decision-taking and policy-making" (SNA, 1993:1(1)).
7
generating employment and incomes to the persons concerned” (SNA2, 1993:5(1)). It means that that activities are strongly related to the typical of household enterprises3.
That typical of household enterprises implies that the production of goods and services can be conducted legally and illegally. It means that informal work contributes a positive impact for poor household and a negative impact for the government as well. In addition to generate an employment, the informal work take a place as an income source. On the other hand, informal work can be detrimental for the state through tax avoidance mechanism. Therefore, it is important to distinguish between illicit work and tax avoidance with small-scale actions which is undertaken by communities to meet their basic needs (Bernabe, 2002:26). Hereinafter, this research will maintain the definition of informality according to the SNA 1993 in order to establish a new conceptual framework based on the SNA production boundary for developing countries, particularly Indonesia.
The SNA production boundary is “physical process, carried out under the responsibility, control and management of an institutional unit, in the which labor and assets are used to transform inputs of goods and services into outputs of other goods and services” (SNA2, 1993:1.20). Moreover, this frontier also covered the household production activities which are used as own consumption i.e.: agricultural goods, the production of foodstuff and clothing, the construction of dwellings, housing services, etc. According to SNA2(1993:6.17) “production accounts are not compiled for household activities that produce domestic or personal services for own final consumption within the same household; except for services produced by employing paid domestic staff”. Those activities can be carried legally, illegally and underground. The occupation are characterized as an illicit work if the process is strongly related to prohibited goods and services, and/or producers who do not have a business license. While the activities are categorized as underground activities when intentionally to evade the institutional arrangement. The SNA 1993 emphasizes that there is no clear distinction between illegal and underground, but both have the potential to harm the government.
2 Commission of the European Communities, International Monetary Fund, Organization for Economic Co-operation and Development, United Nations, & Inter-Secretariat Working Group on National Accounts, 1993, System of National Accounts 1993, Brussels/Luxembourg: The Working Group. 3 The household enterprises are “units engaged in the production of goods or services which are not constituted as separate legal entities independently of the households or household members that own them, and for which no complete set of accounts (including balance sheets of assets and liabilities) are available which would permit a clear distinction of the production activities of the enterprises from the other activities of their owners and the identification of any flows of income and capital between the enterprise and the owners” (ILO 1993b,7 as cited in Bernabe 2002:33).
8
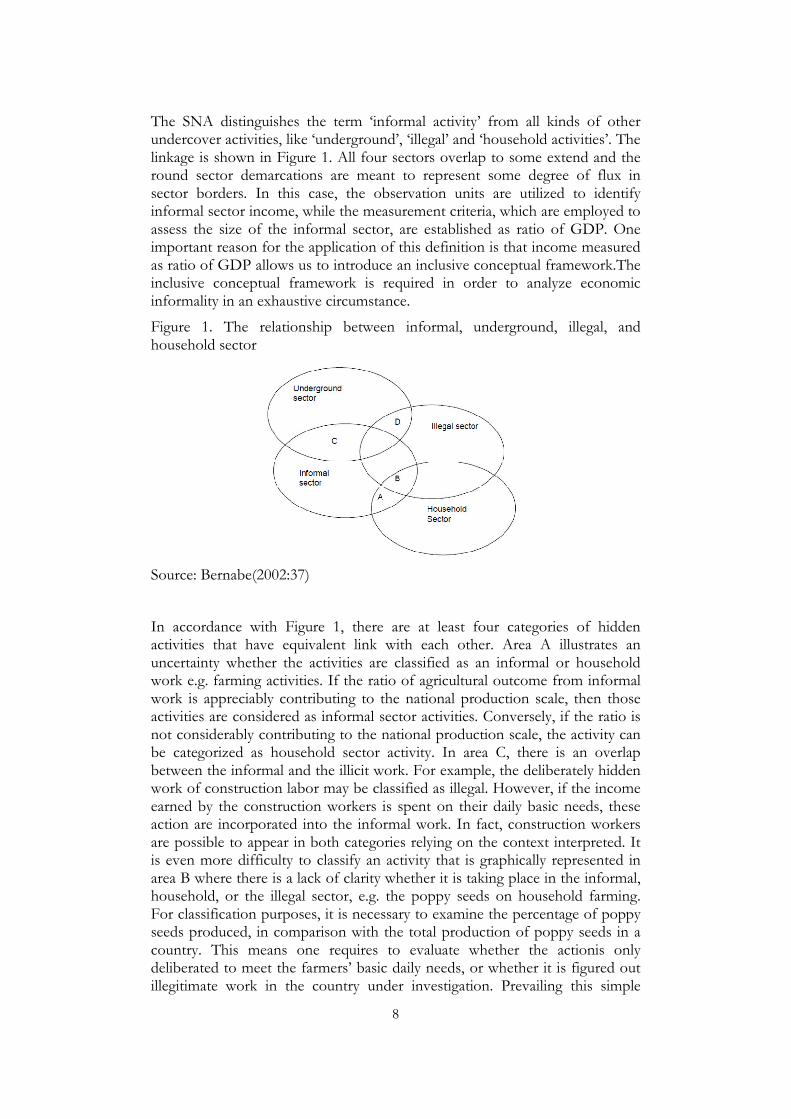
The SNA distinguishes the term ‘informal activity’ from all kinds of other undercover activities, like ‘underground’, ‘illegal’ and ‘household activities’. The linkage is shown in Figure 1. All four sectors overlap to some extend and the round sector demarcations are meant to represent some degree of flux in sector borders. In this case, the observation units are utilized to identify informal sector income, while the measurement criteria, which are employed to assess the size of the informal sector, are established as ratio of GDP. One important reason for the application of this definition is that income measured as ratio of GDP allows us to introduce an inclusive conceptual framework.The inclusive conceptual framework is required in order to analyze economic informality in an exhaustive circumstance.
Figure 1. The relationship between informal, underground, illegal, and household sector
Source: Bernabe(2002:37)
In accordance with Figure 1, there are at least four categories of hidden activities that have equivalent link with each other. Area A illustrates an uncertainty whether the activities are classified as an informal or household work e.g. farming activities. If the ratio of agricultural outcome from informal work is appreciably contributing to the national production scale, then those activities are considered as informal sector activities. Conversely, if the ratio is not considerably contributing to the national production scale, the activity can be categorized as household sector activity. In area C, there is an overlap between the informal and the illicit work. For example, the deliberately hidden work of construction labor may be classified as illegal. However, if the income earned by the construction workers is spent on their daily basic needs, these action are incorporated into the informal work. In fact, construction workers are possible to appear in both categories relying on the context interpreted. It is even more difficulty to classify an activity that is graphically represented in area B where there is a lack of clarity whether it is taking place in the informal, household, or the illegal sector, e.g. the poppy seeds on household farming. For classification purposes, it is necessary to examine the percentage of poppy seeds produced, in comparison with the total production of poppy seeds in a country. This means one requires to evaluate whether the actionis only deliberated to meet the farmers’ basic daily needs, or whether it is figured out illegitimate work in the country under investigation. Prevailing this simple
9
distribution path, the poppy seeds cultivation can be sorted appropriately.The area D will be ruled out in this study because it is not directly related to the informal sector.
Based on these observations, the informal sector and its interrelationship withother hidden sectors (underground, illegal and household sector), the following definition of the informal sector is applied:
“[T]he informal sector is the set of productive economic activities, which fall within the SNA (1993) production boundary, and are unmeasured untaxed and/or unregulated, not because of deliberate attempts to evade thepayment of taxes or infringe labor or other legislation, but because they are undertaken to meet basic needs (e.g. petty trade, household agricultural production, ambulant street vending, unregistered taxi services – with own car, rickshaw or other means of transportation, undeclared paid domestic employment, etc).” (Bernabe, 2002:32-33)
The above definition emphasizes the importance to distinguish the informal sector from the underground sector since the informal sector is not always intended to avoid institutional regulations. This is an important feature of the informal sector, which is in accordance with the concept of informality described in the SNA 1993. However, SNA 1993 focuses on the household enterprise as the unit of observation, following Bernabe (2002) I will consider the activity as the unit of observation.
Furthermore, Bernabe (2003) highlighted three important points that ask for the activity as the unit of observation and therefore need a refinement of the SNA definition of informality. Firstly, “the informal workis not necessarily performed with the deliberate intention of evading the payment of taxes or social security contributions or infringing labor or other legislations or administrative provisions” (SNA2, 1993:135). It means that informal work may be linked to the underground sector but its main purpose is to generate income and employment. Conversely, the definition of the informal sector in this study has excluded the practices of tax avoidance or violation of other regulations that are detrimental to the government. Secondly, the definition of the informal sector regarding household enterprises as the unit of observation is granted too restricted. The informal work comprises whole productive activities done in family or enterprises . For instance, a family might have subscribers who are engaged in informal activities and others who are engaged in formal activities and yet others who are unpaid household workers. Similarly, formal enterprises often employ a huge number of unregistered workers. Thirdly, the domestic or personal service which is held by household to their own final consumption is excluded in SNA 1993. In fact, the existence of such activity is very important for households. Not only as a source of
10
income and employment, such activity also plays a valuable aspect in the process of agricultural production (Bernabe, 2002:35). On the contrary, the new determination of informality will cover all activities as long as they are section of the SNA production boundaries.
In order to get a better understanding of the term informal sector, the above discussed concepts are combined in a schematic representation of the different activities to facilitate a comparison between the informal, the underground, the illegal andthe household sector (see Figure 1). Slightly different from the previous definition, this comparison presents the economic activities as unit of observation and the lack of measurement of the economic activity as a criterion in defining each sector. By presenting this approach I aim to further flesh out the comparison between the informal and the underground sectors.
According to this definition, the informal sector is the combined area of 2, 3, and 4; the underground sector includes the areas 5, 6, and 7; the illegal sector covers areas indicated with the numbers 8,9, and 10; while the household sector consists of area number 1. Regarding the household sector, Thomas (1995) present the definition of a broader household sector. Not only measured household activities are excluded from the SNA production boundary, but the definition also includes household activities outside the SNA production boundary. In other words, the household sector is not only intended for self-consumption, but also to meet the basic necessities. Whereas, the disagreement on the informal sector’s definition is still an important concern for the International Labor Organization (ILO). According to the SNA2 1993, the informal sector covers areas number 2, 5, and 8. This means that the informal sector includes all activities within the SNA production boundary, either legal or illegal, which is held by informally owned enterprises or enterprises run by informal workers. That determination is granted too confined due to it neglects the activities which are undertaken by other economic agents, like other family (not including the informally owned-account enterprises or enterprises in the informal workers) and non-families.
Based on the above definition of informality, I investigate the informal trading along the border between Indonesia and Malaysia. I focus on ICBT between the two countries and my unit of observation is the income generated from this activity. According to BTA 1970, ICBT was deliberately allowed to facilitate the livelihoods of the residents living in the areas around the border (Entikong and Sekayam district). The border communities are officially allowed to buy and sell goods and services cross-country without being taxed or checked by customs. As the residents are officially allowed to sell and by goods ICBT does not constitute an illegal activity. At the same time, the lack of tax on cross-border trade by the residents of the border regions makes it an informal activity. Certainly, the convenience of allowed-for tax avoidance is regulated by a number of standard pertaining to the types of person who takes part in these activities, the types of goods traded and the value of trade allowed for in ICBT. Since the primary purpose of ICBT between Indonesia and
11
Malaysia is to provide supplies for the basic daily needs of the residents in the border areas, especially in the Entikong and Sekayam districts, the issue of tax evasion or other trade regulations is ruled out by the government. Therefore, ICBT is classified as informal activity, not as underground activity. Thus, the existence of ICBT in this regulated form is not a burden to the economy of the two involved countries but was rather put in place to allow for some prosperity in the peripheral and economically weak border regions.
Thus, the governments of Indonesia and Malaysia put emphasis on the social and labor market aspects when allowing for ICBT. Financial, legal, and national accounting considerations are subordinate. Bernabe (2002) has pointed out that in countries with demanding bureaucracies and high levels of corruption, the informal sector offers positive opportunities to spur economic growth offsetting the issue of tax avoidance. Corruption is still a concern in Indonesia.
As claimed by the Corruption Perceptions Index (CPI) 2014, with a score of 34 out of a maximum of 100, Indonesia is contemplated as facing obstacles with corruption. Hence, in the international corruption ranking Indonesia has the high rank of 107 out of 174 indicating that the country is not clean of corruption. Similarly, the bureaucracy in Indonesia is tardy and far from being clean of corruption. Therefore, ICBT is used as indirect way of providing labor market opportunities and buffering against adverse shocks in the absence of fully functional social security and public facilities.
2.3. Literature review
2.3.1. Who gets involved in informal work?
What drives the participation in informal activities is still being debated among economists. Mainstream economists, such as Souza and Tokman (1978), argue that informal activities are driven by poverty and the vulnerability of the economy. On the other hand, de Soto (1990) argues that informal activities appeared as a response to excess regulation in the labor market and complicated bureaucracies. Structuralists like Portes and Schauffler (1993) and Feige (1990) also put an emphasis on regulations in explaining informality. According to them, informal activities appear as a product of (excess) government regulation.
The ILO (International Labor Organization) and PREALC (Programa Regional del Empleo the América Latina y el Caribe) point to the poverty-vulnerability nexus arguing that informal work emerged as a result of economic vulnerability. According to Rakowski (1994), economic vulnerability is a result of the marginal jobs poor people tend to have and as a decrease in income due to crisis or structural adjustment policies. These conditions force people to engage in informal work as survival strategies. Limited employment opportunities and lack of social security benefits also encourage people to
12
participate in informal work (Souza and Tokman, 1978). Most of them are engaged in the manufacturing industry, trade and personal services. In the 80s, informal activities were seen in relation to livelihood strategies. Guerguil (1988) argues that informal work is a series of activities based on a specific reason, namely to meet basic daily needs. Thus, the purpose of informal work differs from the one of formal work with the latter being intended to accumulate capital.
In addition, de Soto (1990) argues that excess regulation, taxation and demanding bureaucracy contributed to the growth of informal work. According to de Soto (1990) the government only gives privileges to large-scale businessmen providing them with flexible regulations and short bureaucratic processes. In contrast, small and medium entrepreneurs are confronted with various government regulations that impede their production process or business operation. Inevitably, the divergence in institutional behavior spurs the small or medium entrepreneurs to take an illegal route to expedite their business. According to this view, “informality is the popular response that successfully breaks down the legal barrier” (Portes and Schauffler, 1993:40). In the other words, informal activity is no longer seen as a marginal job for the poorest people, but as a powerful way to survive under the pressure of government regulations. Thus, informality can only be reduced by reducing government regulations, employing fair tax systems and reducing the bureaucratic burden that formal entrepreneurs face.
In the early 1990s, the structuralists propose new approaches in order to get a better understanding of the informal activities and its origin. By combining the two previous approaches, structuralists show that informal work is an income-generating activity, which results from government regulation, and contributes positively to the growth of the formal sector (Portes and Schauffler, 1993; Feige, 1990). This reasoning is slightly different to de Soto’s argument. According to this approach, informal work is not separate from the formal work, but there is a mutual relationship between both of them. The solution which is proposed by de Soto to eliminate the government’s role in informal activities is no longer relevant. The role of government is indispensable as a counterweight to maintain the competitive advantages between the informal and the formal sector. However, structuralist perceives that “more deregulation and greater flexibility is needed to enable firms to adjust to changes in the economic conditions” (Bernabe, 2002: 12).
Recent years, more and more researchers focused their attention on informal work and the characteristics of those being involved in it. Various issues related to informal activities have to be investigated further in order to examine the determinants of informal works. Individual characteristics, such as gender, education, regional differences, and job are often recognized to have a strong link with the people’s decision to join informal work (Losby et. al., 2002). The relationship between individual characteristics with the
13
participation of people in informal work will be discussed in details in what follows.
The linkage between gender and informal work has become an important concern by many economists (Hoyman1987, McInnis-Dittrich1995). The involvement of married women in informal work over the past few decades has showna significant growth. Hoyman (1987) noted that the involvement of women in informal work in 1975 was nearly doubled compared with men. At least, there are two important arguments about the motive of women to participate in informal work that have been summarized by McInnis-Dittrich (1995). First, women choose to engage in informal work because it has a higher degree of flexibility compared to formal work, so that married women can manage their responsibilities as a mother, wife, and a worker. In contrast, according to the feminists’ view, women's involvement in informal work is a necessity as women are marginalized in the economy. Thus, there is no other choice for a woman to engage economically apart from the informal sector.
The role of education in determining one’s decision to engage in informal work is still being debated. Although the relationship between the level of education and informal work in urban areas has been very clear, but this relationship becomes unclear in rural areas (Losby et al., 2002: 22-23). Nelson (1999)interviewed 275 individuals of working age in Coolidge County, Vermont, and pointed out that the education level is a poor indicator to asses the individual involvement in informal work. It implies that individuals across all levels of education participate in informal work and for the case of Vermont it cannot be argued that it is only the uneducated that have to resort to informal activities. Contrary to this, Souza and Tokman (1976:360) underlined that education levels affect one’s decision to engage in informal work. According to them, about 70% of the informal workers in Latin American countries, such as Paraguay and El Salvador, are composed of lowly educated workers. In line with this finding, the number of illiterate informal workers in Quito and Guayaquil (Ecuador) is about one-third of the total number of workers.
Regional factor differences also play an important role in individual’s decision to conduct informal work. Differing socio-economic conditions in urban and rural areas encourage people to engage in informal work. According to studies by Sassen (1997) and Campbell, Spencer, and Amonker (1993), the informal work in urban areas is deliberately raised by the capitalists to reduce the cost of production. Meanwhile, in rural areas, informal work appears as a response to the limitations of formal employment. Informal work is a last resort for people to ensure that their families make ends meet. In line with this, Campbell, Spencer, and Amonker (1993:46) as quoted in Losbyet. al. (2002:28) pointed out that “the more the formal income, the less the participation in the use of such tactics by necessity”.
14
Referring to the statement of Campbell, Spencer, and Amonker (1993:46) above, the formal job status is closely related to a person’s decision to engage in informal employment. Nelson (1999) categorized the types of formal work into ‘good job’ and ‘bad job’. The principal distinction is ‘good job’ give better payment than ‘bad job’, and a ‘good job’ is a full time or all year-round job, while a ‘bad job’ is part time or seasonal. People who have ‘good’ or ‘bad jobs’ have the same possibility to get involved in the informal sector, despite the different motives. People who have a ‘good job’ will conduct informal work after their formal working hours or on weekends. They use the informal activity as an informal safety net in case they lose their formal job. On the other hand, the instability of ‘bad jobs’ forces people to seek additional income from informal work. This strategy is implemented as a coping mechanism due to the economic vulnerability the people face.
Based on above discussion, it is worth to say that the demographic, geographic, and socio-economic characteristics influence the individual preference to get involved in informal work.
2.3.2. Understanding the opportunities offered in informal work
Implications of informal work for creating sustainable household livelihoods have already received attention by many other researchers. Applying a social policy and labor market view, informal work generates new employment, reduces poverty and overcomes social exclusion. For countries that can only offer limited formal employment and social security, informal work becomes an eligible consideration to survive (Bernabe, 2012). Definite output enfeeble the institutional ability to provide social security for its citizens (Bernabe, 2002). Eventually, this condition results in social exclusion that threatens the sustainability of poor household’s livelihood.
From the economic point of view, the informal work is related to the level of individual income. According to the study of Jensen, Cornwell, and Findeis (1995), ‘poor household’ participate in informal work in order to survive, while the ‘non-poor household’ decide to engage in informal work because they want to help their neighbors. In the other words, poor household’s participation in informal work is guided by economic reasons, while the participation of non-poor household are not based on economic reasons. Furthermore, it has been pointed out that “lower income families were more likely to participate in the informal economy” (Losby et al., 2002:23). They obtain additional income from informal work as a strategy for survival. This is in accordance with the study by Nelson (1999), which emphasized that people who have a ‘bad job’ are most likely to get involved in informal work in order to get additional income.
The level of income from informal work became the interest of further studies. Many economists, like Ogalo (2010) and Ama et al. (2013), have shown that participation in informal work is more favorable than formal work. Focusing on ICBT, Ama et. al. (2013:4221) found that “the monthly profit generated by
15
ICB traders is over ten times the minimum wage of workers in Botswana”. In line with this, Ogalo (2010:4) also underlined that “it is apparent that the majority of ICBT participants survive on more than US$ 2 a day which some of them would never achieve under formal employment, especially in the shrinking economies of EAC”. The above literature uses the official income from formal as a benchmark, which is not a good reference point for rural areas. Due to the limited formal employment in rural areas it is a challenge to properly assess the level of income from informal employment. To determine the level of income of the people involved in ICBT, this study will use the income level of people who are not involved in ICBT as comparison. By doing so, I avoid resorting to national average income levels, which are too high compared to the average income level in the border regions.
Ackello-Ogutu & Echessah (1998) and Minde and Nakhumwa (1998) also study the association of ICBT and household income. At the border of Tanzania, many people sell and buy their agricultural products informally to the neighboring countries. Ackello-Ogutu & Echessah(1998) show that in addition to meeting the daily consumption needs, ICBT may contribute to the eradication of poverty through the provision of employment and income generation. The average income earned amounted to 25% of the volume of goods and services traded through ICBT (Nakhumwa, 1998). For Tanzania, this implies that the advantage which is gained by ICBT household is around US$ 11 million. The profits are used by the people in the border area for consumptions and to improve their welfare with ICBT contributing positively to household income.
The level of family earnings which is acquired from the informal work is often associated with individual and household characteristics. Merz and Wolff (1993) underlined that the different household strategies to obtain income through the informal sector depend on the household characteristics. Household characteristics include age, gender, education, marital status, location, head of household, type of house and size of household. According to Carneiro and Henley (2001), age and educational level are positively correlated with the level of household income. Nguyen et al. (2014) pointed out that women have a lower income compared to men in both informal and formal employment. Differences in income in various geographically separated regions suggest the importance of location factors in determining the household income. Furthermore, Naschold (2009:763) states that “locational factors were also important; suggesting that the efficiency of market mechanisms in narrowing factor returns differs across locations”.
Due to the vulnerability of informal work and the absence of social security in informal work, many households diversify their income sources (Hart, 1973). Not only do they rely on income from a primary job, informal workers also have a secondary job to contribute to their revenues. As time can be flexible used in informal work, people carry out the primary and the secondary job simultaneously. A good example is given by an ICB trader in Entikong who
16
has a grocery store in her home. By applying that strategy, the household gains more income to support her family. This strategy is also documented by Merz and Wolff (1993) who highlighted that a household’s earnings achieving strategy can be based on multiple jobs. The existence of multiple jobs in rural households is widely acknowledged and also taken into consideration by standard socio-economic surveys by asking for and categorizing the sources of family income into the main source and additional income sources.
2.4. Empirical findings
This section will review the empirical evidences in relation to the literature that is presented in the previous section. One strand of the empirical evidences analyzes the socio-demographic factors that influence households’ decisions to get involved in informal work. Generally, “a better financial situation of the households (from the formal economy) also causes a higher participation rate in the informal economy” (Merz and Wolff, 1993:184). Additional empirical evidences pertain to the relationship between informal work and the level of household income. As mentioned earlier, there is a difference in income between informal and formal jobs. Ama et. al. (2013) found for the case of cross-border trade that the average income of informal workers is higher than the formal workers.
Carneiro and Henley (2001) used the data from the 1997 Brazilian PNAD household survey (Pesquisa National porAmostra de Domicilios) with 109,541 respondents. They estimate a person’s decision to engage in informal work based onself-selection on observables and obtain corrected and predicted earnings through simultaneous regressions. The estimations indicate that “a higher predicted earnings differential between the informal and formal sectors is associated with a greater probability of a worker being employed in the informal sector” (Carneiro and Henley, 2001:1). In the other words, based on their characteristics informal and formal worker have comparative advantages from their selection into one occupation or the other indicating that individuals make informed choices. In this regard, some household characteristics, such as the size of household, location, the common remittances procedures, secondary income and multiple job holding are also relevant to explain the probability of a person to participate in the informal sector.
Diego et. al. (2012) estimated the determining factors of informal workers in the Middle East and North African (MENA) countries and classifies them into two groups, namely the Gulf Corporation Council (GCC) countries and non-GCC countries. The reason for this classification is the differences in behavior between informal workers in both areas. This study does not apply an econometric analysis. Yet, the study comes to similar conclusion as large scale quantitative studies. The study indicates that age, gender and education are highly contribute opting for informality. According to Diego et. al., the majority of participants in informal work is people aged between 15 and 24 years and there is a downward trend after the age of 24 years. In the field of
17
education, duration of education is inversely proportional to the growth of informal work. It means that the tendency of highly educated people to engage in informal work will be smaller. In the case of gender, there is unevenness in some areas. In Iraq and Lebanon, the probability of engaging in informal work is higher for women than for men. In contrast, the probability for women to participate in informal work is lower than that for men in Egypt.
Aikaeli and Mkenda (2015) applied a logit regression models to estimate the decision of micro and small entrepreneurs to participate in informal work, especially in the construction industry in Tanzania. The data was obtained from surveys conducted in six regions in Tanzania in 2013, namely Dar es Salaam, Tanga, Arusha, Mwanza, Dodoma and Mbeya and contains 1,445 respondents. Regression results indicate that education, income from other sources and gender affect the participation of entrepreneurs in the informal work. Most informal entrepreneurs in Tanzania’s construction industry are not well-educated and earn low incomes. Concerning gender, the regression results indicate that the probability of female workers to get involved in the informal construction industry is higher than for men.
Zuo (2013) estimated the income determinants of informal work in China based on the 2006 Chinese General Social Survey (CGSS). The total number of respondents involved was 10,000 households from 28 provinces and cities in China. By applying multinomial logit (MNL) regression, this study shows that gender, duration of education, location and occupation are important determinants for income in informal work. Men in informal work gain more income than women, while people who have a longer duration of education will have a higher tendency to gain more hourly earnings in informal work than those with a shorter education. By dividing the job category into managerial, professional, technical, and clerical, this study revealed that people who occupied on managerial or professional positions able to generate their income. Conversely, if the people are working on technical or clerical positions, the participation in informal work will reduce their income. In terms of location, people who live in big cities have a higher probability to generate more income in informal work than those who live in small towns.
Naschold (2009) used panel data from rural Pakistan to establish the determinants of household revenue from informal activities. In order to investigates the determinants of household revenue in the periods 1986-1987 and 1988-1989, this study applied the OLS regression and the panel regression (random effect) on each. The estimation results indicate that household income will increase depending on such factors as age, education and the ownership of physical assets like land, houses or cattle. In addition, education at secondary level workers can boost household income from informal work. The ownership of physical assets is also positively correlated with an increase on household income. However, the location of the house which is far from the center of the capital and the size of the household inhibits informal income.
18
Nguyen et al. (2014) estimated the determinants of labor income from informal work in Vietnam in 2010. The OLS regression is applied to data from the Vietnam Household Living Standard Survey (VHLSS). The regression results indicate that gender, education, age, marital status, and occupation are important explanatory variables for individual income, which is derived from informal work. Furthermore, they argue that informal labor income will increase along with the increase in age and the levels of education. On the other words, the age of individual and the levels of education are positively correlated with informal income. In contrast, there is a negative link between people who work on labor-intensive industry with their revenues. In terms of gender, there is an earnings gap between women and men in the informal employment. Men receive a higher income than women in informal work, because menhave better access to employment and are able to bargain and earn more than women. The responsibility of women as housewives could be a barrier to accessing informal employment. From all those indicators, the marital status (1 if married, 0 if not) is failed to predict the informal labor income.
Ama et al. (2013) applied both qualitative and quantitative techniques to look at the profitability of informal work, especially ICBT in Botswana. A multiple regression was used to analyze primary survey data obtained from 520 ICB traders. The study pointed out that “the monthly profit generated by ICB traders is over ten times the minimum wage of workers in Botswana and gross profit margins from this trade is 54.99%” (Ama et al., 2013:4221). Moreover, Ama et al. determined the advantages of ICBT for household welfare through multiple links, i.e. as the major source of income generation, fulfilling the necessities of life, and reducing household vulnerability to poverty. Besides, the informal trade supports formal activities, as it provides a wider network of distribution and marketing of local products in foreign markets.
In sum, the participation of people in informal activities is strongly affected by individual characteristics, like demographic, socioeconomic and geographic characteristics. By taking part in informal sector, people establish the informal work as the main income generating activities and as an employment. Since informal work provides opportunity for poor household in facing the economic vulnerability, this study is interested in studying the informal work in the border of Indonesia and Malaysia, particularly in Entikong sub-district. Limited study of ICBT in Indonesia motivates the author to present comprehensive perspective about ICBT under the social and labor market aspect.
19
Chapter 3
Overview of Entikong, the Informal Cross-Border Trade Activities and Policies towards it
3.1. Introduction
This chapter provides a general overview of the Indonesian border region of Entikong. I begin by locating the region and providing the demographic composition, this is followed by a brief look at the socio-economic background of Entikong (section 3.2). The third section of this chapter will discuss the scope and nature of ICBT. Finally, the fourth section will elaborate various government policies on cross-border trade between Indonesia and Malaysia.
3.2. General and Socio-Economic Overview of Entikong, West Kalimantan
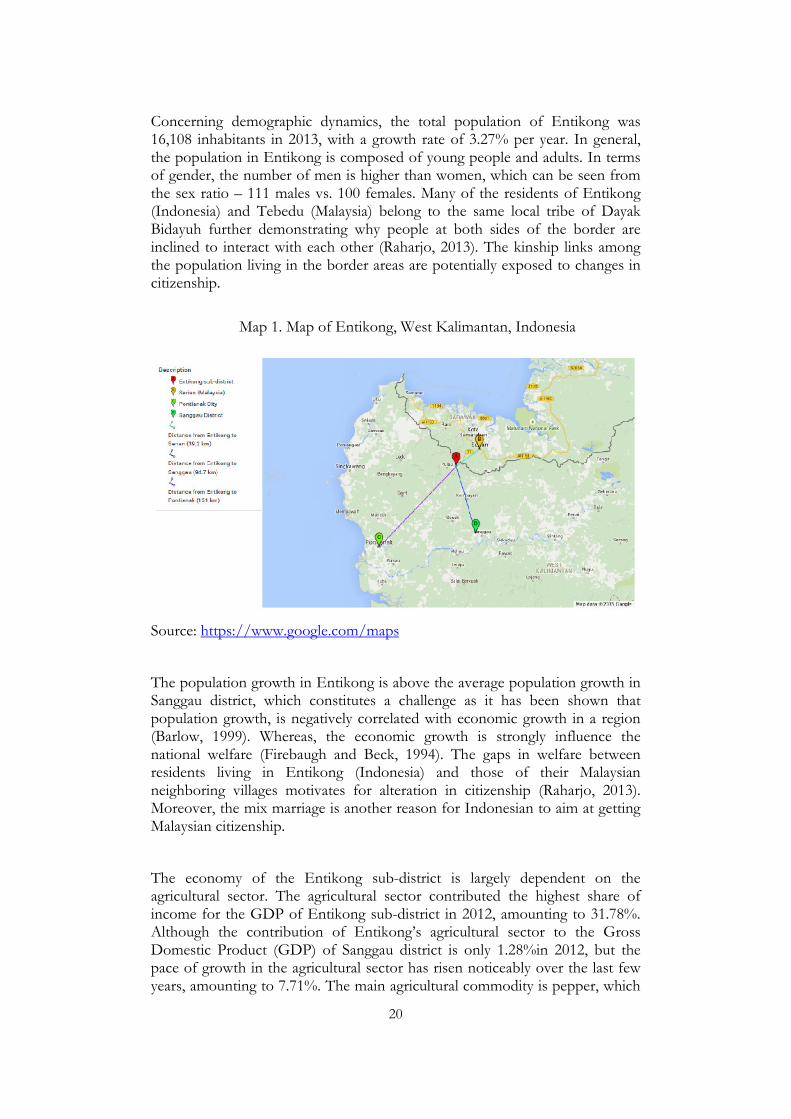
Entikong is a sub-district with a total area of 508.89 km2. It is part of Sanggau -a districtlocated in West Kalimantan, Indonesia. Geographically, the northern area of Entikong borderswith Malaysia, the southern part is next to Bengkayang sub-district, the eastern side borders with Sekayam sub-district, and the western section is next to Landak sub-district (see Map 1). Map 1 shows that the distance from Entikong sub-district to Serian, the capital city of Sarawak (Malaysia), is closer than the distance of Entikong to the capital of the Sanggau district or the capital city of the West Kalimantan province. Therefore,the remote location relative to the rest of Indonesia has forced residents of Entikong to interact more with Malaysia rather than the the Indonesian local district inhabitants.
Entikong is composed of five villages with a topography comprising slopes, valleys, and expanses. The central administration office of Entikong is situated in one of the villages in this sub-district, namely Entikong village. People can access the center either by land or by water. According to Raharjo (2013), the road infrastructure in Entikong is still inadequate. Although the highway of Malaysia-Indonesia (Malindo), which connects Balai Karangan village with the Entikong border post, can be used to reach Entikong, however the roads to access and connect villages within this sub-district are insufficient. Therefore, the residents in Pasang village and Suruh Tembawang village make use of water transportation through the Sekayam River in order to get to the center of Entikongdue to the absence of land roads. Residents in these villageshave to spendRp. 1 million to Rp. 1.4 million for a river boat. The poor road infrastructure in the Entikong sub-districts further limits the possibility of the people located there to interact with the capital city of the West Kalimantan province.
20
Concerning demographic dynamics, the total population of Entikong was 16,108 inhabitants in 2013, with a growth rate of 3.27% per year. In general, the population in Entikong is composed of young people and adults. In terms of gender, the number of men is higher than women, which can be seen from the sex ratio – 111 males vs. 100 females. Many of the residents of Entikong (Indonesia) and Tebedu (Malaysia) belong to the same local tribe of Dayak Bidayuh further demonstrating why people at both sides of the border are inclined to interact with each other (Raharjo, 2013). The kinship links among the population living in the border areas are potentially exposed to changes in citizenship.
Map 1. Map of Entikong, West Kalimantan, Indonesia
Source: https://www.google.com/maps
The population growth in Entikong is above the average population growth in Sanggau district, which constitutes a challenge as it has been shown that population growth, is negatively correlated with economic growth in a region (Barlow, 1999). Whereas, the economic growth is strongly influence the national welfare (Firebaugh and Beck, 1994). The gaps in welfare between residents living in Entikong (Indonesia) and those of their Malaysian neighboring villages motivates for alteration in citizenship (Raharjo, 2013). Moreover, the mix marriage is another reason for Indonesian to aim at getting Malaysian citizenship.
The economy of the Entikong sub-district is largely dependent on the agricultural sector. The agricultural sector contributed the highest share of income for the GDP of Entikong sub-district in 2012, amounting to 31.78%. Although the contribution of Entikong’s agricultural sector to the Gross Domestic Product (GDP) of Sanggau district is only 1.28%in 2012, but the pace of growth in the agricultural sector has risen noticeably over the last few years, amounting to 7.71%. The main agricultural commodity is pepper, which
21
Entikong being the largest producer of pepper in Sanggau district (The Central Bureau of Statistics, 2014). Other important agricultural commodities are rice, corn, soybeans, peanuts, cassava, and sweet potatoes. The shares of other business fields to the GDP of Entikong are trade, hotel and restaurant (15.07%), transportation and communication (13.89%), miscellaneous services (13.49%), and mining and quarrying (11.12%). The GDP of Entikonghas beenshowing a continuous positive trend for the last three years. According to the regional statistics of Entikong sub-district (2014), GDP per capita increased by 4% in 2011 and by another 6% in 2012. In line with this, the GDP of Sanggau district also increased between 2008 and 2012.
In terms of formal jobs in Entikong, most of them are in the fields of education and healthcare. In 2013, the number of educators was 198 persons, comprising 144 teachers of Elementary Schools, 27 teachers of Junior High Schools, and another 27 teachers of Senior High Schools. Compared to the number of students in Entikong, this number of teachers is inadequate. In the health sector, there was a decrease in the number of health professionals (doctors, nurses, midwives, and non-medical personnel) since 2011.
3.3. The Scope and Nature of Informal Cross-Border Trade
The geographical distance from markets and centers in Indonesia and the limited infrastructure are some potential handicaps to inhibit the economic growth of Entikong sub-district. To sell their harvests to the city, farmers have always been struggling to transport their commodities. In addition to the long transporting time, farmers also suffer from fallen prices of their agricultural products due to deteriorating qualities of their perishable commodities. Therefore, residents in Entikong sub-district prefer to sell their agricultural products to Malaysia. Besides a close distance and higher market prices, traders also benefit from the exchange rate against the local currency. Various obstacles in transportation from the provincial capital city or the capital of Sanggau district to Entikong had handicapped distributions of basic commodities and others that are not locally produced. This has triggered price hikes, troubled supplies of the goods, and resulted in supply scarcities. Therefore, it is easy to understand why the residents of Entikong prefer to purchase their daily supplies from the neighboring districts in Malaysia. A shorter distance and more affordable prices are among the reasons for Entikong’s inhabitants to do so. It is precisely this kind of trading activity that is regarded as ICBT.
This ICBT is regulated by the governments of both bordering countries. The Republic of Indonesia and the Kingdom of Malaysia signed an agreement, which was acknowledged as the Border Trade Agreement, on August 24, 1970 in Jakarta. Among other points that are covered in the agreement the land and sea borders are defined and where informal trade is allowed to take place. Further, it also detailed types of traders, who were legally get involved in ICBT, i.e.: the people who live in the border areas of both countries. The other issues
22
regulated were the types of goods and services traded, and the value of goods allowed for, i.e.: each person may only carry goods worth no more than RM 600 or US$ 156.72 per month. The traders engaged in this ICBTare exempt from taxes and duties of exit and entry.
The official documents required for those who are engaged in the ICBT are a PLB and a KILB. The PLB is a privilege for Entikong’s and Sekayam’s residents to enter and exit the border point without being taxed and charged. They are allowed to visit Malaysia for a stay of no more than 30 days. The PLB is valid for two years after the date of its issuance. In terms of the limits of trading areas, the cross-border traders are only allowed to do business withina 30 km range from the border area (Awang et al., 2013). Many residents cross the border for economic purposes or to visit their relatives who reside in the Malaysian borderland. Hereinafter, the KILB is another official document needed by Indonesians who intend to purchase goods in Malaysia or vice versa. When going through the check-point at the border, a trader needs to show the KILB to the customs officers, and the goods being carried are checked for their type and volume.
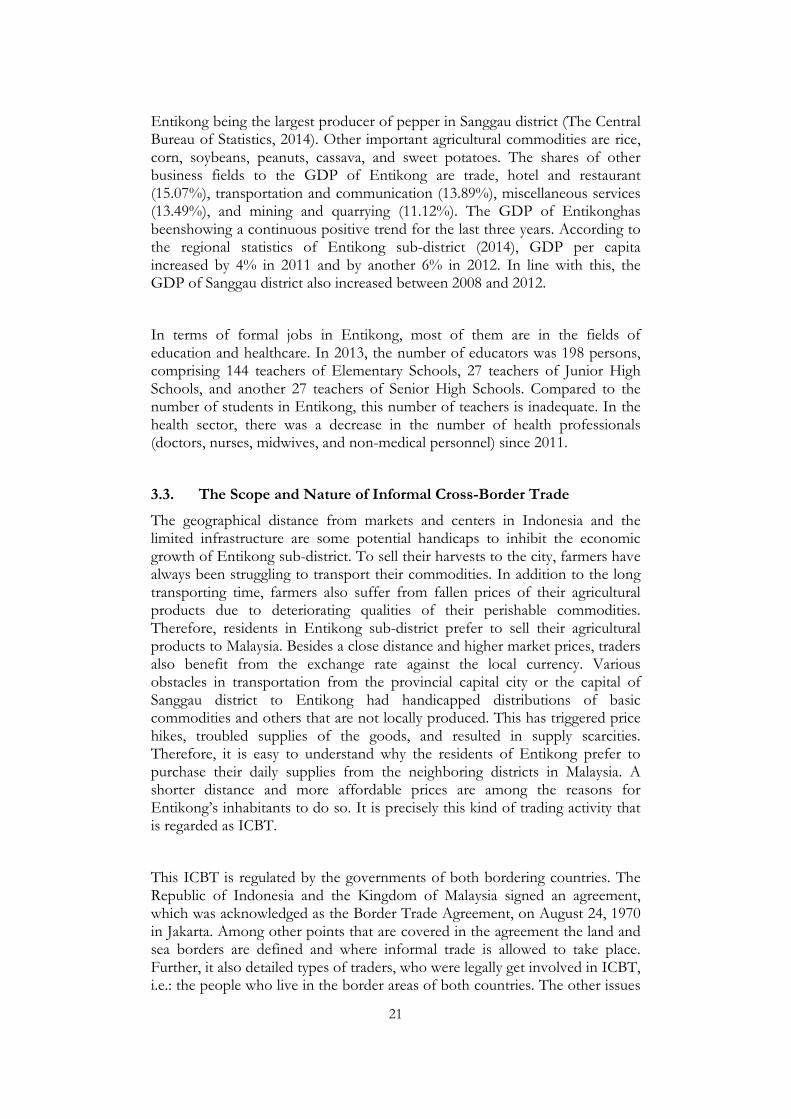
In response to the dynamics of the ICBT, it has been transformed (for legal purposes) into a foreign trading activity, as stated in theMinister of Trade Decree No.36/KP/III/95. Although foreign trade is defined as a type of formal business activities, the administrative requirements are not much different from those of the ICBT under the BTA. People who get involved in foreign trade through the Entikong border must have a PLB and a KILB as supporting documents to legalize their trading activities. The fundamental differences between formal and informal trade are with respect to the value of the goods and services. For formal foreign trade the value is unlimited. Thus, whenever the value of traded goods exceeds RM 600, the items will be subject to import duties as applied on export and import activities in general. All trading transactions of foreign trade through Entikong cross-border post are recorded by the government and included in the national statistics. A graphical representation of the conditions for informal and formal CBT through the Entikong border post is presented in Figure 2.
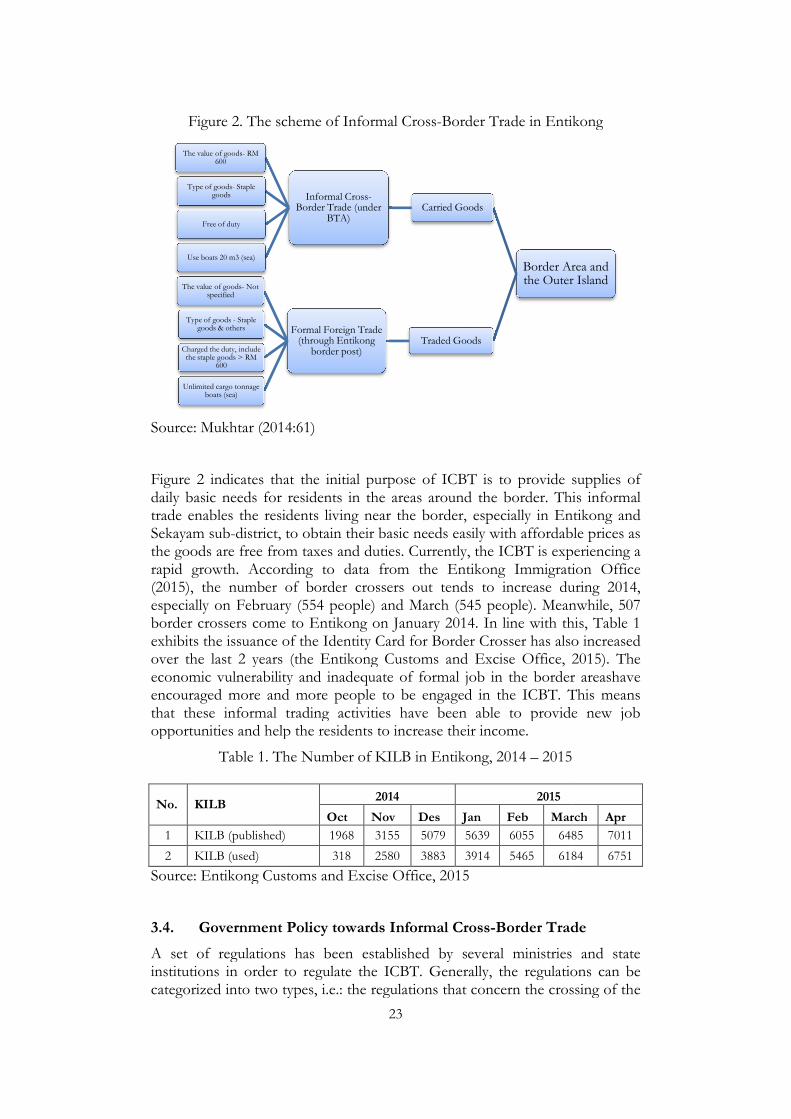
Figure 2. The sch
Source: Mukhtar (2014
Figure 2 indicates thadaily basic needs for rtrade enables the residSekayam sub-district, tthe goods are free fromrapid growth. Accord(2015), the number oespecially on Februaryborder crossers come exhibits the issuance oover the last 2 years economic vulnerabilityencouraged more andthat these informal topportunities and help
Table 1. Th
No. KILB
1 KILB (published)
2 KILB (used)
Source: Entikong Cust
3.4. Government P
A set of regulations institutions in order tcategorized into two ty
The value of goods- RM 600
Type of goods- Staple goods
Free of duty
Use boats 20 m3 (sea)
The value of goods- Not specified
Type of goods - Staple goods & others
Charged the duty, include the staple goods > RM
600
Unlimited cargo tonnage boats (sea)
23
scheme of Informal Cross-Border Trade in Entik
014:61)
that the initial purpose of ICBT is to provide sr residents in the areas around the border. Thi
esidents living near the border, especially in Entt, to obtain their basic needs easily with affordablrom taxes and duties. Currently, the ICBT is expeording to data from the Entikong Immigratir of border crossers out tends to increase duary (554 people) and March (545 people). Meane to Entikong on January 2014. In line with th
e of the Identity Card for Border Crosser has alsors (the Entikong Customs and Excise Office, 2ility and inadequate of formal job in the bordernd more people to be engaged in the ICBT. Tl trading activities have been able to provideelp the residents to increase their income.
The Number of KILB in Entikong, 2014 – 2015
2014 2015
Oct Nov Des Jan Feb Marc
1968 3155 5079 5639 6055 648
318 2580 3883 3914 5465 618
ustoms and Excise Office, 2015
nt Policy towards Informal Cross-Border Trad
ns has been established by several ministries r to regulate the ICBT. Generally, the regulatio
types, i.e.: the regulations that concern the cross
Border Arthe Outer
Carried GoodsInformal Cross-
Border Trade (under BTA)
Traded GoodsFormal Foreign Trade
(through Entikong border post)
ntikong
e supplies of his informal ntikong and
able prices as xperiencing a ation Office during 2014, anwhile, 507
this, Table 1 lso increased , 2015). The er areashave
. This means ide new job
arch Apr
6485 7011
6184 6751
rade
ies and state tions can be ossing of the
Area and ter Island
24
border point by traded goods, and the ones ruling the crossing of the border by people. The trade agreements inthe borderland between Indonesia and Malaysia have been in existence since 1967. The first revision was carried out in 1970, and it later underwent another revision in 1994. The latest revision was proposed in 2010 but it has not been completed and implemented until now.
The agreement that regulates the trade relations between Indonesia and Malaysia in the border areas was signed on 11 May 1967 in Kuala Lumpur and contains some basic agreements on trade and the economic relations between the two countries. This agreement was replaced by the new agreement that was signed in 16 October 1973. In order to advance and expand the technical and economic cooperation’s, the two countries have agreed on some important points that rule the mechanism of the cooperation. One part of the mechanism is the expansion of trade and improvement in payment regulations between the two countries. Both governments have agreed to give equal treatment to economic activities such as trade, investment, and many others, no matter whether they are undertaken by residents or citizens of the neighboring country. One advantage of this cooperation is the exemption of import and export duties for trading activities through the cross-border post. The residents in the border areas that have a cross-border pass can take advantage of this regulation. These advantages are provided by the governments in both countries to facilitate cross-border trade traffic.
The first revision of the rules set in the Agreement on Border Trade between the Government of Republic of Indonesia and that of Malaysia (or, which is well-known as the Border Trade Agreement was signed on August 24, 1970 in Jakarta. In general, the agreement stated that ICBT can be done through both land borders and sea borders based on the demarcation lines agreed upon. The commodities allowed to trade by Indonesian border-crossers are agricultural products and someothers except for minerals, oils and ores. While on the Malaysian side, the residents are permitted to sell goods for basic needs and other commodities, which are needed by the industries in the border areas such as appliances, tools and other equipment. People who are allowed to get involved in ICBT are those who live in the border areas and possess a valid national passport or a border pass issued by the authorized institutions, as stated in the Basic Arrangement on Border Crossing in 1967. Every movement of traded goods through the Indonesian border area needs to be checked by the officers at the Indonesian Border Control Post, and the value of transactions allowed for ICBT must not exceed RM 600 per month.
The increasing traffic of goods and services traded through Entikong border post prompted the government to revise the regulations through the Decree of the Minister of Trade No.36/KP/III/95. In general, the arrangement contains provisions on cross-border trade through Entikong border post in West Kalimantan. Cross-border trade in Entikong border post can be either traditional or foreign trade. The traditional cross-border trade is carried out in
25
accordance with provisions contained in the BTA 1970. While the foreign trade, which is conducted over Entikong border post, is regulated by the regular export and import provisions. Realization of income and expenditure related to goods and services traded under the foreign trade regime is recorded by the head of the local Ministry of Trade in West Kalimantan province, and it is then submitted to the head of research and development of the national Ministry of Trade every three months.
In 2009, the Indonesian government proposed a revision of the regulation to Malaysia, in relation to the trade agreement between the two countries in the border region. One of the items in the schemes was a hike in the maximum payment ceiling from RM 600 per Border Crossing Pass to RM 1,500. The Ministry of Trade had planned for this revision to be completed in 2010. However, both countries failed to reach an agreement on this issue until 2010. As stated by the Director General of International Trade Cooperation from the Ministry of Trade, the revision of the regulation was still in process in 2010 (Suhendra, 2010). But the revision of the 1970 BTA became a polemic, and up to now there has not yet been any agreement between Indonesia and Malaysia regarding the proposed increase in the maximum spending limit.
The basic agreement of individual movements in the border area between Indonesia and Malaysia was outlined in an agreement on border crossing (or well-known as the Border Crossing Agreement/BCA) between the Government of the Republic of Indonesia and that of Malaysia, which was signed on June 12, 2006 in Bukit Tinggi. This agreement replaced the previous one that was signed in Medan on May 12, 1984. In addition to discussing exit and entry points in the border region, the BCA sets a catchment zone that is associated with each border point. The catchment zone defines the areas where cross-border trade facilities, in Indonesia and Malaysia, either formal or informal ones, are located.

26
Chapter 4
Research Methodology
4.1. Introduction
This research combines qualitative and quantitative methods to outline who get involves in ICBT and to what extent the household income is affected by the participation in ICBT in the Entikong area. The data used is primary and secondary data. Primary data is obtained from a survey among 147 people who live in the Entikong region and secondary data is obtained from a variety of sources, such as the The Central Bureau ofStatistics, the National Board of Border Management, the Entikong Customs and Excise Office, and the Entikong Immigration Office.
4.2. Set up of the survey and quantitative analysis
The author carried out a survey among 77 ICB traders and 70 non-informal cross border traders who live all in the Entikong area. The snowball sampling method was employed making use of a key informant. This method is chosen because it is deemed appropriate whenever “populations are not easily identified or accessed” (O ‘leary, 2014). The survey instrument which was used for the study is the ICBT questionnaire which was developed by the Uganda Bureau of Statistics (UBOS) in 2008. The questionnaire consists of ‘closed’ and ‘open-ended questions’ that have been adapted to the Indonesian context. The ‘open-ended questions’ allow respondents to share their opinion and the ‘closed question’ aim to “seek quantitative information about the respondents’ attributes or behavior” (Hay, 2010:194-195).
In order to facilitate the data collection’s process, this data collection involved two research assistants to distribute the questionnaires. The main tasks of the research assistants were the arrangement of an initial picture to the questionnaire and to help the respondents in filling in the questionnaire. The research assistants were chosen based on their ability to conduct interviews and have in-depth knowledge about the ICBT in Entikong. The research assistants “explained to the traders the purpose of the study; assured them of the confidentiality of information provided and informed them that there was no monetary compensation for participating” (Ama et al, 2013:4224).
In order to analyze the quantitative survey information, regression analysis is employed. To date there is only a small number of quantitative studies on ICBT and it is difficult to assess the impact of ICBT as it is challenging to establish a comparable control group of individuals who are not engaged in ICBT. Therefore, individuals where sampled who live in Entikong and engage in ICBT and comparable individuals who live in Entikong but do not engage in ICBT. Identifying the differences between these two groups of individuals is one of the main aspects of the questionnaire. In the empirical analysis, these
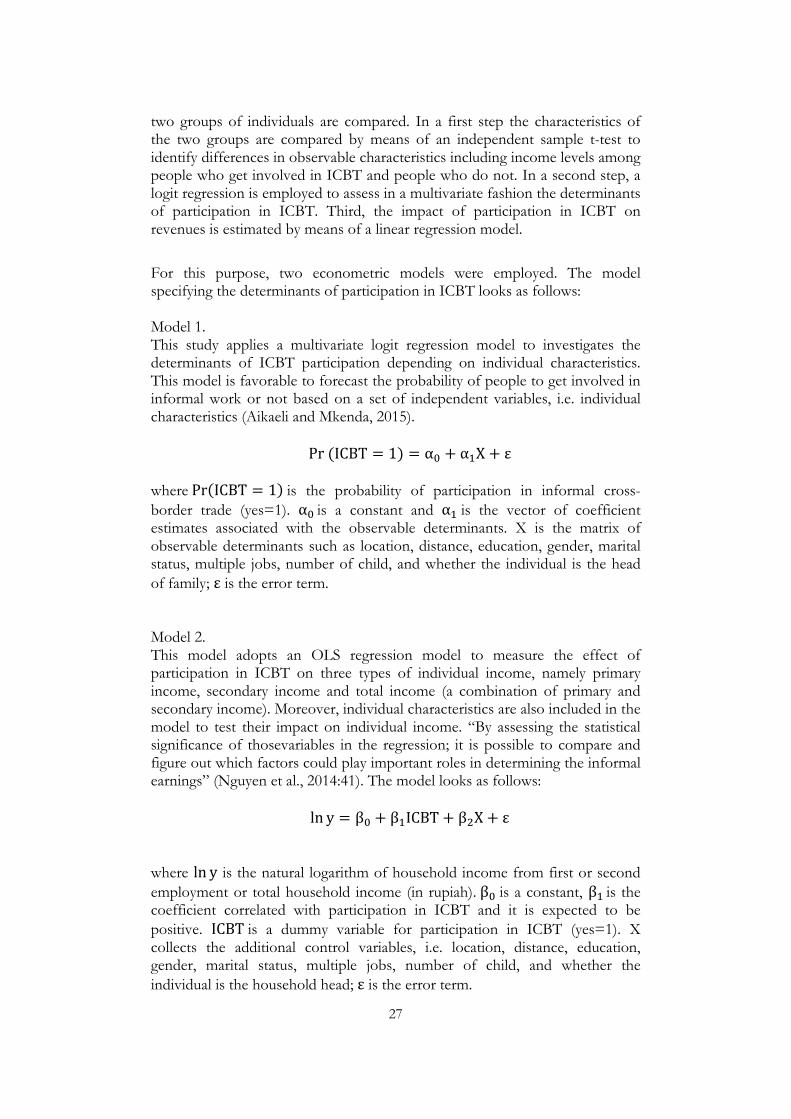
27
two groups of individuals are compared. In a first step the characteristics of the two groups are compared by means of an independent sample t-test to identify differences in observable characteristics including income levels among people who get involved in ICBT and people who do not. In a second step, a logit regression is employed to assess in a multivariate fashion the determinants of participation in ICBT. Third, the impact of participation in ICBT on revenues is estimated by means of a linear regression model.
For this purpose, two econometric models were employed. The model specifying the determinants of participation in ICBT looks as follows: Model 1. This study applies a multivariate logit regression model to investigates the determinants of ICBT participation depending on individual characteristics. This model is favorable to forecast the probability of people to get involved in informal work or not based on a set of independent variables, i.e. individual characteristics (Aikaeli and Mkenda, 2015).
Pr (ICBT = 1) = α + α�X + ε
where Pr(ICBT = 1) is the probability of participation in informal cross-
border trade (yes=1). α is a constant and α� is the vector of coefficient estimates associated with the observable determinants. X is the matrix of observable determinants such as location, distance, education, gender, marital status, multiple jobs, number of child, and whether the individual is the head
of family; ε is the error term. Model 2. This model adopts an OLS regression model to measure the effect of participation in ICBT on three types of individual income, namely primary income, secondary income and total income (a combination of primary and secondary income). Moreover, individual characteristics are also included in the model to test their impact on individual income. “By assessing the statistical significance of thosevariables in the regression; it is possible to compare and figure out which factors could play important roles in determining the informal earnings” (Nguyen et al., 2014:41). The model looks as follows:
ln y = β + β�ICBT + β�X + ε
where ln y is the natural logarithm of household income from first or second
employment or total household income (in rupiah). β is a constant, β� is the coefficient correlated with participation in ICBT and it is expected to be
positive. ICBT is a dummy variable for participation in ICBT (yes=1). X collects the additional control variables, i.e. location, distance, education, gender, marital status, multiple jobs, number of child, and whether the
individual is the household head; ε is the error term.
28
Household income is categorized into three types, namely the primary income (income derived from the first job, in this case ICBT for the traders), secondary income (income derived from the second job), and total income (income jointly derived from the first and second job). The reason for looking at these three types of income is that the majority of traders engage in ICBT as main income generating activity but most people also have a second job to make ends meet. Carneiro and Henley (2001:12) pointed out that “additional income from other sources in the household might reduce the marginal utility of the opportunity cost of paying social insurance contribution”. In addition to providing protection against the risk of loss of the primary income, the presence of secondary income would weaken the individual’s social security necessities. Thereof, it is important to examine the different sources of household income, namely primary, secondary and total income.
4.3. Qualitative and Secondary Data
For the collection of qualitative data this study identified key informants from the National Board of Border Management, the Entikong district office, the Entikong Customs and Excise Office, the Entikong Immigration Office, and the Entikong Border Point Office. All key informants were interviewed based on their role related to ICBT. The first key informant is the Deputy AssistantState Transboundary Management (BNPP). In accordance with the Regulation of the Minister of Home Affairs No.43 in 2010, the Deputy Assistant State Transboundary Management is in charge of preparing and formulating master plans and action plans, coordinating policy formulations, budgeting, controlling, monitoring, evaluating and reporting on the implementation of activities in the border states, especially concerning land borders. The second key informant is the Head of the Entikong sub-District who gave a brief description of the socioeconomic conditions in Entikong. After that, the interview continued with the Head of Customs Office in Entikong, Head of Immigration Office in Entikong and Head of Management Unit of Cross-Border Checkpoint (UP3LB). The last three officers are vertical government officers from the central government in Jakarta.
Based on the information, which was acquired from the key informants, the survey questionnaires were developed and distributed. The survey took place for three weeks during April to May 2015. In addition to the survey, the research assistants also collected field observations and asked additional questions (besides the systematic questions) to the respondents to enrich the information needed. A total of 150 questionnaires were distributed and 147 respondents returned the questionnaire. Some questionnaires are not completely answered. Of the remaining 147 respondents, 77 respondents are people who engage in ICBT and the remaining 70 respondents are people who do not engage in ICBT. The composition of respondents is 50 women and 97 men.
29
This study also employs secondary data to enrich the analysis. Secondary data are obtained from national data sources such as the Central Bureau of Statistics (BPS). In addition, the researcher also collected official reports from the Entikong Customs and Excise Office, and the Entikong Immigration Office about the ICBT activities. Media releases both in print and online, also produces a wide range of pertinent information for this study. Certainly, the online sources needed to be checked for reliability and accuracy. To deal with this, O’Leary (2014) suggests several strategies in selecting the appropriate fact from the internet, like searching for evidence from various sources, conducting peer review of the evidence obtained from another source, checking the credibility of the issuer and the references that are used as a basis to produce this information.
4.4. Ethical considerations pertaining to the survey
The ICBT is a very sensitive issue for the informal economic actors who live in the borderland areas. Most of them ask what the intention of this research are. Besides the issue of taxation, one of their biggest concerns is the issue of the elimination of ICBT. The issues cause the respondents who rely on ICBT as an income generating source to be concerned. Consequently, they feel reluctant or even afraid to provide full information in the questionnaire resulting in missing answers. Facing this problem, the research assistants briefly explained the academic nature of this study. Moreover, the research assistants clearly conveyed the information to the respondent that the results of this survey are confidential and will not be published to a government agency or others.
4.5. Hypothesis
Based on the conceptual framework, this research establishes two main hypotheses, which pertain to the determinants of ICBT and its relation with household income.
Hypothesis 1: There are significant differences in demographic, socio-economic and geographic characteristics which influence the decision of individuals to engage in ICBT, i.e. gender, location, distance, multiplicity of jobs, being a household head and the ownership of assets.
Hypothesis 2: There are significant differences in household income between people who get involved in ICBT and people who do not get involved as individuals and households get engaged in cross-border trade to improve their economic conditions.
30
Chapter 5
Analysis
5.1. Introduction
This chapter examines the ICBT in Entikong through qualitative and quantitative techniques. The quantitative data will be assessed by using regression techniques, whereas the qualitative data will be analyzed descriptively by means of graphical representations. I start the analysis by looking at the determinants of people’s participation in ICBT. Then, I move on to the revenues gained from engaging in the ICBT. And finally I takes a look into the types of commodities traded.
5.2. Descriptive statistics
The demographic characteristics of the 77 people who get involved and the 70 people who do not get involved in the informal cross boder trade are presented in Table 2. I start with a descriptive analysis and a simple comparison of means. The number of men and women who engage in the ICBT is slightly different, with 3.9% more men in my sample being ICB traders. In other words, there is only a small difference in the number of men and women involved in ICBT. In contrast, the majority of people in the sample who do not participate in ICBT are men (81.43%). This gender difference across the two sub-samples is statistically significant.
In terms of education, I observe that most of the people who do not engage in ICBT are Junior High School graduates (60%). Meanwhile, the educational background of those participating is more varied. 42.86% of them are graduates of Junior High School; 27.27% have completed their education in secondary school; and some 5.19% have never received any formal education. However, with almost 9 years of education on average the educational levels are statistically identical across the tow samples (p-value=0.467). As it can be seen from the information on distance to the border, the sampled individuals live in three areas close to the border, and no noticeable diversity can be constructed between people engaged in ICBT and those who are not indicating that in terms of location the control group is suitable for the comparison (p-value=0.634). Moreover, the information on distance show a that it is not only those who live near the border who engage in ICBT. The largest group of traders (45.45%) live more than 26 km away from the border.
Further, the data shows that roughly half the participants in ICBT are household heads (49.35%). The respondents who state that they do not engage in informal trade are even more likely to be heads of household (78.57%) with the difference being statistically significant. Most of ICB traders (93.51) come from Entikong and Sekayam village; this high share may be due to the
31
provision of the free PLB by the local governments, as a requirement for those who want to take part in ICBT. Concerning other factors such as age, marital status, family size, number of child and number of school-age children, it was found that the sampled individuals of the two groups, participants and non-participants of ICBT, have many common characteristics. The majority of them are married an between 26 and 40 years old. The average size of the household is 4 to 5 people, with one or two school-aged children. The number of child there are no statistically significant differences between ICB traders and non-traders.
Furthermore, the assets owned by people who engage in ICBT and those who do not are not extremely heteregeneous. It can be shown that nearly all live in permanent houses with brick walls. The flooring and roofing materials used are also similar between the two groups. They normally have floors made from cement and roofs of metal sheets. Moreover, all of the interviewed individuals tend to have a house with two rooms, apart from the kitchen, bathroom and storage-room.
Looking at their income, both groups show similar patterns for revenues from the first job. The majority of the respondents earn between Rp. 1,000,000 and Rp. 2,000,000 from their first job. However, ICB traders earn more with the difference being significant at th 3.6% level. Moreover, an even more pronounced difference is found in terms of revenues received from the second job. People who do not get involved in ICBT have very moderate incomes from their second job ranging below Rp. 1,000,000. In contrast, ICB traders tend to receive higher revenues from their second jobs, suggesting that ICBT might beused as a coping mechanism by those who need extra income to make ends meet or those who have encountered extra-expenditures due to unforeseen events. Consequently, 58.44% of the people who engage in ICBT prefer to have multiple jobs.
To sum up, the descriptive analysis indicates that there are very few differences in observable demographic characteristics and in assets for ICB traders versus non-traders, but significant disparities appear in income levels between the two groups. This result does not only stem from differences in income from the second job, but also holds for total revenues. I now turn to a multivariate comparison of the determinants of participation in ICB to assess whether the impression gained from the simple differences in means can be confirmed.
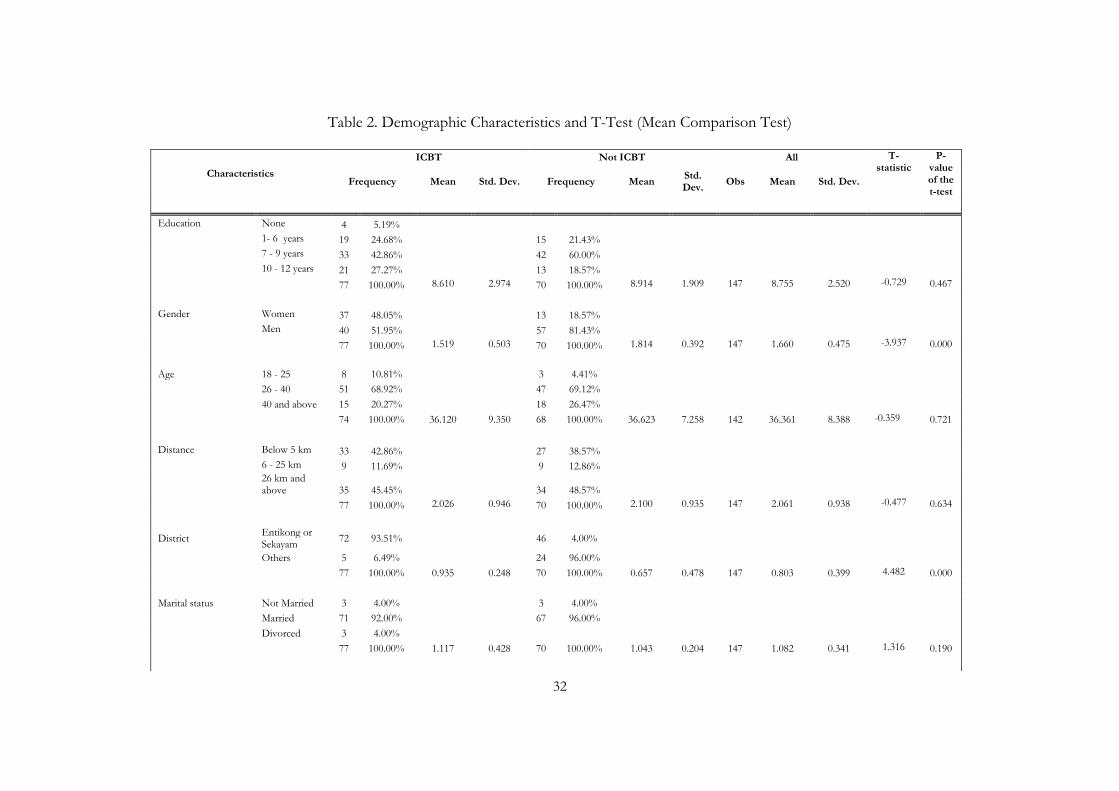
32
Table 2. Demographic Characteristics and T-Test (Mean Comparison Test)
Characteristics
ICBT Not ICBT All T-statistic
P-value of the t-test
Frequency Mean Std. Dev. Frequency Mean Std. Dev.
Obs Mean Std. Dev.
Education None 4 5.19%
1- 6 years 19 24.68% 15 21.43%
7 - 9 years 33 42.86% 42 60.00%
10 - 12 years 21 27.27% 13 18.57%
77 100.00% 8.610 2.974 70 100.00% 8.914 1.909 147 8.755 2.520 -0.729 0.467
Gender Women 37 48.05% 13 18.57%
Men 40 51.95% 57 81.43%
77 100.00% 1.519 0.503 70 100.00% 1.814 0.392 147 1.660 0.475 -3.937 0.000
Age 18 - 25 8 10.81%
3 4.41%
26 - 40 51 68.92%
47 69.12%
40 and above 15 20.27%
18 26.47%
74 100.00% 36.120 9.350 68 100.00% 36.623 7.258 142 36.361 8.388 -0.359 0.721
Distance Below 5 km 33 42.86% 27 38.57%
6 - 25 km 9 11.69% 9 12.86%
26 km and above 35 45.45% 34 48.57%
77 100.00% 2.026 0.946 70 100.00% 2.100 0.935 147 2.061 0.938 -0.477 0.634
District Entikong or Sekayam
72 93.51%
46 4.00%
Others 5 6.49%
24 96.00%
77 100.00% 0.935 0.248 70 100.00% 0.657 0.478 147 0.803 0.399 4.482 0.000
Marital status Not Married 3 4.00%
3 4.00%
Married 71 92.00%
67 96.00%
Divorced 3 4.00%
77 100.00% 1.117 0.428 70 100.00% 1.043 0.204 147 1.082 0.341 1.316 0.190
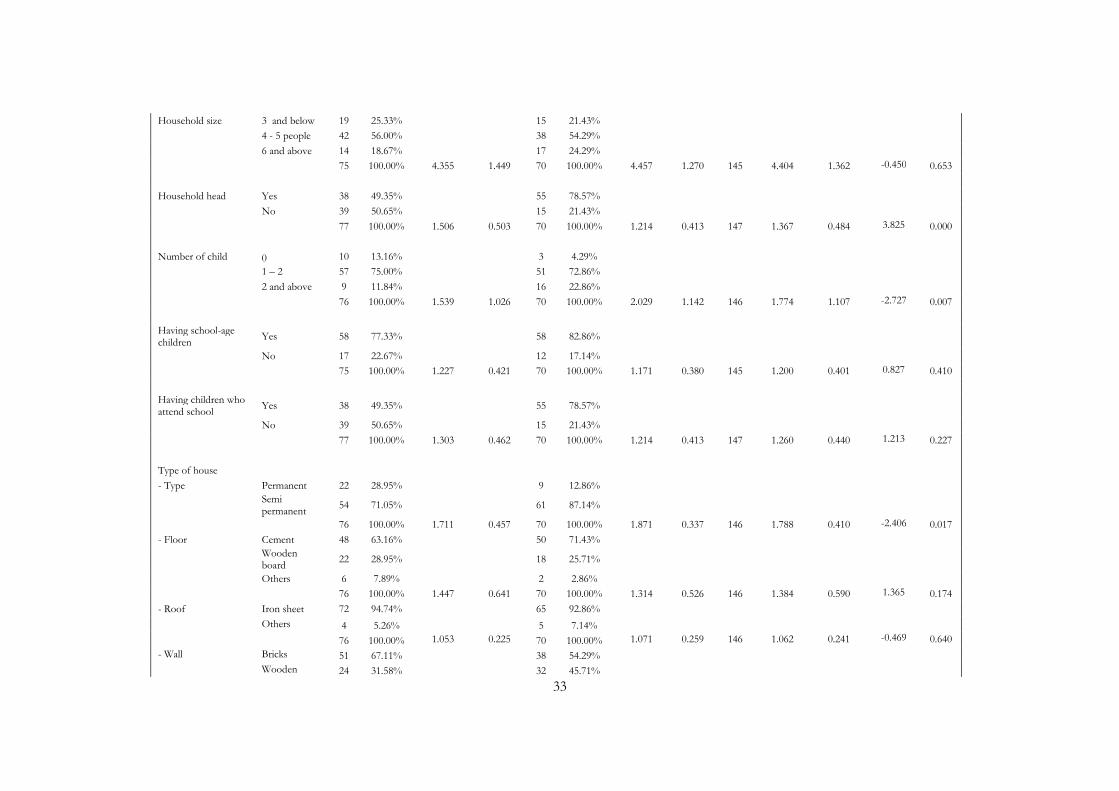
33
Household size 3 and below 19 25.33%
15 21.43%
4 - 5 people 42 56.00%
38 54.29%
6 and above 14 18.67%
17 24.29%
75 100.00% 4.355 1.449 70 100.00% 4.457 1.270 145 4.404 1.362 -0.450 0.653
Household head Yes 38 49.35%
55 78.57%
No 39 50.65%
15 21.43%
77 100.00% 1.506 0.503 70 100.00% 1.214 0.413 147 1.367 0.484 3.825 0.000
Number of child 0 10 13.16%
3 4.29%
1 – 2 57 75.00%
51 72.86%
2 and above 9 11.84%
16 22.86%
76 100.00% 1.539 1.026 70 100.00% 2.029 1.142 146 1.774 1.107 -2.727 0.007
Having school-age children
Yes 58 77.33%
58 82.86%
No 17 22.67%
12 17.14%
75 100.00% 1.227 0.421 70 100.00% 1.171 0.380 145 1.200 0.401 0.827 0.410
Having children who attend school
Yes 38 49.35%
55 78.57%
No 39 50.65%
15 21.43%
77 100.00% 1.303 0.462 70 100.00% 1.214 0.413 147 1.260 0.440 1.213 0.227
Type of house
- Type Permanent 22 28.95%
9 12.86%
Semi permanent
54 71.05%
61 87.14%
76 100.00% 1.711 0.457 70 100.00% 1.871 0.337 146 1.788 0.410 -2.406 0.017
- Floor Cement 48 63.16%
50 71.43%
Wooden board
22 28.95%
18 25.71%
Others 6 7.89%
2 2.86%
76 100.00% 1.447 0.641 70 100.00% 1.314 0.526 146 1.384 0.590 1.365 0.174
- Roof Iron sheet 72 94.74%
65 92.86%
Others 4 5.26% 5 7.14%
76 100.00% 1.053 0.225 70 100.00% 1.071 0.259 146 1.062 0.241 -0.469 0.640
- Wall Bricks 51 67.11% 38 54.29%
Wooden 24 31.58% 32 45.71%
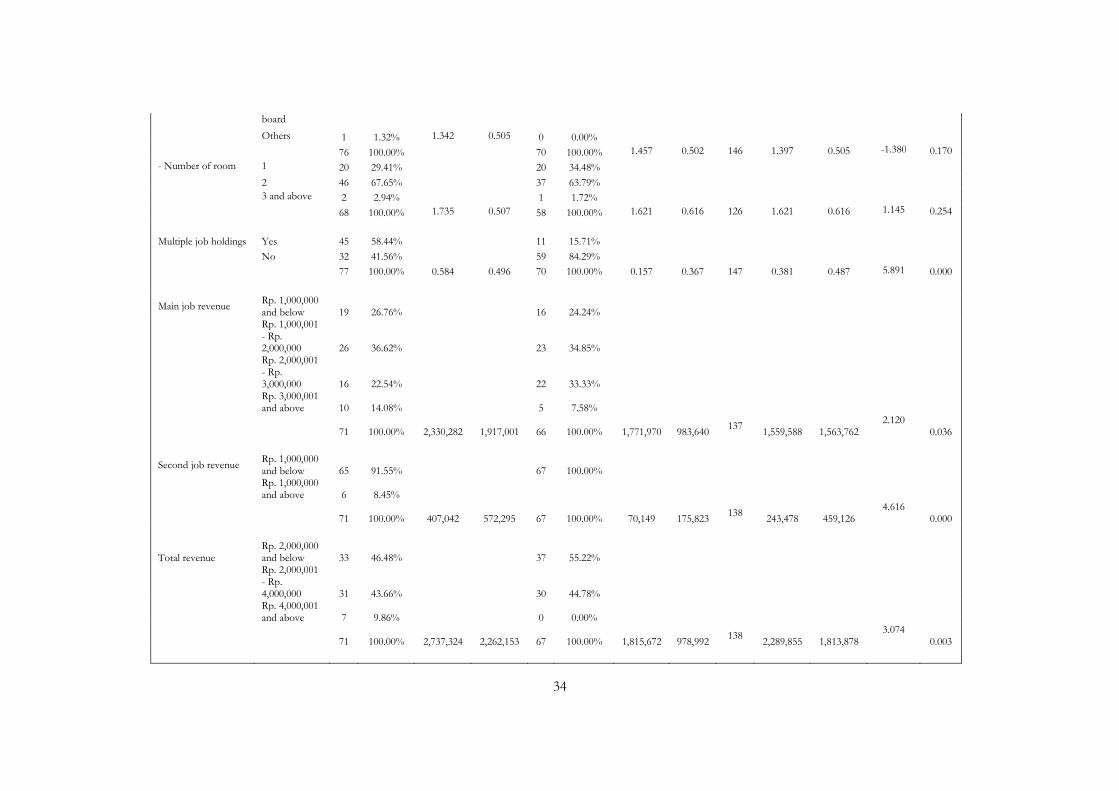
34
board
Others 1 1.32% 1.342 0.505 0 0.00%
76 100.00%
70 100.00% 1.457 0.502 146 1.397 0.505 -1.380 0.170
- Number of room 1 20 29.41% 20 34.48%
2 46 67.65% 37 63.79%
3 and above 2 2.94% 1 1.72%
68 100.00% 1.735 0.507 58 100.00% 1.621 0.616 126 1.621 0.616 1.145 0.254
Multiple job holdings Yes 45 58.44%
11 15.71%
No 32 41.56%
59 84.29%
77 100.00% 0.584 0.496 70 100.00% 0.157 0.367 147 0.381 0.487 5.891 0.000
Main job revenue Rp. 1,000,000 and below 19 26.76% 16 24.24%
Rp. 1,000,001 - Rp. 2,000,000 26 36.62%
23 34.85%
Rp. 2,000,001 - Rp. 3,000,000 16 22.54%
22 33.33%
Rp. 3,000,001 and above 10 14.08% 5 7.58%
71 100.00%
2,330,282
1,917,001 66 100.00%
1,771,970
983,640 137
1,559,588
1,563,762
2.120 0.036
Second job revenue Rp. 1,000,000 and below 65 91.55% 67 100.00%
Rp. 1,000,000 and above 6 8.45%
71 100.00%
407,042
572,295 67 100.00%
70,149
175,823
138
243,478
459,126 4.616
0.000
Total revenue Rp. 2,000,000 and below 33 46.48% 37 55.22%
Rp. 2,000,001 - Rp. 4,000,000 31 43.66%
30 44.78%
Rp. 4,000,001 and above 7 9.86% 0 0.00%
71 100.00%
2,737,324
2,262,153 67 100.00%
1,815,672
978,992 138
2,289,855
1,813,878
3.074 0.003
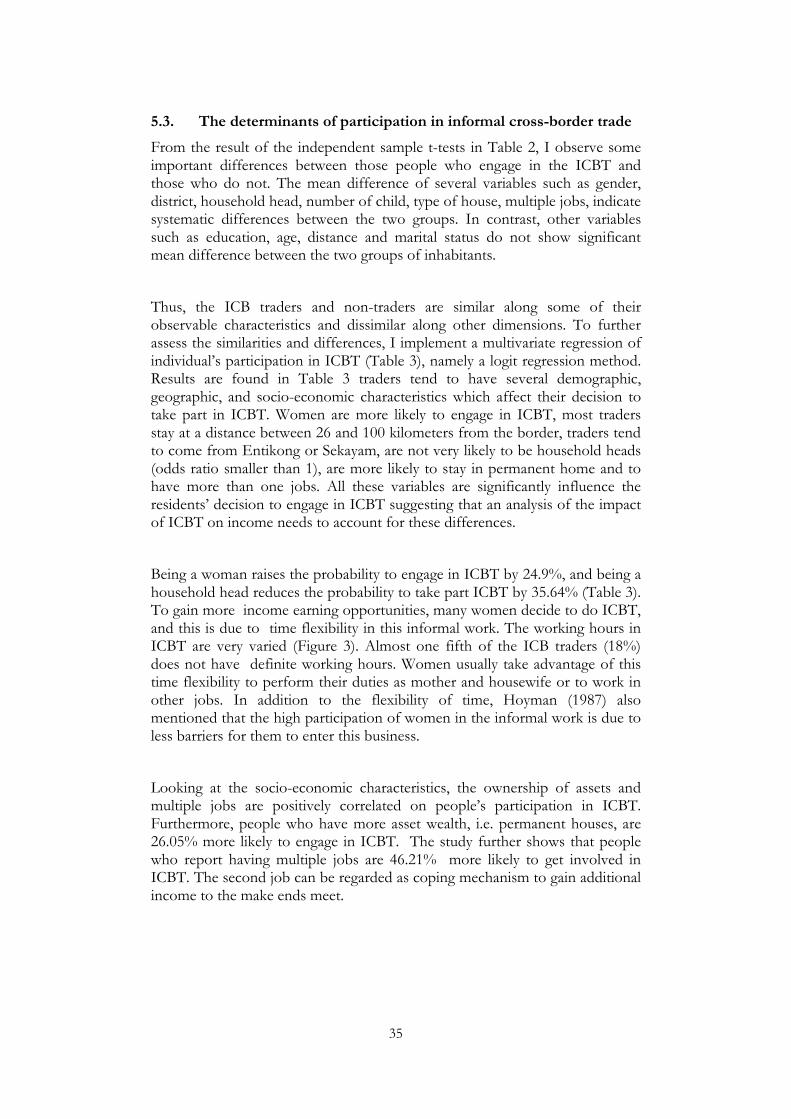
35
5.3. The determinants of participation in informal cross-border trade
From the result of the independent sample t-tests in Table 2, I observe some important differences between those people who engage in the ICBT and those who do not. The mean difference of several variables such as gender, district, household head, number of child, type of house, multiple jobs, indicate systematic differences between the two groups. In contrast, other variables such as education, age, distance and marital status do not show significant mean difference between the two groups of inhabitants.
Thus, the ICB traders and non-traders are similar along some of their observable characteristics and dissimilar along other dimensions. To further assess the similarities and differences, I implement a multivariate regression of individual’s participation in ICBT (Table 3), namely a logit regression method. Results are found in Table 3 traders tend to have several demographic, geographic, and socio-economic characteristics which affect their decision to take part in ICBT. Women are more likely to engage in ICBT, most traders stay at a distance between 26 and 100 kilometers from the border, traders tend to come from Entikong or Sekayam, are not very likely to be household heads (odds ratio smaller than 1), are more likely to stay in permanent home and to have more than one jobs. All these variables are significantly influence the residents’ decision to engage in ICBT suggesting that an analysis of the impact of ICBT on income needs to account for these differences.
Being a woman raises the probability to engage in ICBT by 24.9%, and being a household head reduces the probability to take part ICBT by 35.64% (Table 3). To gain more income earning opportunities, many women decide to do ICBT, and this is due to time flexibility in this informal work. The working hours in ICBT are very varied (Figure 3). Almost one fifth of the ICB traders (18%) does not have definite working hours. Women usually take advantage of this time flexibility to perform their duties as mother and housewife or to work in other jobs. In addition to the flexibility of time, Hoyman (1987) also mentioned that the high participation of women in the informal work is due to less barriers for them to enter this business.
Looking at the socio-economic characteristics, the ownership of assets and multiple jobs are positively correlated on people’s participation in ICBT. Furthermore, people who have more asset wealth, i.e. permanent houses, are 26.05% more likely to engage in ICBT. The study further shows that people who report having multiple jobs are 46.21% more likely to get involved in ICBT. The second job can be regarded as coping mechanism to gain additional income to the make ends meet.
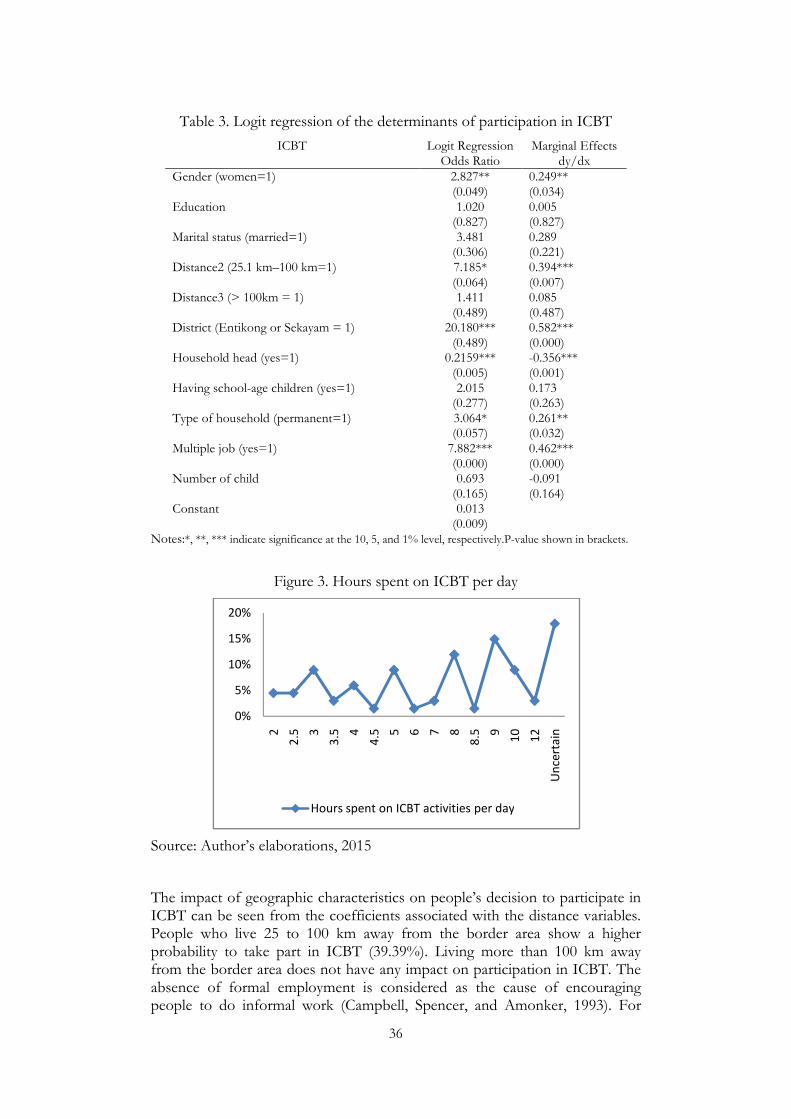
36
Table 3. Logit regression of the determinants of participation in ICBT
ICBT Logit Regression Marginal Effects
Odds Ratio dy/dx
Gender (women=1) 2.827** 0.249**
(0.049) (0.034)
Education 1.020 0.005
(0.827) (0.827)
Marital status (married=1) 3.481 0.289
(0.306) (0.221)
Distance2 (25.1 km–100 km=1) 7.185* 0.394***
(0.064) (0.007)
Distance3 (> 100km = 1) 1.411 0.085
(0.489) (0.487)
District (Entikong or Sekayam = 1) 20.180*** 0.582***
(0.489) (0.000)
Household head (yes=1) 0.2159*** -0.356***
(0.005) (0.001)
Having school-age children (yes=1) 2.015 0.173
(0.277) (0.263)
Type of household (permanent=1) 3.064* 0.261**
(0.057) (0.032)
Multiple job (yes=1) 7.882*** 0.462***
(0.000) (0.000)
Number of child 0.693 -0.091
(0.165) (0.164)
Constant 0.013 (0.009)
Notes:*, **, *** indicate significance at the 10, 5, and 1% level, respectively.P-value shown in brackets.
Figure 3. Hours spent on ICBT per day
Source: Author’s elaborations, 2015
The impact of geographic characteristics on people’s decision to participate in ICBT can be seen from the coefficients associated with the distance variables. People who live 25 to 100 km away from the border area show a higher probability to take part in ICBT (39.39%). Living more than 100 km away from the border area does not have any impact on participation in ICBT. The absence of formal employment is considered as the cause of encouraging people to do informal work (Campbell, Spencer, and Amonker, 1993). For
0%
5%
10%
15%
20%
2
2.5 3
3.5 4
4.5 5 6 7 8
8.5 9
10
12
Un
cert
ain
Hours spent on ICBT activities per day
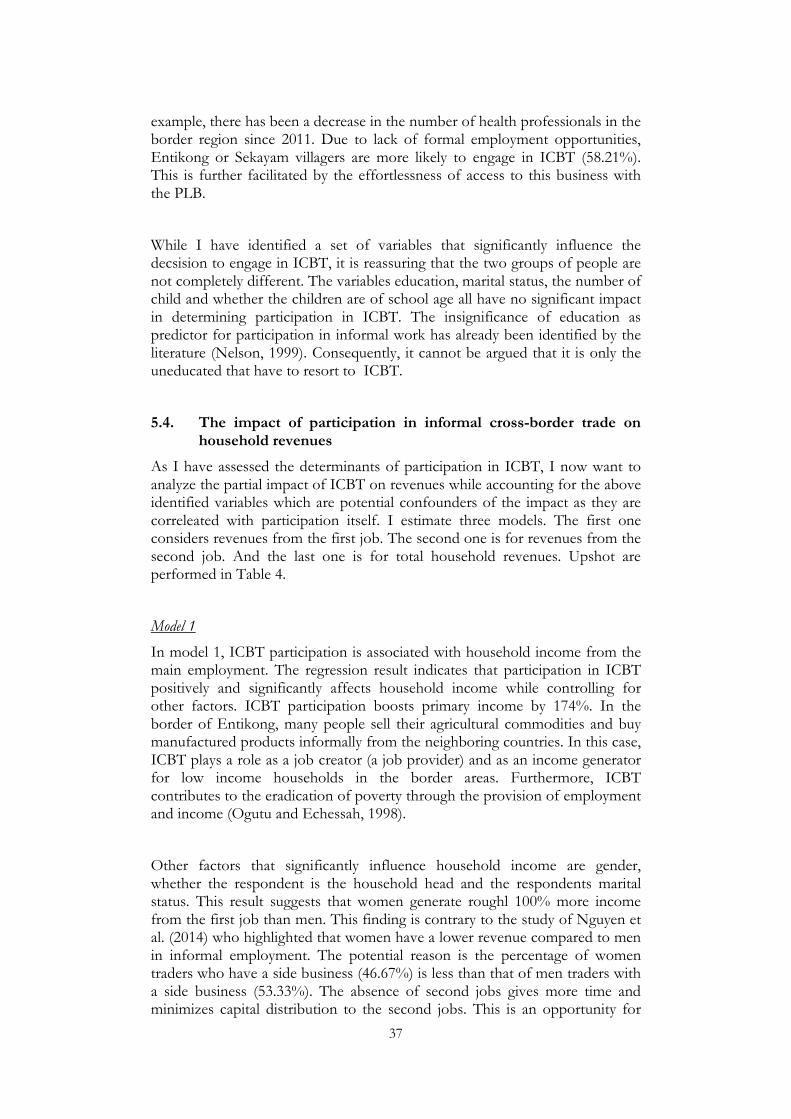
37
example, there has been a decrease in the number of health professionals in the border region since 2011. Due to lack of formal employment opportunities, Entikong or Sekayam villagers are more likely to engage in ICBT (58.21%). This is further facilitated by the effortlessness of access to this business with the PLB.
While I have identified a set of variables that significantly influence the decsision to engage in ICBT, it is reassuring that the two groups of people are not completely different. The variables education, marital status, the number of child and whether the children are of school age all have no significant impact in determining participation in ICBT. The insignificance of education as predictor for participation in informal work has already been identified by the literature (Nelson, 1999). Consequently, it cannot be argued that it is only the uneducated that have to resort to ICBT.
5.4. The impact of participation in informal cross-border trade on household revenues
As I have assessed the determinants of participation in ICBT, I now want to analyze the partial impact of ICBT on revenues while accounting for the above identified variables which are potential confounders of the impact as they are correleated with participation itself. I estimate three models. The first one considers revenues from the first job. The second one is for revenues from the second job. And the last one is for total household revenues. Upshot are performed in Table 4.
Model 1
In model 1, ICBT participation is associated with household income from the main employment. The regression result indicates that participation in ICBT positively and significantly affects household income while controlling for other factors. ICBT participation boosts primary income by 174%. In the border of Entikong, many people sell their agricultural commodities and buy manufactured products informally from the neighboring countries. In this case, ICBT plays a role as a job creator (a job provider) and as an income generator for low income households in the border areas. Furthermore, ICBT contributes to the eradication of poverty through the provision of employment and income (Ogutu and Echessah, 1998).
Other factors that significantly influence household income are gender, whether the respondent is the household head and the respondents marital status. This result suggests that women generate roughl 100% more income from the first job than men. This finding is contrary to the study of Nguyen et al. (2014) who highlighted that women have a lower revenue compared to men in informal employment. The potential reason is the percentage of women traders who have a side business (46.67%) is less than that of men traders with a side business (53.33%). The absence of second jobs gives more time and minimizes capital distribution to the second jobs. This is an opportunity for
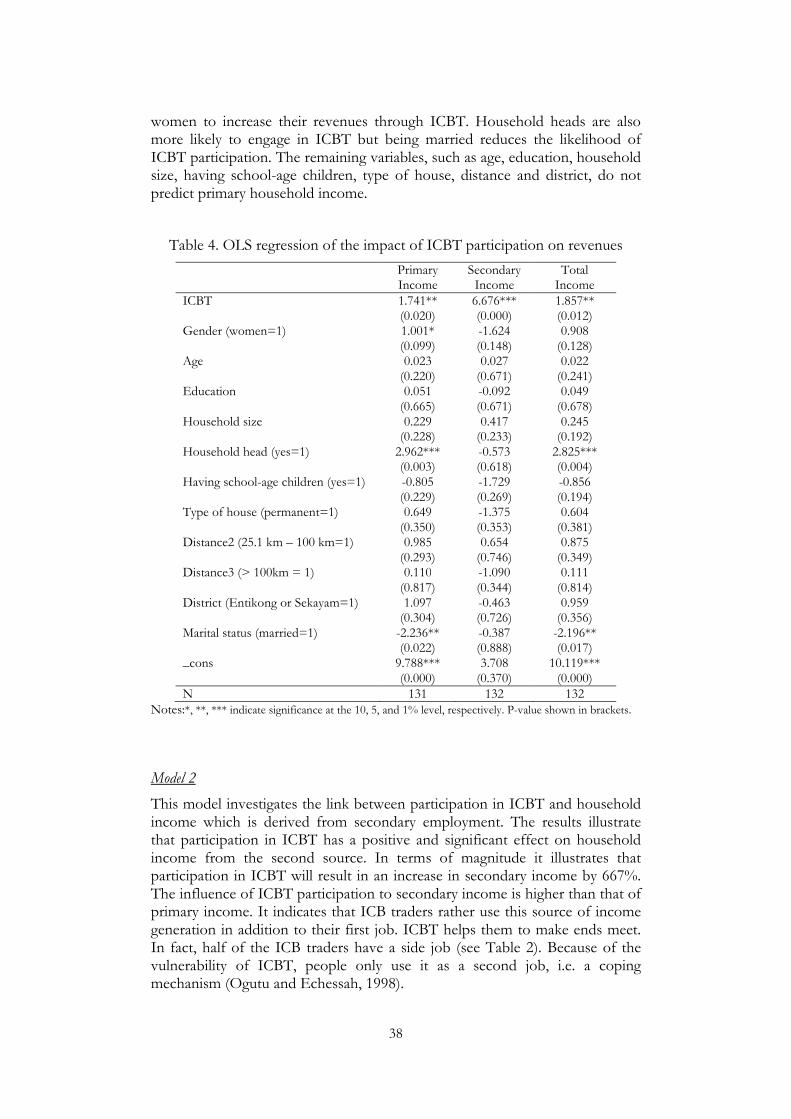
38
women to increase their revenues through ICBT. Household heads are also more likely to engage in ICBT but being married reduces the likelihood of ICBT participation. The remaining variables, such as age, education, household size, having school-age children, type of house, distance and district, do not predict primary household income.
Table 4. OLS regression of the impact of ICBT participation on revenues
Primary Income
Secondary Income
Total Income
ICBT 1.741** 6.676*** 1.857**
(0.020) (0.000) (0.012)
Gender (women=1) 1.001* -1.624 0.908
(0.099) (0.148) (0.128)
Age 0.023 0.027 0.022
(0.220) (0.671) (0.241)
Education 0.051 -0.092 0.049
(0.665) (0.671) (0.678)
Household size 0.229 0.417 0.245
(0.228) (0.233) (0.192)
Household head (yes=1) 2.962*** -0.573 2.825***
(0.003) (0.618) (0.004)
Having school-age children (yes=1) -0.805 -1.729 -0.856
(0.229) (0.269) (0.194)
Type of house (permanent=1) 0.649 -1.375 0.604
(0.350) (0.353) (0.381)
Distance2 (25.1 km – 100 km=1) 0.985 0.654 0.875
(0.293) (0.746) (0.349)
Distance3 (> 100km = 1) 0.110 -1.090 0.111
(0.817) (0.344) (0.814)
District (Entikong or Sekayam=1) 1.097 -0.463 0.959
(0.304) (0.726) (0.356)
Marital status (married=1) -2.236** -0.387 -2.196**
(0.022) (0.888) (0.017)
_cons 9.788*** 3.708 10.119***
(0.000) (0.370) (0.000)
N 131 132 132 Notes:*, **, *** indicate significance at the 10, 5, and 1% level, respectively. P-value shown in brackets.
Model 2
This model investigates the link between participation in ICBT and household income which is derived from secondary employment. The results illustrate that participation in ICBT has a positive and significant effect on household income from the second source. In terms of magnitude it illustrates that participation in ICBT will result in an increase in secondary income by 667%. The influence of ICBT participation to secondary income is higher than that of primary income. It indicates that ICB traders rather use this source of income generation in addition to their first job. ICBT helps them to make ends meet. In fact, half of the ICB traders have a side job (see Table 2). Because of the vulnerability of ICBT, people only use it as a second job, i.e. a coping mechanism (Ogutu and Echessah, 1998).
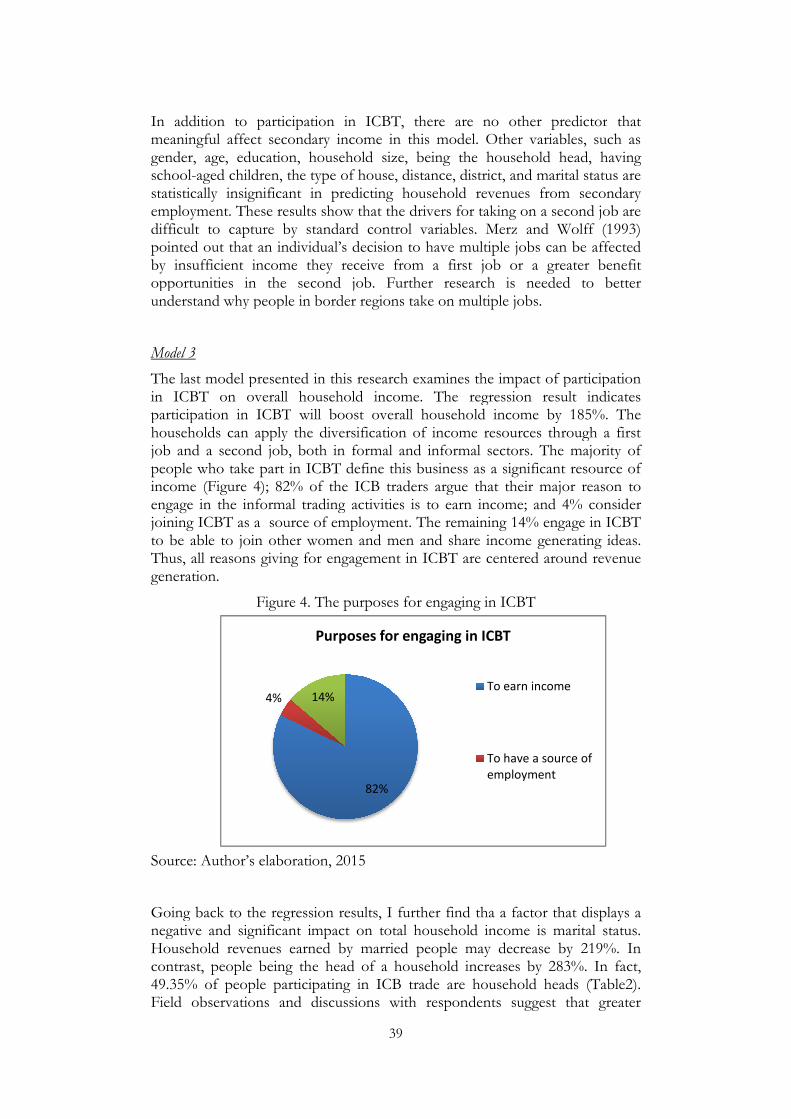
4%
In addition to particmeaningful affect secogender, age, educatioschool-aged children, statistically insignificaemployment. These redifficult to capture bpointed out that an inby insufficient incomopportunities in the understand why people
Model 3
The last model presenin ICBT on overall participation in ICBThouseholds can apply job and a second jobpeople who take part income (Figure 4); 82engage in the informajoining ICBT as a souto be able to join othThus, all reasons givingeneration.
Figur
Source: Author’s elabo
Going back to the regnegative and significanHousehold revenues contrast, people being49.35% of people parField observations an
39
82%
14%
Purposes for engaging in ICBT
To earn income
To have a source
employment
rticipation in ICBT, there are no other predecondary income in this model. Other variabletion, household size, being the household hean, the type of house, distance, district, and maritaicant in predicting household revenues from results show that the drivers for taking on a seco by standard control variables. Merz and Wo individual’s decision to have multiple jobs can bome they receive from a first job or a greathe second job. Further research is needed ple in border regions take on multiple jobs.
ented in this research examines the impact of paall household income. The regression resultBT will boost overall household income by 1ply the diversification of income resources throuob, both in formal and informal sectors. The m
in ICBT define this business as a significant r82% of the ICB traders argue that their majormal trading activities is to earn income; and 4%ource of employment. The remaining 14% engagther women and men and share income genera
ving for engagement in ICBT are centered aroun
ure 4. The purposes for engaging in ICBT
boration, 2015
regression results, I further find tha a factor thaticant impact on total household income is mars earned by married people may decrease by ing the head of a household increases by 283%participating in ICB trade are household head and discussions with respondents suggest th
rce of
redictor that bles, such as head, having ital status are m secondary econd job are Wolff (1993) n be affected eater benefit ed to better
participation ult indicates 185%. The rough a first e majority of
resource of jor reason to 4% consider gage in ICBT erating ideas. ound revenue
hat displays a arital status.
by 219%. In 83%. In fact, ads (Table2). that greater
40
responsibility as the heads of families forces them to expand their resources of household revenue through multiple jobs. In fact, 53% of the people engaged in ICBT consider their position as head of the family as the main reason (Figure 5). By implementing this strategy, total household revenues are better secured as suggested by the regression results. Other variables, i.e.: gender, age, education, household size, having school-age children, type of house, distance and district, do not predict total household revenues.
Figure 5. The reasons in the decision to engage in ICBT
Source: Author’s elaboration, 2015
5.5. Goods traded through informal cross-border trade
For the 77 people in the sample who engage in ICBT, I have a detailed account of the types of products exported to Malaysia and those imported from there. Figure 6 presents the types of goods exported. As ruled in the BTA 1970, most of them are agricultural products and and some other commodities, except for minerals, oils and ores. Although pepper is the main agricultural commodity in Entikong, but it is not a major exported product due to extreme price fluctuations and own consumption. The main agricultural productexported to Malaysia is sour eggplant (24%). Pepper is the second most exported product (19%). The other exported goods are rubber (14%), peanuts (7%), beans (7%), corn (7%), and some others. Lesser and Moise-Leeman (2009:5) also underlined that the traded goods in ICBTare “staple food commodities” and “low quality consumer goods”.
The exported agricultural products are mostly sourced from other villages within the district (43%), while the agricultural sector in Entikong only contributes with 35% to the total exports. It indicates that the agricultural sector in Entikong is not very well developed. Limited water supply in Entikong is the main handicap for the agricultural sector to develop. The area is surrounded by mountains and farmers rely on rain as a source of water for irrigations. The rough terrain makes it difficult for its residents to depend upon the agricultural sector as the main source of income.
53%
14%
5%
26%
2%
Reason to engage in ICBTI am the head of the
household
I provide the capital needed
for this business
I have the information needed
to run the business
I was trained in
entrepreneurial skills that
enable me to run this business
Others
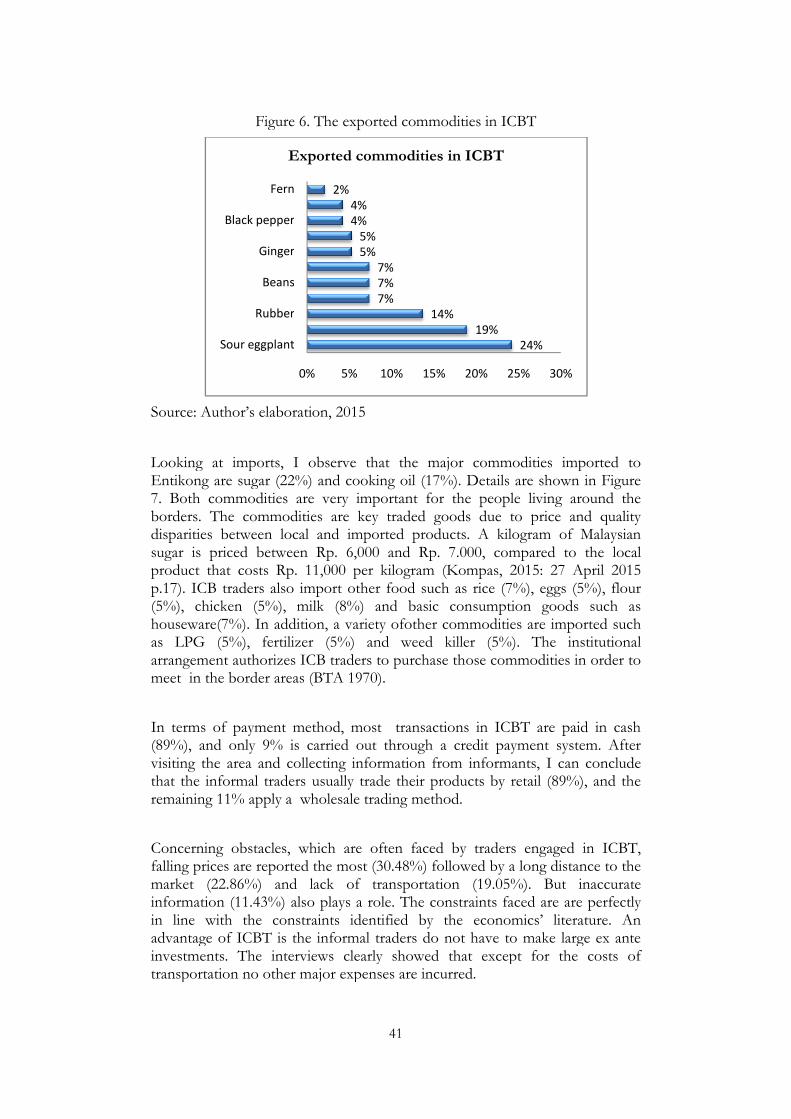
Figure
Source: Author’s elabo
Looking at imports, Entikong are sugar (227. Both commodities borders. The commodisparities between losugar is priced betweproduct that costs Rpp.17). ICB traders also(5%), chicken (5%), houseware(7%). In addas LPG (5%), fertilarrangement authorizemeet in the border are
In terms of payment (89%), and only 9% visiting the area and that the informal traderemaining 11% apply a
Concerning obstaclesfalling prices are repormarket (22.86%) aninformation (11.43%) in line with the conadvantage of ICBT is investments. The intetransportation no othe
Sour eggplant
Rubber
Beans
Ginger
Black pepper
Fern
41
ure 6. The exported commodities in ICBT
boration, 2015
ts, I observe that the major commodities im (22%) and cooking oil (17%). Details are shownies are very important for the people living amodities are key traded goods due to price a local and imported products. A kilogram of tween Rp. 6,000 and Rp. 7.000, compared toRp. 11,000 per kilogram (Kompas, 2015: 27 A
also import other food such as rice (7%), eggs (), milk (8%) and basic consumption goods
addition, a variety ofother commodities are imprtilizer (5%) and weed killer (5%). The inizes ICB traders to purchase those commodities areas (BTA 1970).
nt method, most transactions in ICBT are pa% is carried out through a credit payment systd collecting information from informants, I canaders usually trade their products by retail (89%ly a wholesale trading method.
les, which are often faced by traders engaged orted the most (30.48%) followed by a long distaand lack of transportation (19.05%). But ) also plays a role. The constraints faced are ar
constraints identified by the economics’ liter is the informal traders do not have to make larinterviews clearly showed that except for thether major expenses are incurred.
24%
19%
14%
7%
7%
7%
5%
5%
4%
4%
2%
0% 5% 10% 15% 20% 25% 30%
lant
ber
ans
nger
per
Fern
Exported commodities in ICBT
imported to wn in Figure around the and quality of Malaysian to the local 7 April 2015
(5%), flour ods such as
ported such institutional
es in order to
paid in cash system. After can conclude 9%), and the
ed in ICBT, istance to the t inaccurate are perfectly iterature. An large ex ante the costs of
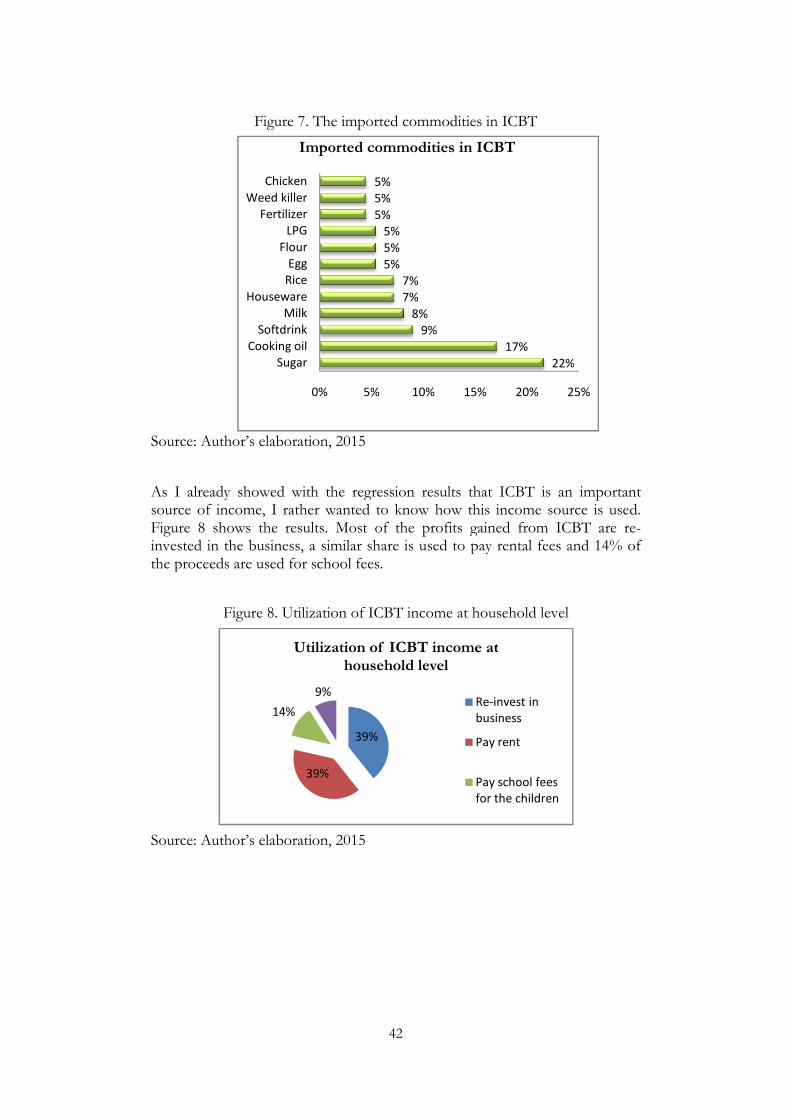
Sug
Cooking
Softdri
M
Housewa
Ri
Flo
Fertiliz
Weed kil
Chick
Figure
Source: Author’s elabo
As I already showed source of income, I raFigure 8 shows the rinvested in the businethe proceeds are used f
Figure 8. U
Source: Author’s elabo
14%
42
22%
17%
9%
8%
7%
7%
5%
5%
5%
5%
5%
5%
0% 5% 10% 15% 20% 25
Sugar
ing oil
ftdrink
Milk
eware
Rice
Egg
Flour
LPG
rtilizer
d killer
hicken
Imported commodities in ICBT
ure 7. The imported commodities in ICBT
boration, 2015
ed with the regression results that ICBT is an I rather wanted to know how this income source results. Most of the profits gained from ICBiness, a similar share is used to pay rental fees aned for school fees.
. Utilization of ICBT income at household level
boration, 2015
39%
39%
14%
9%
Utilization of ICBT income at household level
Re-invest in
business
Pay rent
Pay school fees
for the children
2%
25%
an important urce is used.
ICBT are re-s and 14% of
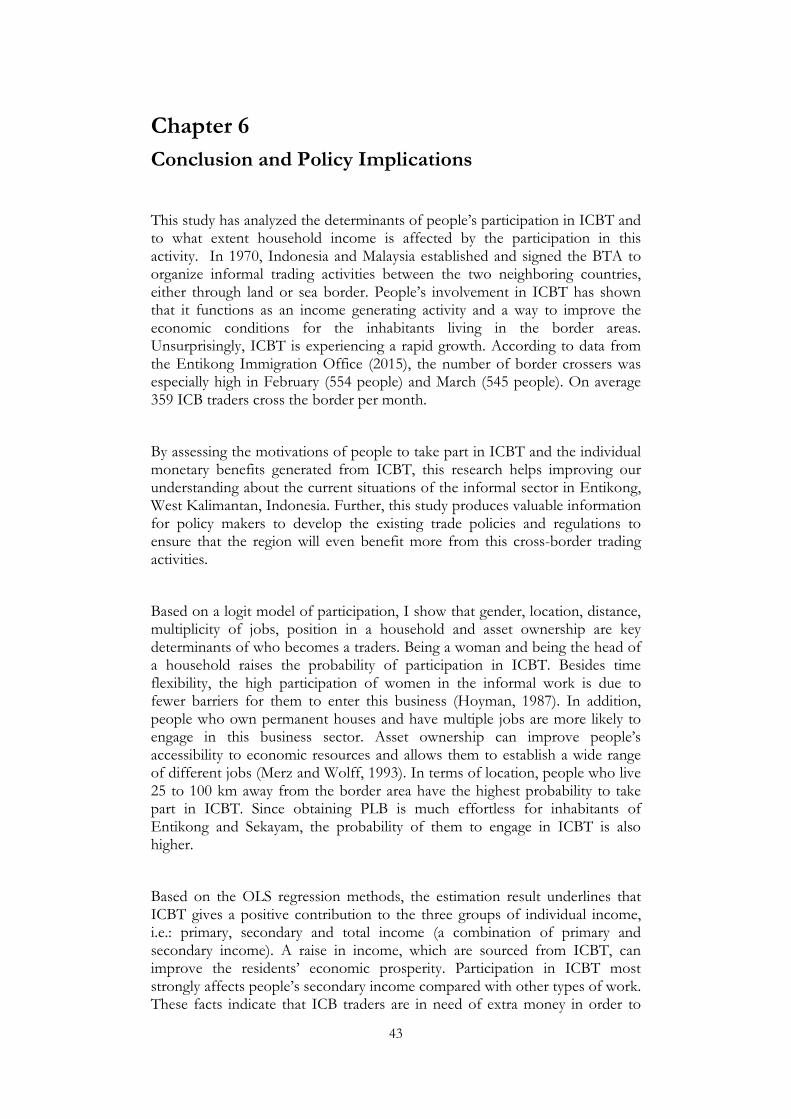
43
Chapter 6
Conclusion and Policy Implications
This study has analyzed the determinants of people’s participation in ICBT and to what extent household income is affected by the participation in this activity. In 1970, Indonesia and Malaysia established and signed the BTA to organize informal trading activities between the two neighboring countries, either through land or sea border. People’s involvement in ICBT has shown that it functions as an income generating activity and a way to improve the economic conditions for the inhabitants living in the border areas. Unsurprisingly, ICBT is experiencing a rapid growth. According to data from the Entikong Immigration Office (2015), the number of border crossers was especially high in February (554 people) and March (545 people). On average 359 ICB traders cross the border per month.
By assessing the motivations of people to take part in ICBT and the individual monetary benefits generated from ICBT, this research helps improving our understanding about the current situations of the informal sector in Entikong, West Kalimantan, Indonesia. Further, this study produces valuable information for policy makers to develop the existing trade policies and regulations to ensure that the region will even benefit more from this cross-border trading activities.
Based on a logit model of participation, I show that gender, location, distance, multiplicity of jobs, position in a household and asset ownership are key determinants of who becomes a traders. Being a woman and being the head of a household raises the probability of participation in ICBT. Besides time flexibility, the high participation of women in the informal work is due to fewer barriers for them to enter this business (Hoyman, 1987). In addition, people who own permanent houses and have multiple jobs are more likely to engage in this business sector. Asset ownership can improve people’s accessibility to economic resources and allows them to establish a wide range of different jobs (Merz and Wolff, 1993). In terms of location, people who live 25 to 100 km away from the border area have the highest probability to take part in ICBT. Since obtaining PLB is much effortless for inhabitants of Entikong and Sekayam, the probability of them to engage in ICBT is also higher.
Based on the OLS regression methods, the estimation result underlines that ICBT gives a positive contribution to the three groups of individual income, i.e.: primary, secondary and total income (a combination of primary and secondary income). A raise in income, which are sourced from ICBT, can improve the residents’ economic prosperity. Participation in ICBT most strongly affects people’s secondary income compared with other types of work. These facts indicate that ICB traders are in need of extra money in order to
44
make ends meet. Moreover, the demographic characteristics of the ICB traders show that half of them have a side job. Due to the vulnerability of ICBT, people try to have a second job (Ogutu and Echessah, 1998). In addition, many people in the border area rely on ICBT to sell their agricultural commodities and buy manufactured products from neighboring countries.
The above study gives important insights in micro-level dynamics surrounding ICBT. Before drawing policy conclusions, I want to voice some words of caution. First, I had to rely on snowball sampling and thus my sample is not population representative. Second, my sample only consists of 147 respondents and is hence rather small for rigorous analysis. Third, I aimed at assessing the determinants and impacts of ICBT by comparing traders and non-traders. But I cannot fully rule out endogeneity as I can only control for observable characteristics. Nevertheless, I consider the study at hand an important contribution to the understanding of ICBT in Indonesia as it is to the best of my knowledge the first study that aims at quantifying the impact of ICBT.
According to the above analysis, ICBT is an important economic activity by people living in the remote border areas of Entikong. ICBT is often used as second income source suggesting that it functions as a coping mechanism. In light of ongoing debates about legalizing informal work, the analysis outcomes suggest that ICBT should be kept in place as it helps the local people to face the economic vulnerabilities in the border areas, particularly in Entikong. The geographical distance of Entikong to the capital of Sanggau district and that of West Kalimantan Province (Pontianak) has made this area out of reach from the government’s attention. Many infrastructure development plans, which are intended to support the economic growth of Entikong, have never been realized up to the present. When talking about these plans, people refer to ‘Angels who have not come to Entikong yet’. This sarcastic expression is often cited by the local communities as a sign of their disappointment about the lack of support from the government.
Therefore, many people have to rely on ICBT for employment. ICBT is an important source of income for households in the border areas. The absence of ICBT will likely make their economic welfare decline. As a consequence, the government would need to provide a costly social security program to deal with this situation. Otherwise, Entikong residents might migrate to the already populous centers, which are also costly for the government, as it will create social tensions. It is obvious that the government will be indirectly harmed if it abolishes ICBT. The local populations heavily depend on ICBT as has been shown through this study. Thus, it is questionable whether the government would really benefit from formalizing this small-scale cross-border trade. The tax gains are likely to be small.
45
References
Ackello-Ogutu, C., & Echessah, P. N. (1998) ‘Unrecorded Cross-Border Trade
between Tanzania and Her Neighbors’. Implications for Food Security SD Publication Series Office of Sustainable Development Bureau for Africa, 89.
Afrika, J. G., & Ajumbo, G. (2012) ‘Informal Cross-Border Trade in Africa:
Implications and Policy Recommendations’. Africa Economic Brief, 3(10). Aikaeli, J., & Mkenda, B. K. (2015) ‘Determinants of Informal Employment: A Case
of Tanzania’s Construction Industry’. Botswana Journal of Economics, 12(2), 51-73. Ama, N. O., Mangadi, K. T., Okurut, F. N., & Ama, H. A. (2013) ‘Profitability of The
Informal Cross-Border Trade: A Case Study of Four Selected Borders of Botswana’. African Journal of Business Management, 7(40), 4221.
Awang, A. H., Sulehan, J., Bakar, N. R. A., Abdullah, M. Y., & Liu, O. P. (2013)
‘Informal Cross-Border Trade Sarawak (Malaysia)-Kalimantan (Indonesia): A Catalyst for Border Community’s Development’. Asian Social Science, 9(4), p167.
Barberia, L. G., Johnson, S., & Kaufmann, D. (1997) ‘Social Networks in
Transition’. William Davidson Institute Working PaperNo. 102 Barlow, R. (1994) ‘Population Growth and Economic Growth: Some More
Correlations’. Population and Development Review, 153-165. Bernabè, S. (2002) ‘Informal Employment in Countries in Transition: A Conceptual
Framework’. LSE STICERD Research Paper No. CASE056. Campbell, R. R., Spencer, J. C., & Amonker, R. G. (1993) ‘The Reported and
Unreported Missouri Ozarks: Adaptive Strategies of The People Left Behind’. Forgotten places: Uneven Development in Rural America, 30-52.
Carneiro, F. G., & Henley, A. (2001) ‘Modelling Formal vs. Informal Employment
and Earnings: Micro-econometric Evidence for Brazil’. U of Wales at Aberystwyth Management & Business Working Paper, (2001-15).
Clarke, S. (1998) ‘Making Ends Meet in a Non-Monetary Market Economy’. Centre for
Comparative Labor Studies, Université de Warwick, 14, 1998-2000. Commission of the European Communities, International Monetary Fund,
Organization for Economic Co-operation and Development, United Nations, & Inter-Secretariat Working Group on National Accounts(1993) ‘System of National Accounts 1993’. Brussels/Luxembourg: The Working Group.
De Soto, H. (1990) The Other Path: The Invisible Revolution in The Third World.Harper &
Row/Perennial Library, 1990 Diego, F., Kimie, T., & Diego, A. U. (2012) ‘Micro-Determinants of Informal
Employment in The Middle East and North Africa Region’. Social Protection Discussion Papers.
46
Feige, E. L. (1990) ‘Defining and Estimating Underground and Informal Economies: The New Institutional Economics Approach’. World Development, 18(7), 989-1002.
Firebaugh, G., & Beck, F. D. (1994) ‘Does Economic Growth Benefit the Masses?
Growth, Dependence, and Welfare in The Third World’. American Sociological Review, 631-653.
Floridi, A. (2014) ‘Borderland Economy in Egypt and Occupied Palestinian Territories
Toward a New Approach’, MA Research Paper. The Hague: International Institute of Social Studies.
Guerguil, M. (1988) ‘Some Thoughts on the Definition of the Informal Sector’. Cepal
Review No.35. Hart, K. (1973)‘Informal Income Opportunities and Urban Employment in Ghana’.
The Journal of Modern African Studies, 11(01), 61-89. Hay, Iain. (2010) Qualitative Research Methods in Human Geography. Canada: Oxford
University Press, 3rd Edition. Hoyman, M. (1987) ‘Female Participation in the Informal Economy: A Neglected
Issue’. The Annals of the American Academy of Political and Social Science, 493(1), 64-8 Jensen, L., Cornwell, G. T., & Findeis, J. L. (1995)‘Informal Work in
Nonmetropolitan Pennsylvania1’. Rural Sociology, 60(1), 91-107. Kompas(2005) ‘Gula Ilegal Bisa Lewat Entikong-Tebedu (The Illegal Sugar Can Pass
Entikong–Tebedu)’, Kompas Magazine, 27 April, p.17. Kurniadi, D. (2009) ‘Strategi Pengembangan Wilayah Perbatasan Antarnegara:
Memacu Pertumbuhan Ekonomi Entikong Kabupaten Sanggau Provinsi Kalimantan Barat (The Area Development Strategy of Countries: Stimulating Economic Growth in Entikong, Sanggau, West Kalimantan)’. Jurnal Pembangunan Wilayah dan Kota, 5(3), 285-285.
Leonard, M. (2000) ‘Coping Strategies in Developed and Developing Societies: The
Workings of the Informal Economy’. Journal of International Development, 12(8), 1069-1085.
Lesser, C., & Moisé-Leeman, E. (2009) ‘Informal Cross-Border Trade and Trade
Facilitation Reform in Sub-Saharan Africa’.OECD Trade Policy Papers, No.86, OECD Publishing.
Losby, J. L., Else, J. F., Kingslow, M. E., Edgcomb, E. L., Malm, E. T., & Kao, V.
(2002) ‘Informal Economy Literature Review’. ISED Consulting and Research. McInnis-Dittrich, K. (1995) ‘Women of The Shadows: Appalachian Women's
Participation in The Informal Economy’. Affilia, 10(4), 398-412. Merz, J., & Wolff, K. G. (1993) ‘The Shadow Economy: Illicit Work and Household
Production: A Microanalysis of West Germany’. Review of Income and Wealth, 39(2), 177-194.
47
Minde, I. J., & Nakhumwa, T. O. (1998) Unrecorded Cross-Border Trade Between Malawi and Neighboring Countries. Malawi: Office of Sustainable Development, Bureau for Africa, US Agency for International Development.
Mukhtar, Z. (2014). ‘Aspek Hukum Transaksi Perdagangan Lintas Batas Pada Daerah
Perbatasan (Legal Aspects of Cross Border-Trade Transactions in Border Region)’, Doctoral dissertation. Makassar: Universitas Hasanuddin.
Naschold, F. (2009) ‘Microeconomic Determinants of Income Inequality in Rural
Pakistan’. Journal of Development Studies, 45(5), 746-768. Nelson, M. K. (1999) ‘Economic Restructuring, Gender, and Informal Work: A Case
Study of a Rural County1’. Rural Sociology, 64(1), 18-43. Nguyen, D. L., Nguyen, B. G., Tran, T. H., Vo, T. M. L., & Nguyen, D. N. (2014)
‘Employment, Earnings and Social Protection for Female Workers in Vietnam’s Informal Sector’. EADN Working Paper No.84.
Ogalo, V. (2010) ‘Informal Cross-Border Trade in EAC: Implications for Regional
Integration and Development’. CUTS African Resource Centre, Nairobi. O’ leary, Zina (2014) The Essential Guide to: Doing Your Research Project. London: Sage
Publications Ltd, 2nd Edition. Pisani, M. J., & Richardson, C. (2012) ‘Cross-Border Informal Entrepreneurs Across
The South Texas–Northern Mexico Boundary’. Entrepreneurship & Regional Development, 24(3-4), 105-121.
Portes, A., & Schauffler, R. (1993) ‘Competing Perspectives on the Latin American
Informal Sector’. Population and Development Review 33-60. Prasojo, Z. H. (2013) ‘Dinamika Masyarakat Lokal di Perbatasan (The Dynamics of
Local Communities at the Border)’.Walisongo, 21(2), 417-436. Raharjo, S. N. I. (2013) ‘Kebijakan Pengelolaan Kawasan Perbatasan Darat Indonesia-
Malaysia--Studi Evaluatifdi Kecamatan Entikong (Indonesia’s Policy on The Land Border Area Management with Malaysia--An Evaluative Study in the Entikong District)’. Widyariset, 16(1), 71-80.
Rakowski, C. A. (1994) ‘Convergence and Divergence in the Informal Sector Debate:
A Focus on Latin America, 1984–92’. World Development, 22(4), 501-516. Sassen, S. (1997) Informalization in Advanced Market Economies. New York: International
Labor Office, Development Policies Department. Siburian, R. (2002) ‘Entikong: Daerah Tanpa Krisis Ekonomi di Perbatasan
Kalimantan Barat-Sarawak (Entikong: The Region Without Economic Crisis in the Borderland of West Kalimantan-Sarawak)’. Antropologi Indonesia, 67, 87-93.
Skoufias, E. (2003) ‘Economic Crises and Natural Disasters: Coping Strategies and
Policy Implications’. World Development, 31(7), 1087-1102. Souza, P. R., & Tokman, V. E. (1976) ‘Informal Urban Sector in Latin
America’.The. Int'l Lab. Rev., 114, 355.
48
Suhendra (2010) ‘Negosiasi Perjanjian Perdagangan Perbatasan RI-Malaysia Molor(The Border Trade Agreement Negotiations between Indonesia and Malaysia Delayed)’.Accessed 13 August 2015<http://finance.detik.com/read/2010/01/05/150142/1272062/4/negosiasi-perjanjian-perdagangan-perbatasan-ri-malaysia-molor>.
The Central Bureau of Statistics (2014) Statistik Daerah Kecamatan Entikong 2014 (The
Regional Statistics of Entikong 2014). Katalog BPS: 1101001.6105.220. Sanggau, the Central Bureau of Statistics in Sanggau District.
The Entikong Immigration Office (2015) ‘Data Pelintas Warga Negara Republik
Indonesia yang Melalui Tempat Pemeriksaan Imigrasi Entikong (The Data of Indonesian Citizens who Cross the Border Area Through the Entikong Immigration Checkpoint)’. Entikong,the Entikong Immigration Office.
The Entikong Customs and Excise Office (2015) ‘Data Jumlah Penerbitan dan
Penggunaan Kartu Identitas Lintas Batas/KILB (The Number of Published and Used the Cross-Border Identity Card/KILB)’. Entikong, the Entikong Customs and Excise Office.
The National Board of Border Management Republic of Indonesia (2014) Profil Pos
Lintas Batas Negara: Entikong(The Profile of Post Transboundary Country: Entikong). Seri Profil Pos Lintas Batas Negara No.001.001. Jakarta, the National Board of Border Management of Republic Indonesia.
Thomas, J. J. (1995) Surviving in The City: The Urban Informal Sector in Latin America.
London: Pluto Press. Transparency International(2014) ‘Corruption Perceptions Index 2014’. Germany:
Transparency International (brochure). Uganda Bureau of Statistics(2008) The Informal Cross-Border Trade: Qualitative Baseline
Study 2008. Uganda: UBOS, 2009. Wulandari, R. (2012) ‘Kajian Mengenai Basic Arrangement on Border Crossing 1967
antara Indonesia-Malaysia Berkaitan dengan Praktek Perdagangan Gula Illegal di Entikong Kalimantan Barat (The Study of Basic Arrangement on Border Crossing between Indonesia-Malaysia 1967 Related to the Illegal Practices of Sugar Trading in Entikong, West Kalimantan)’. Jurnal Varia Bina Civika, (75).
Yakubovich, V. (1999) ‘Economic Constraints and Social Opportunities: Participation
in Informal Support Networks of Russian Urban Households’. Household Survival Strategies, Job Creation and New Forms of Employment in Russia.
Zuo, H. (2013) ‘The Earnings Differential between Formal and Informal Employees
in Urban China’. Contemporary Economics, 7(3), 115-124. https://www.google.com/maps. Accessed 13 August
2015.<https://www.google.com/maps/d/edit?mid=zyPt2KkkoIcg.kizueG-
e6XnU>
49
Regulations Ministry of Defense of the Republic of Indonesia, Comander-in-Chief of the Armed
Forces (1984) ‘Agreement on Border Crossing Between the Republic of Indonesia and Malaysia’.
Ministry of Foreign Affairs of the Republic of Indonesia, Minister of Foreign Affairs
(1973) ‘Basic Agreement on Economic and Technical Cooperation Between the Government of the Republic of Indonesia and the Government of Malaysia’.
Ministry of Home Affairs of the Republic of Indonesia, Minister of Home Affairs (2006) ‘Agreement Between the Government of the Republic Indonesia and the Government of Malaysia on Border Crossing’.
Ministry of Manpower and Transmigration of the Republic Indonesia, Governor of
West Kalimantan (2014) ‘West Kalimantan Governor Decree No.526/Nakertrans/2014. Penetapan Upah Minimum Kabupaten (UMK) dan Upah Minimum Sektoral Kabupaten (UMSK) Sanggau Tahun 2015(The Determination of Minimum Wages District (UMK) and Sectoral Minimum Wage District (UMSK) Sanggau 2015)’.
Ministry of Trade of the Republic Indonesia, Minister of Trade (1970) ‘Agreement on
Border Trade Between the Government of Republic Indonesia and the Government of Malaysia’.
Ministry of Trade of the Republic of Indonesia, Minister of Trade (1967) ‘Basic
Arrangements on Trade and Economic Relations Agreed by the Government of the Republic of Indonesia and the Government of Malaysia’.
Ministry of Trade of the Republic of Indonesia, Minister of Trade (1995) ‘Minister of
Trade Decree No.36/KP/III/95. Perdagangan Lintas Batas Entikong di Propinsi Kalimantan Barat(The Cross-Border Trade in West Kalimantan Province)’.
The Republic of Indonesia (1967) ‘Basic Arrangement on Border Crossing’.
Appendices
Appendix 1. Question
In
Kortenae
To whom it may concern
I am a master degree
majoring Economic De
tittle “Informal Cross-Bo
in West Kalimantan, I
because it has fundame
border area. This study a
cross-border trade and h
area. This information is
be used for research pur
Thanks for your assistan
50
tionnaire
International Institute of Social Studies
naerkade 12, 2518 AX, Den Haag, Netherland
Risti’ana Malik J
SB240
ern,
e student in International Institute of Social Studi
Development. Now, I am working on my Research
Border Trade: Impacts on Household’s Income -- A
, Indonesia”. I am interested in informal cross-bo
mental economic value which related to standard o
y aims to get deep understanding about the practice
d hopefully improve the situation of informal tradin
n is strictly confidential and not for publication. This
urposes only.
tance and cooperation.
ik Jani Jaleha
2408(BC8847)
udies (ISS) in
rch Paper on
A Case Study
border trade
d of living in
ce of informal
ding in border
his result is to
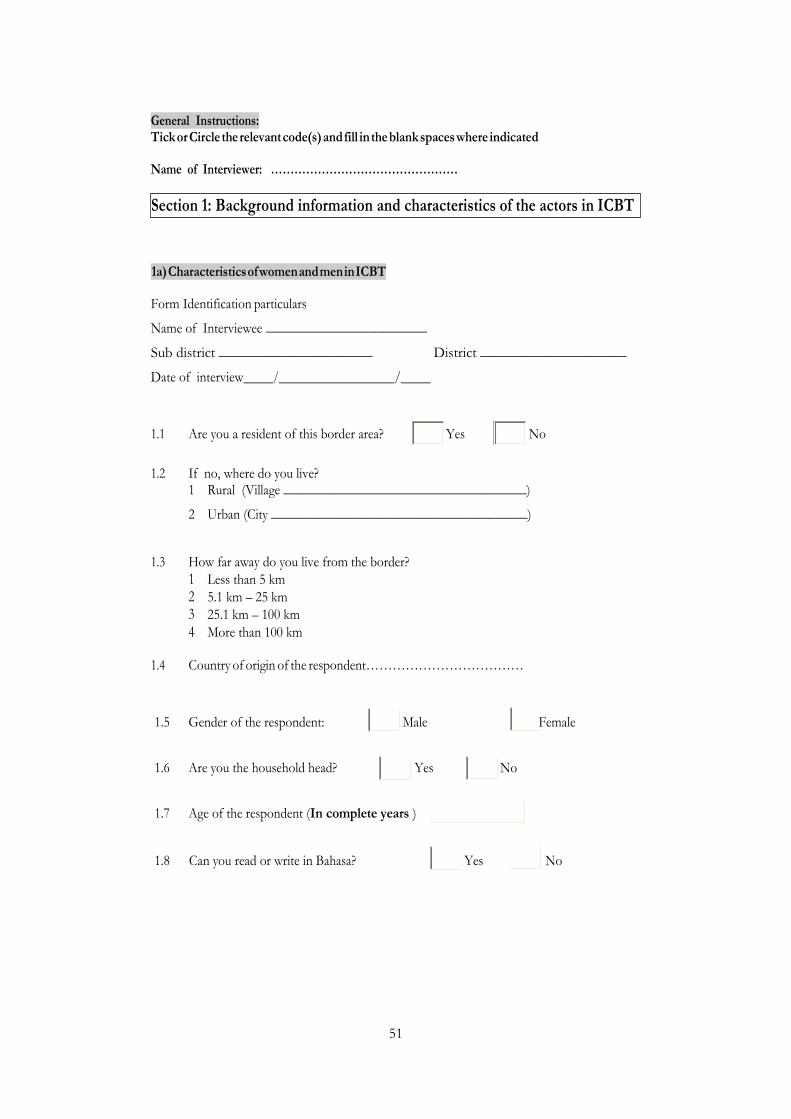
51
General Instructions: Tick or Circle the relevant code(s) and fill in the blank spaces where indicated
Name of Interviewer: …………………………………………
1a) Characteristics of women and men in ICBT
Form Identification particulars
Name of Interviewee ______________________
Sub district _____________________ District ____________________
Date of interview / /
1.1 Are you a resident of this border area? Yes No
1.2 If no, where do you live? 1 Rural (Village _____________________________________)
2 Urban (City _______________________________________)
1.3 How far away do you live from the border? 1 Less than 5 km 2 5.1 km – 25 km 3 25.1 km – 100 km
4 More than 100 km
1.4 Country of origin of the respondent………………………………
1.5 Gender of the respondent: Male
Female
1.6 Are you the household head? Yes
No
1.7 Age of the respondent (In complete years )
1.8 Can you read or write in Bahasa?
Yes
No
Section 1: Background information and characteristics of the actors in ICBT
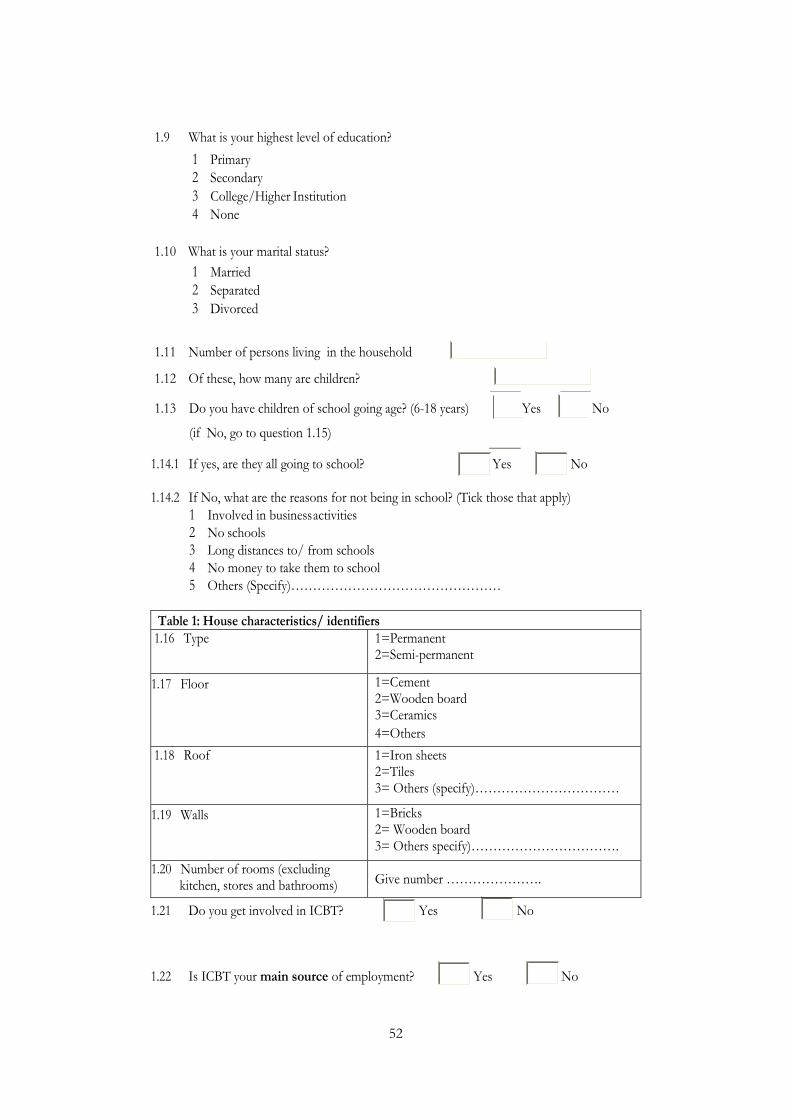
52
1.14.1 If yes, are they all going to school? Yes No 1.14.2 If No, what are the reasons for not being in school? (Tick those that apply)
1 Involved in business activities 2 No schools 3 Long distances to/ from schools 4 No money to take them to school
5 Others (Specify)…………………………………………
Table 1: House characteristics/ identifiers 1.16 Type 1=Permanent
2=Semi-permanent
1.17 Floor 1=Cement 2=Wooden board 3=Ceramics
4=Others
(specify)………………… 1.18 Roof 1=Iron sheets 2=Tiles 3= Others (specify)……………………………
1.19 Walls 1=Bricks 2= Wooden board 3= Others specify)…………………………….
1.20 Number of rooms (excluding kitchen, stores and bathrooms) Give number ………………….
1.21 Do you get involved in ICBT? Yes No
1.22 Is ICBT your main source of employment? Yes No
1.9
What is your highest level of education?
1 Primary
2 Secondary 3 College/Higher Institution
4 None
1.10 What is your marital status?
1 Married
2 Separated 3 Divorced
1.11 Number of persons living in the household
1.12 Of these, how many are children?
1.13 Do you have children of school going age? (6-18 years)
(if No, go to question 1.15)
Yes
No
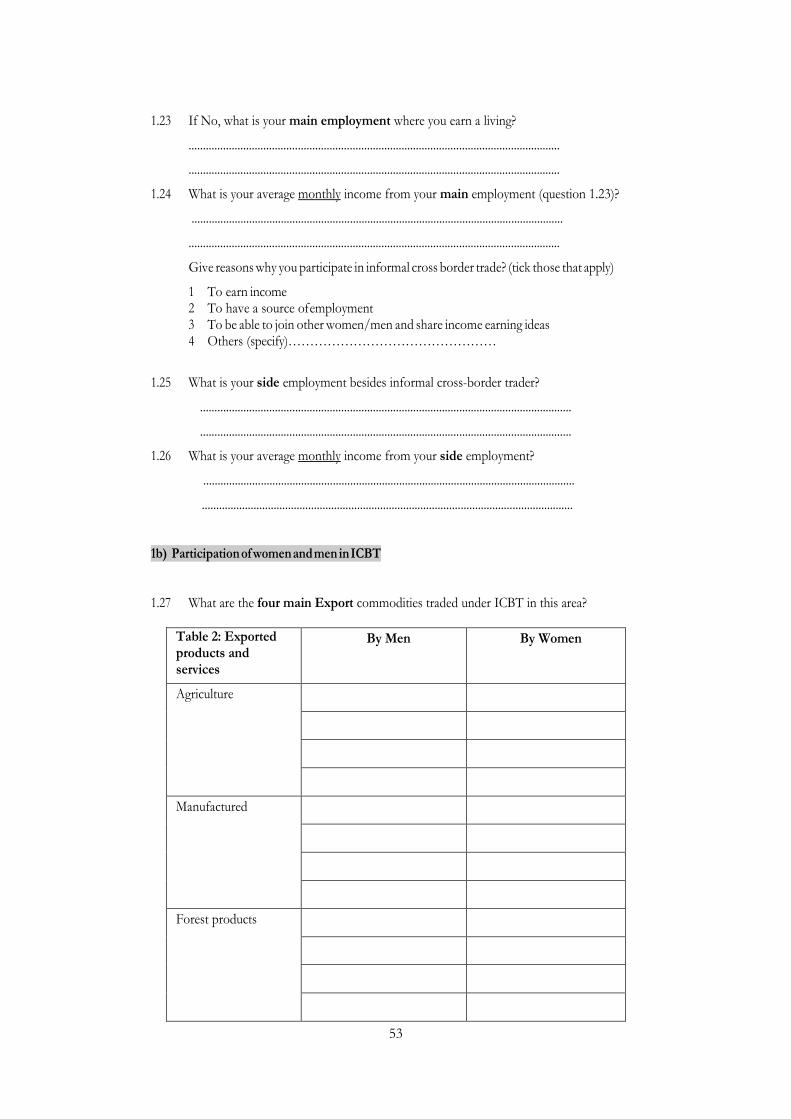
53
1.23 If No, what is your main employment where you earn a living?
.................................................................................................................................
.................................................................................................................................
1.24 What is your average monthly income from your main employment (question 1.23)?
.................................................................................................................................
.................................................................................................................................
Give reasons why you participate in informal cross border trade? (tick those that apply)
1 To earn income 2 To have a source of employment 3 To be able to join other women/men and share income earning ideas 4 Others (specify)…………………………………………
1.25 What is your side employment besides informal cross-border trader?
.................................................................................................................................
.................................................................................................................................
1.26 What is your average monthly income from your side employment?
.................................................................................................................................
.................................................................................................................................
1b) Participation of women and men in ICBT
1.27 What are the four main Export commodities traded under ICBT in this area?
Table 2: Exported products and services
By Men By Women
Agriculture
Manufactured
Forest products
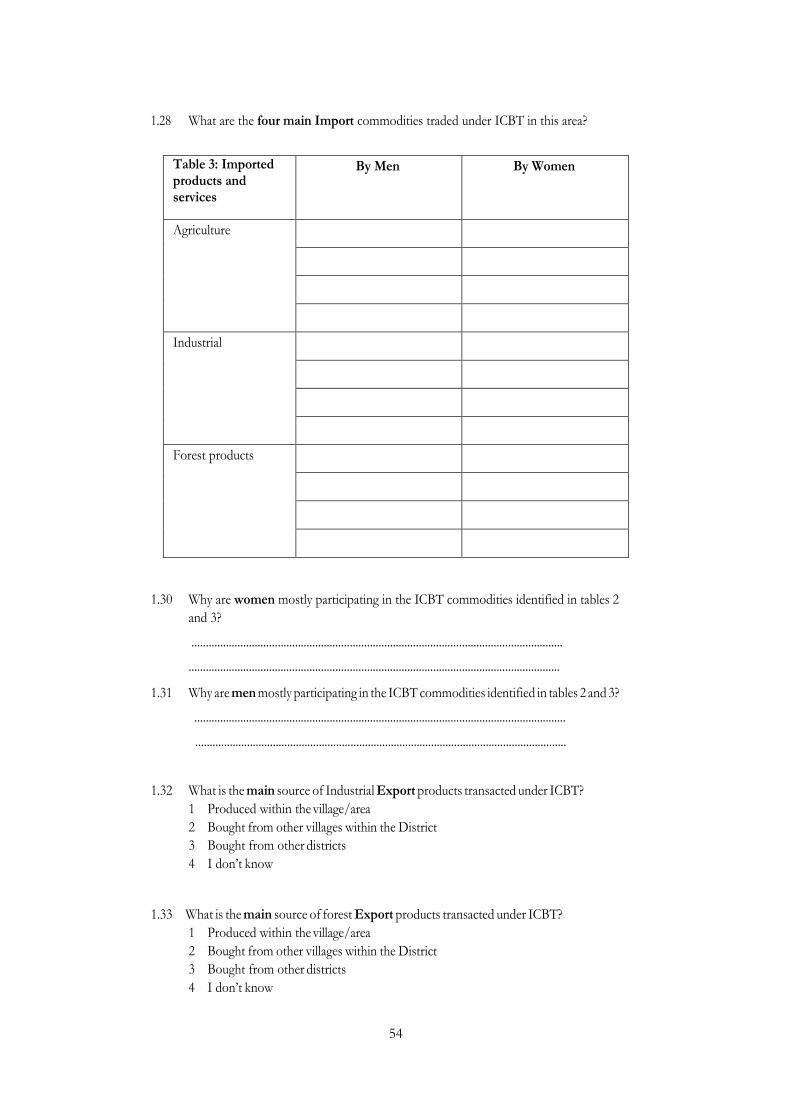
54
1.28 What are the four main Import commodities traded under ICBT in this area?
Table 3: Imported products and services
By Men By Women
Agriculture
Industrial
Forest products
1.30 Why are women mostly participating in the ICBT commodities identified in tables 2
and 3?
.................................................................................................................................
.................................................................................................................................
1.31 Why are men mostly participating in the ICBT commodities identified in tables 2 and 3?
.................................................................................................................................
.................................................................................................................................
1.32 What is the main source of Industrial Export products transacted under ICBT?
1 Produced within the village/area
2 Bought from other villages within the District
3 Bought from other districts
4 I don’t know
1.33 What is the main source of forest Export products transacted under ICBT?
1 Produced within the village/area
2 Bought from other villages within the District
3 Bought from other districts
4 I don’t know
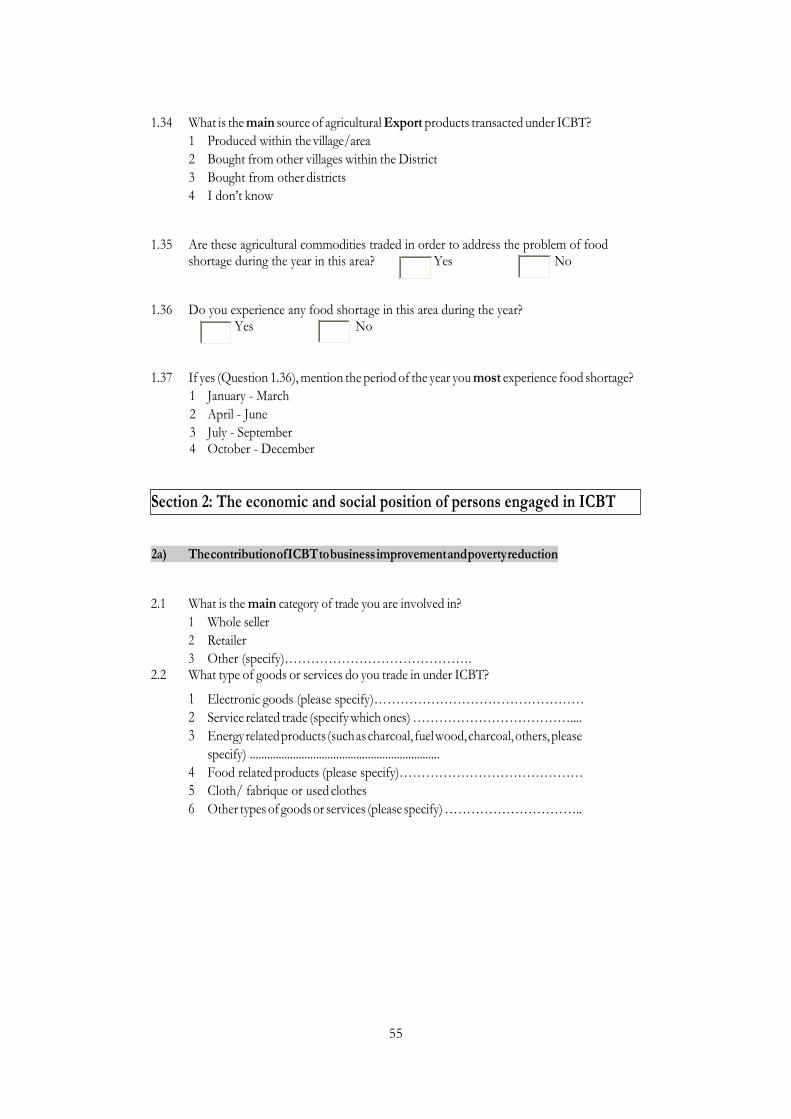
55
1.34 What is the main source of agricultural Export products transacted under ICBT?
1 Produced within the village/area
2 Bought from other villages within the District
3 Bought from other districts
4 I don’t know
1.35 Are these agricultural commodities traded in order to address the problem of food shortage during the year in this area? Yes No
1.36 Do you experience any food shortage in this area during the year? Yes No
1.37 If yes (Question 1.36), mention the period of the year you most experience food shortage?
1 January - March
2 April - June
3 July - September 4 October - December
2a) The contribution of ICBT to business improvement and poverty reduction
2.1 What is the main category of trade you are involved in?
1 Whole seller
2 Retailer
3 Other (specify)……………………………………. 2.2 What type of goods or services do you trade in under ICBT?
1 Electronic goods (please specify)…………………………………………
2 Service related trade (specify which ones) ………………………………....
3 Energy related products (such as charcoal, fuel wood, charcoal, others, please
specify) ..................................................................
4 Food related products (please specify)……………………………………
5 Cloth/ fabrique or used clothes
6 Other types of goods or services (please specify) …………………………..
Section 2: The economic and social position of persons engaged in ICBT
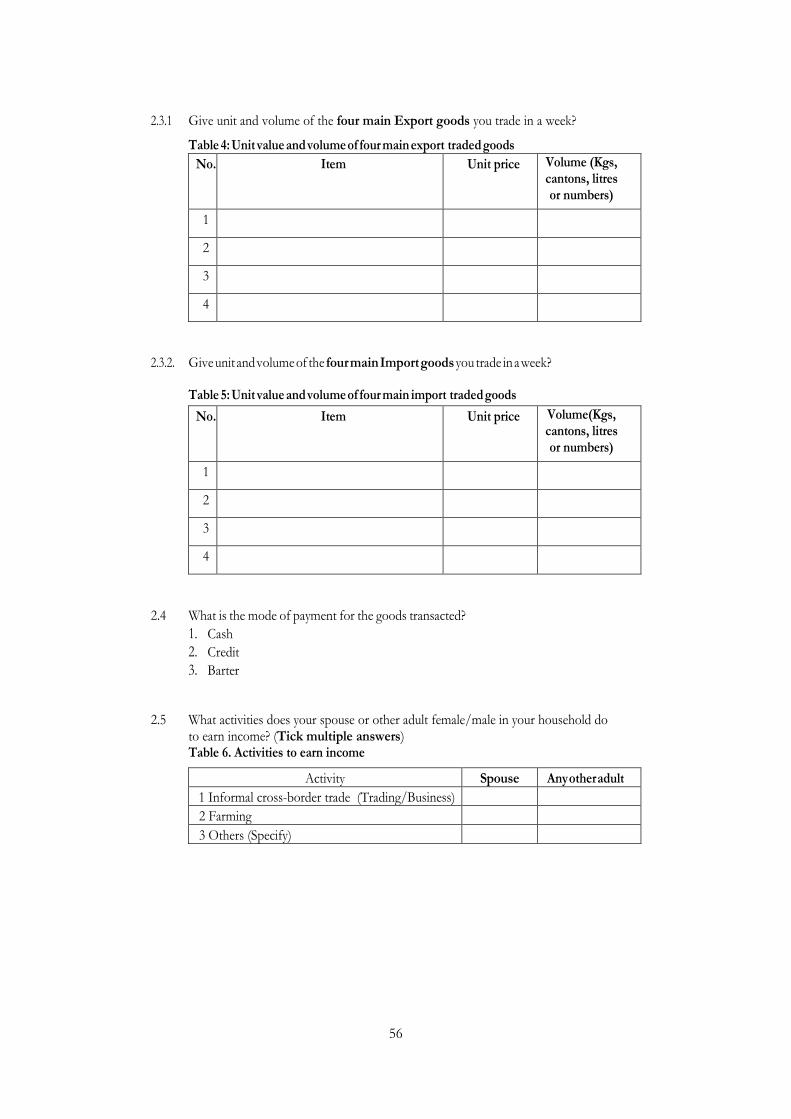
56
2.3.1 Give unit and volume of the four main Export goods you trade in a week?
Table 4: Unit value and volume of four main export traded goods
No. Item Unit price Volume (Kgs, cantons, litres or numbers)
1
2
3
4
2.3.2. Give unit and volume of the four main Import goods you trade in a week?
Table 5: Unit value and volume of four main import traded goods
No. Item Unit price Volume(Kgs, cantons, litres or numbers)
1
2
3
4
2.4 What is the mode of payment for the goods transacted?
1. Cash
2. Credit
3. Barter
2.5 What activities does your spouse or other adult female/male in your household do to earn income? (Tick multiple answers) Table 6. Activities to earn income
Activity Spouse Any other adult
1 Informal cross-border trade (Trading/Business)
2 Farming
3 Others (Specify)
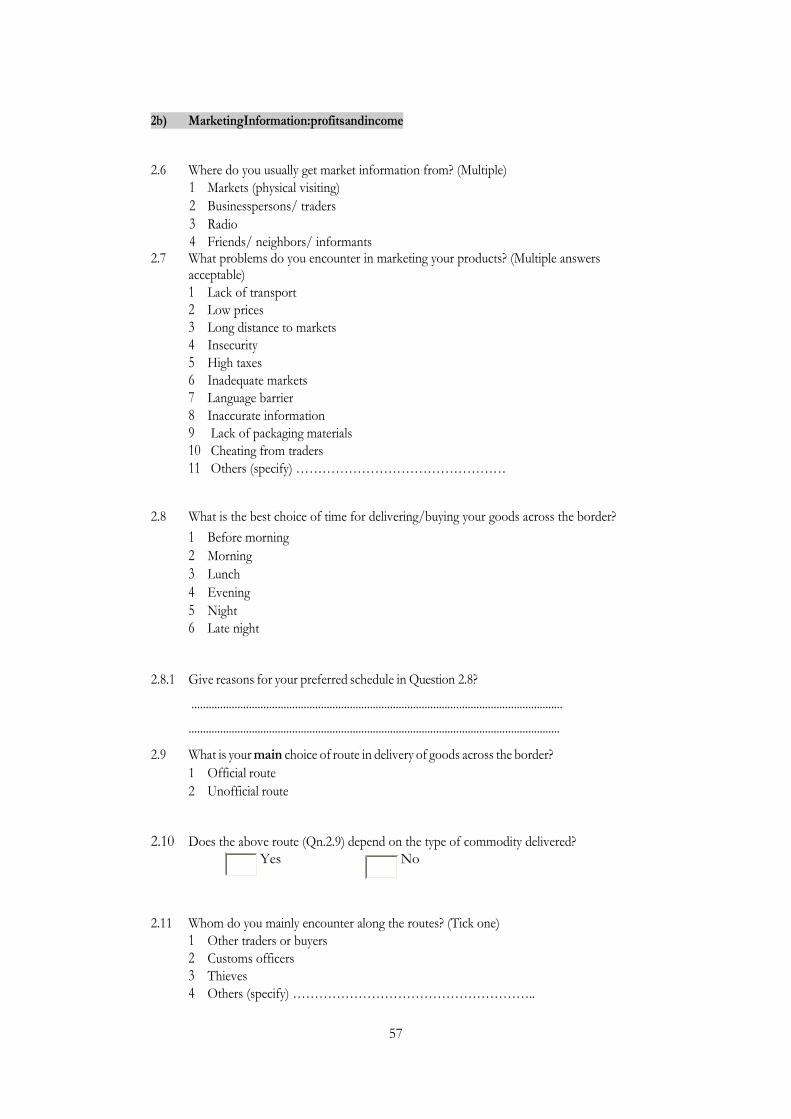
57
2b) Marketing Information: profits and income
2.6 Where do you usually get market information from? (Multiple)
1 Markets (physical visiting)
2 Businesspersons/ traders
3 Radio 4 Friends/ neighbors/ informants
2.7 What problems do you encounter in marketing your products? (Multiple answers acceptable)
1 Lack of transport 2 Low prices 3 Long distance to markets 4 Insecurity
5 High taxes 6 Inadequate markets 7 Language barrier
8 Inaccurate information 9 Lack of packaging materials 10 Cheating from traders
11 Others (specify) …………………………………………
2.8 What is the best choice of time for delivering/buying your goods across the border?
1 Before morning
2 Morning
3 Lunch
4 Evening
5 Night 6 Late night
2.8.1 Give reasons for your preferred schedule in Question 2.8?
.................................................................................................................................
.................................................................................................................................
2.9 What is your main choice of route in delivery of goods across the border?
1 Official route
2 Unofficial route
2.10 Does the above route (Qn.2.9) depend on the type of commodity delivered? Yes No
2.11 Whom do you mainly encounter along the routes? (Tick one) 1 Other traders or buyers
2 Customs officers 3 Thieves 4 Others (specify) ………………………………………………..
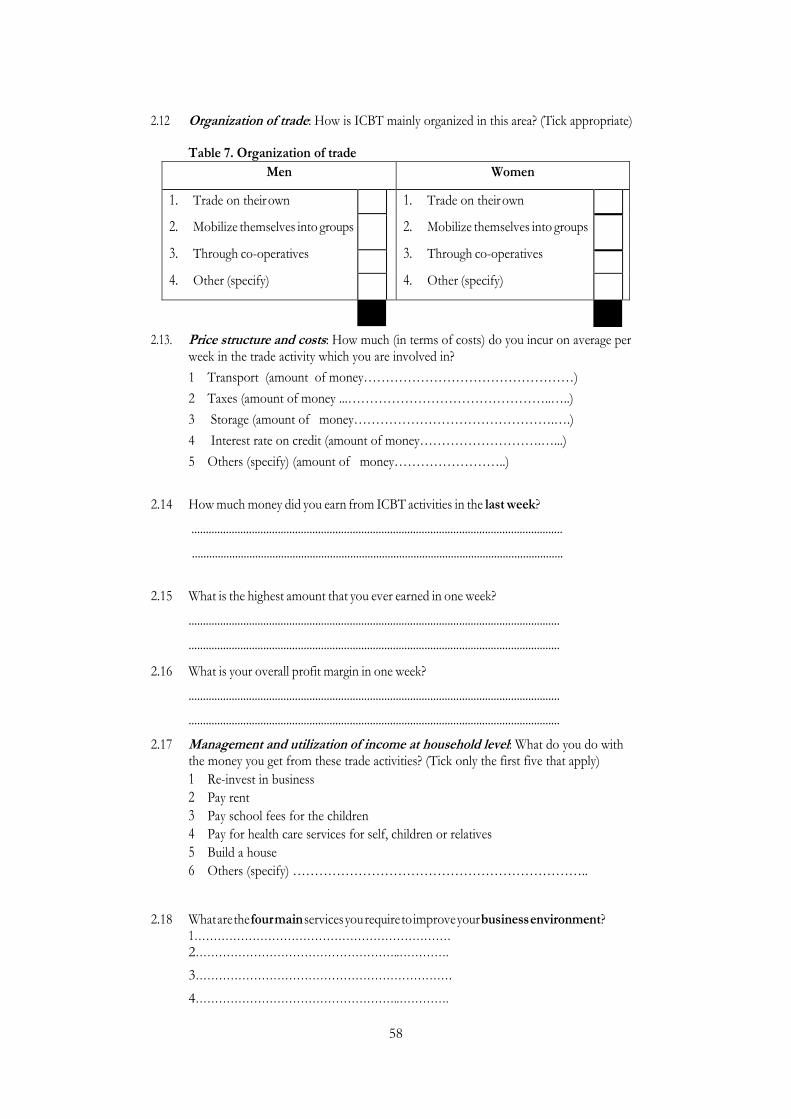
58
2.12 Organization of trade: How is ICBT mainly organized in this area? (Tick appropriate)
Table 7. Organization of trade
Men Women
1. Trade on their own
2. Mobilize themselves into groups
3. Through co-operatives
4. Other (specify)
1. Trade on their own
2. Mobilize themselves into groups
3. Through co-operatives
4. Other (specify)
2.13. Price structure and costs: How much (in terms of costs) do you incur on average per week in the trade activity which you are involved in?
1 Transport (amount of money…………………………………………)
2 Taxes (amount of money ...………………………………………..…..)
3 Storage (amount of money……………………………………….….)
4 Interest rate on credit (amount of money……………………….…...)
5 Others (specify) (amount of money……………………..)
2.14 How much money did you earn from ICBT activities in the last week?
.................................................................................................................................
.................................................................................................................................
2.15 What is the highest amount that you ever earned in one week?
.................................................................................................................................
.................................................................................................................................
2.16 What is your overall profit margin in one week?
.................................................................................................................................
.................................................................................................................................
2.17 Management and utilization of income at household level: What do you do with the money you get from these trade activities? (Tick only the first five that apply)
1 Re-invest in business
2 Pay rent
3 Pay school fees for the children
4 Pay for health care services for self, children or relatives
5 Build a house
6 Others (specify) …………………………………………………………..
2.18 What are the four main services you require to improve your business environment? 1………………………………………………………… 2……………………………………………..………….
3…………………………………………………………
4……………………………………………..………….
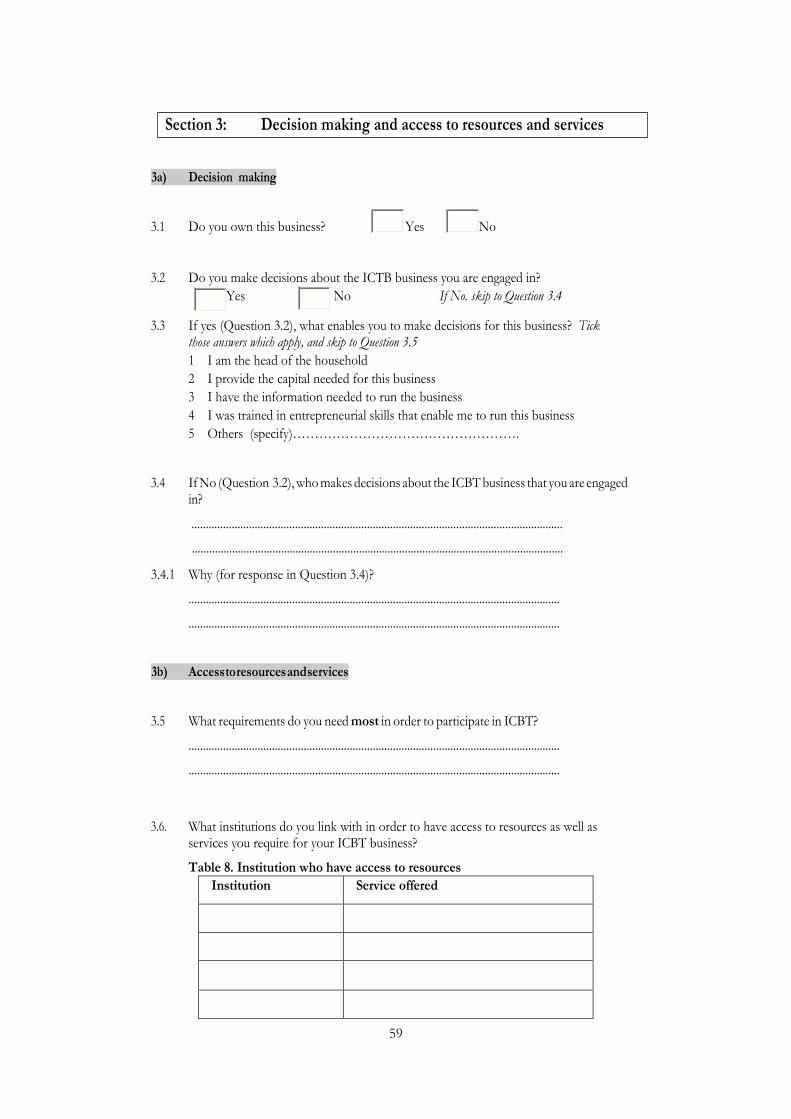
59
3a) Decision making
3.1 Do you own this business? Yes No
3.2 Do you make decisions about the ICTB business you are engaged in?
Yes No If No. skip to Question 3.4
3.3 If yes (Question 3.2), what enables you to make decisions for this business? Tick those answers which apply, and skip to Question 3.5
1 I am the head of the household
2 I provide the capital needed for this business
3 I have the information needed to run the business
4 I was trained in entrepreneurial skills that enable me to run this business
5 Others (specify)…………………………………………….
3.4 If No (Question 3.2), who makes decisions about the ICBT business that you are engaged in?
.................................................................................................................................
.................................................................................................................................
3.4.1 Why (for response in Question 3.4)?
.................................................................................................................................
.................................................................................................................................
3b) Access to resources and services
3.5 What requirements do you need most in order to participate in ICBT?
.................................................................................................................................
.................................................................................................................................
3.6. What institutions do you link with in order to have access to resources as well as services you require for your ICBT business?
Table 8. Institution who have access to resources
Institution Service offered
Section 3: Decision making and access to resources and services
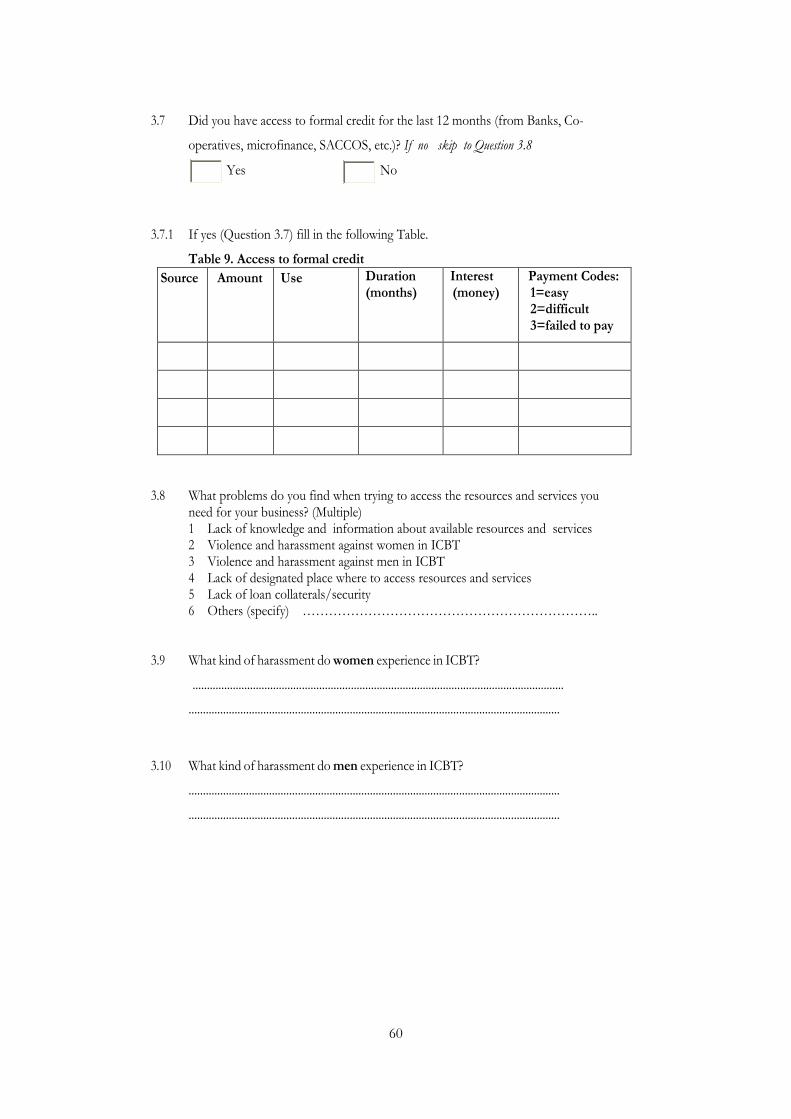
60
3.7 Did you have access to formal credit for the last 12 months (from Banks, Co-
operatives, microfinance, SACCOS, etc.)? If no skip to Question 3.8
Yes No
3.7.1 If yes (Question 3.7) fill in the following Table.
Table 9. Access to formal credit
Source Amount Use Duration (months)
Interest (money)
Payment Codes: 1=easy 2=difficult 3=failed to pay
3.8 What problems do you find when trying to access the resources and services you need for your business? (Multiple) 1 Lack of knowledge and information about available resources and services 2 Violence and harassment against women in ICBT 3 Violence and harassment against men in ICBT 4 Lack of designated place where to access resources and services 5 Lack of loan collaterals/security 6 Others (specify) …………………………………………………………..
3.9 What kind of harassment do women experience in ICBT?
.................................................................................................................................
.................................................................................................................................
3.10 What kind of harassment do men experience in ICBT?
.................................................................................................................................
.................................................................................................................................
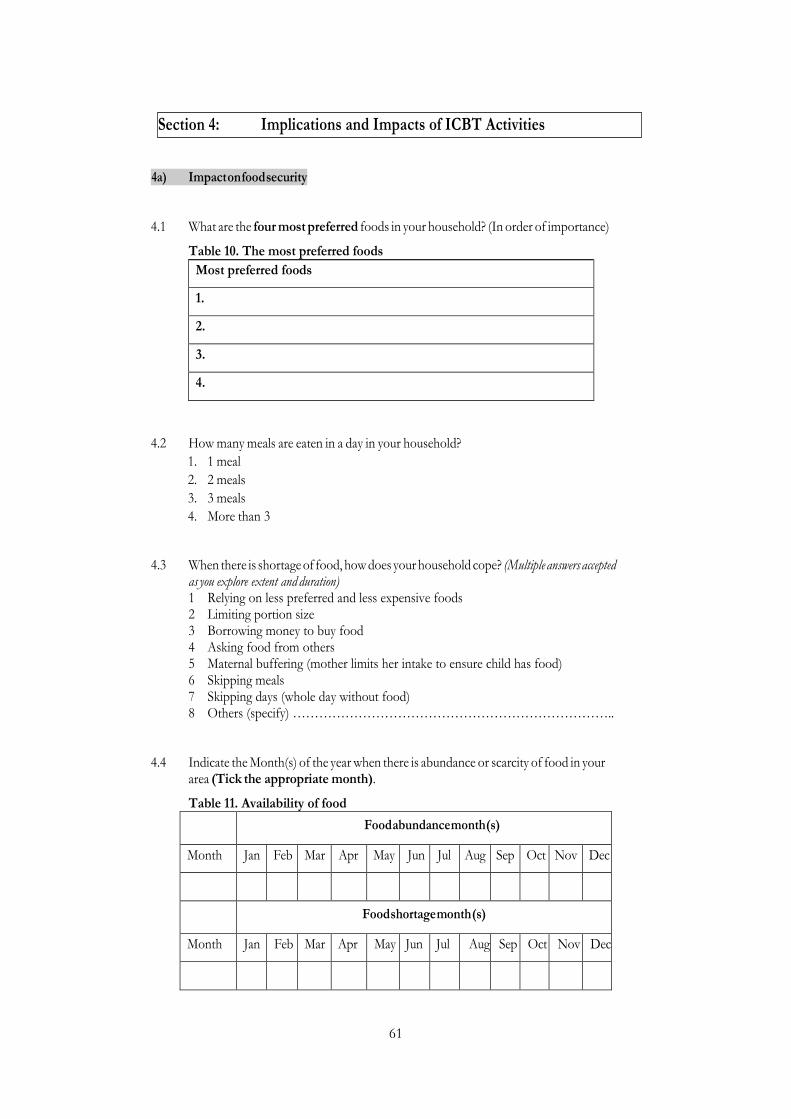
61
4a) Impact on food security
4.1 What are the four most preferred foods in your household? (In order of importance)
Table 10. The most preferred foods
Most preferred foods
1.
2.
3.
4.
4.2 How many meals are eaten in a day in your household?
1. 1 meal
2. 2 meals
3. 3 meals
4. More than 3
4.3 When there is shortage of food, how does your household cope? (Multiple answers accepted as you explore extent and duration) 1 Relying on less preferred and less expensive foods 2 Limiting portion size 3 Borrowing money to buy food 4 Asking food from others 5 Maternal buffering (mother limits her intake to ensure child has food) 6 Skipping meals 7 Skipping days (whole day without food) 8 Others (specify) ………………………………………………………………..
4.4 Indicate the Month(s) of the year when there is abundance or scarcity of food in your area (Tick the appropriate month).
Table 11. Availability of food Food abundance month (s)
Month Jan Feb Mar Apr May Jun Jul Aug Sep Oct Nov Dec
Food shortage month (s)
Month Jan Feb Mar Apr May Jun Jul Aug Sep Oct Nov Dec
Section 4: Implications and Impacts of ICBT Activities
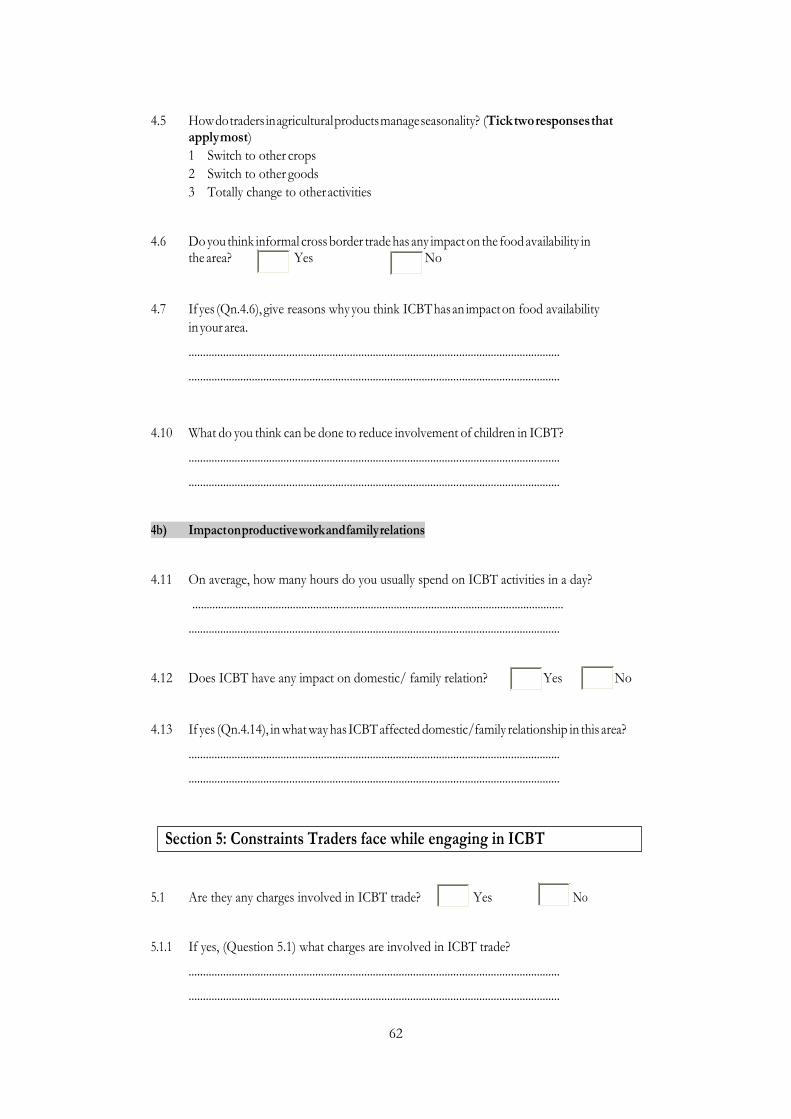
62
4.5 How do traders in agricultural products manage seasonality? (Tick two responses that apply most)
1 Switch to other crops
2 Switch to other goods
3 Totally change to other activities
4.6 Do you think informal cross border trade has any impact on the food availability in the area? Yes No
4.7 If yes (Qn.4.6), give reasons why you think ICBT has an impact on food availability
in your area.
.................................................................................................................................
.................................................................................................................................
4.10 What do you think can be done to reduce involvement of children in ICBT?
.................................................................................................................................
.................................................................................................................................
4b) Impact on productive work and family relations
4.11 On average, how many hours do you usually spend on ICBT activities in a day?
.................................................................................................................................
.................................................................................................................................
4.12 Does ICBT have any impact on domestic/ family relation? Yes No
4.13 If yes (Qn.4.14), in what way has ICBT affected domestic/family relationship in this area?
.................................................................................................................................
.................................................................................................................................
5.1 Are they any charges involved in ICBT trade? Yes No
5.1.1 If yes, (Question 5.1) what charges are involved in ICBT trade?
.................................................................................................................................
.................................................................................................................................
Section 5: Constraints Traders face while engaging in ICBT
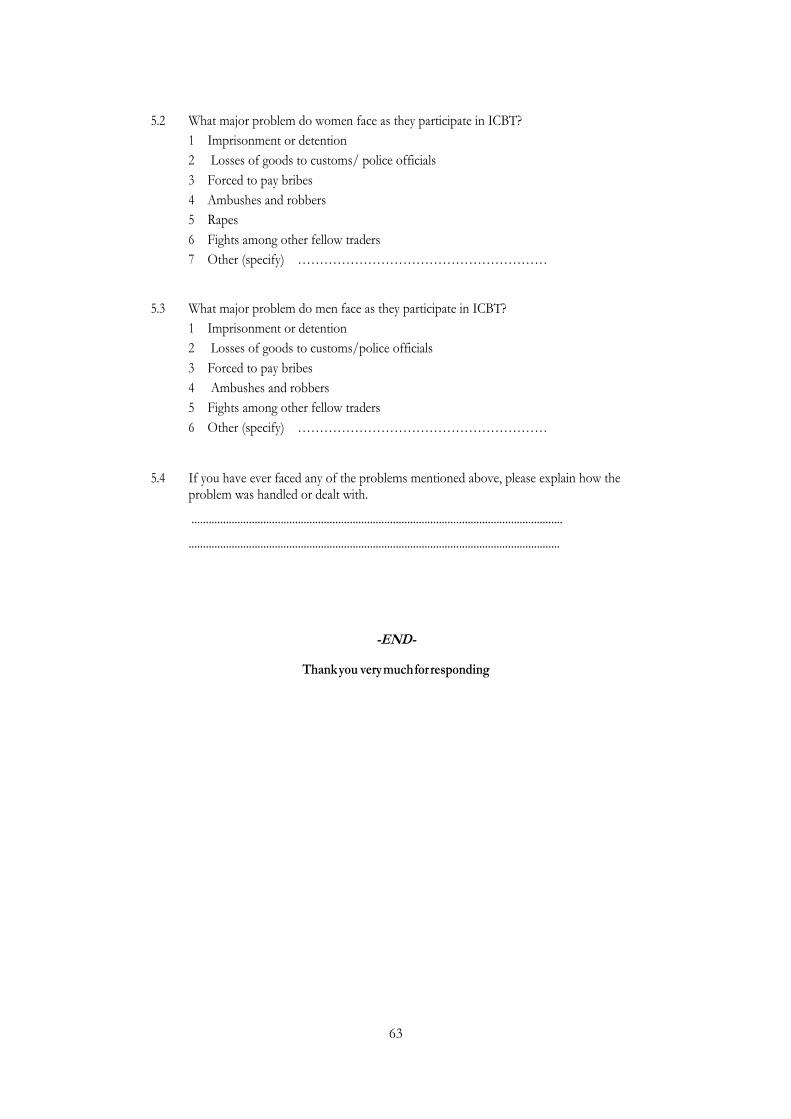
63
5.2 What major problem do women face as they participate in ICBT?
1 Imprisonment or detention
2 Losses of goods to customs/ police officials
3 Forced to pay bribes
4 Ambushes and robbers
5 Rapes
6 Fights among other fellow traders
7 Other (specify) …………………………………………………
5.3 What major problem do men face as they participate in ICBT?
1 Imprisonment or detention
2 Losses of goods to customs/police officials
3 Forced to pay bribes
4 Ambushes and robbers
5 Fights among other fellow traders
6 Other (specify) …………………………………………………
5.4 If you have ever faced any of the problems mentioned above, please explain how the problem was handled or dealt with.
.................................................................................................................................
.................................................................................................................................
-END-
Thank you very much for responding


