
Methods), we estimate that the probability of populating unboundtranslational states upon n s(N–H) decay, and hence producingmolecular translation, is 6 £ 1025. Considering both factors (prob-ability of n s(N–H) excitation and probability of decay to trans-lation), the small magnitude of the yield measured for pathway M1is fully consistent with a mode-selective mechanism of inducingmolecular translation, which prevails at lower tunnelling currents.When we raise the excitation rate in order to balance the stretch-to-translation decay rate with an additional excitation of the stretchmode, the energy accumulated in the molecule is large enoughto activate an additional decay pathway producing moleculardesorption, which is mediated by the umbrella mode (N.L. andJ.I.P., manuscript in preparation).
Molecular desorption mediated by the d s(N–H3) mode, M2,dominates when we reduce the electron energy to exclude n(N–H)excitations. This pathway is described by three excitations of theumbrella mode overtones in a ladder-climbing fashion (Fig. 4b).The ammonia gains sufficient vibrational energy to overcome the600-meV adsorption well. The umbrella mode features a smallercoupling with translational states than that found for the n s(N–H)mode. Moreover, our calculations show that d s(N–H3) vibrationalstates above 360 meV may well populate a long-lived transition stateconnected with the complete inversion of the molecule, which leadsto desorption after an additional excitation. In this process theumbrella mode itself becomes the vibrational state along thereaction coordinate (Fig. 4b), as was previously deduced fromultraviolet and infrared photodesorption experiments19,20.
It would be interesting to extend this methodology to morecomplex processes, searching for strategies of controlling andenhancing reactivity at surfaces that may be applied at the macro-scopic scale. The controlled environment furnished by the STMallows the detection of reaction mechanisms in the limit of very lowyield and very low power irradiation. In such single-moleculestudies, we expect that mode-selective strategies will becomeimportant in the discovery of reaction pathways that are inaccessibleby classical ‘thermal’ chemistry. A
MethodsTo estimate the potential barriers for translation and desorption, we performed total-energy calculations using plane waves and pseudopotentials in the generalized gradientapproximation of density functional theory. Using the method of refs 23 and 24, we alsoestimated chemisorbed ammonia frequencies, the probability of excitation of each modeand their lifetime. The numerical results for the relevant modes of this work are: thesymmetric and one antisymmetric stretch mode, n s(N–H) and na
1(N–H), at 408 meV and422 meV (294 meVand 311 meV for ND3), both with a probability Pn ¼ 6 £ 1024 of beingexcited per impinging electron and a lifetime of 4 ps and 8 ps, respectively; the umbrellamode, d s(N–H3), at 139 meV (104 meV for ND3), 40 £ 1024 and 25 ps; the scissors modes,d a(N–H3), degenerate at 200 meV (145 meV for ND3), 2 £ 1024 and 11 ps.
The decay probability, Pm, of a single n s(N–H) excitation decaying into the unboundhindered translation levels plus electron–hole excitation is estimated as the fractionw m.30/w. w m.30 is the sum of damping rates into states m above the barrier fortranslation, and w is the damping rate of the n s(N–H) mode, via excitation of electron–hole pairs and hindered translational states. An upper limit of the translation yield is thenYR ¼ Pn £ Pm ¼ 3 £ 1028 molecules per electron.
Received 20 December 2002; accepted 8 April 2003; doi:10.1038/nature01649.
1. Jortner, J., Levine, R. D. & Pullman, B. (eds) Mode Selective Chemistry (Kluwer Academic, Dordrecht,
1991).
2. Dai, H. L. & Ho, W. (eds) Laser Spectroscopy and Photochemistry on Metal Surfaces (World Scientific,
Singapore, 1995).
3. Higgings, J., Conjusteau, A., Scoles, G. & Bernasek, S. L. State selective vibrational (2n3) activation of
the chemisorption of methane on Pt(111). J Chem. Phys. 114, 5277–5283 (2001).
4. Potter, E. D., Herek, J. L., Pedersen, S., Liu, Q. & Zewail, A. H. Femtosecond laser control of a chemical
reaction. Nature 355, 66–68 (1992).
5. Sinha, A., Hsiao, M. C. & Crim, F. F. Controlling bimolecular reactions: Mode and bond selected
reaction of water with hydrogen atoms. J. Chem. Phys. 94, 4928–4935 (1991).
6. Bronikowski, M. J., Simpson, W. R., Girard, B. & Zare, R. N. Bond-specific chemistry: OD:OH
product ratios for the reactions H þ HOD(100) and H þ HOD(001). J. Chem. Phys. 95, 8647–8648
(1991).
7. Hansma, P. K. (ed.) Tunnelling Spectroscopy: Capabilities, Applications, and New Techniques (Plenum,
New York, 1982).
8. Stipe, B. C., Rezaei, M. A. & Ho, W. Single-molecule vibrational spectroscopy and microscopy. Science
280, 1732–1735 (1998).
9. Ho, W. Inducing and viewing bond selected chemistry with tunneling electrons. Acc. Chem. Res. 31,
567–573 (1998).
10. Eigler, D. M., Lutz, C. P. & Rudge, W. E. An atomic switch realized with the scanning tunnelling
microscope. Nature 352, 600–603 (1991).
11. Stipe, B. C., Rezai, M. A. & Ho, W. Coupling of vibrational excitation to the rotational motion of a
single adsorbed molecule. Phys. Rev. Lett. 81, 1263–1266 (1998).
12. Komeda, T., Kim, Y., Kawai, M., Persson, B. N. J. & Ueba, H. Lateral hopping of molecules induced by
excitation of internal vibration mode. Science 295, 2055–2058 (2002).
13. Bartels, L. et al. Atomic scale chemistry: Desorption of ammonia from Cu(111) induced by tunneling
electrons. Chem. Phys. Lett. 313, 544–552 (1999).
14. Avouris, Ph. Manipulation of matter at the atomic and molecular level. Acc. Chem. Res. 28, 95–102
(1995).
15. Stipe, B. C. et al. Single-molecule dissociation by tunneling electrons. Phys. Rev. Lett. 78, 4410–4413
(1997).
16. Hla, S. W., Bartels, L., Meyer, G. & Rieder, K. H. Inducing all steps of a chemical reaction with the
scanning tunneling microscope tip: Towards single molecule engineering. Phys. Rev. Lett. 85,
2777–2780 (2000).
17. Kim, Y., Komeda, T. & Kawai, M. Single-molecule reaction and characterization by vibrational
excitation. Phys. Rev. Lett. 89, 126104 (2002).
18. Rust, H.-P., Buisset, J., Schweizer, E. K. & Cramer, L. High precision mechanical approach mechanism
for a low temperature scanning tunneling microscope. Rev. Sci. Instrum. 68, 129–132 (1997).
19. Hertel, T., Wolf, M. & Ertl, G. UV photostimulated desorption of ammonia from Cu(111). J. Chem.
Phys. 102, 3414–3430 (1995).
20. Hussla, I. et al. Infrared-laser-induced photodesorption of NH3 and ND3 adsorbed on single-crystal
Cu(100) and Ag film. Phys. Rev. B 32, 3489–3501 (1985).
21. Prybyla, J. A., Heinz, T. F., Misewich, J. A., Loy, M. M. T. & Glownia, J. H. Desorption induced by
femtosecond laser pulses. Phys. Rev. Lett. 64, 1537–1540 (1990).
22. Salam, G. P., Persson, M. & Palmer, R. E. Possibility of coherent multiple excitation in atom transfer
with a scanning tunneling microscope. Phys. Rev. B 49, 10655–10662 (1994).
23. Lorente, N. & Persson, M. Theory of single molecule vibrational spectroscopy and microscopy. Phys.
Rev. Lett. 85, 2997–3000 (2000).
24. Lorente, N. & Persson, M. Theoretical aspects of tunneling-current-induced bond excitation and
breaking at surfaces. Faraday Discuss. 117, 277–290 (2000).
Acknowledgements J.I.P. acknowledges research contracts ‘Marie Curie’ (EU) and ‘Ramon y
Cajal’ (Ministerio de Ciencia y Tecnologıa). N.L. acknowledges support from ACI Jeunes
Chercheurs, and the CNRS programme ‘Nano-Objet Individuel’. All calculations were performed
at the Centre d’Informatique National de l’Enseignement Superieur (CINES) and the Centre de
Calcul Midi-Pyrenees (CALMIP).
Competing interests statement The authors declare that they have no competing financial
interests.
Correspondence and requests for materials should be addressed to J.I.P. ([email protected]).
..............................................................
Impact of urbanization and land-usechange on climateEugenia Kalnay & Ming Cai
University of Maryland, College Park, Maryland 20770-2425, USA.............................................................................................................................................................................
The most important anthropogenic influences on climate are theemission of greenhouse gases1 and changes in land use, such asurbanization and agriculture2. But it has been difficult to separ-ate these two influences because both tend to increase the dailymean surface temperature3,4. The impact of urbanization hasbeen estimated by comparing observations in cities with those insurrounding rural areas, but the results differ significantlydepending on whether population data5 or satellite measure-ments of night light6–8 are used to classify urban and ruralareas7,8. Here we use the difference between trends in observedsurface temperatures in the continental United States and thecorresponding trends in a reconstruction of surface temperaturesdetermined from a reanalysis of global weather over the past 50years, which is insensitive to surface observations, to estimate theimpact of land-use changes on surface warming. Our resultssuggest that half of the observed decrease in diurnal temperaturerange is due to urban and other land-use changes. Moreover, ourestimate of 0.27 8C mean surface warming per century due to
letters to nature
NATURE | VOL 423 | 29 MAY 2003 | www.nature.com/nature528 © 2003 Nature Publishing Group
land-use changes is at least twice as high as previous estimatesbased on urbanization alone7,8.
Two methods used in the US to classify meteorological stationsinto urban and rural to ‘correct’ the observed surface temperaturetrends for urbanization effects are based on population data5 andsatellite measurements of night-light6–8, respectively, and the corre-sponding estimates of the impact of urbanization differ in magni-tude (0.06 and 0.15 8C per century)7,8. The finding that atmospherictemperatures as measured by satellites and weather balloons havesmaller warming trends than surface observations has been thesubject of much discussion9 centred mostly on the quality of thedata, but it could be partially explained by a predominance of land-use effects over greenhouse warming near the surface.
We estimated the impact of urbanization and other land uses onclimate change by comparing trends observed by surface stationswith surface temperatures derived from the NCEP-NCAR 50-yearReanalysis (NNR)10. In the NNR (a statistical combination of 6-hour forecasts and observations), surface observations of tempera-ture, moisture and wind over land are not used11. However,atmospheric vertical soundings of wind and temperature (rawin-sondes and satellite soundings) strongly influence the NNR, andsurface temperatures are estimated from the atmospheric values. Asa result, the NNR should not be sensitive to urbanization or land-use effects, although it will show climate changes to the extent thatthey affect the observations above the surface.
As indicated by Fig. 1 and many other studies, the NNR captureswell surface temperature variations caused by atmospheric storms,advection of warm/cold air, and variations in the frequency or trackof major storms. In contrast to the actual surface observations, wefind no statistically significant difference in the NNR estimation ofurban and rural station trends (see Methods). These argumentssuggest that we could attribute the differences between monthly orannually averaged surface-temperature trends derived from obser-vations and from the NNR primarily to urbanization and otherchanges in land use.
We compare the daily maximum and minimum temperatures of1,982 surface stations located below 500 m in the 48 contiguousUnited States, and the daily surface maximum and minimumtemperatures on a 2.58 gaussian grid from the NNR interpolatedto the station locations, both for the period 1950–1999. We computetemperature anomalies with respect to the 50-year mean annualcycle for each site and each data set. Trends are computed as changesin decadal averages in the anomalies to reduce random errors. TheNNR (1948 to the present) has been constructed with a model anddata assimilation system kept unchanged, but it is affected bychanges in the observing systems, especially the introduction ofthe satellite observing system in 1979. Therefore, in the compu-tation of trends we exclude changes from the decade of the 1970s tothe 1980s.
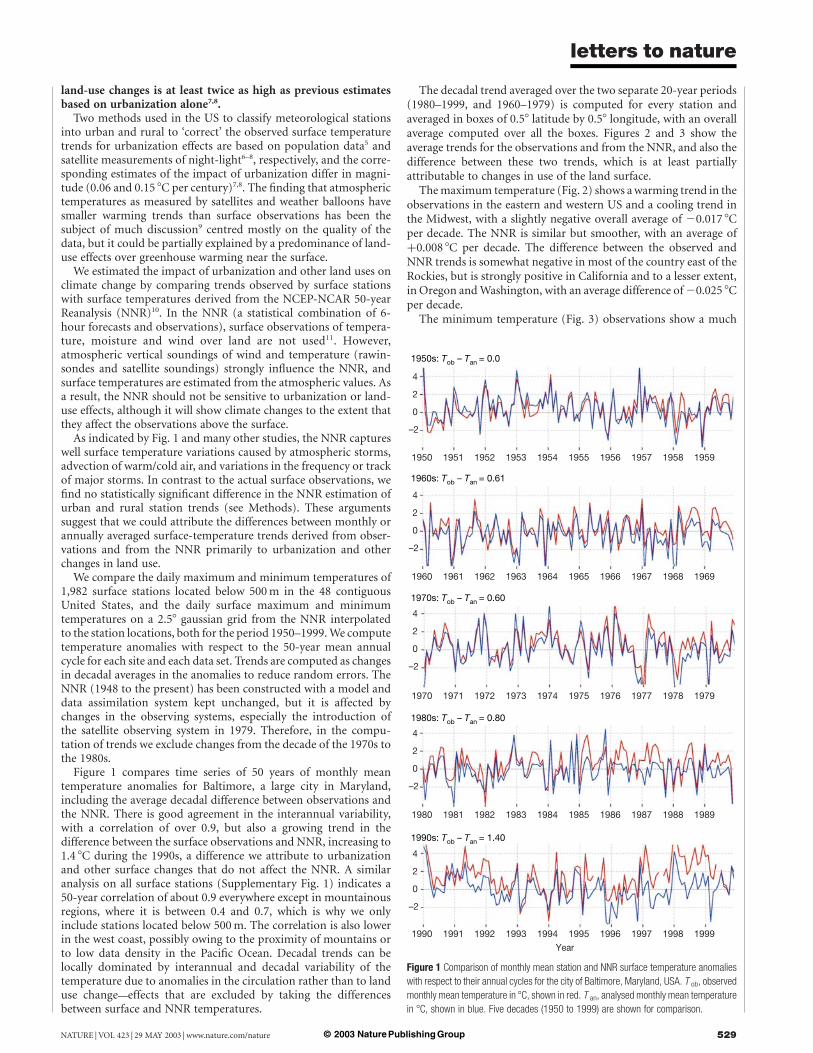
Figure 1 compares time series of 50 years of monthly meantemperature anomalies for Baltimore, a large city in Maryland,including the average decadal difference between observations andthe NNR. There is good agreement in the interannual variability,with a correlation of over 0.9, but also a growing trend in thedifference between the surface observations and NNR, increasing to1.4 8C during the 1990s, a difference we attribute to urbanizationand other surface changes that do not affect the NNR. A similaranalysis on all surface stations (Supplementary Fig. 1) indicates a50-year correlation of about 0.9 everywhere except in mountainousregions, where it is between 0.4 and 0.7, which is why we onlyinclude stations located below 500 m. The correlation is also lowerin the west coast, possibly owing to the proximity of mountains orto low data density in the Pacific Ocean. Decadal trends can belocally dominated by interannual and decadal variability of thetemperature due to anomalies in the circulation rather than to landuse change—effects that are excluded by taking the differencesbetween surface and NNR temperatures.
The decadal trend averaged over the two separate 20-year periods(1980–1999, and 1960–1979) is computed for every station andaveraged in boxes of 0.58 latitude by 0.58 longitude, with an overallaverage computed over all the boxes. Figures 2 and 3 show theaverage trends for the observations and from the NNR, and also thedifference between these two trends, which is at least partiallyattributable to changes in use of the land surface.
The maximum temperature (Fig. 2) shows a warming trend in theobservations in the eastern and western US and a cooling trend inthe Midwest, with a slightly negative overall average of 20.017 8Cper decade. The NNR is similar but smoother, with an average ofþ0.008 8C per decade. The difference between the observed andNNR trends is somewhat negative in most of the country east of theRockies, but is strongly positive in California and to a lesser extent,in Oregon and Washington, with an average difference of 20.025 8Cper decade.
The minimum temperature (Fig. 3) observations show a much
Figure 1 Comparison of monthly mean station and NNR surface temperature anomalies
with respect to their annual cycles for the city of Baltimore, Maryland, USA. T ob, observed
monthly mean temperature in 8C, shown in red. T an, analysed monthly mean temperature
in 8C, shown in blue. Five decades (1950 to 1999) are shown for comparison.
letters to nature
NATURE | VOL 423 | 29 MAY 2003 | www.nature.com/nature 529© 2003 Nature Publishing Group

stronger positive trend in most of the country, with an average ofþ0.193 8C per decade. In the NNR, the minimum temperatureincreases everywhere except in the Midwest and California, with anaverage of þ0.113 8C per decade. The difference in minimumtemperature trends between observed and NNR values is positivein most of the country, especially in California, with an average of0.080 8C per decade (40% of the observed trend).
Supplementary Fig. 2 shows the trend in the difference betweenmaximum and minimum temperatures or diurnal temperaturerange (DTR). In the observations the DTR trend is strongly negativein most of the country with an average decrease of 20.210 8C perdecade. The NNR also shows a general decrease of DTR, with anational average of 20.105 8C per decade so that about half of thedecrease in DTR could be attributable to surface changes.
The daily mean temperature observation trends (SupplementaryFig. 3) obtained as the average of the maximum and minimumtemperatures show an increase in most of the country, with anaverage trend of þ0.088 8C per decade. The NNR trends have anaverage of þ0.061 8C per decade. Of the two “urban correction”estimates7,8, our estimate of 0.27 8C per century attributable to landuse is closer to the estimate based on the night-light urban effect (seecentre bottom of plate 3C in ref. 7) than to the estimate based onpopulation density (see centre bottom of plate 3B in ref. 7). Itshould be noted that our observed daily mean temperature trends
(Supplementary Fig. 3a) are different from previous 50-year or 100-year trend estimates (see plates 3A and 7A in ref. 7) because in ourcomputations we did not include (1) the decadal trends corre-sponding to the 1980s–1970s and especially the 1960s–1950s, and(2) urban and non-urban data adjustments. The non-urban adjust-ments tend to be strongly positive except over the Rockies (see plate3B in ref. 7), so that if we had added them to the raw observations,our estimate of the land-use impact on the mean temperature trendswould have been geographically similar but larger.
Although it is not possible definitively to attribute the differencesbetween the observation and the NNR temperature trends solely toland use, including urbanization, agriculture and irrigation, ourresults are compatible with such an interpretation. The well-known‘urban heat island’ effect actually takes place at night, when build-ings and streets release the solar heating absorbed during the day. Atthe time of the maximum temperature the urban effect is one ofslight cooling, owing to shading, aerosols, and to thermal inertiadifferences between city and country that are not currently wellunderstood12.
The effect of agricultural development, increasing evaporationduring the day, would also tend to decrease the maximum tem-perature: irrigation would increase the heat capacity of the soil, thusincreasing the minimum temperature. Therefore, both urbaniz-ation and agriculture effects could be consistent with the generalincrease in the minimum temperature and slight decrease in themaximum temperature, and contribute to the reduction in thediurnal temperature range shown in our estimates east of theRockies (Figs 2c and 3c).
This implies that the comparison of urban and rural stationswithout including agricultural effects would underestimate the total
1
–1
0.5
–0.5
0.3
–0.3
0.2
–0.2
0.1
–0.1
0.05
–0.050
1
–1
0.5
–0.5
0.3
–0.3
0.2
–0.2
0.1
–0.1
0.05
–0.050
1
–1
0.5
–0.5
0.3
–0.3
0.2
–0.2
0.1
–0.1
0.05
–0.050
120 115 110 105 100 95 90 85 80 75 70Longitude (°W)
Max
imum
tem
per
atur
e (°
C)
–0.017 °C
+0.008 °C
–0.025 °C
48
45
42
39
36
33
30
27
48
45
42
39
36
33
30
27
48
45
42
39
36
33
30
27
Latit
ude
(°N
)
a
b
c
Figure 2 Decadal trend of the maximum temperature averaged for every US station below
an elevation of 500 m. Each value (in 8C per decade) was calculated from the average of
the ‘1990s minus the 1980s’ and the ‘1970s minus the 1960s’ maximum temperatures.
The station values are displayed as averages in boxes of 0.58 latitude by 0.58 longitude.
Blank boxes indicate that none of the 1982 stations is within the boxes, and the national
average is the average of these boxes. The average value of the trend is indicated in each
panel. a, Station (observed) maximum temperature trends. b, NNR (analysed) maximum
temperature trends. c, ‘Observed minus analysed’ maximum temperature trends.
1
–1
0.5
–0.5
0.3
–0.3
0.2
–0.2
0.1
–0.1
0.05
–0.050
1
–1
0.5
–0.5
0.3
–0.3
0.2
–0.2
0.1
–0.1
0.05
–0.050
1
–1
0.5
–0.5
0.3
–0.3
0.2
–0.2
0.1
–0.1
0.05
–0.050
120 115 110 105 100 95 90 85 80 75 70Longitude (°W)
Max
imum
tem
per
atur
e (°
C)
+0.193 °C
+0.113 °C
+0.080 °C
48
45
42
39
36
33
30
27
48
45
42
39
36
33
30
27
48
45
42
39
36
33
30
27
Latit
ude
(°N
)
a
b
c
Figure 3 Decadal trend of the minimum temperature averaged for every US station below
500 m. Legend as for Fig. 2 but for the minimum temperatures.
letters to nature
NATURE | VOL 423 | 29 MAY 2003 | www.nature.com/nature530 © 2003 Nature Publishing Group
impact of land-use changes. More studies are needed, including acomparison of geographical distribution of NNR trends with otherupper-air observations, such as rawinsondes and satellites, a moreprecise definition of the urban and rural observing stations, and theimpact of other human activities such as contrails and aerosols thatcan also reduce the diurnal temperature range13.
Our method can incorporate updated observations as theybecome available, can be applied to land stations throughout theworld, to other variables such as humidity and winds, detectseasonal trends, and signal changes in station locations that areotherwise difficult to identify. A
MethodsDataFor the surface observations, we use the daily surface maximum and minimumuncorrected surface station temperatures from the National Climate Data Center (NCDC)‘Cooperative Summary of the Day’ data set over the 48 contiguous states of the UnitedStates for 1950–1999. For the NNR, we use the global daily surface maximum andminimum temperatures gridded on 2.58 gaussian boxes, also for the period 1950–1999.
AnalysisWe interpolate linearly the gridded NNR data to each observational site, and only considerthe sites that have a total of at least 480 (whole) months of observations. In addition,because the NNR has surface heights different from those of the real locations, andextrapolations underground can introduce errors overwhelming the signal of the realtrends (Supplementary Fig. 2), in the computation of the trends we only consider siteswith elevations lower than 500 m. There are 1,982 US surface stations satisfying these twoconditions. We obtain monthly means by averaging daily data; daily mean temperaturesare obtained by averaging maximum and minimum temperatures, and daily temperatureranges by subtracting the minimum from the maximum temperature.
Because the NNR can have systematic differences with observations, especially near thesurface, owing to deficiencies in the model forecast or the method of assimilation, weremove the 50-year monthly mean annual cycle for each site from both the observationsand the NNR. We are thus comparing anomalies with respect to the 50-year mean annualcycle. In the results we present both comparisons of the 50-year time series and trends. Thetrends are computed as changes in decadal averages in order to reduce random errors. Weonly consider two decadal trends: the decade 1990–1999 minus 1980–1989, and 1970–1979 minus 1960–1969. We do not include in the trends the difference between the decades1960–1969 and 1950–1959, because the observing system during the 1950s wasconsiderably less reliable than in later decades, and it underwent significant schedulingchanges during 1958 (ref. 11).
In addition, we have to address changes in the observing systems, especially theintroduction of the satellite observing system (of which the most important is the TIROS-N Operational Vertical Sounder, TOVS) starting in 1979. These two major changes are themain reason why trends in the NNR need to be carefully estimated. We therefore do notinclude the changes 1980–1989 minus 1970–1979. The two decadal changes that we keepcorrespond to the 1990s minus 1980s (20 years with satellite data), and 1970s minus 1960s(20 years essentially without satellite data). Thus, when we average them we obtain decadaltrends from two independent and largely homogeneous 20-year periods.
We compared the 1990s versus 1980s trend of 775 stations classified as urban versus 167stations classified as rural. The mean surface temperature increased by 0.31 8C for theurban stations and 0.13 8C for the rural stations, with standard deviations of about 0.5 8Ceach. The difference between urban and rural warming, 0.18 8C, is significant at a 99% levelof significance. The trends for the reanalysis station estimates are 0.26 8C for urban and0.25 8C for rural, with standard deviations of about 0.22 8C, and the difference 0.01 8Cbetween urban and rural is insignificant, showing that the NNR is insensitive to surfaceeffects.
In the time series we compute the 1950–1959 average temperature difference betweenthe NNR and the surface station at each station and subtract it from the NNR. This forcesthe two time series to have the same 10-year time average during the 1950s and is done fordisplay but does not affect the computation of the trends or correlations.
Received 18 December 2002; accepted 23 April 2003; doi:10.1038/nature01675.
1. IPCC Climate Change 2001: The Scientific Basis (Cambridge Univ. Press, Cambridge, UK, 2001).
2. Pielke, R. A. Sr et al. The influence of land-use change and landscape dynamics on the climate system:
Relevance to climate-change policy beyond the radiative effects of greenhouse gases. Phil. Trans. R. Soc.
Lond. A 360, 1–15 (2002).
3. Gallo, K. P. & Owen, T. W. Satellite-based adjustments for urban heat island temperature bias. J. Appl.
Meteorol. 38, 806–813 (1999).
4. Owen, T. W., Gallo, K. P., Elvidge, C. D. & Baugh, K. E. Using DMSP-OLS light frequency data to
categorize urban environments associated with US climate observing stations. Int. J. Remote Sensing
19, 3451–3456 (1998).
5. Easterling, D. R. et al. Maximum and minimum temperature trends for the globe. Science 277, 364–
367 (1997).
6. Gallo, K. P., Easterling, D. R. & Peterson, T. C. The influence of land use/land cover on climatological
values of the diurnal temperature range. J. Clim. 9(11), 2941–2944 (1996).
7. Hansen, J. E. et al. A closer look at United States and global surface temperature change. J. Geophys.
Res. 106, 23947–23963 (2001).
8. Gallo, K. P., Owen, T. W., Easterling, D. R. & Jamason, P. F. Temperature trends of the US historical
climatology network based on satellite-designated land use/land cover. J. Clim. 12(5), 1344–1348
(1999).
9. NRC Board on Atmosphere Sciences and Climate Committee Panel, John M. Wallace, chair, pages
1–71. Reconciling Observations of Global Temperature Change (National Research Council,
Washington DC, 2000).
10. Kalnay, E. et al. The NCEP/NCAR 40-year reanalysis project. Bull. Am. Meteorol. Soc. 77, 437–431
(1996).
11. Kistler, R. et al. The NCEP/NCAR 50-year reanalysis: Monthly means CD-ROM and documentation.
Bull. Am. Meteorol. Soc. 82, 247–267 (2000).
12. Runnalls, K. E. & Oke, T. R. Dynamics and controls of the near-surface heat island of Vancouver, BC.
Phys. Geogr. 21, 283–304 (2000).
13. Travis, D. J., Carleton, A. M. & Lauritsen, R. G. Contrails reduce daily temperature range. Nature 418,
601 (2002).
Supplementary Information accompanies the paper on www.nature.com/nature.
Acknowledgements This study was partially supported by a Risk Prediction Initiative grant. We
are grateful to A. Senserini, who performed most of the computations, to J. E. Janowiak and
W. Ebisuzaki who provided the data, and to R. Murnane, T. Oke, J. Hansen, E. Rassmusson,
R. Pielke Sr, T. vonder Haar and Z. Li for discussions.
Competing interests statement The authors declare that they have no competing financial
interests.
Correspondence and requests for materials should be addressed to E.K.
..............................................................
Field sports and conservation in theUnited KingdomT. E. E. Oldfield, R. J. Smith, S. R. Harrop & N. Leader-Williams
Durrell Institute of Conservation and Ecology, University of Kent, Canterbury,Kent CT2 7NS, UK.............................................................................................................................................................................
Many natural habitats exist on privately owned land outsideprotected areas1, but few governments can afford to enforce orsubsidize conservation of this biodiversity. Even in some devel-oped countries, conservation subsidy schemes have only achievedlimited success2–4. Fortunately, some landowners may be willingto accept management costs in return for other benefits5,although this remains controversial when it involves the killingof charismatic species. For example, participants in British fieldsports, such as fox hunting and game-bird shooting, may volun-tarily conserve important habitats that are required by quarryspecies6–8. Here we report results from a multidisciplinary studythat addressed this issue by focusing on three sites across centralEngland. We found that landowners participating in field sportsmaintained the most established woodland and planted morenew woodland and hedgerows than those who did not, despite theequal availability of subsidies. Therefore, voluntary habitatmanagement appears to be important for biodiversity conserva-tion in Britain. Current debates on the future of field sports inBritain, and similar activities globally, may benefit from con-sidering their utility as incentives to conserve additional habitaton private land.
Private landowners play an increasingly important role in bio-diversity conservation1. This is especially important where habitatsform isolated remnants in an agricultural matrix, and it is politicallydifficult to establish large protected areas9. This is typified by thesituation in Britain, where farmland covers 76% of the country andincreases in agricultural efficiency have caused great declines inbiodiversity7,10,11. The British government has responded by intro-ducing legislation to protect important habitats and species onpublic and private land12–14, as well as establishing subsidyschemes11,15. However, conservation legislation remains unpopular
letters to nature
NATURE | VOL 423 | 29 MAY 2003 | www.nature.com/nature 531© 2003 Nature Publishing Group
19. Otwinowski, M. & Minor, W. Processing of X-ray diffraction data collected in oscillation mode.
Methods Enzymol. 276, 307–326 (1997).
20. Terwilliger, T. C. & Berendzen, J. Automated MAD and MIR structure solution. Acta Crystallogr. D 55,
849–861 (1999).
21. Terwilliger, T. C. Maximum likelihood density modification. Acta Crystallogr. D 56, 965–972 (2000).
22. Jones, T., Zou, J.-Y., Cowan, S. & Kjeldgaard, M. Improved methods for building protein models in
electron density maps and the location of errors in these models. Acta Crystallogr. A 47, 110–119 (1991).
23. Brunger, A. T. et al. Crystallography & N.M.R. system: a new software suite for macromolecular
structure determination. Acta Crystallogr. D 54, 905–921 (1998).
Supplementary Information accompanies the paper on www.nature.com/nature.
Acknowledgements We are grateful to J. R. H. Tame for a critical reading of the manuscript. We
thank Z. No for providing sildenafil citrate; D.-K. Kim for providing vardenafil; D. K. Shin for
discussion and figures; and H.-S. Lee and G.-H. Kim for their assistance at the Pohang Light
Source (PLS), beamline 6B. Experiments at PLS were supported, in part, by the Ministry of
Science and Technology (MOST) of Korea and POSCO. We also thank S.Y.P’s group for their
assistance at Spring-8 for high-resolution data. This work was supported partially by a grant from
the National Research Laboratory Program and the Center for Biological Modulators of the 21c
Frontier R&D Program, subsidized MOST. This work was also supported partly by Yuyu Inc. and
KT&G Co. Ltd..
Competing interests statement The authors declare that they have no competing financial
interests.
Correspondence and requests for materials should be addressed to S.G.R.
([email protected]) or J.M.C. ([email protected]). Coordinates for the
sildenafil, tadalafil and vardenafil complex structure have been deposited in the Protein Data
Bank under accession codes 1UDT, 1UDU and 1UHO, respectively.
..............................................................
erratum
The expression domain ofPHANTASTICA determines leafletplacement in compound leaves
Minsung Kim, Sheila McCormick, Marja Timmermans & Neelima Sinha
Nature 424, 438–443 (2003)..............................................................................................................................................................................
In the Methods section on page 443 of this Letter, a line was omitted.The sentence should read: “We determined antibody purity andspecificity by western blot analysis on protein extracts preparedfrom wild-type and rs2 mutant apices.” A
..............................................................
corrigenda
Structure of the replicative helicaseof the oncoprotein SV40 largetumour antigen
Dawei Li, Rui Zhao, Wayne Lilyestrom, Dahai Gai, Rongguang Zhang,James A. DeCaprio, Ellen Fanning, Andrzej Joachimiak,Gerda Szakonyi & Xiaojiang S. Chen
Nature 423, 512–518 (2003)..............................................................................................................................................................................
The name of A. J. was misspelt in the author list and should beAndrzej Joachimiak. Also, he is in the Biosciences Division of SBC(and not at the Advanced Photon Source, as published). A
..............................................................
corrigendum
Impact of urbanization andland-use change on climate
E. Kalnay & M. Cai
Nature 423, 528–531 (2003)..............................................................................................................................................................................
When calculating areal averages, which involve weighting griddeddata with the cosine of the latitude of half-degree grid boxes, wedivided the sum by the total number of grids but omitted to dividethe sum also by the average cosine latitude of the domain, which is0.786. This error affects only the area-averaged values, not the mapsor the station values, or the relative differences between station andreanalysis values. As a result, the average numbers on the mapsshould be divided by this factor. As the proportions quoted remainthe same, this error does not affect our conclusions, except that thevalues of area-averaged trends have to be multiplied by 1.272. Thecorrected estimate of the trend in daily mean temperature due toland use changes is 0.35 8C per century. A
letters to nature
NATURE | VOL 425 | 4 SEPTEMBER 2003 | www.nature.com/nature102 © 2003 Nature Publishing Group


