Running Head: IMAGES, VALUES, AND LANDSCAPE PREFERENCE
Images of Nature, Environmental Values, and Landscape Preference:
Exploring their Interrelationships
Agnes E. Van den Berg
Alterra, Green World Research, Wageningen, The Netherlands
Danny H. de Vries
University of North Carolina at Chapel Hill, USA
Charles A.J. Vlek
University of Groningen, The Netherlands
AUTHOR NOTES: This study was conducted as part of a doctoral dissertation project (Van
den Berg, 1999). This dissertation project was supported by a grant from the Nature
Development Research Stimulation Program of the Dutch Ministry of Agriculture, Nature
Management and Fisheries.
Correspondence to Agnes van den Berg, Alterra, P.O. Box 47, 6700 AA Wageningen. E-mail:
Images, Values, and Landscape Preference
2
Abstract
The present study explores the links among images of nature, environmental values,
and group differences in landscape preferences. Groups of students from three different
educational disciplines (agriculture, psychology, and biology) evaluated the scenic beauty of
slides depicting managed and unmanaged natural landscapes with varying degrees of human
influence. Multilevel analyses revealed group differences in the relationship between
perceived landscape beauty and perceived human influence. Beauty ratings of biology and
psychology students were negatively related to perceived human influence, while beauty
ratings of students of agriculture were positively related to perceived human influence. In
addition, the present study found group differences in images of nature, assessed by means of
prototypicality ratings of descriptions of nature instances, and group differences in
environmental values, as measured by the NEP scale (Dunlap & Van Liere, 1978). Students
of biology and psychology displayed more ecocentric images of nature and environmental
values than students of agriculture. Participants with more ecocentric images of nature and
environmental values also displayed higher preferences for unmanaged as compared to
managed natural landscapes. However, mediational analyses provided no evidence that group
differences in the relationship between perceived landscape beauty and perceived human
influence were mediated by group differences in images of nature and environmental values.
Taken together, the findings of the present study underline the key role of perceived degree of
human influence in group differences in affective and cognitive responses towards nature.
Images, Values, and Landscape Preference
3
Images of Nature, Environmental Values, and Landscape Preference:
Exploring their Interrelationships
Throughout history, wilderness and rural landscapes have been evaluated in opposed
ways. Some people have regarded wilderness landscapes as 'waste land', filled with threats,
while praising rural landscapes for their usefulness and orderliness (Lemaire, 1970).
Conversely, others have regarded wilderness landscapes as a divine place of bliss and
harmony, while criticizing rural landscapes for their lack of spiritual value (Nash, 1973).
Although the relative importance of pro-rural orientations and pro-wilderness orientations
may vary over time and across cultures, historians have emphasized that both orientations
have always co-existed within different time periods and cultures (Tuan, 1974; Schama, 1995;
Eisenberg, 1998).
As the most important difference between wilderness and rural landscapes concerns
their degree of human influence, these historical accounts suggest that in modern times degree
of human influence may still be an important source of interpersonal differences in landscape
preferences. Consistent with this interpretation, there is accumulating empirical evidence for
the existence of group differences in the preferred balance between spontaneous and human-
influenced patterns in natural landscapes (e.g., González Bernaldez & Parra, 1979; Schroeder,
1983; Dearden, 1984; Fenton, 1985; Kaplan & Herbert, 1987; Orland, 1988; Van den Berg,
Vlek, & Coeterier, 1998). For example, farmers and low-income groups have been found to
prefer managed natural landscapes with a high degree of human influence, while
environmentalists and high-income groups have been found to prefer unmanaged natural
landscapes with a low degree of human influence (Van den Berg, 1999).
How can individual differences in preferences for natural landscapes be explained?
Within the field of environmental psychology, individual differences in landscape preferences
are generally thought to reflect the influence of people’s personal and socially shared
experiences with respect to natural environments, including their value and belief systems and
past experiences (cf. Ulrich, 1983; Wohlwill, 1983; Kaplan & Kaplan, 1989). Obviously,
experiences can only influence people’s landscape preferences when they are somehow
Images, Values, and Landscape Preference
4
recorded in the brain. Psychologists refer to these mentally recorded experiences as
‘cognitions’, or symbolic representations of personal and/or socially shared experiences and
values. Cognitions are thought to act as broad and abstract layers through which initial,
affective responses to concrete environmental stimuli are filtered and interpreted (Wohlwill,
1983). To the extent that members of a group share the same cognitions, this filtering process
may explain differences in landscape preferences between groups from different sociocultural
backgrounds.
Thus, in the course of their lives, people develop an intricate and rich cognitive
structure that embodies their vision of what nature really is, and how it is related to humans.
According to environmental philosophers (Worster, 1985; Keulartz, Swart, & Van der Windt,
2000), such visions of nature can generally be classified along a continuum that ranges from
anthropocentric to ecocentric. People with an anthropocentric vision of nature tend to describe
and value nature in terms of it’s usefulness to humans. These people are likely to interpret a
high degree of human influence in natural landscapes in a positive manner, because a high
degree of human influence generally signifies a high level of usefulness to humans. People
with a more ecocentric vision of nature tend to describe and value nature in terms of it’s
intrinsic value. These people are likely to interpret a high degree of human influence in
natural landscapes in a more negative manner, because a high degree of human influence
often implies a low intrinsic value of the landscape, particularly when human interventions
are carried out without respect for plants and animals.
This paper presents the results of a first exploration of the relationships between
visions of nature and landscape preferences among groups of students from different
educational backgrounds (agriculture, biology, psychology). Visions of nature were studied
both in a descriptive sense, i.e., the vision of what nature is, and in a normative sense, i.e., the
vision of why nature is important and how people should treat nature. In the remainder of this
paper, these two types of visions of nature will be referred to as ‘images of nature’ and
‘environmental values’, respectively.
Images, Values, and Landscape Preference
5
Images of Nature
Images of nature can be defined as people’s general cognitions of what nature is (cf.
Kaplan, 1983). Thus far, empirical studies of images of nature have mostly relied on
preference judgments as an indirect means of measuring images of nature (e.g., Kaplan, 1985;
Kaplan & Kaplan, 1989; Strumse, 1996). Underlying this general practice is the assumption
that people’s affective responses toward a specific scene are guided by rapid cognitive
appraisals of the scene (Kaplan & Kaplan, 1982). Although this assumption may be true, it
should be pointed out that rapid, unconscious cognitive evaluations of a scene (perceptual
filters) are quite different from higher-order cognitive structures that represent people’s
conscious image of nature. Thus, it seems worthwhile to study images of nature and
preferences in their own right, and to gain more insight into possible relationships between
these two kinds of responses.
A number of studies have employed similarity or prototypicality ratings to investigate
images of nature independent from preference judgments (e.g., Fenton, 1985; Purcell, 1986,
1987, 1992). Using statistical techniques to uncover dimensions underlying people’s
similarity or prototypicality ratings, the results of these studies have consistently identified
human influence as an important underlying dimension. These findings are in agreement with
descriptive classifications of images of nature which have characterized these images in terms
of their position on a dimension ranging from untouched by humans to visibly influenced by
humans (e.g., Nature Conservation Council, 1993). Generally, people who perceive
landscapes that are visibly influenced by humans as typical examples of nature can be
described as having an anthropocentric nature image, while people who perceive landscapes
that seem untouched by humans as typical examples of nature can be described as having an
ecocentric image.
Images, Values, and Landscape Preference
6
Environmental Values
Environmental values can be defined as ethical-normative cognitions concerning the
value of nature and the relationship between humans and nature1. Analogous to images of
nature, environmental values are often classified according to their position on a dimension
ranging from anthropocentric to ecocentric (e.g., Catton & Dunlap, 1980). Individuals holding
anthropocentric environmental values view nature as subordinate to humans, who are seen as
rulers or managers of the natural world. Individuals holding ecocentric environmental values
regard nature as the most important reality, and view humans as only part of that reality.
In order to assess individual differences in environmental values, Dunlap & Van
Liere (1978) have developed the New Environmental Paradigm (NEP) scale. The NEP scale
was intended as a unidimensional measure of environmental values, with low scores
indicating anthropocentrism, and high scores indicating ecocentrism. The scale consists of
twelve items that cover three broad themes, i.e., humanity's ability to upset the balance of
nature, the existence of limits to growth for human societies, and the appropriate role of
humans relative to the rest of nature (for a description of items, see Van den Born, this
volume). Studies employing the NEP scale have revealed relationships between ecocentric
environmental values and a wide range of sociodemographic variables, including knowledge
of the environment and urban versus rural place of residence (Buttel, 1987; Arcury, 1990;
Arcury & Christianson, 1990). Although in recent years the dimensionality of the NEP scale
has been contested and a revised scale has been proposed (Strumse, 1996; Dunlap, Van Liere,
Merting & Jones, 2000), the original NEP scale continues to enjoy considerable popularity as
a unidimensional measure of individual differences in environmental values (Kaiser, Wölfing,
& Fuhrer, 1999; Schultz and Zelezny, 1999).
1 It may be noted that the concept of ‘environmental values’ as used in this paper is a combination of the concepts of ‘values of nature’ and ‘images of relationship’ as distinguished by Van den Born et al. (2001) and Van den Born (this volume).
Images, Values, and Landscape Preference
7
The Present Study and Hypotheses
Thus far, the links among images of nature, environmental values, and individual
differences in landscape preferences have received little empirical attention. The present
research aimed to fill this void. Students from three different educational disciplines
(agriculture, psychology, and biology), evaluated natural landscapes with varying degrees of
human influence on several dimensions, including scenic beauty and degree of human
influence. Separate measures of the students’ images of nature and environmental values were
obtained to investigate possible links between visions of nature and landscape preferences.
It was expected that students from different educational disciplines would differ in
their landscape preferences as well as in their images of nature and environmental values.
Students of agriculture, because of their interest in and expert knowledge of farming, were
expected to prefer natural landscapes with a high degree of human influence, and to have
relatively anthropocentric images of nature and environmental values (González Bernaldez &
Parra, 1979; Arcury & Christianson, 1990; Yu, 1995; Vogel, 1996). Biology students,
because of their interest in and expert knowledge of nature, were expected to prefer natural
landscapes with a low degree of human influence, and to have relatively ecocentric images of
nature and environmental values (e.g., Dearden, 1984; Kaplan & Herbert, 1987; Arcury,
1990). Psychology students were primarily included in the study as a control group, with few
distinctive characteristics as regards their landscape preferences and cognitions about nature.
In a more exploratory vein, the current study sought to examine the possible
mediational role of images of nature and environmental values in group differences in
preferences for natural landscapes. Thus, it was investigated whether group differences in the
preferred balance between spontaneous and human-influenced patterns in natural landscapes
could be explained by corresponding group differences in images of nature and environmental
values.
Images, Values, and Landscape Preference
8
Method
Participants
Participants were students from three different educational disciplines: 20 students of
a school for secondary vocational agricultural training (16 males and 4 females; mean age 20
years), 20 psychology students (14 males and 6 females; mean age 20 years) and 20 biology
students (13 males and 7 females; mean age 20 years). Both psychology and biology students
were undergraduates at the University of Groningen. One participant, a student of agriculture,
was excluded from the analyses because of missing values. Participants received 7 Euro for
taking part in the study.
Stimuli
The stimulus set consisted of 36 color slides drawn from an initial collection of 42
slides. A first criterion for the initial selection of slides was that these should represent the
different groups of natural landscapes as they can be found in The Netherlands. These groups
of landscapes are described in the handbook of target nature types in The Netherlands (Bal et
al., 1995; see also Ministry of Agriculture, Nature Management & Fisheries, 1996). In this
ecological handbook, natural landscapes are classified into four broad groups (the so-called
'target nature types') according to the intensity of nature management activities that are
required to maintain these landscapes: (a) 'approximately natural units', (b) 'guided natural
units', (c) 'semi-natural units', and (d) 'multifunctional units'. A second criterion was that the
slides should cover the major physical-geographical regions of The Netherlands, including
sandy areas, clay areas, river areas, and peat areas. A third criterion was that all slides should
have been photographed at eye-level; thus, slides depicting landscape details or bird's eye
views were not included. As a last criterion, none of the slides should depict intrusive signs of
human influence, such as buildings or farming machinery.
Each scene was classified by three ecologists (all experts on nature management) into
one of the four target nature types. These classifications were used to select a final set of 36
slides, consisting of 18 managed natural landscapes that were developed through active nature
Images, Values, and Landscape Preference
9
management strategies, such as fertilizing, grazing and ploughing (i.e., scenes classified as
'semi-natural' or 'multifunctional' by at least two experts, see Figure 1 for an example) and 18
unmanaged natural landscapes that had developed spontaneously without active human
intervention (i.e., scenes classified as 'approximately natural' or 'guided natural' by at least
two experts, see Figure 2 for an example). Agreement between the experts was adequate, with
Cramer's V coefficients ranging from .62 to .84.
Slide Ratings
All participants rated each of the 36 slides for beauty and a number of other
characteristics, including degree of human influence. Perceived degree of human influence
was assessed on two scales, one scale ranging from “not at all manicured” to “very
manicured”, and another scale ranging from “not at all rough” to “very rough”. Average
landscape ratings on these two scales were strongly negatively correlated, r = -.95, p < .001,
suggesting that the scales measure the same underlying dimension. Ratings on the
“manicured” scale were used as a measure of human influence in the analyses presented in
this paper2. All ratings were given on nine-points scales ranging from 1 = 'not at all' to 9 = 'a
great deal'. Each scene was presented as a 'landscape' plus index number.
Images of Nature and Environmental Values
After rating the slides, participants filled out several questionnaires, among which
were measures of images of nature and environmental values. Images of nature were assessed
using a methodology based on the work of Rosch and her colleagues on cognitive schemata
(Rosch & Mervis, 1975; see also Purcell, 1987). Participants judged 33 descriptions of
instances of nature according to their typicality for the category of 'nature'. The nature
instances represented eleven 'images of nature' listed by the Dutch Nature Conservation
2 We also analyzed the data reported in this paper using the roughness ratings as a measure of human influence. The results of these analyses were highly similar to the results of the analyses with the “manicured” ratings.
Images, Values, and Landscape Preference
10
Council on theoretical and experiential grounds (Nature Conservation Council, 1993).
Instructions were similar to the instructions used by Rosch & Mervis (1975, p. 588) and
Purcell (1987, p. 73). Participants were asked to rate the extent to which an instance
represented their idea or image of nature on scales ranging from 1 to 10. Scale extremes were
labeled 1 for 'worst example' and 10 for 'best possible example'. Table 1 below lists the final
selection of 25 of the 33 instances used.
Environmental values were assessed using a Dutch translation of the original 12-item
New Environmental Paradigm (NEP) scale by Dunlap and Van Liere (1978). Participants
were asked to indicate their agreement with each item on 5-point scales. The items were
coded so that high scores corresponded to high ecocentrism. The reliabilty of the scale was
adequate, Cronbach's Alpha = .78.
Procedure
All instructions and questions were presented on Apple MacIntosh computers. Each
session included three to six participants, who were each seated behind a computer. Slides
were projected on a screen in random order that remained the same across all sessions. Two
scenes classified as diffuse were used as filler slides at the beginning and the end of each
session to avoid start and end effects. The average time for completing the study was
approximately one hour.
Statistical Analysis
Data were analyzed using a combination of conventional statistical techniques, such
as analysis of variance, and a technique called ‘multilevel analysis’ that may be unknown to
most of our readers. We applied this latter technique because our research questions imply
interactions between perceiver characteristics (visions of nature) and landscape characteristics
(degree of human influence) in predicting landscape preferences. Standard statistical
techniques for analyzing landscape preferences, such as ordinary (OLS) regression analysis,
do not allow for the estimation of such 'cross-level' interactions (cf. Hull & Stuart, 1992).
Images, Values, and Landscape Preference
11
Multilevel analysis, however, permits the reliable estimation of the combined influences of
perceiver characteristics and landscape characteristics on landscape preferences (Bryk &
Raudenbusch, 1992). Generally, multilevel analysis provides better estimates in answer to
simple questions for which ordinary regression analysis is commonly used, and in addition
allows more complex questions to be addressed (see Van den Berg et al., 1998, for a detailed
description of the application of multilevel analysis to the study of landscape evaluation).
Results
Images of nature
Prototypicality judgments for 33 instances of nature were submitted to principal
components factor analysis with varimax rotation. A scree-plot indicated that the eigenvalues
started to level off after three factors. Thus, a three-factor solution yielded the best solution.
Factorial composition was determined by including all items with a factor loading greater
than .40 on a given factor. Table 1 provides an overview of the final three factors that resulted
from the factor analysis.
The first factor was named Useful Nature. It included nine items describing instances
of nature with a practical value to humans. Three of these items described instances of
agrarian nature, another three items described nature as an environment for undertaking
recreational activities, i.e., fishing, climbing, sailing, two items described instances of
domestic nature, and one item described a genetically modified organism. This factor
appeared to reflect and anthropocentric nature image.
The second factor was named Healthy Nature. It included eight items that described
instances of nature's (re)generative power and healing properties. This factor appeared to
reflect a mixture of anthropocentric and ecocentric images. On the one hand, it included
instances of nature with practical values to humans, i.e., 'a medicinal herb', on the other hand,
it included instances of nature with more intrinsic values, i.e., 'the biological growth of plants
and flowers'.
Images, Values, and Landscape Preference
12
The third factor was named Spontaneous Nature. It consisted of eight items
describing instances of spontaneous nature. One half of these instances represented rather
'innocent' forms of spontaneous nature, i.e., coastal flats, a forest in autumn colors, a
primeaval forest and a meadow bird, while the other half represented forms of spontaneous
nature that are potentially harmful to humans, i.e., a dark, impenetrable forest, a river that
overflows its banks, a swirling sea and coming face to face with wild animals. This factor
appeared to reflect an ecocentric nature image.
Scores on the Useful Nature factor were significantly negatively correlated with NEP
scores, r = -.58 p < .001, while scores on the Spontaneous Nature factor were significantly
positively correlated with NEP scores, r = .30, p < .05. Scores on the Healthy Nature factor
were not correlated with NEP scores, r = -.06, p > .65. As the NEP scale is assumed to
measure environmental values on a dimension ranging from anthropocentric to ecocentric,
these findings support the interpretation of Useful Nature and Spontaneous Nature as,
respectively, an anthropocentric and an ecocentric nature-image factor.
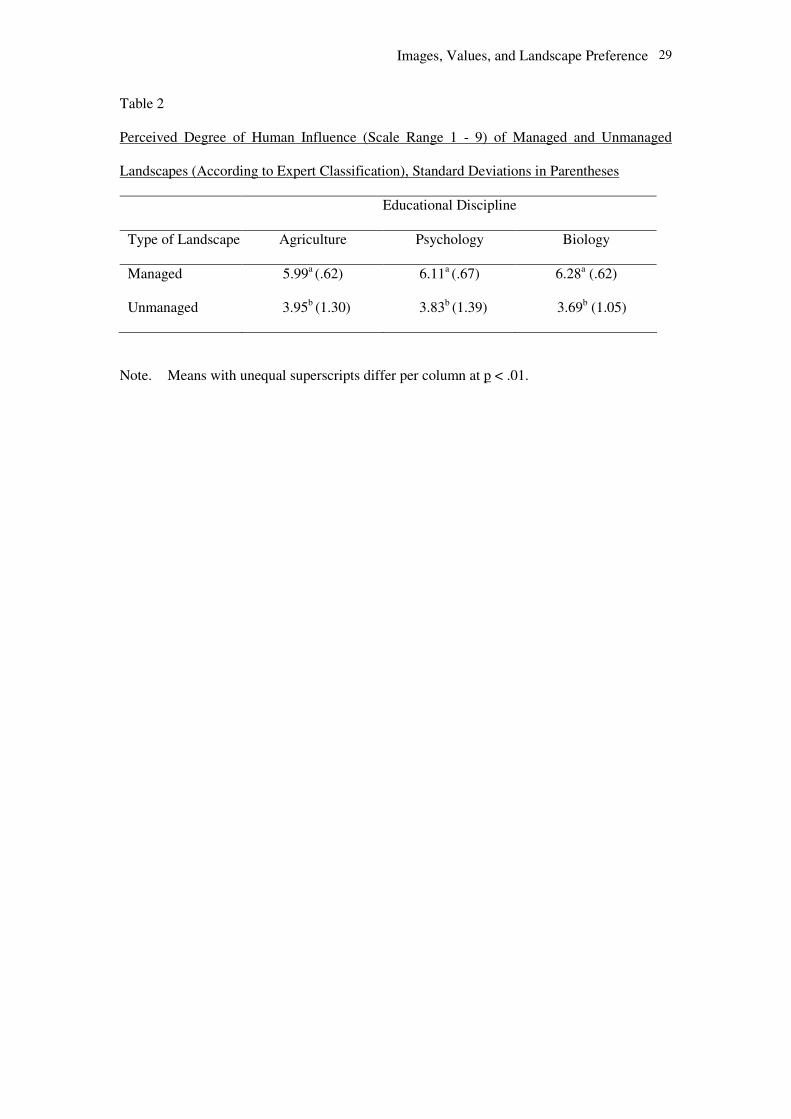
Perceived Degree of Human Influence
We first checked whether participants’ ratings of perceived degree of human
influence agreed with the expert’s classifications. Table 2 shows that participants perceived
the subset of landscapes that were classified as ‘managed’ by the experts as more human-
influenced than the subset of landscapes classified as ‘unmanaged’3. To examine the influence
of educational discipline on ratings of human influence, ratings of human influence were
subjected to a 2 (Landscape Type: Managed versus Unmanaged) x 3 (Educational Discipline:
Agriculture, Psychology, Biology) mixed MANOVA with repeated measures on the first
factor. This analysis revealed that educational discipline did not significantly affect ratings
directly, nor in interaction with Landscape Type. In other words, the foregoing analyses
revealed that ratings of perceived human influence were sensitive to expert-rated differences
3 F (1, 56) = 183.71, p < .001.
Images, Values, and Landscape Preference
13
in nature management strategies among the landscapes, and did not differ across participants
from different educational disciplines.
Group Differences in Landscape Preferences
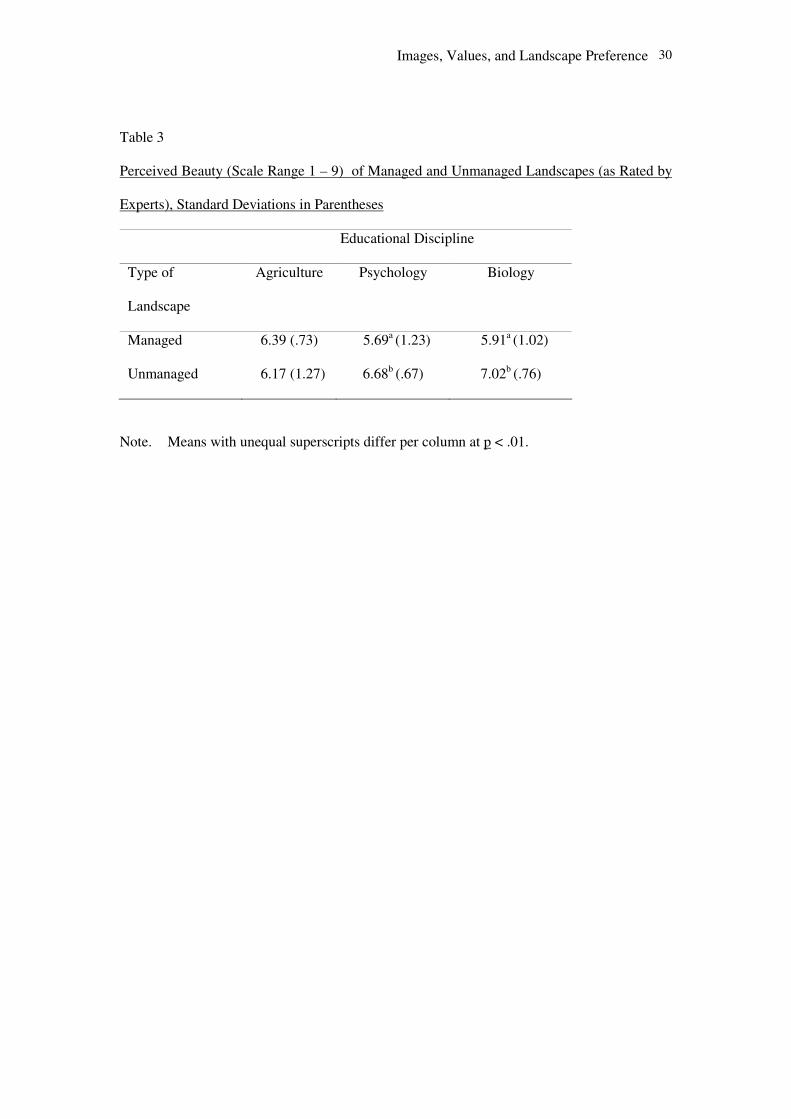
Table 3 provides an overview of the mean beauty ratings for the two subsets of
managed and unmanaged natural landscapes in each of the three disciplinary groups.
Inspection of Table 3 shows that students of agriculture rated managed and unmanaged
natural landscapes about equally beautiful, while psychology and biology students rated
unmanaged natural landscapes significantly more beautiful than managed natural landscapes.
These results provide some preliminary support for the hypothesis that students from different
educational disciplines would differ in their preferred degree of spontaneous to human-
influenced patterns in natural landscapes.
To obtain a more precise estimate of the preferred degree of spontaneous to human-
influenced patterns in natural landscapes among participants from the three educational
disciplines, individual beauty ratings were regressed on the mean ratings of degree of human
influence for each landscape. This approach is more appropriate than comparing the mean
preferences for the two subsets of managed and unmanaged natural landscapes, because it
uses the complete range of variation in perceptions of degree of human influence to predict
individual beauty ratings. To control for dependencies in the data due to the fact that beauty
ratings were nested within individuals, regression analyses were performed with the
multilevel program MLn (Woodhouse, 1995). In Mln, a basic two-level regression model was
specified with the individual beauty ratings as the dependent variable. Starting from this basic
model, participants' mean ratings of degree of human influence for each landscape, and
interactions between this variable and educational discipline, images of nature, and
environmental values, were added and tested.
Images, Values, and Landscape Preference
14
On average, perceived degree of human influence was found to be negatively related
to perceived landscape beauty4. However, inspection of the random part of the model revealed
that there was a substantial amount of between-individual variation in this relationship5. To
investigate the role of educational discipline in this variation, dummy variables representing
the effects of educational discipline, and product terms representing the interaction between
these variables and perceived degree of human influence were added to the model. Results of
this analysis revealed a significant interaction effect between educational discipline and
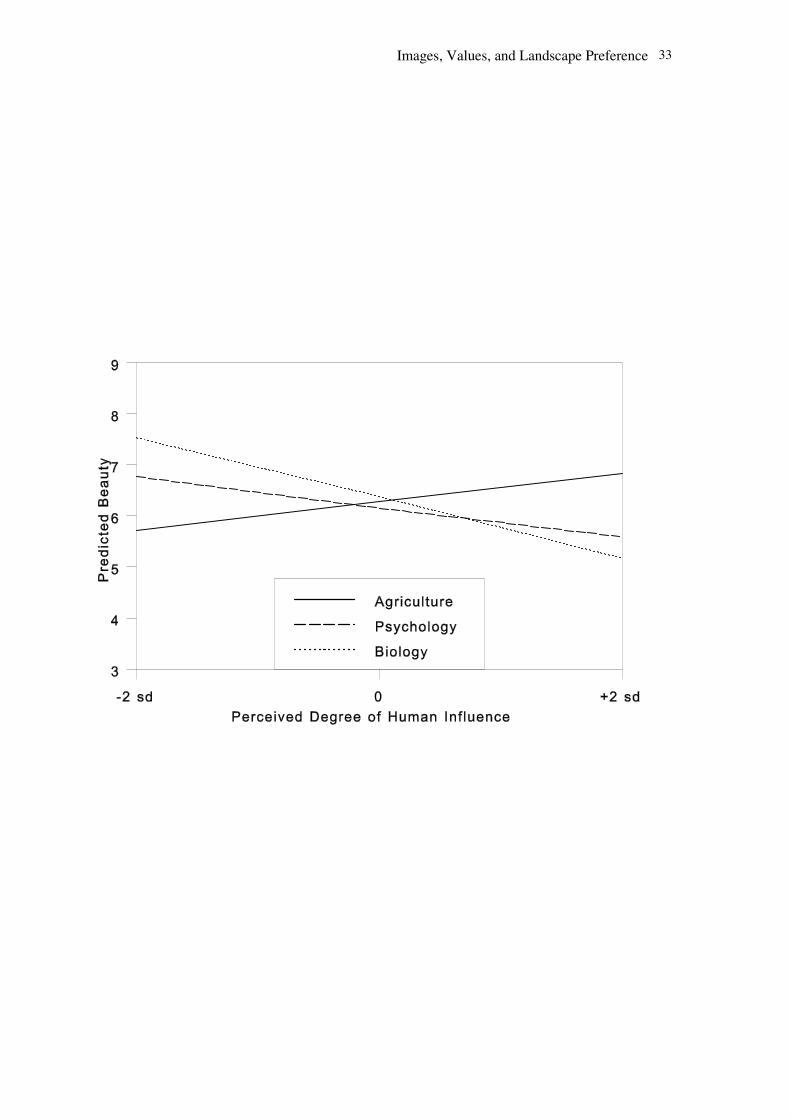
perceived degree of human influence on perceived landscape beauty6. To aid in the
interpretation of this interaction effect, predicted beauty ratings were generated for
participants from each educational discipline using values of 2 standard deviations above and
below the mean to represent high and low degrees of perceived human influence. Inspection
of these predicted beauty ratings in Figure 3 shows that, as expected, perceived degree of
human influence was positively related to beauty ratings of students of agriculture, while it
was negatively related to beauty ratings of psychology and biology students.
Univariately, students of agriculture differed significantly from both psychology and
biology students in the relationship between perceived degree of human influence and
perceived landscape beauty. The difference between psychology and biology students in the
relationship between perceived degree of human influence and perceived landscape beauty
was only marginally significant.
Group Differences in Images of Nature and Environmental Values
To test for group differences in images of nature and environmental values,
individuals' mean prototypicality scores for the three nature-image factors and their mean
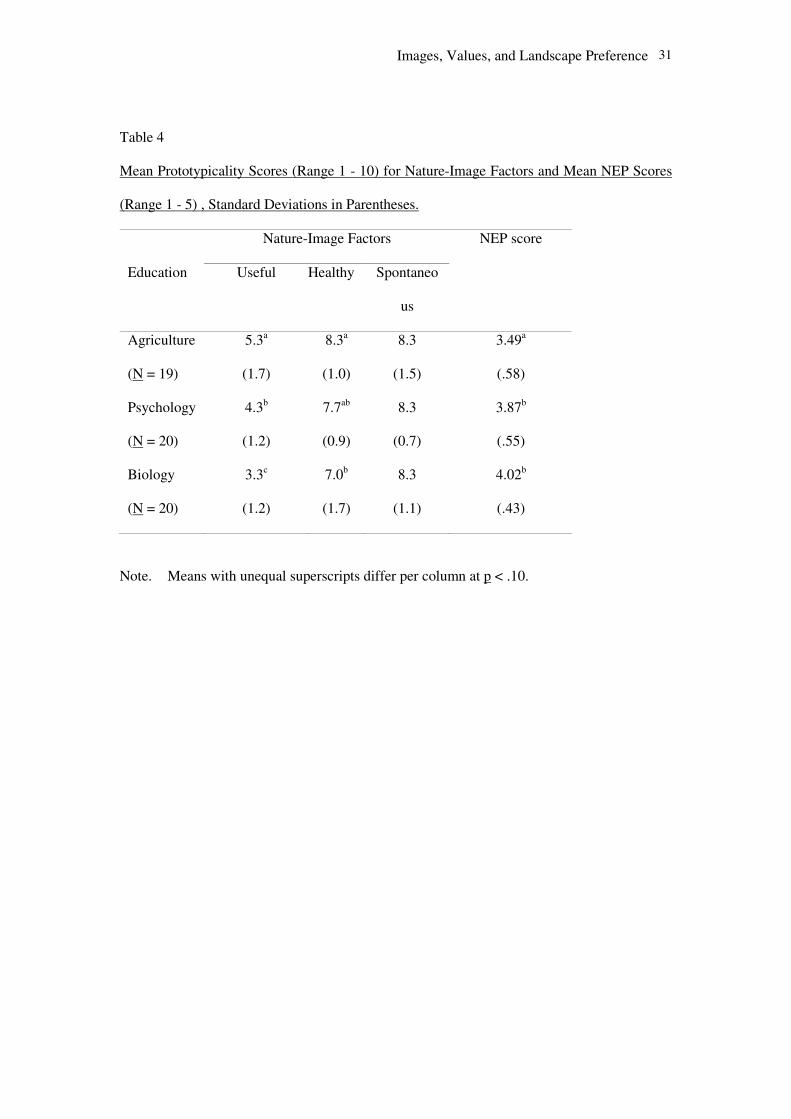
NEP scores were computed and summarized to group level. As can be seen in Table 4,
participants from all three educational disciplines rated instances of Spontaneous and Healthy
Nature as more typical than instances of Useful Nature. This indicates that images of nature
4 ß = -.16, χ2(1) = 6.20, p < .05 5 σ2 = .18, χ2(2) = 138.36, p < .001
Images, Values, and Landscape Preference
15
were generally ecocentric rather than anthropocentric. As expected, students of agriculture
gave reliably higher prototypicality ratings to instances of Useful Nature than did participants
from nonagricultural disciplines. Biology students, as compared to psychology students and
students of agriculture, gave reliably lower prototypicality ratings to instances of Useful
Nature. Except for the finding that students of agriculture gave higher prototypicality ratings
to instances of Healthy Nature than did biology students, no group differences were found for
the Healthy and Spontaneous nature-image factors.
Mean NEP scores were above the scale midpoint, indicating that, on average,
participants from each group tended to have ecocentric environmental values. Mean NEP
scores were significantly lower for students of agriculture than for psychology and biology
students. Although mean NEP scores seemed to be higher for biology students than for
psychology students, this difference did not reach significance. Thus, the predictions
concerning group differences in images of nature and environmental values were partially
supported.
Relations between Visions of Nature and Landscape Preferences
To study relations between visions of nature and landscape preferences, participants'
scores on the Useful, Healthy, and Spontaneous nature-image factors and the NEP scale, as
well as product terms representing the interactions between these variables and degree of
human influence, were simultaneously added to the basic multilevel model. Results of this
analysis showed that only the scores on the Useful nature-image factor were significantly
related to landscape preferences7. As expected, beauty ratings of participants with high scores
on the Useful nature-image factor were positively related to perceived human influence, while
beauty ratings of participants with low scores on the Useful nature-image factor were
negatively related to perceived human influence. Scores on the Healthy and Spontaneous
6 χ2(2) = 21.07, p < .001 7 χ2(1) = 6.36, p < .05
Images, Values, and Landscape Preference
16
nature-image factors, and scores on the NEP scale, were not significantly related to landscape
preferences.
Mediational Analyses
Up to this point, our analyses have revealed (a) differences between the three student
groups in the relationship between perceived landscape beauty and perceived human
influence, (b) differences between the three groups in their scores on the Useful and Healthy
nature-images factors and the NEP scale, and (c) relationships between scores on the Useful
nature-image factor and landscape preferences. Thus, it appears that scores on the Useful
nature-image factor qualify as a potential mediator of the group differences in the relationship
between perceived landscape beauty and perceived human influence. Scores on the other two
nature-image factors and the NEP scale do not qualify as potential mediators because they are
not related to landscape preferences (cf. Baron & Kenny, 1986; Kenny, Kashy & Bolger,
1998; see also Van den Berg, Koole, & Van der Wulp, in press, for a more detailed
explanation of mediational analysis).
Tot test for mediation, the effects of the Useful nature-image factor on the
relationship between degree of human influence and landscape beauty were estimated in one
multilevel model together with the effects of educational discipline on this relationship.
Results of this analysis showed that scores on the Useful nature-image factor did not
significantly influence the relationship between degree of human influence and landscape
beauty when the influence of educational discipline on this relationship was statistically
controlled for. At the same time, the effect of educational discipline on the relationship
perceived degree of human influence and landscape beauty remained highly significant when
it was estimated while controlling for the influence of the Useful nature-image factor8. Taken
together, the current findings suggest that images of nature and environmental values cannot
8 χ2(2) = 12.97, p < .01
Images, Values, and Landscape Preference
17
provide an explanation for the group differences in the appreciation of human influence in
natural landscapes.
Discussion
The present study explored systematic differences in images of nature, environmental
values, and landscape preferences among students from different educational disciplines. As
expected, students of agriculture preferred natural landscapes with a high degree of human
influence, while psychology and biology students preferred natural landscapes with a low
degree of human influence. These results provider further evidence that perceived degree of
human influence plays a key role in the occurrence of group differences in landscape
preferences (e.g., González Bernaldez & Parra, 1979; Schroeder, 1983; Dearden, 1984;
Fenton, 1985; Kaplan & Herbert, 1987; Orland, 1988; Van den Berg et al.,1998).
An important objective of the present research was to measure group differences in
images of nature. Participants were asked to rate the prototypicality of verbal descriptions of
instances of nature with varying degrees of human influence. Subsequent factor analyses on
these prototypicality ratings uncovered three nature-image factors. One factor, labeled Useful
Nature, corresponded to an anthropocentric image of nature, another factor, labeled
Spontaneous Nature, corresponded to an ecocentric image of nature, and a third factor,
labeled Healthy Nature, appeared to reflect healing and regenerative properties of nature.
Participants from all three educational disciplines rated instances of Spontaneous
Nature as more typical examples of nature than instances of Useful Nature. This suggests that
participants' images of nature were generally more ecocentric than anthropocentric. As
expected, there were differences in images of nature among participants from different
educational disciplines. Students of agriculture rated instances of Useful Nature as relatively
typical examples of nature, while students of psychology and biology rated instances of
Useful Nature as relatively atypical examples of nature. This finding suggest that students of
agriculture have broader and more anthropocentric images of nature than students from
nonagricultural disciplines. There were also some differences in images of nature between
Images, Values, and Landscape Preference
18
biology students and the two other groups. Most importantly, biology students perceived
instances of Useful Nature and Healthy Nature as less typical examples of nature than the
other groups did. These results are consistent with findings of previous studies, in which
environmental knowledge has generally been found to be positively associated with an
ecocentric vision of nature (Arcury 1990)
A further objective of the present research was to investigate group differences in
environmental values. Environmental values were measured by means of the NEP scale
(Dunlap & Van Liere, 1978). Like images of nature, participants' environmental values were
generally more ecocentric than anthropocentric. This finding is consistent with sociological
analyses which have argued that the ecocentric view of nature as measured by the New
Environmental Paradigm has become the dominant belief system in Western societies (Catton
& Dunlap, 1980). As expected, students of agriculture displayed less ecocentric
environmental values than psychology and biology students.
Images of nature and environmental values did not have any explanatory power with
regard to group differences in the relationship between perceived landscape beauty and
perceived human influence. More specifically, Spontaneous Nature did not qualify as a
mediator, because there were no group differences in the perceived typicality of this nature-
image factor. Healthy Nature and the NEP scale also did not qualify as mediators, because
they were not related to landscape preferences. Useful Nature qualified as a potential
mediator, because perceived typicality of this nature-image factor differed across educational
groups, and was systematically related to landscape preferences. However, mediational
analyses showed that differences in landscape preferences between students of agriculture and
the other two groups could not be explained by differences in perceived typicality of Useful
Nature between these groups. In sum, our hypothesis that group differences in the preferred
balance between spontaneous and human-influenced patterns in natural landscapes could be
explained by group differences in visions of nature was not confirmed by the data.
It is possible that the lack of explanatory power visions of nature was caused by
measurement error, as there was little variation in ecocentrism in the present research; even
Images, Values, and Landscape Preference
19
the students of agriculture scored relatively high on our measures of images of nature and
environmental values. As several authors have pointed out, acceptance of ecocentric ideas
may have become so widespread that new measures are needed to capture more subtle
differences in people's cognitions regarding the relationship between humans and nature (e.g.,
Gooch, 1995; Scott & Willits, 1994). Thus, the finding that group differences in the
relationship between perceived landscape beauty and perceived human influence were not
mediated by visions of nature could be the result of errors in our quantitative measures of
visions of nature.
Alternatively, it could be that group differences in the relationship between perceived
landscape beauty and perceived human influence are mediated by other, non-cognitive,
psychological processes. In particular, these differences may reflect the influence of more
affective processes, such as people’s motivational orientations (Koole & Van den Berg,
2002). According to a motivational explanation, people who are guided by defensive motives
may prefer nature that is more visibly controlled by humans, because it provides better
possibilities for safety and protection. Conversely, people who are guided by expansive (i.e.,
growth oriented) motives may prefer nature that is untouched by humans, because it provides
better possibilities for personal growth and development. In the present study, students of
agriculture were probably more driven by defensive motives than biologists and psychology
students, because of their (family’s) greater dependency on the natural environment as a main
source of income. Therefore, a motivational explanation may also be relevant to the group
differences in landscape preferences found in the present study. Future studies may further
explore the relative explanatory power of cognitions and motivations with respect to group
differences in preferences for natural landscapes with varying degrees of human influence.
Results of the present study extend the results of a previous field study by Van den
Berg et al. (1998). Because of differences in participants and procedures, results are difficult
to compare across studies. Nevertheless, one interesting discrepancy deserves mention.
Farmers included in the field study displayed a much stronger dislike of unmanaged natural
landscapes than the students of agriculture in the present study. This may be due to
Images, Values, and Landscape Preference
20
differences in the stimulus material, or to differences in participant characteristics, such as the
fact that students of agriculture were younger, and had less experience with rural landscapes
than the farmers in the field study. Alternatively, farmers' judgments in the field study may
have been influenced by the planned-change context in which the study was conducted. More
specifically, the farmers in the field study may have perceived the natural landscapes as a
threat to the status quo, which may have reduced their beauty judgments. Consistent with this
interpretation, Van den Berg & Vlek (1998) have found evidence that unmanaged nature
scenes are rated less beautiful when they are presented as planned changes in an agricultural
area, than when they are presented as existing landscapes. For a further discussion of
contextuality, see Davies (this volume).
The present findings have several practical implications. First, the results indicate that
group differences in the preferred degree of human influence in natural landscapes can be
found even when the landscapes under evaluation do not represent planned changes. This
suggests that such differences cannot be entirely attributed to consequences of the planned-
change context, such as “resistance to change”. Furthermore, the finding that group
differences in landscape preferences were not mediated by cognitive images and values
suggests that persuasion attempts aimed at changing people's abstract images and nature
values may not automatically change their preferences for concrete natural landscapes.
Finally, the finding that students of agriculture tended to have broader images of nature than
did students from nonagricultural disciplines may have important implications with regard to
policy strategies for increasing the natural values of agricultural areas by means of nature
development (cf. Ministry of Agriculture, Nature Management and Fisheries of The Nether-
lands, 1996). Especially farmers may question the usefulness of such strategies, because, in
their conceptions, the existing agrarian landscape already is sufficiently natural (cf. Nassauer,
1997). Thus, in addition to their aesthetic preferences, farmers' broader images of nature may
constitute another source of negative responses to nature development plans.
Images, Values, and Landscape Preference
21
References
Arcury, T.A. (1990). Environmental attitude and environmental knowledge. Human
Organization, 49, 300-304.
Arcury, T.A. & Christianson, E.H. (1990). Environmental worldview in response to
environmental problems. Environment and Behavior, 22, 387-407.
Bal, D., Beije, H.M., Hoogeveen, Y.R., Jansen, S.R.J. & van der Reest, P.J. (1996). Handboek
natuurdoeltypen in Nederland (The handbook of nature target types in the Netherlands).
Wageningen: IKC Natuurbeheer (with English summary).
Baron, R.M. & Kenny, D.A. (1986). The moderator-mediatior variable distinction in social
psychological research: Conceptual, strategic and statistical considerations. Journal of
Personality and Social Psychology, 51, 1173-182.
Bryk, A.S. & Raudenbush, S.W. (1992). Hierarchical linear models: applications and data
analysis. London: Sage Publications.
Buttel, F.H. (1987). New directions in environmental sociology. Annual Review of
Sociology, 13, 465-488.
Catton, W.R., & Dunlap, R.E. (1980). A new ecological paradigm for post-exuberant
sociology. American Behavioral Scientist, 24, 15-47.
Davies (this volume)…………………….
Images, Values, and Landscape Preference
22
Dearden, P. (1984). Factors influencing landscape preferences: an empirical investigation.
Landscape Planning, 11, 293-306.
Dunlap, R.E. & Van Liere, K.D. (1978). The 'New Environmental Paradigm': a proposed
measuring instrument and preliminary results. Journal of Environmental Education, 9, 10-19.
Dunlap, R.E., Van Liere, K.D., Mertig, A.G., & Jones, R.E. (2000). Measuring Endorsement
of the New Ecological Paradigm: A Revised NEP Scale. Journal of Social Issues, 56 425-
442.
Eisenberg, E. (1998). The ecology of Eden: An inquiry into the dream of paradise and a new
vision of our role in nature. New York: Random House.
Fenton, D.M. (1985). Dimensions of meaning in the perception of natural settings and their
relationship to aesthetic response. Australian Journal of Psychology, 37, 325-339.
González Bernaldez, F. & Parra, F. (1979). Dimensions of landscape preferences from
pairwise comparisons. In: G.H. Elsner & R.D. Smardon (Eds.). Proceedings of our national
landscape. A conference on applied techniques for analysis and management of the visual
resource. Gen.Tech. Report PSW-35. Berkeley, California: USDA Forest Service.
Gooch, G.D. (1995). Environmental beliefs and attitudes in Sweden and the Baltic States.
Environment and Behavior, 27, 513-539.
Hull, R.B. & Stewart, W.P. (1992). Validity of photo-based scenic beauty judgments. Journal
of Environmental Psychology, 12, 101-114.
Images, Values, and Landscape Preference
23
Kaiser, F.G., Wölfing, S., & Fuhrer, U. (1999). Environmental attitude and ecological
behaviour. Journal of Environmental Psychology 19, 1-19.
Kaplan, R. (1985). The analysis of perception via preference: a strategy for studying how the
environment is experienced. Landscape Planning, 12, 161-176.
Kaplan, R., & Herbert, E.J. (1987). Cultural and subcultural comparisons in preference for
natural settings. Landscape and Urban Planning, 12, 161-176.
Kaplan, S. (1983). A model of person-environment compatibility. Environment and Behavior,
15, 311-332.
Kaplan, S., & Kaplan, R. (1982). Cognition and environment: Functioning in an uncertain
world. New York: Praeger.
Kaplan, S. & Kaplan, R. (1989). The experience of nature: a psychological perspective. New
York: Cambridge University Press.
Kenny, D.A., Kashy, D.A. & Bolger, N. (1998). Data analysis in social psychology. In: D.
Gilbert, S.T. Fiske, & G. Lindzey (Eds.), Handbook of social psychology (4th ed., Vol. 1, pp.
233-265). New York: McGraw-Hill.
Keulartz, J., Swart, S., & Windt, H. van de (2000). Natuurbeelden en natuurbeleid:
Theoretische en empirische Verkenningen. Den Haag: NWO
Images, Values, and Landscape Preference
24
Koole, S.L., & Van den Berg, A.E. (2002). Lost in the wilderness: Terror management, desire
for control, and evaluations of nature. Manuscript submitted to The Journal of Personality and
Social Psychology.
Lemaire (1970). Filosofie van het landschap [Philosophy of the landscape]. Baarn, The
Netherlands: Ambo.
Ministry of Agriculture, Nature Management and Fisheries of The Netherlands (1996). Nature
conservation policy in The Netherlands: objectives, methods and results. Wageningen:
National Reference Centre for Nature Management.
Nash, R. (1973). Wilderness and the American mind. New Haven, CT: Yale University Press.
Nassauer, J.I., Ed. (1997). Placing nature: Culture and landsape ecology. Washington D.C.:
Island Press.
Nature Conservation Council of The Netherlands (1993). Natuur tussen de oren: natuur- en
landschapsbeelden en hun rol bij de ontwikkeling en vormgeving van beleid. Utrecht:
Natuurbeschermingsraad (with summary in English).
Orland, B. (1988). Aesthetic preference for rural landscapes: some resident and visitor
differences. In: J. Nasar (Ed.). Environmental aesthetics: theory, research, and applications
(pp. 364-378). New York: Cambridge University Press.
Purcell, A.T. (1986). Environmental perception and affect: a schema discrepancy model.
Environment and Behavior, 18, 3-30.
Images, Values, and Landscape Preference
25
Purcell, A.T. (1987). Landscape perception, preference, and schema discrepancy.
Environment and Planning B: Planning and Design, 14, 67-92.
Purcell, A.T. (1992). Abstract and specific physical attributes and the experience of
landscape. Journal of Environmental Management, 34, 159-177.
Rosch, E. & Mervis, C.B. (1975). Family resemblances: Studies in the internal structure of
categories. Cognitive Psychology, 7, 573-605.
Schama, S. (1995). Landscape and memory. London: HarperCollins.
Schroeder, H.W. (1983). Variations in the perception of urban forest recreation sites. Leisure
Sciences, 5, 221-230.
Schultz, P. W., & Zelezny, L. (1999). Values as predictors of environmental attitudes: evidence
for consistency across 14 countries. Journal of Environmental Psychology,19, 255-265.
Scott, D. & Willits, F.K. (1994). Environmental attitudes and behavior: Pennsylvania study.
Environment and Behavior, 26, 239-260.
Strumse, E. (1996). The psychology of aesthetics: explaining visual preferences for agrarian
landscapes in Western Norway. Dissertation. Bergen: University of Bergen.
Tuan, Y. (1974). Topophilia: a study of environmental perception, attitudes, and values. New
Jersey: Englewood Cliffs.
Images, Values, and Landscape Preference
26
Ulrich, R.S. (1983). Aesthetic and affective response to natural environment. In: I. Altman
and J.F. Wohlwill (Eds.), Human behavior and environment: advances in theory and research.
Vol. 6 (pp. 85-125). New York: Plenum Press.
Van den Berg, A.E. (1999). Individual differences in the aesthetic evaluation of natural
landscapes. Dissertation. Groningen: University of Groningen.
Van den Berg, A.E., & Vlek, C.A.J. (1998). The influence of planned-change context on the
evaluation of natural landscapes. Landscape and Urban Planning, 43, 1-10.
Van den Berg, A.E., Koole, S.L., & Van der Wulp, N.Y. (in press). Environmental preference
and restoration: (How) are they related? Journal of Environmental Psychology.
Van den Berg, A.E., Vlek, C.A.J. & Coeterier, J.F. (1998). Group differences in the aesthetic
evaluation of nature development plans: a multilevel approach. Journal of Environmental
Psychology, 18, 141-157
Van den Born (this volume) …………
Van den Born, R.J.G., Lenders, R.H.J., de Groot, W.T., Huijsman, E. (2001). The New
Biophilia: An exploration of visions of nature in Western Countries. Environmental
Conservation, 28, 65-75.
Vogel, S. (1996). Farmers' environmental attitudes and behavior. Environment and Behavior, 28,
591-613.
Images, Values, and Landscape Preference
27
Wohlwill, J.F. (1983). The concept of nature: a psychologist's view. In: I. Altman and J.F.
Wohlwill (Eds.), Human behavior and environment: advances in theory and research. Vol. 6
(pp. 5-37). New York: Plenum Press.
Woodhouse, G. (Ed.). (1995). A guide to MLn for new users. London: Institute of Education,
University of London.
Worster, D. (1985). Nature's economy. A history of ecological ideas. Cambridge: Cambridge
University Press.
Yu, K. (1995). Cultural variations in landscape preference: Comparisons among Chinese sub-
groups and Western design experts. Landscape and Urban Planning, 32, 107-126.

Images, Values, and Landscape Preference
28
Table 1
Results of Factor Analysis of Prototypicality Ratings of Instances of Nature (N=59)
Nature-Image Factors
Useful Healthy Spontaneous
a field with grain and vegetables
wind and water for the sailor
a meadow with cattle
a dog or cat as a pet
the waterside with a fisherman's spot
a mountain slope for a mountaineer
plants on the windowsill
a tree nursery with pines and poplars
a genetically modified organism
.84
.80
.78
.74
.69
.65
.55
.55
.42
natural decomposition of materials
the biological growth of plants and flowers
natural purification of the air
a bird's nest
mist above a field
the healthy smell of woods
the natural cycle of nature
a medicinal herb
.84
.78
.77
.65
.60
.60
.54
.53
flats and/or a sand bar
a dark, impenetrable forest
a forest in autumn colors
a primeaval forest
a river that overflows its banks
a swirling sea
encountering wild animals
a rare meadow bird
85
.74
.69
.62
.57
.52
.45
.42
Explained Variance 22.9 16.9 9.0
Note. The results shown are the results of a rotated factor solution, using Varimax rotations.
The number of factors was constrained to three. Only items with factor loadings
greater than .40 are included.
Images, Values, and Landscape Preference
29
Table 2
Perceived Degree of Human Influence (Scale Range 1 - 9) of Managed and Unmanaged
Landscapes (According to Expert Classification), Standard Deviations in Parentheses
Educational Discipline
Type of Landscape Agriculture Psychology Biology
Managed 5.99a (.62) 6.11a (.67) 6.28a (.62)
Unmanaged 3.95b (1.30) 3.83b (1.39) 3.69b (1.05)
Note. Means with unequal superscripts differ per column at p < .01.
Images, Values, and Landscape Preference
30
Table 3
Perceived Beauty (Scale Range 1 – 9) of Managed and Unmanaged Landscapes (as Rated by
Experts), Standard Deviations in Parentheses
Educational Discipline
Type of
Landscape
Agriculture Psychology Biology
Managed 6.39 (.73) 5.69a (1.23) 5.91a (1.02)
Unmanaged 6.17 (1.27) 6.68b (.67) 7.02b (.76)
Note. Means with unequal superscripts differ per column at p < .01.
Images, Values, and Landscape Preference
31
Table 4
Mean Prototypicality Scores (Range 1 - 10) for Nature-Image Factors and Mean NEP Scores
(Range 1 - 5) , Standard Deviations in Parentheses.
Nature-Image Factors NEP score
Education Useful Healthy Spontaneo
us
Agriculture
(N = 19)
Psychology
(N = 20)
Biology
(N = 20)
5.3a
(1.7)
4.3b
(1.2)
3.3c
(1.2)
8.3a
(1.0)
7.7ab
(0.9)
7.0b
(1.7)
8.3
(1.5)
8.3
(0.7)
8.3
(1.1)
3.49a
(.58)
3.87b
(.55)
4.02b
(.43)
Note. Means with unequal superscripts differ per column at p < .10.

Images, Values, and Landscape Preference
32
Figure Caption
Figure 1 Example of natural landscape with high degree of human influence.
Figure 2. Example of natural landscape with low degree of human influence.
Figure 3. Relationships between perceived degree of human influence and perceived
landscape beauty in the three student groups
Images, Values, and Landscape Preference
33

Images, Values, and Landscape Preference
34


