Hydro Electric Power (Hydel Power)
Operating Principle
Hydro-electric power is generated by the flow of water through turbine, turning the blades of the turbine.
A generator shaft connected to this turbine also turns and hence generates electricity.
Hydro Electric Power (Hydel Power)-1
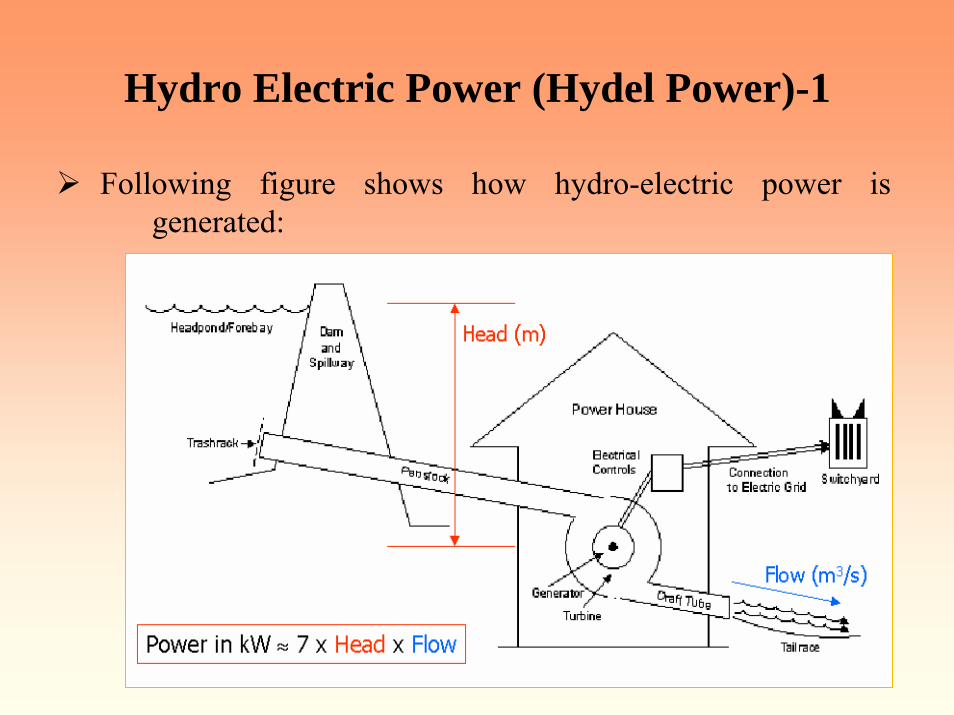
Following figure shows how hydro-electric power is generated:
Hydro Electric Power (Hydel Power)-2
The main components of a hydel power plant are:
Dam/Reservoir/Large buffer tank
Penstock
Power House
a) Turbines
b) Generators
c) Step-up Transformers
Hydro Electric Power (Hydel Power)-3
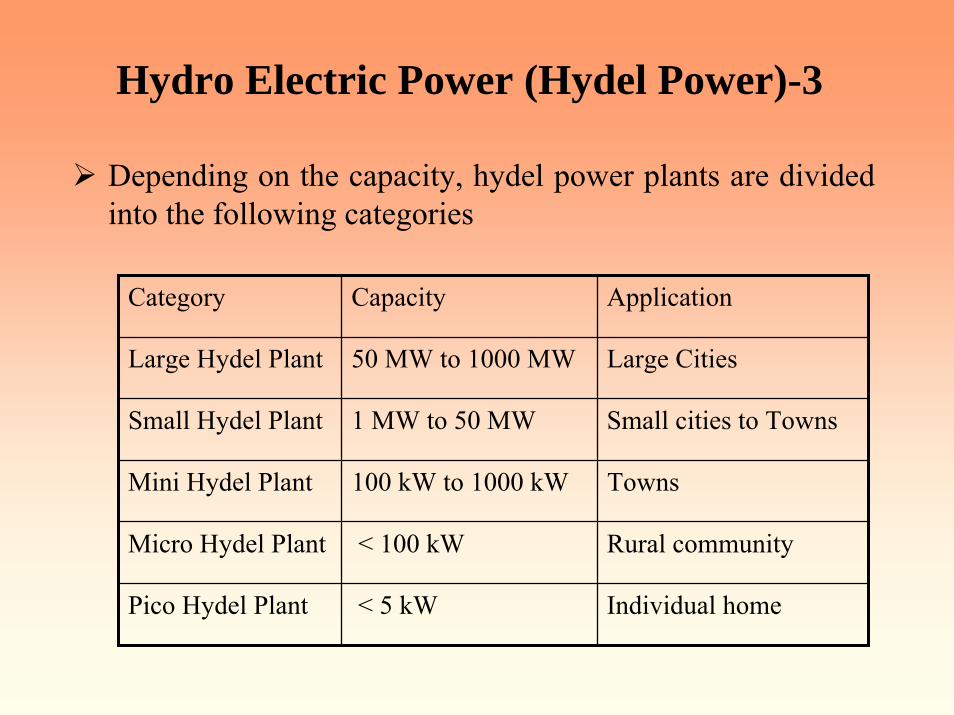
Depending on the capacity, hydel power plants are divided into the following categories
Category Capacity Application
Large Hydel Plant 50 MW to 1000 MW Large Cities
Small Hydel Plant 1 MW to 50 MW Small cities to Towns
Mini Hydel Plant 100 kW to 1000 kW Towns
Micro Hydel Plant < 100 kW Rural community
Pico Hydel Plant < 5 kW Individual home

Hydro Electric Power (Hydel Power)-4
Hydel plants have an efficiency of 75%. The power delivered is given by the following expression:
dtdQHDeliveredPower ⋅⋅= 7_ Kilo watts, where
H = Head in meters
DQ/dt = Rate of discharge in m3/s.
In the figure we see that the turbine is coupled to a generator for generating electrical power. The generator can be of any of the following types:

Hydro Electric Power (Hydel Power)-5
Permanent magnet DC generator (PMDC)Alternator (Synchronous Generator)Induction GeneratorSynchronous reluctance GeneratorTo select the best among the listed options, we need to know the requirement of a generator. Following list gives the requirement:
Rugged and easy to maintainSimple to fabricateHigh efficiencyFail safe or “should not fail at all”.

Hydro Electric Power (Hydel Power)-6Sinusoidal outputGood voltage regulationCost effective for given powerEase of servicing/operationSafetyReliabilityWhen we try to match the requirements to the types of generators, Induction generator fits the bill better than others and hence, this is the type normally used for power generation. The only drawback with induction generators is its poor voltage regulation. To improve the voltage regulation, normally load governors are used in parallel to the actual load.
Hydraulic Energy
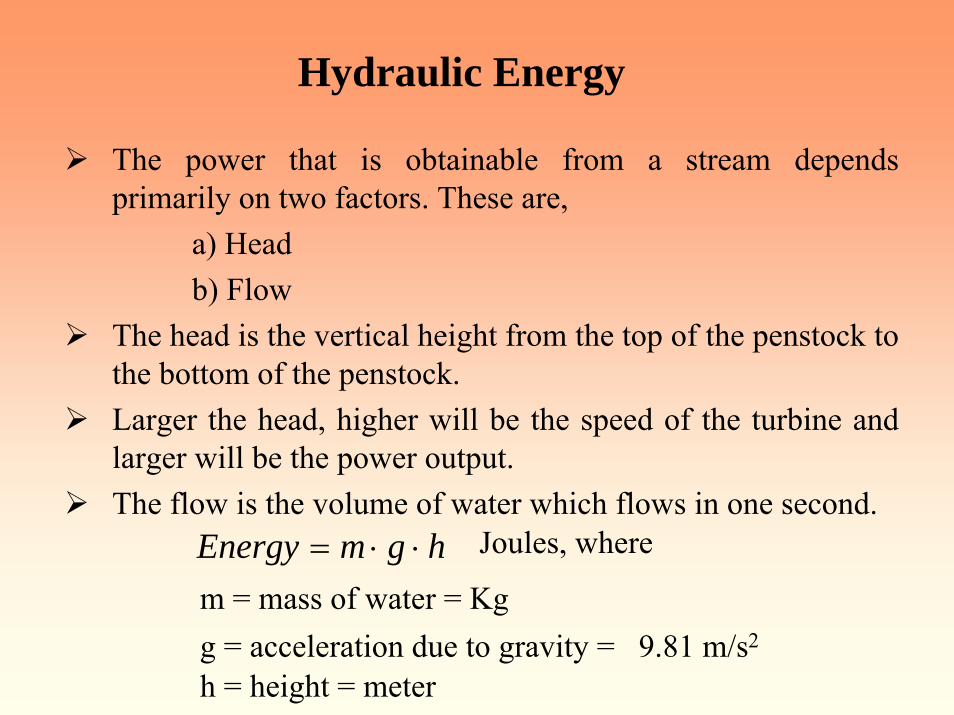
The power that is obtainable from a stream depends primarily on two factors. These are,
a) Head b) Flow
The head is the vertical height from the top of the penstock to the bottom of the penstock. Larger the head, higher will be the speed of the turbine and larger will be the power output. The flow is the volume of water which flows in one second.
hgmEnergy ⋅⋅= Joules, where
m = mass of water = Kgg = acceleration due to gravity = 9.81 m/s2
h = height = meter
Hydraulic Energy-1
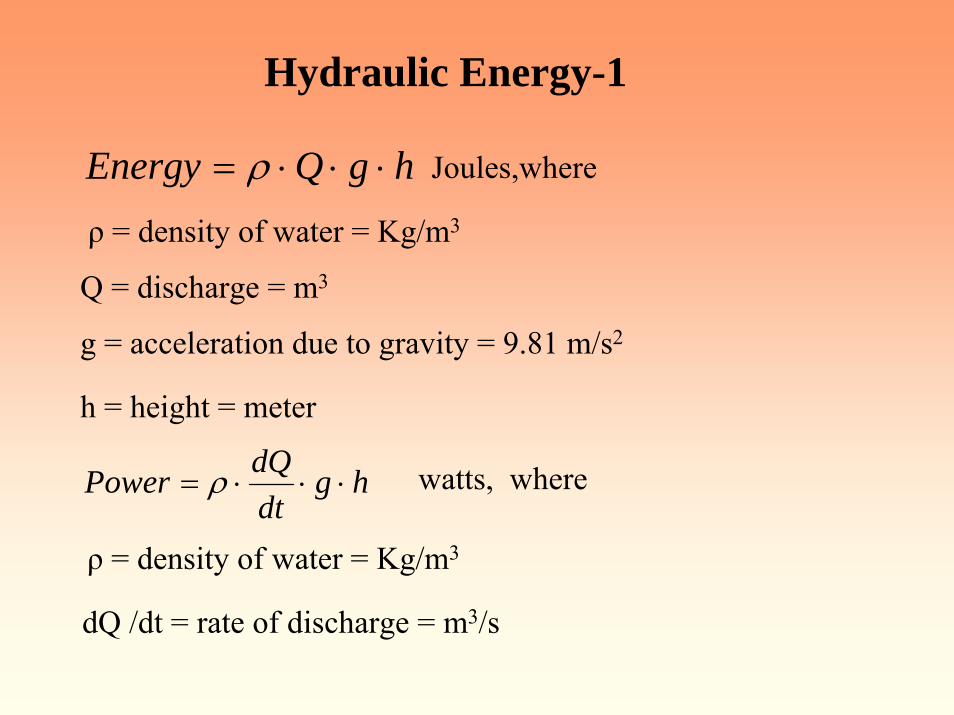
Joules,wherehgQEnergy ⋅⋅⋅= ρρ = density of water = Kg/m3
Q = discharge = m3
g = acceleration due to gravity = 9.81 m/s2
h = height = meter
hgdtdQPower ⋅⋅⋅= ρ watts, where
ρ = density of water = Kg/m3
dQ /dt = rate of discharge = m3/s
Hydraulic Energy-2
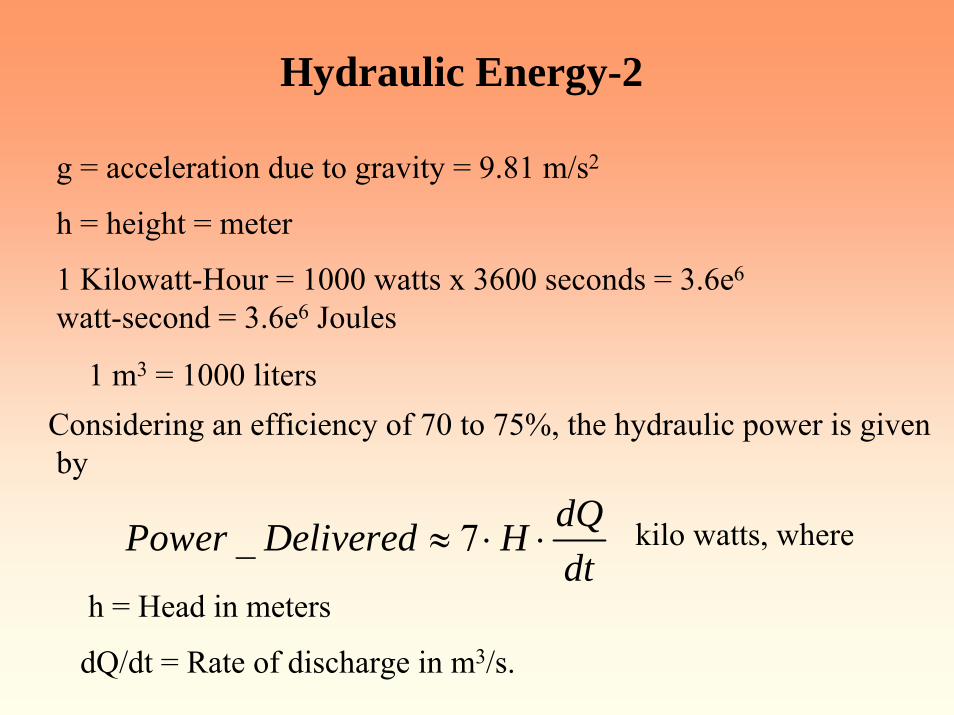
g = acceleration due to gravity = 9.81 m/s2
h = height = meter
1 Kilowatt-Hour = 1000 watts x 3600 seconds = 3.6e6
watt-second = 3.6e6 Joules
1 m3 = 1000 litersConsidering an efficiency of 70 to 75%, the hydraulic power is givenby
_ 7 dQPower Delivered Hdt
≈ ⋅ ⋅ kilo watts, where
h = Head in meters
dQ/dt = Rate of discharge in m3/s.

Layouts
As the physical layout of the micro hydel plant will affect the power output, cost, ruggedness etc., it is worth to consider the following options in choosing the plant layout.Layout decision is based on what factors?
Locations of homes: The distance of the homes from the micro hydel plant will affect the cost of the overall plant.
Water rights: Water may be used downstream by many others for many purposes. The water usage has to be checked with everyone affected and negotiated right at the beginning of the planning process.

Layouts-1
Typical questions to be asked are – whose land will be used for the plant? Who else uses the water and for what purpose? What is the agreement on water sharing? etc.
Power generation: The generated power depends on the head and flow of the water. These are both affected by the physical layout.
Cost: The major cost factor in the plant is the penstock and the distribution system.
The challenge is to keep the penstock and distribution system as short as possible.
Both the cost and the losses increases as these become longer.
Layouts-2
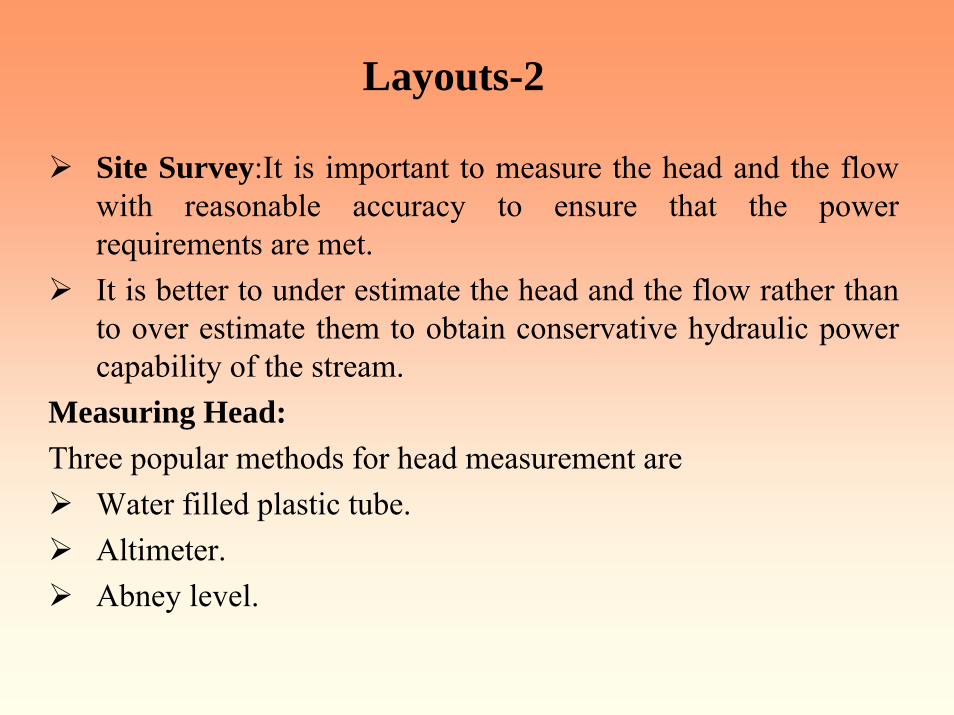
Site Survey:It is important to measure the head and the flow with reasonable accuracy to ensure that the power requirements are met. It is better to under estimate the head and the flow rather thanto over estimate them to obtain conservative hydraulic power capability of the stream.
Measuring Head:Three popular methods for head measurement are
Water filled plastic tube.Altimeter.Abney level.

Layouts-3
Water filled plastic tube:This is the most inexpensive method of head measurement. It requires a piece of transparent plastic tube about 20m long and a diameter of 10mm. Fill the tube with water so that when the two ends are held together, the water level is about 300mm from the top. The water inside the tube will always find the same level on either side .A plastic funnel will help to pour in the water. One person holds one end of the tube at the water level of the reservoir/ forebay tank.

Layouts-4
The second person moves downhill till his eyes are in level with the water level of the fore bay tank. His end of the tube is adjusted till the water level in the tubeis in level with his eyes. Now record that one reading has been taken .After this the tube is lowered such that the water level in the tube is in line with the soles of his feet.Now the first person moves downhill till his eye level is in line with the soles of the feet of the first person. He now raises the tube till the water level is in line with hiseye. Now record that a second reading has been taken.

Layouts-5
This process is repeated till the location of the turbine.
The number of readings taken is summed up.
This is multiplied with the average height to eye level of the two people who took the measurements.
This gives the total head. This procedure should be repeated two to three times to obtain good accuracy.
A variation of this method is to connect one end of the tube with a pressure gauge.
The pressure at each measuring point is recorded and the sum of the total pressures can be used to calculate the overall head.
Altimeters
Altimeters are an instrument to measure the head.
Height is calculated using changes in air pressure.
All that the user had to do is to record one reading at the
expected fore bay location.
Then he has to record the second reading at the turbine in
order to determine the head.
The second reading should be taken as quickly as possible
to prevent any atmospheric changes to affect the reading.
Abney level
The Abney level is a hand held sighting meter. With this method, the angle of the slope (q) is measured. The linear distance (L) is also measured. The head is H is given by
H = L. sin (q)Two posts are driven into the ground one at the position of the proposed fore bay and the other at a position that is 20m to 30m downhill. A clear line of site between the top of the posts is required. The angle between the tops of the two posts is measured using the Abney level and the distance between them is also recorded.

Abney level-1
The head is measure between these two posts using the
above relationship.
Now, the first post is shifted further downhill as compared
to the second post and the measurement recorded.
This process is repeated till the position of the proposed
turbine is reached. The heights are all added up to obtain
the overall head.
Measuring Flow
The flow should be measured during the worst case condition.
During the rainy season, the flow will be high and will
provide high power output.
However, during the dry season, the flow will be low.
It should be estimated whether the load requirement will be
met even during the worst case dry seasons.
Therefore, the flow measurement should be done during the
dry seasons.

Measuring Flow-1
Three simple methods of flow measurements area) Bucket methodb) Float methodc) Salt Gulp AnalysisBucket Method:
Take a 15 liter bucket or any container with known volume. If the volume of the container is not known then it can be found out by filling the container with water from a 1litre bottle. Count the number of liter that has been added. This is giving the volume of the container.
Measuring Flow-2
The most challenging task in this method is to find a location in the stream where the water can be directed into the bucket.This is done by placing the bucket at the bottom of a natural narrow fall in the stream path or by building a simple weir by using a wooden channel or a corrugated sheet such that the stream water flows through this weir during measurement. Now, using a stopwatch, record the time it takes to fill the bucket. Repeat the experiment three times and take the average. The volume of the bucket divided by the average time it takes to fill the bucket gives the flow rate of the water.
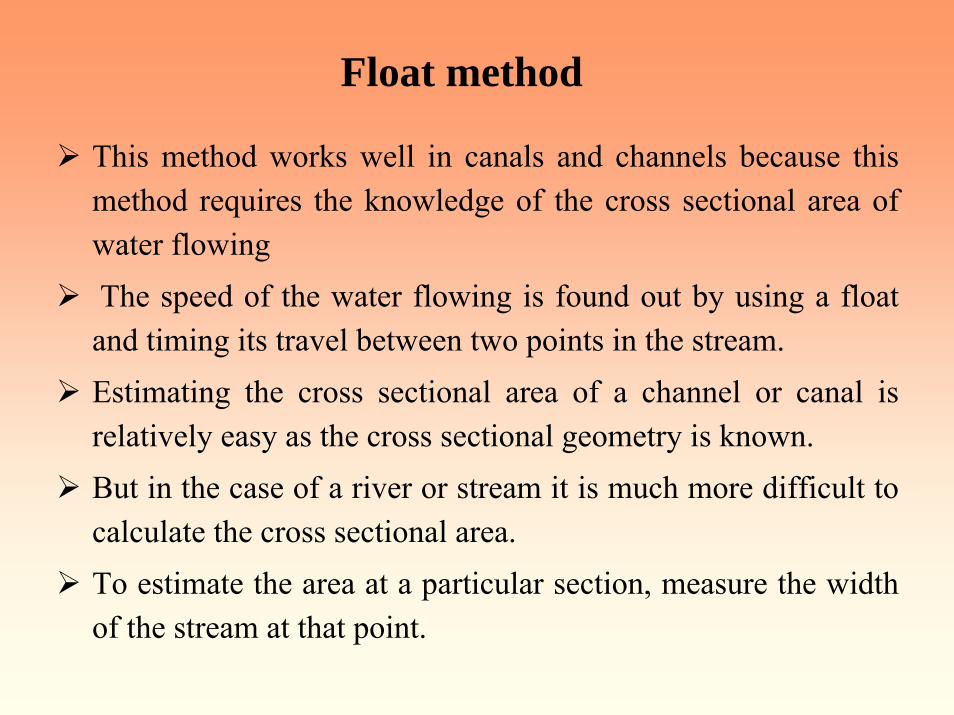
Float method
This method works well in canals and channels because this method requires the knowledge of the cross sectional area of water flowing The speed of the water flowing is found out by using a float and timing its travel between two points in the stream.Estimating the cross sectional area of a channel or canal is relatively easy as the cross sectional geometry is known. But in the case of a river or stream it is much more difficult to calculate the cross sectional area. To estimate the area at a particular section, measure the width of the stream at that point.
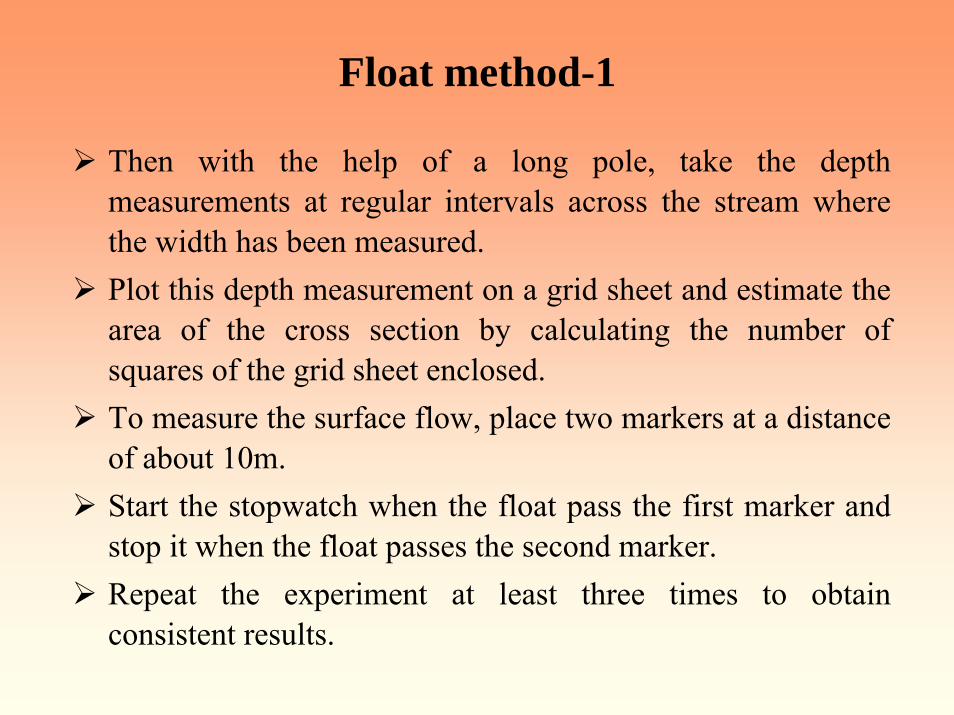
Float method-1
Then with the help of a long pole, take the depth measurements at regular intervals across the stream where the width has been measured. Plot this depth measurement on a grid sheet and estimate the area of the cross section by calculating the number of squares of the grid sheet enclosed. To measure the surface flow, place two markers at a distance of about 10m. Start the stopwatch when the float pass the first marker and stop it when the float passes the second marker. Repeat the experiment at least three times to obtain consistent results.

Float method-2
The flow is the product of the average stream area and the
average velocity of the flow.
Since the water moves the fastest at the surface than the other
layers of the stream.
The average velocity of the stream is found by incorporating a
correction factor to the surface velocity.

Float method-3
The following table gives typical correction factors that can beused.
Type of stream Velocity correction factor (vice)
A rectangular channel with smooth sides and bed
0.85
A deep, slow moving stream 0.75
A small stream with a smooth bed 0.65
A quick, turbulent stream 0.45
A very shallow, rocky stream 0.25
The flow is now given by surfacedQ A v vcfdt
= ⋅ ⋅
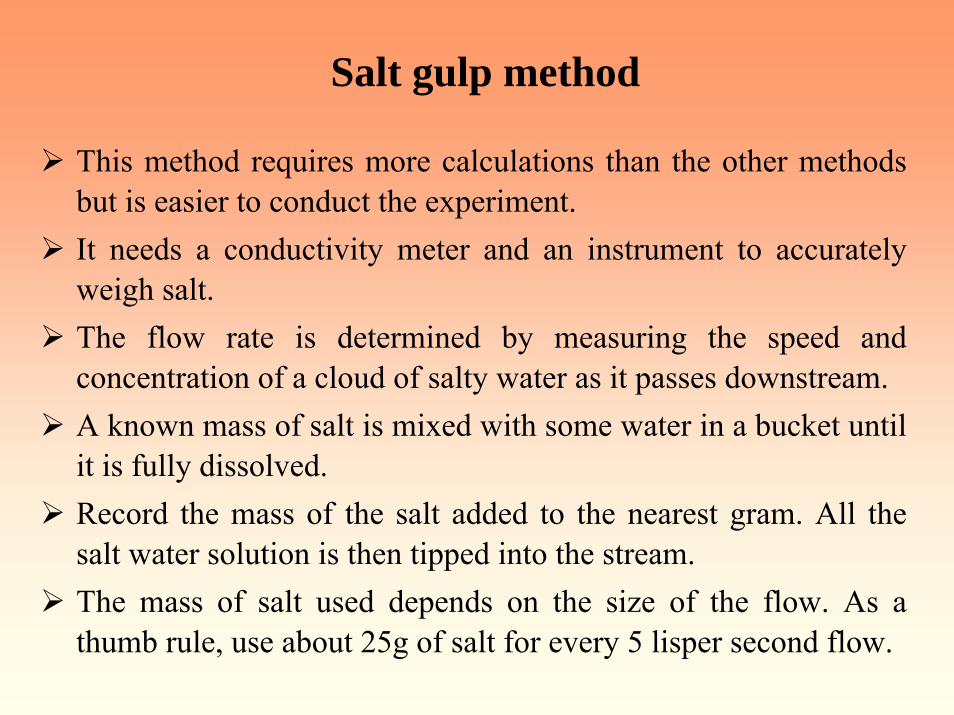
Salt gulp method
This method requires more calculations than the other methods but is easier to conduct the experiment. It needs a conductivity meter and an instrument to accurately weigh salt. The flow rate is determined by measuring the speed and concentration of a cloud of salty water as it passes downstream.A known mass of salt is mixed with some water in a bucket until it is fully dissolved. Record the mass of the salt added to the nearest gram. All the salt water solution is then tipped into the stream. The mass of salt used depends on the size of the flow. As a thumb rule, use about 25g of salt for every 5 lisper second flow.
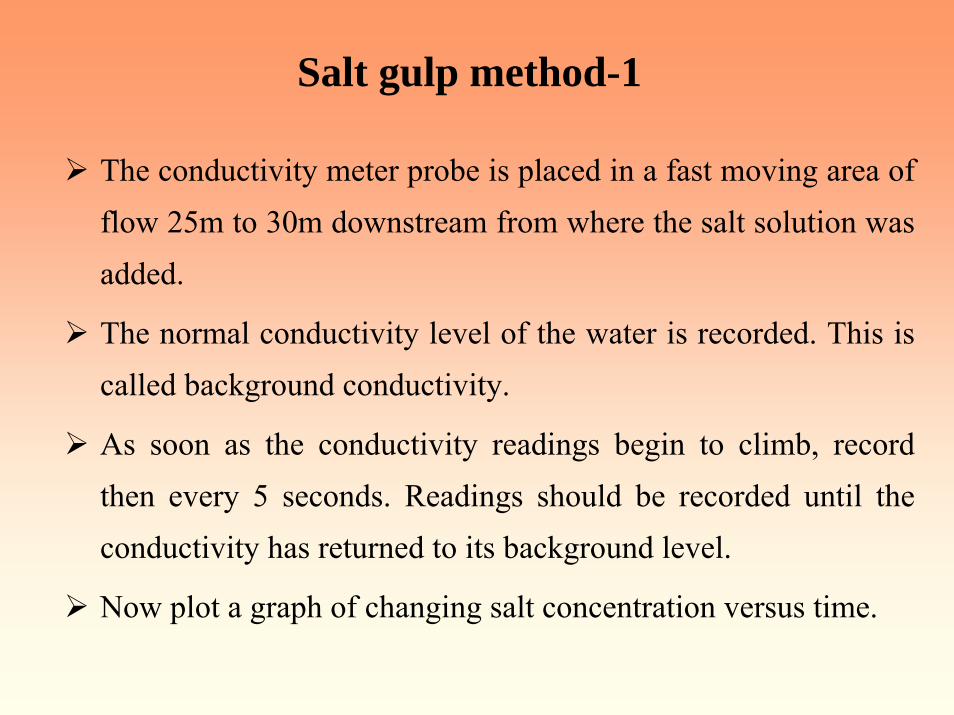
Salt gulp method-1
The conductivity meter probe is placed in a fast moving area of flow 25m to 30m downstream from where the salt solution was added.
The normal conductivity level of the water is recorded. This is called background conductivity.
As soon as the conductivity readings begin to climb, record then every 5 seconds. Readings should be recorded until the conductivity has returned to its background level.
Now plot a graph of changing salt concentration versus time.

Salt gulp method-2
A smooth curve with a peak value at least twice the level of thebackground level indicates that the experiment has been carried out reasonably well. The area under the curve must be established in order to calculate the flow rate. The equation for calculating the flow rate is
1dQ Mkdt A
−
= Where M = mass of saltK-1 = conversion factorA = area under the concentration versus time curve
The conductivity is converted into salt concentration by multiplyingwith a conversion factor that takes water temperature into account.It has the units of ohm-1/mg lt-1. The k-1 value is around 2 for water at 25 deg. C.

Turbine
The turbine is a device which converts the hydraulic power from the water to rotating mechanical energy.
There are several turbines that have been developed for specific purposes.
Turbines are classified into
a) Impulse turbines for high heads.
b) Reaction turbines for low heads.
c) Submersible propeller turbines.
Some of the turbines are Elton, cross flow, turbo, Francis, Harris etc.
Generator
Generally, induction generators and synchronous generators are used to produce the power. Induction generators are especially suited for providing electricity in remote areas because they are rugged and reliable. However, synchronous generators and dc generators have also been used for some applications.The three phase induction motors can be used as generators. These are easily available and quite inexpensive.For most home applications, a single phase supply is required. It is required to produce a single phase supply from a three phase motor.
Load Control
The speed of the turbine changes when the load connected to the generator changes. Since this change of speed affects the voltage and frequency, the load on the generator must be kept constant or the flow of water through the nozzle must be adjusted. The most reliable method of controlling the load and keeping the voltage and frequency constant is by using an electronic load controller. The unused power of the induction generator is sent to a ballast or dummy load so that the total load on the generator remains constant.


