ESSP WORKING PAPER 49
Gender Differences in Access to Extension Services and Agricultural Productivity
Catherine Ragasa*, Guush Berhane**, Fanaye Tadesse‡, and Alemayehu Seyoum Taffesse‡‡
* Postdoctoral Fellow, Development Strategy and Governance Division, International Food Policy Research Institute
** Postdoctoral Fellow, Development Strategy and Governance Division, International Food Policy Re-search Institute – Ethiopia Strategy Support Program, Ethiopia
‡ Research Officer, Ethiopia Strategy Support Program, Ethiopian Development Research Institute ‡‡ Senior Research Fellow, Development Strategy and Governance Division, International Food Policy Re-
search Institute – Ethiopia Strategy Support Program, Ethiopia
December 2012

TABLE OF CONTENTS Abstract .................................................................................................................................................................................................... 1 1. Introduction ......................................................................................................................................................................................... 1 2. Data and Indicators ............................................................................................................................................................................. 3 3. Empirical Method and Estimation ........................................................................................................................................................ 5 4. Results ................................................................................................................................................................................................ 6
4.1. Gender Differences in Access to Extension Services .................................................................................................................. 6 4.2. Gender Differences in Technology Adoption and Input Use ........................................................................................................ 9 4.3. Gender Differences in Productivity ............................................................................................................................................. 11 4.4. Robustness Checks and Remaining Limitations of the Study .................................................................................................... 14
5. Conclusions ...................................................................................................................................................................................... 15 References ............................................................................................................................................................................................. 16
LIST OF TABLES Table 1.1—Summary of literature review on gender differences in extension services, technology adoption and productivity. ............... 2 Table 2.1—Descriptive statistics of explanatory variables and instruments used ..................................................................................... 4 Table 4.1—Mean difference test of access to different extension channels between female and male heads of households ................. 7 Table 4.2—Correlates of household level access to extension services (marginal effects)...................................................................... 8 Table 4.3—Descriptive statistics of productivity, primary crop choice, technology, and input use at plot level ....................................... 10 Table 4.4—Correlates of fertilizer and improved seed use ..................................................................................................................... 11 Table 4.5—Results of the productivity regression, by full sample and primary crops ............................................................................. 13 Table 4.6—Results of crop-specific and gender-specific productivity model regression ........................................................................ 14 Table 4.7—Results of the productivity regression, using various estimates and robustness checks ..................................................... 15
LIST OF FIGURES Figure 4.1—Kernel density of productivity, by gender of household head and by gender of plot decisionmaker ................................... 12
1
ESSP II WORKING PAPER XX
ABSTRACT This paper contributes new empirical evidence and nuanced analysis on the gender difference in access to extension services and how this translates to observed differences in technology adoption and agricultural productivity. We employ a cross-sectional instrumental-variable regression method using a regionally-representative dataset of more than 7,500 households and 32,000 plots in four major regions in Ethiopia that was collected during the 2010 main season. Results suggest that female heads of households and plot managers are less likely to get extension services and less likely to access quality services than their male counterparts after controlling for plot, household, and village level characteristics. Receiving advice from DAs is strongly and positively related to adoption of improved seed and fertilizer for both females and males, as hypothesized. However, beyond their influence through fertilizer and improved seed use, visits by or advice from DAs are not significant in all productivity models estimated for females and males, which is in contrast to past studies. In some crop-specific productivity models estimated, it is the perceived quality of DA visits and access to radio that appear to be strongly and positively significant in explaining productivity levels for both female and male farmers. Our results highlight the need for productivity models that are stratified by gender and crop.
Keywords: technology adoption, agricultural inputs, instrumental variable regression model, agricultural information, Ethiopia
1. INTRODUCTION Agricultural extension and rural education have been emphasized by development experts as crucial in achieving agricultural development, poverty reduction, and food security (Swanson, Bentz, and Sofranko 1997; Dercon et al. 2009; Davis 2008; Swanson and Rajalahti 2010; Feder, Birner, and Anderson 2011). However, empirical evidence shows mixed results in terms of the relevance, cost-effectiveness, and equity dimensions of different approaches of agricultural extension service provision (Feder, Birner, and Anderson 2011; Birner et al. 2006). On one hand, rates of return and the economic contribution of agricultural extension are estimated to be high (Birkhaeuser, Evenson, and Feder 1991; Swanson, Bentz, and Sofranko 1997; Alston et al. 2000); Benin et al. (2011) estimate a 8–49 percent rate of return in the agricultural extension reform in Uganda; and Dercon et al. (2009) show that receiving at least one extension visit per year reduces the likelihood of being poor by 10 percent in Ethiopia. On the other hand, extension systems and delivery methods in many developing countries have been critiqued as ineffective in responding to the demands and technologi-cal challenges of various types of clients and in reaching poor men and women farmers (Rivera, Qamar, and Crowder 2001; Birner et al. 2006; Davis 2008).
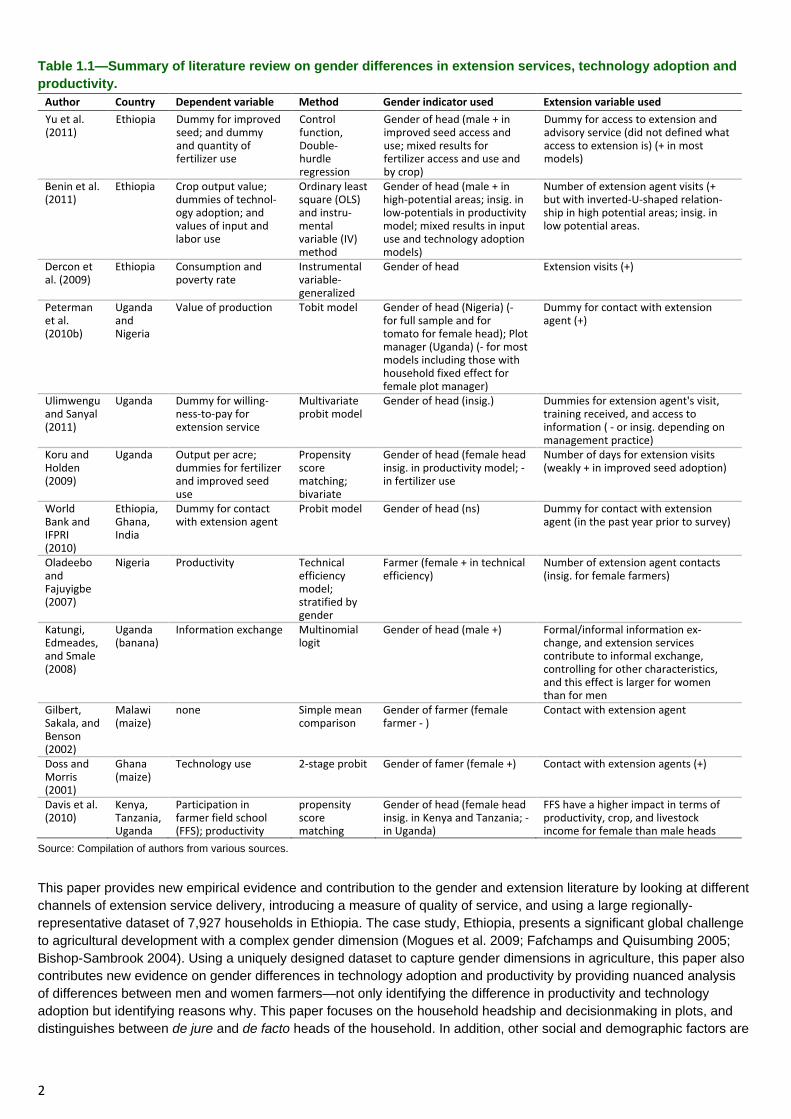
The gender equity dimension of agricultural extension service provision is an aspect that is widely addressed in the literature. From the global survey of 115 countries by FAO in the 1980s to the micro-studies by World Bank and IFPRI in 2010, numerous studies show access to extension services is lower for women as compared with men (Swanson, Farmer, and Bahal 1990; World Bank and IFPRI 2010; Ragasa 2012). When other factors are controlled for, the results are mixed in terms of whether women are disadvantaged or not in access to extension services (Table 1.1). In most of these studies, the measure of extension services is often equated with contacts and visits of public extension agents to the farmers. With new developments in decentralization, demand-driven approaches, and pluralistic systems, new stakeholders and service providers and new types of delivery methods are becoming increasingly available as channels of information and technology transfer among farmers. To the authors’ knowledge, there is no study to date that system-atically compares within a gendered analytical framework different types of extension delivery channels or examines quality of service and their relationship with technology adoption and productivity levels. Most of the studies are case studies covering a very small sample to draw their inferences and generalizations. Peterman, Behrman, and Quisumbing (2010a) also emphasize several methodological limitations of these studies, ranging from the definition of the gender variable to over-simplistic assumptions of cropping patterns and sociocultural dimensions. Moreover, many empirical studies produce biased results due to uncontrolled plot, household, village, or district level characteristics leading to selection bias and endogeneity problem in their estimations.
2
Table 1.1—Summary of literature review on gender differences in extension services, technology adoption and productivity.
Author Country Dependent variable Method Gender indicator used Extension variable used Yu et al. (2011)
Ethiopia Dummy for improved seed; and dummy and quantity of fertilizer use
Control function, Double-hurdle regression
Gender of head (male + in improved seed access and use; mixed results for fertilizer access and use and by crop)
Dummy for access to extension and advisory service (did not defined what access to extension is) (+ in most models)
Benin et al. (2011)
Ethiopia Crop output value; dummies of technol-ogy adoption; and values of input and labor use
Ordinary least square (OLS) and instru-mental variable (IV) method
Gender of head (male + in high-potential areas; insig. in low-potentials in productivity model; mixed results in input use and technology adoption models)
Number of extension agent visits (+ but with inverted-U-shaped relation-ship in high potential areas; insig. in low potential areas.
Dercon et al. (2009)
Ethiopia Consumption and poverty rate
Instrumental variable-generalized
Gender of head Extension visits (+)
Peterman et al. (2010b)
Uganda and Nigeria
Value of production Tobit model Gender of head (Nigeria) (- for full sample and for tomato for female head); Plot manager (Uganda) (- for most models including those with household fixed effect for female plot manager)
Dummy for contact with extension agent (+)
Ulimwengu and Sanyal (2011)
Uganda Dummy for willing-ness-to-pay for extension service
Multivariate probit model
Gender of head (insig.) Dummies for extension agent's visit, training received, and access to information ( - or insig. depending on management practice)
Koru and Holden (2009)
Uganda Output per acre; dummies for fertilizer and improved seed use
Propensity score matching; bivariate
Gender of head (female head insig. in productivity model; - in fertilizer use
Number of days for extension visits (weakly + in improved seed adoption)
World Bank and IFPRI (2010)
Ethiopia, Ghana, India
Dummy for contact with extension agent
Probit model Gender of head (ns) Dummy for contact with extension agent (in the past year prior to survey)
Oladeebo and Fajuyigbe (2007)
Nigeria Productivity Technical efficiency model; stratified by gender
Farmer (female + in technical efficiency)
Number of extension agent contacts (insig. for female farmers)
Katungi, Edmeades, and Smale (2008)
Uganda (banana)
Information exchange Multinomial logit
Gender of head (male +) Formal/informal information ex-change, and extension services contribute to informal exchange, controlling for other characteristics, and this effect is larger for women than for men
Gilbert, Sakala, and Benson (2002)
Malawi (maize)
none Simple mean comparison
Gender of farmer (female farmer - )
Contact with extension agent
Doss and Morris (2001)
Ghana (maize)
Technology use 2-stage probit Gender of famer (female +) Contact with extension agents (+)
Davis et al. (2010)
Kenya, Tanzania, Uganda
Participation in farmer field school (FFS); productivity
propensity score matching
Gender of head (female head insig. in Kenya and Tanzania; - in Uganda)
FFS have a higher impact in terms of productivity, crop, and livestock income for female than male heads
Source: Compilation of authors from various sources.
This paper provides new empirical evidence and contribution to the gender and extension literature by looking at different channels of extension service delivery, introducing a measure of quality of service, and using a large regionally-representative dataset of 7,927 households in Ethiopia. The case study, Ethiopia, presents a significant global challenge to agricultural development with a complex gender dimension (Mogues et al. 2009; Fafchamps and Quisumbing 2005; Bishop-Sambrook 2004). Using a uniquely designed dataset to capture gender dimensions in agriculture, this paper also contributes new evidence on gender differences in technology adoption and productivity by providing nuanced analysis of differences between men and women farmers—not only identifying the difference in productivity and technology adoption but identifying reasons why. This paper focuses on the household headship and decisionmaking in plots, and distinguishes between de jure and de facto heads of the household. In addition, other social and demographic factors are
3
ESSP II WORKING PAPER XX
used to further create a typology of women and men farmers and how these groups behave and respond differently in terms of input and service access, technology adoption, and productivity measures.
The Ethiopian case is also interesting and relevant since its government has been actively investing in its agricultural extension system in the past years. Ethiopia’s extension system has one of the strongest extension agent–farmer ratios found in the world. Over the years, it had trained about 60,000 development agents (DA) for extension service provision (with only 15,000 agents prior to 2000). The field level extension service has now a strong foundation of 8,500 farmer training centers (FTCs), built at the kebele (the lowest administrative division), staffed with 46,000 trained development agents (Davis et al. 2010). This investment in field staff is complemented by the Participatory Demonstration and Training Extension System (PADETES), focusing on the distribution of packages of seeds, fertilizer, credit, and training, and is estimated to cost USD50 million annually or two percent of agricultural GDP in recent years, four to five times the investment in agricultural research in the country (Yu et al. 2011).
While various studies have highlighted major institutional challenges remaining despite the extension reforms (EEA/EEPRI 2006; World Bank 2006; Byerlee et al. 2007; Davis et al. 2010; Spielman et al. 2010), the gender implica-tions of these investments and challenges in extension system have not been addressed in the literature. It is not clear how they have influenced women’s and men’s access to information and their productivity. Although various attempts to reach more women farmers were implemented, such as the creation of a “women’s development package”, gender inequality seems to persists (Mogues et al. 2009) and there is limited understanding on how this seeming gender disparity in extension services contribute to limited technology adoption and productivity levels. It is therefore timely and relevant to answer the following research questions using the Ethiopian case: (1) Are there systematic patterns of differences in access to various types of extension services by women and men farmers? (2) What typology of female and male farmers get which information and through which channels? (3) Are there differences in productivity and technology adoption between female and male farmers and if so, are these differences attributed to their access to varying channels and quality of extension services?
Results of this study suggest that there are systematic and significant differences between female and male heads of households and between female and male plot managers in terms of access to different channels of extension services and in the quality of these services as perceived by respondents. Female farmers are less likely to get extension services through various channels and are less likely to access quality services than their male counterparts. Advice received from DAs is strongly and positively significant in explaining fertilizer and improved seed use, but it does not significantly explain productivity. In all of the productivity models, plots of male and female farmers are as equally productive after holding other factors constant. The rest of the paper presents the data used, framework adopted, estimation methods, results, and conclusions.
2. DATA AND INDICATORS This paper uses a recent and unique dataset from a household survey undertaken by the Central Statistical Agency (CSA) of Ethiopia, covering the most important agroecological regions of rural parts of Ethiopia. The survey was con-ducted in June–July 2011 and covers the four major regions of Ethiopia—Tigray, Amhara, Oromia, and SNNP (Southern Nations, Nationalities, and People). Households were surveyed in purposely selected 93 districts within the four regions. Enumeration areas were then randomly selected from the 93 districts. Finally, households were evenly and randomly sampled from each enumeration area. A total of 7,927 households were interviewed. An advantage in this dataset is that the sampling design has ensured a statistical representation of female headed households in the population. After a rigorous data cleaning and excluding outliers or extreme values (defined as those observations greater than three standard deviations from the median and in the top and bottom one percent of the observations), a total of 7,530 house-holds and a total of 31,450 plots were used in the analysis (each household has four plots on average).
This paper mainly focuses on the sections of the household survey that look at extension services, agricultural productivi-ty, and technology adoption. The indicators used are defined as follows:
Gender Indicator: Given the available dataset, two measures of gender were used: (1) household headship1, and (2) who has the right to make decisions on the plot based on the question from the survey questionnaire: “Who in the household has the right to decide what to grow on this parcel?” While it is acknowledged that the latter may be different than the actual decisionmaker on the plot, it can be a better and closer proxy for decisionmaking on the plot than the
1 Household head is defined as individual who administers the household or individual who is considered to be responsible for the household by the
other household members. Distinction was made between de jure female heads (e.g., widow, single, divorced, or separated) and de facto female heads (e.g., wives of male migrants or with ill spouses). De facto female heads are 28 percent of all female heads. In most of the model estimates, there was no significant difference between de facto and de jure female heads.

4
household headship. This paper also controls for age, education level, wealth measure, and other farmer level and household level variables. Part of the sampling design was to have a fair representation of female headed households by ensuring that 30 percent of the selected households were female headed while the rest (70 percent) were male headed. In terms of decisionmaking in plots, about 54 percent of the plots are male-managed, 23 percent are female-managed, and 23 percent are jointly-managed.2
Extension: Different types of channels to get information and extension services used in this paper include visits by and advice received from extension agents; access to radio, newspaper, and bulletins for production and price information; farmers’ visit to demonstration plots and government offices; farmers’ participation in community meetings; and the nature of information or social networks.
Productivity: Following Owens, Hoddinott, and Kinsey (2003), Benin (2006), and Peterman et al. (2010b), this paper uses the value of yield per hectare of various crops as the measure of productivity. Productivity value is calculated by multiplying the quantity of each crop produced per hectare by the district level prices for the major planting season known as Meher. The value of production is used because the majority of the plots were intercropped and area estimates for each crop were difficult to calculate. Overall productivity was estimated for the full sample as well as crop-specific production models.
Technology: Following Benin (2006), Ulimwengu and Sanyal (2011), and Yu et al. (2011), various measures were used to capture technology adoption including both dichotomous and continuous variables: (1) dummies for use of fertilizer, herbicide, pesticide, improved seed, irrigation, soil conservation method, and row planting; (2) amount of fertilizer used (kilogram/hectare); (3) quantity of seed planted (kg/ha); (4) number of oxen per hectare; and (5) amount of total labor used (person-days/hectare).
Other factors: Variables that could potentially affect adoption include plot characteristics, access to agricultural services, holder and household characteristics, resources available to the farmer, local adoption patterns, and reliance on the crop. Table 2.1 presents descriptive statistics for these variables. It also includes potential factors affecting input use and productivity at the village and woreda levels, such as distance to the market, presence of local associations, population density, and agroecological potential.
Table 2.1—Descriptive statistics of explanatory variables and instruments used
Variable name Variable Description Total Sample Male headed Female headed t-test
/a Mean SD Mean SD Mean SD Explanatory variables Plot level factors
Plot size Size of plot in hectares 0.25 0.29 0.25 0.28 0.24 0.31 *** Slope (omitted=flat) Farmers' perception of plot slope compared to flat slope Gently sloped Gently sloped plot 0.30 0.46 0.30 0.46 0.29 0.45 *** Steep Steep sloped plot 0.02 0.13 0.02 0.13 0.01 0.11 Soil quality (omitted=fertile) Farmers' perception of quality of soil, compared to fertile soil
Semi-fertile Semi-fertile soil 0.32 0.47 0.32 0.47 0.31 0.46 ** Not fertile Infertile soil 0.10 0.30 0.10 0.30 0.09 0.29 *
Household level factors Age of head Age of household head 43.0 15.6 41.1 15.15 47.5 15.63 *** Education of head (omitted=no education) Primary education Dummy equals 1 if head has primary education 0.40 0.49 0.51 0.50 0.15 0.36 *** Secondary education Dummy equals 1 if head has secondary education 0.03 0.16 0.04 0.19 0.00 0.07 *** Higher education Dummy equals 1 if head has higher education 0.01 0.09 0.01 0.10 0.00 0.04 ***
Instruments Plot level factors
Owner-cultivated Dummy variable equal to 1 if plot is cultivated by owner, 0 otherwise
0.97 0.16 0.97 0.17 0.99 0.12 ***
Distance of plot from residence
Walking time in minutes from the plot to the residence 14.10 23.3 14.80 23.80 11.96 21.53
Household level factors Household size Number of household members 4.84 2.22 5.32 2.19 3.74 1.87 *** Dependency ratio Household members who are dependent (less than 15 and
greater than 64) over those in the labor force (between 15 and 64, inclusive)
1.15 0.93 1.11 0.80 1.22 1.20 ***
Male proportion Proportion of male members 0.46 0.21 0.52 0.18 0.33 0.24 *** Off farm employment Dummy equals 1 if household head participates in off farm
employment 0.10 0.31 0.03 0.17 0.28 0.45 ***
Exogenous income Transfers made to the household in ETB 154 1894 164 2229 132 529
2 The majority are plots managed jointly by female and male heads; while about 2.5 percent of the plots are managed jointly by “spouse and adult
children” or “head and adult children.”
5
ESSP II WORKING PAPER XX
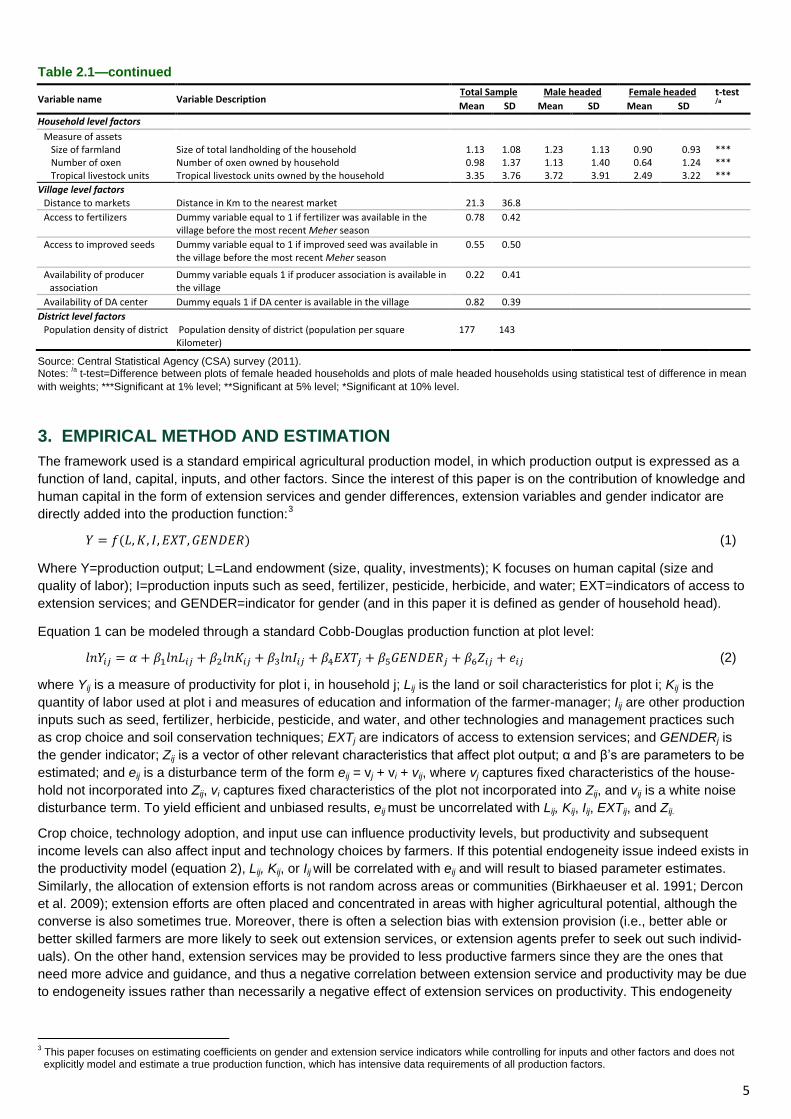
Table 2.1—continued
Variable name Variable Description Total Sample Male headed Female headed t-test
/a Mean SD Mean SD Mean SD Household level factors
Measure of assets Size of farmland Size of total landholding of the household 1.13 1.08 1.23 1.13 0.90 0.93 *** Number of oxen Number of oxen owned by household 0.98 1.37 1.13 1.40 0.64 1.24 *** Tropical livestock units Tropical livestock units owned by the household 3.35 3.76 3.72 3.91 2.49 3.22 ***
Village level factors Distance to markets Distance in Km to the nearest market 21.3 36.8 Access to fertilizers Dummy variable equal to 1 if fertilizer was available in the
village before the most recent Meher season 0.78 0.42
Access to improved seeds Dummy variable equal to 1 if improved seed was available in the village before the most recent Meher season
0.55 0.50
Availability of producer association
Dummy variable equals 1 if producer association is available in the village
0.22 0.41
Availability of DA center Dummy equals 1 if DA center is available in the village 0.82 0.39 District level factors
Population density of district Population density of district (population per square Kilometer)
177 143
Source: Central Statistical Agency (CSA) survey (2011). Notes: /a t-test=Difference between plots of female headed households and plots of male headed households using statistical test of difference in mean with weights; ***Significant at 1% level; **Significant at 5% level; *Significant at 10% level.
3. EMPIRICAL METHOD AND ESTIMATION The framework used is a standard empirical agricultural production model, in which production output is expressed as a function of land, capital, inputs, and other factors. Since the interest of this paper is on the contribution of knowledge and human capital in the form of extension services and gender differences, extension variables and gender indicator are directly added into the production function:3
𝑌 = 𝑓(𝐿,𝐾, 𝐼,𝐸𝑋𝑇,𝐺𝐸𝑁𝐷𝐸𝑅) (1)
Where Y=production output; L=Land endowment (size, quality, investments); K focuses on human capital (size and quality of labor); I=production inputs such as seed, fertilizer, pesticide, herbicide, and water; EXT=indicators of access to extension services; and GENDER=indicator for gender (and in this paper it is defined as gender of household head).
Equation 1 can be modeled through a standard Cobb-Douglas production function at plot level:
𝑙𝑛𝑌𝑖𝑗 = 𝛼 + 𝛽1𝑙𝑛𝐿𝑖𝑗 + 𝛽2𝑙𝑛𝐾𝑖𝑗 + 𝛽3𝑙𝑛𝐼𝑖𝑗 + 𝛽4𝐸𝑋𝑇𝑗 + 𝛽5𝐺𝐸𝑁𝐷𝐸𝑅𝑗 + 𝛽6𝑍𝑖𝑗 + 𝑒𝑖𝑗 (2)
where Yij is a measure of productivity for plot i, in household j; Lij is the land or soil characteristics for plot i; Kij is the quantity of labor used at plot i and measures of education and information of the farmer-manager; Iij are other production inputs such as seed, fertilizer, herbicide, pesticide, and water, and other technologies and management practices such as crop choice and soil conservation techniques; EXTj are indicators of access to extension services; and GENDERj is the gender indicator; Zij is a vector of other relevant characteristics that affect plot output; α and β’s are parameters to be estimated; and eij is a disturbance term of the form eij = vj + vi + vij, where vj captures fixed characteristics of the house-hold not incorporated into Zij, vi captures fixed characteristics of the plot not incorporated into Zij, and vij is a white noise disturbance term. To yield efficient and unbiased results, eij must be uncorrelated with Lij, Kij, Iij, EXTij, and Zij.
Crop choice, technology adoption, and input use can influence productivity levels, but productivity and subsequent income levels can also affect input and technology choices by farmers. If this potential endogeneity issue indeed exists in the productivity model (equation 2), Lij, Kij, or Iij will be correlated with eij and will result to biased parameter estimates. Similarly, the allocation of extension efforts is not random across areas or communities (Birkhaeuser et al. 1991; Dercon et al. 2009); extension efforts are often placed and concentrated in areas with higher agricultural potential, although the converse is also sometimes true. Moreover, there is often a selection bias with extension provision (i.e., better able or better skilled farmers are more likely to seek out extension services, or extension agents prefer to seek out such individ-uals). On the other hand, extension services may be provided to less productive farmers since they are the ones that need more advice and guidance, and thus a negative correlation between extension service and productivity may be due to endogeneity issues rather than necessarily a negative effect of extension services on productivity. This endogeneity
3 This paper focuses on estimating coefficients on gender and extension service indicators while controlling for inputs and other factors and does not
explicitly model and estimate a true production function, which has intensive data requirements of all production factors.
6
issue is a critical consideration that needs to be addressed; otherwise, EXTij and eij will be correlated and 𝛽4 will be a biased estimate of the contribution of extension services in explaining differences in productivity levels.
Technology, input use, and measures of extension services are modeled in equation 3 and represented by Xij:
𝑋𝑖𝑗 = 𝛼 + 𝛾1𝑌𝑖𝑗 + 𝛾2𝐺𝐸𝑁𝐷𝐸𝑅𝑗 + 𝛾3𝑊𝑖𝑗 + 𝑢𝑖𝑗, (3)
where 𝑊𝑖𝑗 are factors that affect 𝑋𝑖𝑗 but do not directly affect 𝑌𝑖𝑗, 𝑢𝑖𝑗 is the error term. Note that equation 2 is a production function and so excludes those factors that do not have a hypothesized direct effect on crop production. Input, technolo-gy, crop choice, and extension on the other hand depend on additional factors that influence awareness, availability, costs, benefits, and risks associated with them. Once equations 2 and 3 are estimated, the coefficients can be used to predict the effect of factors of interest on productivity directly as specified in equation 2 or indirectly via the effects of inputs use, crop choice, and technology adoption.
Given the cross-sectional nature of the data and equations to be estimated, an instrumental-variable (IV) regression model was used. A standard Durbin-Wu-Hausman (DWH) test of endogeneity of regressors suggests that the IV proce-dure is more suitable over a straightforward ordinary least squares (OLS) method. Multiple variables are used to proxy extension and technology adoption in the productivity model, mainly, fertilizer use, improved seeds use, DA advices, and use of irrigation technologies. At least, an equal number of exogenous variables that are correlated with the extension and technology adoption indicators, but not directly correlated with productivity, are needed to instrument for endogeneity. Thus, the model is estimated using a Two-stage Least Squares (2SLS) estimator. The 2SLS is the most efficient variant of IV estimators that is applied in multiple IV conditions (Wooldridge 2002, 96). The instruments used are household level variables including distance of plot from the residence of the household, exogenous income or transfers made to the household, household size, proportion of males in household, and measures of household assets such as land size, number of livestock units, education level of household members; and village level and district level variables including the availability of producer associations in the village, distance to market, access to improved seed in the village, availability of DA center in the village, and population density in the district.
Intuitively, there is no reason to believe that these instruments can directly affect the dependent variable (𝑌𝑖𝑗), beyond their indirect effect through receiving extension advice, input use, crop choice, and technology adoption. Various formal tests were conducted to ascertain the validity of the instruments. The minimum condition for these instruments to be valid is that they are sufficiently correlated with the endogenous variables (Verbeek 2004, 148). This can be tested by estimat-ing the first stage regression of each endogenous variable on the instruments used and perform an F-statistic test (Verbeek 2004, 145). Stock and Watson (2003), also cited in Verbeek (2004, 148), suggest that a minimum F-statistics of 10 is sufficient for validity. The F-statistic test results (not reported here because they are many but are available upon request) confirm that the instruments used are strongly correlated with the endogenous variables instrumented. The Angrist-Pischke (AP) first-stage chi-squared and F statistics tests of underidentification and weak identification, respec-tively, of individual endogenous regressors were conducted and show that these instruments are statistically and highly correlated with the endogenous variables being instrumented (𝑋𝑖𝑗). Moreover, Hansen J statistics (with joint null hypothe-sis that the instruments are valid instruments, i.e., uncorrelated with the error term, and that the excluded instruments are correctly excluded from the estimated equation) and Kleibergen-Paap Wald rk F statistic (which is larger than the Stock and Yogo statistics provided for a 10 percent maximal IV size for valid instruments) suggest that the instruments used are valid.
4. RESULTS This section summarizes the main results in this study. Tables 4.1 and 4.3 provide descriptive results and Tables 4.2, 4.4, 4.5, 4.6, and 4.7 present the econometric estimation results. The subsequent sections directly address and focus on the effect of extension services on technology adoption, input use and productivity among female and male heads of households.
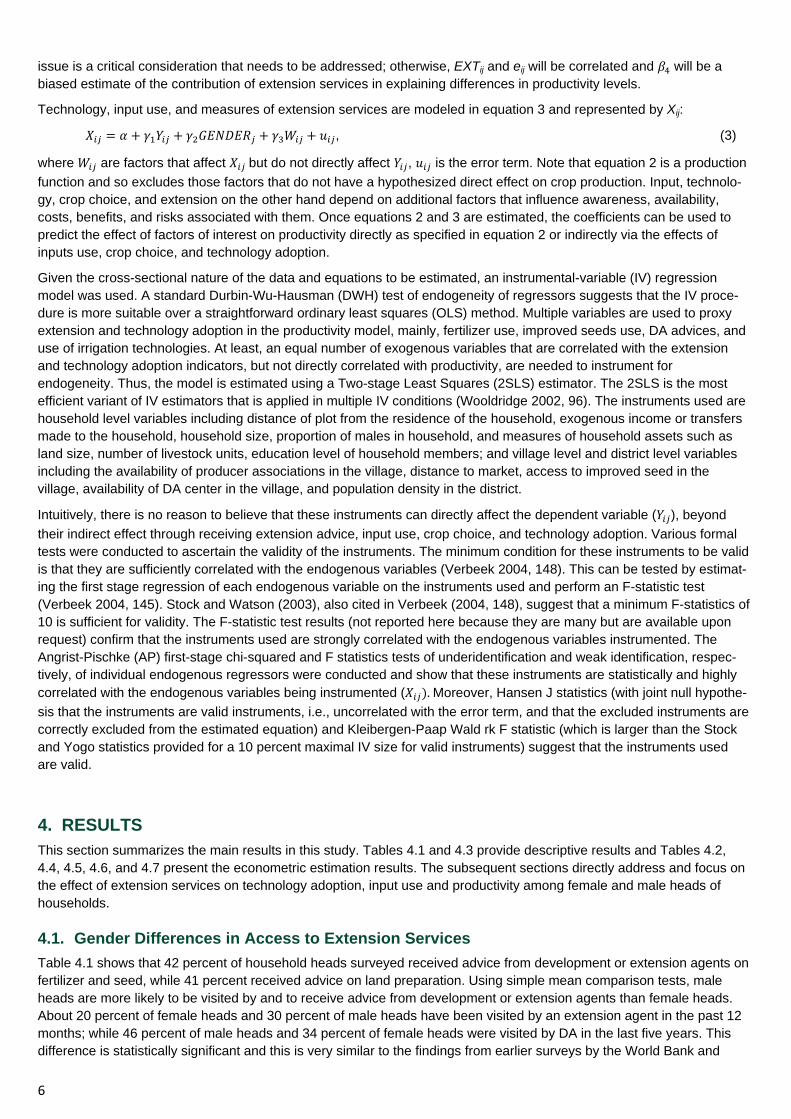
4.1. Gender Differences in Access to Extension Services Table 4.1 shows that 42 percent of household heads surveyed received advice from development or extension agents on fertilizer and seed, while 41 percent received advice on land preparation. Using simple mean comparison tests, male heads are more likely to be visited by and to receive advice from development or extension agents than female heads. About 20 percent of female heads and 30 percent of male heads have been visited by an extension agent in the past 12 months; while 46 percent of male heads and 34 percent of female heads were visited by DA in the last five years. This difference is statistically significant and this is very similar to the findings from earlier surveys by the World Bank and
7
ESSP II WORKING PAPER XX
IFPRI (2010). Moreover, there is a weak statistical perception difference between male heads and female heads regard-ing the usefulness of DA services: female heads are statistically less likely to perceive DA advice to be useful (65 percent) than male heads (67 percent).
Table 4.1—Mean difference test of access to different extension channels between female and male heads of households
Variables Description of variables Total sample
Male heads
Female heads
t-test /a
De jure female heads
De facto female heads
t-test /a
Sample households 7,927 70% 30% 22% 8% Visit to government office of
agriculture
Dummy equals 1 if visit was made to government office of agriculture in the past 12 months, 0 otherwise
0.02 0.03 0.01 *** 0.01 0.01
Visit to farm demonstration plots
Dummy equals 1 if visit was made to demonstration plots or research centers of agriculture last year, 0 otherwise
0.06 0.07 0.03 *** 0.02 0.04
Number of visits to demonstra-tion plots
If demonstration plots were visited, average number of times visit was made 2.55 2.53 2.68 1.92 3.95
Attendance in community meetings
Dummy equals 1 if attended community meeting last year, 0 otherwise 0.52 0.61 0.30 *** 0.28 0.34 **
Number of community meetings attended
If attended community meetings, average number of times such meetings were attended
3.83 3.91 3.45 3.27 3.78
Development agents are helpful Dummy equals 1 if household head believes that DA are helpful 0.66 0.67 0.65 * 0.66 0.63
Visit by DA
DA visit (last year) Dummy equals 1 if visit was made by DA in past 12 months, 0 otherwise 0.27 0.30 0.20 *** 0.19 0.23
Number of DA visits (last year) If visited by an DA, number of times visited 3.48 3.68 2.79 2.92 2.55 DA visit (last 5 years) Dummy equals 1 if visit was made by DA in
past 5 years, 0 otherwise 0.42 0.46 0.34 *** 0.31 0.39
Number of DA visits (last 5years)
If visited in the last 5 years, average number of visit by agent 6.19 6.39 5.55 * 5.03 6.50
Received advice from DA
. . . on fertilizer Dummy equals 1 if received advice from extension agent on fertilizer 0.42 0.47 0.30 *** 0.29 0.32
. . . on planting seeds Dummy equals 1 if received advice from extension agent on planting seeds 0.42 0.48 0.29 *** 0.29 0.31
. . . on land preparation Dummy equals 1 if received advice from extension agent land preparation 0.41 0.46 0.29 *** 0.28 0.32
Access radio for …
… production information Dummy equals 1 if production information was accessed through radio 0.28 0.34 0.15 *** 0.12 0.22 ***
… price information Dummy equals 1 if price information was accessed through radio 0.27 0.33 0.14 *** 0.11 0.20 ***
Access newspaper for …
… production information Dummy equals 1 if production information was accessed through newspaper 0.04 0.05 0.02 *** 0.13 0.03
… for price information Dummy equals 1 if price information was accessed through newspaper 0.03 0.04 0.01 ** 0.01 0.12
Access bulletin board for …
… production information Dummy equals 1 if production information was accessed through bulletin board 0.01 0.01 0.003 ** 0.004 0.001
… price information Dummy equals 1 if price information was accessed through bulletin board 0.01 0.01 0.004 *** 0.005 0.001 *
Number of people in agricultural information networks
Average number of people to discuss agricultural issues 2.96 3.24 2.32 *** 2.27 2.43
These networks have …
. . . planted a new crop Dummy equals 1 if information networks have planted a new crop 0.20 0.20 0.18 0.18 0.18
. . . .adopted new way of planting
Dummy equals 1 if information networks have adopted new or different way of planting 0.16 0.17 0.14 0.13 0.16 *
. . . sold output through new or different channel
Dummy equals 1 if information networks sold output through a new or different channel 0.10 0.10 0.10 0.09 0.12 *
Schooling level of networks compared to respondent more (1=yes, 0, otherwise) 0.45 0.41 0.56 *** 0.55 0.55 less (1=yes, 0, otherwise) 0.28 0.31 0.16 *** 0.14 0.19 *** about the same (1=yes, 0, otherwise) 0.28 0.28 0.28 0.29 0.25 **
Source: Central Statistical Agency (CSA) survey (2011). Notes: /a t-test=Difference between female and male heads and between de facto and de jure female heads using statistical test of difference; ***Significant at 1% level; **Significant at 5% level; *Significant at 10% level.
8
Half of the household heads have attended community meetings; 27 percent have access to radio for production and price information; and only six percent have visited farmers' demonstration plots or research centers in the past 12 months. Few households (1–3 percent) have access to newspapers or bulletins for production and price information. Female heads have significantly less access to community meetings, farm demos, radio, bulletin, and newspaper than male heads. De jure female heads have significantly less access to community meetings and radio for production and price information than de facto female heads. All respondents reported having people or information networks to discuss agricultural issues. Female heads reported having fewer networks than male heads, but female heads reported having more educated people and larger farmers than male heads to discuss agricultural issues.
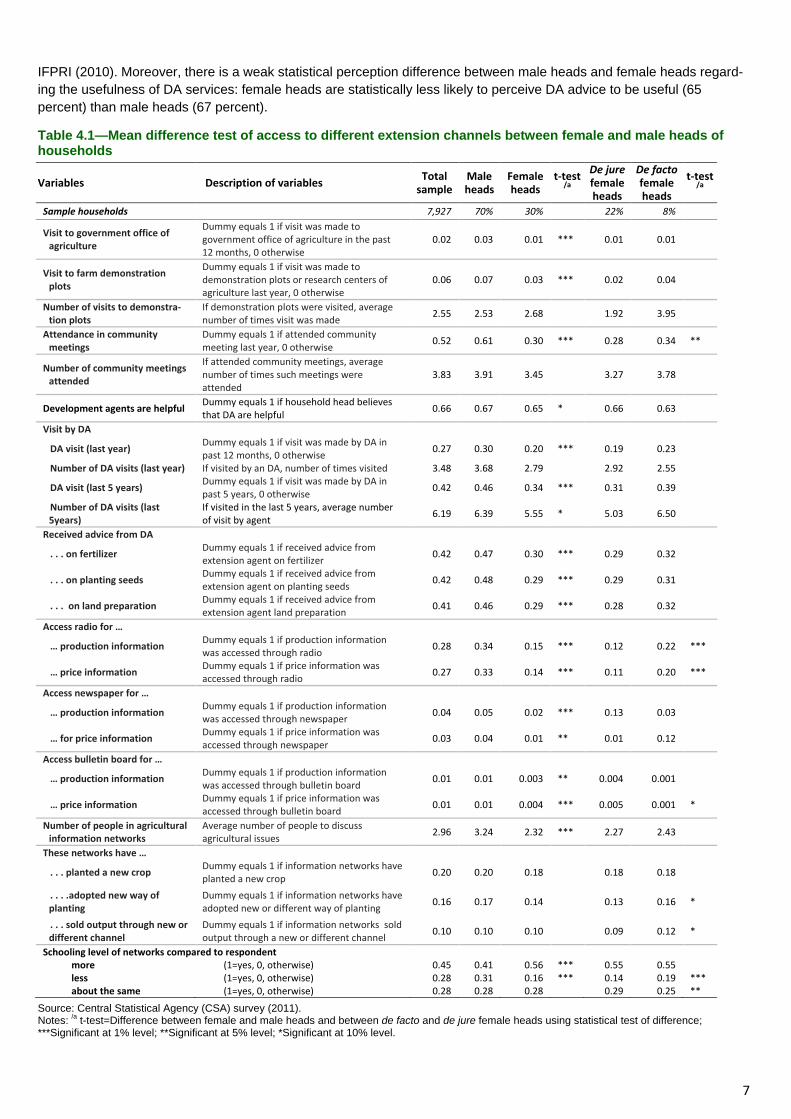
Results of the econometric estimations on access to extension services are presented in Table 4.2. Controlling for other factors, the regression results show a clear difference between female and male heads in access to visits and advice from development agents as well as other channels of information. For instance, male heads are about five percent more likely to be visited by development agents (DA) compared to female heads, holding other factors constant. Male heads are more likely to attend community meetings and visit demonstration plots or research centers. Similar results were found with access to radio for production and price information and receiving advice from DA on fertilizer, planting, or land preparation (not presented as a table in this paper). In addition to gender, the other factors that are found to signifi-cantly affect access to extension services include education, wealth indicators (land size and livestock holdings), propor-tion of male in the households, distance to market, and location dummies. Those with primary level education are more likely to have access to extension services than those with no formal education. Those with larger land size and cattle holding, higher male proportion in the household, and shorter distance to market are more likely to have access to agriculture-related information through different channels.
Table 4.2—Correlates of household level access to extension services (marginal effects)
Explanatory variables Visit by extension agent Attend community meeting Visit demonstration plots
Whole sample
Male heads
Female heads
Whole sample
Male heads
Female heads
Whole sample
Male heads
Female heads
Gender (male=1) 0.046** 0.249*** 0.020** (0.066) (0.065) (0.106) De jure female head (yes=1) -0.049 0.007 0.002 (0.125) (0.122) (0.180) Age in years 0.012*** 0.013*** 0.009 0.027*** 0.029*** 0.011 0.002 0.002 0.001 (0.010) (0.011) (0.020) (0.010) (0.011) (0.020) (0.015) (0.017) (0.034) Age squared -0.000*** -0.000*** 0.000 -0.000*** -0.000*** 0.000 0.000 0.000 0.000 (.000) (.000) (.000) (.000) (.000) (.000) (0.000) (0.000) (0.000) Education of head (omitted=no education) Primary education 0.075*** 0.083*** 0.034 0.068*** 0.062** 0.051 0.020** 0.022** 0.013*
(0.056) (0.062) (0.133) (0.056) (0.061) (0.136) (0.081) (0.088) (0.165)
Secondary education 0.049 0.049 0.08 0.015 0.014 -0.08 -0.004 -0.014 0.047
(0.161) (0.166) (0.571) (0.169) (0.180) (0.653) (0.167) (0.161) (0.707)
Higher education -0.018 -0.026 -0.276* -0.289* 0.04 0.047
(0.308) (0.314) (0.319) (0.323) (0.371) (0.368)
Log of total land size 0.053*** 0.044*** 0.061*** 0.054*** 0.049*** 0.046*** 0.005 0.008 0.000
(0.027) (0.033) (0.049) (0.027) (0.033) (0.048) (0.042) (0.050) (0.076)
Log of tropical livestock unit 0.023*** 0.027*** 0.015*** 0.017*** 0.027*** 0.002 0.002 0.002 0.002
(0.015) (0.021) (0.023) (0.015) (0.019) (0.023) (0.025) (0.031) (0.040)
Proportion of male members 0.106** 0.068 0.142*** 0.116** 0.083 0.186*** 0.001 -0.021 0.017*
(0.128) (0.168) (0.201) (0.126) (0.164) (0.202) (0.207) (0.259) (0.294)
Dummies for primary crop choice YES YES YES YES YES YES YES YES YES Dummy for agroecological zones YES YES YES YES YES YES YES YES YES Dummy for distance to market YES YES YES YES YES YES YES YES YES Dummy for regions YES YES YES YES YES YES YES YES YES Number of observations 7,466 5,291 2,174 7,466 5,291 2,174 7,388 5,236 2,151 Wald chi2 453.45 33.35 12.70 645.02 356.30 104.87 241.86 154.71 103.57 Pseudo R2 0.12 0.12 0.12 0.16 0.12 0.10 0.10 0.08 0.17
Source: Central Statistical Agency (CSA) survey (2011). Notes: Figures are the marginal effects. Figures in parentheses are the robust standard errors. ***Significant at 1% level; **Significant at 5% level; *Significant at 10% level.
9
ESSP II WORKING PAPER XX
There are significant differences in the factors affecting access to different extension services based on the estimates using male heads only and female heads only. Education level is significant in male heads' access to different types of extension services, but education level matters to female heads only in accessing or visiting demonstration plots. Endowment of higher proportion of male members in the household matters more for female heads than for male heads to access the different extension services: female headed households that are endowed with higher proportion of male members are more likely to have been visited by extension agents, attend community meetings, and visit demonstration plots. Age is important for access to different extension channels among male heads (except for radio access); while age is not a significant factor for female heads' access to DA visits. Except for access to radio and visit to demonstration plots, age has a non-linear effect on access to services: older male heads are more likely to access different types of extension services, but at a certain age, the likelihood of access starts to decline with age. Male heads with primary education are more likely to have DA visits, attend community meetings, and visit demonstration plots or research centers.
Land size matters for both male and female heads as a factor affecting visit by extension agents and attendance in community meetings, however, it becomes less significant as a factor in visits to demonstration plots. Asset in the form of livestock is also significant to both female and male heads as a factor in accessing DA visits; to male heads in attending to community meetings, but insignificant to both male and female heads as a factor in visiting demonstration plots. Within the female head only sample, no significant difference is observed between de jure and de facto female heads in their access to various channels of extension service. Similar results were found in the estimations separating female-managed plot only and male-managed plots only.
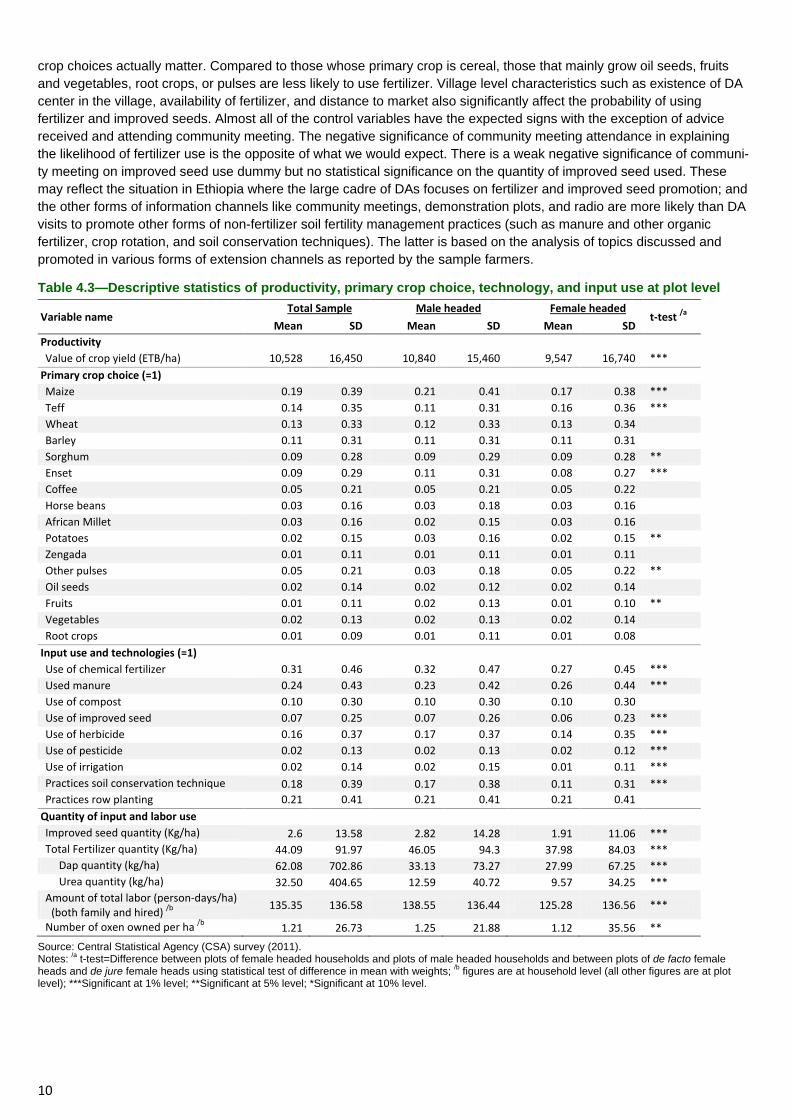
4.2. Gender Differences in Technology Adoption and Input Use In almost all the indicators of technology and input use, female heads are less likely to use or adopt improved technolo-gies and use fewer amounts of inputs (Table 4.3). While 61 percent of households apply fertilizer, about 31 percent of the plots are applied with chemical fertilizer, 24 percent are applied with manure, and 10 percent with compost. There is strong statistical difference between plots of female heads and those of male heads using mean comparison tests (Table 4.3). Plots of male heads are more likely to be applied with chemical fertilizer, while plots of female heads are more likely to be applied with manure. The rate of fertilizer use is significantly greater in plots managed by male heads than those by female heads. Only seven percent of plots are planted with improved seeds. About 16 percent of plots are applied with herbicide, with plots of male heads more likely to be applied with herbicide, with plots of male heads more likely to be planted with improved seeds and planted with greater quantity of seeds than those of female heads. Only two percent of plots are irrigated and applied with pesticide, with plots of male heads more likely to be irrigated and applied with pesticide. About 18 percent reported practicing soil conservation techniques. The amount of labor used is greater for male heads than female heads but the number of oxen used to plow is not significantly different between male and female heads.
The simple mean comparison tests (Table 4.3) suggest strong and statistically significant differences in input usage and technology adoption between female and male heads. However, after controlling for other household, plot, and village level characteristics, input use and adoption of improved management practices are not significantly different between female and male heads and between female and male plot managers4 (Table 4.4). This means that it is not the gender per se of the farmer that is dictating the difference in adoption of technology but it is the gender-differentiated land size and access to extension that explain the different in adoption between women and men. These results are opposite to what Yu et al. (2011) found.
Multivariate probit was also estimated for the dummies and seemingly uncorrelated regression and tobit model for the quantities for fertilizer and improved seed use, but results remained similar in terms of the variables of interest (gender and extension variables).
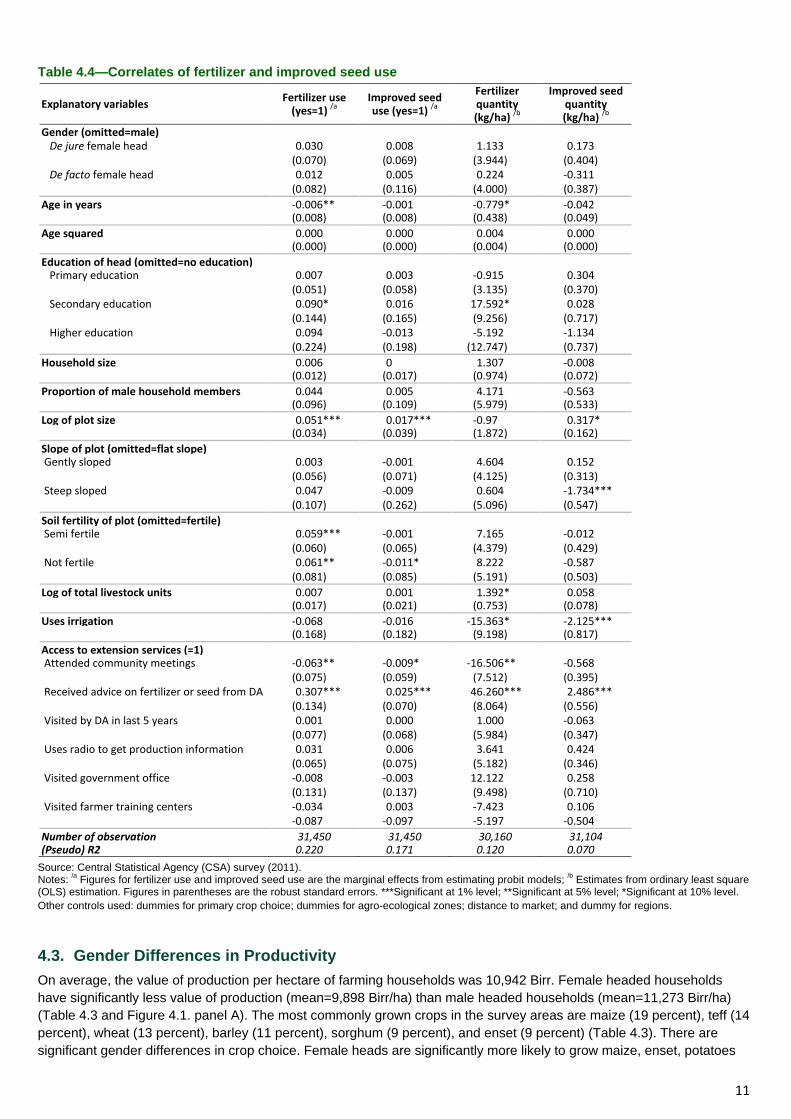
Extension service provision, in the form of DA advice received, is a significant factor that explains whether farmers adopt or not fertilizer and improved seed, and the rate of use of these inputs. Other extension variables, such as frequency of DA visit, access to radio, or attendance to community meetings, are not significant. The difference in terms of access to resources such as land size, education, and access to extension services—particularly with respect to advice on fertiliz-er—could be the leading factors to the observed difference in the application of fertilizer and improved seed between male and female heads.
Characteristics of the household and plot level factors seem to drive the use of these inputs. Households with higher-elevation plots are more likely to use fertilizer or improved seeds than those in lowlands. The results also suggest that
4 Defined as one who has the right to decide on the plot.
10
crop choices actually matter. Compared to those whose primary crop is cereal, those that mainly grow oil seeds, fruits and vegetables, root crops, or pulses are less likely to use fertilizer. Village level characteristics such as existence of DA center in the village, availability of fertilizer, and distance to market also significantly affect the probability of using fertilizer and improved seeds. Almost all of the control variables have the expected signs with the exception of advice received and attending community meeting. The negative significance of community meeting attendance in explaining the likelihood of fertilizer use is the opposite of what we would expect. There is a weak negative significance of communi-ty meeting on improved seed use dummy but no statistical significance on the quantity of improved seed used. These may reflect the situation in Ethiopia where the large cadre of DAs focuses on fertilizer and improved seed promotion; and the other forms of information channels like community meetings, demonstration plots, and radio are more likely than DA visits to promote other forms of non-fertilizer soil fertility management practices (such as manure and other organic fertilizer, crop rotation, and soil conservation techniques). The latter is based on the analysis of topics discussed and promoted in various forms of extension channels as reported by the sample farmers.
Table 4.3—Descriptive statistics of productivity, primary crop choice, technology, and input use at plot level
Variable name Total Sample Male headed Female headed
t-test /a Mean SD Mean SD Mean SD
Productivity Value of crop yield (ETB/ha) 10,528 16,450 10,840 15,460 9,547 16,740 ***
Primary crop choice (=1) Maize 0.19 0.39 0.21 0.41 0.17 0.38 *** Teff 0.14 0.35 0.11 0.31 0.16 0.36 *** Wheat 0.13 0.33 0.12 0.33 0.13 0.34 Barley 0.11 0.31 0.11 0.31 0.11 0.31 Sorghum 0.09 0.28 0.09 0.29 0.09 0.28 ** Enset 0.09 0.29 0.11 0.31 0.08 0.27 *** Coffee 0.05 0.21 0.05 0.21 0.05 0.22 Horse beans 0.03 0.16 0.03 0.18 0.03 0.16 African Millet 0.03 0.16 0.02 0.15 0.03 0.16 Potatoes 0.02 0.15 0.03 0.16 0.02 0.15 ** Zengada 0.01 0.11 0.01 0.11 0.01 0.11 Other pulses 0.05 0.21 0.03 0.18 0.05 0.22 ** Oil seeds 0.02 0.14 0.02 0.12 0.02 0.14 Fruits 0.01 0.11 0.02 0.13 0.01 0.10 ** Vegetables 0.02 0.13 0.02 0.13 0.02 0.14 Root crops 0.01 0.09 0.01 0.11 0.01 0.08
Input use and technologies (=1) Use of chemical fertilizer 0.31 0.46 0.32 0.47 0.27 0.45 *** Used manure 0.24 0.43 0.23 0.42 0.26 0.44 *** Use of compost 0.10 0.30 0.10 0.30 0.10 0.30 Use of improved seed 0.07 0.25 0.07 0.26 0.06 0.23 *** Use of herbicide 0.16 0.37 0.17 0.37 0.14 0.35 *** Use of pesticide 0.02 0.13 0.02 0.13 0.02 0.12 *** Use of irrigation 0.02 0.14 0.02 0.15 0.01 0.11 *** Practices soil conservation technique 0.18 0.39 0.17 0.38 0.11 0.31 *** Practices row planting 0.21 0.41 0.21 0.41 0.21 0.41
Quantity of input and labor use Improved seed quantity (Kg/ha) 2.6 13.58 2.82 14.28 1.91 11.06 *** Total Fertilizer quantity (Kg/ha) 44.09 91.97 46.05 94.3 37.98 84.03 *** Dap quantity (kg/ha) 62.08 702.86 33.13 73.27 27.99 67.25 *** Urea quantity (kg/ha) 32.50 404.65 12.59 40.72 9.57 34.25 *** Amount of total labor (person-days/ha)
(both family and hired) /b 135.35 136.58 138.55 136.44 125.28 136.56 ***
Number of oxen owned per ha /b 1.21 26.73 1.25 21.88 1.12 35.56 ** Source: Central Statistical Agency (CSA) survey (2011). Notes: /a t-test=Difference between plots of female headed households and plots of male headed households and between plots of de facto female heads and de jure female heads using statistical test of difference in mean with weights; /b figures are at household level (all other figures are at plot level); ***Significant at 1% level; **Significant at 5% level; *Significant at 10% level.
11
ESSP II WORKING PAPER XX
Table 4.4—Correlates of fertilizer and improved seed use
Explanatory variables Fertilizer use (yes=1) /a
Improved seed use (yes=1) /a
Fertilizer quantity (kg/ha) /b
Improved seed quantity (kg/ha) /b
Gender (omitted=male) De jure female head 0.030 0.008 1.133 0.173 (0.070) (0.069) (3.944) (0.404) De facto female head 0.012 0.005 0.224 -0.311 (0.082) (0.116) (4.000) (0.387) Age in years -0.006** -0.001 -0.779* -0.042 (0.008) (0.008) (0.438) (0.049) Age squared 0.000 0.000 0.004 0.000 (0.000) (0.000) (0.004) (0.000) Education of head (omitted=no education) Primary education 0.007 0.003 -0.915 0.304 (0.051) (0.058) (3.135) (0.370) Secondary education 0.090* 0.016 17.592* 0.028 (0.144) (0.165) (9.256) (0.717) Higher education 0.094 -0.013 -5.192 -1.134 (0.224) (0.198) (12.747) (0.737) Household size 0.006 0 1.307 -0.008 (0.012) (0.017) (0.974) (0.072) Proportion of male household members 0.044 0.005 4.171 -0.563 (0.096) (0.109) (5.979) (0.533) Log of plot size 0.051*** 0.017*** -0.97 0.317* (0.034) (0.039) (1.872) (0.162) Slope of plot (omitted=flat slope) Gently sloped 0.003 -0.001 4.604 0.152 (0.056) (0.071) (4.125) (0.313) Steep sloped 0.047 -0.009 0.604 -1.734*** (0.107) (0.262) (5.096) (0.547) Soil fertility of plot (omitted=fertile) Semi fertile 0.059*** -0.001 7.165 -0.012 (0.060) (0.065) (4.379) (0.429) Not fertile 0.061** -0.011* 8.222 -0.587 (0.081) (0.085) (5.191) (0.503) Log of total livestock units 0.007 0.001 1.392* 0.058 (0.017) (0.021) (0.753) (0.078) Uses irrigation -0.068 -0.016 -15.363* -2.125*** (0.168) (0.182) (9.198) (0.817) Access to extension services (=1) Attended community meetings -0.063** -0.009* -16.506** -0.568 (0.075) (0.059) (7.512) (0.395) Received advice on fertilizer or seed from DA 0.307*** 0.025*** 46.260*** 2.486*** (0.134) (0.070) (8.064) (0.556) Visited by DA in last 5 years 0.001 0.000 1.000 -0.063 (0.077) (0.068) (5.984) (0.347) Uses radio to get production information 0.031 0.006 3.641 0.424 (0.065) (0.075) (5.182) (0.346) Visited government office -0.008 -0.003 12.122 0.258 (0.131) (0.137) (9.498) (0.710) Visited farmer training centers -0.034 0.003 -7.423 0.106 -0.087 -0.097 -5.197 -0.504 Number of observation 31,450 31,450 30,160 31,104 (Pseudo) R2 0.220 0.171 0.120 0.070
Source: Central Statistical Agency (CSA) survey (2011). Notes: /a Figures for fertilizer use and improved seed use are the marginal effects from estimating probit models; /b Estimates from ordinary least square (OLS) estimation. Figures in parentheses are the robust standard errors. ***Significant at 1% level; **Significant at 5% level; *Significant at 10% level. Other controls used: dummies for primary crop choice; dummies for agro-ecological zones; distance to market; and dummy for regions.
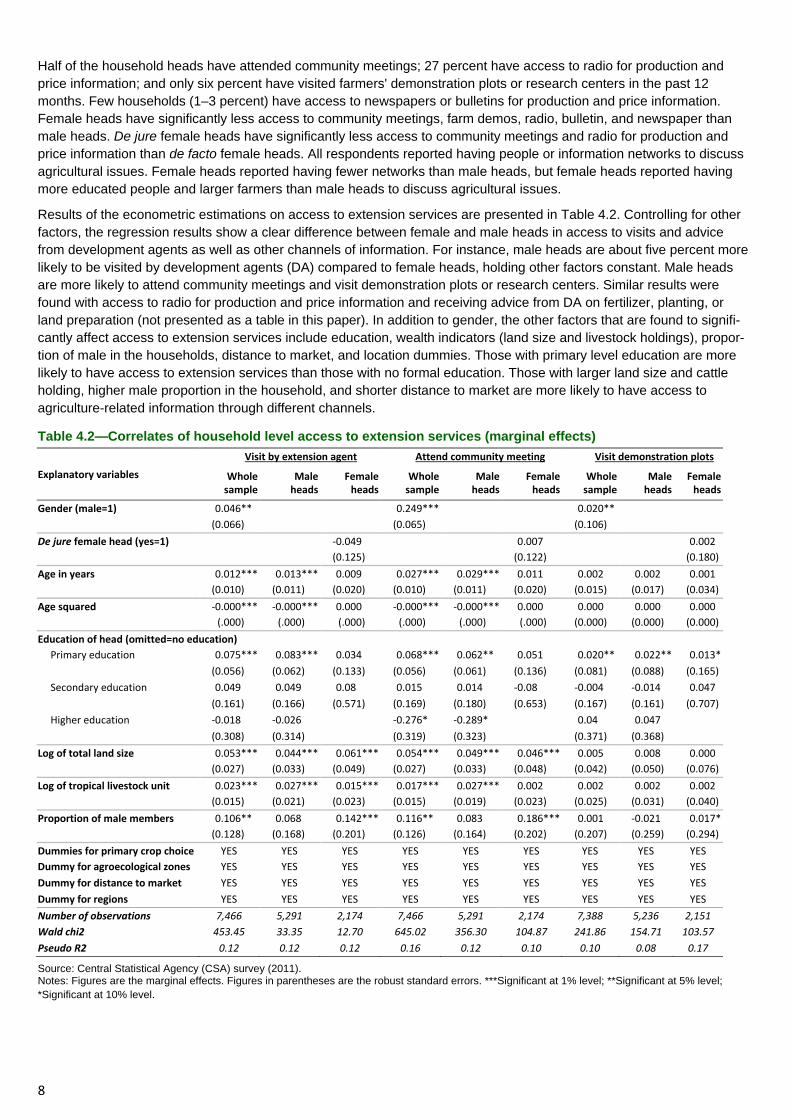
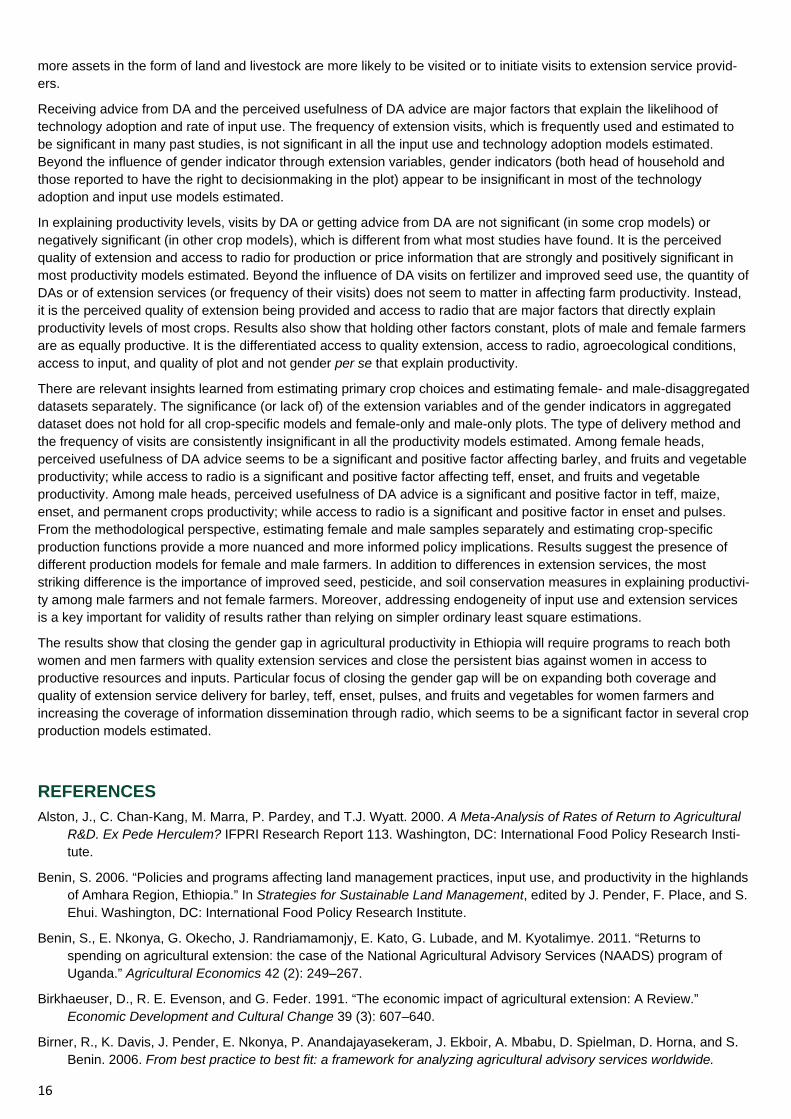
4.3. Gender Differences in Productivity On average, the value of production per hectare of farming households was 10,942 Birr. Female headed households have significantly less value of production (mean=9,898 Birr/ha) than male headed households (mean=11,273 Birr/ha) (Table 4.3 and Figure 4.1. panel A). The most commonly grown crops in the survey areas are maize (19 percent), teff (14 percent), wheat (13 percent), barley (11 percent), sorghum (9 percent), and enset (9 percent) (Table 4.3). There are significant gender differences in crop choice. Female heads are significantly more likely to grow maize, enset, potatoes
12
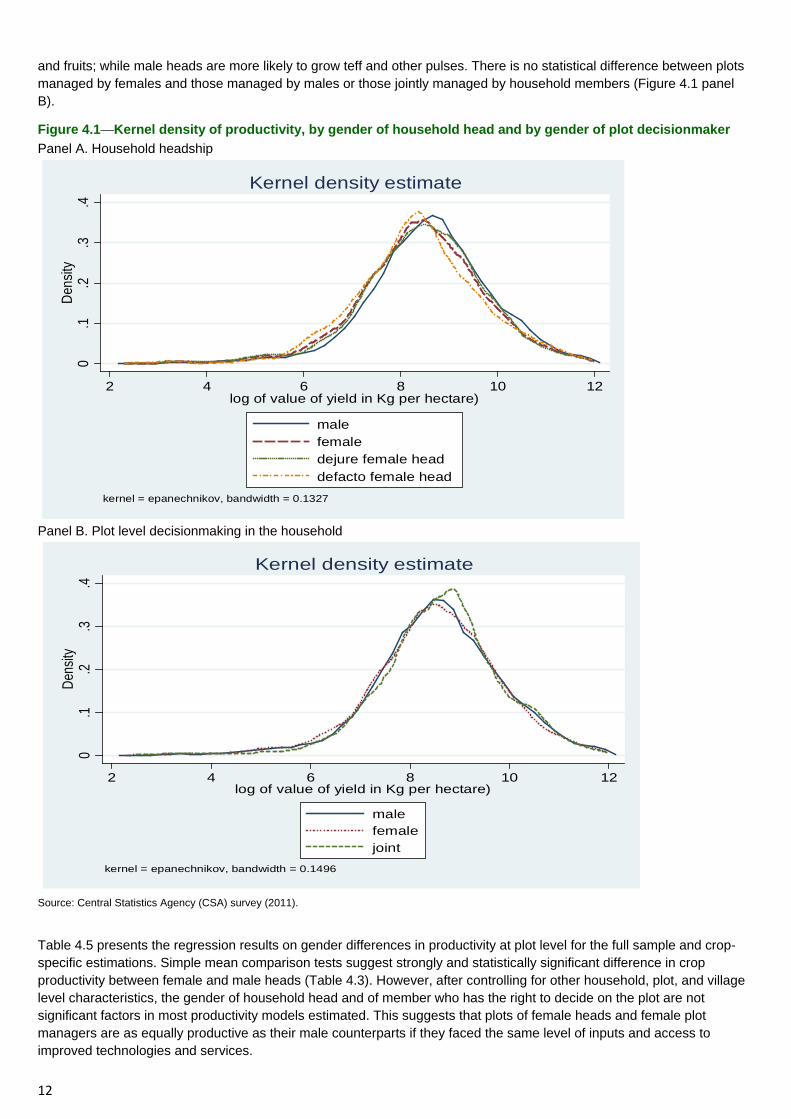
and fruits; while male heads are more likely to grow teff and other pulses. There is no statistical difference between plots managed by females and those managed by males or those jointly managed by household members (Figure 4.1 panel B).
Figure 4.1—Kernel density of productivity, by gender of household head and by gender of plot decisionmaker Panel A. Household headship
Panel B. Plot level decisionmaking in the household
Source: Central Statistics Agency (CSA) survey (2011).
Table 4.5 presents the regression results on gender differences in productivity at plot level for the full sample and crop-specific estimations. Simple mean comparison tests suggest strongly and statistically significant difference in crop productivity between female and male heads (Table 4.3). However, after controlling for other household, plot, and village level characteristics, the gender of household head and of member who has the right to decide on the plot are not significant factors in most productivity models estimated. This suggests that plots of female heads and female plot managers are as equally productive as their male counterparts if they faced the same level of inputs and access to improved technologies and services.
0.1
.2.3
.4De
nsity
2 4 6 8 10 12log of value of yield in Kg per hectare)
malefemaledejure female headdefacto female head
kernel = epanechnikov, bandwidth = 0.1327
Kernel density estimate
0.1
.2.3
.4De
nsity
2 4 6 8 10 12log of value of yield in Kg per hectare)
malefemalejoint
kernel = epanechnikov, bandwidth = 0.1496
Kernel density estimate
13
ESSP II WORKING PAPER XX
Table 4.5—Results of the productivity regression, by full sample and primary crops
Explanatory variables Full sample
Full sample, controlling for crops
Teff Barley Wheat Maize Enset Fruits Permanent crops
Male head 0.054 0.083 -0.077 0.454** 0.155 -0.115 0.330 0.207 0.046 (0.046) (0.093) (0.142) (0.224) (0.211) (0.097) (0.278) (0.196) (0.203) Received advice on fertilizer
1.077 -0.744 -1.358 2.153 1.532 3.284 -3.043 -1.139 -0.891
(1.281) (2.157) (2.307) (3.119) (2.575) (2.221) (1.944) (4.337) (2.451) Received advice on planting
1.766 0.399 0.911 -2.480 -1.886 -3.170 -0.063 1.063 -0.156
(1.281) (2.734) (2.353) (2.846) (2.187) (2.088) (1.831) (4.388) (2.390) Perceived usefulness of DA
0.166*** 0.023 0.216* 0.090 0.057 0.063 0.759*** 0.189 0.576**
(0.057) (0.280) (0.127) (0.299) (0.168) (0.100) (0.267) (0.259) (0.253) Production information 0.161 -0.336 0.064 -0.797 -0.878* 0.241 0.157 0.013 -0.175 through radio (0.140) (0.661) (0.301) (0.491) (0.455) (0.257) (0.834) (0.350) (0.356) Used fertilizer 0.877*** 1.354 0.179 2.040*** 1.201*** 2.562** 2.877 1.168* 0.867 (0.205) (1.887) (0.239) (0.612) (0.418) (1.040) (1.781) (0.639) (1.328) Used improved seeds 1.946** 1.923 1.918 -5.508* 0.664 -2.555* 4.059** (0.130) (0.886) (7.854) (1.386) (2.824) (0.975) (1.480) (1.601) (3.370) Used irrigation 2.523** 8.257** 5.580 -14.602 -9.058 -4.303 -0.387 -0.530 6.670 (1.197) (3.536) (4.008) (11.925) (9.649) (4.139) (2.901) (1.252) (8.882) Used pesticide 3.385** -0.584 -1.919 -2.927 0.335 3.997* 35.714 -3.723 1.171 (1.345) (2.467) (2.872) (8.150) (1.627) (2.425) (38.593) (6.148) (3.153) Log (units of oxen per ha) 0.087*** 0.087*** 0.085*** 0.123** 0.108*** 0.080*** 0.110*** 0.101*** -0.019 (0.008) (0.013) (0.020) (0.050) (0.025) (0.017) (0.025) (0.036) (0.043) Log (total labor per ha) 0.068*** 0.036 0.054* 0.014 0.027 0.032 0.165*** 0.064* 0.134*** (0.010) (0.036) (0.033) (0.065) (0.050) (0.020) (0.030) (0.038) (0.040) Log (age) 0.059 0.047 -0.050 0.083 -0.211 -0.168 0.341* 0.144 -0.098 (0.046) (0.128) (0.178) (0.209) (0.133) (0.105) (0.202) (0.289) (0.231) Slope (omitted=1) Gently sloped -0.044 -0.174 0.041 0.062 0.025 -0.062 0.348* 0.255 0.153 (0.034) (0.180) (0.182) (0.152) (0.117) (0.085) (0.179) (0.255) (0.154) Steep -0.094 -0.465 -0.182 -0.445 -0.267 -0.148 -0.159 0.919 0.088 (0.126) (0.450) (0.372) (0.369) (0.288) (0.491) (0.650) (0.561) (0.707) Plot is fertile 0.087** 0.064 0.116 0.193 0.351*** 0.013 -0.017 -0.044 0.074 (0.037) (0.112) (0.088) (0.126) (0.134) (0.075) (0.174) (0.157) (0.233) Agroecological and
regional controls YES YES YES YES YES YES YES YES YES
Constant 7.159*** 7.740*** 7.420*** 6.364*** 7.757*** 7.641*** 6.001*** 5.797*** 7.437*** (0.192) (0.813) (0.790) (0.916) (0.813) (0.435) (0.789) (1.042) (0.998) N 31352 31352 2059 2609 3009 4805 1939 1216 1510 R-squared 0.97 0.95 0.98 0.95 0.98 0.97 0.91 0.95 0.96 Centered R-squared (0.35) (1.41) (1.02) (2.58) (1.30) (1.30) (1.55) (0.09) (0.17) AIC 114572 132838 6572 10921 10437 17956 8734 4892 6027 BIC 114739 133039 6679 11038 10557 18079 8835 4994 6128 Log-likelihood (57266) (66395) (3267) (5440) (5198) (8959) (4349) (2426) (2994)
Source: Central Statistical Agency (CSA) survey (2011). Notes: Figures in parentheses are the robust standard errors. The controls used are (1) dummy for growth poles under the AGP (Agricultural Growth Program), which is a program initiated by the government of Ethiopia and its development partners, focusing on achieving, among others, high productivity increases in those woredas traditionally considered as high growth potential and the controls are woredas with comparable potential but are not selected for the AGP; and (2) dummies representing different agroecological areas (Wurch, Dega, Weina Dega, and Kolla, respectively, refer to Extreme-highland, highland, mid-highland, and lowland areas). ***Significant at 1% level; **Significant at 5% level; *Significant at 10% level. The instruments used are household level variables including measures of education of household head, trust among household head to DAs working with them, household size, proportion of male in household, distance of plot from the residence of the household, and number of livestock units; and village level and district level variables including number of producer associations in the village, distance to market, access to improved seed in the village, size of plot, availability of DA center in the village, and population density in the district.
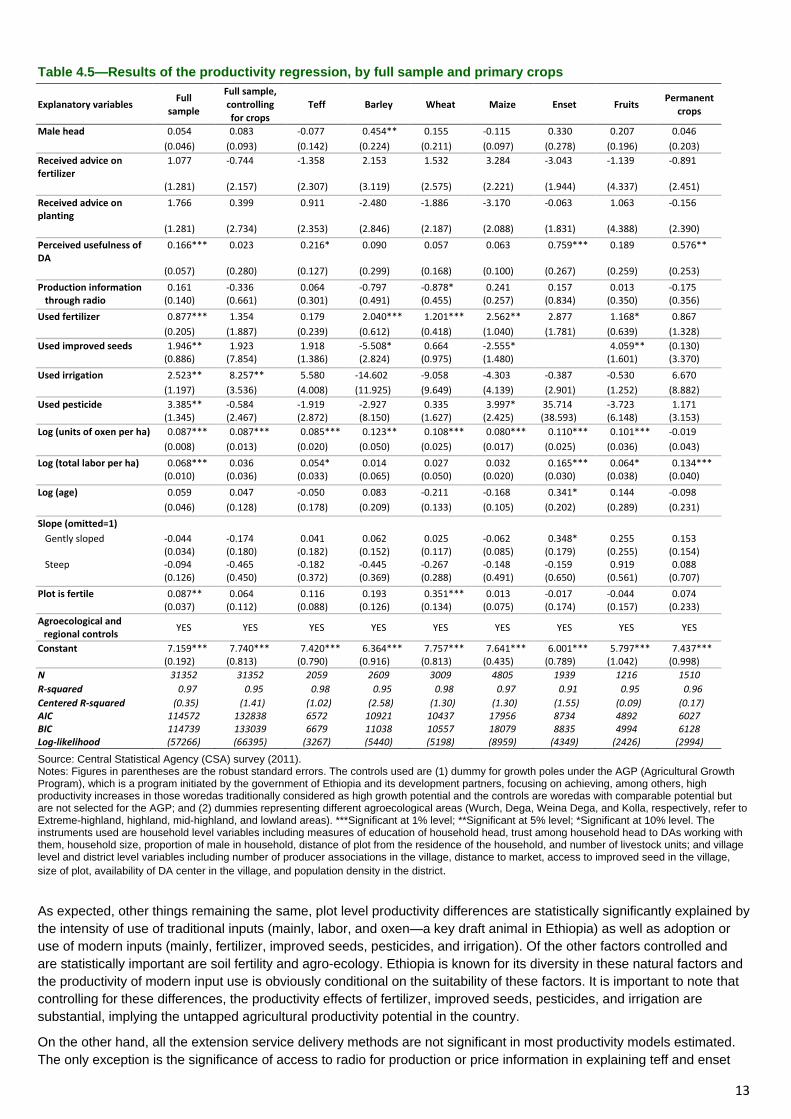
As expected, other things remaining the same, plot level productivity differences are statistically significantly explained by the intensity of use of traditional inputs (mainly, labor, and oxen—a key draft animal in Ethiopia) as well as adoption or use of modern inputs (mainly, fertilizer, improved seeds, pesticides, and irrigation). Of the other factors controlled and are statistically important are soil fertility and agro-ecology. Ethiopia is known for its diversity in these natural factors and the productivity of modern input use is obviously conditional on the suitability of these factors. It is important to note that controlling for these differences, the productivity effects of fertilizer, improved seeds, pesticides, and irrigation are substantial, implying the untapped agricultural productivity potential in the country.
On the other hand, all the extension service delivery methods are not significant in most productivity models estimated. The only exception is the significance of access to radio for production or price information in explaining teff and enset
14
productivity. Visits of extension agents have been shown to be significant in explaining yield, consumption patterns, poverty levels, and productivity levels by many studies (including Yu et al. 2011; Dercon et al. 2009; and Benin 2006), and this is in contrast with the findings of this paper.
This may point to the fact that much of the extension service efforts in Ethiopia, including the training and visit (T&V) services of the DA, are focused on input delivery and persuading farmers to adopt new technologies, particularly fertilizer and improved seeds—and more recently household level water-harvesting and irrigation. Beyond the influence of visits or advice by DAs on fertilizer and improved seed use, there is no other direct effect on productivity. It is the perceived quality of extension service that appeared to be significant for the crop productivity models.
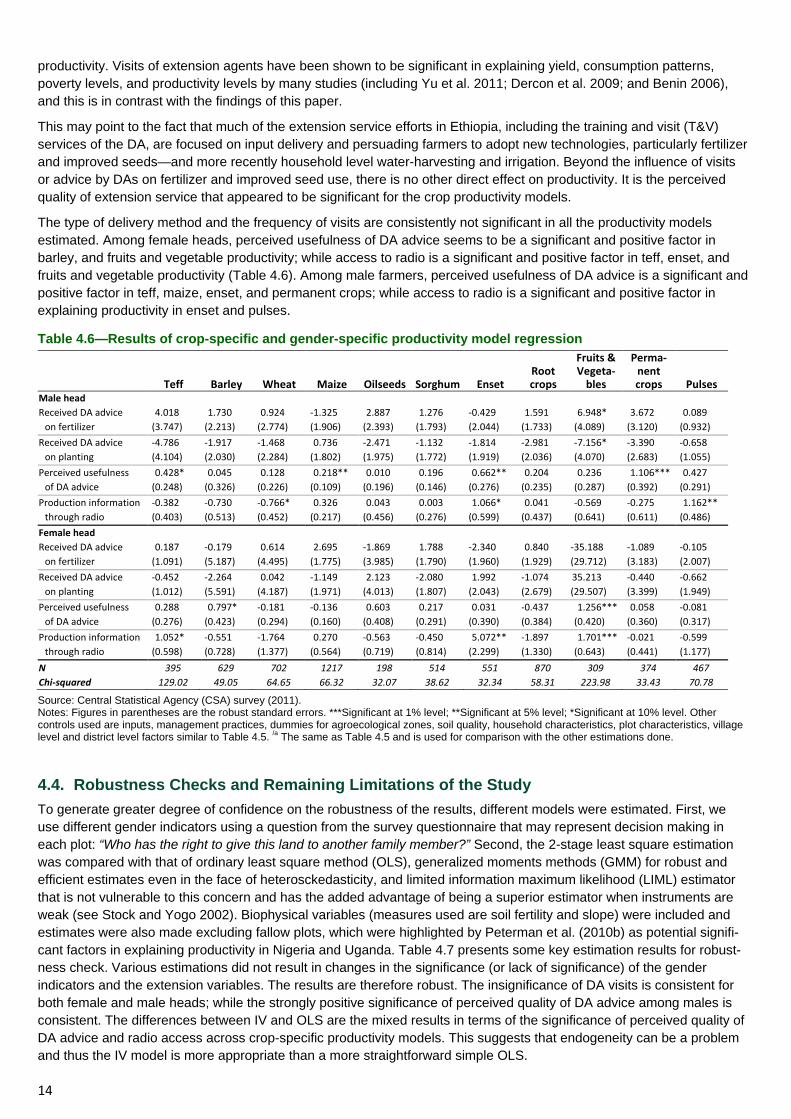
The type of delivery method and the frequency of visits are consistently not significant in all the productivity models estimated. Among female heads, perceived usefulness of DA advice seems to be a significant and positive factor in barley, and fruits and vegetable productivity; while access to radio is a significant and positive factor in teff, enset, and fruits and vegetable productivity (Table 4.6). Among male farmers, perceived usefulness of DA advice is a significant and positive factor in teff, maize, enset, and permanent crops; while access to radio is a significant and positive factor in explaining productivity in enset and pulses.
Table 4.6—Results of crop-specific and gender-specific productivity model regression
Teff Barley Wheat Maize Oilseeds Sorghum Enset
Root crops
Fruits & Vegeta-
bles
Perma-nent crops Pulses
Male head Received DA advice 4.018 1.730 0.924 -1.325 2.887 1.276 -0.429 1.591 6.948* 3.672 0.089
on fertilizer (3.747) (2.213) (2.774) (1.906) (2.393) (1.793) (2.044) (1.733) (4.089) (3.120) (0.932) Received DA advice -4.786 -1.917 -1.468 0.736 -2.471 -1.132 -1.814 -2.981 -7.156* -3.390 -0.658
on planting (4.104) (2.030) (2.284) (1.802) (1.975) (1.772) (1.919) (2.036) (4.070) (2.683) (1.055) Perceived usefulness 0.428* 0.045 0.128 0.218** 0.010 0.196 0.662** 0.204 0.236 1.106*** 0.427
of DA advice (0.248) (0.326) (0.226) (0.109) (0.196) (0.146) (0.276) (0.235) (0.287) (0.392) (0.291) Production information -0.382 -0.730 -0.766* 0.326 0.043 0.003 1.066* 0.041 -0.569 -0.275 1.162**
through radio (0.403) (0.513) (0.452) (0.217) (0.456) (0.276) (0.599) (0.437) (0.641) (0.611) (0.486) Female head Received DA advice 0.187 -0.179 0.614 2.695 -1.869 1.788 -2.340 0.840 -35.188 -1.089 -0.105
on fertilizer (1.091) (5.187) (4.495) (1.775) (3.985) (1.790) (1.960) (1.929) (29.712) (3.183) (2.007) Received DA advice -0.452 -2.264 0.042 -1.149 2.123 -2.080 1.992 -1.074 35.213 -0.440 -0.662
on planting (1.012) (5.591) (4.187) (1.971) (4.013) (1.807) (2.043) (2.679) (29.507) (3.399) (1.949) Perceived usefulness 0.288 0.797* -0.181 -0.136 0.603 0.217 0.031 -0.437 1.256*** 0.058 -0.081
of DA advice (0.276) (0.423) (0.294) (0.160) (0.408) (0.291) (0.390) (0.384) (0.420) (0.360) (0.317) Production information 1.052* -0.551 -1.764 0.270 -0.563 -0.450 5.072** -1.897 1.701*** -0.021 -0.599
through radio (0.598) (0.728) (1.377) (0.564) (0.719) (0.814) (2.299) (1.330) (0.643) (0.441) (1.177) N 395 629 702 1217 198 514 551 870 309 374 467 Chi-squared 129.02 49.05 64.65 66.32 32.07 38.62 32.34 58.31 223.98 33.43 70.78
Source: Central Statistical Agency (CSA) survey (2011). Notes: Figures in parentheses are the robust standard errors. ***Significant at 1% level; **Significant at 5% level; *Significant at 10% level. Other controls used are inputs, management practices, dummies for agroecological zones, soil quality, household characteristics, plot characteristics, village level and district level factors similar to Table 4.5. /a The same as Table 4.5 and is used for comparison with the other estimations done.
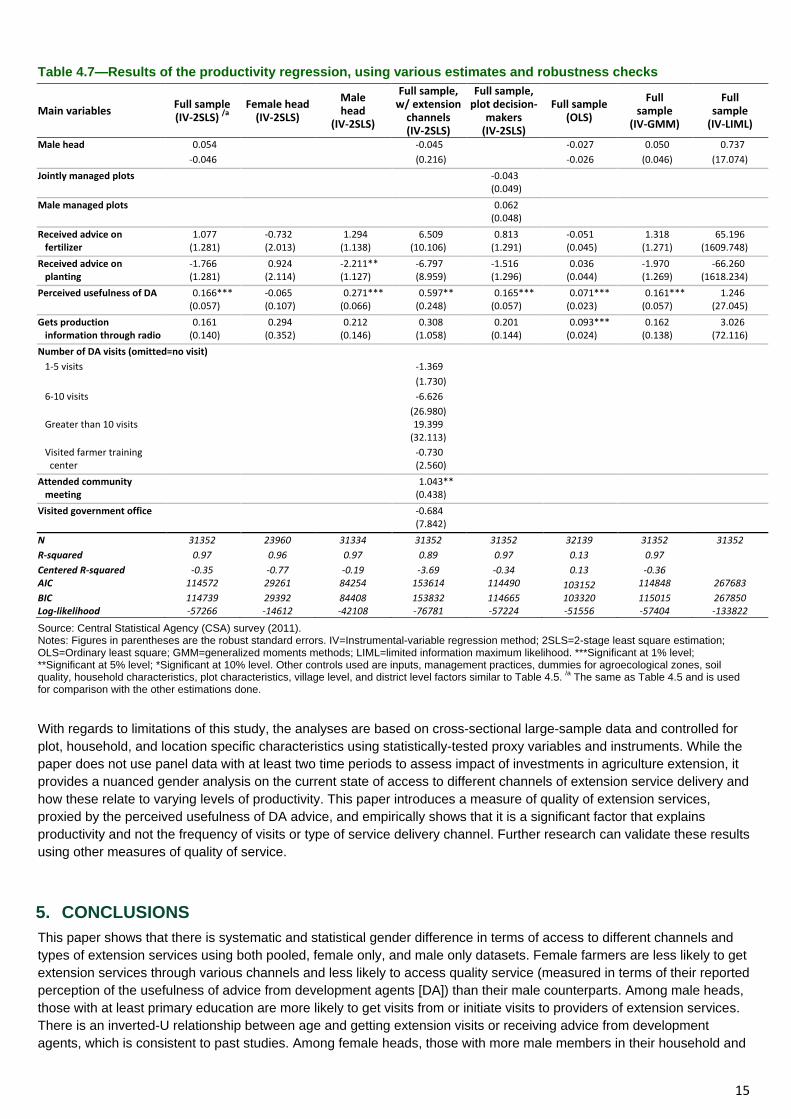
4.4. Robustness Checks and Remaining Limitations of the Study To generate greater degree of confidence on the robustness of the results, different models were estimated. First, we use different gender indicators using a question from the survey questionnaire that may represent decision making in each plot: “Who has the right to give this land to another family member?” Second, the 2-stage least square estimation was compared with that of ordinary least square method (OLS), generalized moments methods (GMM) for robust and efficient estimates even in the face of heterosckedasticity, and limited information maximum likelihood (LIML) estimator that is not vulnerable to this concern and has the added advantage of being a superior estimator when instruments are weak (see Stock and Yogo 2002). Biophysical variables (measures used are soil fertility and slope) were included and estimates were also made excluding fallow plots, which were highlighted by Peterman et al. (2010b) as potential signifi-cant factors in explaining productivity in Nigeria and Uganda. Table 4.7 presents some key estimation results for robust-ness check. Various estimations did not result in changes in the significance (or lack of significance) of the gender indicators and the extension variables. The results are therefore robust. The insignificance of DA visits is consistent for both female and male heads; while the strongly positive significance of perceived quality of DA advice among males is consistent. The differences between IV and OLS are the mixed results in terms of the significance of perceived quality of DA advice and radio access across crop-specific productivity models. This suggests that endogeneity can be a problem and thus the IV model is more appropriate than a more straightforward simple OLS.
15
ESSP II WORKING PAPER XX
Table 4.7—Results of the productivity regression, using various estimates and robustness checks
Main variables Full sample (IV-2SLS) /a
Female head (IV-2SLS)
Male head
(IV-2SLS)
Full sample, w/ extension
channels (IV-2SLS)
Full sample, plot decision-
makers (IV-2SLS)
Full sample (OLS)
Full sample
(IV-GMM)
Full sample
(IV-LIML)
Male head 0.054 -0.045 -0.027 0.050 0.737 -0.046 (0.216) -0.026 (0.046) (17.074) Jointly managed plots -0.043 (0.049) Male managed plots 0.062 (0.048) Received advice on 1.077 -0.732 1.294 6.509 0.813 -0.051 1.318 65.196 fertilizer (1.281) (2.013) (1.138) (10.106) (1.291) (0.045) (1.271) (1609.748) Received advice on -1.766 0.924 -2.211** -6.797 -1.516 0.036 -1.970 -66.260 planting (1.281) (2.114) (1.127) (8.959) (1.296) (0.044) (1.269) (1618.234) Perceived usefulness of DA 0.166*** -0.065 0.271*** 0.597** 0.165*** 0.071*** 0.161*** 1.246 (0.057) (0.107) (0.066) (0.248) (0.057) (0.023) (0.057) (27.045) Gets production 0.161 0.294 0.212 0.308 0.201 0.093*** 0.162 3.026 information through radio (0.140) (0.352) (0.146) (1.058) (0.144) (0.024) (0.138) (72.116) Number of DA visits (omitted=no visit) 1-5 visits -1.369 (1.730) 6-10 visits -6.626 (26.980) Greater than 10 visits 19.399 (32.113) Visited farmer training -0.730 center (2.560) Attended community 1.043** meeting (0.438) Visited government office -0.684 (7.842) N 31352 23960 31334 31352 31352 32139 31352 31352 R-squared 0.97 0.96 0.97 0.89 0.97 0.13 0.97 Centered R-squared -0.35 -0.77 -0.19 -3.69 -0.34 0.13 -0.36 AIC 114572 29261 84254 153614 114490 103152 114848 267683 BIC 114739 29392 84408 153832 114665 103320 115015 267850 Log-likelihood -57266 -14612 -42108 -76781 -57224 -51556 -57404 -133822
Source: Central Statistical Agency (CSA) survey (2011). Notes: Figures in parentheses are the robust standard errors. IV=Instrumental-variable regression method; 2SLS=2-stage least square estimation; OLS=Ordinary least square; GMM=generalized moments methods; LIML=limited information maximum likelihood. ***Significant at 1% level; **Significant at 5% level; *Significant at 10% level. Other controls used are inputs, management practices, dummies for agroecological zones, soil quality, household characteristics, plot characteristics, village level, and district level factors similar to Table 4.5. /a The same as Table 4.5 and is used for comparison with the other estimations done.
With regards to limitations of this study, the analyses are based on cross-sectional large-sample data and controlled for plot, household, and location specific characteristics using statistically-tested proxy variables and instruments. While the paper does not use panel data with at least two time periods to assess impact of investments in agriculture extension, it provides a nuanced gender analysis on the current state of access to different channels of extension service delivery and how these relate to varying levels of productivity. This paper introduces a measure of quality of extension services, proxied by the perceived usefulness of DA advice, and empirically shows that it is a significant factor that explains productivity and not the frequency of visits or type of service delivery channel. Further research can validate these results using other measures of quality of service.
5. CONCLUSIONS This paper shows that there is systematic and statistical gender difference in terms of access to different channels and types of extension services using both pooled, female only, and male only datasets. Female farmers are less likely to get extension services through various channels and less likely to access quality service (measured in terms of their reported perception of the usefulness of advice from development agents [DA]) than their male counterparts. Among male heads, those with at least primary education are more likely to get visits from or initiate visits to providers of extension services. There is an inverted-U relationship between age and getting extension visits or receiving advice from development agents, which is consistent to past studies. Among female heads, those with more male members in their household and
16
more assets in the form of land and livestock are more likely to be visited or to initiate visits to extension service provid-ers.
Receiving advice from DA and the perceived usefulness of DA advice are major factors that explain the likelihood of technology adoption and rate of input use. The frequency of extension visits, which is frequently used and estimated to be significant in many past studies, is not significant in all the input use and technology adoption models estimated. Beyond the influence of gender indicator through extension variables, gender indicators (both head of household and those reported to have the right to decisionmaking in the plot) appear to be insignificant in most of the technology adoption and input use models estimated.
In explaining productivity levels, visits by DA or getting advice from DA are not significant (in some crop models) or negatively significant (in other crop models), which is different from what most studies have found. It is the perceived quality of extension and access to radio for production or price information that are strongly and positively significant in most productivity models estimated. Beyond the influence of DA visits on fertilizer and improved seed use, the quantity of DAs or of extension services (or frequency of their visits) does not seem to matter in affecting farm productivity. Instead, it is the perceived quality of extension being provided and access to radio that are major factors that directly explain productivity levels of most crops. Results also show that holding other factors constant, plots of male and female farmers are as equally productive. It is the differentiated access to quality extension, access to radio, agroecological conditions, access to input, and quality of plot and not gender per se that explain productivity.
There are relevant insights learned from estimating primary crop choices and estimating female- and male-disaggregated datasets separately. The significance (or lack of) of the extension variables and of the gender indicators in aggregated dataset does not hold for all crop-specific models and female-only and male-only plots. The type of delivery method and the frequency of visits are consistently insignificant in all the productivity models estimated. Among female heads, perceived usefulness of DA advice seems to be a significant and positive factor affecting barley, and fruits and vegetable productivity; while access to radio is a significant and positive factor affecting teff, enset, and fruits and vegetable productivity. Among male heads, perceived usefulness of DA advice is a significant and positive factor in teff, maize, enset, and permanent crops productivity; while access to radio is a significant and positive factor in enset and pulses. From the methodological perspective, estimating female and male samples separately and estimating crop-specific production functions provide a more nuanced and more informed policy implications. Results suggest the presence of different production models for female and male farmers. In addition to differences in extension services, the most striking difference is the importance of improved seed, pesticide, and soil conservation measures in explaining productivi-ty among male farmers and not female farmers. Moreover, addressing endogeneity of input use and extension services is a key important for validity of results rather than relying on simpler ordinary least square estimations.
The results show that closing the gender gap in agricultural productivity in Ethiopia will require programs to reach both women and men farmers with quality extension services and close the persistent bias against women in access to productive resources and inputs. Particular focus of closing the gender gap will be on expanding both coverage and quality of extension service delivery for barley, teff, enset, pulses, and fruits and vegetables for women farmers and increasing the coverage of information dissemination through radio, which seems to be a significant factor in several crop production models estimated.
REFERENCES Alston, J., C. Chan-Kang, M. Marra, P. Pardey, and T.J. Wyatt. 2000. A Meta-Analysis of Rates of Return to Agricultural
R&D. Ex Pede Herculem? IFPRI Research Report 113. Washington, DC: International Food Policy Research Insti-tute.
Benin, S. 2006. “Policies and programs affecting land management practices, input use, and productivity in the highlands of Amhara Region, Ethiopia.” In Strategies for Sustainable Land Management, edited by J. Pender, F. Place, and S. Ehui. Washington, DC: International Food Policy Research Institute.
Benin, S., E. Nkonya, G. Okecho, J. Randriamamonjy, E. Kato, G. Lubade, and M. Kyotalimye. 2011. “Returns to spending on agricultural extension: the case of the National Agricultural Advisory Services (NAADS) program of Uganda.” Agricultural Economics 42 (2): 249–267.
Birkhaeuser, D., R. E. Evenson, and G. Feder. 1991. “The economic impact of agricultural extension: A Review.” Economic Development and Cultural Change 39 (3): 607–640.
Birner, R., K. Davis, J. Pender, E. Nkonya, P. Anandajayasekeram, J. Ekboir, A. Mbabu, D. Spielman, D. Horna, and S. Benin. 2006. From best practice to best fit: a framework for analyzing agricultural advisory services worldwide.
17
ESSP II WORKING PAPER XX
DSGD Discussion Paper 37. Washington, DC: Development Strategy and Governance Division, International Food Policy Research Institute.
Bishop-Sambrook, C. 2004. “Gender Analysis: An Overview of Gender Issues in the Agricultural Sector of Ethiopia.” Mimeo. Addis Ababa, Ethiopia: Improving Productivity and Market Success (IPMS), International Livestock Re-search Institute.
Byerlee, D., D.J. Spielman, D. Alemu, and M. Gautam. 2007. Policies to Promote Cereal Intensification in Ethiopia: A Review of Evidence and Experience. IFPRI Discussion Paper 707. Washington, DC: International Food Policy Re-search Institute.
Davis, K. 2008. “Extension in Sub-Saharan Africa: Overview and Assessment of Past and Current Models, and Future Prospects.” Journal of International Agricultural Education and Extension 15 (3): 15–28.
Davis, K., B. Swanson, D. Amudavi, D. Ayalew Mekonnen, A. Flohrs, J. Riese, C. Lamb, and E. Zerfu. 2010. In-Depth Assessment of the Public Agricultural Extension System of Ethiopia and Recommendations for Improvement. IFPRI Discussion Paper 01041. Washington, DC: International Food Policy Research Institute.
Dercon, S., D. Gilligan, J. Hoddinott, and T. Woldehanna. 2009. “The Impact of Agricultural Extension and Roads on Poverty and Consumption Growth in Fifteen Ethiopian Villages.” American Journal of Agricultural Economics 91 (4): 1007–1021.
Doss, C., and M. Morris. 2001. "How Does Gender Affect the Adoption of Agricultural Innovations? The Case of Im-proved Maize Technology in Ghana." Agricultural Economics 25 (1): 27–39.
EEA/EEPRI (Ethiopian Economic Association/Ethiopian Economic Policy Research Institute). 2006. “Evaluation of the Ethiopian Agricultural Extension with Particular Emphasis on the Participatory Demonstration and Training Exten-sion System (PADETES).” Addis Ababa, Ethiopia: EEA/EEPRI.
Fafchamps, M., and A. Quisumbing. 2005. “Marriage, Bequest and Assortative Matching in Rural Ethiopia.” Economic Development and Cultural Change 53 (2): 347–380.
Feder, G., R. Birner, and J. Anderson. 2011. The private sector’s role in agricultural extension systems: potential and limitations.” Journal of Agribusiness in Developing and Emerging Economies 1 (1): 31–54.
Gilbert, G.A., W.D. Sakala, and T.D. Benson. 2002. “Gender analysis of a nationwide cropping system trial survey in Malawi.” African Studies Quarterly 6 (1): 223–243.
Katungi, E., S. Edmeades, and M. Smale. 2008. “Gender, Social Capital, and Information Exchange in Rural Uganda.” Journal of International Development 20: 35–52.
Koru, B., and S. Holden. 2009. “Difference in maize productivity between male- and female-headed households in Uganda.” CSAE Conference Papers. http://www.csae.ox.ac.uk/conferences/2011-EDiA/papers/122-Koru.pdf
Mogues, T., M. Cohen, R. Birner, M. Lemma, J. Randriamamonjy, F. Tadesse, and Z. Paulos. 2009. Agricultural Exten-sion in Ethiopia through a Gender and Governance Lens. ESSP II Discussion Paper 7. Addis Ababa, Ethiopia: Ethi-opia Strategy Support Program II, International Food Policy Research Institute.
Oladeebo, J.O., and A.A. Fajuyigbe. 2007. “Technical Efficiency of Men and Women upland Rice Farmers in Osun State, Nigeria.” Journal of Human Ecology 22 (2): 93–100.
Owens, T., J. Hoddinott, and B. Kinsey. 2003. “The impact of agricultural extension on farm production in resettlement areas of Zimbabwe.” Economic Development and Cultural Change 51 (2): 337–357.
Peterman, A., J. Behrman, and A. Quisumbing. 2010a. A Review of Empirical Evidence on Gender Differences in Nonland Agricultural Inputs, Technology, and Services in Developing Countries. IFPRI Discussion Paper 00975. Washington, DC: International Food Policy Research Institute.
Peterman, A., A. Quisumbing, J. Behrman, and E. Nkonya. 2010b. Understanding Gender Differences in Agricultural Productivity in Uganda and Nigeria. IFPRI Discussion Paper 01003. Washington, DC: International Food Policy Re-search Institute.
Ragasa, C. 2012. “Improving Gender-Responsiveness on Agricultural Extension.” In Gender in Agriculture and Food Security: Closing the Knowledge Gap, edited by A. Quisumbing, R. Meinzen-Dick, T. Raney, A. Croppenstedt, J. Behrman, and A. Peterman. Springer (forthcoming).
18
INTERNATIONAL FOOD POLICY RESEARCH INSTITUTE 2033 K Street, NW | Washington, DC 20006-1002 USA | T: +1.202.862.5600 | F: +1.202.457.4439 | Skype: ifprihomeoffice | [email protected] | www.ifpri.org
IFPRI–ESSP II ADDIS ABABA P.O. Box 5689, Addis Ababa, Ethiopia | T: +251.11.617.2000 | F: +251.11.646.2318 | [email protected] | http://essp.ifpri.info
ETHIOPIAN DEVELOPMENT RESEARCH INSTITUTE P.O. Box 2479, Addis Ababa, Ethiopia | T: +251.11.550.6066 ; +251.11.553.8633 | F: +251.11.550.5588 | [email protected] | www.edri-eth.org
This Working Paper has been prepared as an ESSP II output, and has not been peer reviewed. Any opinions stated herein are those of the author(s) and do not necessarily reflect the policies or opinions of IFPRI.
Copyright © 2012, International Food Policy Research Institute. All rights reserved. To obtain permission to republish, contact [email protected].
Rivera, W.M., K.M. Qamar, and L.V. Crowder. 2001. “Agricultural and Rural Extension Worldwide: Options for Institution-al Reform in Developing Countries.” Rome: Food and Agriculture Organization of the United Nations (FAO).
Spielman, D.J., D. Byerlee, D. Alemu, and D. Kelemework. 2010. “Policies to Promote Cereal Intensification in Ethiopia: the Search for Appropriate Public and Private Roles.” Food Policy 35 (3): 185–194.
Stock, J.H., and M.W. Watson. 2003. Introduction to Econometrics. Boston: Addison-Wesley.
Stock, J.H., and M. Yogo. 2002. Testing for Weak Instruments in Linear IV Regression. NBER Technical Working Paper 284. Cambridge, MA: National Bureau of Economic Research (NBER). http://www.nber.org/papers/t0284
Swanson, B., and R. Rajalahti. 2010. Strengthening Agricultural Extension and Advisory Systems: Procedures for Assessing, Transforming, and Evaluating Extension Systems. Agriculture and Rural Development Discussion Paper 45. Washington, DC: World Bank.
Swanson, B., R. Bentz, and A. Sofranko, eds. 1997. Improving agricultural extension. A reference manual. Rome: Food and Agriculture Organization of the United Nations (FAO).
Swanson, B., B. J. Farmer, and R. Bahal. 1990. “The current status of agricultural extension worldwide.” In Report of the global consultation on agricultural extension, edited by B. E. Swanson. Rome: Food and Agriculture Organization of the United Nations (FAO).
Ulimwengu, J., and P. Sanyal. 2011. Joint Estimation of Farmers’ Stated Willingness to Pay for Agricultural Services. IFPRI Discussion Paper 01070. Washington, DC: International Food Policy Research Institute.
Verbeek, M. 2004. A Guide to Modern Econometrics. Second edition. West Sussex, UK: John Wiley & Sons.
Wooldridge, J. 2002. Econometric Analysis of Cross Section and Panel Data. Cambridge: MIT Press.
World Bank. 2006. Ethiopia: Policies for Pro-Poor Agricultural Growth. Washington, DC: World Bank.
World Bank, and International Food Policy Research Institute. 2010. Gender and governance in rural services: Insights from India, Ghana, and Ethiopia. Washington, DC: World Bank; International Food Policy Research Institute.
Yu, B., A. Nin-Pratt, J. Funes, and S. Asrat Gemessa. 2011. Cereal Production and Technology Adoption in Ethiopia. ESSP II Working Paper 31. Addis Ababa, Ethiopia: Ethiopia Strategy Support Program II, International Food Policy Research Institute.
About ESSP II The Ethiopia Strategy Support Program II is an initiative to strengthen evidence-based policymaking in Ethiopia in the areas of rural and agricultural development. Facilitated by the International Food Policy Research Institute (IFPRI), ESSP II works closely with the government of Ethiopia, the Ethiopian Development Research Institute (EDRI), and other development partners to provide information relevant for the design and implementation of Ethiopia’s agricultural and rural development strategies. For more information, see http://www.ifpri.org/book-757/ourwork/program/ethiopia-strategy-support-program or http://essp.ifpri.info/ or http://www.edri.org.et/.
About these working papers The ESSP Working Papers contain preliminary material and research results from IFPRI and/or its partners in Ethiopia. The papers are not subject to a formal peer review. They are circulated in order to stimulate discussion and critical comment. The opinions are those of the authors and do not necessarily reflect those of their home institutions or supporting organizations.


