Download - Gali koval

GALI KOVALSTRATEGIC ALTERNATIVE ANALYSIS
Nadeya Hassan
Katarzyna Krzeptowski Sabala
Luoheng Huang
Faculty Advisor: Joseph Vu

Table of Contents
• Executive Summary 3
• Business Description 5
• Gali Koval Overview 7
• Retail & Apparel 9Industry Analysis
• Valuation 12
• Scenario #119
• Synergy
• Scenario #2 23• Leverage Buyout
• Valuation Ranges 27
• Strategic Buyers 29
• Brand Name, Licensing 37
& TrademarkIndustry Analysis
• Trademark Dispute 41
• Comprehensive 47 Recommendation
• Questions 49
• Appendix 50

EXECUTIVE SUMMARY
Executive Summary
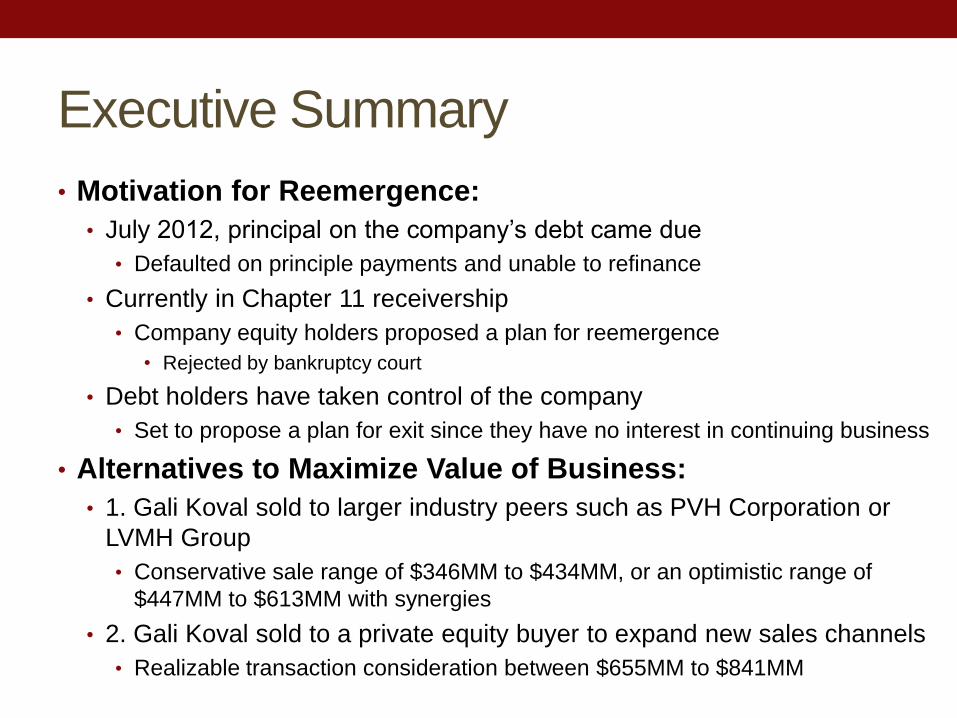
• Motivation for Reemergence:
• July 2012, principal on the company‟s debt came due
• Defaulted on principle payments and unable to refinance
• Currently in Chapter 11 receivership
• Company equity holders proposed a plan for reemergence
• Rejected by bankruptcy court
• Debt holders have taken control of the company
• Set to propose a plan for exit since they have no interest in continuing business
• Alternatives to Maximize Value of Business:
• 1. Gali Koval sold to larger industry peers such as PVH Corporation or
LVMH Group
• Conservative sale range of $346MM to $434MM, or an optimistic range of
$447MM to $613MM with synergies
• 2. Gali Koval sold to a private equity buyer to expand new sales channels
• Realizable transaction consideration between $655MM to $841MM

BUSINESS DESCRIPTION
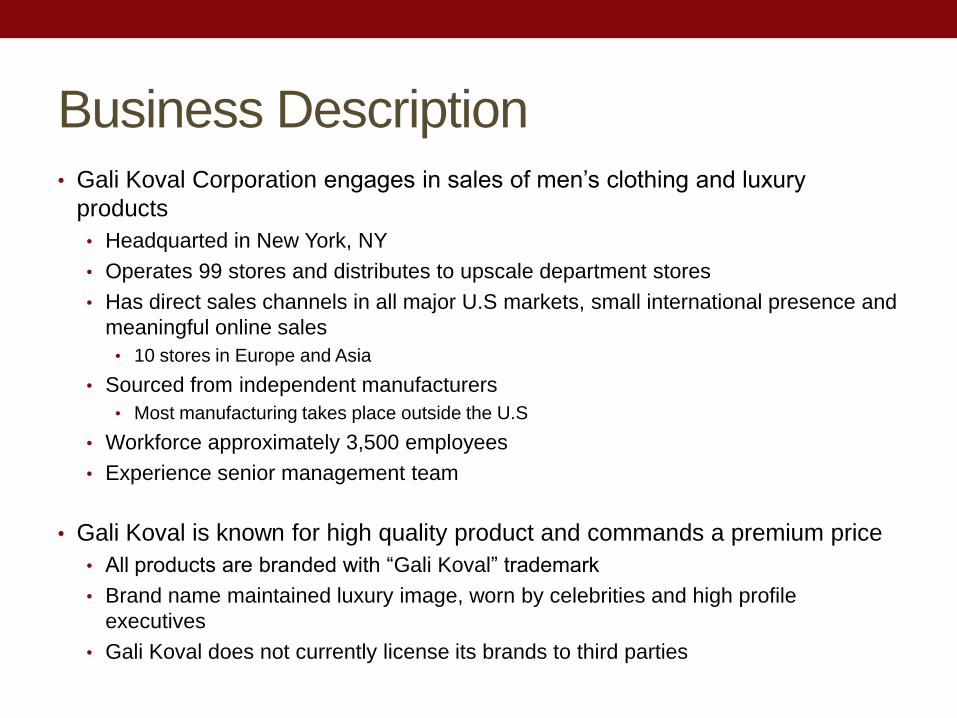
Business Description• Gali Koval Corporation engages in sales of men‟s clothing and luxury
products
• Headquarted in New York, NY
• Operates 99 stores and distributes to upscale department stores
• Has direct sales channels in all major U.S markets, small international presence and
meaningful online sales
• 10 stores in Europe and Asia
• Sourced from independent manufacturers
• Most manufacturing takes place outside the U.S
• Workforce approximately 3,500 employees
• Experience senior management team
• Gali Koval is known for high quality product and commands a premium price
• All products are branded with “Gali Koval” trademark
• Brand name maintained luxury image, worn by celebrities and high profile
executives
• Gali Koval does not currently license its brands to third parties

GALI KOVAL OVERVIEW

Gali Koval Overview
• 2007: Gali Koval acquired by private equity firm for $1.1 billion
• Acquisition funded with 65% debt and 35% equity• Believed there was an opportunity to expand international operations and sales
• Attempted to expand internationally in 2008 and 2009, but has since closed some of these new outlets
• 2009: Gali Koval lost a large department store customer
• Due to disagreements about pricing and marketing strategy
• Since global recession in 2008-2009, luxury brands have seen performance suffer
Revenue (‘000s) & Margin
Trends
Revenue:• Plummeted sharply during
financial crisis
• Has recently stabilized, but results
continue to be below 2007 levels
EBITDA:• Margin reduction in recent years is
mainly a result of significant lost
revenues
• Company‟s cost cutting efforts
have not kept pace with declines
in revenue

RETAIL & APPARELIndustry Background

Industry History
2010
• Consumer Spending on Apparel• $191.3 billion
• Disposable Personal Income• Increased 3.6% (0.7% in 2009)
• Imported Apparel• $71.40 billion
• Exports of U.S-Made Clothing• $4.51 billion
• US Retail Sales• $219.23 billion
• Men‟s Apparel Retail Sales• Accounted for 28% of US Retail Sales
2011
• Consumer Spending on Apparel• Increase of 3.8% from 2010: $198.7 billion
• Disposable Personal Income• Increased to 3.8% from 2010
• Imported Apparel• Increase of 8.8% from 2010: $77.66 billion
• Exports of US-Made Clothing• Increase of 13.7% from 2010: $5.13 billion
• US Retail Sales• Increase of 5.9% from 2010: $226.52
• Men‟s Apparel Retail Sales• Accounted for 28% of US Retail Sales
Source: Standard & Poor‟s Industry Surveys-Apparel & Footwear: Retailers and Brands

Industry Background Forecasts
• Overview-Post Financial Crisis• Expected unemployment rate of 8.2% with continued improvement through 2015, project a rate of 7.0%
• Change in spending and savings patterns
• More responsible/constrained consumer will force the sector to adjust lower sustainable levels of demand
• Will lead investors to lower their long-term secular growth expectation
• Recession sharpened the consumer‟s value focused and increased the retailer consideration set by 4%*
• GDP grew 1.3% in second quarter of 2012, projected 2.2% growth for end of 2012
• Luxury Goods Market• Bain & Co. estimated worldwide sales growth for luxury goods will be between 6%-7%
• Highest growth would come from Asia (excluding Japan) at 16.5%, Americas (5%-7%) and Europe (3.75%)
• Within emerging markets, sales forecasted to increases 18%-22% in China, 14% in Latin America, and 8.75% in
the Middle East
Source: Standard & Poor‟s Industry Surveys-Apparel & Footwear: Retailers and Brands
3%8%
7%
4%
6%
22%
5%5%
15%
20%
5%
Consumer Spending (2011)Apparel
Food
Other durables
Cars
Energy
Other services
Recreation and travel services
Restaurants
Housing
Health Care
Other Nondurables

VALUATION

Trading Comparables
• Comparable companies consist of publicly traded companies in the Apparel
Industry• They have similar products, business models, and growth to Gali Koval
• Tend to be slightly larger as smaller companies have greater difficulty adhering to the high compliance costs
of being publicly traded
• EV/EBITDA multiples imply a valuation range of $202MM to $430MM• Median multiple of 5.9x leads an implied valuation of $282MM
Transaction Comparables
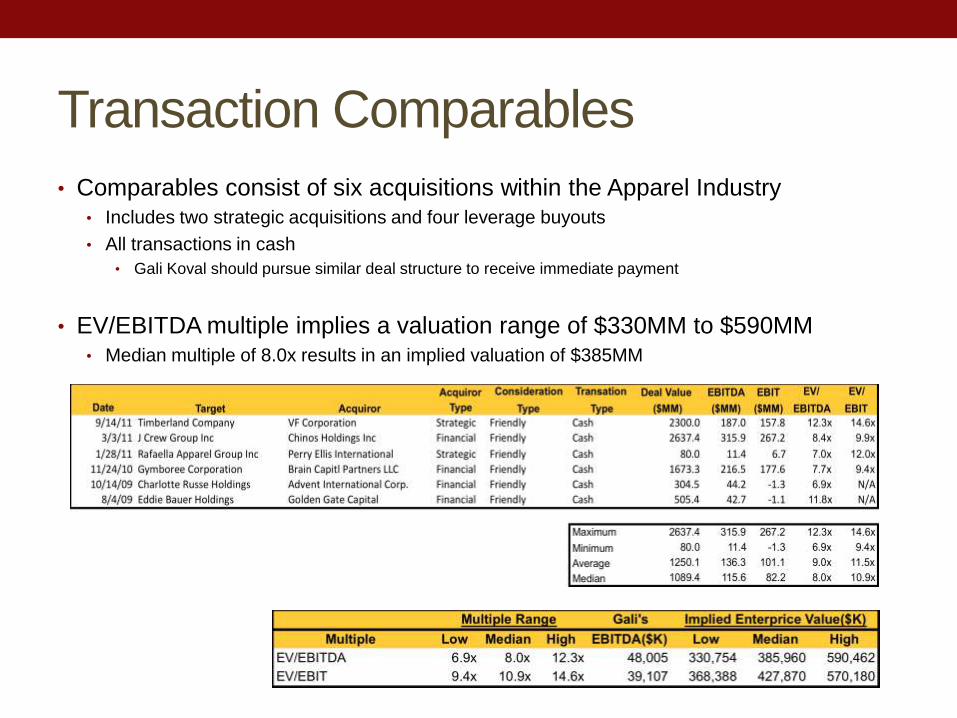
• Comparables consist of six acquisitions within the Apparel Industry• Includes two strategic acquisitions and four leverage buyouts
• All transactions in cash
• Gali Koval should pursue similar deal structure to receive immediate payment
• EV/EBITDA multiple implies a valuation range of $330MM to $590MM• Median multiple of 8.0x results in an implied valuation of $385MM

Financial Projections
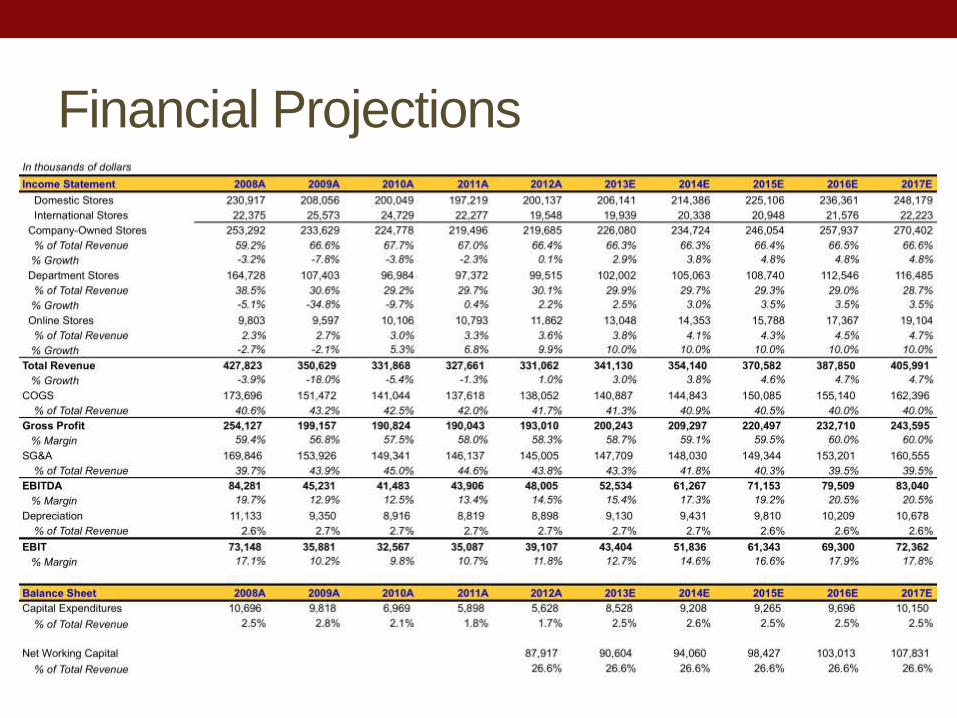
• 2013-2016 Assumptions:• Management plan used as given
• Net Working Capital (NWC) in 2012: $87.917M• NWC= Current Asset – Current Liabilities + Current Portion of Debt
• Company was taken over by debt holders and no current debt is accounted
• Projections of NWC for 2013-2016: 26.6%• Will be held constant with 2012 percentage of revenue
• 2017 Assumptions:• Revenue growth percentage from 2016 will be held constant
• Company Owned Stores: 4.8%
• Department Stores: 2.5%
• Online Stores: 10%
• Expenses (as a percentage of revenue) held constant• COGS: 40%
• SG&A: 39.5%
• Depreciation held constant at 2.6% of revenue
• Capital Expenditures held constant at 2.5% of revenue
• NWC held constant at historical percentage of 26.6% of revenue
• Post 2017 Assumptions:• Unlevered Free Cash Flow to firm will grow 2.0% in perpetuity
Financial Projections
WACC Calculations
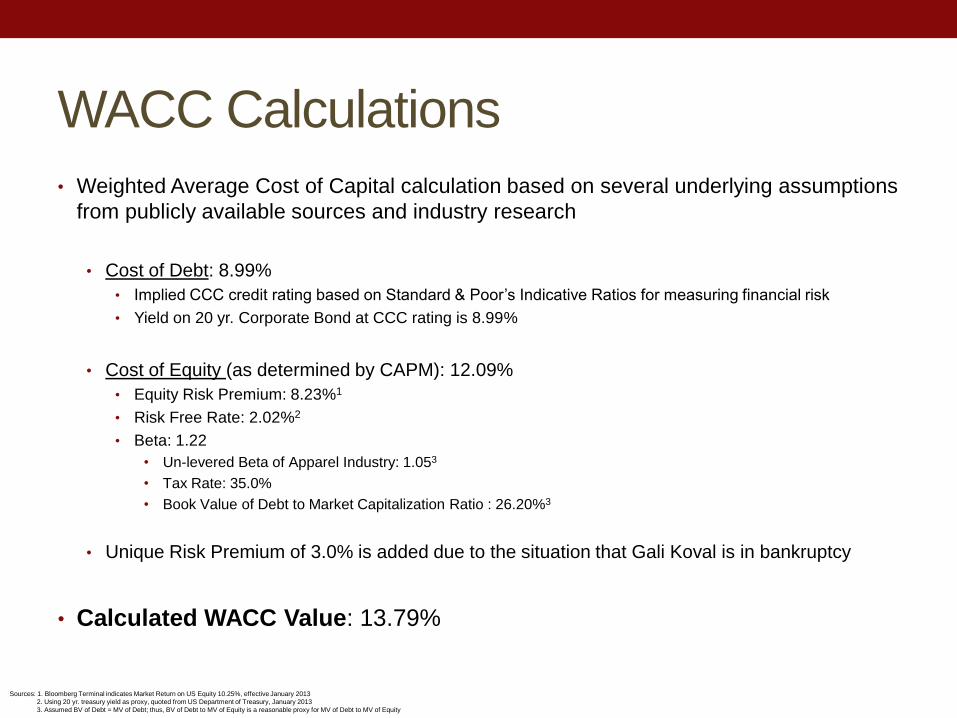
• Weighted Average Cost of Capital calculation based on several underlying assumptions
from publicly available sources and industry research
• Cost of Debt: 8.99%
• Implied CCC credit rating based on Standard & Poor‟s Indicative Ratios for measuring financial risk
• Yield on 20 yr. Corporate Bond at CCC rating is 8.99%
• Cost of Equity (as determined by CAPM): 12.09%
• Equity Risk Premium: 8.23%1
• Risk Free Rate: 2.02%2
• Beta: 1.22
• Un-levered Beta of Apparel Industry: 1.053
• Tax Rate: 35.0%
• Book Value of Debt to Market Capitalization Ratio : 26.20%3
• Unique Risk Premium of 3.0% is added due to the situation that Gali Koval is in bankruptcy
• Calculated WACC Value: 13.79%
Sources: 1. Bloomberg Terminal indicates Market Return on US Equity 10.25%, effective January 2013
2. Using 20 yr. treasury yield as proxy, quoted from US Department of Treasury, January 2013
3. Assumed BV of Debt = MV of Debt; thus, BV of Debt to MV of Equity is a reasonable proxy for MV of Debt to MV of Equity

Discounted Cash Flow
• Discounted Cash Flows Analysis projected financial statements
• Calculated WACC of 13.79%, and assumed Terminal Growth Rate of 2.0%
• Results in intrinsic value of $315MM
• Implied valuation range of $282MM to $358MM

SCENARIO #1Synergy
DCF with Synergies
• If Gali Koval Corporation is purchased by a strategic buyer, it could anticipate a premium over the intrinsic valuation due to revenue and cost synergies from scalability
• Synergy Assumptions:• Revenue
• $14MM revenue synergies in 2013, increases $2MM/yr. until reaching $20MM in 2016, revenue synergies in 2017 held constant as 2016
• $7.5MM/yr. of lost revenue due to store closings
• Gross Margin• Will remain the same level as percentage of revenue as outlined in financial statement
projections
• Gross Margin is projected at 60% of revenue and the industry average of about 51%1
• Synergies won‟t have any improvement in Gross Margin
• SG&A cost savings • $8MM/yr. cost savings due to store closings
• $25MM one time cost reduction due to distribution center rationalization in 2013
• $3MM one time expense due to store closings in 2013
• $10MM one time saving through management and back office reductions in 2013
• Depreciation, Capital Expenditures, and Net Working Capital will remain at stated percentage of revenue as outlined in financial statement projections
Sources: 1. Bloomberg Terminal
DCF with Synergies
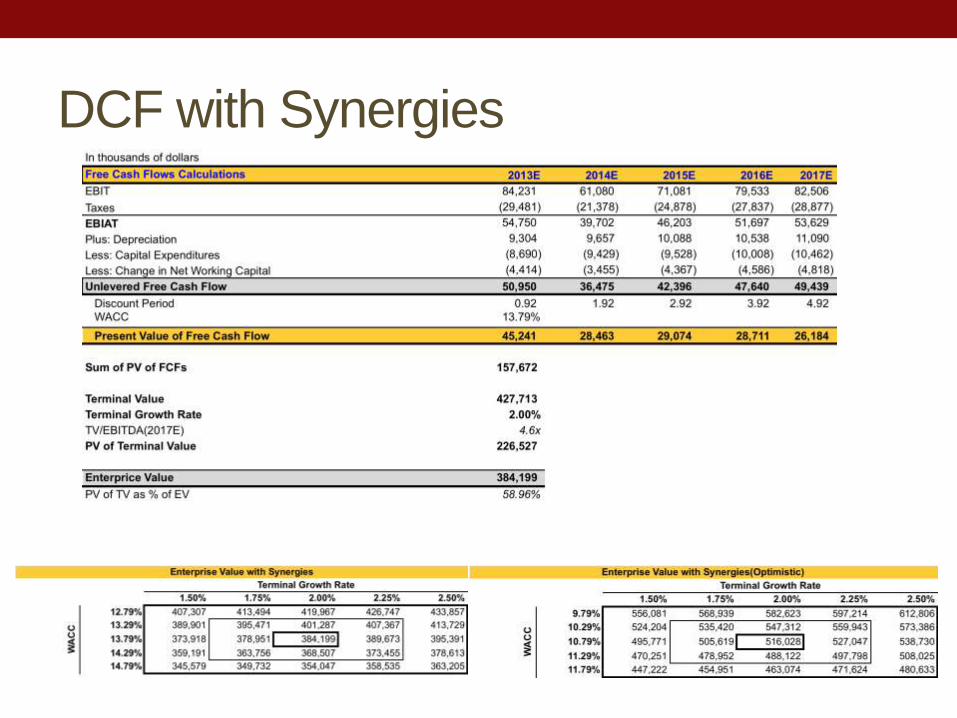
• Discounted Cash Flow Analysis from projected realizable
synergies, calculated WACC of 13.79%, and terminal growth rate of
2.0%
• Results in intrinsic valuation with synergies of $384MM, assuming all
synergies are realized
• Implied valuation with synergies from $346MM to $434MM
• It‟s possible that after being acquired by a healthy strategic
buyer, Gali Koval‟s WACC will return back to the industry average and
no unique risk premium related to bankruptcy will need to be added
• In this case, WACC=10.79%
• Results an optimistic intrinsic value with synergies range of $447MM -
$613MM
DCF with Synergies

SCENARIO #2Leverage Buy-Out
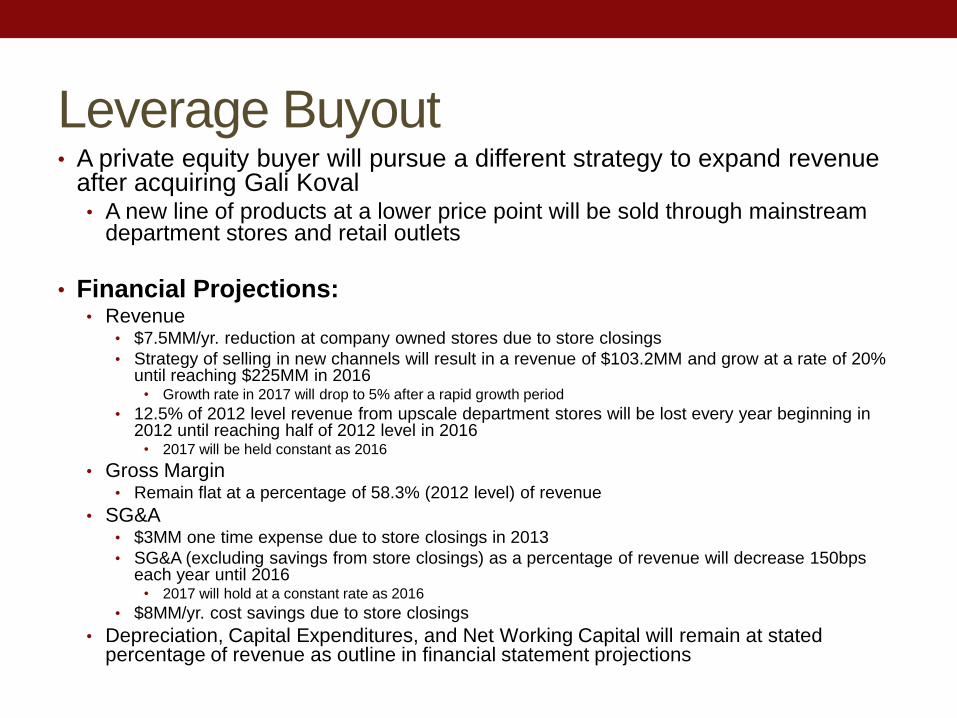
Leverage Buyout• A private equity buyer will pursue a different strategy to expand revenue
after acquiring Gali Koval• A new line of products at a lower price point will be sold through mainstream
department stores and retail outlets
• Financial Projections:• Revenue
• $7.5MM/yr. reduction at company owned stores due to store closings
• Strategy of selling in new channels will result in a revenue of $103.2MM and grow at a rate of 20% until reaching $225MM in 2016
• Growth rate in 2017 will drop to 5% after a rapid growth period
• 12.5% of 2012 level revenue from upscale department stores will be lost every year beginning in 2012 until reaching half of 2012 level in 2016
• 2017 will be held constant as 2016
• Gross Margin• Remain flat at a percentage of 58.3% (2012 level) of revenue
• SG&A• $3MM one time expense due to store closings in 2013
• SG&A (excluding savings from store closings) as a percentage of revenue will decrease 150bps each year until 2016
• 2017 will hold at a constant rate as 2016
• $8MM/yr. cost savings due to store closings
• Depreciation, Capital Expenditures, and Net Working Capital will remain at stated percentage of revenue as outline in financial statement projections
Leverage Buyout
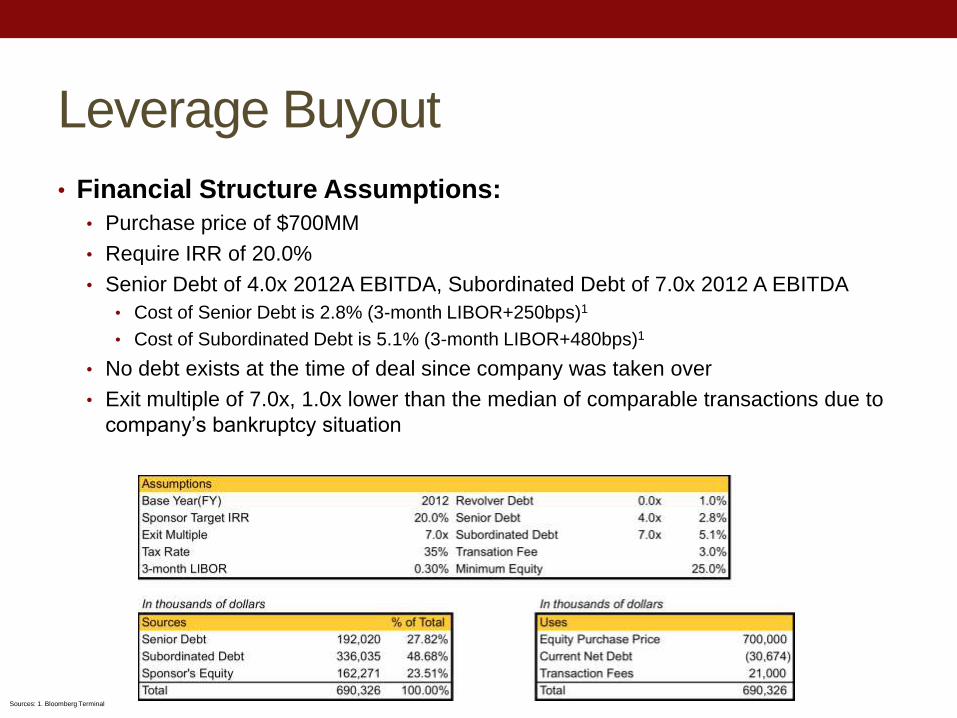
• Financial Structure Assumptions:
• Purchase price of $700MM
• Require IRR of 20.0%
• Senior Debt of 4.0x 2012A EBITDA, Subordinated Debt of 7.0x 2012 A EBITDA
• Cost of Senior Debt is 2.8% (3-month LIBOR+250bps)1
• Cost of Subordinated Debt is 5.1% (3-month LIBOR+480bps)1
• No debt exists at the time of deal since company was taken over
• Exit multiple of 7.0x, 1.0x lower than the median of comparable transactions due to
company‟s bankruptcy situation
Sources: 1. Bloomberg Terminal

Leverage Buyout
• Return Analysis• Valuation range of $655MM to $841MM
• Assuming financial sponsor must ensure 20.0% IRR, it would be limited to paying $733MM
• Attractiveness of Leverage Buyout• Stable cash flows allow for consistent debt repayment and potential for future profitable growth
• The opportunity to expand through new channels will substantially increase Gali Koval‟s revenue
• Acquirer will offer strong financial support for new market strategy

VALUATION RANGES

Valuation Ranges
• Ranges determined through sensitivity or multiples analysis:
• Discounted Cash Flow- $282MM to $358MM
• Leverage Buyout- $655MM to $841MM
• DCF + Synergies- $346MM to $434MM
• Transaction Comparable - $330MM to $590MM
• Trading Comparable- $202MM to $430MM
• Discounted Cash Flow from a leverage buyout exceeds ranges of other
valuations
• Illustrates a premium the bondholders would receive if sold to private equity firm

STRATEGIC BUYERSLVMH Group & PVH Corp.
LVMH Overview
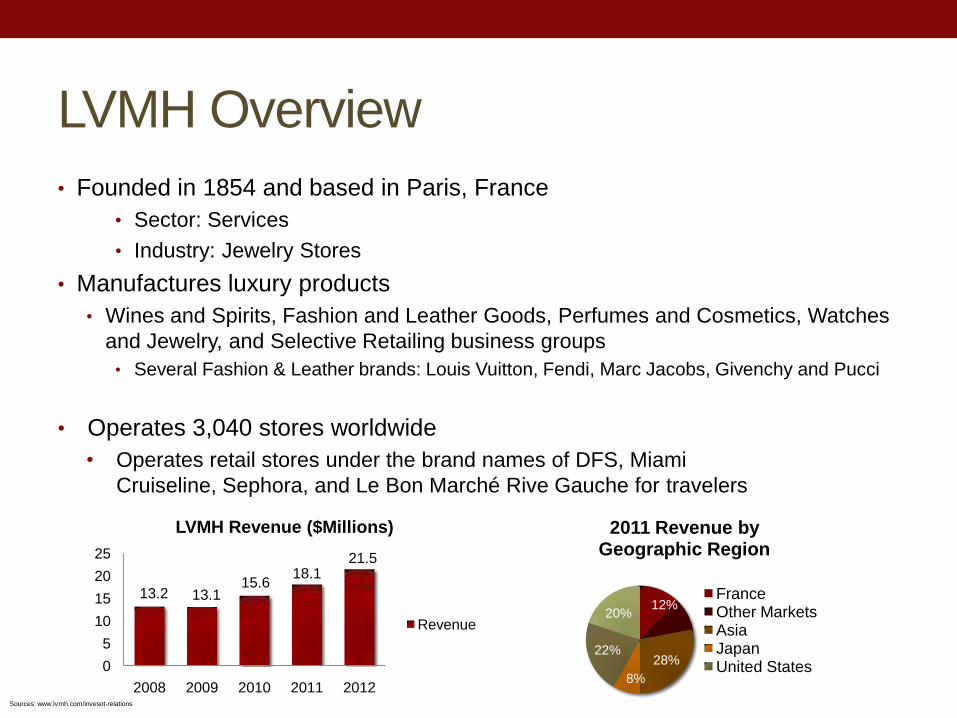
• Founded in 1854 and based in Paris, France
• Sector: Services
• Industry: Jewelry Stores
• Manufactures luxury products
• Wines and Spirits, Fashion and Leather Goods, Perfumes and Cosmetics, Watches
and Jewelry, and Selective Retailing business groups
• Several Fashion & Leather brands: Louis Vuitton, Fendi, Marc Jacobs, Givenchy and Pucci
• Operates 3,040 stores worldwide
• Operates retail stores under the brand names of DFS, Miami
Cruiseline, Sephora, and Le Bon Marché Rive Gauche for travelers
12%
10%
28%
8%
22%
20%
2011 Revenue by Geographic Region
FranceOther MarketsAsiaJapanUnited States
13.2 13.115.6
18.121.5
0
5
10
15
20
25
2008 2009 2010 2011 2012
LVMH Revenue ($Millions)
Revenue
Sources: www.lvmh.com/invesot-relations
LVMH Overview
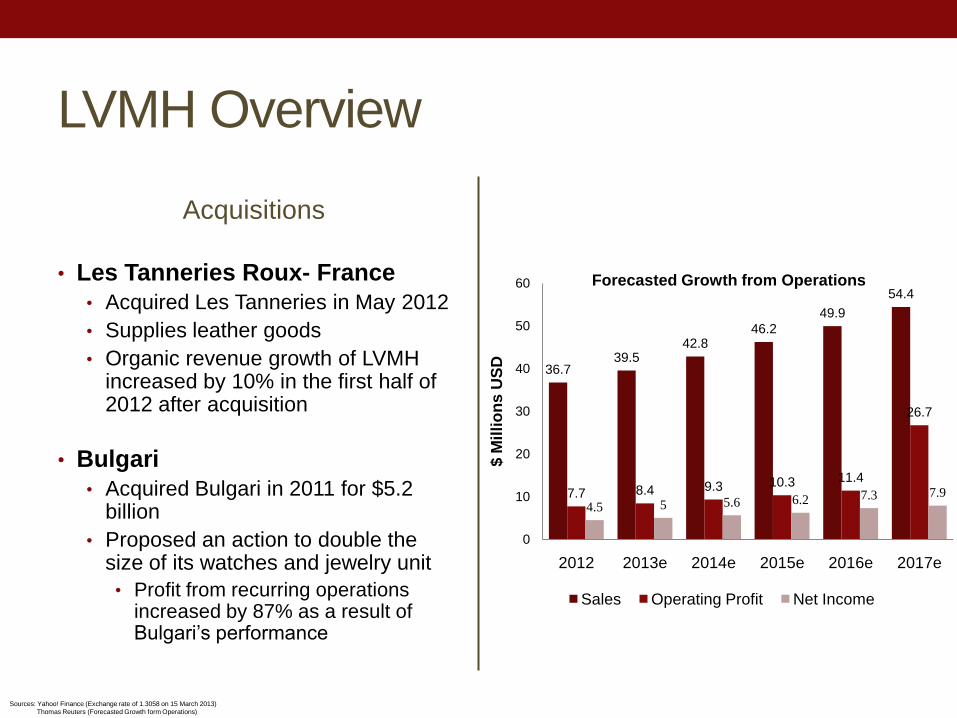
Acquisitions
• Les Tanneries Roux- France
• Acquired Les Tanneries in May 2012
• Supplies leather goods
• Organic revenue growth of LVMH increased by 10% in the first half of 2012 after acquisition
• Bulgari
• Acquired Bulgari in 2011 for $5.2 billion
• Proposed an action to double the size of its watches and jewelry unit
• Profit from recurring operations increased by 87% as a result of Bulgari‟s performance
36.739.5
42.846.2
49.9
54.4
7.7 8.4 9.3 10.3 11.4
26.7
4.5 5 5.6 6.2 7.3 7.9
0
10
20
30
40
50
60
2012 2013e 2014e 2015e 2016e 2017e
$ M
illi
on
s U
SD
Forecasted Growth from Operations
Sales Operating Profit Net Income
Sources: Yahoo! Finance (Exchange rate of 1.3058 on 15 March 2013)
Thomas Reuters (Forecasted Growth form Operations)

LVMH Overview
• Strategic Fit:
• Based on Gali Koval‟s initial attempt to expand internationally, LVMH provides major markets geographically
• Due to its brand development strategy and more than 3,000 stores worldwide
• Supports the growth of the brands by respecting their identity and their creative positioning
• Strength of star brands with solid financial structure and geographical balance of revenue
• Concerns/Risk:
• Sole purpose is not strictly in the retail/apparel industry
• Main focus on prestige/luxury brands with considerable growth
• Headquartered in France and most business is conducted overseas
• Continuous Europe‟s sovereign debt crisis and Eurozone crisis can affect performance in European markets
Source: www.lvmh.com/investor-relations

PVH Overview• Founded in 1881 and is based in New York, New York
• Sector: Consumer Goods
• Industry: Textile: Apparel Clothing
• Ticker Symbol: PVH
• Leases and operates approx. 1,000 retail locations
• Markets products through wholesale to national and regional department, mid-tier
department, mass market, and specialty and independent stores; and retail stores, as
well as through e-commerce Website
• Operates as an apparel company in the United States, Canada, Europe, and
internationally
• Brand portfolio includes:
• Calvin Klein, Tommy Hilfiger, IZOD, Heritage
2.43 2.49 2.40
4.64
11.5
22.5
33.5
44.5
55.5
6
2008 2009 2010 2011
PVH Revenue ($ billions)
PVH Revenue (in billions)
27%
52%
21%
2011 Revenue by Geographic Region
Europe
North America
Other
Source: Yahoo! Finance

PVH OverviewAcquisitions
• Calvin Klein• Acquired Calvin Klein in 2003 for approximately $3.0
Billion from Warnaco Group
• Continued expansion of men's sportswear business
• Growth after the acquisition rose at a 13% compound annual growth rate
• Generated approximately $2.8 billion in global retail stores after the buyout
• Tommy Hilfiger• Acquired Tommy Hilfiger in 2010 for approximately
$3.0 Billion from Warnaco Group
• Focused expansion in Europe and Japan
• Growth after acquisition rose at a 13% compound annual growth rate
• Growth opportunities remain to drive Tommy Hilfiger from $4.6 billion in worldwide retail revenues in 2010 to over $6.5 billion
• Heritage Brands• Acquired in 2010
• 10% revenue increase after acquisition in 2010
• Incurred $3.3 billion in worldwide retail revenue in 2010
• Forecasted growth of 4.0 billion
$7.6$5.6
$3.4
$10$7.3
$3.7
Calvin Klein Tommy Hilfiger Heritage Brands
Planned Annual Top Line Growth($ billions)
2011A 2014E
$3,051B
$1,065B
$1,775B
2011 Revenues: $5.9B
Tommy Hilfiger Calvin Klein Heritage Brands
Sources: Yahoo! Finance
PVH.com

PVH Overview
• Strategic Fit:
• Continued opportunities for PVH through license and brand extensions and international expansion, the next leg growth for firm
• Estimated EV/EBITDA of 8.2x
• Believe sales growth in the low- to mid single digit range
• Value in management‟s long-term strategy:• Contains structural improvements to the operating model
• Established a vast distribution network• Spans lower-priced discount channels, department stores and high-end retail
boutiques
• Concerns/Risk:
• With targeted 8%-10% growth rate for Calvin Klein and Tommy Hilfiger, there is a risk of saturations and overextension in the labels
• Operates in a extremely competitive consumer market that is affected by macro/consumer trends
• Challenges in getting more floor space in department stores for new launches as retailers push for more private-label merchandise
Source: Morningstar

Recommended Buyer
• PVH Corporation
• Successfully evolved into a diverse portfolio firm
• Exposure across a number of company-owned brands, licenses, and
apparel categories
• Established vast distribution network
• Thus cross-selling and promotional opportunities
• Reaching international presence is next goal
• Record of success with acquisitions
• Calvin Klein doubled global retail sales and est. 13% compound annual
growth rate in 2003
• Build dominant position in fragmented categories
• Such as men‟s dress shirts and neckwear
• Perfect fit for Gali Koval to be incorporated
Source: Morningstar & PVH.com

BRAND NAME, LICENSING
& TRADEMARKIndustry Analysis

Brand Name
• Apparel and accessories industries remains extremely
competitive and highly fragmented• Getting into business is easy, staying in is much more difficult
• Start-up companies are undercapitalized and lack broad-based global sourcing
• Lack marketing muscle to build exposure and brand loyalty among customers
• Small firms often seek to be acquired by larger companies to expand sales
• Strong brand image is crucial• Manufacturers have more price flexibility by creating “must-have” perception
• Brand extension can strengthen the perception of value associated with
brand
• Established brand names:
• Convey image of quality
• Builds customer loyalty
• Translate to repeat businessSource: Standard & Poor‟s Industry Surveys-Apparel & Footwear: Retailers and Brands

Brand Names- Examples
Source: theinternationalman.com/img
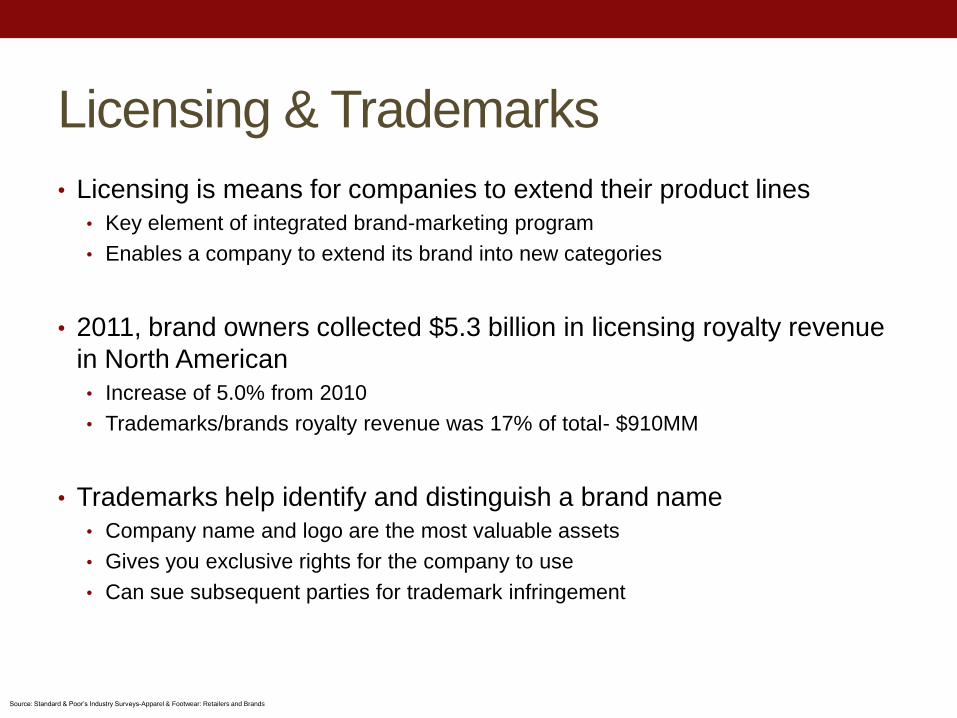
Licensing & Trademarks
• Licensing is means for companies to extend their product lines
• Key element of integrated brand-marketing program
• Enables a company to extend its brand into new categories
• 2011, brand owners collected $5.3 billion in licensing royalty revenue
in North American
• Increase of 5.0% from 2010
• Trademarks/brands royalty revenue was 17% of total- $910MM
• Trademarks help identify and distinguish a brand name
• Company name and logo are the most valuable assets
• Gives you exclusive rights for the company to use
• Can sue subsequent parties for trademark infringement
Source: Standard & Poor‟s Industry Surveys-Apparel & Footwear: Retailers and Brands

TRADEMARK DISPUTE
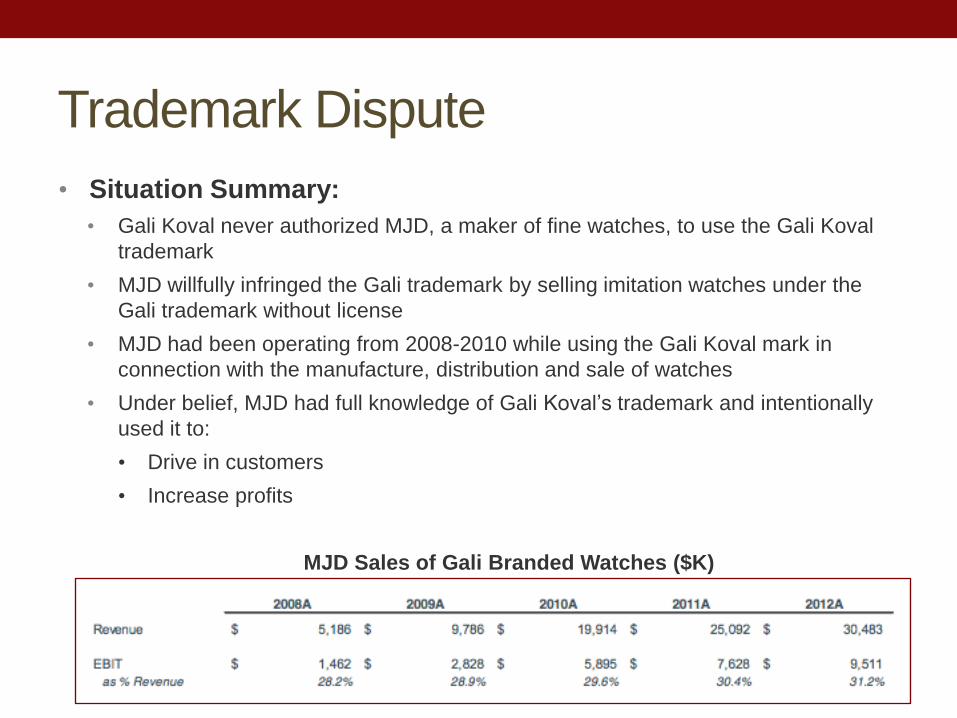
Trademark Dispute
• Situation Summary:
• Gali Koval never authorized MJD, a maker of fine watches, to use the Gali Koval
trademark
• MJD willfully infringed the Gali trademark by selling imitation watches under the
Gali trademark without license
• MJD had been operating from 2008-2010 while using the Gali Koval mark in
connection with the manufacture, distribution and sale of watches
• Under belief, MJD had full knowledge of Gali Koval‟s trademark and intentionally
used it to:
• Drive in customers
• Increase profits
MJD Sales of Gali Branded Watches ($K)
Trademark Dispute
• Reasons to Sue MJD:• MJD had no authorization to use „Gali‟ trademark to:
• Manufacture, distribute, or sell the watch
• MJD is not associated with Gali Koval through:• Sponsorship, approval, or endorsement
• MJD willfully infringed the „Gali‟ trademark without license• Under belief they had full knowledge of Gali Koval and intentionally use it to drive customers
and increase profits
• Potential Harm to Gali‟s Business:• Unfair competition and false designation of origin
• Gali Koval prestige brand image is negatively affected • Misleads consumers of the value and premium price
• Missed the opportunity to collect additional revenue through the sales of the brand name watches
• Missed opportunity to expand in the accessories market internationally
• Alternatives to Settle Dispute in Trademark Infringement:• 1. Legal Dispute- Proceed to Court
• 2. Brand Name Licensing with MJD
Source: Bloomberg Terminal Law
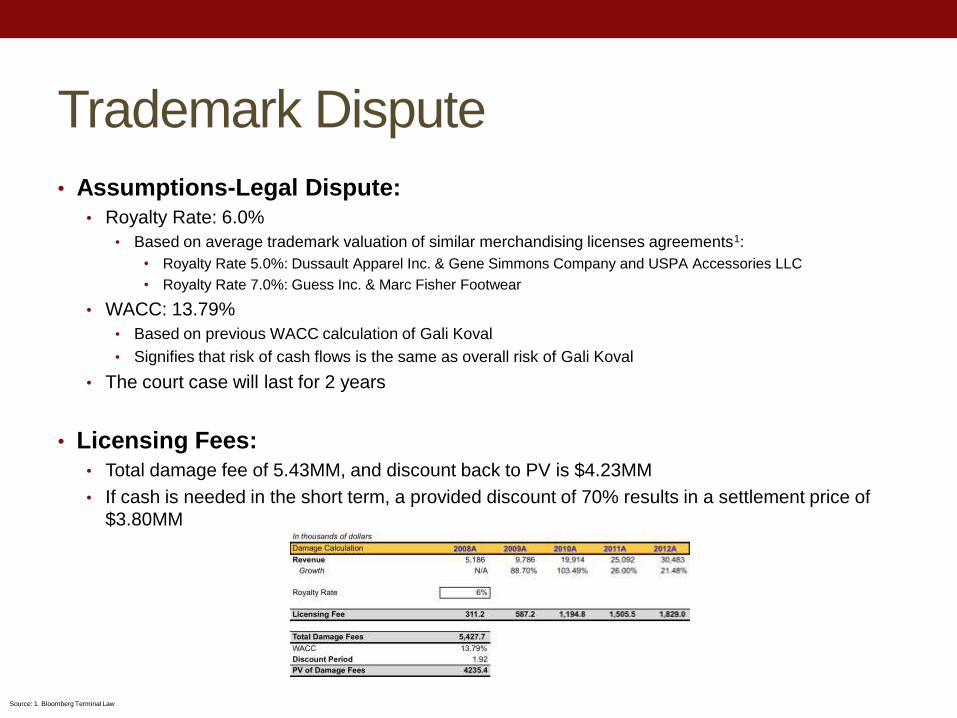
Trademark Dispute
• Assumptions-Legal Dispute:• Royalty Rate: 6.0%
• Based on average trademark valuation of similar merchandising licenses agreements1:
• Royalty Rate 5.0%: Dussault Apparel Inc. & Gene Simmons Company and USPA Accessories LLC
• Royalty Rate 7.0%: Guess Inc. & Marc Fisher Footwear
• WACC: 13.79%
• Based on previous WACC calculation of Gali Koval
• Signifies that risk of cash flows is the same as overall risk of Gali Koval
• The court case will last for 2 years
• Licensing Fees:• Total damage fee of 5.43MM, and discount back to PV is $4.23MM
• If cash is needed in the short term, a provided discount of 70% results in a settlement price of
$3.80MM
Source: 1. Bloomberg Terminal Law

Trademark Dispute
• Assumptions- Future Cooperation• Royalty Rate: 6.0%
• Based on average trademark valuation of similar merchandising licenses agreements1:
• Royalty Rate 5.0%: Dussault Apparel Inc. & Gene Simmons Company and USPA Accessories LLC
• Royalty Rate 7.0%: Guess Inc. & Marc Fisher Footwear
• WACC: 13.79%
• Based on previous WACC calculation of Gali Koval
• Signifies that risk of cash flows is the same as overall risk of Gali Koval
• MJD revenue will grow at 15%/yr. for the next 5years
• Licensing Fees• Future licensing cash flow will result in a Present Value range of $8.8MM-$10.3MM
Source: 1. Bloomberg Terminal Law

Trademark Dispute
• Recommendation:
• Unless Gali Koval needs immediate payment to pay back any costs, Gali
would benefit establishing a relationship with MJD:
• Based on previous MJD sales growth of the Gali-branded watches, it provides a
platform for the Gali brand name to expand
• Thus, generating more revenues for future growth
• Competitive advantage to use MJD established market internationally
• Gali Koval does not have a market share for watches
• Can use MJD‟s networks and resources to develop other accessories and/or luxury
products
• To prevent further trademark infringements, Gali should be more inclined to
license its brand to third parties
• Or, register its trademark internationally to compete with other prestige brand names
• Opportunity to firmly establish Gali Koval‟s brand name internationally

COMPREHENSIVE
RECOMMENDATION

Comprehensive Recommendation
• Recommendation:• Sell Gali Koval to a private equity firm
• Leverage buyout establishes a consideration value of $733MM• LBO analysis results in a price range of $655MM to $841MM
• Valuation range higher than alternatives
• Offers debt-holders the best feasible price
• Acquirer will offer a strong financial support in the expansion of the low-priced product line • Change in business structure can result in future operating growth
• Change in financial structure can improve operating efficiency
• Settle trademark dispute with MJD• Future license fees add about $9.53MM in 5yrs.
• Sensitivity analysis future licensing fees range from $8.82MM to $10.32MM
• Deal Structure:• Similar all cash acquisitions within the apparel industry
• Acquirers are capable of paying in all cash, thus bondholders will receive immediate payment

QUESTIONS

APPENDIX

Synergy Projections
Income Statement 2013E 2014E 2015E 2016E 2017E
Revenue Before Synergies 341,130 354,140 370,582 387,850 405,991
Synergies-Revenue Growth 6,500 8,500 10,500 12,500 12,500
Revenue Incl. Synergies 347,630 362,640 381,082 400,350 418,491
Gross Margin%(Excl. Synergies) 58.7% 59.1% 59.5% 60.0% 60.0%
Gross Margin%(Incl. Synergies) 58.7% 59.1% 59.5% 60.0% 60.0%
Gross Profit 204,058 214,321 226,745 240,210 251,095
SG&A Excl. Synergies 150,523 151,583 153,575 158,139 165,498
% of Total Revenue (Excl. Synergies) 43.3% 41.8% 40.3% 39.5% 39.5%
Synergies-Cost Savings 40,000 8,000 8,000 8,000 8,000
SG&A Incl. Synergies 110,523 143,583 145,575 150,139 157,498
EBITDA 93,535 70,738 81,169 90,071 93,596
Depreciation 9,304 9,657 10,088 10,538 11,090
% of Total Revenue 2.68% 2.66% 2.65% 2.63% 2.65%
EBIT (Incl. Synergies) 84,231 61,080 71,081 79,533 82,506
EBIT (Excl. Synergies) 43,404 51,836 61,343 69,300 72,281
EBIT of Synergies 40,827 9,244 9,738 10,233 10,225
Increase in Depreciation from Synergies 174 226 278 329 412
Balance Sheet 2013E 2014E 2015E 2016E 2017E
Capital Expenditures
Capital Expenditures Excl. Synergies 8,528 9,208 9,265 9,696 10,150
% of Total Revenue 2.5% 2.6% 2.5% 2.5% 2.5%
Capital Expenditures Incl. Synergies 8,690 9,429 9,528 10,008 10,462
Increase in CAPEX due to Synergies 162 221 263 312 313
Net Working Capital
Net Working Capital Excl. Synergies 90,604 94,060 98,427 103,013 107,831
% of Total Revenue 26.6% 26.6% 26.6% 26.6% 26.6%
Net Working Capital Incl. Synergies 92,331 96,317 101,215 106,333 111,151
Increase in NWC due to Synergies 1,726 2,258 2,789 3,320 3,320
• Additional detail on the calculation on DCF with Synergies

Leverage Buyout AnalysisIn thousands of dollars
Income Statement 2012A 2013E 2014E 2015E 2016E 2017E
Domestic Stores 200,137 206,141 214,386 225,106 236,361 248,179
Store Closing Revenue Reduction N/A 7,500 7,500 7,500 7,500 7,500
International Stores 19,548 19,939 20,338 20,948 21,576 22,223
Company-Owned Stores 219,685 218,580 242,224 253,554 265,437 277,902
% of Total Revenue 66.4% 48.7% 49.7% 48.9% 47.6% 47.7%
% Growth 0.1% -0.5% 10.8% 4.7% 4.7% 4.7%
Upscale Department Stores 99,515 87,076 74,636 62,197 49,758 49,758
% of Total Revenue 30.1% 19.4% 15.3% 12.0% 8.9% 8.5%
% Growth 2.2% -12.5% -14.3% -16.7% -20.0% 0.0%
New Channels N/A 130,208 156,250 187,500 225,000 236,250
% of Total Revenue N/A 29.0% 32.1% 36.1% 40.4% 40.5%
% Growth N/A N/A 20.0% 20.0% 20.0% 5.0%
Online Stores 11,862 13,048 14,353 15,788 17,367 19,104
% of Total Revenue 3.6% 2.9% 2.9% 3.0% 3.1% 3.3%
% Growth 9.9% 10.0% 10.0% 10.0% 10.0% 10.0%
Total Revenue 331,062 448,912 487,463 519,039 557,562 583,014
% Growth 1.0% 35.6% 8.6% 6.5% 7.4% 4.6%
COGS 138,052 187,196 203,272 216,439 232,503 243,117
% of Total Revenue 41.7% 41.7% 41.7% 41.7% 41.7% 41.7%
Gross Profit 193,010 261,716 284,191 302,600 325,058 339,897
% Margin 58.3% 58.3% 58.3% 58.3% 58.3% 58.3%
SG&A(Not include store closing savings) 145,005 189,890 198,885 203,982 210,758 220,379
% of Total Revenue 43.8% 42.3% 40.8% 39.3% 37.8% 37.8%
Store Closing Cost Savings N/A 5,000 8,000 8,000 8,000 8,000
EBITDA 48,005 76,826 93,306 106,617 122,300 127,518
% Margin 14.5% 17.1% 19.1% 20.5% 21.9% 21.9%
Depreciation 8,898 12,015 9,431 9,810 10,209 15,450
% of Total Revenue 2.7% 2.68% 2.68% 2.68% 2.68% 2.68%
EBIT 39,107 64,811 83,875 96,807 112,091 112,068
% Margin 11.8% 14.4% 17.2% 18.7% 20.1% 19.2%
Balance Sheet 2012A 2013E 2014E 2015E 2016E 2017E
Capital Expenditures 5,628 11,222 12,675 12,977 13,939 14,575
% of Total Revenue 1.7% 2.5% 2.6% 2.5% 2.5% 2.5%
Net Working Capital 87917 87,917 119,231 129,470 137,857 148,088 154,848
% of Total Revenue 26.6% 26.6% 26.6% 26.6% 26.6% 26.6%
• Additional detail on the
calculation of leverage
buyout analysis
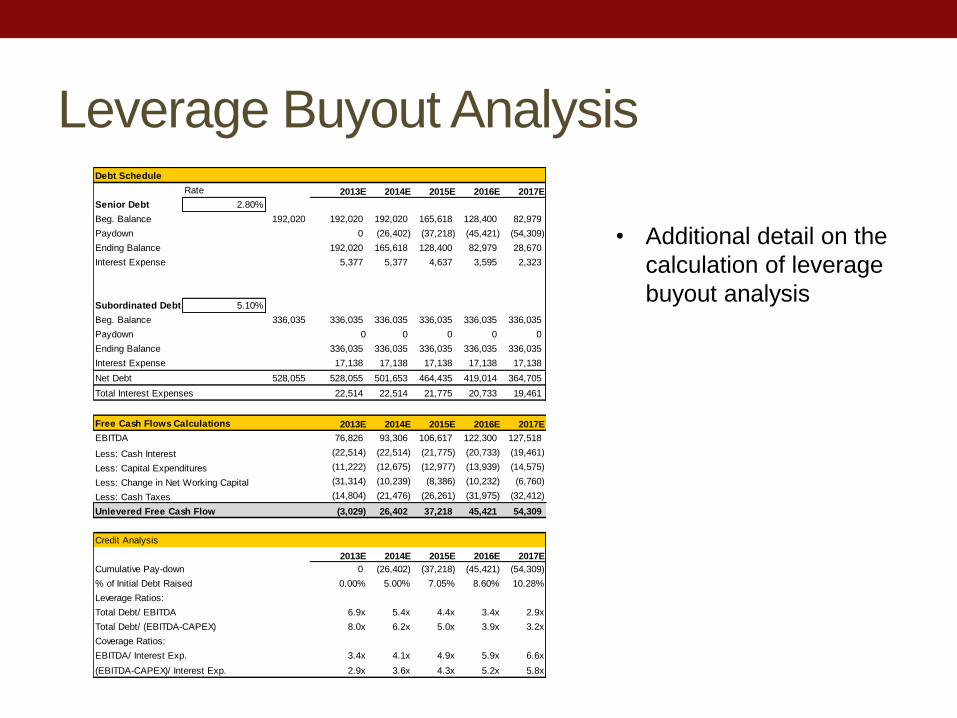
Leverage Buyout AnalysisDebt Schedule
Rate 2013E 2014E 2015E 2016E 2017E
Senior Debt 2.80%
Beg. Balance 192,020 192,020 192,020 165,618 128,400 82,979
Paydown 0 (26,402) (37,218) (45,421) (54,309)
Ending Balance 192,020 165,618 128,400 82,979 28,670
Interest Expense 5,377 5,377 4,637 3,595 2,323
Subordinated Debt 5.10%
Beg. Balance 336,035 336,035 336,035 336,035 336,035 336,035
Paydown 0 0 0 0 0
Ending Balance 336,035 336,035 336,035 336,035 336,035
Interest Expense 17,138 17,138 17,138 17,138 17,138
Net Debt 528,055 528,055 501,653 464,435 419,014 364,705
Total Interest Expenses 22,514 22,514 21,775 20,733 19,461
Free Cash Flows Calculations 2013E 2014E 2015E 2016E 2017E
EBITDA 76,826 93,306 106,617 122,300 127,518
Less: Cash Interest (22,514) (22,514) (21,775) (20,733) (19,461)
Less: Capital Expenditures (11,222) (12,675) (12,977) (13,939) (14,575)
Less: Change in Net Working Capital (31,314) (10,239) (8,386) (10,232) (6,760)
Less: Cash Taxes (14,804) (21,476) (26,261) (31,975) (32,412)
Unlevered Free Cash Flow (3,029) 26,402 37,218 45,421 54,309
Credit Analysis
2013E 2014E 2015E 2016E 2017E
Cumulative Pay-down 0 (26,402) (37,218) (45,421) (54,309)
% of Initial Debt Raised 0.00% 5.00% 7.05% 8.60% 10.28%
Leverage Ratios:
Total Debt/ EBITDA 6.9x 5.4x 4.4x 3.4x 2.9x
Total Debt/ (EBITDA-CAPEX) 8.0x 6.2x 5.0x 3.9x 3.2x
Coverage Ratios:
EBITDA/ Interest Exp. 3.4x 4.1x 4.9x 5.9x 6.6x
(EBITDA-CAPEX)/ Interest Exp. 2.9x 3.6x 4.3x 5.2x 5.8x
• Additional detail on the
calculation of leverage
buyout analysis


