Download - Food Industry Monitor
Prof. Carmine Garzia
June 26, 2020
Food Industry Monitor
Food is Health. Competitive scenarios in the food industry
Performance analysis and forecasting
Content analysis. Evolution of consumer behavior
Business model analysis. Health innovation and performance
Agenda
© 2020 Carmine Garzia - Food Industry Monitor - All Rights Reserved
© 2019 Carmine Garzia - Food Industry Monitor - All rights reserved
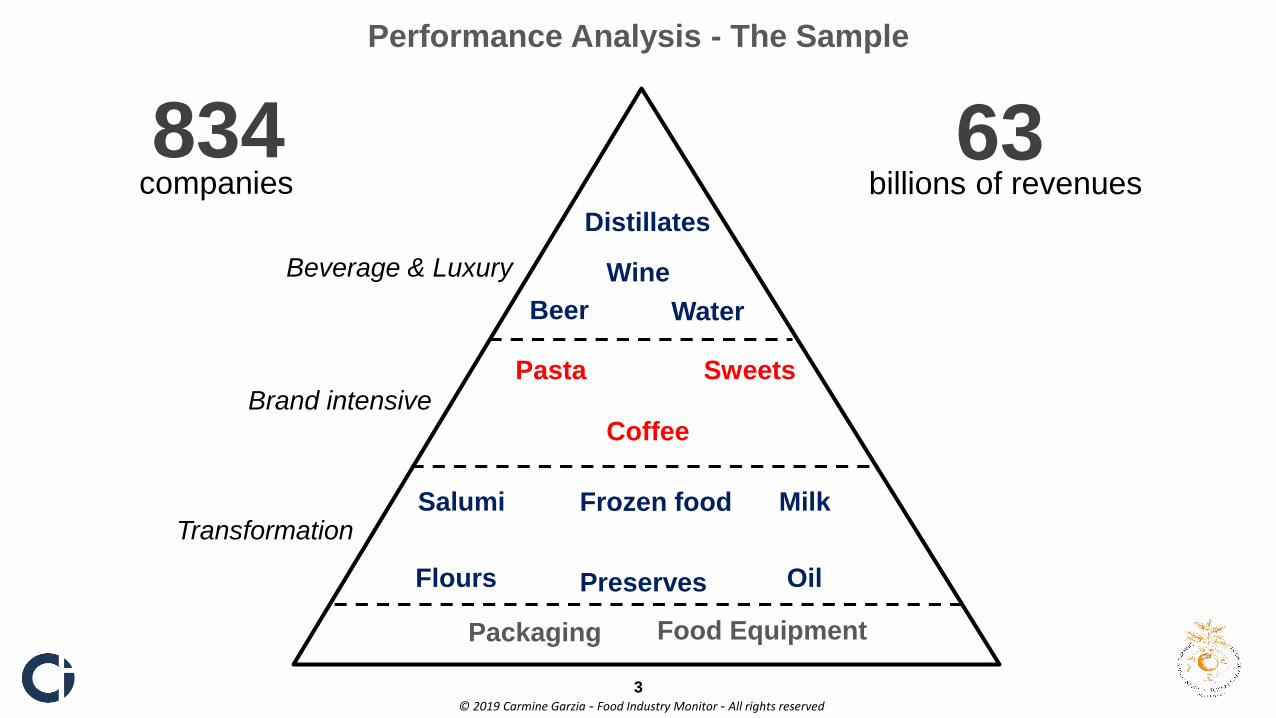
Flours Oil
Transformation
Preserves
Salumi Frozen food Milk
Brand intensivePasta
Coffee
Sweets
Beverage & Luxury
Beer Water
Wine
Distillates
Packaging Food Equipment
834 63companies billions of revenues
3
Performance Analysis - The Sample
4
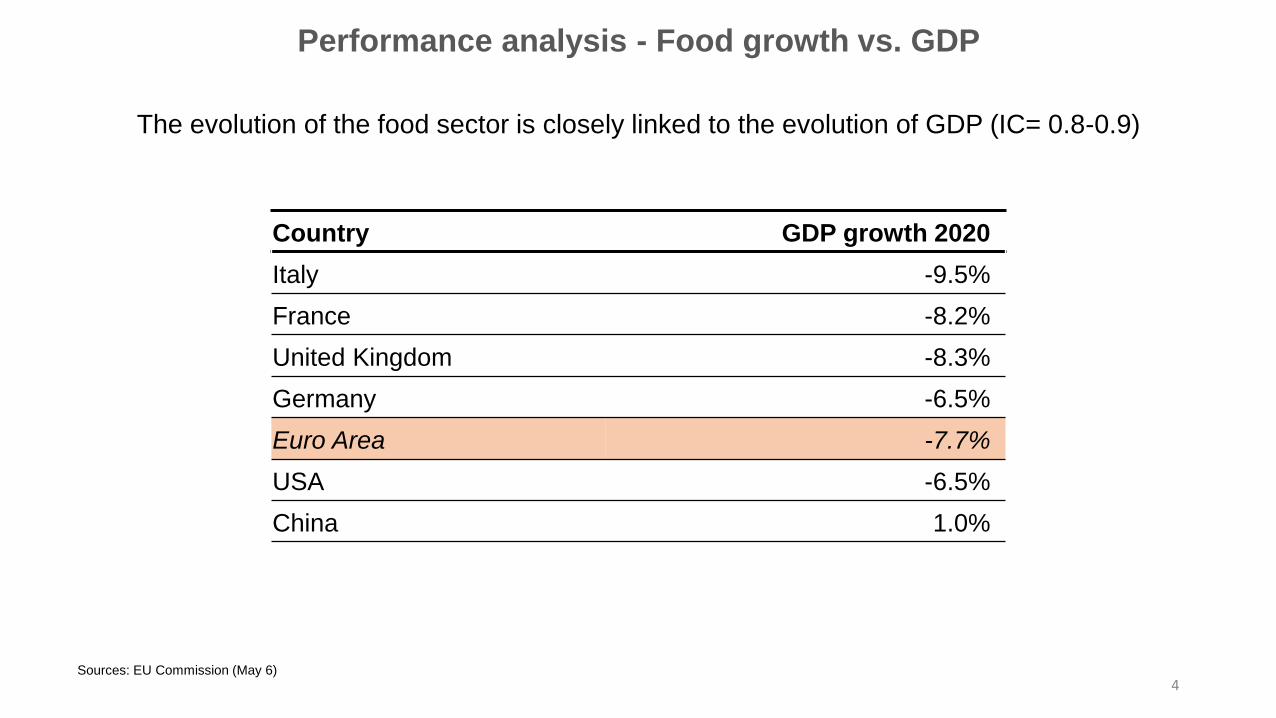
Country GDP growth 2020
Italy -9.5%
France -8.2%
United Kingdom -8.3%
Germany -6.5%
Euro Area -7.7%
USA -6.5%
China 1.0%
Sources: EU Commission (May 6)
The evolution of the food sector is closely linked to the evolution of GDP (IC= 0.8-0.9)
Performance analysis - Food growth vs. GDP
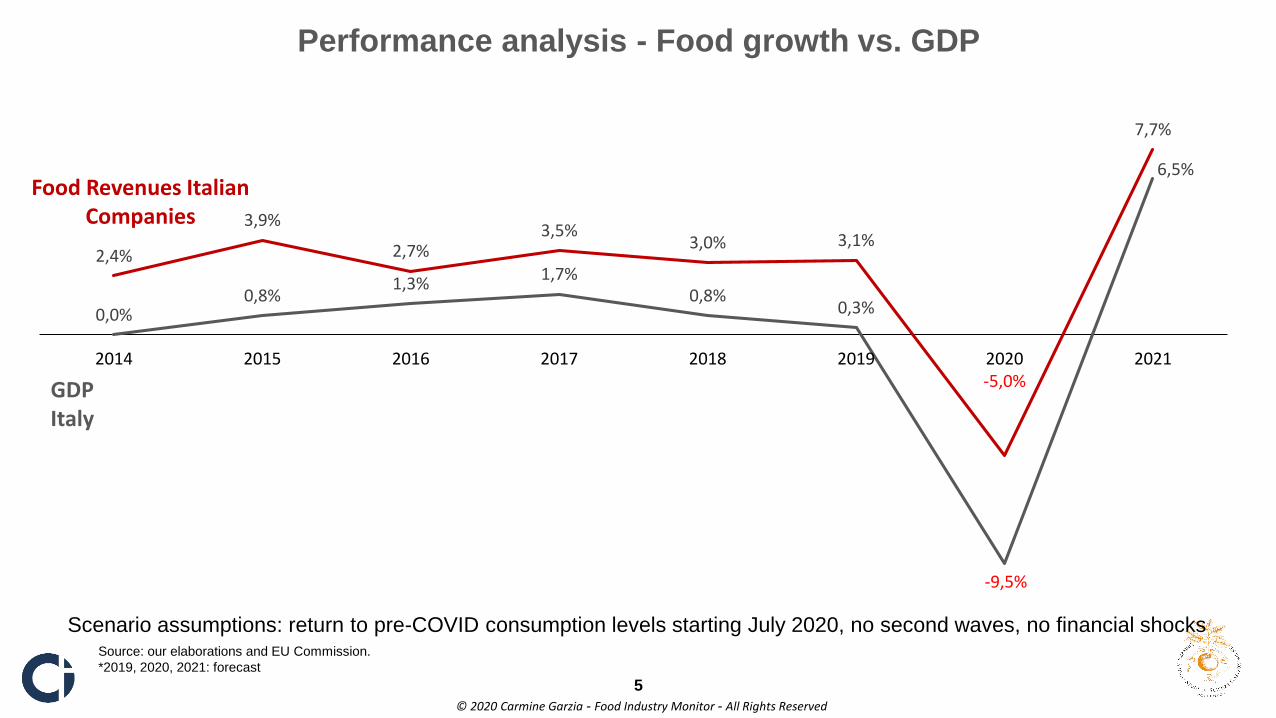
2,4%
3,9%
2,7%3,5%
3,0% 3,1%
-5,0%
7,7%
0,0%0,8%
1,3%1,7%
0,8%0,3%
-9,5%
6,5%
2014 2015 2016 2017 2018 2019 2020 2021
5
Performance analysis - Food growth vs. GDP
Source: our elaborations and EU Commission.
*2019, 2020, 2021: forecast
Food Revenues Italian Companies
GDPItaly
© 2020 Carmine Garzia - Food Industry Monitor - All Rights Reserved
Scenario assumptions: return to pre-COVID consumption levels starting July 2020, no second waves, no financial shocks
6
Performance Analysis - Profitability
*2019, 2020, 2021: forecast
© 2020 Carmine Garzia - Food Industry Monitor - All Rights Reserved
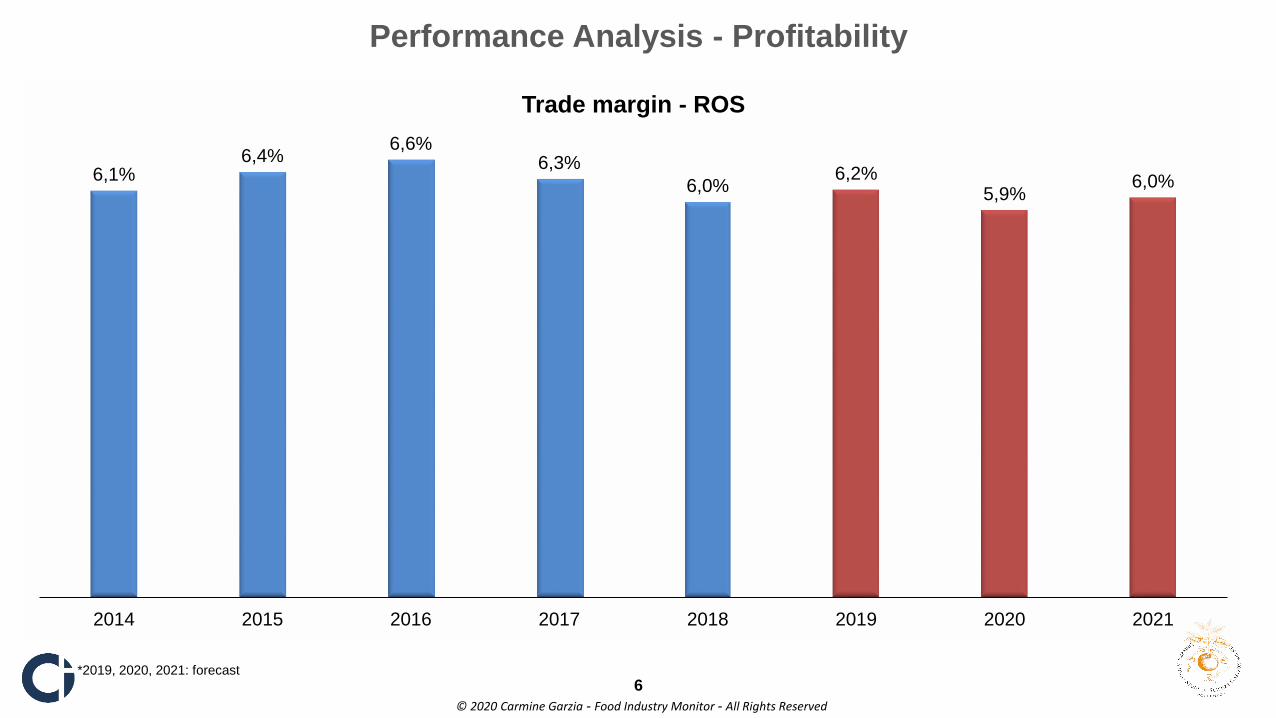
6,1%6,4%
6,6%6,3%
6,0%6,2%
5,9%6,0%
2014 2015 2016 2017 2018 2019 2020 2021
Trade margin - ROS
7
Performance Analysis - Profitability
© 2020 Carmine Garzia - Food Industry Monitor - All Rights Reserved
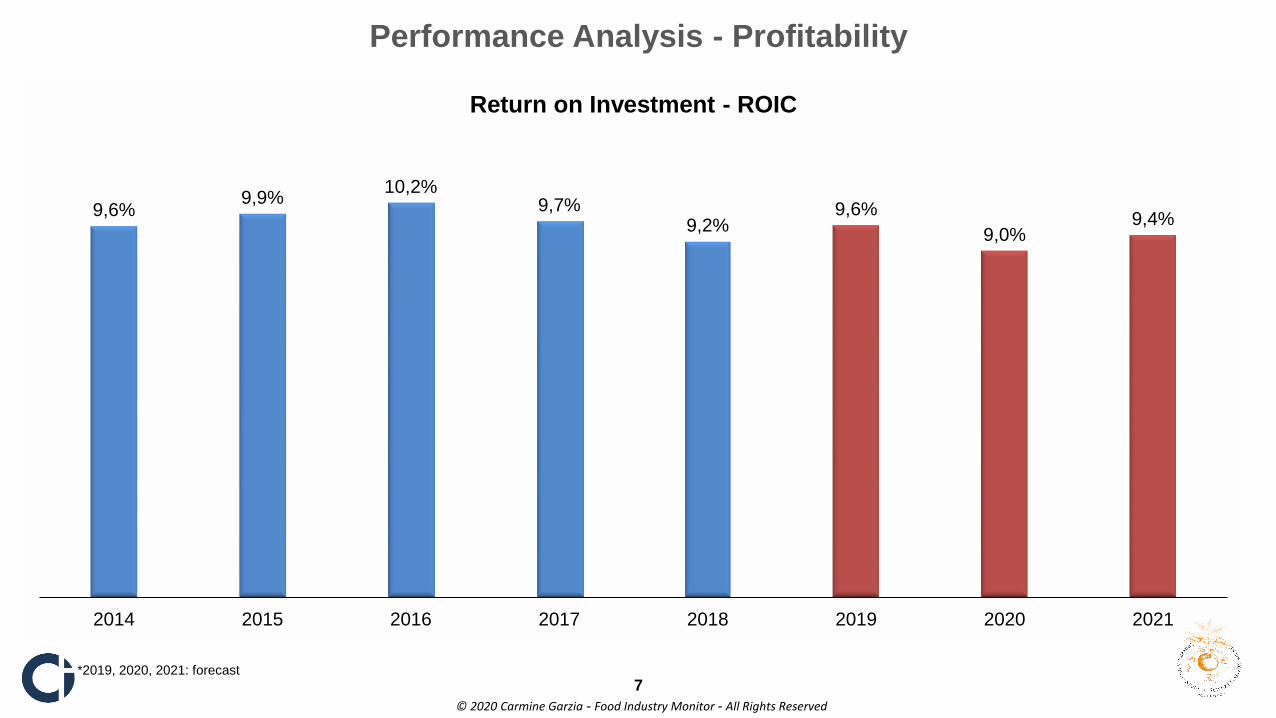
9,6%9,9%
10,2%9,7%
9,2%9,6%
9,0%9,4%
2014 2015 2016 2017 2018 2019 2020 2021
Return on Investment - ROIC
*2019, 2020, 2021: forecast
8
Performance Analysis - Financial Structure
© 2020 Carmine Garzia - Food Industry Monitor - All Rights Reserved
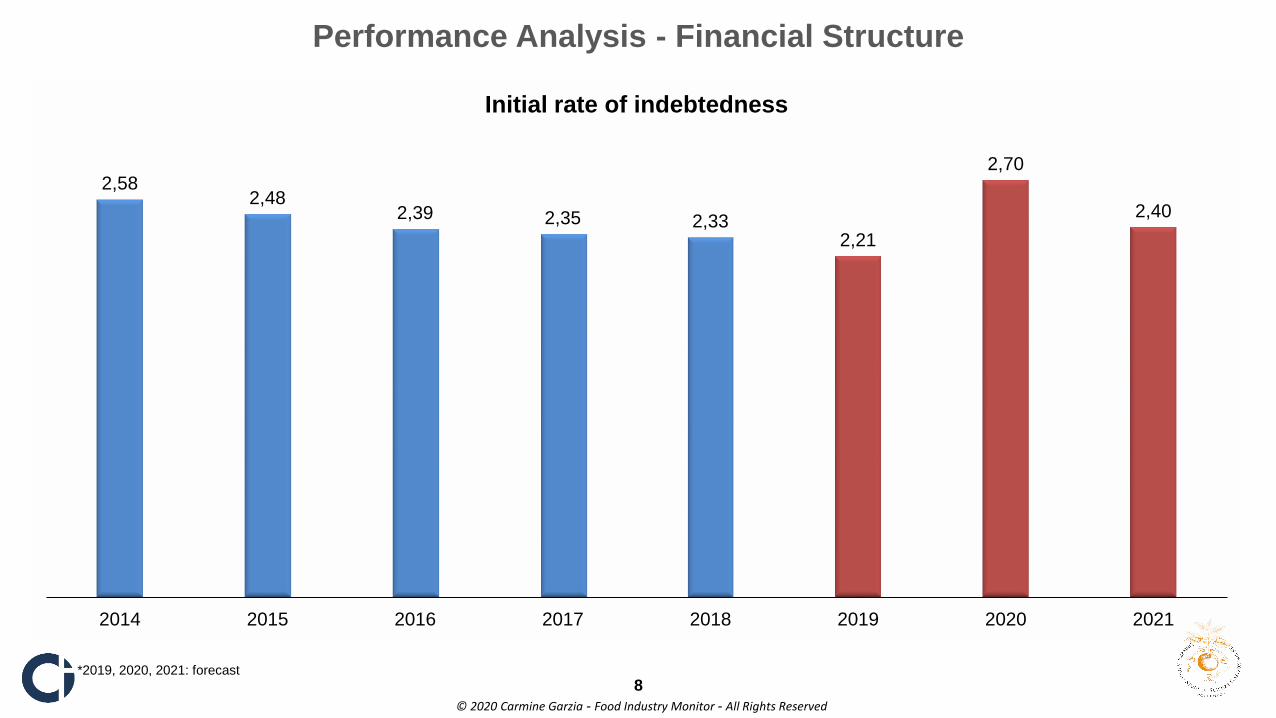
2,582,48
2,39 2,35 2,332,21
2,70
2,40
2014 2015 2016 2017 2018 2019 2020 2021
Initial rate of indebtedness
*2019, 2020, 2021: forecast
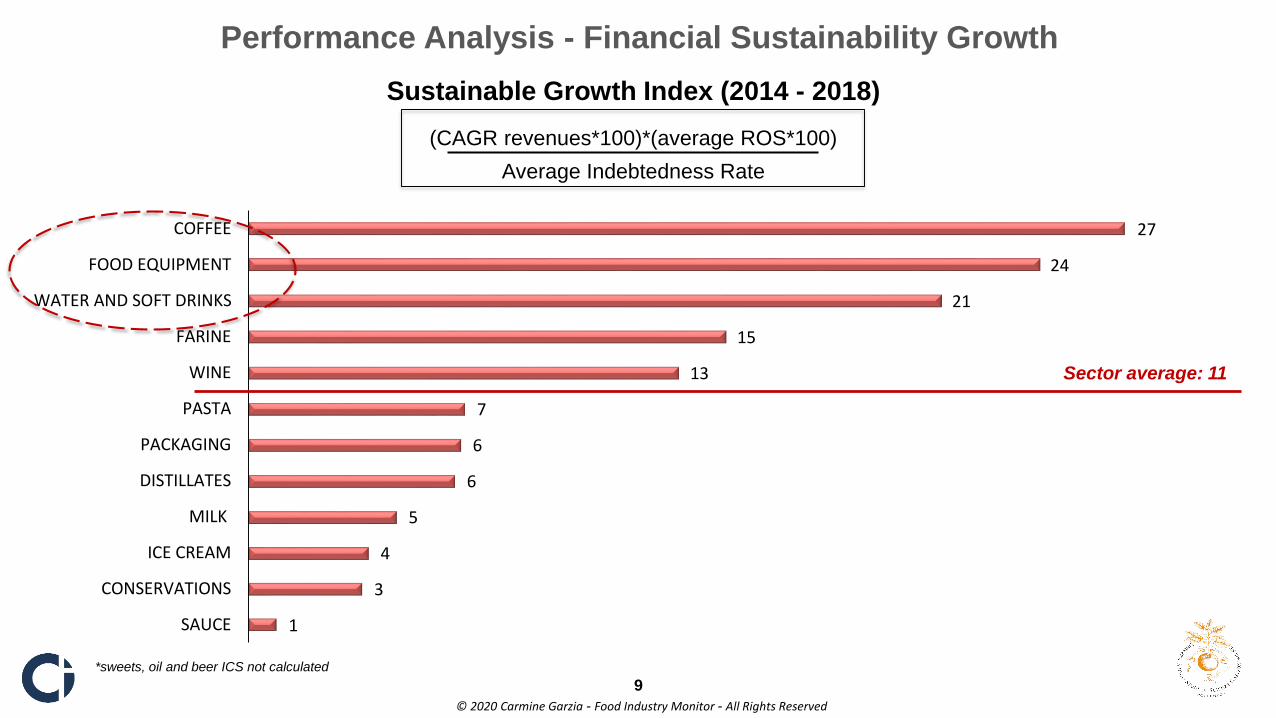
1
3
4
5
6
6
7
13
15
21
24
27
SAUCE
CONSERVATIONS
ICE CREAM
MILK
DISTILLATES
PACKAGING
PASTA
WINE
FARINE
WATER AND SOFT DRINKS
FOOD EQUIPMENT
COFFEE
9
Performance Analysis - Financial Sustainability Growth
(CAGR revenues*100)*(average ROS*100)
Average Indebtedness Rate
Sustainable Growth Index (2014 - 2018)
*sweets, oil and beer ICS not calculated
© 2020 Carmine Garzia - Food Industry Monitor - All Rights Reserved
Sector average: 11
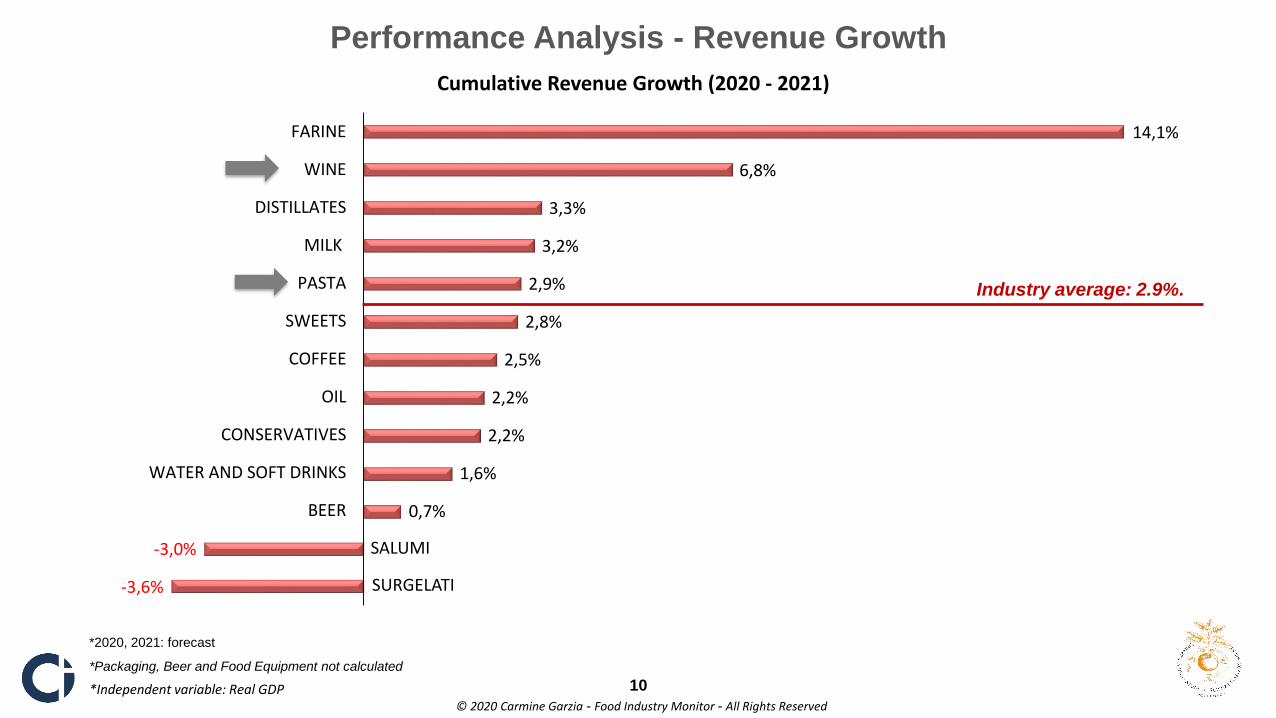
-3,6%
-3,0%
0,7%
1,6%
2,2%
2,2%
2,5%
2,8%
2,9%
3,2%
3,3%
6,8%
14,1%
BEER
WATER AND SOFT DRINKS
CONSERVATIVES
OIL
COFFEE
SWEETS
PASTA
MILK
DISTILLATES
WINE
FARINE
Cumulative Revenue Growth (2020 - 2021)
SALUMI
SURGELATI
10
Performance Analysis - Revenue Growth
© 2020 Carmine Garzia - Food Industry Monitor - All Rights Reserved
*2020, 2021: forecast
Industry average: 2.9%.
*Packaging, Beer and Food Equipment not calculated
*Independent variable: Real GDP
11
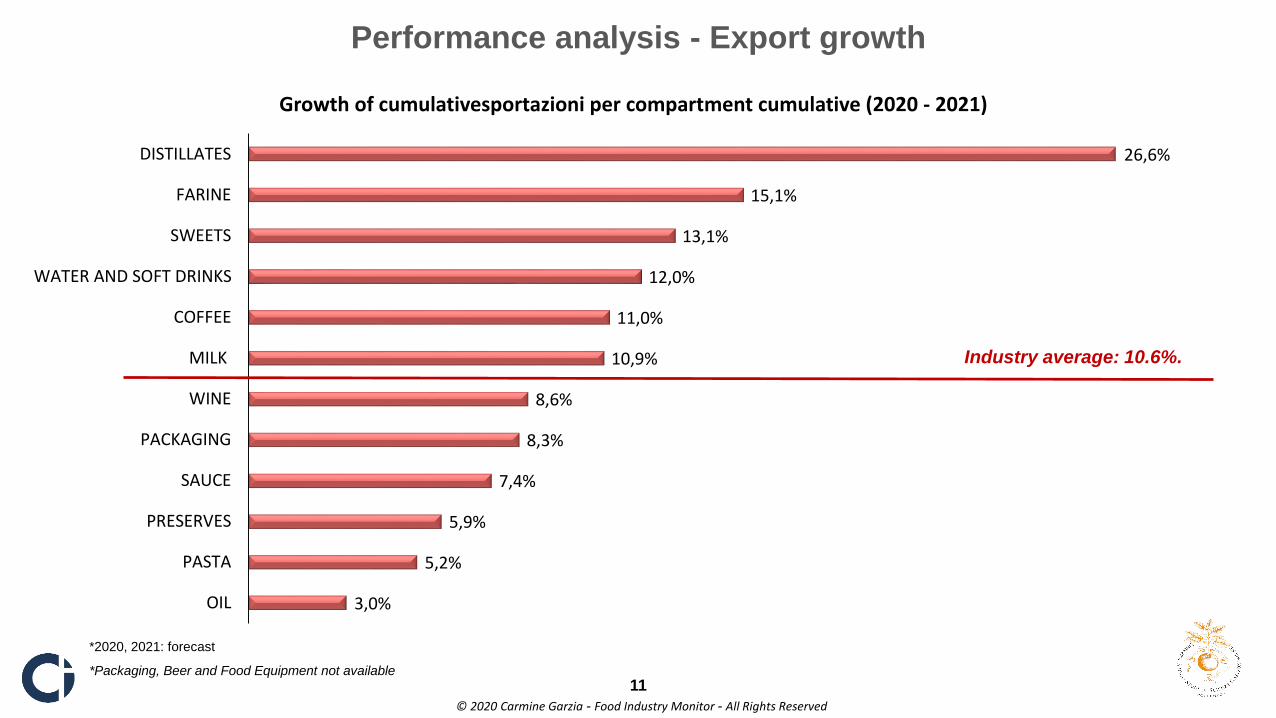
Performance analysis - Export growth
© 2020 Carmine Garzia - Food Industry Monitor - All Rights Reserved
3,0%
5,2%
5,9%
7,4%
8,3%
8,6%
10,9%
11,0%
12,0%
13,1%
15,1%
26,6%
OIL
PASTA
PRESERVES
SAUCE
PACKAGING
WINE
MILK
COFFEE
WATER AND SOFT DRINKS
SWEETS
FARINE
DISTILLATES
Growth of cumulativesportazioni per compartment cumulative (2020 - 2021)
Industry average: 10.6%.
*2020, 2021: forecast
*Packaging, Beer and Food Equipment not available
Content analysis gives insight into consumer behavior
42 web titles analyzed, 60% international
Period of observation: 2015-2019
Identification of recurring topics and perceptual cluster analysis
Content analysis - Objectives and structure
© 2020 Carmine Garzia - Food Industry Monitor - All Rights Reserved
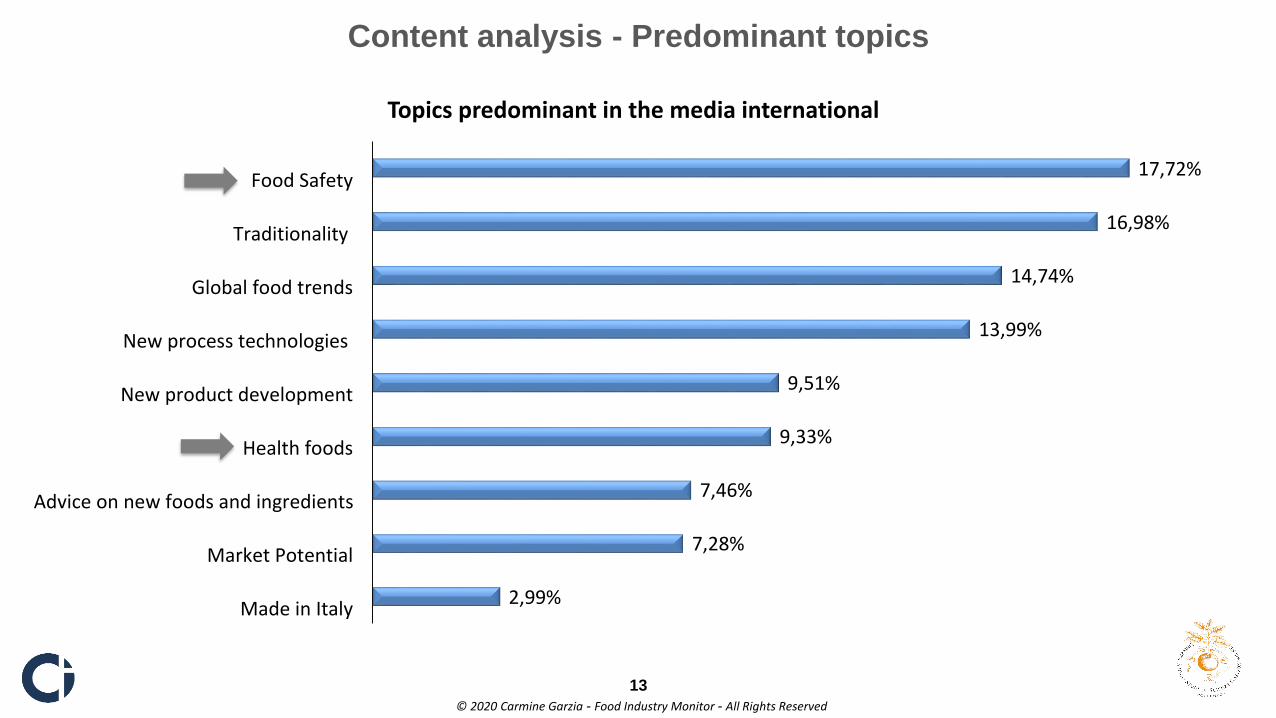
2,99%
7,28%
7,46%
9,33%
9,51%
13,99%
14,74%
16,98%
17,72%
Made in Italy
Market Potential
Advice on new foods and ingredients
Health foods
New product development
New process technologies
Global food trends
Traditionality
Food Safety
Topics predominant in the media international
13
Content analysis - Predominant topics
© 2020 Carmine Garzia - Food Industry Monitor - All Rights Reserved
14
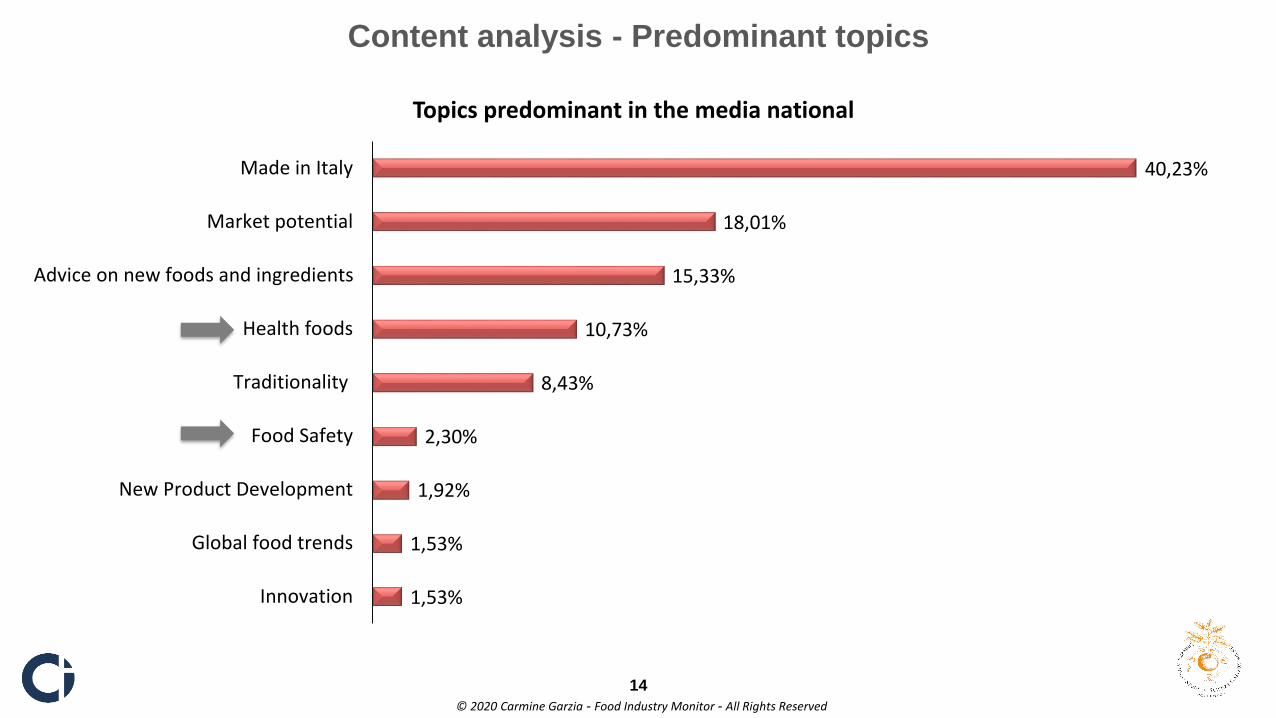
Content analysis - Predominant topics
© 2020 Carmine Garzia - Food Industry Monitor - All Rights Reserved
1,53%
1,53%
1,92%
2,30%
8,43%
10,73%
15,33%
18,01%
40,23%
Innovation
Global food trends
New Product Development
Food Safety
Traditionality
Health foods
Advice on new foods and ingredients
Market potential
Made in Italy
Topics predominant in the media national
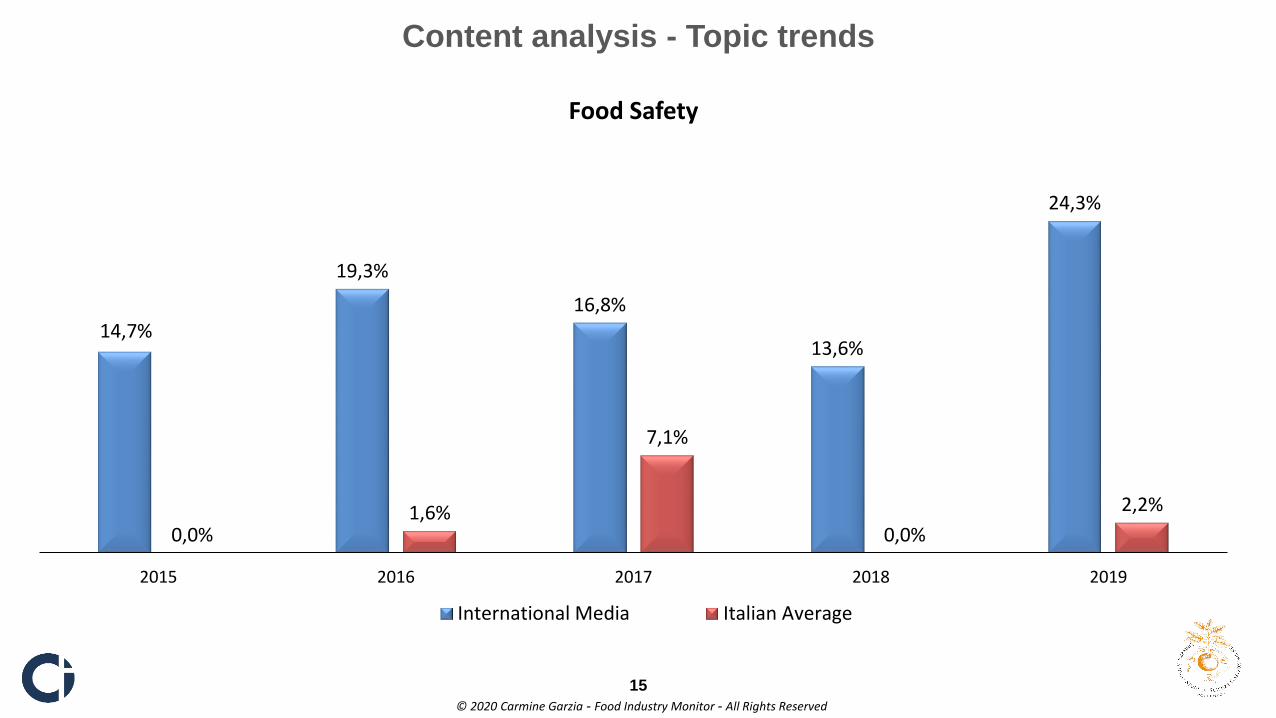
Content analysis - Topic trends
© 2020 Carmine Garzia - Food Industry Monitor - All Rights Reserved
15
14,7%
19,3%
16,8%
13,6%
24,3%
0,0%1,6%
7,1%
0,0%
2,2%
2015 2016 2017 2018 2019
Food Safety
International Media Italian Average
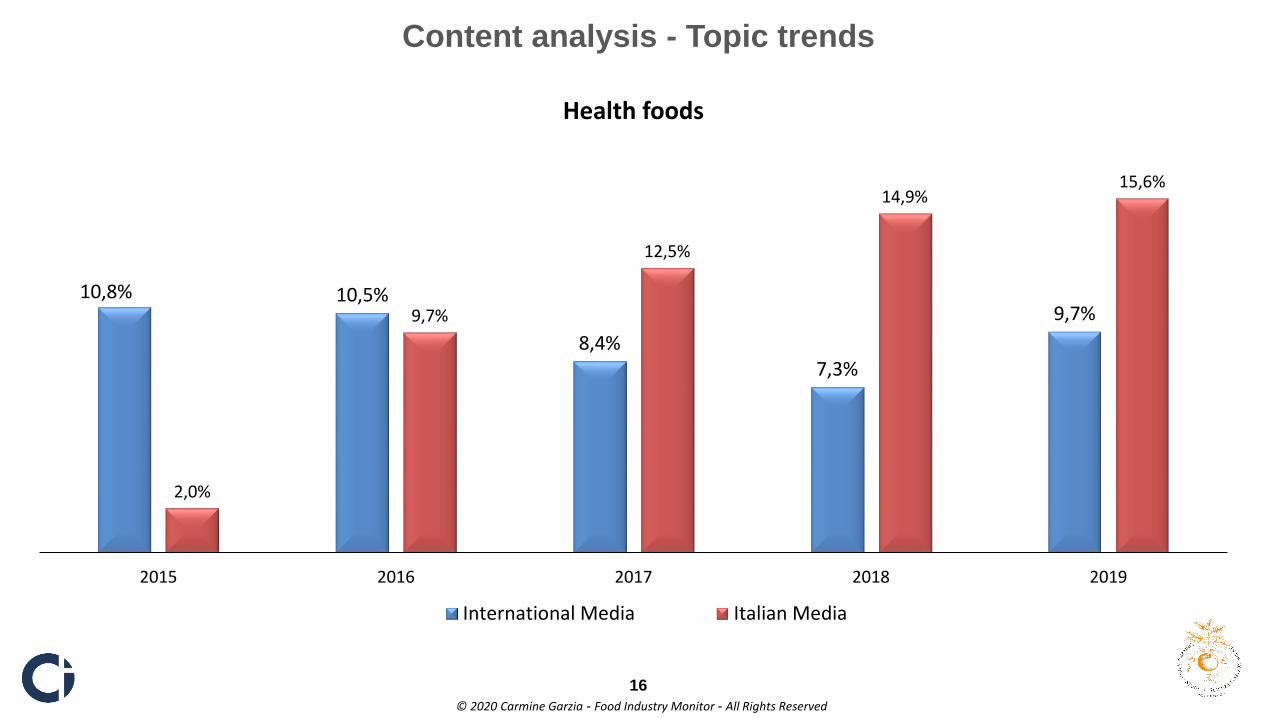
Content analysis - Topic trends
© 2020 Carmine Garzia - Food Industry Monitor - All Rights Reserved
16
10,8% 10,5%
8,4%7,3%
9,7%
2,0%
9,7%
12,5%
14,9%15,6%
2015 2016 2017 2018 2019
Health foods
International Media Italian Media
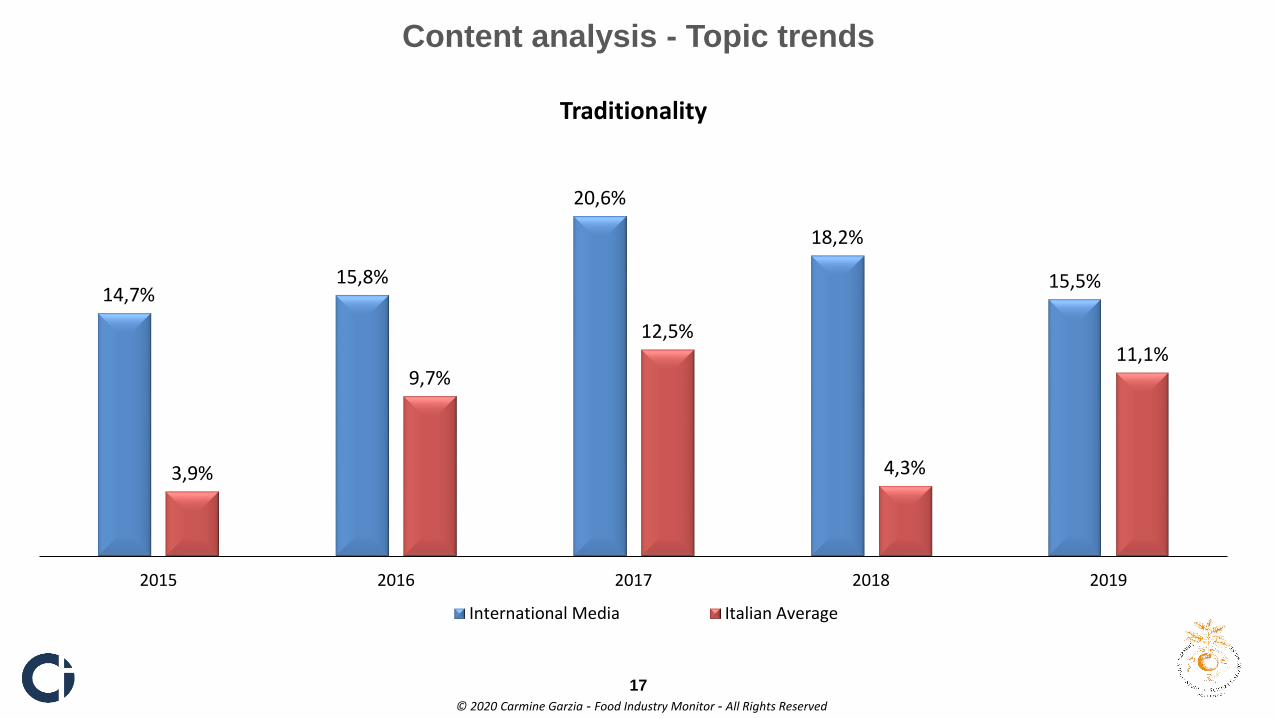
Content analysis - Topic trends
© 2020 Carmine Garzia - Food Industry Monitor - All Rights Reserved
17
14,7%15,8%
20,6%
18,2%
15,5%
3,9%
9,7%
12,5%
4,3%
11,1%
2015 2016 2017 2018 2019
Traditionality
International Media Italian Average
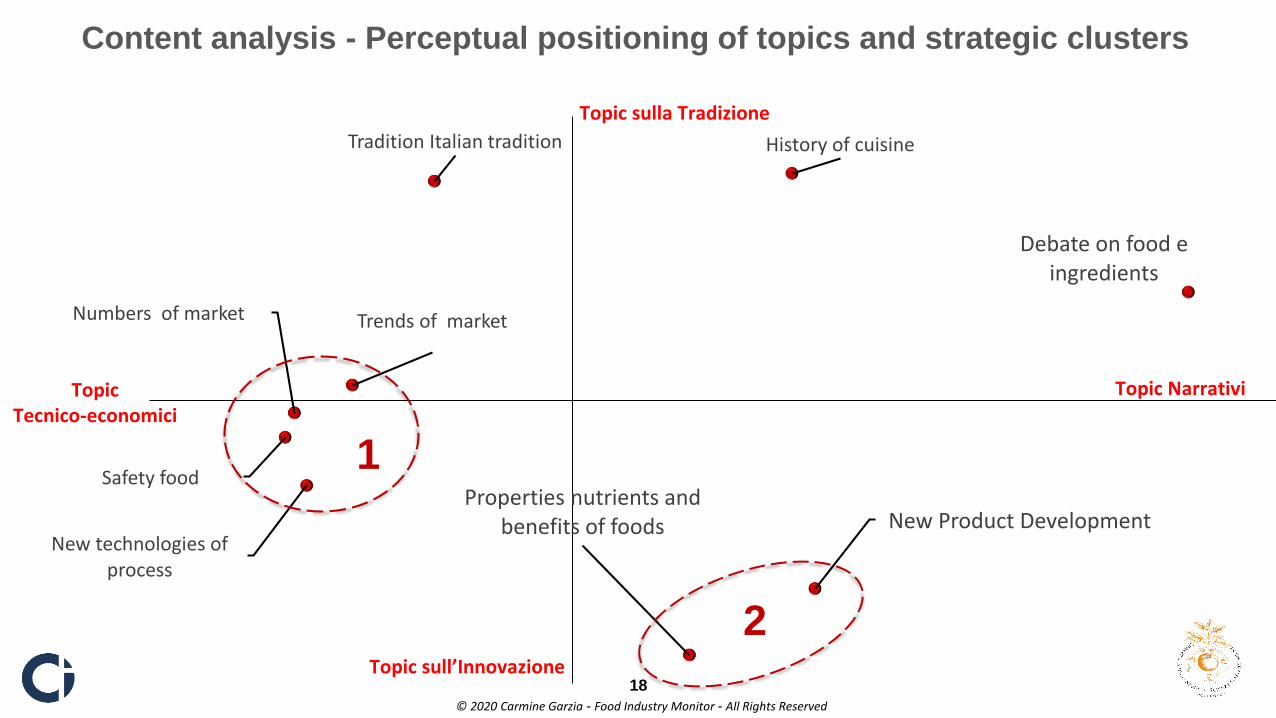
New Product Development
Trends of market
Safety foodProperties nutrients and
benefits of foods
History of cuisine
Numbers of market
New technologies of process
Tradition Italian tradition
Debate on food e ingredients
Topic sulla Tradizione
Topic sull’Innovazione
TopicTecnico-economici
Topic Narrativi
1
2
18
Content analysis - Perceptual positioning of topics and strategic clusters
© 2020 Carmine Garzia - Food Industry Monitor - All Rights Reserved
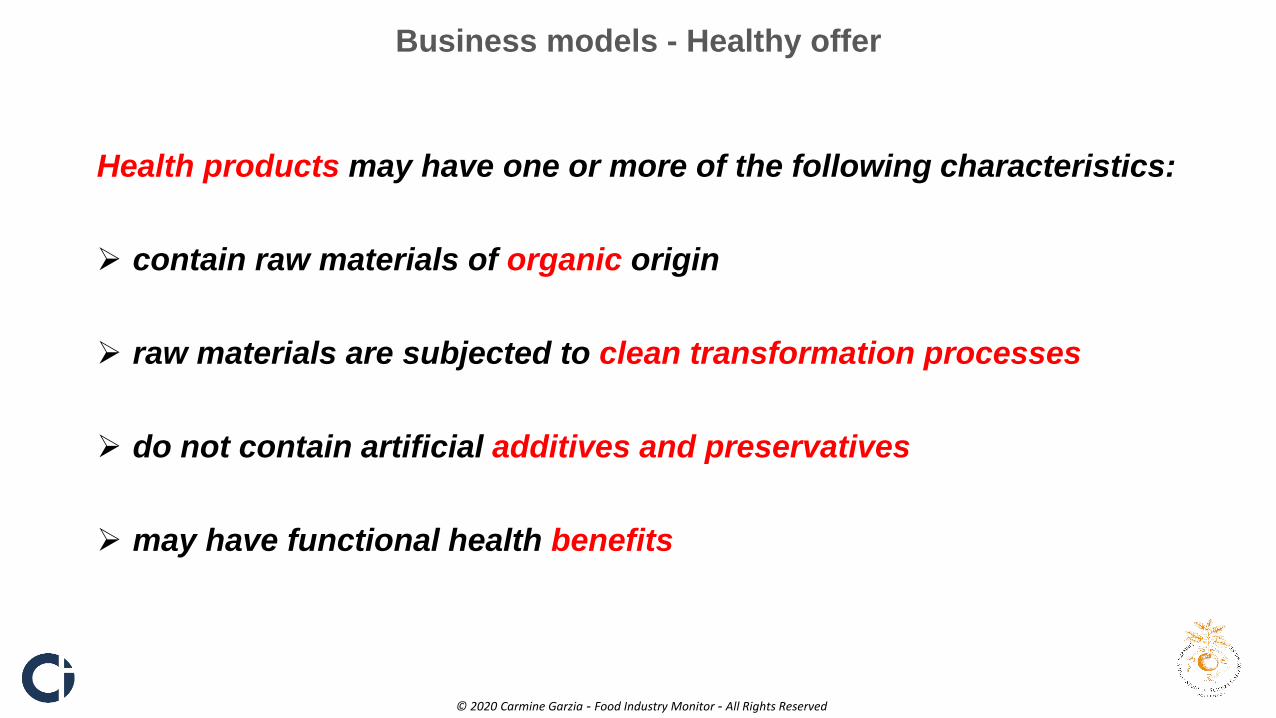
Health products may have one or more of the following characteristics:
contain raw materials of organic origin
raw materials are subjected to clean transformation processes
do not contain artificial additives and preservatives
may have functional health benefits
Business models - Healthy offer
© 2020 Carmine Garzia - Food Industry Monitor - All Rights Reserved

18,3%
21,3%
28,4%
29,4%
41,0%
45,0%
52,8%
57,2%
57,8%
Coffee
Sweets
Water
Pasta
Meat products
Preserves
Milk and dairy products
Oil
Flours
Presence of products on total range of products offered by Italian companies
Business models - Healthy offer
Average: 39.3%.
© 2020 Carmine Garzia - Food Industry Monitor - All Rights Reserved
20
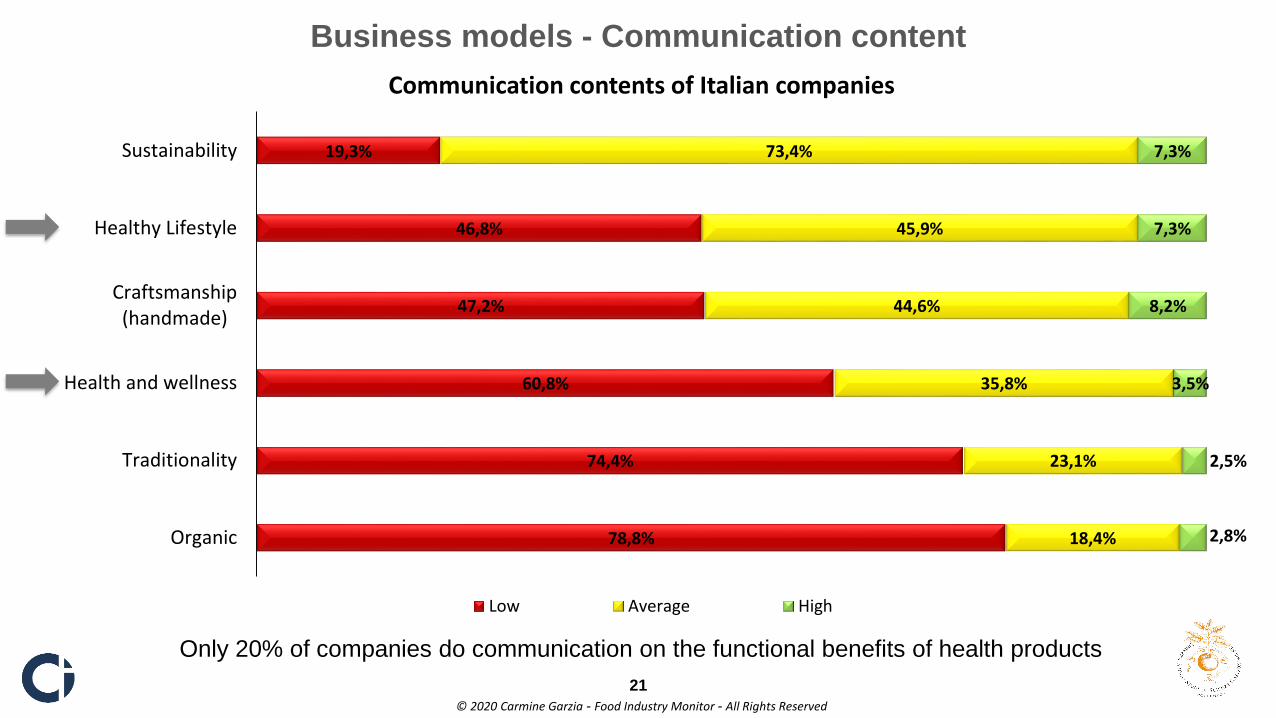
78,8%
74,4%
60,8%
47,2%
46,8%
19,3%
18,4%
23,1%
35,8%
44,6%
45,9%
73,4%
2,8%
2,5%
3,5%
8,2%
7,3%
7,3%
Organic
Traditionality
Health and wellness
Craftsmanship(handmade)
Healthy Lifestyle
Sustainability
Communication contents of Italian companies
Low Average High
Business models - Communication content
© 2020 Carmine Garzia - Food Industry Monitor - All Rights Reserved
21
Only 20% of companies do communication on the functional benefits of health products
22
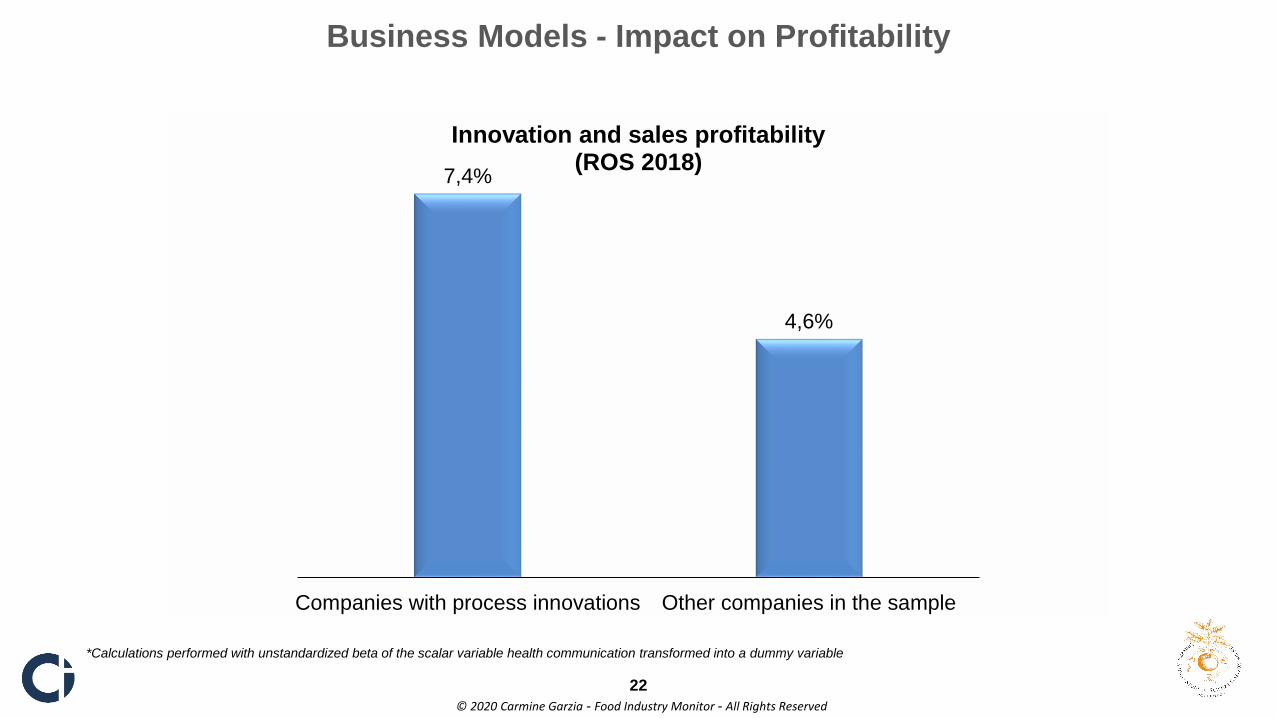
Business Models - Impact on Profitability
© 2020 Carmine Garzia - Food Industry Monitor - All Rights Reserved
7,4%
4,6%
Companies with process innovations Other companies in the sample
Innovation and sales profitability (ROS 2018)
*Calculations performed with unstandardized beta of the scalar variable health communication transformed into a dummy variable
23
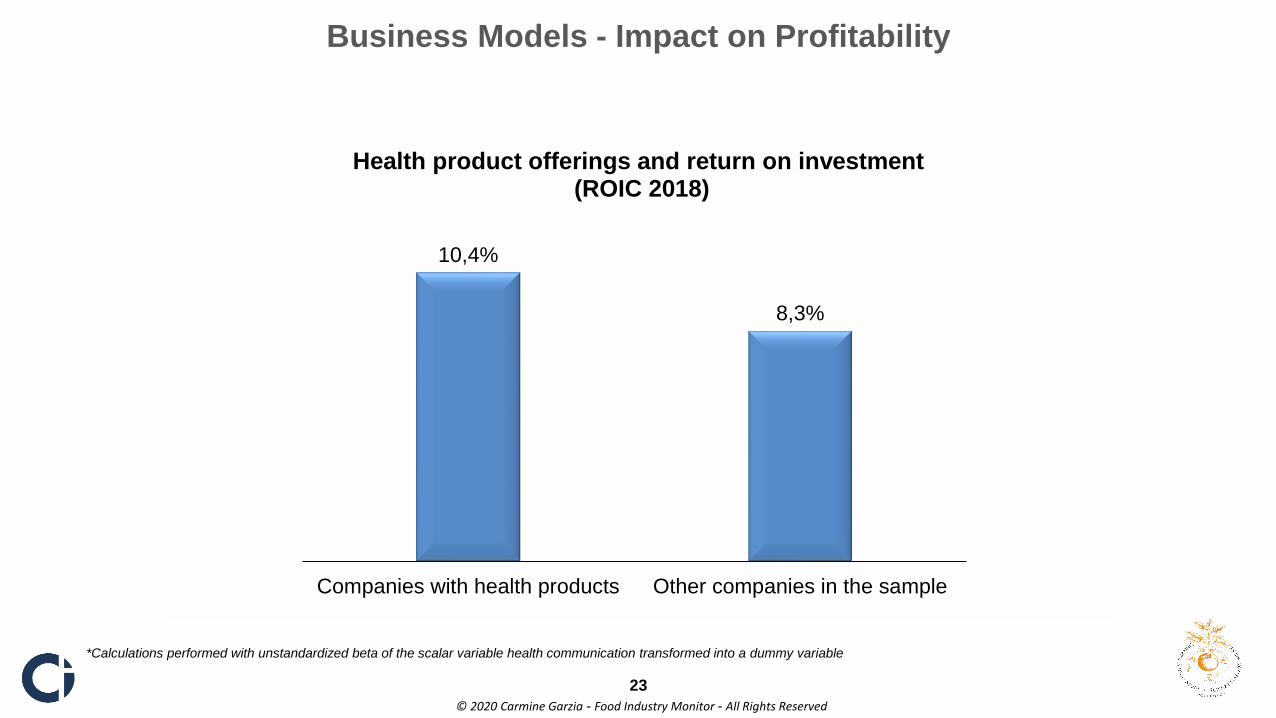
Business Models - Impact on Profitability
© 2020 Carmine Garzia - Food Industry Monitor - All Rights Reserved
10,4%
8,3%
Companies with health products Other companies in the sample
Health product offerings and return on investment(ROIC 2018)
*Calculations performed with unstandardized beta of the scalar variable health communication transformed into a dummy variable
24
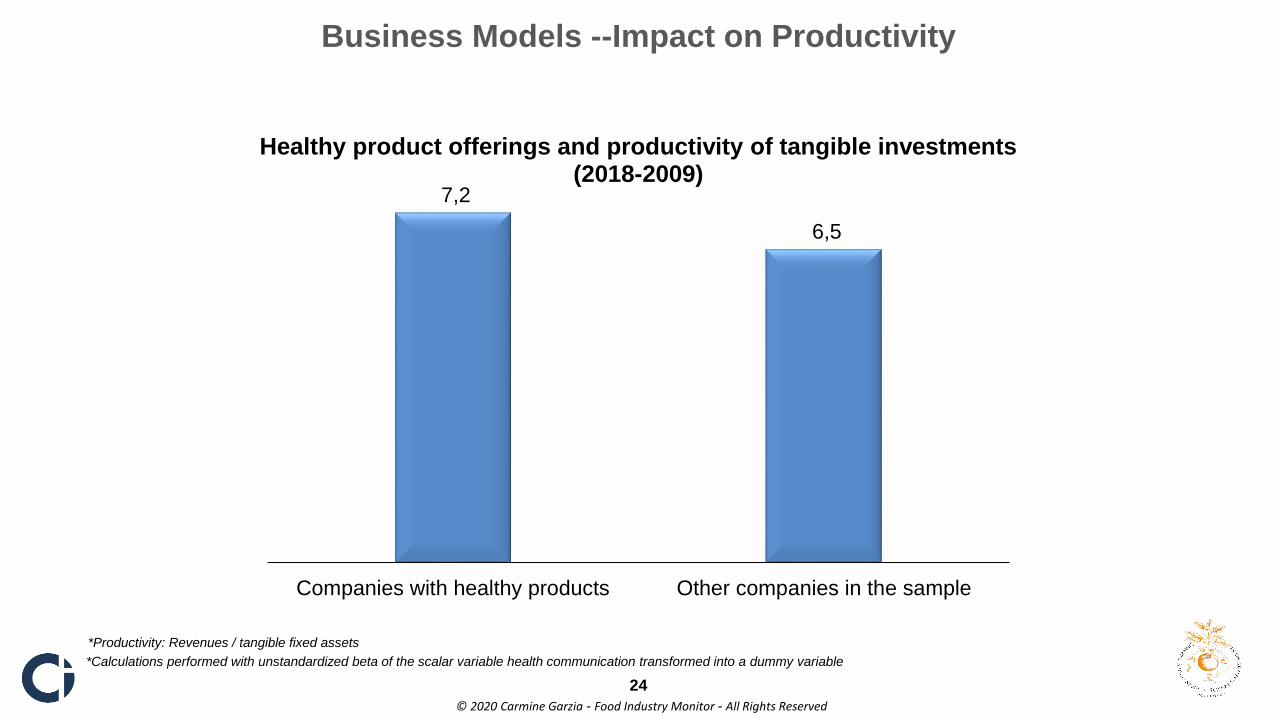
Business Models --Impact on Productivity
© 2020 Carmine Garzia - Food Industry Monitor - All Rights Reserved
*Productivity: Revenues / tangible fixed assets
7,2
6,5
Companies with healthy products Other companies in the sample
Healthy product offerings and productivity of tangible investments (2018-2009)
*Calculations performed with unstandardized beta of the scalar variable health communication transformed into a dummy variable
25
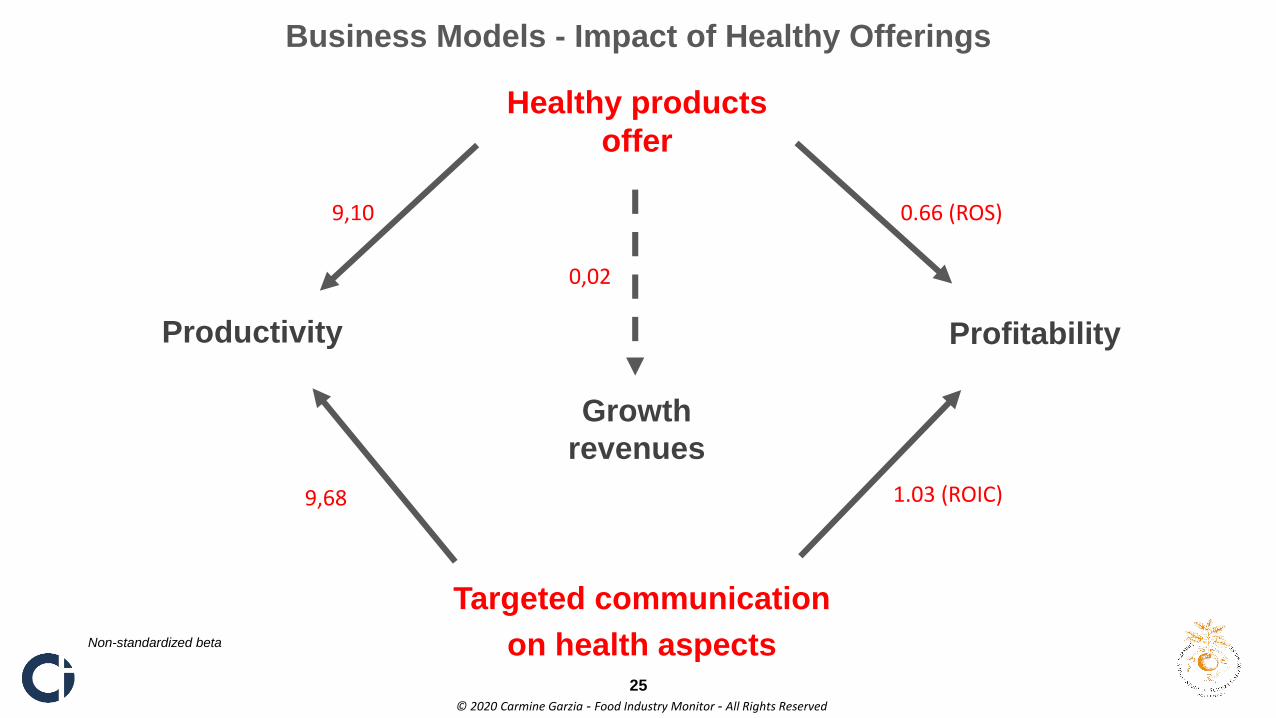
Business Models - Impact of Healthy Offerings
© 2020 Carmine Garzia - Food Industry Monitor - All Rights Reserved
Healthy products
offer
Growth
revenues
Profitability Productivity
Targeted communication
on health aspectsNon-standardized beta
0,02
0.66 (ROS)
1.03 (ROIC)
9,10
9,68
This research report is based on public data and data collected from restricted access databases, which were processed by a team of
researchers at the University of Gastronomic Sciences in Pollenzo, Bra.
Representative samples of the various sectors of the food industry were constructed by extracting companies with ATECO codes, and all the
companies identified in this way were checked to verify the congruity of the activity carried out with the sector to which they belonged.
The financial statements of the companies were acquired from the AIDA and CERVED databases in optical format and were reclassified
according to the financial statement formats currently in use in the context of economic-business analysis.
The report was written by Prof. Carmine Garzia in collaboration with Dr. Francesco Maria Gentile who coordinated the research team for the
collection of questionnaires, the construction of databases and statistical processing. The research team, composed of: Margherita Testa, Sofia
Eleonora D'angelo and Pier Lorenzo Rolando, carried out the collection of empirical data on business models and strategic choices of
companies.
The research project was carried out with the support of Ceresio Investors.
The computations were based on public budget data available as of 5/25/2020. The report was closed as of 06/20/2020.
http://www.foodindustrymonitor.com
26
METHODOLOGY


