Flood Forecast ing and Warn ing on the R i v e r R h i n e G. Steinebach, PhD and K . Wilke, PhD*
Bern
Gamsbsheim Karlsruhe Mainz Duisburg
Lelystadt
Abstract
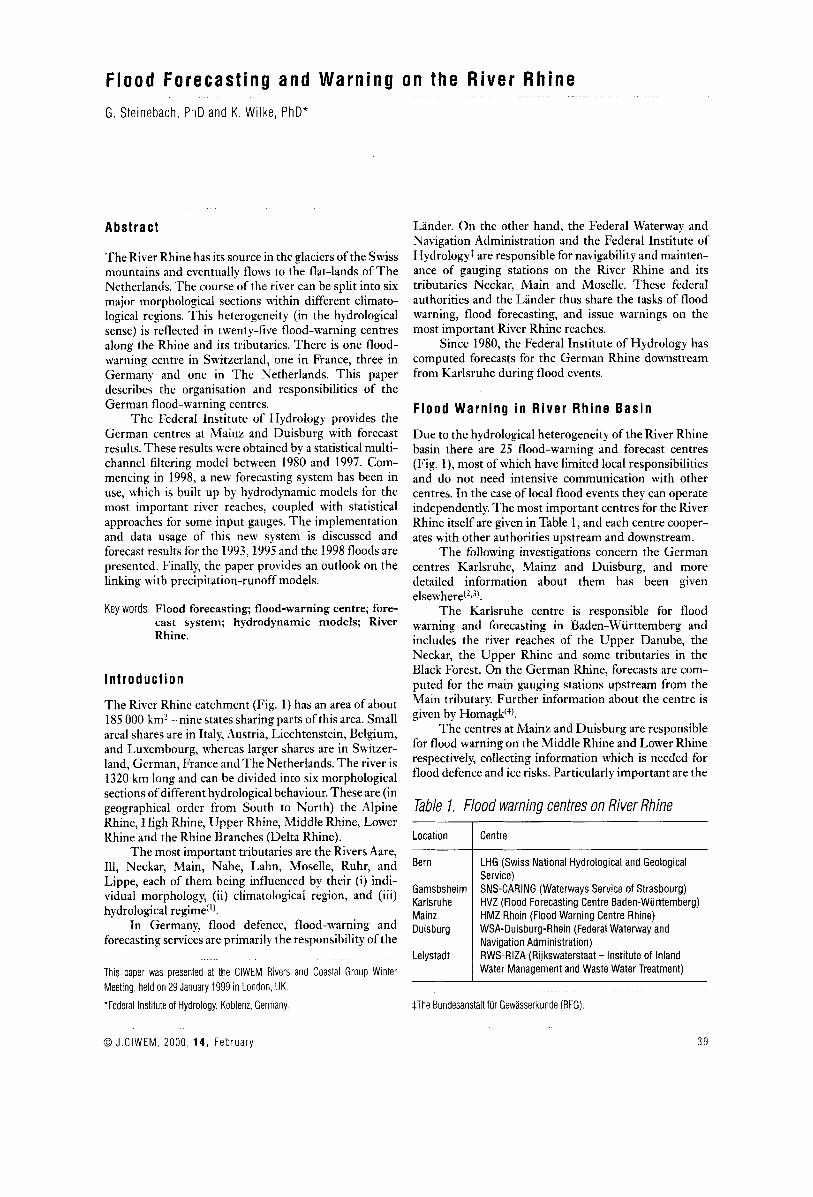
LHG (Swiss National Hydrological and Geological Service) SNS-CARING (Waterways Service of Strasbourg) HVZ (Flood Forecasting Centre Baden-Wurttemberg) HMZ Rhein (Flood Warning Centre Rhine) WSA-Duisburg-Rhein (Federal Waterway and Navigation Administration) RWS-RIZA (Rijkswaterstaat - Institute of Inland Water Management and Waste Water Treatment)
The River Rhine has its source in the glaciers of the Swiss mountains and eventually flows to the flat-lands of The Netherlands. The course of the river can be split into six major morphological sections within different climato- logical regions. This heterogeneity (in the hydrological sense) is reflected in twenty-five flood-warning centres along the Rhine and its tributaries. There is one flood- warning centre in Switzerland, one in France, three in Germany and one in The Netherlands. This paper describes the organisation and responsibilities of the German flood-warning centres.
The Federal Institute of Hydrology provides the German centres at Mainz and Duisburg with forecast results. These results were obtained by a statistical multi- channel filtering model between 1980 and 1997. Com- mencing in 1998, a new forecasting system has been in use, which is built up by hydrodynamic models for the most important river reaches, coupled with statistical approaches for some input gauges. The implementation and data usage of this new system is discussed and forecast results for the 1993,1995 and the 1998 floods are presented. Finally, the paper provides an outlook on the linking with precipitation-runoff models.
Key words: Flood forecasting; flood-warning centre; fore- cast system; hydrodynamic models; River Rhine.
I n t r o d u c t i o n
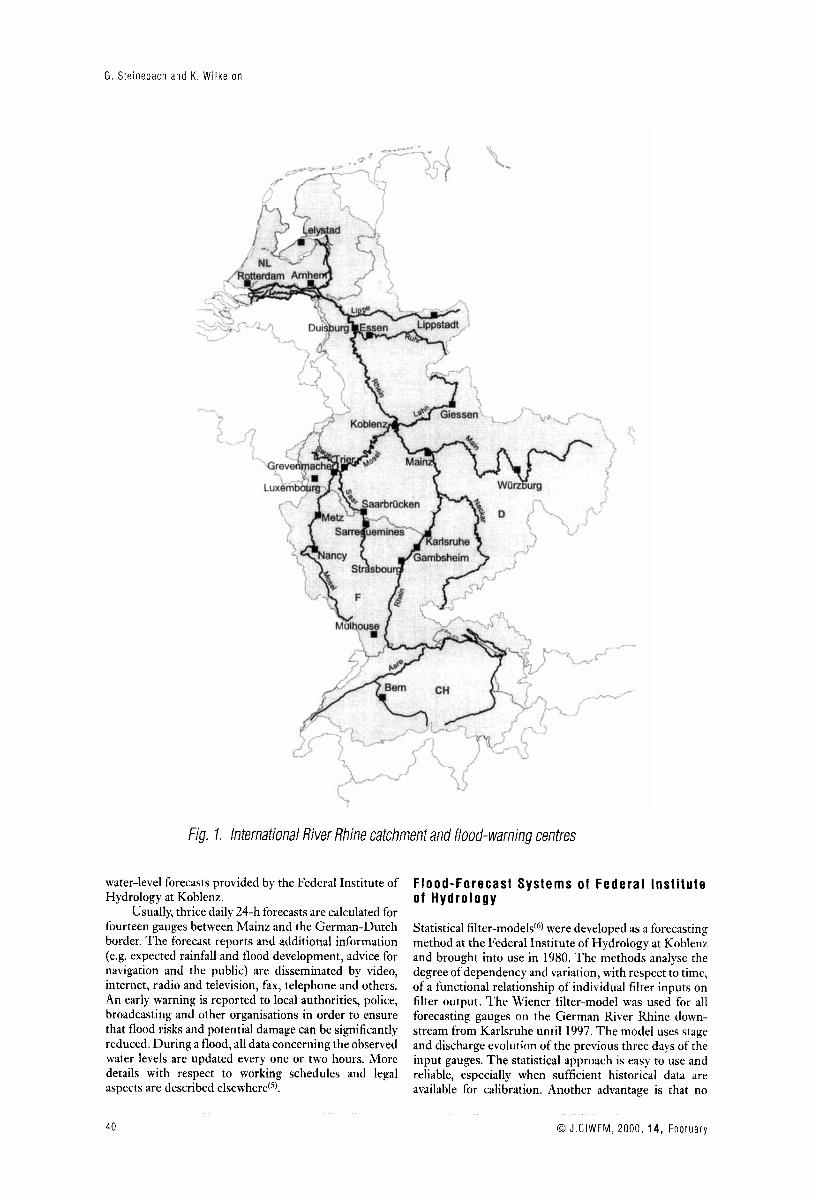
The River Rhine catchment (Fig. 1) has an area of about 185 000 km2 -nine states sharing parts of this area. Small areal shares are in Italy, Austria, Liechtenstein, Belgium, and Luxembourg, whereas larger shares are in Switzer- land, German, France and The Netherlands. The river is 1320 km long and can be divided into six morphological sections of different hydrological behaviour. These are (in geographical order from South to North) the Alpine Rhine, High Rhine, Upper Rhine, Middle Rhine, Lower Rhine and the Rhine Branches (Delta Rhine).
The most important tributaries are the Rivers Aare, Ill, Neckar, Main, Nahe, Lahn, Moselle, Ruhr, and Lippe, each of them being influenced by their (i) indi- vidual morphology, (ii) climatological region, and (iii) hydrological regime").
In Germany, flood defence, flood-warning and forecasting services are primarily the responsibility of the
This paper was presented at the CIWEM Rivers and Coastal Group Winter Meeting, held on 29 January 1999 in London, UK
*Federal Institute of Hydrology, Koblenz, Germany
Lander. On the other hand, the Federal Waterway and Navigation Administration and the Federal Institute of Hydrology4 are responsible for navigability and mainten- ance of gauging stations on the River Rhine and its tributaries Neckar, Main and Moselle. These federal authorities and the Lander thus share the tasks of flood warning, flood forecasting, and issue warnings on the most important River Rhine reaches.
Since 1980, the Federal Institute of Hydrology has computed forecasts for the German Rhine downstream from Karlsruhe during flood events.
F l o o d W a r n i n g i n R i v e r R h i n e B a s i n
Due to the hydrological heterogeneity of the River Rhine basin there are 25 flood-warning and forecast centres (Fig. l) , most of which have limited local responsibilities and do not need intensive communication with other centres. In the case of local flood events they can operate independently. The most important centres for the River Rhine itself are given in Table 1, and each centre cooper- ates with other authorities upstream and downstream.
The following investigations concern the German centres Karlsruhe, Mainz and Duisburg, and more detailed information about them has been given el~ewhere(~1~).
The Karlsruhe centre is responsible for flood warning and forecasting in Baden-Wurttemberg and includes the river reaches of the Upper Danube, the Neckar, the Upper Rhine and some tributaries in the Black Forest. On the German Rhine, forecasts are com- puted for the main gauging stations upstream from the Main tributary. Further information about the centre is given by H ~ m a g k ( ~ ) .
The centres at Mainz and Duisburg are responsible for flood warning on the Middle Rhine and Lower Rhine respectively, collecting information which is needed for flood defence and ice risks. Particularly important are the
Table 1. Flood warning centres on River Rhine
Location I Centre
0 J.CIWEM, 2000, 1 4 , February 39
G . Steinebach and K . W i l k e on
f ig. 7. /n~ernatiuna/ River Rhine catchment and flood-warning centres
water-level forecasts provided by the Federal Institute of Hydrology at Koblenz.
Usually, thrice daily 24-h forecasts are calculated for fourteen gauges between Mainz and the German-Dutch border. The forecast reports and additional information (e.g. expected rainfall and flood development, advice for navigation and the public) are disseminated by video, internet, radio and television, fax, telephone and others. An early warning is reported to local authorities, police, broadcasting and other organisations in order to ensure that flood risks and potential damage can be significantly reduced. During a flood, all dataconcerning the observed water levels are updated every one or two hours. More details with respect to working schedules and legal aspects are described elsewhere(".
Flood-Forecast Systems of Federa l Inst i tute o f H y d r o l o g y
Statistical filter-models@) were developed as a forecasting method at the Federal Institute of Hydrology at Koblenz and brought into use in 1980. The methods analyse the degree of dependency and variation, with respect to time, of a functional relationship of individual filter inputs on filter output. The Wiener filter-model was used for all forecasting gauges on the German River Rhine down- stream from Karlsruhe until 1997. The model uses stage and discharge evolution of the previous three days of the input gauges. The statistical approach is easy to use and reliable, especially when sufficient historical data are available for calibration. Another advantage is that no
40 0 J C I W E M , 2000, 14, F e b r u a r y
F l o o d F o r e c a s t i n g and W a r n i n g on the R ive r Rh ine
information about the river-bed geometry needs to be known.
The HVZ Karlsruhe is responsible for the compu- tation of the forecasts for the gauges upstream from the Main confluence and the Federal Institute of Hydrology is responsible for the gauges downstream. Recently, the Institute has used a new modelling approach for flood forecasting based upon hydrodynamic models. This model has been applied to flow forecasting on the River Rhine for navigation during low-water periods since 1996.
With this new model it is easier either to take into account forecast results for input gauges by other authorities or to link the core model with others. Furthermore, it is possible to consider retention measures or changes in cross-sections directly, or to compute forecasts for any chosen section, e.g. a newly installed gauging station.
The new River Rhine forecast system consists of four sub-models:
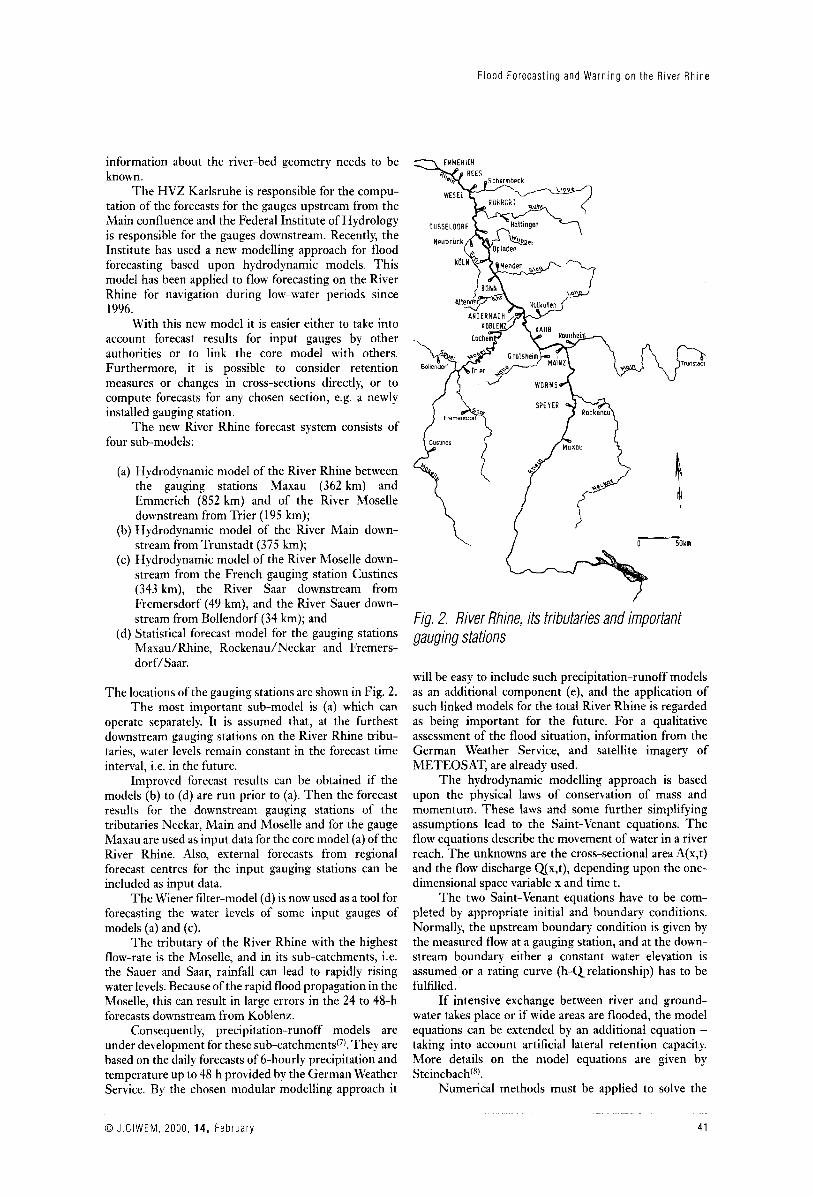
(a) Hydrodynamic model of the River Rhine between the gauging stations Maxau (362 km) and Emmerich (852 km) and of the River Moselle downstream from Trier (195 km);
(b) Hydrodynamic model of the River Main down- stream from Trunstadt (375 km);
(c) Hydrodynamic model of the River Moselle down- stream from the French gauging station Custines (343 km), the River Saar downstream from Fremersdorf (49 km), and the River Sauer down- stream from Bollendorf (34 km); and
(d) Statistical forecast model for the gauging stations Maxau/Rhine, RockenadNeckar and Fremers- dorf/Saar.
The locations of the gauging stations are shown in Fig. 2. The most important sub-model is (a) which can
operate separately. It is assumed that, at the furthest downstream gauging stations on the River Rhine tribu- taries, water levels remain constant in the forecast time interval, i.e. in the future.
Improved forecast results can be obtained if the models (b) to (d) are run prior to (a). Then the forecast results for the downstream gauging stations of the tributaries Neckar, Main and Moselle and for the gauge Maxau are used as input data for the core model (a) of the River Rhine. Also, external forecasts from regional forecast centres for the input gauging stations can be included as input data.
The Wiener filter-model (d) is now used as a tool for forecasting the water levels of some input gauges of models (a) and (c).
The tributary of the River Rhine with the highest flow-rate is the Moselle, and in its sub-catchments, i.e. the Sauer and Saar, rainfall can lead to rapidly rising water levels. Because of the rapid flood propagation in the Moselle, this can result in large errors in the 24 to 48-h forecasts downstream from Koblenz.
Consequently, precipitation-runoff models are under development for these sub- catchment^(^). They are based on the daily forecasts of 6-hourly precipitation and temperature up to 48 h provided by the German Weather Service. By the chosen modular modelling approach it
Schermbeck
DUSSELDORF Haitingen
Neubruck Dploden
/ IT---- 50km
Fig. 2. River Rhine, its tributaries and important gauging stations
will be easy to include such precipitation-runoff models as an additional component (e), and the application of such linked models for the total River Rhine is regarded as being important for the future. For a qualitative assessment of the flood situation, information from the German Weather Service, and satellite imagery of METEOSAT, are already used.
The hydrodynamic modelling approach is based upon the physical laws of conservation of mass and momentum. These laws and some further simplifying assumptions lead to the Saint-Venant equations. The flow equations describe the movement of water in a river reach. The unknowns are the cross-sectional area A(x,t) and the flow discharge QLx,t), depending upon the one- dimensional space variable x and time t.
The two Saint-Venant equations have to be com- pleted by appropriate initial and boundary conditions. Normally, the upstream boundary condition is given by the measured flow at a gauging station, and at the down- stream boundary either a constant water elevation is assumed or a rating curve (h-Qrelationship) has to be fulfilled.
If intensive exchange between river and ground- water takes place or if wide areas are flooded, the model equations can be extended by an additional equation - taking into account artificial lateral retention capacity. More details on the model equations are given by Steinebach@).
Numerical methods must be applied to solve the
0 J.CIWEM. 2000, 14, February 41
G . Ste inebach and K. W i l k e on
occurring partial differential equations (PDEs), where the numerical method of lines approach is used for the solution. In a first step, the system of PDEs is discretised in space by finite differences or other specially adopted schemes. This semi-discretisation process yields a system of linked differential algebraic equations (DAEs). The solution of the remaining DAE-system is achieved by a modified version of the semi-implicit fourth order Rosenbrock-Wanner (ROW) method RODAS. ROW methods are generalised implicit Runge-Kutta methods and achieve good numerical results with respect to stability, efficiency and accuracy.
The daily experience with the forecast system shows that the RODAS scheme is robust. If a proper implementation is provided, the end-user does not need knowledge in numerics. Further descriptions of the numerical solution schemes are given elsewhere('J).
To operate the forecast system, all input data have to be collected in a pre-processor step. At present, about 70 gauging stations are interrogated automatically by a modem connection, and all input data are checked
graphically. The overall time for the graphical check of input data, the computation of the forecasts with the different models (a), (b), (c) and (d), and the graphical output for the forecast results is about 20 mins. This leads to a reasonable working time for operational use, provided that the collection of the input data can be completed within 30-45 mins.
The whole forecast system is implemented on an UNIX-work station under Fortran, and all graphics ate performed with the help of the Fortran subroutine library GINO.
F o r e c a s t R e s u l t s
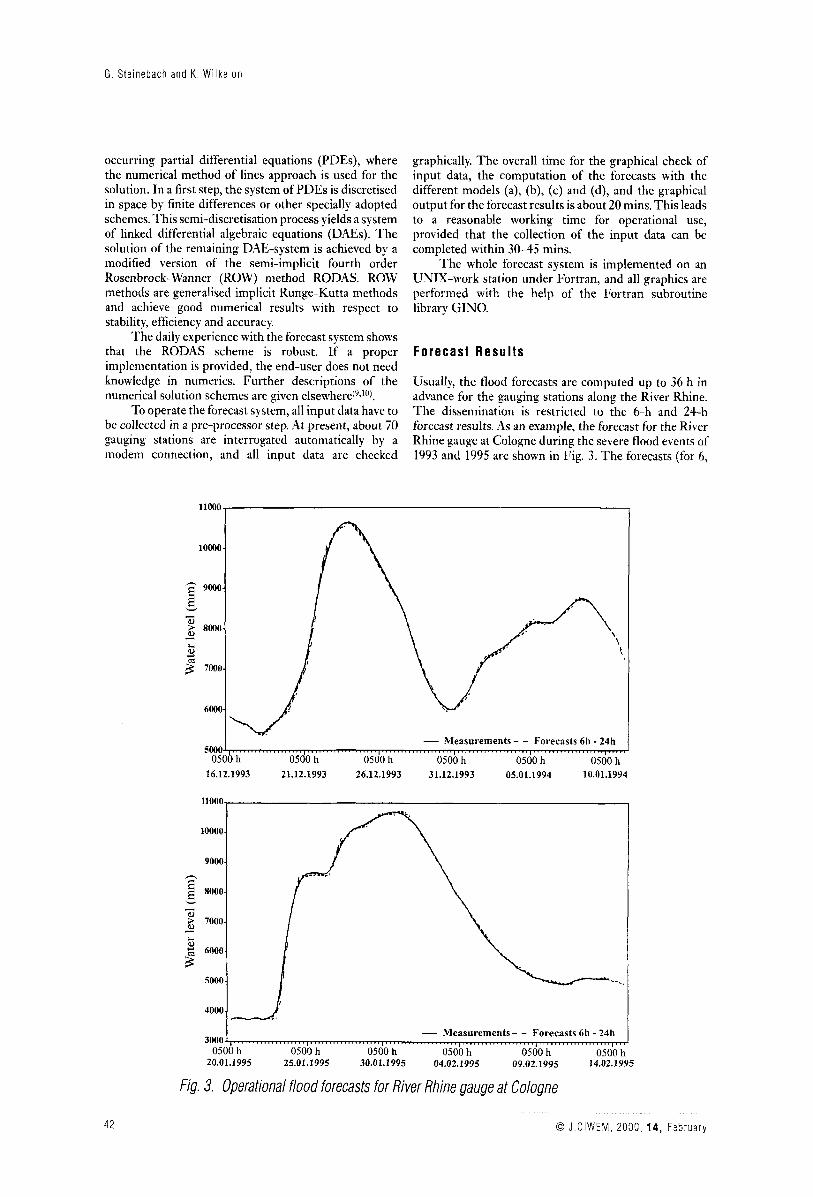
Usually, the flood forecasts are computed up to 36 h in advance for the gauging stations along the River Rhine. The dissemination is restricted to the 6-h and 24-h forecast results. As an example, the forecast for the River Rhine gauge at Cologne during the severe flood events of 1993 and 1995 are shown in Fig. 3 . The forecasts (for 6,
10000-
v - 0 > 8000- a, \
k a,
\ - t c
7000-
6000-
- Measurements - - Forecasts 6h - 24h 5000 I . " ' . ' . . . '
050 ~i h 0500 h 0500 h 0500 h 0500 h 16.12.1993 21.12.1993 26.12.1993 31.12.1993 05.01.1994 10.01.1994
- Measurements- - Forecasts 6h - 24h
0500 h 0500 h b','-
20.01.1995 25.01.1995 30.0 1.1995 04.02. I995 09.02.1995 14.02.1995
42
Fig. 3. Operational flood forecasts for River Rhine gauge at Cologne
0 J CIWEM, 2000, 14, F e b r u a r y
F l o o d F o r e c a s t i n g a n d Warn ing o n the River Rh ine
12, 18 and 24 h in advance) were computed by the statistical Wiener filter-model. Input data are 6-hourly changes of stage or discharge at 15 gauges within the catchment up to the gauge at Cologne. The changes of the previous three days are considered within the model, although no meteorological data are used.
The old city of Cologne is flooded if the water level exceeds 10 m at the gauge. In this case, the mobile flood- protection dam will be overtopped and severe damage will occur. Therefore it is important to have a precise water-level forecast, and these requirements could be fulfilled by the statistical Federal Institute of Hydrology model.
Table 2 shows the maximum water levels since 1970 at the Cologne gauge.
Table 2. Maximum water levels at Co/ogne oauging station since 1970
Flood event I Water level (m)
1995 1993 1983 1988 1970 1998
10.69 10.63 9.96 9.95 9.87 9.49
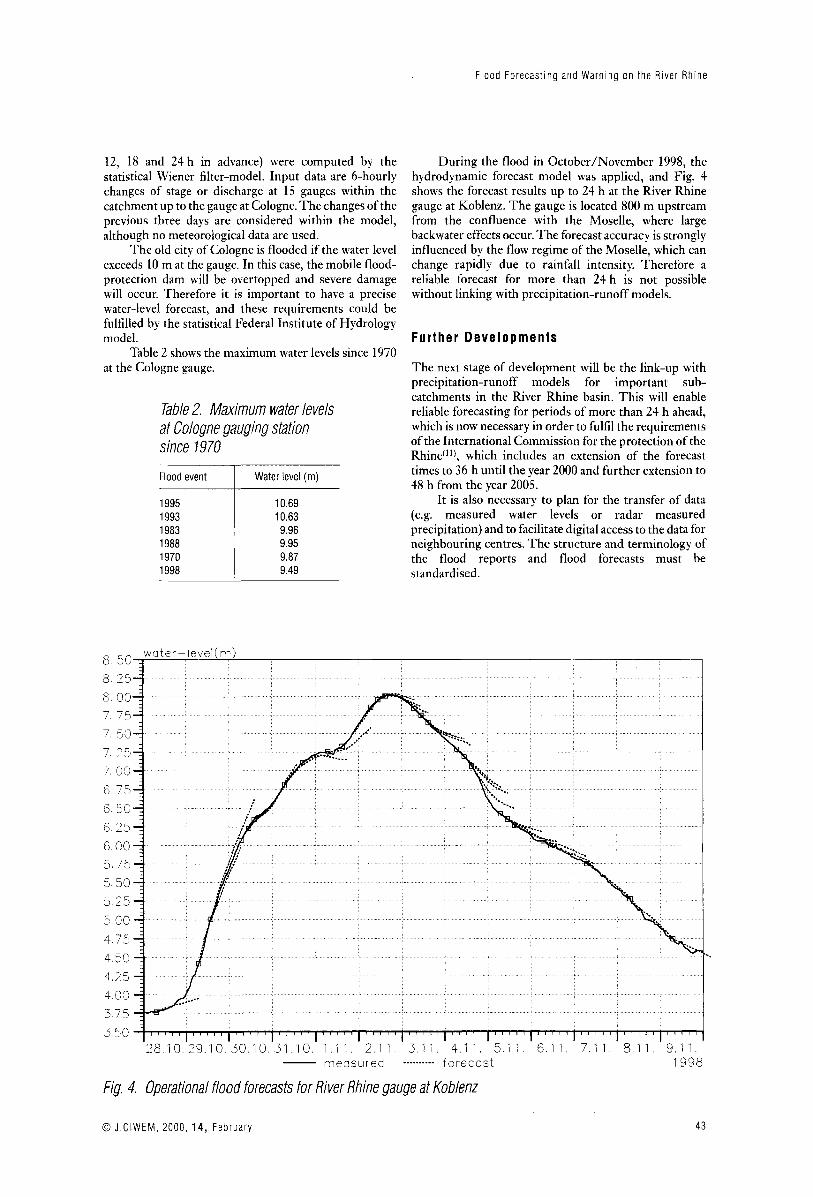
During the flood in October/November 1998, the hydrodynamic forecast model was applied, and Fig. 4 shows the forecast results up to 24 h at the River Rhine gauge at Koblenz. The gauge is located 800 m upstream from the confluence with the Moselle, where large backwater effects occur. The forecast accuracy is strongly influenced by the flow regime of the Moselle, which can change rapidly due to rainfall intensity. Therefore a reliable forecast for more than 24 h is not possible without linking with precipitation-runoff models.
Further Developments
The next stage of development will be the link-up with precipitation-runoff models for important sub- catchments in the River Rhine basin. This will enable reliable forecasting for periods of more than 24 h ahead, which is now necessary in order to fulfil the requirements of the International Commission for the protection of the Rhinec"), which includes an extension of the forecast times to 36 h until the year 2000 and further extension to 48 h from the year 2005.
It is also necessary to plan for the transfer of data (e.g. measured water levels or radar measured precipitation) and to facilitate digital access to the data for neighbouring centres. The structure and terminology of the flood reports and flood forecasts must be standardised.
Fig. 4. Operational flood forecasts for River Rhine gauge at Koblenz
0 J.CIWEM, 2000, 14, Februa ry 4 3
G. Steinebach and K. Wilke on
Conclusions
1. Hydrodynamic models for the most important river reaches, coupled with statistical models for the forecasting of input gauges, were found to give an accuracy comparable to those obtained by the Wiener filtering model which was used previously.
2. The new approach offers a greater flexibility with respect to further developments.
3. The application of these models, combined with a reliable prediction of precipitation, will provide an early flood warning.
Acknowledgements
The authors wish to thank Dr R. Busskamp and M r R. Mulders for arranging the maps.
R e f e r e n c e s
(1) DEUTSCHES IHP/OHP NATIONALKOMITEE. The River Rhine - Development and Management. lHf/OHf Berichte. Sonderheft 9, Koblenz. 1996.
(2) SCHAOLER, B. (ed.) Bestandsaufnahme der Meldesysteme und Vorschlage zur Verbesserung der Hochwasservorhersage im Rheingebiet, SchluO-bericht der IKSR Arbeitseinheit Melde- systeme/Hochwasservorhersage. Report-nr. 11-1 2 of the lnternationale Kommission fur die Hydrologie des Rheingebietes. 1997.
(3) Wilke, K. State-of-the-art in flood forecasting and future developments. In Proc. 1st Workshop. European Commission, EUR 18019EN. 1998. p177.
(4) HOMAGK, P. Structure of the flood-forecasting centre in Baden- Wurttemberg (HVZ) and possible improvements of flood forecasts by use of hydrometeorological data and products. In Proc. Workshop on Food Forecasting. Czech Hydrometeorological Institute, Prague. 1998. p l49 .
(5) WILKE, K. Operational short-term flood forecasts in the River Rhine basin. In Pl.A.N.C. Con[ on lnland Waterways and Flood Control. Brussels. 1995.
(6) WILKE, K. Kurzfristige Wasserstands- und AbfluOvorhersage am Rhein unter Anwendung ausgewahlter mathematischer Verfahren. Schriftenreihe, 65, DVWK, 1984.
(7) KRAHE, P. Water-level and discharge forecasts in the River Moselle basin on the basis of measured and forecasted meteorological data. In froc. of Workshop on Flood Forecasting. Czech Hydrometeorological Institute, Prague, 1998, 108.
(8) STEINEBACH, G. Using hydrodynamic models in forecast systems for large rivers. In froc. of Advances in Hydro-Science and Engineering, Vol. 3 , (K. P. Holz, W Bechteler, S. S. Y. Wang, M. Kawahara (eds).) Cottbus, 1998.
(9) HILOEN, M. AND STEINEBACH, G. ENO-discretizations in MOL- applications: some examples in river hydraulics. Appl. Numerical Mathematics, 1998, 28,293.
(10) STEINEBACH, G. Order-reduction of ROW-methodsfor DAEs and method of lines applications. Preprint-Nr. 1741. Fachbereich Mathematik, TH Darmstadt, 1995.
on Flood Defence, Koblenz, 1998. (1 1) INTERNATIONAL COMMISSION FOR THE PROTECTION OF THE RHINE. Action Plan
4 4 0 J CIWEM, 2000, 14, February


