A Training of Trainers Manual
Flash Flood Risk Management

Flash Flood Risk ManagementA Training of Trainers Manual
International Centre for Integrated Mountain Development, Kathmandu, 2011
Prepared byArun Bhakta ShresthaPrem Sagar ChapagainRajesh Thapa
Published byInternational Centre for Integrated Mountain Development GPO Box 3226, Kathmandu, Nepal
Copyright © 2011
International Centre for Integrated Mountain Development (ICIMOD)
All rights reserved. Published 2011
ISBN 978 92 9115 222 3 (printed)
978 92 9115 223 0 (electronic)
LCCN 2011-312016
Photos: Cover, p118, Sundar Rai; p6, Partha Das; p114, Arun B Shrestha
Printed and bound in Nepal by
Hill Side Press (P) Ltd., Kathmandu, Nepal
Production team
Isabella Bassignana-Khadka (Consultant editor)Andrea Perlis (Senior editor)Dharma R Maharjan (Layout and design)Asha Kaji Thaku (Editorial assistant)
Note
This publication may be reproduced in whole or in part and in any form for educational or non-profit purposes without special permission from the copyright holder, provided acknowledgement of the source is made. ICIMOD would appreciate receiving a copy of any publication that uses this publication as a source. No use of this publication may be made for resale or for any other commercial purpose whatsoever without prior permission in writing from ICIMOD.
The views and interpretations in this publication are those of the author(s). They are not attributable to ICIMOD and do not imply the expression of any opinion concerning the legal status of any country, territory, city or area of its authorities, or concerning the delimitation of its frontiers or boundaries, or the endorsement of any product.
This publication is available in electronic form at www.icimod.org/publications
Citation: Shrestha, AB; Chapagain, PS; Thapa, R (2011) Flash flood risk management – A training of trainers manual. Kathmandu: ICIMOD
Contents
Foreword ivAcknowledgements vAcronyms and Abbreviations vi
Introduction 1About This Manual 2How to Use This Manual 2Course Structure 3Materials for the Workshop 3Suggested Schedule 5
Day 1 7 Session 1: Introduction 8 Session 2: Flash Flood Hazards in the HKH Region 13 Session 3: Types, Causes, and Impacts of Flash Floods 20 Session 4: Flash Flood Hazard Analysis and Assessment 27
Day 2 31 Session 5: Vulnerability and Flash Flood Risk Assessment 32 Session 6: Local Knowledge on Disaster Management 36 Session 7: Community-Based Flash Flood Risk Management 45 Session 8: Gender Perspectives in Disaster Management 53 Session 9: Social Hazard Mapping and Risk Assessment 56
Day 3 63 Session 10: Non-Structural Measures for Flash Flood Risk Management 64 Session 11: Modelling Tools for Flash Flood Management 70 Session 12: Integrated Flash Flood and Watershed Management 74 Session 13: Hazard-Specific Flash Flood Management: Intense Rainfall Floods 81 Session 14: Hazard-Specific Flash Flood Management: Landslide Dam Outburst Floods 90
Day 4 103 Session 15: Country Presentations 104 Session 16: Hazard-Specific Flash Flood Management: Glacial Lake Outburst Floods 105
Days 5, 6, and 7 117 Field Trip 117
Day 8 119 Session 17: Legal and Institutional Issues of Integrated Flood Risk Management 120 Session 18: Flash Flood Management Cycle – Preparedness 128 Session 19: Flash Flood Management Cycle – Response and Recovery 135 Session 20: Overall Discussion 145 Session 21: Training Evaluation and Closing Session 146
References 148
Foreword
The Hindu Kush-Himalayan (HKH) region is a prominent physiographic feature of our planet. As the youngest mountain system in the world, it has unstable geological conditions and a steep topography, which, combined with frequent extreme weather conditions, makes the region prone to many different natural hazards from landslides, avalanches, and earthquakes, to massive snowfalls and flooding. Among these, flash floods are particularly challenging for communities.
Flash floods are severe flood events that occur with little warning. They can be triggered by intense rainfall, failure of natural or artificial dams, and outbursts of glacial lakes. The frequent occurrence of flash floods in the Hindu Kush-Himalayan region poses a severe threat to lives, livelihoods, and infrastructure, both in the mountains and downstream. Vulnerable groups such as the poor, women, children, the elderly, and people with disabilities are often the hardest hit. Flash floods tend to carry with them much higher amounts of debris than normal floods and as a result cause more damage to hydropower stations, roads, bridges, buildings, and other infrastructure.
Since its establishment in 1983, ICIMOD has explored different ways to reduce the risk of disasters from natural hazards and to reduce the physical and social vulnerability of the people in the region. Approaches have included training courses, hazard mapping, and vulnerability assessments in the region as well as fostering dialogue among stakeholders and developing materials for capacity building.
ICIMOD, in collaboration with various partners, has compiled and published resource materials on flash flood risk management in order to support capacity development and to support the training of planners and practitioners. These materials, after having been tested with various groups, have now been converted into this Training of Trainers Manual with the objective of disseminating the capacity to a larger number of practitioners. The present publication was produced as part of the project ‘Flash Flood Risk Reduction – Strengthening Capacity in the Hindu Kush-Himalayas’, supported by the United States Agency for International Development, Office for Foreign Disaster Assistance (USAID/OFDA). While this manual is a small step, we hope that it will contribute meaningfully towards reducing disaster risk and providing greater physical security for the people of this vulnerable region.
David Molden Director General, ICIMOD
Acknowledgements
This manual is an output of the project ‘Flash Flood Risk Reduction – Strengthening Capacity in the Hindu Kush-Himalayas’, which was supported by the United States Agency for International Development, Office for Foreign Disaster Assistance (USAID/OFDA).
We are grateful to several colleagues who have contributed to this manual and to all the resource persons who supported the Training of Trainers Workshop which was instrumental in improving it. Professor Narendra Raj Khanal of Tribhuvan University, Mr Sagar Ratna Bajracharya, and Mr Sundar Kumar Rai of ICIMOD provided important input to the workshop and helped in preparing the draft of the manual. Dr Wolfgang Eric Grabs and Dr Giacomo Teruggi of the World Meteorological Organization (WMO) contributed significantly to the workshop and supported us with resource material. Practical Action Nepal provided support on the field visit.
Sincere thanks go to Professor Hua Ouyang, ICIMOD’s Programme Manager for Integrated Water and Hazard Management, for seeing through the completion of the module and to all the staff of this programme who were supportive during the preparation of the manual. Our heartfelt thanks also go to the many other colleagues, both within and outside ICIMOD, who read the manuscript and provided valuable comments and suggestions.
Acronyms and Abbreviations
CFFRMC community flash flood risk management committee DTM digital terrain model DWIDP Department of Water Induced Disaster Prevention, NepalGIS geographic information system GLOF glacial lake outburst floodGWP Global Water Partnership HKH Hindu Kush-HimalayasICIMOD International Centre for Integrated Mountain DevelopmentIFM integrated flood managementIFFM integrated flash flood managementITCZ inter-tropical convergence zone IWRM integrated water resources management LDOF landslide dam outburst floodmasl meters above sea levelNGO Non-governmental organisationP3DM participatory three-dimensional modellingPGIS participatory GISPRA Participatory Rural AppraisalMWRS monitoring, warning, and response system USACE/HEC United States Army Corps of Engineers’ Hydrologic Engineering Center UNISDR United Nations International Strategy for Disaster ReductionWMO World Meteorological Organization
11
Introduction
Flash floods are one of the most common forms of natural disaster in the Hindu Kush-Himalayan (HKH) region. They consist of sudden and very strong surges of water (usually along a riverbed or gully) and can carry rocks, soil, and other debris. The physical environment of the HKH is conducive to flash floods since these are the youngest mountains on earth and are still tectonically active. Since this area is undergoing uplift, it is characterised by steep slopes and a high rate of surface erosion. In addition to the geological conditions, intense seasonal precipitation in the central and eastern Himalayas (particularly during the summer monsoon season) and in the western Himalayas and the Hindu Kush (particularly during winter precipitation) triggers various types of natural hazards. Floods are one of the most common forms of natural disaster in this region. Intense monsoon rainfall or cloudbursts can cause devastating flash floods in the middle mountains (500–3,500 masl), and rapid melting of snow accumulated during winter is the main cause of flash floods in the Hindu Kush and western Himalayas. Furthermore, the region is experiencing widespread deglaciation, likely due to climate change, which has caused the formation and rapid growth of many glacial lakes. These lakes can burst their boundaries as a result of internal instabilities or external triggers in a process known as a glacial lake outburst flood (GLOF), which can cause immense flooding downstream. Landslides due to intense rainfall, in combination with geological instabilities and earthquakes, can cause the ephemeral damming of rivers. The outbreak of lakes created by such damming is another type of flash flood common in the region.
Hundreds of lives and billions of dollars worth of property and high-cost infrastructure are lost and much scarce agricultural land is destroyed every year in the region owing to landslides, debris flows, and floods. In the last decade of the twentieth century, floods killed about 100,000 persons and overall affected about 1.4 billion people worldwide; moreover, there is every indication that the number of events (and deaths) is increasing (Jonkman 2005). Statistics show that the number of people killed per event is significantly higher in Asia than elsewhere, and that not only are flash floods responsible for the greatest number of deaths among all water-induced disasters (Jonkman 2005), but in addition mortality rates for flash flood events are significantly higher than for riverine floods.
Despite the destructive nature and immense impact they have on the socioeconomy of the region, flash floods have not received adequate attention and the HKH regional capacity to manage this risk is low. This lack of capacity can be attributed to poor understanding of the processes and a lack of knowledge on what measures can be used. This manual was developed to address this need and to help develop regional capacity to manage the risk of flash floods. It contains a training curriculum and the resource materials needed to deliver a basic training in flash flood risk management. The manual has been prepared to help different stakeholders (government staff, non-governmental organisations and other civil society groups, lawyers, academics, and media people) understand the basics of flash floods and the full range of flood and risk management measures for an integrated approach to flash floods, including the importance of community participation, legal and institutional aspects, the latest social hazard mapping techniques, and an introduction to the various modelling tools. The overall objective of the training is to enable participants to effectively help communities and nations to be better prepared for flash floods using the implements that are available. The aim is to develop a pool of people who are able to serve as knowledge multipliers in the region.
In using the manual, it must be remembered that training needs are subject to the specific context in which the training is being conducted. Since national policies and legislation can and do differ among countries, the trainer should try to place the training in the context of the particular situation at hand, including country-specific policies and legal provisions.
2
Flash Flood Risk Management – A Training of Trainers Manual
2
About This ManualThis manual was designed to help build the capacity of trainers in the field of flash flood risk management. It is largely based on ICIMOD's Resource Manual on Flash Flood Risk Management, Module 1 (Shrestha et al. 2008) and Module 2 (Shrestha 2008). The manual was tested during the ‘Integrated Approach to Flash Floods and Flood Risk Management in the Hindu Kush-Himalayan Region’ Training of Trainers Workshop which was organised by ICIMOD from 25 October to 2 November 2010 in Kathmandu, and revisions were incorporated.
The manual was prepared assuming that the participants have a basic knowledge and understanding of flash flood risk assessment and management. Building on this basic knowledge the manual aims to provide: � a better understanding of the types, causes, and impacts of flash floods; � a better understanding of flash flood hazards, vulnerability, risk assessment, and management methods; � an appreciation of the role that local knowledge and gender perspectives can play in flash flood risk
management; � an introduction to social hazard mapping techniques, and valuing the process of community participation; � an understanding of the full range of flood and risk management measures for specific types of flash floods; � an assessment of the legal and institutional aspects of flood and disaster management; � an introduction to the various modelling tools that are available; � an understanding of the full range of concepts and methods for an integrated approach to flash flood risk
management; � an in-depth understanding of the flash flood risk management cycle; � the necessary tools and materials that will enable the trainers to replicate this course in their own work
areas.
How to Use This ManualThis Training of Trainers Manual uses an adult learning method for the presentation of materials. Participant-centred learning has been kept in mind in designing the sessions and activities and in the training process. The authors envisage that a 'facilitator' will oversee the entire training session and that each session will be taught by one or more 'trainers' who can, in turn, call upon specific experts for the technical sessions and resource persons who either have some specific expertise or who can help with local arrangements for the field visits, if and when required. The facilitator intervenes at the end of activities to conduct the discussion and other training-related matters. For effective learning, the participants are requested to engage fully in the sessions and to be active and open.
Presentations, case studies, discussions, and question and answer sessions are used to enhance learning in each session. Suggestions are given to help the trainer lead the training effectively. For effective teaching the participants need to be actively involved and the facilitators need to allot time for motivating them. It is suggested that participatory teaching and learning methods be used as much as possible in each session, but for highly technical subjects it may be necessary to rely primarily on a presentation format. Sufficient time is allotted for each session so that the participants are engaged in both learning and sharing. The authors have designed a total of 21 sessions to take place over five days, but the number of days can be modified based on the needs of the participants and the context. In addition, a three-day field trip is recommended to provide the participants with hands-on learning about various aspects of field methods and techniques. In total, it is proposed that the training can be completed in eight days.
Experience shows that the maximum number of participants that can be accommodated is around 30. With more participants it is difficult to ensure the interaction and participation of all.
The training process is outlined at the beginning of each session. Resource materials are included at the end of each session, so the manual can also be used as a resource manual. The sessions are structured as follows.
33
Introduction
Session Title: Introduces the main content of the session
Time: Rough guide of the minimum time needed for the session and the exercises
Objectives: Broad objectives and areas to be covered, followed by a point-wise list of specific focus areas, issues to be discussed, and skills to be imparted
Suggested method: The methods and techniques appropriate to the activities for the session are left to the discretion of the presenter who can choose to do a verbal presentation, use a media tool such as PowerPoint, or come up with his/her own innovative methodology to present case studies and exercises. When a specific method, such as group work, is warranted, it is signalled at the beginning of the session; otherwise it is assumed that the normal classroom situation applies.
Materials required: The resource materials needed are given at the end of each session. These activity-wise resource materials will make it easier to understand each activity and can also be valuable for future reference. The numbering follows the numbering of the activities; for instance, RM 7.1 refers to the resource materials for Activity 7.1 of Session 7.
Note to the trainer: Additional instructions or supporting material on methodology, process, and themes to be discussed are given in the text as needed.
Activities: The activities and exercises
Course StructureThe session themes for each day are listed on the first page of the sections for each day. The suggested outline is as follows.
Day 1: Introduction, flash flood hazards in the HKH region; types, causes and impacts; hazard analysis and assessmentDay 2: Vulnerability and flash flood risk assessment, local knowledge on disaster management, community-based flash flood risk management, gender perspective in disaster management, social hazard mapping and risk assessmentDay 3: Non-structural measures for flash flood risk management, integrated flash flood and watershed management, hazard-specific flash flood management for intense rainfall floods and landslide dam outburst floodsDay 4: Country presentations, flash flood management for glacial lake outburst floods, briefing on the field tripDays 5, 6, and 7: Field tripDay 8: Legal and institutional issues of integrated flood risk management, flash flood management cycle (preparedness, response and recovery), and overall discussion
The curriculum and schedule for the training are provided at the start of the manual. The manual has been designed so that learning during training sessions can be incorporated when the manual is updated and revised. It is hoped that trainers will be able to conduct the training easily with the help of the manual, and that participants in the training sessions will be able to act as multiplier agents by training others.
Materials for the Workshop Ensure that the materials required for the workshop are ready before the training begins. Some materials may need to be procured in advance. Planning will help save time and overcome confusion. The following materials are required for the workshop: � a bag for each participant containing a pen, writing pad, and any relevant documents and materials, to
be distributed during registration; � laptop, overhead projector, extension cords, and any other associated equipment, depending on the
training venue and the trainer’s chosen methodology;
4
Flash Flood Risk Management – A Training of Trainers Manual
4
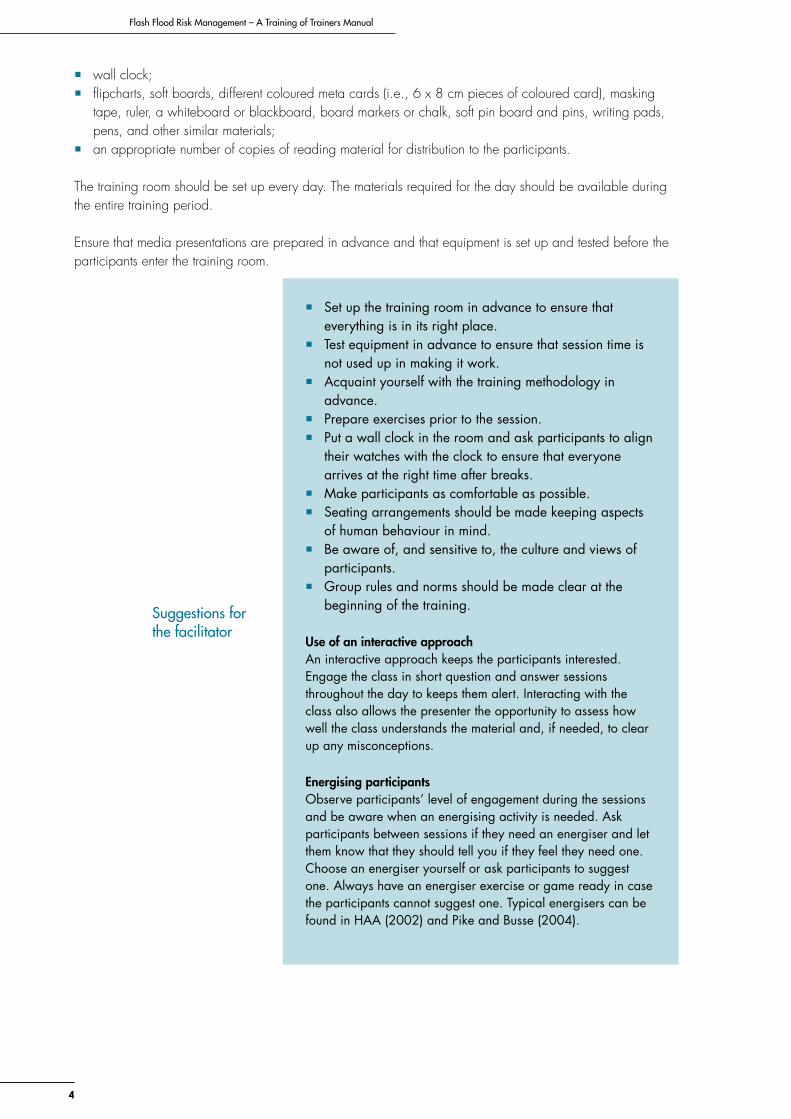
� Set up the training room in advance to ensure that everything is in its right place.
� Test equipment in advance to ensure that session time is not used up in making it work.
� Acquaint yourself with the training methodology in advance.
� Prepare exercises prior to the session. � Put a wall clock in the room and ask participants to align
their watches with the clock to ensure that everyone arrives at the right time after breaks.
� Make participants as comfortable as possible. � Seating arrangements should be made keeping aspects
of human behaviour in mind. � Be aware of, and sensitive to, the culture and views of
participants. � Group rules and norms should be made clear at the
beginning of the training.
Use of an interactive approachAn interactive approach keeps the participants interested. Engage the class in short question and answer sessions throughout the day to keeps them alert. Interacting with the class also allows the presenter the opportunity to assess how well the class understands the material and, if needed, to clear up any misconceptions.
Energising participantsObserve participants’ level of engagement during the sessions and be aware when an energising activity is needed. Ask participants between sessions if they need an energiser and let them know that they should tell you if they feel they need one. Choose an energiser yourself or ask participants to suggest one. Always have an energiser exercise or game ready in case the participants cannot suggest one. Typical energisers can be found in HAA (2002) and Pike and Busse (2004).
� wall clock; � flipcharts, soft boards, different coloured meta cards (i.e., 6 x 8 cm pieces of coloured card), masking
tape, ruler, a whiteboard or blackboard, board markers or chalk, soft pin board and pins, writing pads, pens, and other similar materials;
� an appropriate number of copies of reading material for distribution to the participants.
The training room should be set up every day. The materials required for the day should be available during the entire training period.
Ensure that media presentations are prepared in advance and that equipment is set up and tested before the participants enter the training room.
Suggestions for the facilitator
55
Introduction
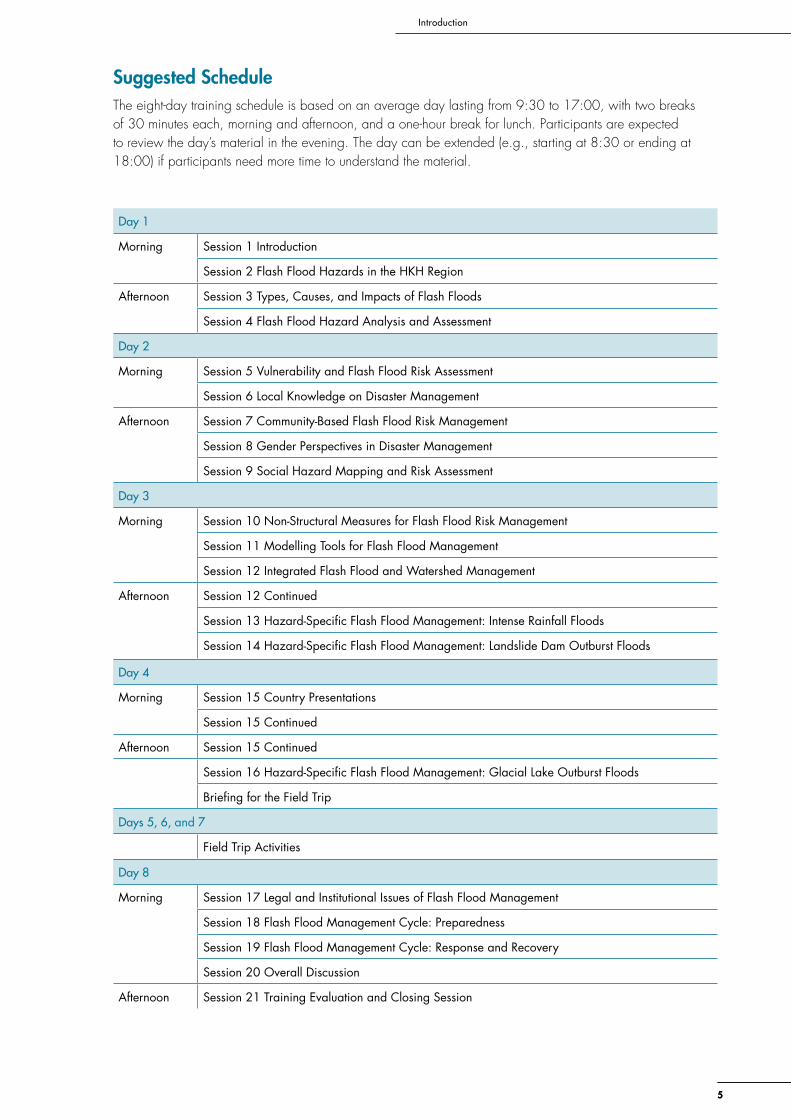
Suggested ScheduleThe eight-day training schedule is based on an average day lasting from 9:30 to 17:00, with two breaks of 30 minutes each, morning and afternoon, and a one-hour break for lunch. Participants are expected to review the day’s material in the evening. The day can be extended (e.g., starting at 8:30 or ending at 18:00) if participants need more time to understand the material.
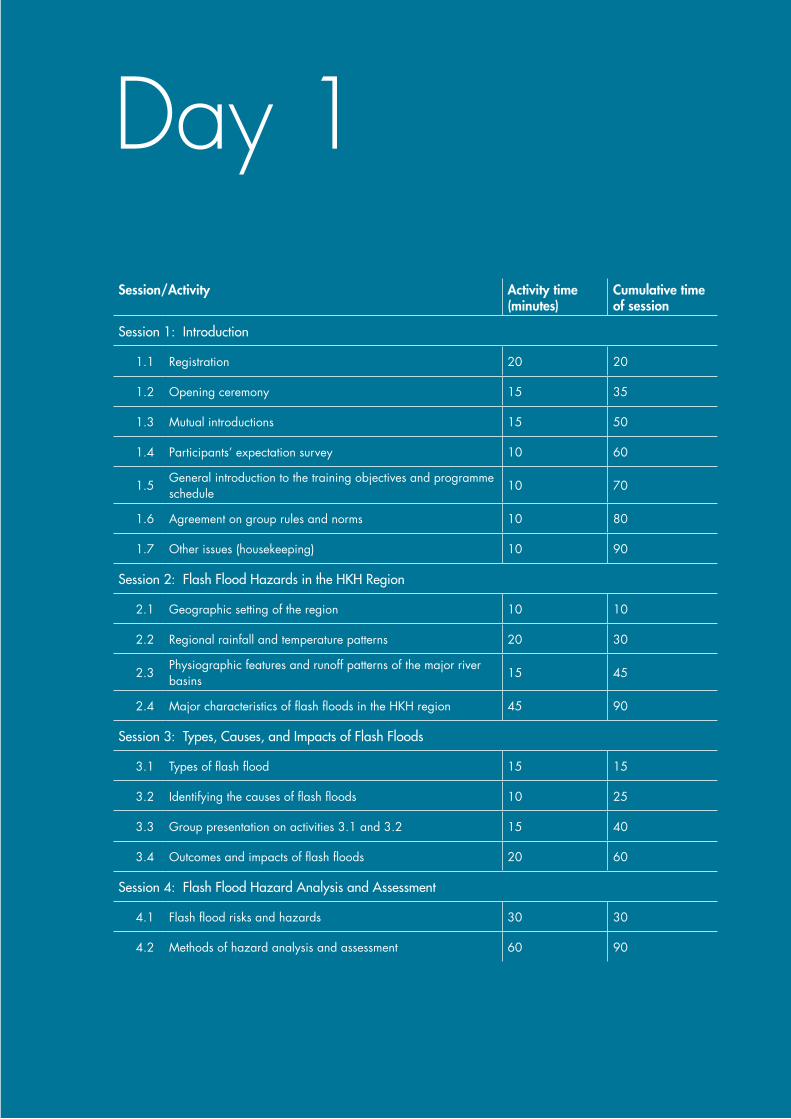
Day 1
Morning Session 1 Introduction
Session 2 Flash Flood Hazards in the HKH Region
Afternoon Session 3 Types, Causes, and Impacts of Flash Floods
Session 4 Flash Flood Hazard Analysis and Assessment
Day 2
Morning Session 5 Vulnerability and Flash Flood Risk Assessment
Session 6 Local Knowledge on Disaster Management
Afternoon Session 7 Community-Based Flash Flood Risk Management
Session 8 Gender Perspectives in Disaster Management
Session 9 Social Hazard Mapping and Risk Assessment
Day 3
Morning Session 10 Non-Structural Measures for Flash Flood Risk Management
Session 11 Modelling Tools for Flash Flood Management
Session 12 Integrated Flash Flood and Watershed Management
Afternoon Session 12 Continued
Session 13 Hazard-Specific Flash Flood Management: Intense Rainfall Floods
Session 14 Hazard-Specific Flash Flood Management: Landslide Dam Outburst Floods
Day 4
Morning Session 15 Country Presentations
Session 15 Continued
Afternoon Session 15 Continued
Session 16 Hazard-Specific Flash Flood Management: Glacial Lake Outburst Floods
Briefing for the Field Trip
Days 5, 6, and 7
Field Trip Activities
Day 8
Morning Session 17 Legal and Institutional Issues of Flash Flood Management
Session 18 Flash Flood Management Cycle: Preparedness
Session 19 Flash Flood Management Cycle: Response and Recovery
Session 20 Overall Discussion
Afternoon Session 21 Training Evaluation and Closing Session
77
Introduction
Day 1Session/Activity Activity time
(minutes)Cumulative time of session
Session 1: Introduction
1.1 Registration 20 20
1.2 Opening ceremony 15 35
1.3 Mutual introductions 15 50
1.4 Participants’ expectation survey 10 60
1.5General introduction to the training objectives and programme schedule
10 70
1.6 Agreement on group rules and norms 10 80
1.7 Other issues (housekeeping) 10 90
Session 2: Flash Flood Hazards in the HKH Region
2.1 Geographic setting of the region 10 10
2.2 Regional rainfall and temperature patterns 20 30
2.3Physiographic features and runoff patterns of the major river basins
15 45
2.4 Major characteristics of flash floods in the HKH region 45 90
Session 3: Types, Causes, and Impacts of Flash Floods
3.1 Types of flash flood 15 15
3.2 Identifying the causes of flash floods 10 25
3.3 Group presentation on activities 3.1 and 3.2 15 40
3.4 Outcomes and impacts of flash floods 20 60
Session 4: Flash Flood Hazard Analysis and Assessment
4.1 Flash flood risks and hazards 30 30
4.2 Methods of hazard analysis and assessment 60 90
8
Flash Flood Risk Management – A Training of Trainers Manual
88
SESS
IoN
1
8
Flash Flood Risk Management – A Training of Trainers Manual
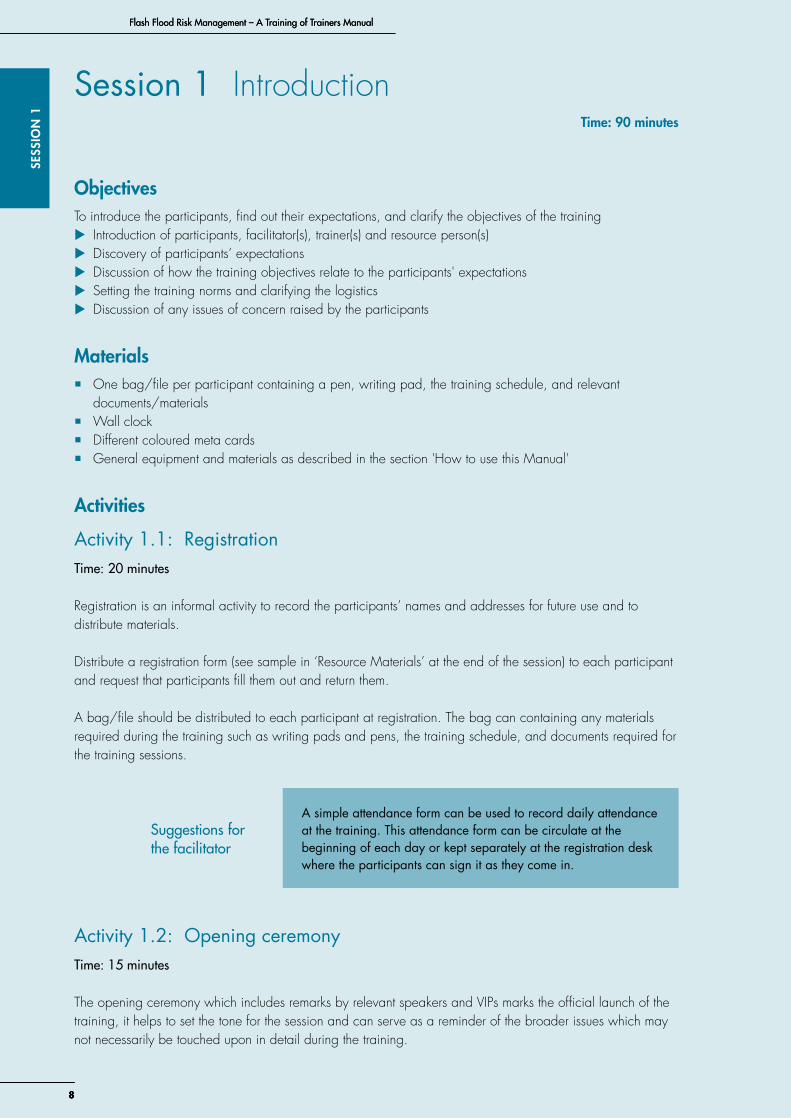
Session 1 IntroductionTime: 90 minutes
objectivesTo introduce the participants, find out their expectations, and clarify the objectives of the training
X Introduction of participants, facilitator(s), trainer(s) and resource person(s) X Discovery of participants’ expectations X Discussion of how the training objectives relate to the participants' expectations X Setting the training norms and clarifying the logistics X Discussion of any issues of concern raised by the participants
Materials � One bag/file per participant containing a pen, writing pad, the training schedule, and relevant
documents/materials � Wall clock � Different coloured meta cards � General equipment and materials as described in the section 'How to use this Manual'
Activities
Activity 1.1: RegistrationTime: 20 minutes
Registration is an informal activity to record the participants’ names and addresses for future use and to distribute materials.
Distribute a registration form (see sample in ‘Resource Materials’ at the end of the session) to each participant and request that participants fill them out and return them.
A bag/file should be distributed to each participant at registration. The bag can containing any materials required during the training such as writing pads and pens, the training schedule, and documents required for the training sessions.
Activity 1.2: Opening ceremonyTime: 15 minutes
The opening ceremony which includes remarks by relevant speakers and VIPs marks the official launch of the training, it helps to set the tone for the session and can serve as a reminder of the broader issues which may not necessarily be touched upon in detail during the training.
A simple attendance form can be used to record daily attendance at the training. This attendance form can be circulate at the beginning of each day or kept separately at the registration desk where the participants can sign it as they come in.
Suggestions for the facilitator
99
Day 1
9
SESSIoN
1
9
Day 1
Activity 1.3: Mutual introductionsTime: 15 minutes
The facilitator asks participants, trainer(s) and resource person(s) to introduce themselves by stating their name, the country that they are working in, the organisation that they are affiliated with, and by giving a brief account of their expertise.
Activity 1.4: Participants’ expectation surveyTime: 10 minutes
The aim of the survey is to give the facilitator a better idea of the participants' expectations so that the course content can be fine-tuned to accommodate their needs (if possible).
Step 1 Distribute a blank meta card to each participant. Ask the participants to write down their expectations from the training on the meta card provided.
Step 2 Collect the completed meta cards. The facilitator goes through the meta cards and compiles a summary list of the expectations. The facilitator then communicates the participants expectations’ to the programme coordinator and to the resource persons so they can address the relevant issues in their sessions.
Prepare a programme for the opening ceremony. Remember to be mindful of the protocol for the different speakers and VIPs. When inviting the speakers, acquaint them with the purpose of the training and inform them of how long they are requested to speak.
Suggestions for the facilitator
Introducing participants, trainer(s), and resource person(s) at the start of the training helps to create an environment of ease among all present. Make the introductions fun by using an icebreaker, which serves the dual purpose of making the session interesting and discovering the background of the participants. There are many possible icebreakers (e.g., West 1999).
Suggestions for the facilitator
It is strongly recommended that the facilitator go through the meta cards to compile the list and become acquainted with the participants’ expectations from the training; the facilitator should then consider how to accommodate any need for changes to the content of the training.
Suggestions for the facilitator

10
Flash Flood Risk Management – A Training of Trainers Manual
1010
SESS
IoN
1
10
Flash Flood Risk Management – A Training of Trainers Manual
Activity 1.5: General introduction to the training objectives and programme schedule Time: 10 minutes
The facilitator makes a presentation: � Outlining the training objectives � Introducing the main topics/themes � Relating the expectations of the participants (as per their feedback on the meta cards) to the topics that will
be covered in the training programme. � Introducing the programme schedule
Activity 1.6: Agreement on group rules and normsTime: 10 minutes
The facilitator discusses the rules and norms to be observed to ensure a good atmosphere for the training and inquires whether these are acceptable to the participants as is, or whether they need to be modified. The facilitator writes down the points raised on a flip chart or white board. These can be summarised on one sheet of paper and display on the wall throughout the training. Some typical ideas that might be included are listed below. � Raise hand to ask a question � One speaker at a time � Respect for gender and culture. Do not use gender, racial, religious, or culturally sensitive words, or
language. � Respect starting and ending times � Attend the sessions on time � Inform when absent � Switch off mobiles phones during the session � Deal with things that disturb participants first. No question or observation is weird � Responsible for your own learning � Responsible for your ‘yes’ and ‘no’ � Keep cases realistic
Call attention to the programme schedule and briefly explain the content of the training and the way it is distributed over the days. When presenting the training objectives, make sure to correlate these with the expectations expressed by the participants. The comparison should give the participants an idea of the extent to which they already have a comprehensive, strategic overview of flood risk management and whether or not they have expectations outside the scope of the training. If some expectations are not covered in the objectives, make this clear. If the expectation is relevant but not explicitly covered, explain that it can be either discussed in private with the trainer or, if it is of general interest to this particular class, it can be discussed during a related session.
Suggestions for the facilitator
1111
Day 1
11
SESSIoN
1
11
Day 1
Activity 1.7: Other issues (housekeeping) Time: 10 minutes
It is wise to keep aside some time to discuss any other issues that may need attention during the training. These issues may or may not be related to the technical aspects of the training. Letting participants know that any issues that are important to them will be looked after is reassuring and is a way of making participants feel comfortable and engaged. The facilitator may ask about time schedules, logistics, or any other issue. If a participant raises an issue, the facilitator should seek a solution by discussing with the group. The important thing is to assure participants that their needs will be taken into consideration. Items that may be of concern to the participants can include, for example: � Resource materials and data � Information regarding transportation from the place of residence to the training venue � Places for phone communication, internet access, etc. � Nearby market places for general shopping � Traffic and security regulations � Emergency contact person(s) and contact details
After this discussion, the facilitator can continue with the next technical session.
Use the parking lot – find time to answer all questionsDuring any given presentation the participants may raise issues that are relevant in the context of the session but which it is not possible to address or clarified at the moment due to time or resource constraints. Such issues can be ‘parked’ by writing them on the chart paper provided for this purpose. The ‘parking lot’ chart paper is displayed by the presenter’s desk or in another convenient location. The trainer can then discuss these topics either one-on-one with the individual or with a group by arranging a mutually agreed time either during lunchtime or tea break or at the end of the day.
Suggestions for the facilitator
12
Flash Flood Risk Management – A Training of Trainers Manual
1212
SESS
IoN
1
Session 1 Resource Materials
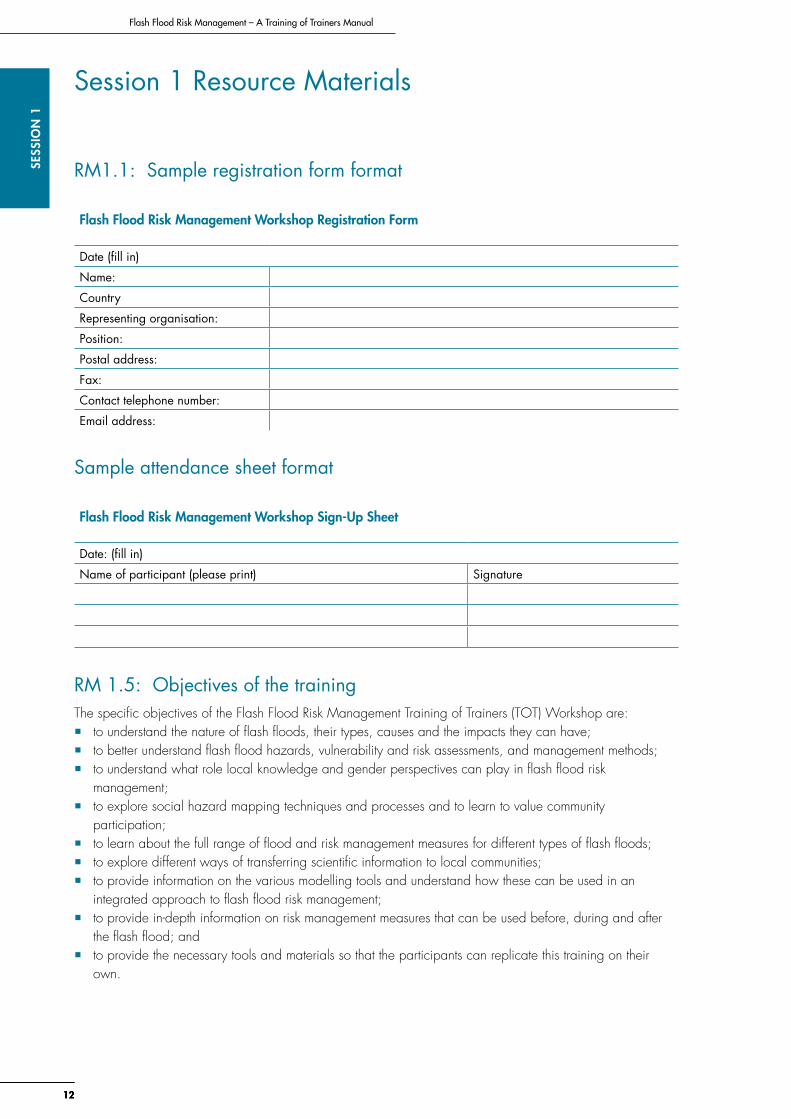
RM1.1: Sample registration form format
Flash Flood Risk Management Workshop Registration Form
Date (fill in)
Name:
Country
Representing organisation:
Position:
Postal address:
Fax:
Contact telephone number:
Email address:
Sample attendance sheet format
Flash Flood Risk Management Workshop Sign-Up Sheet
Date: (fill in)
Name of participant (please print) Signature
RM 1.5: Objectives of the trainingThe specific objectives of the Flash Flood Risk Management Training of Trainers (TOT) Workshop are: � to understand the nature of flash floods, their types, causes and the impacts they can have; � to better understand flash flood hazards, vulnerability and risk assessments, and management methods; � to understand what role local knowledge and gender perspectives can play in flash flood risk
management; � to explore social hazard mapping techniques and processes and to learn to value community
participation; � to learn about the full range of flood and risk management measures for different types of flash floods; � to explore different ways of transferring scientific information to local communities; � to provide information on the various modelling tools and understand how these can be used in an
integrated approach to flash flood risk management; � to provide in-depth information on risk management measures that can be used before, during and after
the flash flood; and � to provide the necessary tools and materials so that the participants can replicate this training on their
own.
13
Day 1SESSIo
N 2
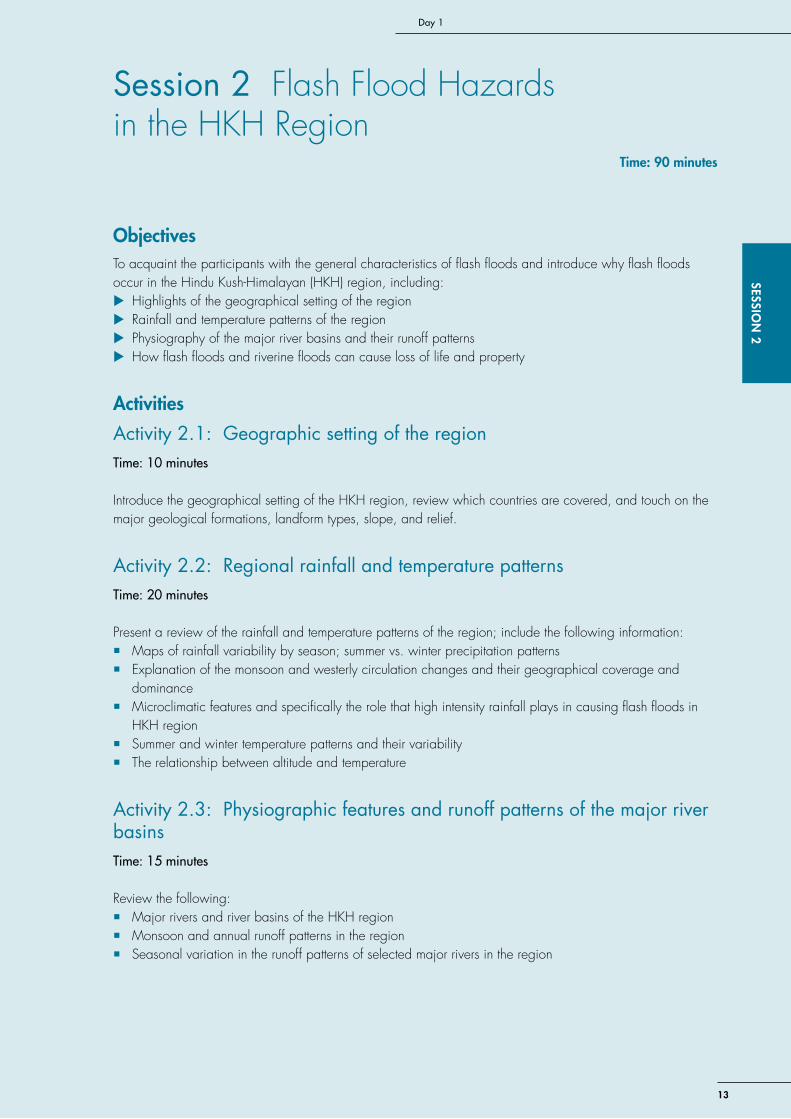
Session 2 Flash Flood Hazards in the HKH Region
Time: 90 minutes
objectivesTo acquaint the participants with the general characteristics of flash floods and introduce why flash floods occur in the Hindu Kush-Himalayan (HKH) region, including:
X Highlights of the geographical setting of the region X Rainfall and temperature patterns of the region X Physiography of the major river basins and their runoff patterns X How flash floods and riverine floods can cause loss of life and property
Activities
Activity 2.1: Geographic setting of the regionTime: 10 minutes
Introduce the geographical setting of the HKH region, review which countries are covered, and touch on the major geological formations, landform types, slope, and relief.
Activity 2.2: Regional rainfall and temperature patterns Time: 20 minutes
Present a review of the rainfall and temperature patterns of the region; include the following information: � Maps of rainfall variability by season; summer vs. winter precipitation patterns � Explanation of the monsoon and westerly circulation changes and their geographical coverage and
dominance � Microclimatic features and specifically the role that high intensity rainfall plays in causing flash floods in
HKH region � Summer and winter temperature patterns and their variability � The relationship between altitude and temperature
Activity 2.3: Physiographic features and runoff patterns of the major river basinsTime: 15 minutes
Review the following: � Major rivers and river basins of the HKH region � Monsoon and annual runoff patterns in the region � Seasonal variation in the runoff patterns of selected major rivers in the region
14
SESS
IoN
2Flash Flood Risk Management – A Training of Trainers Manual
14
Flash Flood Risk Management – A Training of Trainers Manual
Activity 2.4: Major characteristics of flash floods in the HKH region Time: 45 minutes
Step 1 Introduce the following:
� Major flood events in the region and loss of life and property � The difference between flash floods and riverine floods
Open up a discussion on the difference between flash floods and riverine floods. Present the major differences between the two types of floods and compare the extent of losses that can be caused by each type.
Step 2 Present a short video on flash floods. Possible examples can include the extreme weather events of 1993, and/or the Bagmati flood or Koshi Flood that took place in Nepal in 2008. Discuss the nature of the flood and discuss the extent of the damage that it caused in terms of the loss of life and property.
15
Day 1SESSIo
N 2
Session 2 Resource Materials
RM 2.1: Geographical setting of the regionThe HKH region extends 3,500 km in length and covers all or part of eight countries, namely, Afghanistan, Bangladesh, Bhutan, China, India, Myanmar, Nepal, and Pakistan. The region encompasses some of the highest mountain chains in the world and the world›s two highest mountain peaks, Mt. Everest (8,850 m, Nepal) and K2 (8,611 m, Pakistan).
The mountain chains of the HKH region are the youngest on earth and are still tectonically active. They are still undergoing uplift and consequently the region is characterised by steep slopes and a high rate of surface erosion. These ranges contain rock series from all the major geologic periods. The central Himalayan zone has predominantly crystalline and metamorphic rocks which date from the Tertiary Period (which started before 65 million years ago and ended 1.6 million years ago) whereas the Eastern Himalayas have more examples of Archaean basement gneiss which date to more than 2.5 billion years ago. The lower ranges, along the southern flank of the Himalayas, consist of a complex set of younger Tertiary sedimentary deposits including riverine deposits left behind by rivers originating in the Himalayas.
RM 2.2: Rainfall and temperature in the HKHThe climate in the Himalayas, as in the other parts of South Asia, is dominated by the Monsoon. The summer monsoon originates in the Bay of Bengal and the amount of monsoon precipitation it deposits decreases from east to west. The Monsoon season is much longer in the Eastern Himalayas (e.g., Assam), where it lasts for five months (June-October), than in the central Himalayas (Sikkim, Nepal, and Kumaon) where it lasts for four months (June-September). In the Western Himalayas (e.g., Kashmir) the Monsoon lasts for only two months (July-August) (Chalise and Khanal 2001); however, this area also receives significant precipitation from winter westerlies. Winter precipitation is greater in the western parts of the region and less in the eastern parts. Summer precipitation is greater on the windward side of the Himalayas owing to the orographic effect and the leeward side receives less rain. Annual precipitation decreases from southeast to northwest: from about 800 mm at Markam and Songpan in western Sichuan to 400-500 mm at Lhasa, 200-300 mm at Tingri, and less than 100 mm at Ngari Prefecture (Mei’e et al. 1985).
Temperatures in the HKH vary inversely with elevation at the rate of about 0.6°C per 100 m but, due to the rugged terrain, temperatures vary widely over short distances. Local temperatures also vary according to season, aspect, and slope (Zurick et al. 2006). Owing to the thin atmosphere above the Tibetan Plateau and ample and intense radiation, the surface temperature has a large diurnal variation, although its annual temperature range is relatively small. The diurnal variation of temperatures in the northern mountainous region of Pakistan and Afghanistan is also considerable, and the annual temperature range is large. In Chitral (1450 masl), for example, in the course of a year temperatures can climb to as high as 42°C and can plunge to as low as -14.8°C (Shamshad 1988).
High-intensity rainfall is a characteristic microclimatic feature of the region (Domroes 1979). Such high-intensity rainfall has important implications for the flash floods known as intense rainfall floods (IRFs) which are common throughout the HKH.
The Western Himalayas, Karakoram and Hindu Kush can receive large amounts of snow during the winter. This precipitation is caused by westerly disturbances from the Mediterranean. These intense snowfalls can affect livelihoods not only by causing avalanches, which often block transport routes, but also by causing flash floods when rapid snowmelt is triggered by fast warming in the spring.
16
SESS
IoN
2Flash Flood Risk Management – A Training of Trainers Manual
16
Flash Flood Risk Management – A Training of Trainers Manual
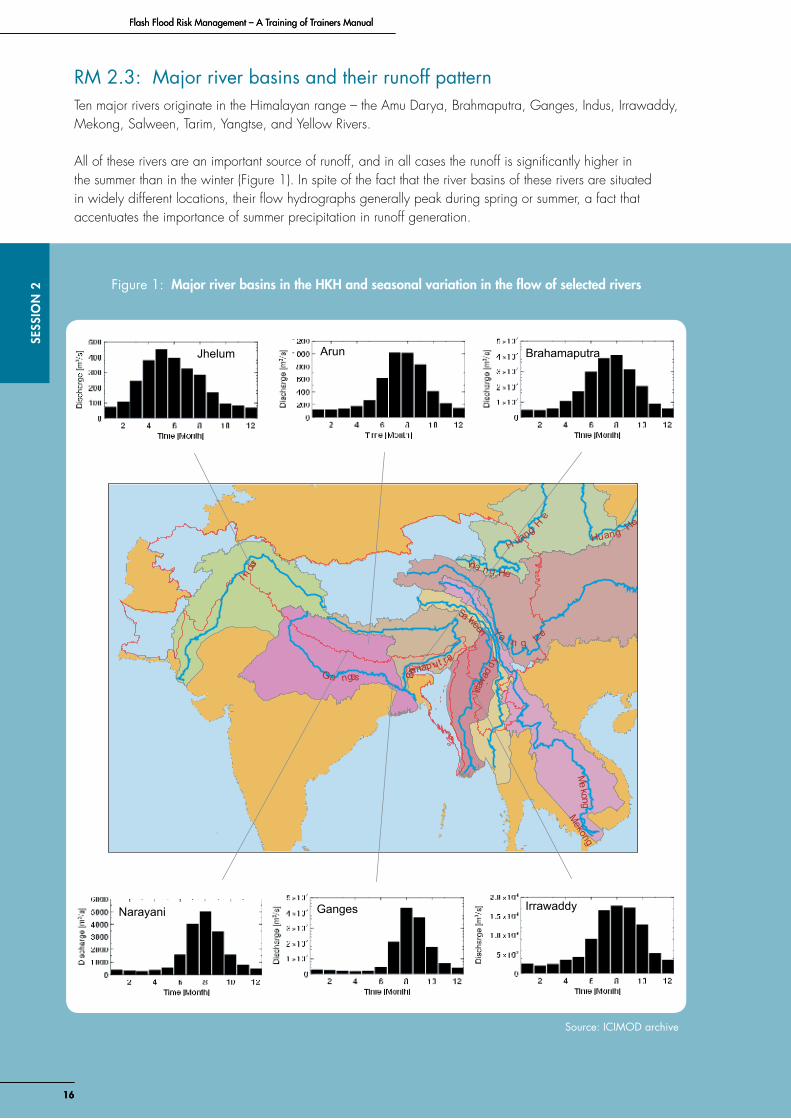
RM 2.3: Major river basins and their runoff patternTen major rivers originate in the Himalayan range – the Amu Darya, Brahmaputra, Ganges, Indus, Irrawaddy, Mekong, Salween, Tarim, Yangtse, and Yellow Rivers.
All of these rivers are an important source of runoff, and in all cases the runoff is significantly higher in the summer than in the winter (Figure 1). In spite of the fact that the river basins of these rivers are situated in widely different locations, their flow hydrographs generally peak during spring or summer, a fact that accentuates the importance of summer precipitation in runoff generation.
Mekong
I ndus
Yan g tze
Sa lween
Ga nges
Irrawa
d dy
Brahmap ut ra
H uang He
Huang He
Mekong
Hua n g He
IrrawaddyNarayani
ArunJhelum Brahamaputra
Ganges
Figure 1: Major river basins in the HKH and seasonal variation in the flow of selected rivers
Source: ICIMOD archive
17
Day 1SESSIo
N 2
17
Day 1
Box 1: Characteristics of flash floods
� Sudden and rapid events that travel like waves � Sudden onset – little or no lead time � Can occur at any time of the year � Floods are localised � No distinct flood path � Flood waters travel at high speed � Flood waters contain a high debris load
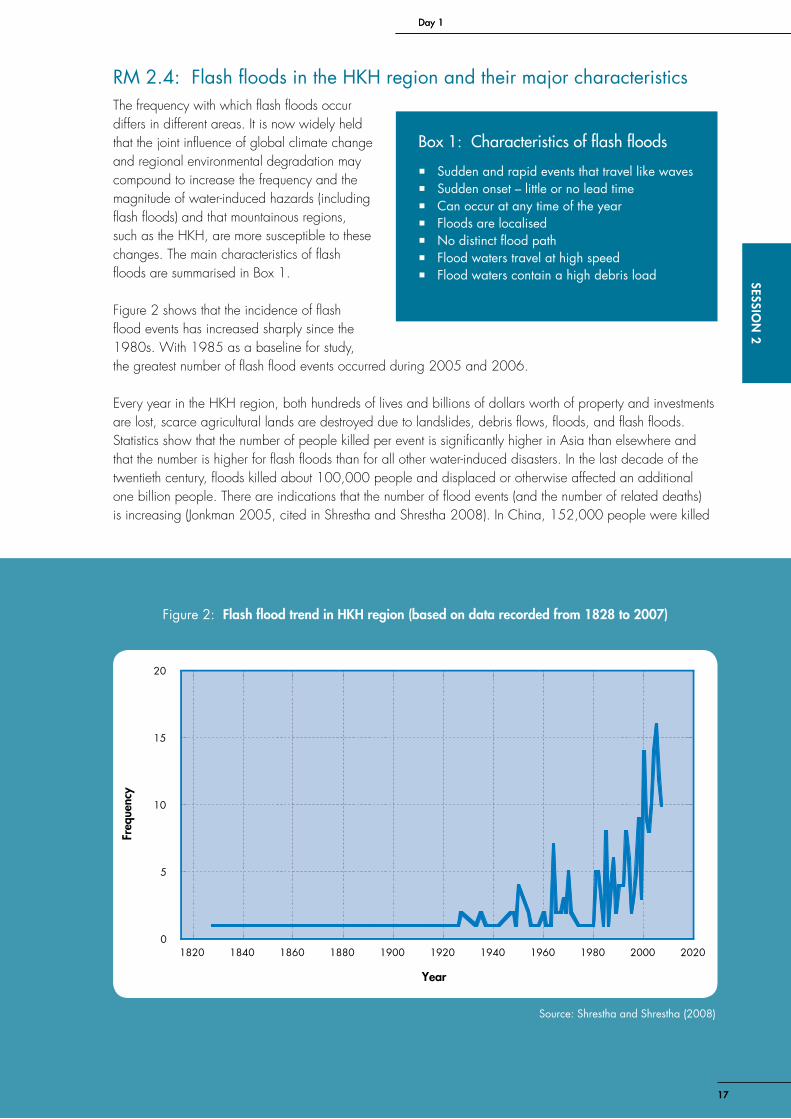
RM 2.4: Flash floods in the HKH region and their major characteristicsThe frequency with which flash floods occur differs in different areas. It is now widely held that the joint influence of global climate change and regional environmental degradation may compound to increase the frequency and the magnitude of water-induced hazards (including flash floods) and that mountainous regions, such as the HKH, are more susceptible to these changes. The main characteristics of flash floods are summarised in Box 1.
Figure 2 shows that the incidence of flash flood events has increased sharply since the 1980s. With 1985 as a baseline for study, the greatest number of flash flood events occurred during 2005 and 2006.
Every year in the HKH region, both hundreds of lives and billions of dollars worth of property and investments are lost, scarce agricultural lands are destroyed due to landslides, debris flows, floods, and flash floods. Statistics show that the number of people killed per event is significantly higher in Asia than elsewhere and that the number is higher for flash floods than for all other water-induced disasters. In the last decade of the twentieth century, floods killed about 100,000 people and displaced or otherwise affected an additional one billion people. There are indications that the number of flood events (and the number of related deaths) is increasing (Jonkman 2005, cited in Shrestha and Shrestha 2008). In China, 152,000 people were killed
Figure 2: Flash flood trend in HKH region (based on data recorded from 1828 to 2007)
0
5
10
15
20
1820 1840 1860 1880 1900 1920 1940 1960 1980 2000 2020
Freq
uency
Year
Source: Shrestha and Shrestha (2008)
18
SESS
IoN
2Flash Flood Risk Management – A Training of Trainers Manual
18
Flash Flood Risk Management – A Training of Trainers Manual
0
50
100
150
200
0
500
1,000
1,500
2,000
2,500
3,000
3,500
4,000
Africa Americas Asia Europe Oceania
Killed Affected
Pers
ons
Affected (thousands)
Flood
Landslide/avalanche
Famine
Water related epidemic
Drought
0
50
100
150
200
0
0.5
1
1.5
2
2.5
3
3.5
4
Riverine flood Flash flood Other
Killed Mortality (%)
Pers
ons
Mortality (%
)
a.
b.
c.
Table 1: Flash floods and riverine floods
Flash floods Riverine floods
Features Rapid water level rise above natural channelsReaches peak flow within minutes up to a few hoursRapid recession (within minutes to few hours)Often dissipate quicklyNot necessarily related to base flow levelsShort lag times
Slow water level rise beyond natural channelsReaches peak flow within days to weeksSlow recession (within days to weeks)Mostly coinciding with high base flow levelsMedium to long lag times
Causes Very high intensity rainstorms/ cloudburstsRapid snow/glacial melt due to rapid increase in temperatureDam (both artificial and natural) breaks
Prolonged seasonal precipitation of low to high intensitySeasonal snow and glacial melt
Associated problems
Often carry high sediment and debris loadsVery high hydraulic force and erosive power
Inundation
Frequency Occasionally, any time during the year Annually during rainy season
Affected areas River plains and valleysAlluvial fansMostly local extentGenerally small to medium areas are affected
River plains and valleysLocal to regional extentLarge areas can be affected
Predictability Very difficult to forecast With appropriate technology and measures in place, forecasting is easily possible
Potential mitigation measures
Early warning systemsCommunity preparedness and awarenessAppropriate emergency measures
Real-time flood forecastingCommunity preparedness and awarenessAppropriate emergency measures
Source: Xu et al. (2006)
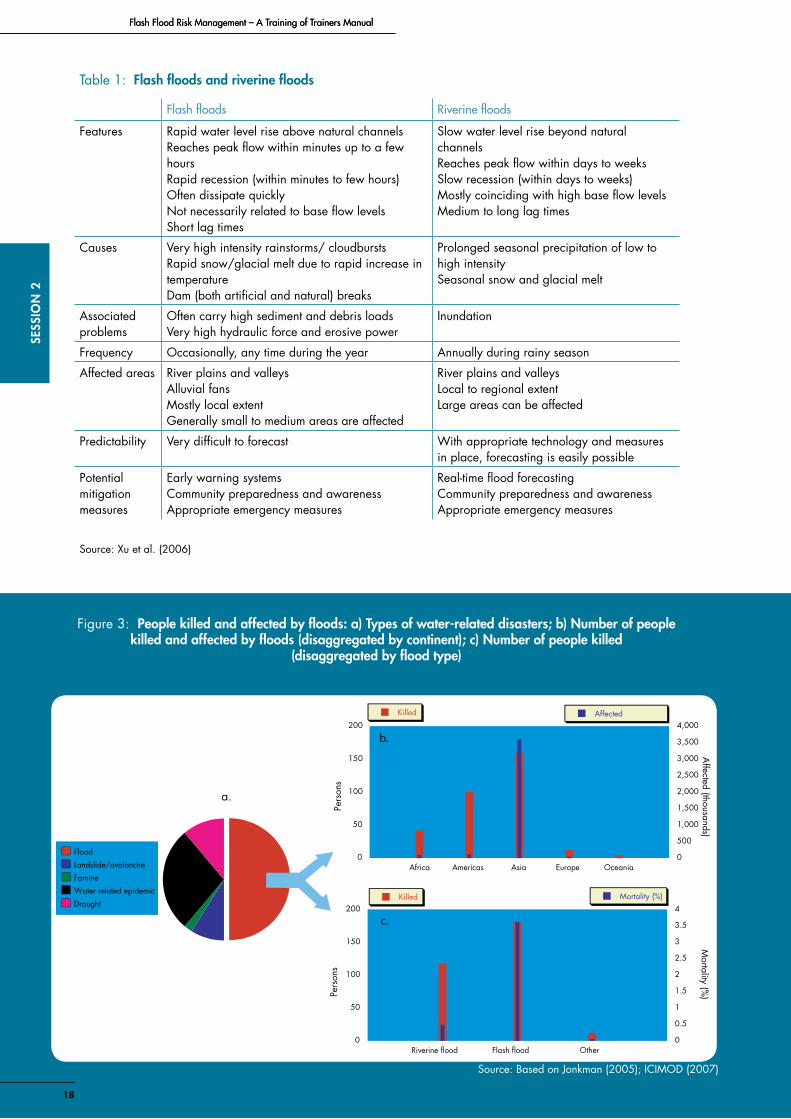
Figure 3: People killed and affected by floods: a) Types of water-related disasters; b) Number of people killed and affected by floods (disaggregated by continent); c) Number of people killed
(disaggregated by flood type)
Source: Based on Jonkman (2005); ICIMOD (2007)

19
Day 1SESSIo
N 2
in flash floods during the period from 1950 to 1990, and accounted for about 67% of the total number of flood related deaths during the same period (Zhuo and Wan 2005, cited in Shrestha and Shrestha 2008). In Nepal, landslides, floods, and avalanches are annually responsible for about 300 deaths and the destruction of important infrastructure of estimated worth US$ 9 million (DWIDP 2005, cited in Shrestha and Shrestha 2008).
Flash floods and riverine floods differ in many respects (see Table 1). The numbers of people killed or otherwise affected is higher for flash floods than for riverine floods (Figure 3) (Jonkman 2005). The region’s flash floods occur predominantly in the mountainous parts of South Asia, such as the greater Himalayan range, the Hindu Kush, the Karakorum, the Tien Shan, the Kun Lun, and the Pamir.
20
SESS
IoN
3Flash Flood Risk Management – A Training of Trainers Manual
Session 3 Types, Causes, and Impacts of Flash Floods
Time: 60 minutes
objectives To understand the types, causes and impacts of flash floods, including:
X The different types of flash floods X Identifying the causes of flash floods X Understanding the impacts that flash floods can have from different perspectives
Methodology This session uses group work to stimulate involvement and discussion. The participants are divided into groups where they discuss the assigned topic and record their findings. At the end of the allotted time each group shares their findings and the whole class participates in a group discussion.
Activities
Activity 3.1: Types of flash floodTime: 15 minutes
Step 1 Depending on the number of participants, divide the class into 3-5 groups, each having 3-6 participants.
Step 2 Distribute Handout 3.1 to each group.
Step 3 Ask the groups to discuss the types of flash floods that can occur in the region and ask them to list the different types on Handout 3.1.
Step 4 When the participants have had a chance to complete their handouts, engage them in a short question and answer session. Add to the participants’ understanding and correct common misconceptions. To make the definitions more vivid, show pictures of the various types of floods. It is important to intervene at this point because the groups need to have a clear understanding of the different types of flash floods before they go on the next activity which is about the causes.
The interactive format of this session provides the trainer with an opportunity to find out how much the class knows about flash floods. It is therefore necessary to encourage everyone to actively participate in the discussion.
Note to the trainer
21
Day 1SESSIo
N 3
Activity 3.2: Identifying the causes of flash floodsTime: 10 minutes
Step 1 Similar to Activity 3.1; this time, ask the groups to discuss the probable causes of flash floods.
Step 2 Continue with Handout 3.1, ask the groups to list the causes for each type of flash flood identified in the previous exercise.
Activity 3.3: Group presentation on Activities 3.1 and 3.2Time: 15 minutes
Step 1 Ask each group to select a person to present the group’s findings on the types and causes of flash floods.
Step 2 Comments on the similarities and differences in the list of ‘causes’ that each group presents. Uses this as a starting point to present the major causes of flash floods.
Step 3 Ask the groups to return the completed Handout 3.1. Review the returned handouts and mark the missing types of flash floods and their causes as compared to the list found in the resource materials. Use this feedback to gauge the participants’ grasp of the subject matter. Make sure to notice if there are any new types and causes mentioned by the participants.
Activity 3.4: Outcomes and impacts of flash floodsTime: 20 minutes
Step 1 Continue with the same groups as were formed for Activity 3.2. Distribute Handout 3.4 to each group. Ask the participants to discuss the possible impacts of flash floods.
Step 2 Ask each group first to list the possible impacts of flash floods and then to complete the table by considering what type of impact each can have.
Step 3 Make sure that the participants are able to analyse the impacts from different perspectives. Discuss the types of impacts and review responses given in Handout 3.4.
The group exercise on the categorisation of flash flood impacts helps participants to understand the impacts from different perspectives. Guide the discussion by first highlighting what the impacts can be and then discuss each from different perspectives. For example, work through the example of a bridge damaged during a flash flood. In this case the physical loss of the structure is immediately evident and its effect on the transportation system is also quickly apparent. The loss of a bridge severely affects everyday life and disturbs the normal mobility pattern. Eventually, its devastating effects on the regional economy also become apparent. The economic consequences can be equally incapacitating. These can include, for example, impacts on tourism and travel through the area as alternative routes need to be taken. The point to emphasise is that impacts can be viewed from different perspectives e.g., physical, economic, and social. Discuss how the impacts can be quantified.
Note to the trainer
22
SESS
IoN
3Flash Flood Risk Management – A Training of Trainers Manual
Session 3 Handouts
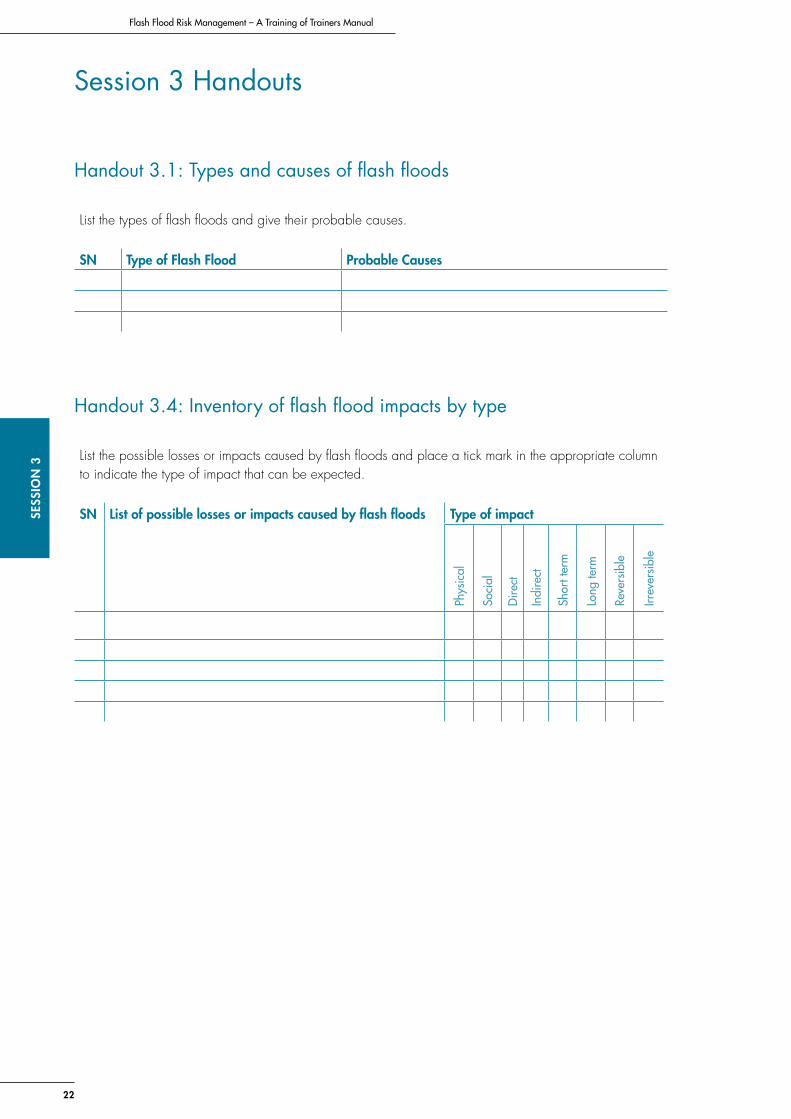
Handout 3.1: Types and causes of flash floods
List the types of flash floods and give their probable causes.
SN Type of Flash Flood Probable Causes
Handout 3.4: Inventory of flash flood impacts by type
List the possible losses or impacts caused by flash floods and place a tick mark in the appropriate column to indicate the type of impact that can be expected.
SN List of possible losses or impacts caused by flash floods Type of impact
Phys
ical
Soci
al
Dire
ct
Indi
rect
Shor
t ter
m
Long
term
Reve
rsib
le
Irrev
ersi
ble
23
Day 1SESSIo
N 3
Session 3 Resource Materials
RM 3.1: Types and causes of flash floodsBased on the underlying processes causing flash floods, they can be categorised into three main types: intense rainfall floods, landslide dam outburst floods, and glacial lake outburst floods. In addition, flash floods can also be caused by bursting of artificial structures such as dams.
The causes of flash floods can be broadly classified into two main groups; these are either meteorological (intense precipitation) or geo-environmental.
Intense rainfall flash floods
Intense rainfall is the most common cause of flash flooding in the HKH region. It is associated with three meteorological phenomena: cloudbursts, stationary monsoon troughs, and monsoon depressions.
Cloudbursts. A cloudburst is an extreme form of precipitation, sometimes with hail and thunder, which normally lasts no longer than a few minutes but is capable of creating flood conditions. Cloudbursts occur when air masses are heated intensely and rise rapidly to form thunderclouds. When these clouds interact with the local topography, they often move upwards, especially if the atmospheric flow is perpendicular to the topographic features. Intense precipitation typically involves some connection to monsoon air masses, which originate in the tropics and are typically warm and heavily laden with moisture (Kelsch et al. 2001). A lack of wind aloft prevents the dissipation of thunderclouds and facilitates concentrated cloudbursts which typically deposit precipitation in a small localised area.
Monsoon trough. Intense rainfall can also be caused by the prolonged stationary positioning of an inter-tropical convergence zone (ITCZ), commonly called a monsoon trough. An ITCZ is an elongated zone or low pressure system which typically sits along the mountain range. This type of meteorological phenomenon was responsible for record precipitation in the upper region of the Mahabharat Range in the central part of Nepal on 19-20 July 1993. On 20 July, Tistung station measured a rainfall of 540 mm in 24 hours, and the gauge recorded a maximum rainfall of 70 mm in one hour (Shrestha 2008).
Monsoon depressions. Intense monsoon depressions seldom reach the mountain areas during the monsoon season. They are occasionally caused by strong westerly waves over northern Kashmir, which cause heavy to very heavy rainfall in the lower Kashmir and Jammu Valley, resulting in devastating flash floods. Westerly waves moving across Kashmir and the northern parts of Pakistan can strengthen the monsoon depression. In July 2005, this type of a depression moved into Punjab and Kashmir and caused heavy rainfall in the upper catchment of the Chenab River (Shrestha 2008). Since the mountain catchments are very steep, the river flooded quickly.
Geo-environmental causes of flash floods
Geo-environmental factors can also precipitate flash flooding. The main geo-environmental factors to causes flash floods are the outburst of a landslide dam and the outburst of a glacial lake.
Outburst of landslide dams. The HKH region is prone to recurrent and often devastating landslides because the mountain slopes of the HKH are both steep and unstable. Excessive precipitation and earthquakes can cause the slopes to landslide. The landslides and debris flow can form temporary dams across river courses, impounding immense volumes of water. A landslide dam outburst flood (LDOF) can occur when these makeshift dams are overtopped or water breaks through.
24
SESS
IoN
3Flash Flood Risk Management – A Training of Trainers Manual
As the reservoir level rises (due to river flow or otherwise) and overtops the dam crest the dam can suddenly erode and outburst. The dam can also be overtopped when a secondary landslide falls into the reservoir. Alternatively, since landslide dams are only makeshift, their own internal instabilities can trigger an outbreak even without overtopping. Landslide dam outburst floods scrape out riverbeds and banks causing heavy damage to the riparian areas and huge sedimentation in downstream areas.
In general, high landslide dams form in steep, narrow, valleys because this is where landslide debris gathers (Costa and Schuster 1988). Commonly, large landslide dams are caused by complex landslides that start as slumps or slides and become rock or debris avalanches. Volcanic eruptions can also cause the formation of dams, but there are no such examples in the HKH region. Other mechanisms that can contribute to the formation of landslide dams are stream under-cutting and entrenchment.
Outburst of glacial lakes. Glacial lakes form as glaciers recede, and their formation is directly related to climate variability. When glaciers recede they leave behind large voids that are filled with melt-water; these are moraine-dammed glacial lakes. Moraine dams are structurally weak and unstable; they undergo constant changes due to slope failures, slumping, and other such effects. When a moraine dam fails catastrophically the result is a glacial lake outburst flood (GLOF).
Glacial lake outbursts are a main cause of flash floods in the HKH. Glacial lakes can burst due to internal instabilities in the natural moraine dam triggered by hydrostatic pressure, erosion, overtopping, or other internal structural failure. Glacial lakes can also burst due to external triggers such as rock or ice avalanches, earthquakes, and the like. A GLOF can result in the discharge of water and debris whose flow is several orders of magnitude greater than seasonal high flow. Bhutan, China, Nepal, and Pakistan have suffered a number of GLOFs in the past (Ives et al. 2010).
Avalanches and earthquakes can also trigger GLOF events depending on the severity, magnitude, location, and other characteristics. Moraine dams can also collapse without the aid of an external trigger, such as when the dam slopes fail or when there is excessive seepage from the natural drainage network of the dam.
Outbreak of artificial structures. The failure of artificial structures can also cause tremendous flash floods. As more and more river basins in the HKH are being exploited by people, flash floods due to the failure of human-made hydraulic structures will likely increase. Flash floods can occur when there is the uncoordinated operation of a hydraulic structure. Moreover, when settlements are constructed on natural flood plains and water is re-channelled it can lead to conditions that can cause flash floods. Other causes of flash flooding are urban infrastructure development and deforestation (due to increasing urbanisation in mountain areas), and failure to maintain drainage systems.
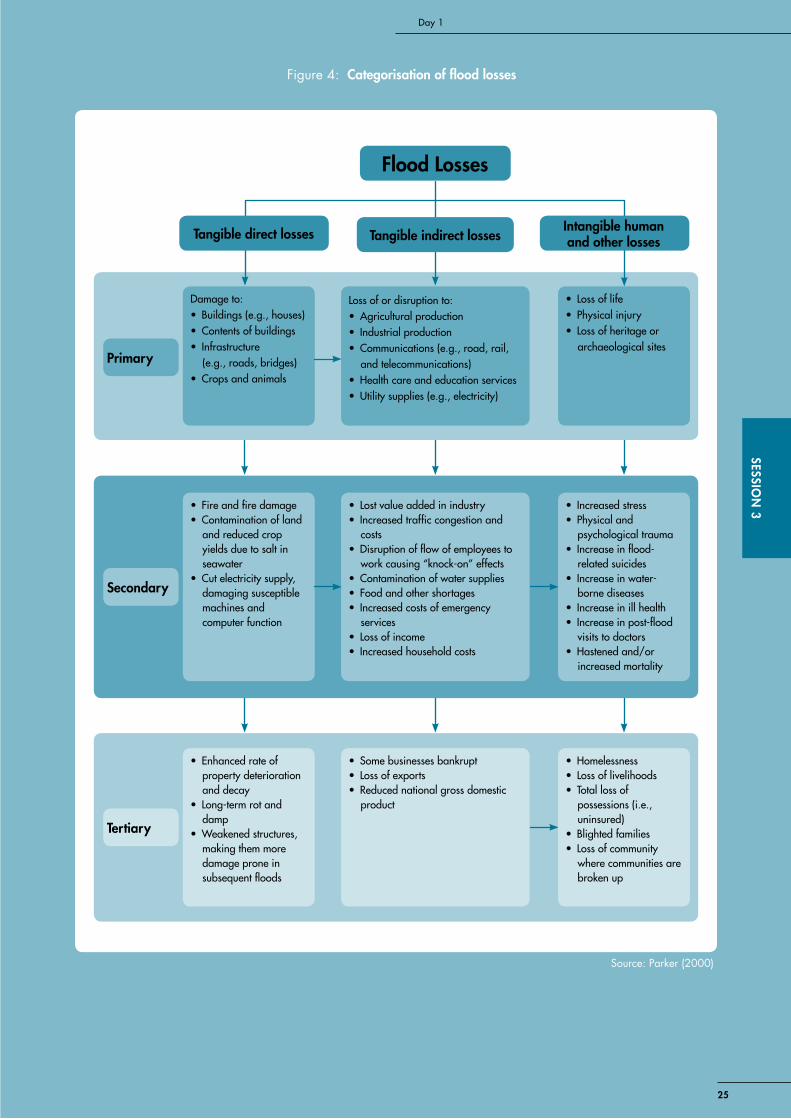
RM 3.2: Outcomes and impacts of flash floodsFlash flood waters flow at high speed and carry large amounts of debris. These debris laden waters can cause the loss of life and can sweep away critical infrastructure that is the lifeline of mountain communities. Some of the destruction which is caused by flash floods is immediately apparent while some subtly undermines existing structures and the true damage is not seen until some later time. Some of the destruction is short term while some has long term detrimental effects on the environment and the socio-economic life of communities. Typical flood losses are given in Figure 4.
Socioeconomic
Landslides and debris flows can have major socioeconomic impacts and can affect people, their homes, possessions, industrial establishments, and lifelines such as highways, railways, and communication systems. The indirect effects of flash floods are also many and can encompass aspects as diverse as reducing real estate values, causing the loss of industrial, agricultural, and forest productivity; and causing the loss of tourist revenues by damaging land or facilities or by interrupting transportation systems.
25
Day 1SESSIo
N 3
Figure 4: Categorisation of flood losses
Damage to:• Buildings(e.g.,houses)• Contentsofbuildings• Infrastructure
(e.g.,roads,bridges)• Cropsandanimals
• Fireandfiredamage• Contaminationofland
and reduced crop yields due to salt in seawater
• Cutelectricitysupply,damaging susceptible machines and computer function
• Enhancedrateofproperty deterioration and decay
• Long-termrotanddamp
•Weakenedstructures,making them more damage prone in subsequent floods
Loss of or disruption to:• Agriculturalproduction• Industrialproduction• Communications(e.g.,road,rail,
andtelecommunications)• Healthcareandeducationservices• Utilitysupplies(e.g.,electricity)
• Lostvalueaddedinindustry• Increasedtrafficcongestionand
costs• Disruptionofflowofemployeesto
workcausing“knock-on”effects• Contaminationofwatersupplies• Foodandothershortages• Increasedcostsofemergency
services• Lossofincome• Increasedhouseholdcosts
• Somebusinessesbankrupt• Lossofexports• Reducednationalgrossdomestic
product
• Lossoflife• Physicalinjury• Lossofheritageor
archaeological sites
• Increasedstress• Physicaland
psychological trauma• Increaseinflood-
related suicides• Increaseinwater-
borne diseases• Increaseinillhealth• Increaseinpost-flood
visits to doctors• Hastenedand/or
increased mortality
• Homelessness• Lossoflivelihoods• Totallossof
possessions(i.e.,uninsured)
• Blightedfamilies• Lossofcommunity
where communities are broken up
Primary
Secondary
Flood Losses
Tertiary
Intangible human and other lossesTangible indirect lossesTangible direct losses
Source: Parker (2000)

26
SESS
IoN
3Flash Flood Risk Management – A Training of Trainers Manual
Environmental
Flash floods in the HKH take a great toll on the natural environment. Mudflows can cover terraced lands with boulders and debris and can damage standing crops laying waste to agricultural fields. In the foothills and plains of the river valleys, floods often deposit coarse sediment, which not only damages valuable crops but also renders the land infertile. Floods cause severe bank erosion and the loss of soil. Debris flows aggrade river beds, divert flows, and can cause riverine floods. When rivers change their course, the environmental setting is altered.
27
Day 1SESSIo
N 4
Session 4 Flash Flood Hazard Analysis and Assessment
Time: 90 minutes
objectivesTo understand flash flood hazards and to be able to understand:
X The concepts of risk and hazard X The methods of hazard analysis and assessment
Activities
Activity 4.1: Flash flood risks and hazards Time: 30 minutes
Step 1 Engage the participants in a short interactive question and answerer session; ask the class how the concepts of risk and hazard apply to flash floods.
Step 2 Clarify the concepts and introduce the source-pathway-receptor-consequence conceptual model of risk.
Step 3 Present the major steps involved in flash flood risk assessment and explain what information it is necessary to obtain from primary and secondary sources. Clarify that hydrological, meteorological, land use, and geographical information can be collected from secondary sources but that socio-economic and geo-morphological data need to be collected from the field. Emphasise that field verification is important for all data.
Before beginning the next activity take a moment to put things into perspective. Explain that risk assessment is the most essential part of the flash flood risk management process. Clarify that analysis and assessment of hazard and vulnerability are the prerequisites for risk assessment and that the following activity and the following session are leading up to this.The analysis leading up to risk assessment is a multi-step process, where the steps are: � The collection of essential information on the flood prone
area as needed; and can include geographical, geological, hydrometeorological, land-use, and land-cover data as well as historical information on past flood events
� The actual hazard analysis and assessment � The vulnerability assessment � The risk assessment
Note to the trainer
28
SESS
IoN
4Flash Flood Risk Management – A Training of Trainers Manual
Activity 4.2: Methods of hazard analysis and assessment Time: 60 minutes
Step 1 Review the fact that analysis of hazard is based on information collected from different sources as discussed in Activity 4.1.
Step 2 Discuss the various methods of flash flood hazard analysis. Give a presentation that lists the methods and gives their major characteristics. Emphasise that a combination of social (community-based) and technical methods gives the best results.
Step 3 Clarify the concept of hazard intensity and hazard probability level and discuss how they are determined. Discuss how probability levels are assigned both to flash flood that are cause by intense rainfall and to flash floods that are caused by other means.
Step 4 Present the hazard-level scale and explain how it is determined.
29
Day 1SESSIo
N 4
Session 4 Resource Materials
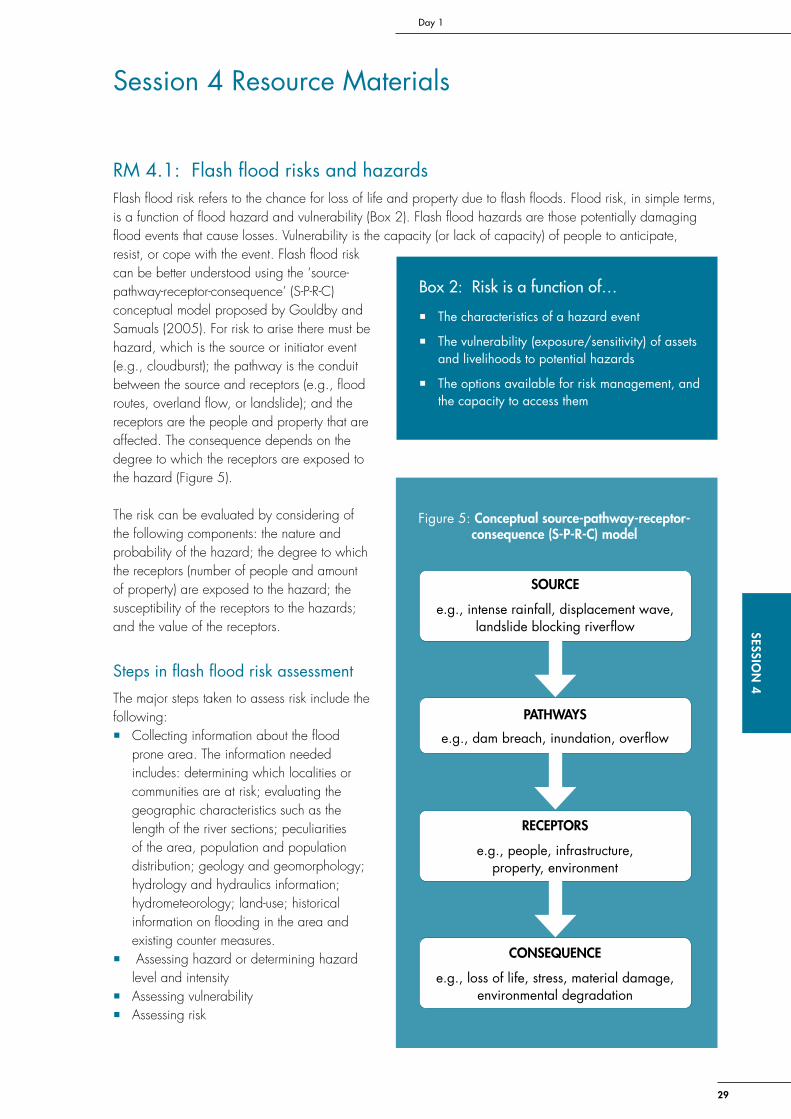
RM 4.1: Flash flood risks and hazardsFlash flood risk refers to the chance for loss of life and property due to flash floods. Flood risk, in simple terms, is a function of flood hazard and vulnerability (Box 2). Flash flood hazards are those potentially damaging flood events that cause losses. Vulnerability is the capacity (or lack of capacity) of people to anticipate, resist, or cope with the event. Flash flood risk can be better understood using the ‘source-pathway-receptor-consequence’ (S-P-R-C) conceptual model proposed by Gouldby and Samuals (2005). For risk to arise there must be hazard, which is the source or initiator event (e.g., cloudburst); the pathway is the conduit between the source and receptors (e.g., flood routes, overland flow, or landslide); and the receptors are the people and property that are affected. The consequence depends on the degree to which the receptors are exposed to the hazard (Figure 5).
The risk can be evaluated by considering of the following components: the nature and probability of the hazard; the degree to which the receptors (number of people and amount of property) are exposed to the hazard; the susceptibility of the receptors to the hazards; and the value of the receptors.
Steps in flash flood risk assessment
The major steps taken to assess risk include the following: � Collecting information about the flood
prone area. The information needed includes: determining which localities or communities are at risk; evaluating the geographic characteristics such as the length of the river sections; peculiarities of the area, population and population distribution; geology and geomorphology; hydrology and hydraulics information; hydrometeorology; land-use; historical information on flooding in the area and existing counter measures.
� Assessing hazard or determining hazard level and intensity
� Assessing vulnerability � Assessing risk
Box 2: Risk is a function of…
� The characteristics of a hazard event
� The vulnerability (exposure/sensitivity) of assets and livelihoods to potential hazards
� The options available for risk management, and the capacity to access them
SoURCE
e.g., intense rainfall, displacement wave, landslide blocking riverflow
PATHWAyS
e.g., dam breach, inundation, overflow
RECEPToRS
e.g., people, infrastructure, property, environment
CoNSEqUENCE
e.g., loss of life, stress, material damage, environmental degradation
Figure 5: Conceptual source-pathway-receptor- consequence (S-P-R-C) model
30
SESS
IoN
4Flash Flood Risk Management – A Training of Trainers Manual
RM 4.2: Methods of hazard analysis and assessment The different scenarios of flash flood hazard can be analysed using various methods and tools and the findings can be presented in the form of hazard maps. Modern technology has advanced hazard mapping and the prediction of possible events considerably through techniques such as geological mapping and satellite imagery, high resolution mapping, and computer modelling. Geographic information system (GIS) mapping techniques, in particular, are revolutionising the process of preparing hazard maps. Computer-based modelling techniques and community-based hazard mapping techniques are the cornerstones of hazard analysis. Even more reliable results can be achieved when the two methods are combined and the results are substantiated through field verification.
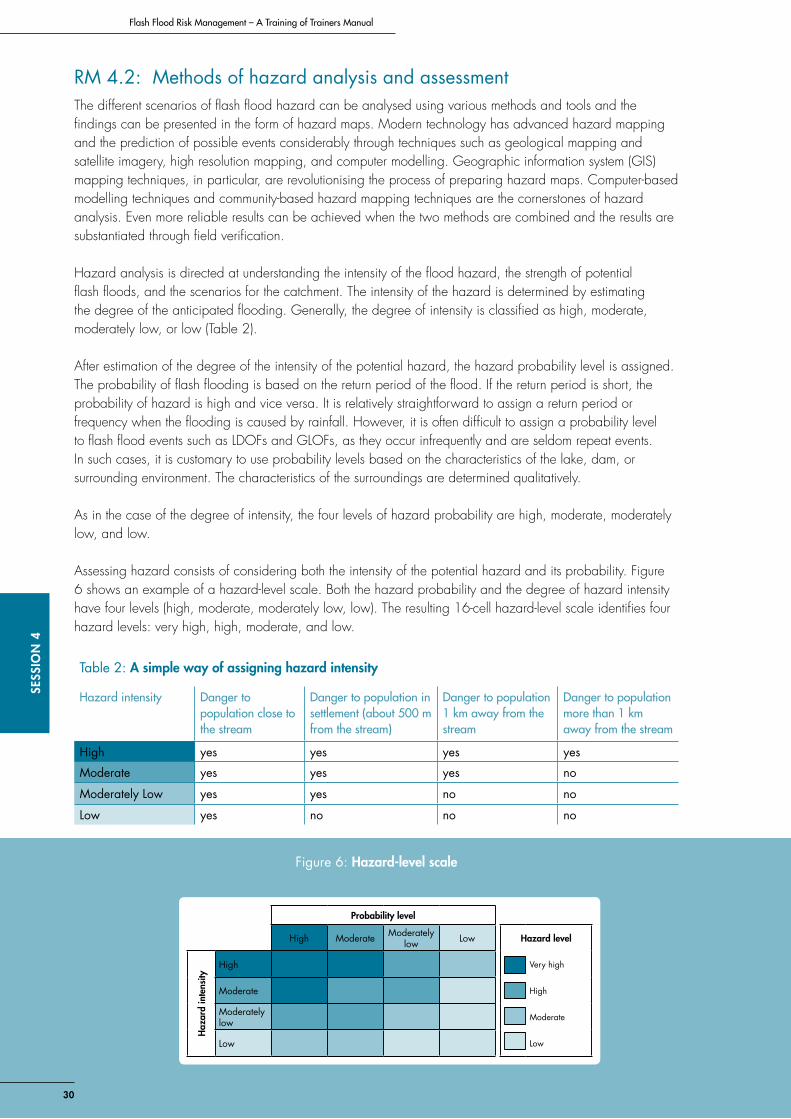
Hazard analysis is directed at understanding the intensity of the flood hazard, the strength of potential flash floods, and the scenarios for the catchment. The intensity of the hazard is determined by estimating the degree of the anticipated flooding. Generally, the degree of intensity is classified as high, moderate, moderately low, or low (Table 2).
After estimation of the degree of the intensity of the potential hazard, the hazard probability level is assigned. The probability of flash flooding is based on the return period of the flood. If the return period is short, the probability of hazard is high and vice versa. It is relatively straightforward to assign a return period or frequency when the flooding is caused by rainfall. However, it is often difficult to assign a probability level to flash flood events such as LDOFs and GLOFs, as they occur infrequently and are seldom repeat events. In such cases, it is customary to use probability levels based on the characteristics of the lake, dam, or surrounding environment. The characteristics of the surroundings are determined qualitatively.
As in the case of the degree of intensity, the four levels of hazard probability are high, moderate, moderately low, and low.
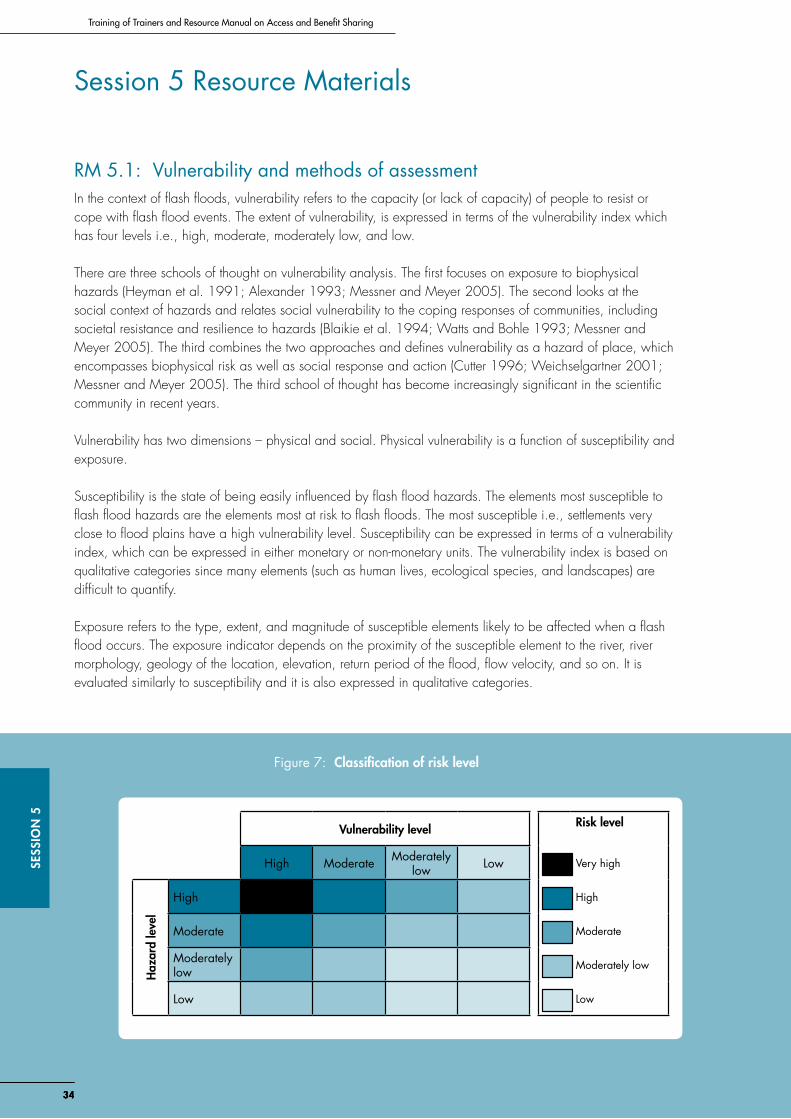
Assessing hazard consists of considering both the intensity of the potential hazard and its probability. Figure 6 shows an example of a hazard-level scale. Both the hazard probability and the degree of hazard intensity have four levels (high, moderate, moderately low, low). The resulting 16-cell hazard-level scale identifies four hazard levels: very high, high, moderate, and low.
Table 2: A simple way of assigning hazard intensity
Hazard intensity Danger to population close to the stream
Danger to population in settlement(about500mfromthestream)
Danger to population 1 km away from the stream
Danger to population more than 1 km away from the stream
High yes yes yes yes
Moderate yes yes yes no
Moderately Low yes yes no no
Low yes no no no
Figure 6: Hazard-level scale
Probability level
High Moderate Moderately low Low Hazard level
Haz
ard
inte
nsity
High Very high
Moderate High
Moderately low Moderate
Low Low
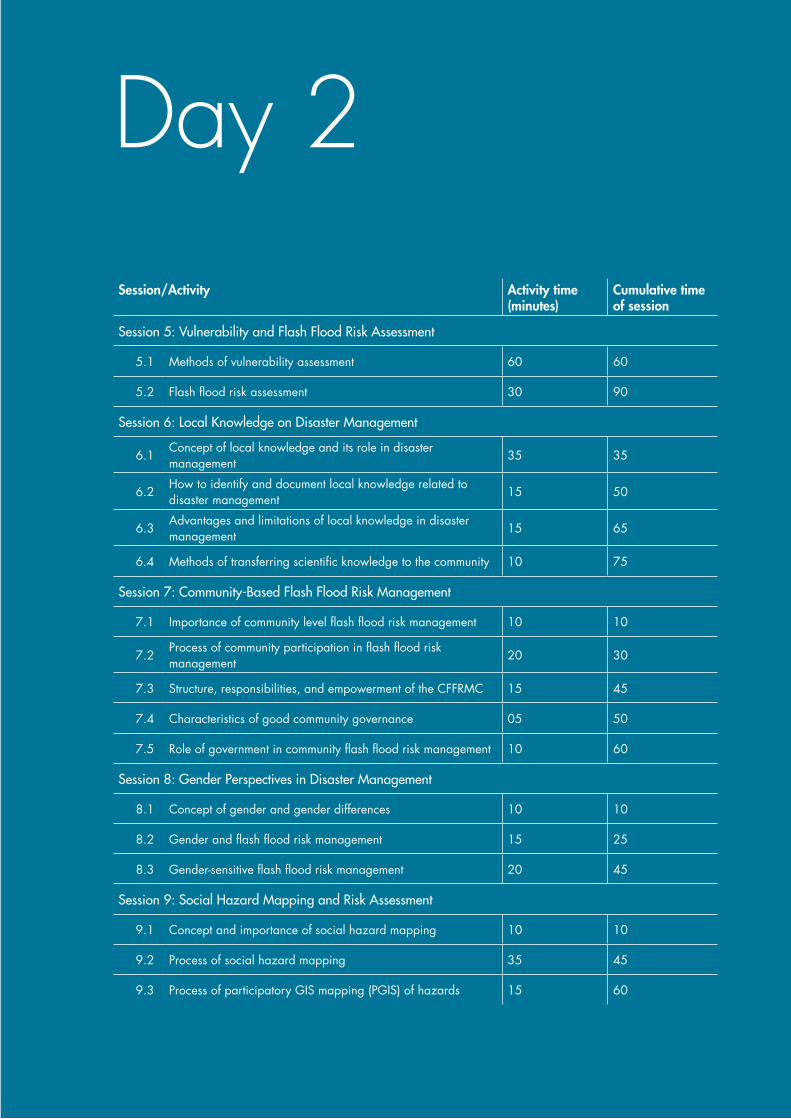
Day 2Session/Activity Activity time
(minutes)Cumulative time of session
Session 5: Vulnerability and Flash Flood Risk Assessment
5.1 Methods of vulnerability assessment 60 60
5.2 Flash flood risk assessment 30 90
Session 6: Local Knowledge on Disaster Management
6.1Concept of local knowledge and its role in disaster management
35 35
6.2How to identify and document local knowledge related to disaster management
15 50
6.3Advantages and limitations of local knowledge in disaster management
15 65
6.4 Methods of transferring scientific knowledge to the community 10 75
Session7:Community-BasedFlashFloodRiskManagement
7.1 Importance of community level flash flood risk management 10 10
7.2Process of community participation in flash flood risk management
20 30
7.3 Structure, responsibilities, and empowerment of the CFFRMC 15 45
7.4 Characteristics of good community governance 05 50
7.5 Role of government in community flash flood risk management 10 60
Session 8: Gender Perspectives in Disaster Management
8.1 Concept of gender and gender differences 10 10
8.2 Gender and flash flood risk management 15 25
8.3 Gender-sensitive flash flood risk management 20 45
Session 9: Social Hazard Mapping and Risk Assessment
9.1 Concept and importance of social hazard mapping 10 10
9.2 Process of social hazard mapping 35 45
9.3 Process of participatory GIS mapping (PGIS) of hazards 15 60
32
Training of Trainers and Resource Manual on Access and Benefit Sharing
3232
SESS
IoN
5SE
SSIo
N 5
Session 5 Vulnerability and Flash Flood Risk Assessment
Time: 90 minutes
objective To understand vulnerability and risk assessment by:
X Understanding the concept of vulnerability X Becoming familiar with the methods of vulnerability assessment X Learning about risk levels and risk assessment
Activities
Activity 5.1: Methods of vulnerability assessment Time: 60 minutes
Step 1 Engage the participants in a short interactive question and answer session asking ‘what is vulnerability?’ in the context of flash floods.
Step 2 Clarify the concept of vulnerability and the levels of vulnerability. Present the different schools of thought on vulnerability analysis.
Step 3 Present both the physical and social aspects of vulnerability assessment and discuss the assessment methods.
Step 4 Clarify the concepts of susceptibility and exposure. Explain the process of deriving vulnerability levels.
Step 5 Clarify the concept of exposure and discuss how exposure indicators are derived and expressed, e.g., high, medium, and low.
Step 6 Discuss socioeconomic vulnerability. Highlight adaptive capacity and its indicators.
Step 7 Discuss how quantitative adaptive indicators are converted to qualitative categories.
Step 8 Explain how physical and socioeconomic adaptive indicators are combined to assess vulnerability levels.
Analysis of vulnerability is the third step in risk assessment. Remind the participants that collecting the essential data and analysing hazard are the first and second steps and that these were covered in the previous sessions. Discuss the different schools of thoughts on vulnerability and mention that current scientific thought favours using a combination of biophysical and socioeconomic indicators to get the best overall estimate of vulnerability.
Note to the trainer
3333
Day 2
33
SESSIoN
5
Activity 5.2: Flash flood risk assessmentTime: 30 minutes
The aim of this activity is to bring together the concepts presented in the previous sessions and to show how all of these contribute to the final assessment of risk.
Step 1 Before beginning with the formal presentation engage the class in a short question and answer session on ‘what is risk assessment’? Clarify the concept and clear up any misconceptions.
Step 2 Review the four levels of hazard and the four levels of total vulnerability (RM 5.1 and Figure 7); review how these are graded (i.e., high, moderate, moderately low, and low).
Step 3 Present the method of determining risk levels for risk assessment.
Risk assessment involves quantification of risk through understanding hazard, vulnerabilities, and exposure patterns. Reiterate that it is essential both to understand these aspects and to know how to grade them in order to be able to plan and to conceive strategies for risk management.
Note to the trainer
34
Training of Trainers and Resource Manual on Access and Benefit Sharing
3434
SESS
IoN
5
Session 5 Resource Materials
RM 5.1: Vulnerability and methods of assessmentIn the context of flash floods, vulnerability refers to the capacity (or lack of capacity) of people to resist or cope with flash flood events. The extent of vulnerability, is expressed in terms of the vulnerability index which has four levels i.e., high, moderate, moderately low, and low.
There are three schools of thought on vulnerability analysis. The first focuses on exposure to biophysical hazards (Heyman et al. 1991; Alexander 1993; Messner and Meyer 2005). The second looks at the social context of hazards and relates social vulnerability to the coping responses of communities, including societal resistance and resilience to hazards (Blaikie et al. 1994; Watts and Bohle 1993; Messner and Meyer 2005). The third combines the two approaches and defines vulnerability as a hazard of place, which encompasses biophysical risk as well as social response and action (Cutter 1996; Weichselgartner 2001; Messner and Meyer 2005). The third school of thought has become increasingly significant in the scientific community in recent years.
Vulnerability has two dimensions – physical and social. Physical vulnerability is a function of susceptibility and exposure.
Susceptibility is the state of being easily influenced by flash flood hazards. The elements most susceptible to flash flood hazards are the elements most at risk to flash floods. The most susceptible i.e., settlements very close to flood plains have a high vulnerability level. Susceptibility can be expressed in terms of a vulnerability index, which can be expressed in either monetary or non-monetary units. The vulnerability index is based on qualitative categories since many elements (such as human lives, ecological species, and landscapes) are difficult to quantify.
Exposure refers to the type, extent, and magnitude of susceptible elements likely to be affected when a flash flood occurs. The exposure indicator depends on the proximity of the susceptible element to the river, river morphology, geology of the location, elevation, return period of the flood, flow velocity, and so on. It is evaluated similarly to susceptibility and it is also expressed in qualitative categories.
Figure 7: Classification of risk level
Vulnerability level Risk level
High Moderate Moderately low Low Very high
Haz
ard
leve
l
High High
Moderate Moderate
Moderately low Moderately low
Low Low
3535
Day 2
35
SESSIoN
5
In a physically vulnerable zone, the extent of socioeconomic vulnerability depends to a large extent on the society’s capacity to adapt. Adaptive capacity is both a social and economic in nature. Settlements along riverbanks are vulnerable to flash floods debris fans. Poverty as well as limited access and control over various resources contribute to vulnerability. Adaptive capacity can be expressed either quantitatively or qualitatively. A few quantitative indicators of adaptive capacity include accessibility, availability of health facilities, availability of communication facilities, and income level. Those indicators have to be converted to qualitative categories so that they can be combined with qualitative indicators to estimate the socioeconomic vulnerability of the area in question. The qualitative indicators are those that encompass different risk management measures such as warning systems, loss reduction measures, social awareness, and attitude. Physical and socioeconomic vulnerability are converted into qualitative categories and combined to obtain the overall total vulnerability, which can also be reported in qualitative categories (e.g., high, moderate, moderately low, low).
RM 5.2: Flash flood risk assessment A risk-level scale is the product of hazard level assessment and an estimation of total vulnerability. Four levels of hazard and four levels of total vulnerability (high, moderate, moderately low, and low) are used to estimate the risk level.
The scale is derived by making informed but subjective judgments, and in this regard it is similar to the hazard-level scale. Figure 7 shows the risk-levels: very high, high, moderate, moderately low, and low.
36
SESS
IoN
6Flash Flood Risk Management – A Training of Trainers Manual
Session 6 Local Knowledge on Disaster Management
Time: 75 minutes
objective To understand what local knowledge is and what role it can play in disaster management by
X Introducing the concept of local knowledge X Learning the methods needed to identify and document local knowledge on disaster management X Identifying the strengths and weaknesses of local knowledge on disaster management X Learning how scientific knowledge can be transferred to the community level
Activities
Activity 6.1: Concept of local knowledge and its role in disaster management Time: 35 minutes
Step 1 Clarify the concept of local knowledge and then engage class in a short question and answer session where the participants are encouraged to compare and contrast ‘scientific knowledge’ with ‘local knowledge’ in the context of disaster management.
Clarify how the scientific knowledge approach is top down while local knowledge is bottom up. Local knowledge is subjective; it comprises the beliefs and values of people in a specific place and time. Scientific knowledge is objective and it valid regardless of the context.
What people know is influenced both by what they experience and by the beliefs, worldviews, and values of their community. Indigenous knowledge is part of local knowledge. Local knowledge is a complex adaptive response to internal and external changes. All people have local knowledge, but indigenous people who still live in close harmony with nature have a deep understanding that comes from fine-tuning their understanding about nature and adjusting their practices over time. Their knowledge has been created, recreated, and transferred from one generation to the next. Specific practices based on local knowledge can vary depending on the practitioner’s ethnicity, clan, gender, age, wealth, educational status, and personal experiences.
Note to the trainer
37
Day 2SESSIo
N 6
Step 2 Show the short video on local knowledge and flood preparedness in the Eastern Terai of Nepal.
Step 3 Distribute Handout 6.1 and ask the participants to write down what they understand by ‘local knowledge’?
Based on the video presentation and on their own experience, ask the class to write the answer of the following questions: � What areas are covered by the term ‘local knowledge’? How does it cover both environmental
knowledge and social and cultural aspects? � Where is local knowledge located? � Who in the community has local knowledge? � How and when is local knowledge produced, transmitted and/or lost?
Step 4 Ask the participants what role they think local knowledge plays in flash flood management.
Step 5 Clarify the importance of local knowledge in disaster management. Specifically mention how local knowledge can be used in flash flood management.
Activity 6.2: How to identify and document local knowledge related to disaster management Time: 15 minutes
Step 1 Discuss why it is important to document local knowledge.
Step 2 Discuss the four pillars of local knowledge on disaster preparedness.
Step 3 Discuss the process of documenting local knowledge.
About the videoThe video shows how the people of the Eastern Terai of Nepal use local knowledge in flash flood and riverine flood preparedness. It also shows how these people live surrounded by numerous different stresses. Practitioners working in the field of flash flood management need to be aware that while communities exist in a give environmental context that this needs to be considered against the backdrop of their own particular socio-cultural, economic and political situation. The hazards of flash floods need to be seen as one of the many natural hazards and other stresses that the community faces.
Note to the trainer
Reiterate that local knowledge is context specific and that it is not easy to generalise it and apply it to other areas. Clarify that the purpose of documenting local knowledge is not to conserve it, but rather to learn from it in order to create new concepts, methods, or strategies for improved flash flood and disaster management. Local knowledge is documented in the hope of being able to use indigenous methods to strengthen the coping mechanisms that communities use to deal with disasters.
Note to the trainer
Activity 6.3: Advantages and limitations of local knowledge in disaster managementTime: 15 minutes
Step 1 Engage the class in a short question and answer session asking them what they perceive to be the links between local knowledge and disaster management. Discuss what can be learned from local knowledge for disaster management.
Step 2 Discuss the advantages of using local knowledge in disaster preparedness and management.
Step 3 Discuss the limitations of using local knowledge alone in disaster preparedness and management.
Activity 6.4: Methods of transferring scientific information to the communityTime: 10 minutes
In addition to local knowledge, it is important to understand the extent to which the community knows about the various scientific methods and information that may be available on flash flood management.
Step 1 Discuss why it is important to transfer scientific knowledge to the local level. Explain what different means can be used to disseminate information and that it is important to keep in mind that not all means of communication are available or applicable to the same extent in different places or situations.
Step 2 Discuss with the participants what kind of information it is necessary to disseminate and why. Emphasise that it is necessary to choose an avenue of communication that local people can rely on.
Step 3 Describe how information creates awareness and leads to changes in behaviour at the local level.
Step 4 Describe the process of communicating scientific information to the local level and describe the different methods that can be used.
38
SESS
IoN
6Flash Flood Risk Management – A Training of Trainers Manual
When presenting the advantages and limitations of using local knowledge in disaster preparedness and management, try to link the discussion with the video presentation and compare and contrast local activities with external, top-down strategies of disaster preparedness and management.
Note to the trainer
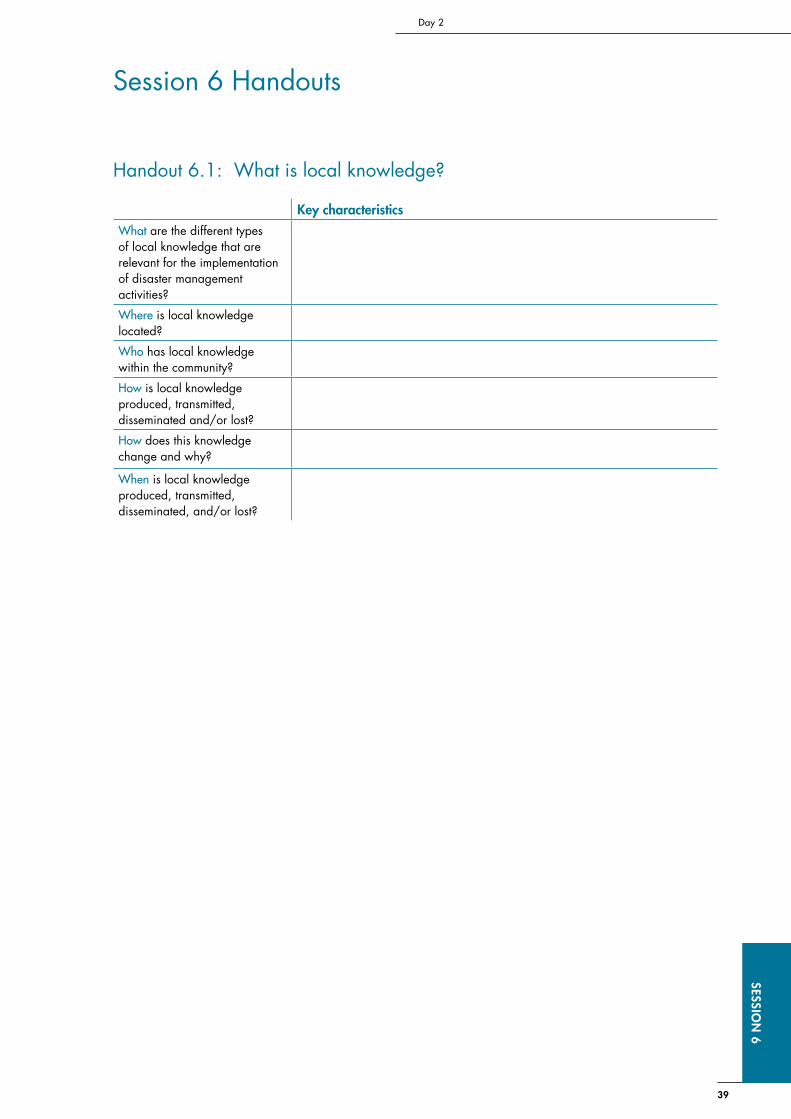
39
Day 2SESSIo
N 6
Session 6 Handouts
Handout 6.1: What is local knowledge?
Key characteristicsWhat are the different types of local knowledge that are relevant for the implementation of disaster management activities?
Where is local knowledge located?
Who has local knowledge within the community?
How is local knowledge produced, transmitted, disseminated and/or lost?
How does this knowledge change and why?
When is local knowledge produced, transmitted, disseminated, and/or lost?
40
SESS
IoN
6Flash Flood Risk Management – A Training of Trainers Manual
Session 6 Resource Materials
RM 6.1: Local knowledge and its role in flash flood management
What is local knowledge?
The term ‘local knowledge’ is used here in its broadest sense; it refers to what the people living with risk know about natural hazards, what they believe, and how they cope with different risk situations. Peoples’ practices, their lifestyles, and what they believe, all influence their knowledge on natural hazards. Local knowledge is unique to a given culture and it holistically comprises all of the complex diversity of how that society understands both the visible and invisible. Local knowledge and practices are place specific and can and do evolve; they are complex adaptive responses to change. In many cases, communities have been living with natural hazards for generations and have been able to cope and to adapt in order to minimise, reduce, or avoid the negative effects that natural hazards can have on their livelihoods, properties, and lives.
Flash flood management is a major challenge for both government and non-governmental organisations (NGOs) mainly because of the difficulties associated with accurate forecasting and the short lead-times for issuing warnings. When dealing with flood preparedness and management activities, most agencies tend to favour scientific and specialised knowledge, a great deal of which cannot be assimilated in local contexts and realities. On the other hand, local knowledge can provide information related to the local context, local environmental variability, and specificities; local perceptions of natural hazards; community-valued tradeoffs with respect to risk in the context of multiple stresses; local information on who are the vulnerable groups and individuals. Local knowledge can contribute by giving local advice on safe locations for construction sites (buildings and roads) and by being used together with conventional knowledge for hazard mapping. Local knowledge can also be used to inform: early warning systems, surveys, and other inventories to verify information, as well as to help adapt communication strategies to local understanding and perceptions, and to integrate local values into the decision-making processes. The incorporation of local knowledge in disaster preparedness and management activities can be made cost-effective, efficient, and sustainable. In the HKH, local knowledge is even more pertinent than elsewhere because, since many communities are isolated and remote, local knowledge is often all that is available.
Where can local knowledge be found?
Local knowledge is everywhere: in people’s heads, their beliefs, cultural and religious ceremonies, practices, taboos, local rules, songs, and proverbs. Local knowledge resides at the individual and household level as well as at the collective level, gathered and transmitted by community stewards and other key social actors. We all have local knowledge, but it may differ by ethnicity, clan, gender, age, sex, socio-economic group, and educational level.
When and how is local knowledge created and transformed?
Local knowledge is dynamic; it is both created and lost over time. Unlike conventional or scientific knowledge, local knowledge depends more on memory, intuition, and the senses than on the intellect. Local knowledge is always gained through experience and is transferred from one generation to the next.
RM 6.2: Identifying and documenting local knowledge Local knowledge is not instantly available and cannot always be easily documented. To document local knowledge it is first necessary to spend some time with the community to understand everyday livelihood practices and to observe practices, events, and activities that are part of their local knowledge. Figure 8 provides a simple framework describing how local knowledge on disaster preparedness is related to:
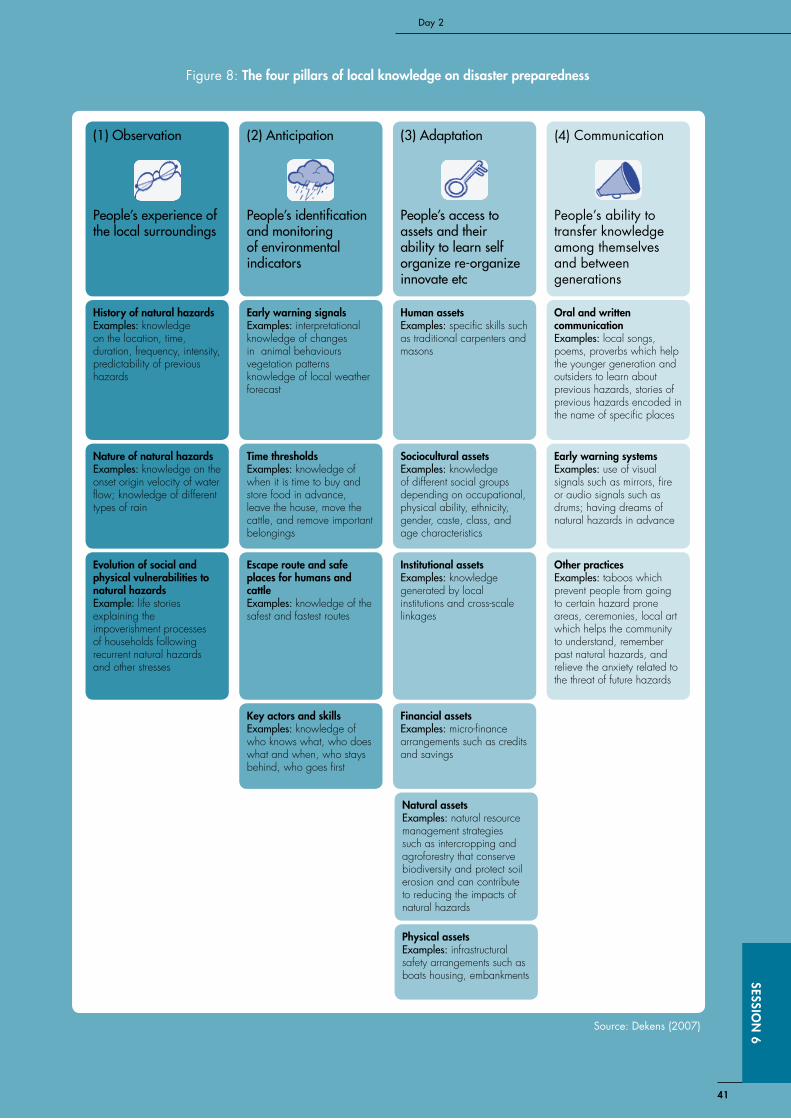
41
Day 2SESSIo
N 6
Figure 8: The four pillars of local knowledge on disaster preparedness
(1)Observation
People’s experience of the local surroundings
(2)Anticipation
People’s identification and monitoring of environmental indicators
(3)Adaptation
People’s access to assets and their ability to learn self organizere-organizeinnovate etc
(4) Communication
People’s ability to transfer knowledge among themselves and between generations
History of natural hazardsExamples: knowledge on the location, time, duration, frequency, intensity, predictability of previous hazards
Early warning signalsExamples: interpretational knowledge of changes in animal behaviours vegetation patterns knowledge of local weather forecast
Human assetsExamples: specific skills such as traditional carpenters and masons
oral and written communicationExamples: local songs, poems, proverbs which help the younger generation and outsiders to learn about previous hazards, stories of previous hazards encoded in the name of specific places
Sociocultural assetsExamples: knowledge of different social groups depending on occupational, physical ability, ethnicity, gender, caste, class, and age characteristics
Early warning systemsExamples: use of visual signals such as mirrors, fire or audio signals such as drums; having dreams of natural hazards in advance
Institutional assetsExamples: knowledge generated by local institutions and cross-scale linkages
other practicesExamples: taboos which prevent people from going to certain hazard prone areas, ceremonies, local art which helps the community to understand, remember past natural hazards, and relieve the anxiety related to the threat of future hazards
Financial assetsExamples: micro-finance arrangements such as credits and savings
Natural assetsExamples: natural resource management strategies such as intercropping and agroforestry that conserve biodiversity and protect soil erosion and can contribute to reducing the impacts of natural hazards
Physical assetsExamples: infrastructural safety arrangements such as boats housing, embankments
Time thresholdsExamples:knowledge of when it is time to buy and store food in advance, leave the house, move the cattle, and remove important belongings
Escape route and safe places for humans and cattleExamples:knowledge of the safest and fastest routes
Key actors and skillsExamples: knowledge of who knows what, who does what and when, who stays behind, who goes first
Nature of natural hazardsExamples: knowledge on the onset origin velocity of water flow; knowledge of different types of rain
Evolution of social and physical vulnerabilities to natural hazardsExample: life stories explaining the impoverishment processes of households following recurrent natural hazards and other stresses
Source: Dekens (2007)
42
SESS
IoN
6Flash Flood Risk Management – A Training of Trainers Manual
� people’s ability to observe their local surroundings; � people’s capacity to identify and monitor environmental indicators (of an upcoming flood); � people’s ability to develop adaptation strategies for recurrent floods; � people’s ability to communicate understanding of past and present floods.
As a general procedure, practitioners working in the area of disaster management should remember to ask questions related to these four key dimensions to try to understand both what people know about natural hazards in their locality and what they do for disaster preparedness.
In trying to identify and document local knowledge, one should always be open to observing local customs, events, and activities. Documenting local knowledge is a discovery process that takes place by observing people in their day-to-day lives in their own context; it should take place by observation and by using one’s own senses much more than by interrogating the community. It is important to observe how people categorise their observations and give meaning to them. The observer/researcher needs to be keenly aware that the act of discovery can be affected by the power relation that he or she has in the community. Research should be reflexive. The researcher needs to be able to put aside his own preconceptions when he observes and interprets what local people do. The researcher also needs to be able to question what he perceives to ensure that he is not filtering the information according to his own socio-cultural bias.
Documentation not only helps to preserve local knowledge; it also helps to inform those wishing to work with communities to strengthen sustainable and equitable local coping mechanisms. Well documented local knowledge also helps to create new concepts, methods, or strategies for improved disaster management.
RM 6.3: Advantages and limitations of local knowledge in disaster managementLocal knowledge and practices have several advantages when compared to most external, top-down strategies. When the local knowledge is not taken into consideration and used fully, it is highly likely that the following will result. � Community dependence on external help can be increased and unsustainable disaster management
activities promoted. � When the situation is not considered holistically and when there is no profound understanding and
analysis of the vulnerability context, new vulnerabilities and disasters can be created. � Projects intended to benefit the entire community may not reach the most vulnerable and disadvantaged. � Valuable opportunities that could strengthen good local practices and attenuate unsustainable ones for
creative and innovative solutions can be missed. � Misunderstandings, resentments, and lack of trust can develop between the community members and those
trying to help them. � Inappropriate technologies, ideas, or communication strategies can be promoted owing to a
misunderstanding of local contexts – the result of which is often a negative impact on the environment and/or the economy.
� Community involvement and ownership may be lacking, and resistance to change may result. � Monitoring and other disaster management activities can be diminished or totally neglected. � Possible future relationships on development projects can be irreparably damaged or compromised.
The following are the major limitations or barriers to the use of local knowledge in disaster management and disaster preparedness. � Local knowledge may be perceived as unscientific and inferior to conventional knowledge. � People can be fatalistic and often live at risk because of lack of knowledge. � Local knowledge is difficult to identify, use, assess, validate, generalise, and replicate. � Local knowledge is often monopolised by dominant groups in the community. � Some local practices, beliefs, and adaptation strategies are unsustainable and/or not socially equitable.
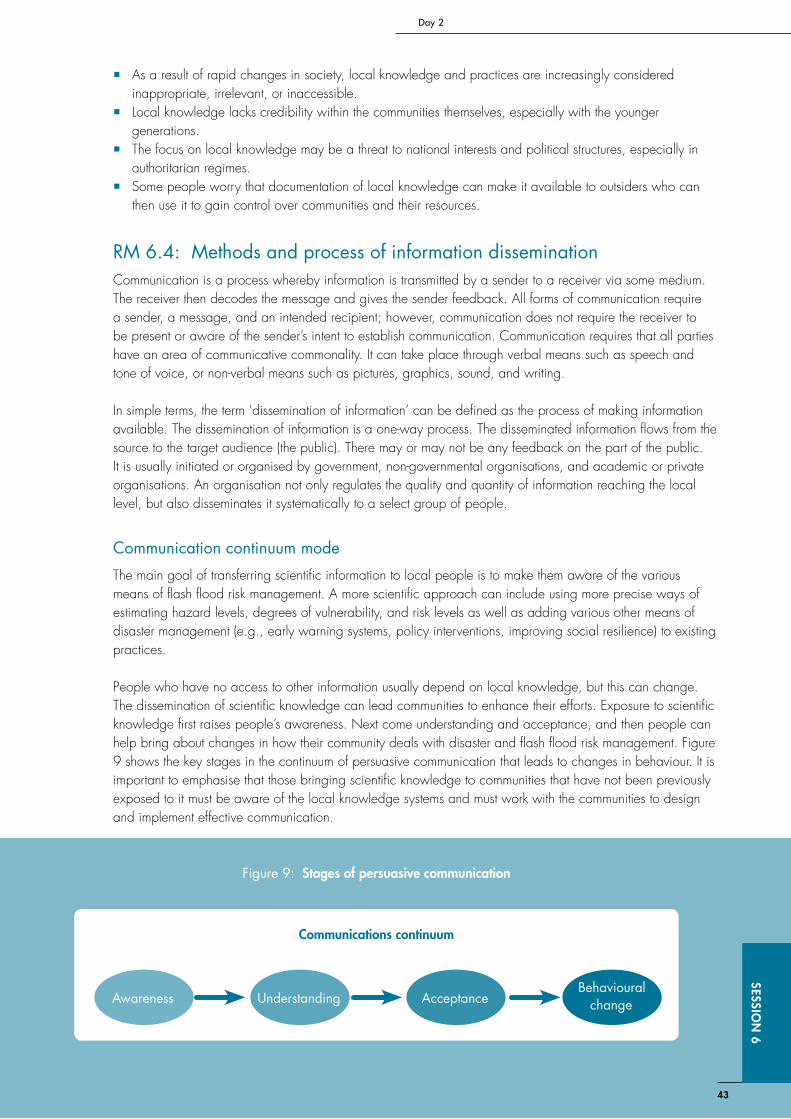
43
Day 2SESSIo
N 6
� As a result of rapid changes in society, local knowledge and practices are increasingly considered inappropriate, irrelevant, or inaccessible.
� Local knowledge lacks credibility within the communities themselves, especially with the younger generations.
� The focus on local knowledge may be a threat to national interests and political structures, especially in authoritarian regimes.
� Some people worry that documentation of local knowledge can make it available to outsiders who can then use it to gain control over communities and their resources.
RM 6.4: Methods and process of information disseminationCommunication is a process whereby information is transmitted by a sender to a receiver via some medium. The receiver then decodes the message and gives the sender feedback. All forms of communication require a sender, a message, and an intended recipient; however, communication does not require the receiver to be present or aware of the sender’s intent to establish communication. Communication requires that all parties have an area of communicative commonality. It can take place through verbal means such as speech and tone of voice, or non-verbal means such as pictures, graphics, sound, and writing.
In simple terms, the term ‘dissemination of information’ can be defined as the process of making information available. The dissemination of information is a one-way process. The disseminated information flows from the source to the target audience (the public). There may or may not be any feedback on the part of the public. It is usually initiated or organised by government, non-governmental organisations, and academic or private organisations. An organisation not only regulates the quality and quantity of information reaching the local level, but also disseminates it systematically to a select group of people.
Communication continuum mode
The main goal of transferring scientific information to local people is to make them aware of the various means of flash flood risk management. A more scientific approach can include using more precise ways of estimating hazard levels, degrees of vulnerability, and risk levels as well as adding various other means of disaster management (e.g., early warning systems, policy interventions, improving social resilience) to existing practices.
People who have no access to other information usually depend on local knowledge, but this can change. The dissemination of scientific knowledge can lead communities to enhance their efforts. Exposure to scientific knowledge first raises people’s awareness. Next come understanding and acceptance, and then people can help bring about changes in how their community deals with disaster and flash flood risk management. Figure 9 shows the key stages in the continuum of persuasive communication that leads to changes in behaviour. It is important to emphasise that those bringing scientific knowledge to communities that have not been previously exposed to it must be aware of the local knowledge systems and must work with the communities to design and implement effective communication.
Communications continuum
Awareness Understanding AcceptanceBehavioural
change
Figure 9: Stages of persuasive communication

44
SESS
IoN
6Flash Flood Risk Management – A Training of Trainers Manual
Means of disseminating information
There are many means of disseminating information to local people. However, it may be that not all are available or applicable to the same extent in all situations. The following are a few effective means of disseminating information at the local level to consider. � Workshops at the local level � Community meetings and discussions � Local newspaper and radio programmes � Publication and distribution of reference materials � Publication and distribution of reports � Internet � Audio visual presentations � Demonstrations
45
Day 2SESSIo
N 7
Session 7 Community-Based Flash Flood Risk Management
Time: 60 minutes
objectiveTo appreciate the importance of community involvement, and to learn how to proceed in promoting community participation in flash flood risk management by:
X Appreciating the importance of community involvement in flash flood management X Learning how the community can participate in flash flood management X Involving the government in community flash flood risk management
Activities
Activity 7.1: Importance of community-level flash flood risk managementTime: 10 minutes
Step 1 Define what a community is.
Step 2 Discuss the major features of community-based flash flood risk management and its importance. Discuss the need to involve communities in flash flood risk management.
Step 3 Explain the comparative advantages of community-based flash flood risk management and highlight the fact that it can be more sustainable, cheaper, easier to implement, and less detrimental to the environment than other approaches to flash flood risk management.
Step 4 Highlight the features of community-based approaches and discuss the advantages that they offer.
Activity 7.2: Process of community participation in flash flood risk management Time: 20 minutes
Step 1 Present and discuss the conceptual framework for community participation (see Figure 10 in RM 7.2). Clarify that the community not only manages the risk but also assesses the risk using local knowledge and experience.
Step 2 Discuss how to form a Community Flash Flood Risk Management Committee (CFFRMC) and remember to mention the importance of arranging community meetings and conducting needs assessments.
Discuss the following questions with the participants and make sure that they understand how these apply to their particular situations.
Who calls the community meeting? How do you go about calling a meeting and where can it be held? � Communities have social organisations such as village
councils, youth clubs, and mothers’ groups, which can serve
Note to the trainer
Flash Flood Risk Management: A Training of Trainers Manual
46
SESS
IoN
7
as centres for convening community meetings. It is important to remember that when the invitation to attend the meeting is extended by a person respected in the community or by a social worker, that the members of the community will see it as trustworthy.
� The meeting venue can be a public place such as a community hall, village council hall, or other location that is convenient for the maximum number of villagers.
Who should be invited to the meeting? � When inviting community members to the meeting, remember
to include people from all walks of life and from all segments of the society. Different people have different types of knowledge and experience, so see to it that the meeting includes a good balance in terms of ethnicity, caste, and gender. Securing the contribution of all groups will best serve the goals of the committee.
What initial information is required before the meeting? � To initiate the discussion with the community, collect
information on past flash flood events and on the losses that the villagers may have incurred. Discuss what the community can do for flash flood risk management.
� Assess the needs of the community with respect to education, awareness, training, weather forecasting, early warning, and demonstration for planning and flash flood risk management. The community can also assesses the risk of flash floods and prepare maps. (Note that the process of social hazard mapping is discussed in the forthcoming session).
What can the community do? � Propose the ad hoc formation of a CFFRMC with broad
participation and give the committee the responsibility for further planning and activities.
Note to the trainer (continued)
Activity 7.3: Structure, responsibilities, and empowerment of the CFFRMCTime: 15 minutes
Step 1 Engage the participants in a short question and answer session on how the committee should be structured, how many sub-committees there should be, and so on. Discuss the advantages and disadvantages of having either too small or too large a committee with respect to general operations and decision making.
Step 2 Explain the structure of a typical CFFRMC. Clarify why an advisory committee is needed and how one can be formed. Remember to mention that based on the needs and on the recommendations of the advisory committee, additional committees can be formed as needed.
Step 3 Present the roles and responsibilities of the CFFRMC and its sub-committees during all the phases of flash flood management, i.e., before, during, and after the flood event. Remember to point out that the committee is responsible for planning, implementing, and monitoring the various activities of flash flood risk management that will help the community be better prepared for a flood disaster.
47
Day 2SESSIo
N 7
Step 4 Discuss the different ways that the CFFRMC can be empowered. Stress that institutional and financial empowerment are very important. The different sub-committees each have different responsibilities and a variety of skill types are required to staff them.
Step 5 Discuss the mechanisms that can be used for the financial empowerment of the committee
Activity 7.4: Characteristics of good community governanceTime: 5 minutes
Step 1 Discuss the importance of governance and enumerate the characteristics of good community governance.
Step 2 Discuss possible dispute resolution mechanisms. Note that a cell, department, or division can be formed within the CFFRMC to deal with dispute resolution. Point out that it is always best when internal mechanisms can be devised to resolve disputes, but that other mechanisms are available when this is not possible.
Activity 7.5: Role of government in community flash flood risk managementTime: 10 minutes
Step 1 Give a short presentation outlining why the government should be involved in community flash flood management.
Step 2 Discuss how the government can participate in community flash flood management, what sort of activities it can be involved in, and how it can collaborate with the community.
Step 3 Explain how the government can be involved before, during, and after a flash flood.
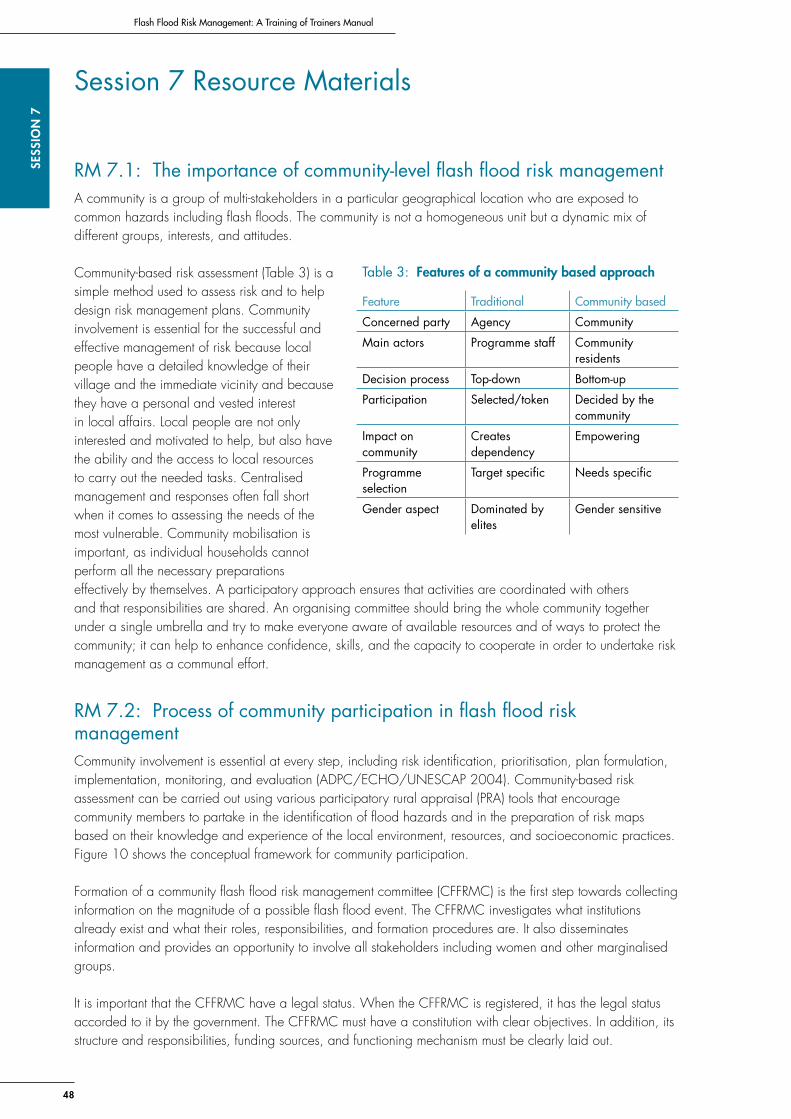
Flash Flood Risk Management: A Training of Trainers Manual
48
SESS
IoN
7
Session 7 Resource Materials
RM 7.1: The importance of community-level flash flood risk managementA community is a group of multi-stakeholders in a particular geographical location who are exposed to common hazards including flash floods. The community is not a homogeneous unit but a dynamic mix of different groups, interests, and attitudes.
Community-based risk assessment (Table 3) is a simple method used to assess risk and to help design risk management plans. Community involvement is essential for the successful and effective management of risk because local people have a detailed knowledge of their village and the immediate vicinity and because they have a personal and vested interest in local affairs. Local people are not only interested and motivated to help, but also have the ability and the access to local resources to carry out the needed tasks. Centralised management and responses often fall short when it comes to assessing the needs of the most vulnerable. Community mobilisation is important, as individual households cannot perform all the necessary preparations effectively by themselves. A participatory approach ensures that activities are coordinated with others and that responsibilities are shared. An organising committee should bring the whole community together under a single umbrella and try to make everyone aware of available resources and of ways to protect the community; it can help to enhance confidence, skills, and the capacity to cooperate in order to undertake risk management as a communal effort.
RM 7.2: Process of community participation in flash flood risk managementCommunity involvement is essential at every step, including risk identification, prioritisation, plan formulation, implementation, monitoring, and evaluation (ADPC/ECHO/UNESCAP 2004). Community-based risk assessment can be carried out using various participatory rural appraisal (PRA) tools that encourage community members to partake in the identification of flood hazards and in the preparation of risk maps based on their knowledge and experience of the local environment, resources, and socioeconomic practices. Figure 10 shows the conceptual framework for community participation.
Formation of a community flash flood risk management committee (CFFRMC) is the first step towards collecting information on the magnitude of a possible flash flood event. The CFFRMC investigates what institutions already exist and what their roles, responsibilities, and formation procedures are. It also disseminates information and provides an opportunity to involve all stakeholders including women and other marginalised groups.
It is important that the CFFRMC have a legal status. When the CFFRMC is registered, it has the legal status accorded to it by the government. The CFFRMC must have a constitution with clear objectives. In addition, its structure and responsibilities, funding sources, and functioning mechanism must be clearly laid out.
Table 3: Features of a community based approach
Feature Traditional Community based
Concerned party Agency Community
Main actors Programme staff Community residents
Decision process Top-down Bottom-up
Participation Selected/token Decided by the community
Impact on community
Creates dependency
Empowering
Programme selection
Target specific Needs specific
Gender aspect Dominated by elites
Gender sensitive
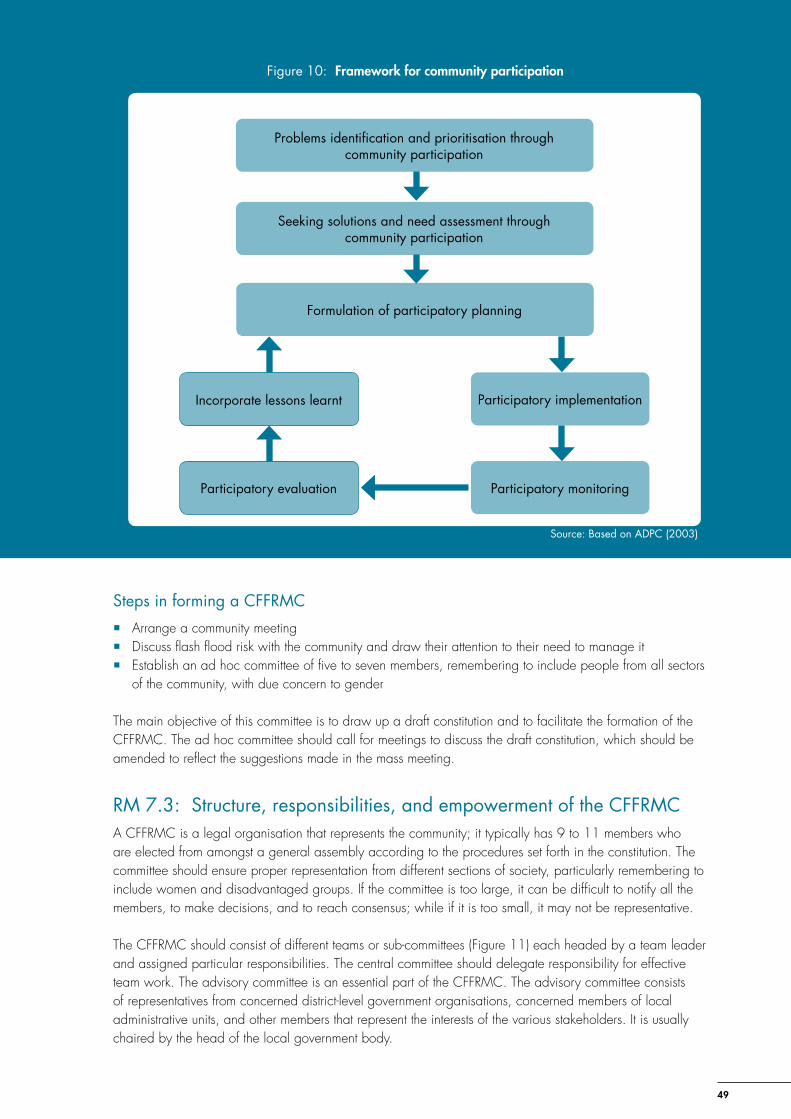
49
Day 2SESSIo
N 7
Steps in forming a CFFRMC
� Arrange a community meeting � Discuss flash flood risk with the community and draw their attention to their need to manage it � Establish an ad hoc committee of five to seven members, remembering to include people from all sectors
of the community, with due concern to gender
The main objective of this committee is to draw up a draft constitution and to facilitate the formation of the CFFRMC. The ad hoc committee should call for meetings to discuss the draft constitution, which should be amended to reflect the suggestions made in the mass meeting.
RM 7.3: Structure, responsibilities, and empowerment of the CFFRMCA CFFRMC is a legal organisation that represents the community; it typically has 9 to 11 members who are elected from amongst a general assembly according to the procedures set forth in the constitution. The committee should ensure proper representation from different sections of society, particularly remembering to include women and disadvantaged groups. If the committee is too large, it can be difficult to notify all the members, to make decisions, and to reach consensus; while if it is too small, it may not be representative.
The CFFRMC should consist of different teams or sub-committees (Figure 11) each headed by a team leader and assigned particular responsibilities. The central committee should delegate responsibility for effective team work. The advisory committee is an essential part of the CFFRMC. The advisory committee consists of representatives from concerned district-level government organisations, concerned members of local administrative units, and other members that represent the interests of the various stakeholders. It is usually chaired by the head of the local government body.
Figure 10: Framework for community participation
Problems identification and prioritisation through community participation
Seeking solutions and need assessment through community participation
Formulation of participatory planning
Incorporate lessons learnt
Participatory evaluation
Participatory implementation
Participatory monitoring
Source: Based on ADPC (2003)
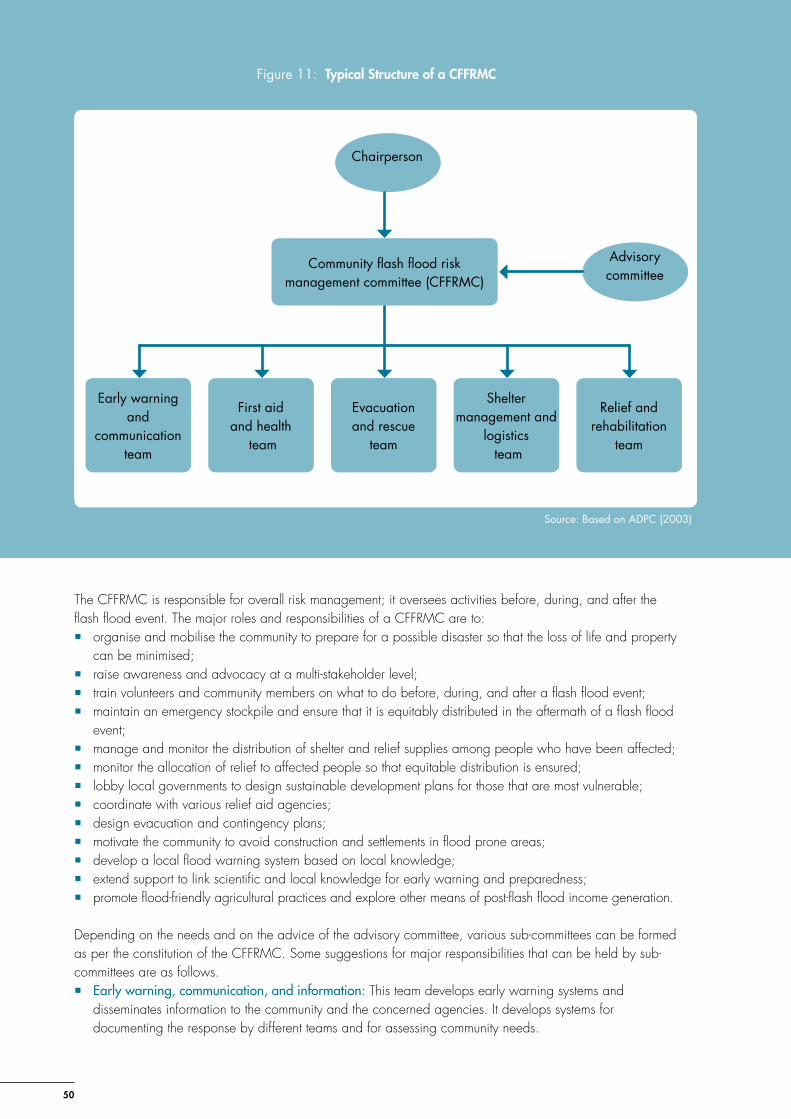
Flash Flood Risk Management: A Training of Trainers Manual
50
SESS
IoN
7
The CFFRMC is responsible for overall risk management; it oversees activities before, during, and after the flash flood event. The major roles and responsibilities of a CFFRMC are to: � organise and mobilise the community to prepare for a possible disaster so that the loss of life and property
can be minimised; � raise awareness and advocacy at a multi-stakeholder level; � train volunteers and community members on what to do before, during, and after a flash flood event; � maintain an emergency stockpile and ensure that it is equitably distributed in the aftermath of a flash flood
event; � manage and monitor the distribution of shelter and relief supplies among people who have been affected; � monitor the allocation of relief to affected people so that equitable distribution is ensured; � lobby local governments to design sustainable development plans for those that are most vulnerable; � coordinate with various relief aid agencies; � design evacuation and contingency plans; � motivate the community to avoid construction and settlements in flood prone areas; � develop a local flood warning system based on local knowledge; � extend support to link scientific and local knowledge for early warning and preparedness; � promote flood-friendly agricultural practices and explore other means of post-flash flood income generation.
Depending on the needs and on the advice of the advisory committee, various sub-committees can be formed as per the constitution of the CFFRMC. Some suggestions for major responsibilities that can be held by sub-committees are as follows. � Earlywarning,communication,andinformation: This team develops early warning systems and
disseminates information to the community and the concerned agencies. It develops systems for documenting the response by different teams and for assessing community needs.
Figure 11: Typical Structure of a CFFRMC
Chairperson
Advisory committee
Community flash flood risk management committee (CFFRMC)
Early warning and
communication team
First aid and health
team
Evacuation and rescue
team
Shelter management and
logistics team
Relief and rehabilitation
team
Source: Based on ADPC (2003)
51
Day 2SESSIo
N 7
� First-aidandhealth: The responsibilities of this team include mobilising and organising camps to treat injured people and raising community awareness about health, hygiene, and education in times of flash floods.
� Evacuationandrescue: This team evacuates affected people and, when possible, also removes domestic animals and other material goods along with the people.
� Shelter management and logistics: This team finds shelter for victims. Before a flood, it must establish and maintain stockpiles of materials (with community accountability) and develop logistical systems to distribute relief.
� Relief and rehabilitation: This team ensures the necessary stock of relief goods with proper security and monitoring.
The CFFRMC is a voluntary organisation and thus depends on volunteers. Each team should enrol a certain number of volunteers and to the extent possible, the team composition should reflect the local geography, gender, and social demography.
It is essential that the CFFRMC be empowered both institutionally and financially to be able to react to crises quickly and carry out its work effectively. The functional bodies must be able to react to a flood rapidly and make rational decisions. Committee members, team leaders, and volunteers need to have appropriate expertise and a clear understanding of their roles and responsibilities. They may also need training or skill development in various areas such as: early warning, preparedness and risk reduction, measurement of precipitation, water-level gauge recording, early warning systems, participatory hazard and vulnerability mapping, preparedness planning, community-based first aid, community-based disaster management, building mitigation structures, watershed management, and agriculture management.
It is important for the CFFRMC to be financially viable. The committee must establish close contact with external agencies, including government agencies, to obtain funds. Some possible fundraising mechanisms that have worked well in the past include organising social and religious events, selling natural resources that belong to the community (such as community forest resources and products), and levying local taxes. When funds are collected for community benefit it is important to maintain proper accounting of both income and expenditures.
RM 7.4: Characteristics of good community governanceGovernance provides an enabling environment whereby communities can provide services for the common good. The key characteristics of good governance are: assessment of needs, prioritisation, and equitable allocation of resources. The governance process must encourage cyclical planning that allows for learning and improvement over time. Good community governance for flash flood risk management can be fostered by keeping in mind a few basic guidelines. � Participation: A participatory approach that includes the whole community is important. Everyone in the
community can participate by voicing their opinion on the need for the mitigation measures and possible solutions.
� Communication: The effectiveness of a CFFRMC can be gauged by the extent to which it has been successful in communicating to the community the potential problem of flash floods, its causes, and appropriate solutions to minimise losses. The peaceful resolution of stakeholder disputes and grievances in the committee are vital.
� Efficiency: It is achieved by minimising financial, political, social, and environmental costs. � Equityandinclusiveness: It is necessary and important to promote the empowerment of women and
marginalised groups, and to make sure that these groups have the opportunity to be involved. � Responsiveness: The committee must be responsible and accountable to the community and it must include
all stakeholders. � Transparency: Transparency of procedures indicates good governance.
Different grievances and community complaints can be resolved through institutional mechanisms such as public cells which redress grievances under the CFFRMC. Cells help to resolve disputes, for example
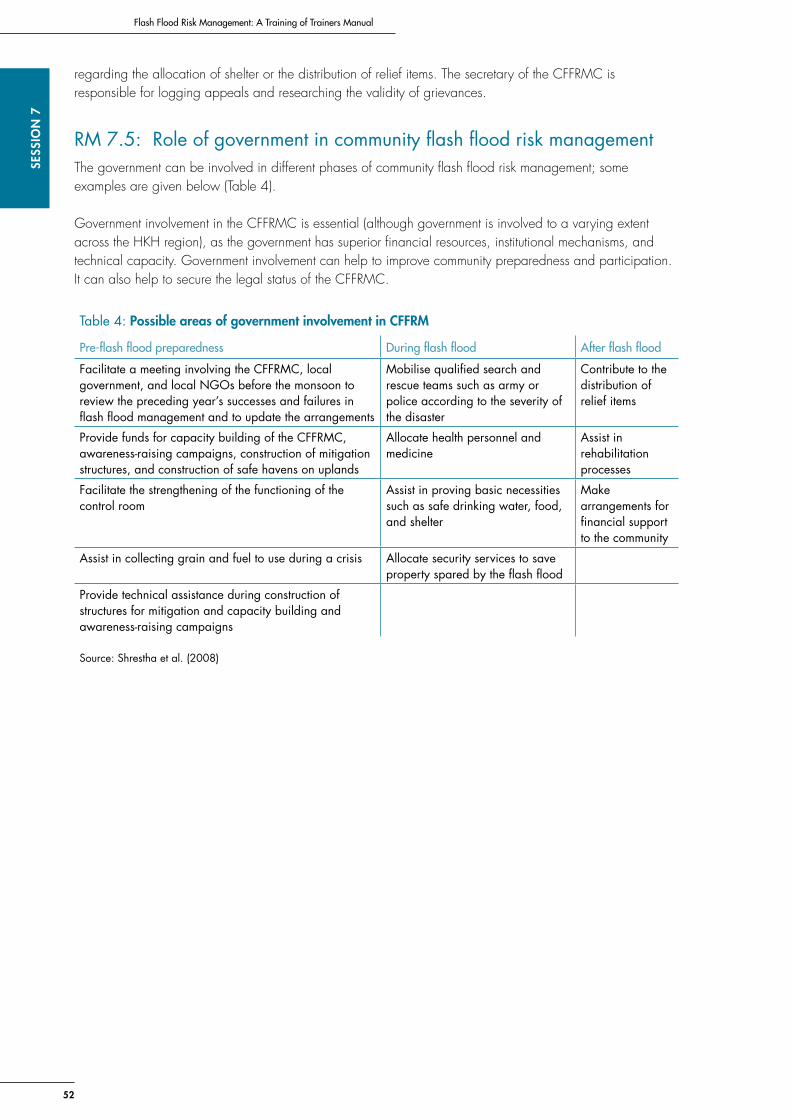
Flash Flood Risk Management: A Training of Trainers Manual
52
SESS
IoN
7
Table 4: Possible areas of government involvement in CFFRM
Pre-flashfloodpreparedness During flash flood After flash flood
Facilitate a meeting involving the CFFRMC, local government, and local NGOs before the monsoon to review the preceding year’s successes and failures in flash flood management and to update the arrangements
Mobilise qualified search and rescue teams such as army or police according to the severity of the disaster
Contribute to the distribution of relief items
Provide funds for capacity building of the CFFRMC, awareness-raising campaigns, construction of mitigation structures, and construction of safe havens on uplands
Allocate health personnel and medicine
Assist in rehabilitation processes
Facilitate the strengthening of the functioning of the control room
Assist in proving basic necessities such as safe drinking water, food, and shelter
Make arrangements for financial support to the community
Assist in collecting grain and fuel to use during a crisis Allocate security services to save property spared by the flash flood
Provide technical assistance during construction of structures for mitigation and capacity building and awareness-raising campaigns
Source: Shrestha et al. (2008)
regarding the allocation of shelter or the distribution of relief items. The secretary of the CFFRMC is responsible for logging appeals and researching the validity of grievances.
RM 7.5: Role of government in community flash flood risk managementThe government can be involved in different phases of community flash flood risk management; some examples are given below (Table 4).
Government involvement in the CFFRMC is essential (although government is involved to a varying extent across the HKH region), as the government has superior financial resources, institutional mechanisms, and technical capacity. Government involvement can help to improve community preparedness and participation. It can also help to secure the legal status of the CFFRMC.
53
Day 2SESSIo
N 8
Session 8 Gender Perspectives in Disaster Management
Time: 45 minutes
objective To understand how the gender dimension and gender issues play a role in disaster and flash flood risk management by
X Learning the concept of ‘gender’ and appreciating gender differences X Understanding gender issues in flash flood risk management X Learning how gender-sensitive flash flood risk management works
Activities
Activity 8.1: Concept of gender and gender differencesTime: 10 minutes
Step 1 Engage the class in a short question and answer session in which the participants are asked to voice their understanding of ‘gender’. Give a short presentation explaining how ‘gender’ differs from ‘sex’ and clarify the differences.
Step 2 Discuss how society differentiates between activities that are perceived as ‘man’s work’ and ‘woman’s work’.
Activity 8.2: Gender and flash flood risk managementTime: 15 minutes
Step 1 Discuss how issues of gender are of concern in flash flood risk management.
Step 2 Discuss how women are generally more affected both during and after a flash flood.
Activity 8.3: Gender-sensitive flash flood risk managementTime: 20 minutes
Step 1 Discuss the need for gender-sensitive flash flood risk management.
Step 2 Discuss the most significant problems that women face during a disaster.
Step 3 Discuss possible gender-sensitive approaches to flash flood risk management.
The class may not be aware that access to and control over various resources can be gender specific. Clarify that gender as well as economic status, age, and physical fitness can all affect flood risk.
Note to the trainer
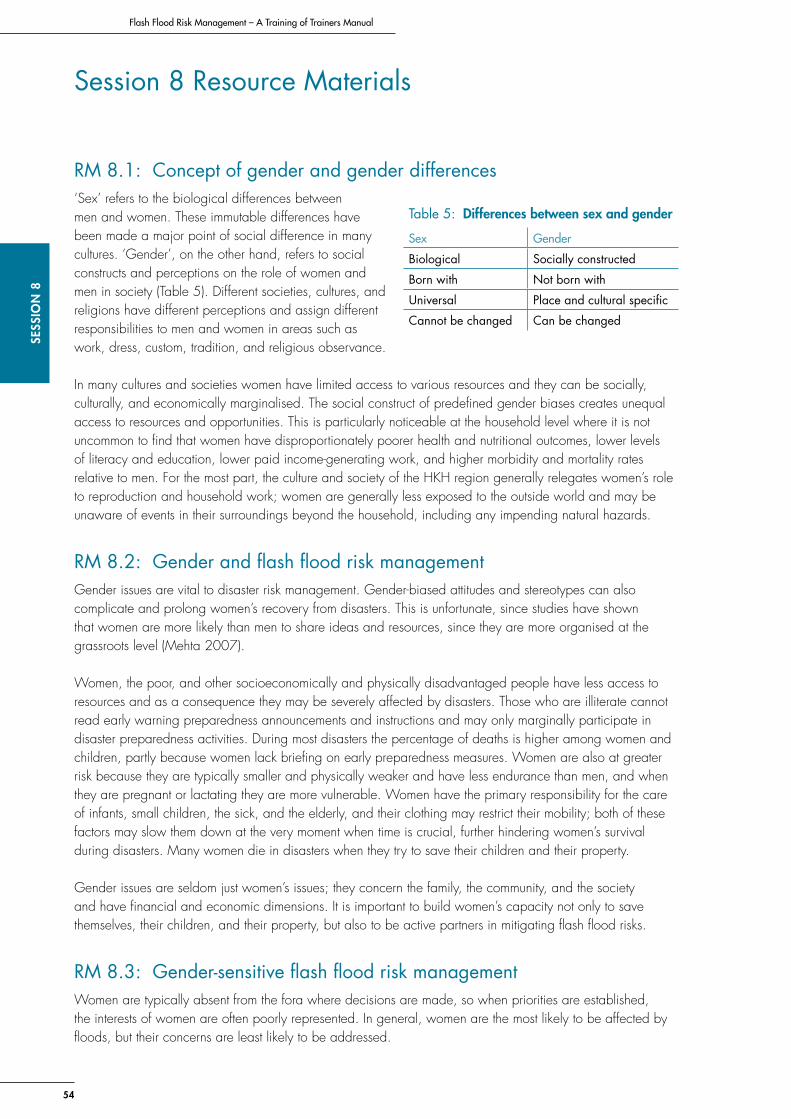
54
SESS
IoN
8Flash Flood Risk Management – A Training of Trainers Manual
Session 8 Resource Materials
RM 8.1: Concept of gender and gender differences‘Sex’ refers to the biological differences between men and women. These immutable differences have been made a major point of social difference in many cultures. ‘Gender’, on the other hand, refers to social constructs and perceptions on the role of women and men in society (Table 5). Different societies, cultures, and religions have different perceptions and assign different responsibilities to men and women in areas such as work, dress, custom, tradition, and religious observance.
In many cultures and societies women have limited access to various resources and they can be socially, culturally, and economically marginalised. The social construct of predefined gender biases creates unequal access to resources and opportunities. This is particularly noticeable at the household level where it is not uncommon to find that women have disproportionately poorer health and nutritional outcomes, lower levels of literacy and education, lower paid income-generating work, and higher morbidity and mortality rates relative to men. For the most part, the culture and society of the HKH region generally relegates women’s role to reproduction and household work; women are generally less exposed to the outside world and may be unaware of events in their surroundings beyond the household, including any impending natural hazards.
RM 8.2: Gender and flash flood risk managementGender issues are vital to disaster risk management. Gender-biased attitudes and stereotypes can also complicate and prolong women’s recovery from disasters. This is unfortunate, since studies have shown that women are more likely than men to share ideas and resources, since they are more organised at the grassroots level (Mehta 2007).
Women, the poor, and other socioeconomically and physically disadvantaged people have less access to resources and as a consequence they may be severely affected by disasters. Those who are illiterate cannot read early warning preparedness announcements and instructions and may only marginally participate in disaster preparedness activities. During most disasters the percentage of deaths is higher among women and children, partly because women lack briefing on early preparedness measures. Women are also at greater risk because they are typically smaller and physically weaker and have less endurance than men, and when they are pregnant or lactating they are more vulnerable. Women have the primary responsibility for the care of infants, small children, the sick, and the elderly, and their clothing may restrict their mobility; both of these factors may slow them down at the very moment when time is crucial, further hindering women’s survival during disasters. Many women die in disasters when they try to save their children and their property.
Gender issues are seldom just women’s issues; they concern the family, the community, and the society and have financial and economic dimensions. It is important to build women’s capacity not only to save themselves, their children, and their property, but also to be active partners in mitigating flash flood risks.
RM 8.3: Gender-sensitive flash flood risk management Women are typically absent from the fora where decisions are made, so when priorities are established, the interests of women are often poorly represented. In general, women are the most likely to be affected by floods, but their concerns are least likely to be addressed.
Table 5: Differences between sex and gender
Sex Gender
Biological Socially constructed
Born with Not born with
Universal Place and cultural specific
Cannot be changed Can be changed
55
Day 2SESSIo
N 8
The CFFRMC also plays a role in training women to deal with disease control, malnutrition, food shortages, land treatment, and crop production. Adopting a gender perspective would advocate that the roles of men and women be examined separately and that strategies for protection and mitigation be targeted specifically at men and women based on their roles.
For the most part, women in the HKH region have lower literacy and educational levels than men; this has also contributed to their reduced access to post-disaster relief activities. Moreover, the lack of gender awareness in communications at the grassroots level means that women have had limited access to disaster-related information. It is important to bring gender issues to the fore when addressing capacity building and empowerment initiatives. The knowledge and skills gained for general preparedness are also useful in emergencies.
Women face specific problems during disasters. One recurring problem is the lack of privacy; in situations of prolonged water logging, the simple activity of bathing and tending to personal hygiene in relative privacy is more problematic for women than it is for men. Women are also more restricted in their mobility than men, as they are usually the ones responsible for the care of young children and the elderly. Women and girls of all ages are commonly harassed during disasters. Not only are the womenfolk commonly forgotten when information is disseminated, but they have the added burden of also being the ones tasked with collecting relief materials. Women, the poor, and the more underprivileged segments of society have specific issues when it comes to combating disaster, but they can also bring a unique perspective which can be invaluable in saving lives and property, especially at the family level. For this reason it is necessary to keep the following points in mind when conducting gender-based risk management, as women can introduce innovative mechanisms and techniques. � Remember to differentiate between different target groups and specific objectives and approaches for all
intervention activities. � Involve women in pre- and post-disaster management. � When planning activities remember that women have particular needs with respect to security, hygiene,
and related issues. � Ensure girls’ education after disaster. � Protect the specific health needs of women. � Help women become self-sufficient in terms of minimum income and financial security. � Ensure equitable aid distribution. � See that women can partake in the decision-making process by providing the capacity building and
advocacy training that they need to be able to participate fully.
56
SESS
IoN
9Flash Flood Risk Management – A Training of Trainers Manual
Session 9 Social Hazard Mapping and Risk Assessment
Time: 1 hour
objective To appreciate the importance of social hazard mapping and to learn how to implement it by:
X Understanding the concept of social hazard mapping X Learning how to conduct social hazard mapping with a local community X Learning about participatory GIS mapping (PGIS)
Activities
Activity 9.1: Concept and importance of social hazard mapping
Time: 10 minutes
Step 1 Introduce the concept of social hazard mapping and explain who prepares the maps and how.
Step 2 Discuss the processes of identifying potential stakeholders who will be involved in the social hazard mapping process. Highlight the fact that while it is important to involve social elites, key informants, and local leaders, it is equally important to involve community members from different castes and ethnic backgrounds and from all socio-cultural and economic groups, since each will be able to contribute a different type of knowledge and experience. Remember to emphasise gender issues and to stress the participation of women.
Step 3 Discuss how social hazard mapping can be disseminated to and used by communities and local authorities.
Activity 9.2: Process of social hazard mappingTime: 35 minutes
Step 1 Introduce how social hazard mapping can be conducted in a community setting with local people who may be unfamiliar with maps in general (RM 9.2). Give practical advice. Make participants aware of possible pitfalls, and also include checklists that should be helpful in conducting on-site social hazard mapping.
Step 2 Review the steps of social hazard mapping (detailed in RM 9.2):
� Introductions and establishing rapport � Discussion of the map � Familiarising participants with map signs and symbols � Question and answer session � Marking the map � Preparing the legend � Emphasising community awareness
57
Day 2SESSIo
N 9
Activity 9.3: Process of participatory GIS mapping (PGIS) of hazardsTime: 15 minutes
Step 1 Explain what participatory GIS-based community hazard mapping is. Mention how GIS and remote sensing databases can be linked with the community-based exercise of hazard mapping. Social hazard mapping, in its most elementary form (as for example in Activity 9.2), uses only community-based knowledge and information. A greater degree of accuracy and sophistication can be achieved by using the PGIS method, which integrates community knowledge with spatial data.
Step 2 Review the methodology of PGIS. Clarify that PGIS involves two steps. The first step is to collect information from the community as already outlined in Activity 9.2. The second step is to integrate the information collected by the community with the spatial data layers to prepare the social hazard map.
Step 3 The information which is collected from the community can be analysed and integrated with the GIS/remote sensing based data directly in the field or it can be processed in the office. In either case, the end result is the flash flood hazard map.
Clarify that one of the responsibilities of the CFFRMC is to collect the information that is needed to prepare a hazard map and to prepare the actual map. Alternatively, the CFFRMC can choose to assign the task of preparing the hazard map to another organisation. Regardless of who prepares the hazard map, the steps needed for the preparatory groundwork are the same. Some or all of the following tools and techniques can be used to collect all of the relevant information for the preparatory groundwork: participatory rural appraisal (PRA) methods such as observation, focus group discussions, in-depth interviews, key informant surveys, checklists, and review of previous documents and papers to collect information previously recorded about the community. (If the CFFRMC is not preparing the hazard map, then the group doing so should consult the CFFRMC for any additional information it can provide.)
Note to the trainer
Box 4: Planning ahead for field work
Social hazard mapping is a group activity. A little planning ahead can help to make the exercise a good success. When working in the field make sure that the following drawing materials are available: drawing pens of different colour, markers, pencils, erasers, A1 size plain paper, scales, measuring tape, etc. In addition to the drawing materials make sure that maps of the area are also available; these can be, for example, topographic maps, aerial photographs or high resolution satellite images (e.g., QuickBbird, IKONOS). Note that it is best when the maps are printed on A1 or A0 size paper.
58
SESS
IoN
9Flash Flood Risk Management – A Training of Trainers Manual
Session 9 Resource Materials
RM 9.1: Concept and importance of social hazard mappingA social hazard map is a map of the local flash flood hazards; it is prepared based on local knowledge and other available information. It can be prepared either by the CFFRMC or any other organisation in consultation with CFFRMC and the local communities (Boxes 3 and 4). It consists of information on the range of possible damage and disaster prevention activities. The activity of social hazard mapping helps the community become aware of the extent of the damage that possible flash floods can inflict, the possible hazard scenario, possible evacuation routes, sites, and so on; in general, it encourages discussion in the community for heightened awareness and better flash flood risk management (Box 5).
RM 9.2: Process of social hazard mappingSocial flood hazard maps reflect the location and the condition of a given area. A flood hazard map uses symbols to indicate the location of houses, assets, services delivery organisations, infrastructure (roads, schools, hospitals, and bazaars), and other community landmarks. It is a tool that the CFFRMC uses to encourage the participatory process of collecting baseline data and information; the data that are collected are plotted on a map to help the planning team analyse the strengths (resources/opportunities available) and risks (exposures and vulnerabilities) in the area in question (cluster, district, ward). It also helps in the identification of vulnerable
Box 3: Social hazard mapping – key considerations
Social hazard mapping is carried out by the community itself. It is usually coordinated by the CFFRMC and done in consultation with community members and a variety of stakeholders. It is also possible for outsiders to the community to prepare social hazard maps, but they should be aware of a number of potential pitfalls, such as the difficulty of identifying the correct people to liaise with, language challenges, and barriers in access to the community and in selecting participants. Sometimes outsiders do not know the local language and cannot communicate with the local facilitator. It is important to have a good facilitator who is also a key informant and who is capable of establishing a rapport with the community before conducting the exercise.
It is important to keep the channels of communications open with the local authorities; to report to them on the activities being conducted; and to obtain permission, if needed, before beginning.
Box5:Usesoffloodhazardmaps
By local people � To consider proper land use planning � To learn about flood history � To organise for preparedness and evacuation � To help prepare emergency evacuation plans � To help identify communication channels � To identify safe routes and places
By CFFRMC/local administrative authority � To review land use planning/ urban planning � To update disaster preparedness activities � To review evacuation routes and sites � To update specific assistance plans � To promote education and awareness activities � To update information � To disseminate updated information
59
Day 2SESSIo
N 9
Box7:Usingcolourandsymbols
Discuss how different hazard zones can be indicated by marking them in different colours. Go over the colour conventions and the standard symbols used in mapping. By convention, red is usually used to mark the most high risk and critical areas. Agricultural land is typically depicted in yellow, forests in green, rivers and lakes in blue, and barren land in gray. Areas of risk can all be depicted in the same colour but with different intensity depending on the level of risk.
Box 6: Scale of the map
The scale of the map should be on the order of 1:10,000 to 1:15,000 to allow for easy identification of individual houses and evacuation routes, and for the participants to easily gauge the extent of a possible inundation. Explain that on a 1:10,000 scale map, 1 cm on the map corresponds to 100 m on the ground. It is essential to get across the concept of scale since this is fundamental to preparing and reading maps. Once the participants have a good handle on the concept of scale they will then easily be able to locate landmarks and be able to sketch information such as how far their houses and property are from the expected hazard area.
groups such as people with disabilities or those with special needs, who will need special consideration during emergency rescue and relief operations. Since the map includes all possible local resources, it can be of great help when rescue workers and others are searching for assistance in locating measures that can lessen the magnitude of loss, the safest path for evacuation, and safe places for temporary settlements.
Steps in social hazard mapping
Step 1: When conducting social hazard mapping in a community setting, remember to first greet the participants and put them at ease by clarifying the objectives of the work. Introduce each of your team members and ask the local participants to introduce themselves. Try to establish a good rapport between the outsider group and its mediator and the local facilitator and community members.
Step 2: The second step is the discussion of the map. Before the session begins, hang the map on a wall or position it appropriately so that it will be visible to all the participants. Regardless of the type of map, whether it is a topographic map, an aerial photo, or a remote sensing satellite image, introduce it to the local participants by pointing out some familiar landmarks. Explain how the map was produced and go into some detail about the orientation, the direction, and the scale (see Box 6). Point out reference points that will be familiar to them such as the settlement, agricultural land, the roads, the river, and other well-known community infrastructure. Clarify how to read the map and remember to explain the scale of the map in relation to the ground scale.
Step 3: Remind the participants of the need to familiarise local people with the different symbols, colours, icons, and other conventional signs used on maps to depict landmarks such as rivers, roads, settlements, schools, hospitals, irrigation canals, agricultural land, forest, and so on (see Box 7). It is important to do this before proceeding with the preparation of the social hazard map.
Step 4: Engage the local participants in a short question and answer session on what they think is the most essential information to include on a social hazard map and why.
Step 5: Ask the participants to identify and mark features such as the boundaries of the community, neighbouring settlements, various flood risk zones, highland and lowland areas, safe areas, and other points of reference (Box 8). When starting with a base map, verify and update features that are already identifiable on the map. When a new map needs to be created, proceed as follows. � Draw the main objects such as the river and its tributaries, any canals and lakes, and the location of rain
gauges. � Draw settlements, houses, and infrastructure (e.g., roads). � Indicate the different uses of land such as forests, pasture areas, open areas, and landslide areas. � Indicate the location of communication infrastructure, telecom towers, electricity towers, transmission lines,
and so on.
60
SESS
IoN
9Flash Flood Risk Management – A Training of Trainers Manual
� Mark the location of areas that are routinely flood prone, areas that have experienced inundation at some time in the past, and area that are considered to be safe.
� Mark areas that are particularly flood prone. � Mark the maximum height of past flood levels. � Identify and map high, medium, and low risk flood
zones by marking them with different colours. � Identify the location of vulnerable communities,
areas, and people. � Mark internal and external safe areas. � Map safe evacuation routes. � Mark the location of safe evacuation sites, the
control room, public security points, health care centres, and so on.
Step 6: Ask the participants to prepare a legend detailing all of the features that they have indicated. The legend should be clear and easily understandable by local people.
Step 7: After collectively preparing the hazard map, it is important to reiterate that everyone in the community should be made aware of it so that they all can be prepared for the eventuality of a possible flash flood and be aware of contingency plans.
Some tips for preparing a social flood hazard map � As in standard mapping practice, the top of the piece of paper on which the map is drawn indicates
north. The boundaries of wards and villages are marked. It is advisable to provide a legend and a scale for the map.
� Record the location of every cluster of households, of the markets, and of the public buildings. � Record the location of structures such as canals, weirs, roads, airports, bridges, the path of the river,
highlands, and lowlands. The location of vulnerable areas should noted and indicated on the map using special symbols.
� Record the location of evacuation routes, safe havens, and the locations that can be used as staging areas for emergency volunteers. Record the location of infrastructure and indicate whether it is available for use in emergence situations. Record the location of vulnerable areas, safe structural constructions, hazard prone houses and infrastructure, and the locations of the most vulnerable people.
� Public safety and security: indicate the location of civil defence installations, communications centres, emergency management centres, fire stations, hospitals and other medical facilities, mass emergency shelters, police stations and other installations that are available for public security, for stockpiling, and for the use of community emergency organisations.
� Utilities: Clearly mark communication lines and antenna complexes. � Agriculture: indicate the location of food storage and processing facilities, irrigation systems,
impoundments and reservoirs, levees, and dikes.
A comprehensive risk analysis for flash floods needs to be conducted in advance in order to be able to plan for all eventualities. The analysis begins by estimating the possible intensity and magnitude of the event and gauging the extent of the impact that it can have on vulnerable human lives and livestock; the analysis then proceeds by seeing what plans can be made for emergency shelter sites, evacuation routes, and emergency water sources. The risk analysis also involves making plans to train volunteers and response personnel and to disseminate information to locals about what to do in case of an emergency. Rapid onset disasters such as flash floods do not allow enough time to collect secondary information. It is very important that the CFFRMC collect such information well in advance of the onset of the flash flood.
Box 8: Information to include on the hazard map
� Inundated area, depth � Flood concentration period � Area to be evacuated � Location of evacuation sites and routes � Control room � Dangerous spots � Past flood record � Predicted extent of flood and damage � Location of houses, settlement and infrastructure � Public safety and security: police, hospital � Explanation and direction use in the map
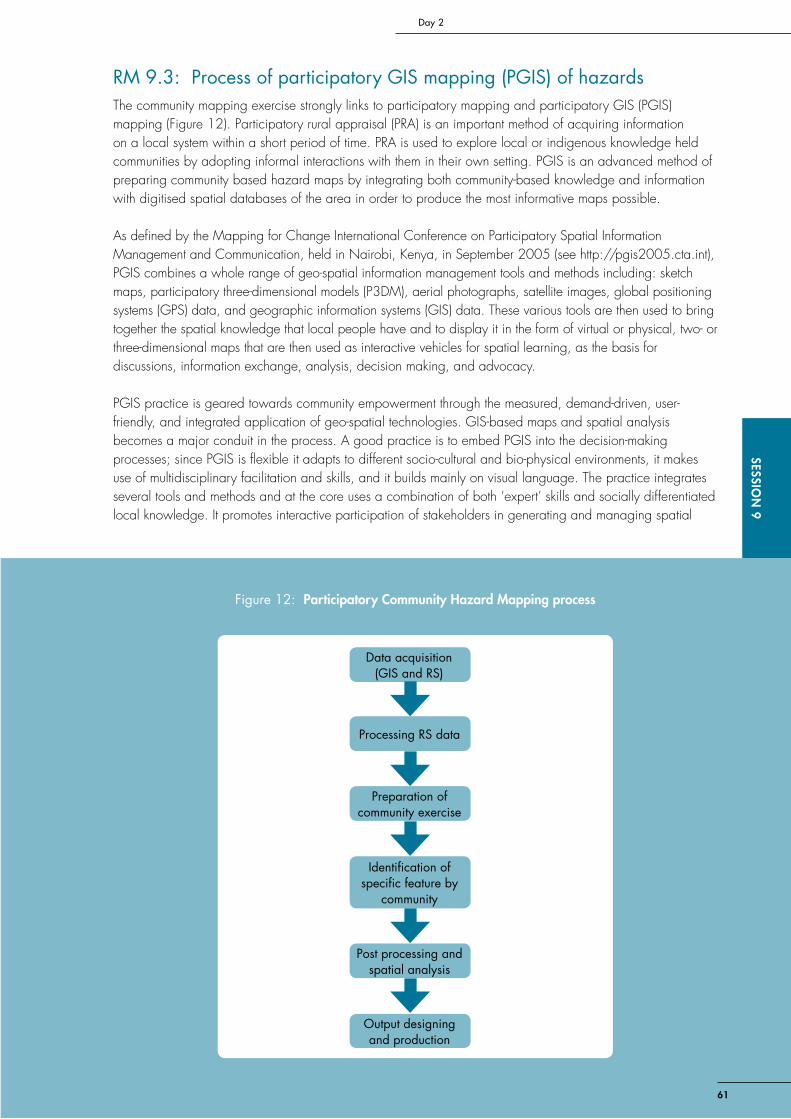
61
Day 2SESSIo
N 9
RM 9.3: Process of participatory GIS mapping (PGIS) of hazardsThe community mapping exercise strongly links to participatory mapping and participatory GIS (PGIS) mapping (Figure 12). Participatory rural appraisal (PRA) is an important method of acquiring information on a local system within a short period of time. PRA is used to explore local or indigenous knowledge held communities by adopting informal interactions with them in their own setting. PGIS is an advanced method of preparing community based hazard maps by integrating both community-based knowledge and information with digitised spatial databases of the area in order to produce the most informative maps possible.
As defined by the Mapping for Change International Conference on Participatory Spatial Information Management and Communication, held in Nairobi, Kenya, in September 2005 (see http://pgis2005.cta.int), PGIS combines a whole range of geo-spatial information management tools and methods including: sketch maps, participatory three-dimensional models (P3DM), aerial photographs, satellite images, global positioning systems (GPS) data, and geographic information systems (GIS) data. These various tools are then used to bring together the spatial knowledge that local people have and to display it in the form of virtual or physical, two- or three-dimensional maps that are then used as interactive vehicles for spatial learning, as the basis for discussions, information exchange, analysis, decision making, and advocacy.
PGIS practice is geared towards community empowerment through the measured, demand-driven, user-friendly, and integrated application of geo-spatial technologies. GIS-based maps and spatial analysis becomes a major conduit in the process. A good practice is to embed PGIS into the decision-making processes; since PGIS is flexible it adapts to different socio-cultural and bio-physical environments, it makes use of multidisciplinary facilitation and skills, and it builds mainly on visual language. The practice integrates several tools and methods and at the core uses a combination of both ‘expert’ skills and socially differentiated local knowledge. It promotes interactive participation of stakeholders in generating and managing spatial
Figure 12: Participatory Community Hazard Mapping process
Data acquisition (GIS and RS)
Processing RS data
Preparation of community exercise
Identification of specific feature by
community
Post processing and spatial analysis
Output designing and production

62
SESS
IoN
9Flash Flood Risk Management – A Training of Trainers Manual
62
information and it uses information about specific landscapes to facilitate broadly-based decision-making processes that support effective communication and community advocacy (Rambaldi et al. 2006).
The participatory mapping method consists of two major steps: first, topographic maps, aerial photographs and satellite images are acquired and presented to the community as a ‘blank’ map to facilitate discussion and the identification of specific features. Second, the data derived through PRA methods are integrated using GIS and enhanced through additional spatial analysis. Participatory GIS is an emergent practice which is the result of a spontaneous merger of participatory learning and action (PLA) methods with geographic information technologies.
GIS has been widely used for the assessment of risk and the management of natural hazards by integrating it to manipulate information from different sources. It can be used to delineate the different flood risk zones in such a way that the information acquired can be communicated better and therefore more readily understood for decision making.
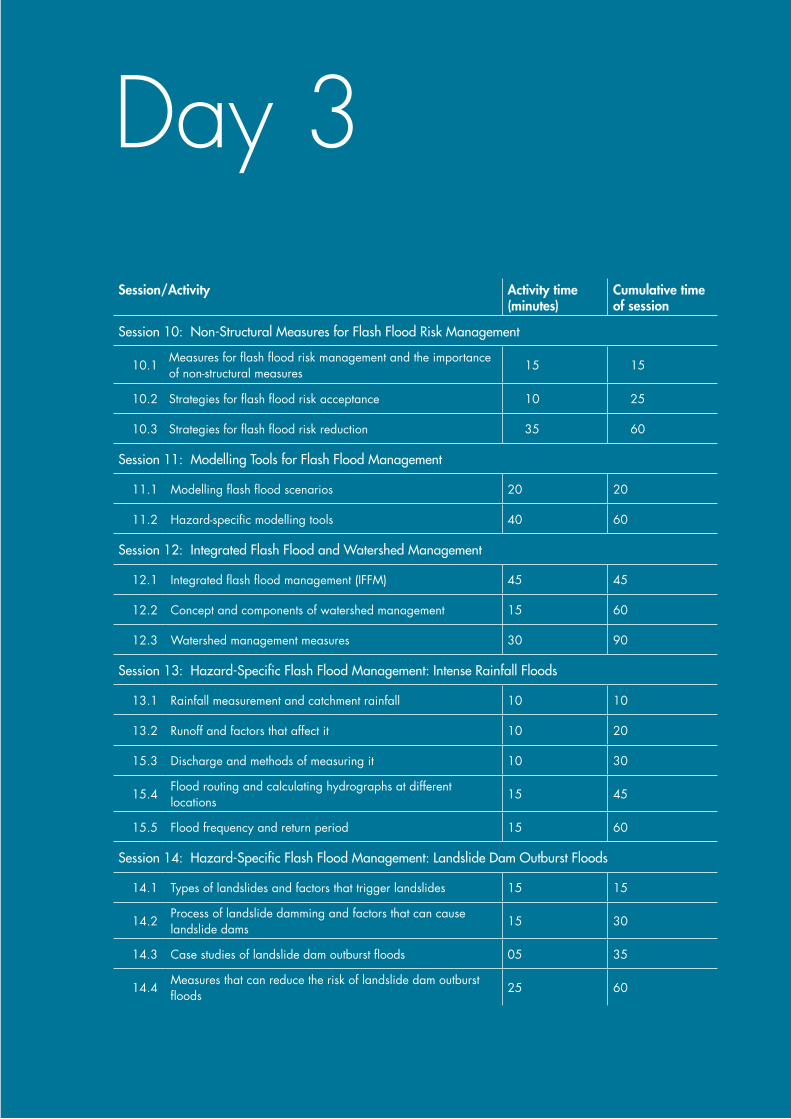
Day 3Session/Activity Activity time
(minutes)Cumulative time of session
Session10:Non-StructuralMeasuresforFlashFloodRiskManagement
10.1Measures for flash flood risk management and the importance of non-structural measures
15 15
10.2 Strategies for flash flood risk acceptance 10 25
10.3 Strategies for flash flood risk reduction 35 60
Session 11: Modelling Tools for Flash Flood Management
11.1 Modelling flash flood scenarios 20 20
11.2 Hazard-specific modelling tools 40 60
Session12:IntegratedFlashFloodandWatershedManagement
12.1 Integrated flash flood management (IFFM) 45 45
12.2 Concept and components of watershed management 15 60
12.3 Watershed management measures 30 90
Session13:Hazard-SpecificFlashFloodManagement:IntenseRainfallFloods
13.1 Rainfall measurement and catchment rainfall 10 10
13.2 Runoff and factors that affect it 10 20
15.3 Discharge and methods of measuring it 10 30
15.4Flood routing and calculating hydrographs at different locations
15 45
15.5 Flood frequency and return period 15 60
Session14:Hazard-SpecificFlashFloodManagement:LandslideDamOutburstFloods
14.1 Types of landslides and factors that trigger landslides 15 15
14.2Process of landslide damming and factors that can cause landslide dams
15 30
14.3 Case studies of landslide dam outburst floods 05 35
14.4Measures that can reduce the risk of landslide dam outburst floods
25 60
64
SESS
IoN
10
Flash Flood Risk Management – A Training of Trainers ManualSE
SSIo
N 1
0
Session 10 Non-Structural Measures for Flash Flood Risk Management
Time: 60 minutes
objectivesTo introduce the various non-structural measures available for flash flood risk management, including:
X Types of flash flood risk management X The importance of non-structural measures X Risk acceptance methods X Risk reduction methods
Activities
Activity 10.1: Measures for flash flood risk management and the importance of non-structural measures Time: 15 minutes
Step 1 Highlight the different flash flood risk management measures that can be used. Give a PowerPoint presentation explaining the different structural and non-structural measures that are available. Explain that a community can use both small-scale structural measures and non-structural measures. Emphasise that a combination of the two is the best way of achieving a good result.
Step 2 Explain that there are three phases to disaster risk management: pre-flood, during the flood, and post-flood.
Step 3 Explain that while a combination of structural and non-structural measures is best, a community with limited resources can achieve the greatest margin of safety by concentrating efforts on non-structural measures.
Activity 10.2: Strategies for flash flood risk acceptanceTime: 10 minutes
Step 1 Clarify what ‘risk acceptance’ means.
Step 2 Introduce the three key risk acceptance strategies. Discuss how risk acceptance strategies are implemented in different areas and mention in each case who responds and how they respond during emergencies.
Mention that emergency planning is based on government policy and on the existing institutional arrangements for flash flood and disaster risk management. Emergency planning usually has national, sub-national, and local level components complete with operational plans that assign roles and responsibilities.
Note to the trainer
65
Day 3SESSIo
N 10
SESSIoN
10
Activity 10.3: Strategies for flash flood risk reductionTime: 35 minutes
Step 1 Differentiate between the two types of strategies that can be used to reduce the risks associated with a flash flood: strategies aimed at prevention and strategies aimed at mitigation.
Step 2 Present the various preventive strategies for flash flood management.
Step 3 Clarify the concept of watershed. Discuss the social and natural components of watersheds; note that a watershed can consist of agricultural lands, forests, rangelands, barren lands, and/or floodplains. Draw attention to the fact that better agricultural practices, some rearranging of the agricultural calendar, reforestation, and regulation of grazing are some of the measures that can be used to prevent flash floods. The watershed approach will be discussed in Session 12.
Step 4 Open up a short question and answer session on possible mitigation strategies. Sum up the participants’ feedback and present the entire range of possible mitigation strategies.
Step 5 Discuss the need for hydrometeorological monitoring, analysis, and forecasting. Explain how a forecasting system works.
Step 6 Discuss how warnings are disseminated. Discuss efficient ways of disseminating information (see Box 9 in RM 10.3).
Step 7 Discuss how flash flood affected communities and individuals can access financial support. Some financial instruments available to cash-strapped flood victims are tax waivers, low interest loans (or waiver of loan interest), and compensation for maintaining structural interventions. Financial support can also be available sector-wise, such as from forest users’ or farmers’ groups.
Step 8 Discuss how different groups respond to flash floods. Finally, discuss some of the challenges to flash flood risk management (see Box 10 in RM 10.3).
When you discuss mitigation strategies, encourage the participants to share their knowledge and experience in reducing the intensity, frequency, and impact of flash floods in their regions. Present the strategies of discharge reduction, monitoring, warning, forecasting, and response system.
It is important to mention that warnings, forecasts, and the methods used to communicate them to local communities should be easy to understand. Warnings should be issued in the local languages and dialects of the major linguistic groups who live in the flood affected area.
Note to the trainer
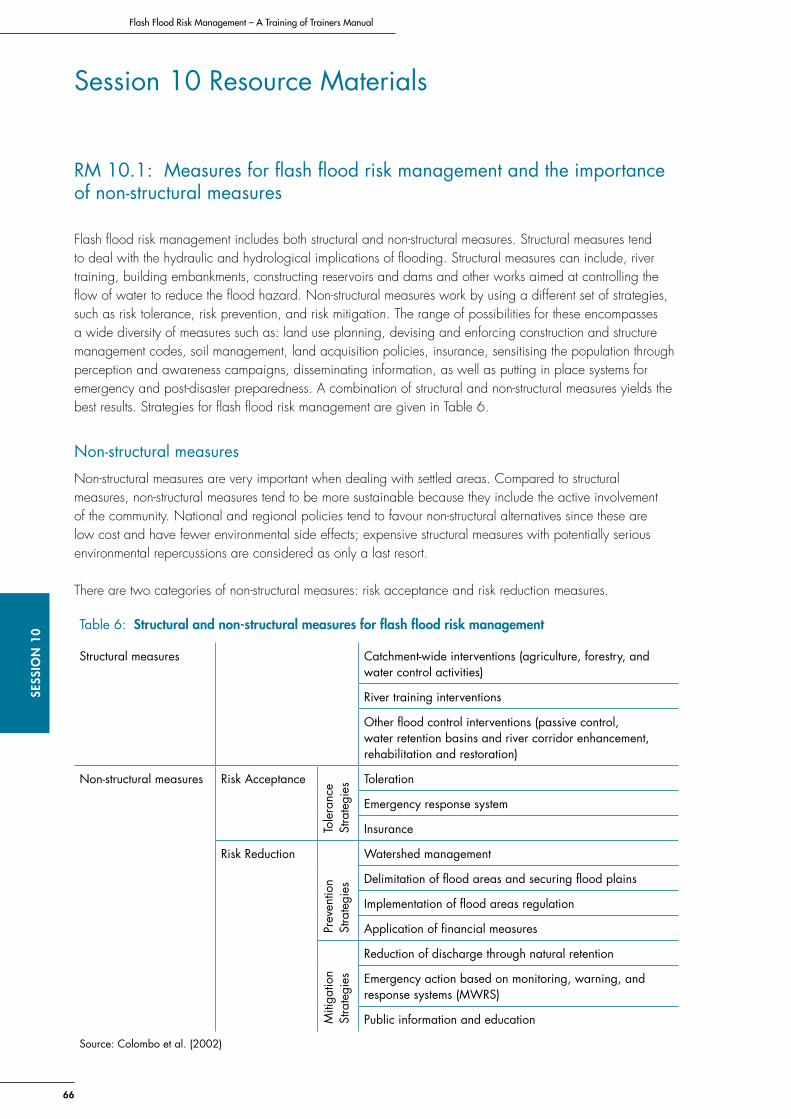
66
SESS
IoN
10
Flash Flood Risk Management – A Training of Trainers Manual
Session 10 Resource Materials
RM 10.1: Measures for flash flood risk management and the importance of non-structural measures
Flash flood risk management includes both structural and non-structural measures. Structural measures tend to deal with the hydraulic and hydrological implications of flooding. Structural measures can include, river training, building embankments, constructing reservoirs and dams and other works aimed at controlling the flow of water to reduce the flood hazard. Non-structural measures work by using a different set of strategies, such as risk tolerance, risk prevention, and risk mitigation. The range of possibilities for these encompasses a wide diversity of measures such as: land use planning, devising and enforcing construction and structure management codes, soil management, land acquisition policies, insurance, sensitising the population through perception and awareness campaigns, disseminating information, as well as putting in place systems for emergency and post-disaster preparedness. A combination of structural and non-structural measures yields the best results. Strategies for flash flood risk management are given in Table 6.
Non-structural measures
Non-structural measures are very important when dealing with settled areas. Compared to structural measures, non-structural measures tend to be more sustainable because they include the active involvement of the community. National and regional policies tend to favour non-structural alternatives since these are low cost and have fewer environmental side effects; expensive structural measures with potentially serious environmental repercussions are considered as only a last resort.
There are two categories of non-structural measures: risk acceptance and risk reduction measures.
Table 6: Structural and non-structural measures for flash flood risk management
Structural measures Catchment-wide interventions (agriculture, forestry, and water control activities)
River training interventions
Other flood control interventions (passive control, water retention basins and river corridor enhancement, rehabilitation and restoration)
Non-structural measures Risk Acceptance
Tole
ranc
e St
rate
gies
Toleration
Emergency response system
Insurance
Risk Reduction
Prev
entio
n St
rate
gies
Watershed management
Delimitation of flood areas and securing flood plains
Implementation of flood areas regulation
Application of financial measures
Miti
gatio
n St
rate
gies
Reduction of discharge through natural retention
Emergency action based on monitoring, warning, and response systems (MWRS)
Public information and education
Source: Colombo et al. (2002)

67
Day 3SESSIo
N 10
RM 10.2: Various strategies for flash flood risk acceptanceAcceptable risk, as defined in the United Nations International Strategy for Disaster Reduction, is the level of loss that a society or community considers acceptable within the given existing social, economic, political, cultural, technical, and environmental conditions (UNISDR 2009). There are three main types of risk acceptance strategies: toleration, emergency response systems, and insurance.
Toleration
Toleration of risk implies that a competent authority (local, regional, or national) accepts that flash floods can occur. In this case, it is very likely that the competent authority will accept the results of the risk assessment and not promote any activities to reduce the risk.
Emergency response systems
All emergency plans (regional, district, local) should be based on a national emergency plan so that emergency operations within a particular country will be carried out according to the same doctrine of civil protection and in a concerted manner. In general, the various public authorities implicated in the emergency plan will play roles related to their day-to-day responsibilities. They must prepare themselves according to the mission statement established in the emergency plan. To this end, each competent authority (regional, district, local) should have its own emergency plan, accompanied by an operations manual.
Insurance
Insurance against flash flood damage should be an integral part of risk acceptance. However, many countries in the HKH region still do not have this practice because of the high costs involved. Insurance companies have various policies that cover risk. Insurance policies that apply only at the local level are far too expensive both for the insurance companies and for the private and public subscribers.
RM 10.3: Various strategies for flash flood risk reductionRisk reduction is one of the main goals in flash flood management. It can be dealt with in two ways: through prevention strategies and through mitigation strategies.
Prevention strategies
Watershedmanagement. (See also Session 12.) Watershed management has both structural and non-structural components. Watershed management is cross-cutting and closely related both to the socio-economic status of the community and its development. Watershed management takes into consideration a number of basic principles related to runoff and erosion including soil, topography, land cover and use, farming practices, and floodplain zoning. This topic is covered in more detail later in the section on watershed management and the integrated flash flood management approach.
Financial measures. Financial support can be provided after a flash flood occurs in order to aid communities in dealing with the aftermath of the disaster. Usually this aid is administered through national or regional agencies. Financial measures can be � an economic contribution or the waiver of a financial burden such as: taxes, loan interest, or the
liquidation of a loan; � financial support to individuals and local communities for planning, constructing, and maintaining structural
interventions that can be shared among national, provincial, and local administrative levels, with the total amount divided among them (the share of the burden generally increasing progressively from local to provincial to national level);
� support to maintain and regulate hydraulic works of public interest (where the support is given to those who maintain it);
68
SESS
IoN
10
Flash Flood Risk Management – A Training of Trainers Manual
� subsidies targeted at reducing flash flood risks for the protection of forests, pastures, rangelands, and water bodies, including subsidies to community forestry user groups or to targeted farmers to encourage environmentally friendly farming practices.
Mitigation strategies
Mitigation strategies can reduce the intensity, frequency, and impacts of flash floods. These strategies can include the following.
Reducing discharge through natural retention. Various measures can be adopted to promote the natural retention of water. � Suitable areas for water retention need to be identified based on a land-use plan. If these areas fall
within farmers’ private properties, the farmers must be compensated for the loss they incur due to reduced farming revenues;
� Passive flood control measures (as advised by hydraulic engineering experts) can be incorporated into regional development programmes and construction plans so that retention basins can be identified and used for flash flood mitigation;
� Natural retention areas need to be identified and improved.
Monitoring,warning,andresponsesystems(MWRSs). MWRSs can contribute to the mitigation of flash floods and can be a very effective non-structural measures (IDNDR 1997; UNISDR 2005). MWRSs include systems for data collection, monitoring, and transmission; forecasting; warning; dissemination; disaster management; and response. When any of these components fails to function, the effectiveness of the whole system can be hampered.
� Data collection, monitoring, and other associated systems. Collection and monitoring of hydrometeorological data, such as rainfall, temperature, and stream flow, is essential since these data are used in simulations and forecasting that help planners prepare for future scenarios and choose between possible alternatives. Ground-based observation networks and satellite-based precipitation estimations are both good sources of data. Ground-based networks are a tried and true means of collecting rainfall and other meteorological data. Where ground-based observation networks are not available, satellite-based estimates of precipitation may be the only source of rainfall data. Combined satellite and ground-based rainfall estimates provide the best input for flash flood forecasting and early warning systems.
It is important that data be transmitted efficiently from the site to the centre where the data are analysed. The centre can then issue forecasts and warning messages to end users in a timely manner. A wide range of data transmission systems are available; these can include, for example, automated gauge readers that use VHF radio or telegraph to transmit data digitally to the centre.
� Forecasting systems. A forecasting system consists of models (e.g., hydrological, hydraulic) that can predict potential flash flood events; these models are used to closely follow the evolution of key parameters that could trigger a flood event. Forecasting can be very accurate, but if the computation time is too long they are not relvant. Flash floods, as their name implies, are rapid processes and typically the lead time is very short. Since time is of the essence, it is sometimes preferable to forego elaborate (and time consuming) forecasting models in favour of simpler models, such as flash flood guidance tables, which can give immediate results.
� Warningsystems. It is often difficult for the general public to grasp the meaning of quantitative flash flood forecasts; for general dissemination, qualitative warnings are much more useful (Box 9). An example of such a qualitative warning is the flash flood guidance; this is the volume of rainfall during a given time (e.g., 1 to 6 hours) over a given small catchment area. Even the general public can easily interpret this number knowing that rainfall in excess of the flash flood guidance number is considered a flash flood threat.
� Dissemination systems. Flood forecasting and warning information needs to be disseminated effectively. In the majority of cases, even good forecasts fail to prevent damage and loss of life because they are poorly
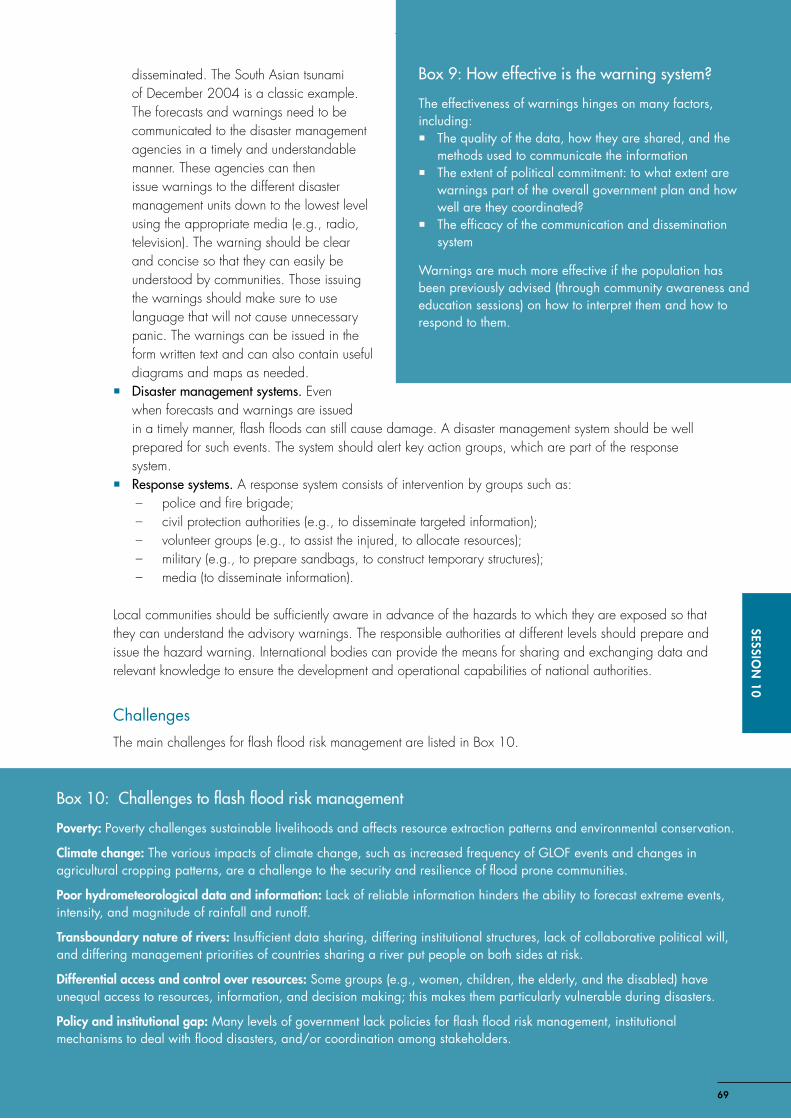
Box 10: Challenges to flash flood risk management
Poverty: Poverty challenges sustainable livelihoods and affects resource extraction patterns and environmental conservation.
Climate change: The various impacts of climate change, such as increased frequency of GLOF events and changes in agricultural cropping patterns, are a challenge to the security and resilience of flood prone communities.
Poor hydrometeorological data and information: Lack of reliable information hinders the ability to forecast extreme events, intensity, and magnitude of rainfall and runoff.
Transboundary nature of rivers: Insufficient data sharing, differing institutional structures, lack of collaborative political will, and differing management priorities of countries sharing a river put people on both sides at risk.
Differential access and control over resources: Some groups (e.g., women, children, the elderly, and the disabled) have unequal access to resources, information, and decision making; this makes them particularly vulnerable during disasters.
Policy and institutional gap: Many levels of government lack policies for flash flood risk management, institutional mechanisms to deal with flood disasters, and/or coordination among stakeholders.
69
SESSIoN
10
disseminated. The South Asian tsunami of December 2004 is a classic example. The forecasts and warnings need to be communicated to the disaster management agencies in a timely and understandable manner. These agencies can then issue warnings to the different disaster management units down to the lowest level using the appropriate media (e.g., radio, television). The warning should be clear and concise so that they can easily be understood by communities. Those issuing the warnings should make sure to use language that will not cause unnecessary panic. The warnings can be issued in the form written text and can also contain useful diagrams and maps as needed.
� Disaster management systems. Even when forecasts and warnings are issued in a timely manner, flash floods can still cause damage. A disaster management system should be well prepared for such events. The system should alert key action groups, which are part of the response system.
� Response systems. A response system consists of intervention by groups such as: – police and fire brigade; – civil protection authorities (e.g., to disseminate targeted information); – volunteer groups (e.g., to assist the injured, to allocate resources); – military (e.g., to prepare sandbags, to construct temporary structures); – media (to disseminate information).
Local communities should be sufficiently aware in advance of the hazards to which they are exposed so that they can understand the advisory warnings. The responsible authorities at different levels should prepare and issue the hazard warning. International bodies can provide the means for sharing and exchanging data and relevant knowledge to ensure the development and operational capabilities of national authorities.
Challenges
The main challenges for flash flood risk management are listed in Box 10.
Box 9: How effective is the warning system?
The effectiveness of warnings hinges on many factors, including: � The quality of the data, how they are shared, and the
methods used to communicate the information � The extent of political commitment: to what extent are
warnings part of the overall government plan and how well are they coordinated?
� The efficacy of the communication and dissemination system
Warnings are much more effective if the population has been previously advised (through community awareness and education sessions) on how to interpret them and how to respond to them.
70
SESS
IoN
11
Flash Flood Risk Management – A Training of Trainers Manual
Session 11 Modelling Tools for Flash Flood Management
Time: 60 minutes
objectivesTo introduce modelling tools for flash flood management, including:
X Tools that can be used to understand different flash flood scenarios X Hazard-specific modelling tools
Activities
Activity 11.1: Modelling flash flood scenariosTime: 20 minutes
Engage the class in a short question and answer session to see how familiar they are with the various types of software and modelling tools that are available for flash flood modelling.
Give a quick introduction to the two types of flash flood models, i.e., rainfall-runoff models and runoff routing (to the catchment) outlet models.
Activity 11.2: Hazard-specific modelling tools Time: 40 minutes
Step 1 Discuss satellite rainfall estimation and how it is helpful in hydrological modelling.
Step 2 Discuss computer software models that can be used to understand the various intense flash flood scenarios.
Step 3 Discuss the computer software models used to simulate dam failures.
71
Day 3SESSIo
N 11
Session 11 Resource Materials
RM 11.1: Modelling flash flood scenariosThere are two basic components to modelling flash flood scenarios. The first component is to convert rainfall into run-off and the second is to determine how that run-off will route to the catchment outlet.
Rainfall runoff model
Rainfall runoff models simulate the behaviour of watersheds, channels, and other water-control structures. They can help to predict runoff volumes, peak flows, and the timing of flows by simulating the behaviour of watersheds, channels, and reservoirs.
Flood routing model
Flood routing models compute the progressive time and shape of flood waves at successive points along a river. Flood routing is also called storage routing or stream-flow routing. Flood routing models are numerical methods used to estimate the movement of flood waves along a channel reach. They are based on knowing the discharge hydrograph at the upstream end and on knowing the hydraulic characteristics of the reach; they typically assume that there is no perturbation coming from the downstream.
RM 11.2: Hazard specific modelling tools for flash flood managementSatellite rainfall estimation
Precipitation is a crucial part of the hydrological cycle. The spatial and temporal variations of precipitation are enormous. An accurate global coverage of rainfall records is necessary to improve weather and climate predictions. Rain gauge data are available only from stations that are on land (where they are located mainly in densely populated areas), and little offshore information exists.
Rainfall can be estimated remotely, either from ground-based weather radars or from space-based satellites. The use of satellite-based rainfall estimates in the HKH region will enable a more thorough, accurate, and timely analysis of weather and climate-related phenomenon by providing accurate rainfall estimates. The use of satellite data can help to improve the analysis of precipitation which is currently interpolated solely from sparse rain gauge data. Satellite data can also be useful in agricultural and hydrological applications such as crop monitoring and stream flow modelling. Mitigation measures for weather-related disasters can always use more accurate and timely information in the decision-making process.
Why satellite rainfall estimation?
It has been a constant challenge to represent the spatial distribution and quantity of precipitation at the small scale throughout the region since only a sparse rain gauge network has been available. When rain gauge data are not available or sufficient, satellite data can be used to derive quantitative estimates of precipitation that are then fed into hydrological models which can forecast discharge. This is one way to overcome the problem of data scarcity in the HKH region.
Computer-based modelling tools and their capabilities
Geographicinformationsystems(GIS). A GIS captures, stores, analyses, manages, and presents data that are linked to location. In the simplest terms, GIS is the merging of cartography, statistical analysis, and database technology. GIS systems are used in many disciplines, such as geography, hydrology, climatology,
72
SESS
IoN
11
Flash Flood Risk Management – A Training of Trainers Manual
land surveying, utility management, natural resource management, photogrammetry, urban planning, emergency management, navigation, and most importantly, flash flood modelling and mapping, hazard mapping, and flash flood risk management.
HEC-GeoHMS. HEC-GeoHMS was developed by the United States Army Corps of Engineers’ Hydrologic Engineering Center (USACE/HEC) as a geo-spatial hydrology toolkit for engineers and hydrologists with limited GIS experience. The program allows users to visualise spatial information, document watershed characteristics, perform spatial analysis, delineate sub-basins and streams, construct inputs to hydrologic models, and it also assists them with report preparation. It creates hydrological inputs that can be used directly with the Hydrologic Modelling System, HEC-HMS.
HEC-GeoRAS. HEC-GeoRAS is an extension to be used with Arc View GIS (a general purpose geographic information system software program developed and copyrighted by the Environmental Systems Research Institute, Inc., (ESRI) Redlands, California. HEC-GeoRAS processes geospatial data for use with USACE/HEC’s River Analysis system (HEC-RAS, see below). The extension allows users to create HEC-RAS import files that contain geometric attribute data from existing digital terrain models (DTMs) and to process results obtained from HEC-GeoRAS.
HEC-HMS. HEC-HMS was developed by USACE/HEC and is capable of simulating the precipitation-runoff in dendritic watershed systems. It was designed to be applied in a wide range of geographic areas and to solve the widest possible range of problems, from large river basin water supplies and flood hydrology to small urban or natural watershed runoff. Hydrographs produced by this program are used directly or in conjunction with other software for studies of water availability, urban drainage, flow forecasting, future urbanisation impact, reservoir spillway design, flood damage reduction, floodplain regulation, and systems operations.
The program is a generalised modelling system that is capable of representing many different watersheds. A model of the watershed is constructed by separating the hydrologic cycle into manageable pieces and constructing boundaries around the watershed of interest. Any mass or energy flux in the cycle is simulated by a mathematical model. In most cases, the user can choose between several available models for each flux. Each mathematical model included in the program is tailored to a given set of environmental conditions. Choosing the correct model requires having both prior knowledge of the watershed and knowing what the goals of the hydrologic study are, as well as engineering judgment. The program features a completely integrated work environment including a database, data entry utilities, computation engine, and tools for reporting results. A graphical user interface allows the user seamless movement between the different parts of the program. Program functionality and appearance are the same across all supported platforms.
NWSBreach. The NWS Breach program was developed, in 1988, by Professor DL Fread, Senior Hydrologist with the Hydrologic Research Laboratory, United States National Weather Service. This program mathematically models the breaching of an earthen dam either by overtopping or by a piping failure. The program predicts the dam-breach characteristics, such as size, shape, and time of formation, and graphs the breach outflow hydrograph.
BOSS DAMBRK. BOSS DAMBRK is an enhanced version of the NWS DAMBRK model. This software can be used to analyse dam and bridge failures, storage effects, and floodplain overbank flow and flood wave attenuation. It is used for one-dimensional hydrodynamic flood routing, dam safety analysis, and reservoir spillway analysis. The program can take into account reservoir inflow, breach formation, spillway and turbine flow, downstream tail water elevations, valley storage, frictional resistance and lateral inflows and outflows. It estimates flood wave travel time, time to flood stage, time to peak elevation, and the corresponding water surface elevations.
HEC-RAS. HEC-RAS was developed by USACE/HEC and is capable of performing one-dimensional steady and unsteady flow water surface profile calculations.

73
Day 3SESSIo
N 11
GeospatialStreamFlowModel(GeoSFM). GeoSFM is a semi-distributed hydrological model for wide-area hydrology analysis. It uses globally available terrain, soil and land cover data, and satellite derived estimates of daily rainfall. The model outputs include stream flow and flood hazard maps.
74
SESS
IoN
12
Flash Flood Risk Management – A Training of Trainers Manual
Session 12 Integrated Flash Flood and Watershed Management
Time: 90 minutes
objectives To introduce the concepts of integrated flash flood and watershed management, including:
X An integrated approach to flash flood management X The major components of watershed management X Watershed management measures
Activities
Activity 12.1: Integrated flash flood management (IFFM)Time: 45 minutes
Step 1 Discuss the traditional approaches to flash flood management.
Step 2 Discuss the shifting paradigm in flood management.
Step 3 Discuss the concept and objectives of IFFM.
Step 4 Discuss the key elements of IFFM in the context of integrated water resource management (see Box 11 in RM 12.1)
Engage the class in a quick question and answer session to help you assess how much they have understood about IFFM and what it aims to achieve.
Reiterate that IFFM aims to: � support sustainable development by balancing development
needs and flood risk; � support livelihood security and reduce vulnerability by
ensuring that different activities of poverty alleviation are incorporated into the planning;
� use environmental preservation as a means of flood prevention;
� reduce the number of lives lost.
Also reiterate that IFFM is an attempt to integrate: � land and water management; � upstream and downstream concerns; � structural and non-structural measures; � short-term and long-term strategies; � local- and basin-level measures; � top-down and bottom-up decision making; � development needs with ecological and economic concerns; � institutions with different functions.
Note to the trainer
75
Day 3SESSIo
N 12
Activity 12.2: Concept and components of watershed managementTime: 15 minutes
Step 1 Define what a watershed is. Show the map of a water basin and point out the major rivers, the minor rivers, and the contour lines. Alternatively, clarify the concept of a watershed by drawing a map on the board. Remember to include major rivers, minor rivers, and contour lines. On either map, draw a line around the basin boundary and indicate the different watersheds and sub watersheds. Explain that a major water basin can have several watersheds.
Step 2 Present the major components of a watershed.
Step 3 Present the benefits of watershed management: � Improved water availability � Improved water quality � Reduced risks of natural disasters � Higher crop yields � Increased biomass cover � Improved soil quality � Increased possibilities for income generating activities � Improved habitats for flora and fauna and, therefore, improved biodiversity
Activity 12.3: Watershed management measuresTime: 30 minutes
Step 1 Present the major watershed management measures, such as land-use management, agricultural remodelling, watercourse maintenance, and bioengineering.
Step 2 Discuss the major activities of land-use management and how they apply in different land types (e.g., agricultural land, forests, pastureland, and settlements).
Step 3 Discuss the various methods of agricultural remodelling such as multiple cropping and modified cropping patterns. Inform participants that information on the extent and timing of floods in a given area can be collected using various participatory rural appraisal (PRA) tools. The information gathered can be used to generate an agricultural ‘calendar’. With this information in hand, farmers can be advised on how to time their cultivation calendar so as to avoid the major flood periods. They can also be advised on what other suitable crops can be planted in the flood-free period.
Step 4 Discuss watercourse maintenance and floodplain management that includes flood hazard mapping with zoning areas on both sides of rivers. Mention that it shows the different zones with various levels of flood hazard to support management intervention: watercourse maintenance can also be done using social hazard mapping technique with the support of GIS.
Step 5 Explain the role of bioengineering in helping to stabilise and protect slopes and minimise runoff. Discuss how trees, grass, shrubs, and other vegetation can be used alone or in combination with small-scale structural measures.
Local people usually know most of the watershed management measures since these are based on local knowledge and common practices. Some of this knowledge and these practices can be shared with and replicated in other places if they are sustainable. In addition to local knowledge, simple scientific techniques such as bioengineering, techniques of jute netting, and small structural measures can be implemented. Watershed management should consist of both structural and non-structural measures.
Note to the trainer
76
SESS
IoN
12
Flash Flood Risk Management – A Training of Trainers Manual
Session 12 Resource Materials
RM 12.1: Integrated flash flood managementEven though floods provide important ecosystem services, they have traditionally been viewed as negative phenomena and their positive attributes have been largely ignored. Accordingly, flood management has largely been problem driven, with most activities implemented after a severe flood. Different structural, non-structural, physical, and institutional interventions are possible at different phases, i.e., before, during, and after the disaster. Flood management often conflicts with activities of other sectors, such as construction, agriculture, and water resource management. Traditional approaches to flood management have focused mainly on reducing runoff by controlling water at the source, storing runoff, enhancing the capacity of the river, putting adequate separation between the river and the population, emergency management, and flood recovery. The emphasis has been on control rather than on management. Flood control measures have usually been planned in isolation from other development, they have commonly been reactive rather than proactive, they have focused on structural measures, sought solutions from mono-disciplines, and integrated flood management policies have been neglected (for details see WMO 2009).
Climate change projections suggest that in future there will be an increase in the frequency and magnitude of flash floods, and that there will be a wider distribution of flood events. A new concept of flood management emphasises the need to find ways of making life sustainable even in flash flood prone areas and floodplains, even when there is considerable risk to life and property. The IFFM approach integrates water resource management, land-use management, and hazard management; it changes the flood management paradigm from defensive to pro-active, from ad-hoc to integrated flood management. It focus on managing and living with floods, balancing floods for sustainable development, and approaching the decision-making process differently by learning to manage risk (WMO 2009).
According to the Global Water Partnership (GWP), integrated water resources management (IWRM) is a process that promotes the coordinated development and management of water, land, and related resources to maximise the resultant economic and social welfare equitably without compromising the sustainability of vital ecosystems (Global Water Partnership Technical Advisory Committee 2000, cited in WMO 2009). Sustainable and effective management of water resources demands a holistic approach, linking social and economic development with the protection of natural ecosystems and appropriate management links between land and water uses.
Integrated flash flood management (IFFM) promotes an integrated approach (Box 11); it advocates the integrated development of land and water resources in a river basin within the context of IWRM, and it aims at maximising the benefits of using floodplains and minimising loss of life from flooding. Furthermore, it focuses on environmental conservation and sustainable development.
IFFM has four major components: water resources management, water quality management, hazard management, and land use management (Figure 13). Integrated flash flood management recognises the river basin as a dynamic system in which there are many interactions and fluxes between land and water bodies. In IFFM the starting point is a vision of what the river basin should be. Incorporating a sustainable livelihood
Box 11: Major elements of IFFM
� Managing risk � Seeing floods are part of the water cycle � Taking a multi-hazard approach; flash floods
give rise to ancillary hazards � Using the river basin as a planning unit � Looking at all aspects - interdisciplinary � A participatory approach involving the whole
community
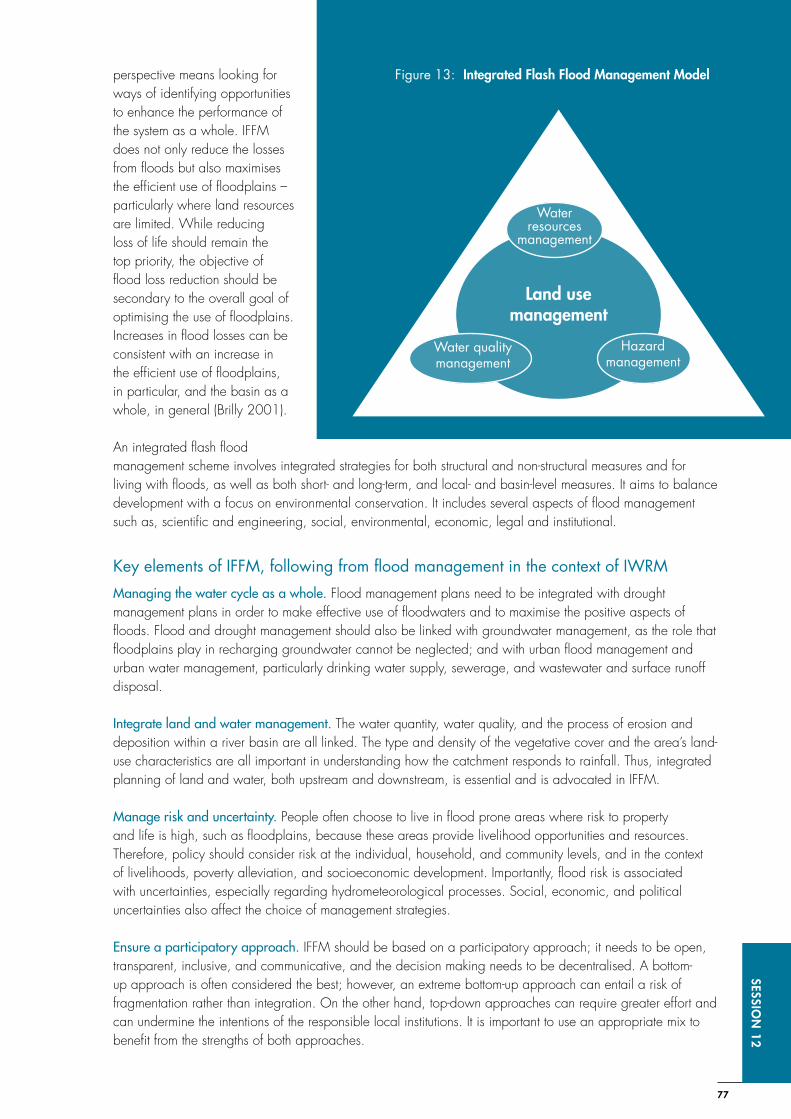
77
Day 3SESSIo
N 12
Water resources
management
Water quality management
Hazard management
Land use management
Figure 13: Integrated Flash Flood Management Modelperspective means looking for ways of identifying opportunities to enhance the performance of the system as a whole. IFFM does not only reduce the losses from floods but also maximises the efficient use of floodplains – particularly where land resources are limited. While reducing loss of life should remain the top priority, the objective of flood loss reduction should be secondary to the overall goal of optimising the use of floodplains. Increases in flood losses can be consistent with an increase in the efficient use of floodplains, in particular, and the basin as a whole, in general (Brilly 2001).
An integrated flash flood management scheme involves integrated strategies for both structural and non-structural measures and for living with floods, as well as both short- and long-term, and local- and basin-level measures. It aims to balance development with a focus on environmental conservation. It includes several aspects of flood management such as, scientific and engineering, social, environmental, economic, legal and institutional.
Key elements of IFFM, following from flood management in the context of IWRM
Managing the water cycle as a whole. Flood management plans need to be integrated with drought management plans in order to make effective use of floodwaters and to maximise the positive aspects of floods. Flood and drought management should also be linked with groundwater management, as the role that floodplains play in recharging groundwater cannot be neglected; and with urban flood management and urban water management, particularly drinking water supply, sewerage, and wastewater and surface runoff disposal.
Integrate land and water management. The water quantity, water quality, and the process of erosion and deposition within a river basin are all linked. The type and density of the vegetative cover and the area’s land-use characteristics are all important in understanding how the catchment responds to rainfall. Thus, integrated planning of land and water, both upstream and downstream, is essential and is advocated in IFFM.
Manage risk and uncertainty. People often choose to live in flood prone areas where risk to property and life is high, such as floodplains, because these areas provide livelihood opportunities and resources. Therefore, policy should consider risk at the individual, household, and community levels, and in the context of livelihoods, poverty alleviation, and socioeconomic development. Importantly, flood risk is associated with uncertainties, especially regarding hydrometeorological processes. Social, economic, and political uncertainties also affect the choice of management strategies.
Ensureaparticipatoryapproach. IFFM should be based on a participatory approach; it needs to be open, transparent, inclusive, and communicative, and the decision making needs to be decentralised. A bottom-up approach is often considered the best; however, an extreme bottom-up approach can entail a risk of fragmentation rather than integration. On the other hand, top-down approaches can require greater effort and can undermine the intentions of the responsible local institutions. It is important to use an appropriate mix to benefit from the strengths of both approaches.
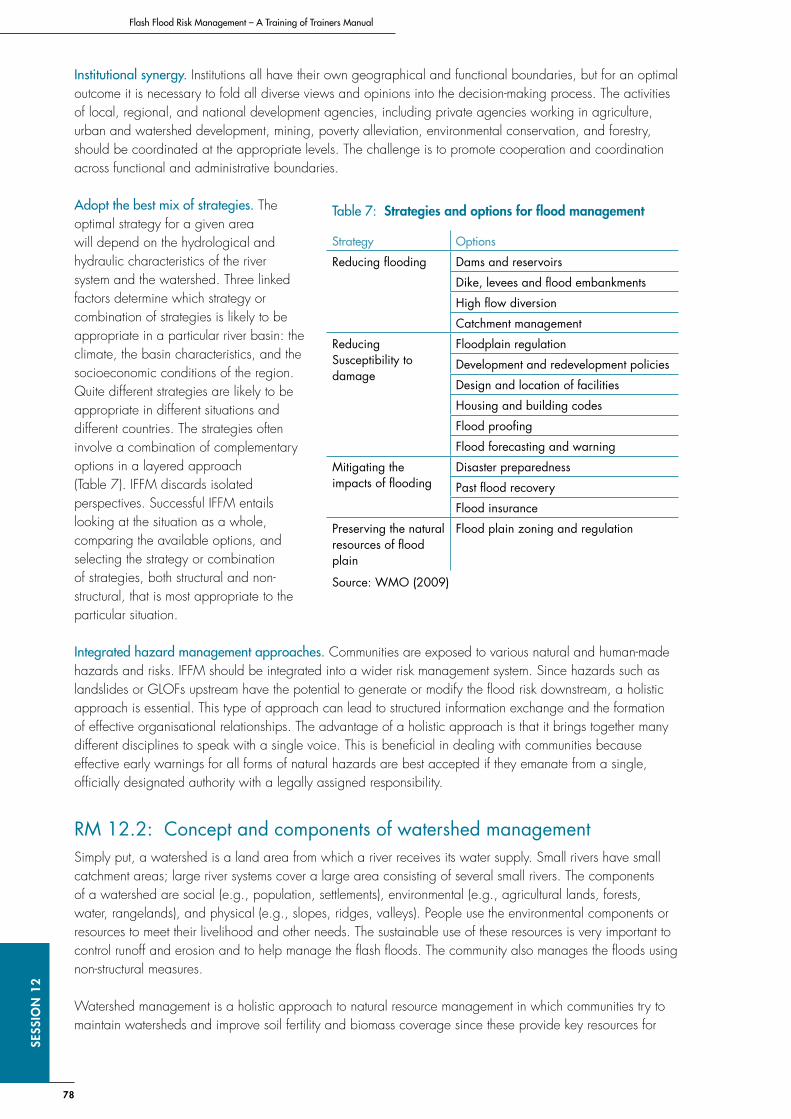
78
SESS
IoN
12
Flash Flood Risk Management – A Training of Trainers Manual
Institutional synergy. Institutions all have their own geographical and functional boundaries, but for an optimal outcome it is necessary to fold all diverse views and opinions into the decision-making process. The activities of local, regional, and national development agencies, including private agencies working in agriculture, urban and watershed development, mining, poverty alleviation, environmental conservation, and forestry, should be coordinated at the appropriate levels. The challenge is to promote cooperation and coordination across functional and administrative boundaries.
Adopt the best mix of strategies. The optimal strategy for a given area will depend on the hydrological and hydraulic characteristics of the river system and the watershed. Three linked factors determine which strategy or combination of strategies is likely to be appropriate in a particular river basin: the climate, the basin characteristics, and the socioeconomic conditions of the region. Quite different strategies are likely to be appropriate in different situations and different countries. The strategies often involve a combination of complementary options in a layered approach (Table 7). IFFM discards isolated perspectives. Successful IFFM entails looking at the situation as a whole, comparing the available options, and selecting the strategy or combination of strategies, both structural and non-structural, that is most appropriate to the particular situation.
Integrated hazard management approaches. Communities are exposed to various natural and human-made hazards and risks. IFFM should be integrated into a wider risk management system. Since hazards such as landslides or GLOFs upstream have the potential to generate or modify the flood risk downstream, a holistic approach is essential. This type of approach can lead to structured information exchange and the formation of effective organisational relationships. The advantage of a holistic approach is that it brings together many different disciplines to speak with a single voice. This is beneficial in dealing with communities because effective early warnings for all forms of natural hazards are best accepted if they emanate from a single, officially designated authority with a legally assigned responsibility.
RM 12.2: Concept and components of watershed managementSimply put, a watershed is a land area from which a river receives its water supply. Small rivers have small catchment areas; large river systems cover a large area consisting of several small rivers. The components of a watershed are social (e.g., population, settlements), environmental (e.g., agricultural lands, forests, water, rangelands), and physical (e.g., slopes, ridges, valleys). People use the environmental components or resources to meet their livelihood and other needs. The sustainable use of these resources is very important to control runoff and erosion and to help manage the flash floods. The community also manages the floods using non-structural measures.
Watershed management is a holistic approach to natural resource management in which communities try to maintain watersheds and improve soil fertility and biomass coverage since these provide key resources for
Table 7: Strategies and options for flood management
Strategy Options
Reducing flooding Dams and reservoirs
Dike, levees and flood embankments
High flow diversion
Catchment management
Reducing Susceptibility to damage
Floodplain regulation
Development and redevelopment policies
Design and location of facilities
Housing and building codes
Flood proofing
Flood forecasting and warning
Mitigating the impacts of flooding
Disaster preparedness
Past flood recovery
Flood insurance
Preserving the natural resources of flood plain
Flood plain zoning and regulation
Source: WMO (2009)
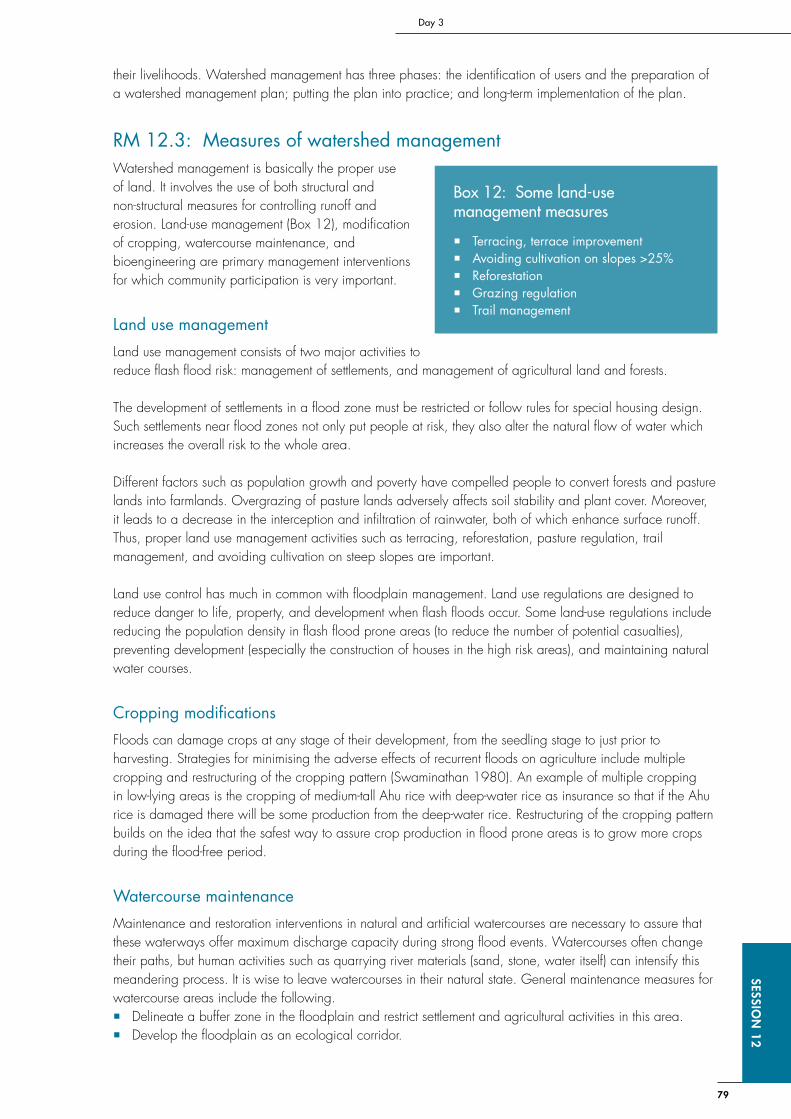
79
Day 3SESSIo
N 12
their livelihoods. Watershed management has three phases: the identification of users and the preparation of a watershed management plan; putting the plan into practice; and long-term implementation of the plan.
RM 12.3: Measures of watershed managementWatershed management is basically the proper use of land. It involves the use of both structural and non-structural measures for controlling runoff and erosion. Land-use management (Box 12), modification of cropping, watercourse maintenance, and bioengineering are primary management interventions for which community participation is very important.
Land use management
Land use management consists of two major activities to reduce flash flood risk: management of settlements, and management of agricultural land and forests.
The development of settlements in a flood zone must be restricted or follow rules for special housing design. Such settlements near flood zones not only put people at risk, they also alter the natural flow of water which increases the overall risk to the whole area.
Different factors such as population growth and poverty have compelled people to convert forests and pasture lands into farmlands. Overgrazing of pasture lands adversely affects soil stability and plant cover. Moreover, it leads to a decrease in the interception and infiltration of rainwater, both of which enhance surface runoff. Thus, proper land use management activities such as terracing, reforestation, pasture regulation, trail management, and avoiding cultivation on steep slopes are important.
Land use control has much in common with floodplain management. Land use regulations are designed to reduce danger to life, property, and development when flash floods occur. Some land-use regulations include reducing the population density in flash flood prone areas (to reduce the number of potential casualties), preventing development (especially the construction of houses in the high risk areas), and maintaining natural water courses.
Cropping modifications
Floods can damage crops at any stage of their development, from the seedling stage to just prior to harvesting. Strategies for minimising the adverse effects of recurrent floods on agriculture include multiple cropping and restructuring of the cropping pattern (Swaminathan 1980). An example of multiple cropping in low-lying areas is the cropping of medium-tall Ahu rice with deep-water rice as insurance so that if the Ahu rice is damaged there will be some production from the deep-water rice. Restructuring of the cropping pattern builds on the idea that the safest way to assure crop production in flood prone areas is to grow more crops during the flood-free period.
Watercourse maintenance
Maintenance and restoration interventions in natural and artificial watercourses are necessary to assure that these waterways offer maximum discharge capacity during strong flood events. Watercourses often change their paths, but human activities such as quarrying river materials (sand, stone, water itself) can intensify this meandering process. It is wise to leave watercourses in their natural state. General maintenance measures for watercourse areas include the following. � Delineate a buffer zone in the floodplain and restrict settlement and agricultural activities in this area. � Develop the floodplain as an ecological corridor.
Box12:Someland-usemanagement measures
� Terracing, terrace improvement � Avoiding cultivation on slopes >25% � Reforestation � Grazing regulation � Trail management
80
SESS
IoN
12
Flash Flood Risk Management – A Training of Trainers Manual
� Do not interfere with the natural course of water. � Maintain watercourse reaches that are still in their natural state. � Protect specific habitats. � Undertake structural interventions to improve ecological functions. Activate old branches and create
biotopes where necessary to comply with the ideal conditions established by environmental models. � Undertake flood damage prevention measures. � Take measures to counter harmful local influences that could be detrimental to the whole system, such as
erosion and sedimentation. � Maintain natural depressions that act as natural retention areas during floods.
Bioengineering
Bioengineering is the integration of vegetative methods with simple engineering practices. It can be very effective for watershed management using local resources (Bhatta et al. 1999). For example, bioengineering can be used to stabilise mountain slopes. Commonly practiced bioengineering techniques that can be used to stabilise slopes and to help minimise runoff include: planting trees, shrubs, and grasses (Li 1999; Wagley 1999). These can be planted on degraded slopes, either alone or in combination where together a dense network of roots in the soil and a canopy overhead helps to protect the slope from erosion, which in turn prevents landslides that can dam rivers. The type of vegetation that should be planted depends on the purpose, site condition, and availability of resources.
Bioengineering measures include the following.
� Planting woody vegetation along the contours to trap soil particles and debris moving down the slope. � Seeding grass, trees, and shrubs directly on site, either alone or in combination. Seeds can be broadcast
to cover large areas in a short time at low cost. This method can be used on steep, rocky, and unstable slopes where seedlings and cuttings cannot be planted directly.
� Planting bamboo or broom grass (rooted culm cuttings, rhisomes, or wild seedlings) to stabilise slopes. � Wattling. Bundles of live branches with buds are put into trenches along contours and are covered with a
thin layer of soil. When the branches put out roots and shoots, a strong vegetative barrier is formed that is effective in retaining the soil and stopping its movement down the slope.
� Creating brushwood check dams of bamboo and wood to stabilise gullies on slopes. � Vegetated riprap. Side slopes of gullies and gully beds can be protected by constructing dry stone walls
and sowing or planting grass in the gaps between the stones to reinforce the toe walls and gully beds. � Constructing loose stone and gabion check dams to stabilise slopes. After the construction of the check
dam, seedlings of trees, shrubs, and grasses are planted either separately or in combination on the gully heads, side slopes, and gully beds, and in and around the structure for reinforcement.
� Usingjutenettingto protect grass slips or seedlings planted on slopes during their early growing period. Later, once the plants are established and the netting is no longer needed, the jute decomposes into the soil.
Watersheds consist of both upstream and downstream components. For sustainable development and risk management, an integrated watershed management approach is essential. An integrated approach can introduce stall feeding to help reduce overgrazing of pasture, for example, and/or introduce biogas or solar power for household activities to reduce dependence on natural resources. Good governance, transparency, and unity in a community are fundamental requirements of proper watershed management.
81
Day 3SESSIo
N 13
Session 13 Hazard-Specific Flash Flood Management: Intense Rainfall Floods
Time: 60 minutes
objectives To introduce the characteristics of intense rainfall floods and to introduce forecasting as a tool for flash flood risk management, including
X The methods used to measure rainfall and to estimate catchment rainfall X The correlation between rainfall and runoff and the factors that affect catchment runoff X Discharge and the methods used to measure discharge X Flood routing and the methods used to determine hydrographs X Flood frequency and return period
Activities
Activity 13.1: Rainfall measurement and catchment rainfallTime: 10 minutes
Step 1 Present and discuss the various types of precipitation (e.g., rain, snow, hail). Explain how rainfall is measured and recorded.
Step 2 Distinguish between ‘total rainfall’ and rainfall intensity. Discuss how knowing the intensity of the rainfall over a short period is more important for predicting flash floods than knowing the total rainfall over a longer period.
Step 3 Discuss how data from a rain gauge can be used to estimate rainfall at the catchment level using methods such as the arithmetic average, the Theissen polygon method, and the isohyetal method.
Step 4 Discuss the importance of rainfall measurements for flash flood forecasting and preparedness.
Activity 13.2: Runoff and factors that affect itTime: 10 minutes
Define runoff and peak runoff rates and discuss the factors that affect runoff. Discuss how rainfall and runoff are related.
Activity 13.3: Discharge and methods of measuring itTime: 15 minutes
Define discharge and explain how it is measured. Explain what a rating curve is.
Flash Flood Risk Management: A Training of Trainers Manual
82
SESS
IoN
13
Activity 13.4: Flood routing and calculating hydrographs at different locationsTime: 15 minutes
Step 1 Discuss the concept of flood routing and differentiate between hydrologic and hydraulic routing. Explain why flood routing is important for flash flood management.
Step 2 Discuss the various types of routing methods. Assign a simple exercise on flood routing where the participants have to calculate flow values at different times and locations. (See Box 13 in RM 13.4 for the exercise.)
Activity 13.5: Flood frequency and return periodTime: 10 minutes
Step 1 Define flood frequency and return period, and discuss the method used to determine return periods.
Step 2 Discuss why return period is an important parameter for flash flood management.
83
Day 3SESSIo
N 13
Session 13 Resource Materials
RM 13.1: Rainfall measurement and catchment rainfallRainfall measurement
Rainfall is a main source of water supply; other forms of precipitation include snow, hail, sleet, mist, dew, and fog. It is important to measure rainfall in order to be able to forecast and prepare for flash floods. In the case of riverine floods, the total amount of rainfall during a period of time is important. The total amount of precipitation can be measured using simple rain gauges. However, for flash floods, the total amount is less important than the intensity of the rainfall, since high-intensity rainfall for even for a short period of time can cause a flash flood. The intensity of rainfall cannot easily be determined by manual rain gauges. More appropriate are recording-type rain gauges that give a continuous record of rainfall which can be resolved into desired time intervals; examples of these are tipping bucket or siphon-type gauges.
A rain gauge gives a point measurement at a particular location, but intense rainfall can be also spatially variable, particularly in mountain areas. A dense network of rain gauges is needed to obtain a reliable spatial survey of rainfall in a catchment. If it is not possible to deploy a large number of gauges then, it is important to identify the key locations in the catchment that can provide the most crucial information for flash flood risk management.
Catchment rainfall
For flash flood risk management measures such as forecasting or modelling, point data from rain gauges alone are not sufficient. The data must be transformed into spatial data or area-averaged data for the catchment. Several methods can be used to calculate area averages. The simplest is to calculate the arithmetic average of rainfall in each rain gauge; however, this method cannot capture spatial variability and is seldom used.
A simple method is the Theissen polygon method, which uses an average based on the assumption that a gauge best represents the rainfall in the area nearest to it. The resulting polygons represent the areas closest to each gauge. The average rainfall derived from the Theissen polygon method is remarkably similar to the arithmetic average in this case, but generally these two methods give different results.
A more accurate method for calculating catchment rainfall is the isohyetal method. In this method, isohyets or lines of equal rainfall are drawn in the same way that contour lines are drawn on an elevation map. There are various computer software models available that use sophisticated algorithms to generate isohyets. Some incorporate terrain characteristics in generating the map. Raster maps of rainfall distribution over an area can also be generated. Raster maps represent continuous rainfall fields over the area of interest. As needed, average rainfall at different spatial scales can be calculated from the raster maps.
RM 13.2: Runoff and factors that affect itRunoff
The rainfall in a catchment is stored either on the surface or as moisture in the soil; part of it is lost by evaporation and part by transpiration. Only some of the rainfall, known as excess rainfall or effective rainfall, contributes to runoff from the catchment. In order to estimate the size of the flood that can be generated by a given amount of rainfall, the runoff must be calculated.
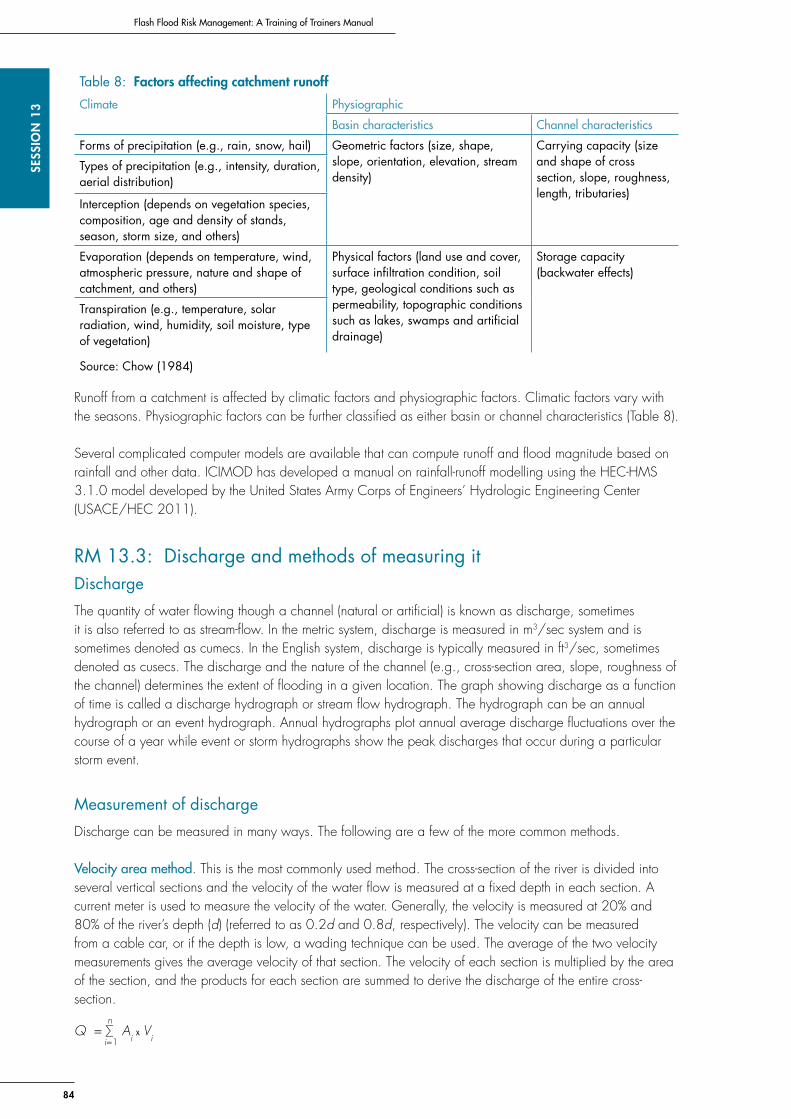
Flash Flood Risk Management: A Training of Trainers Manual
84
SESS
IoN
13
Runoff from a catchment is affected by climatic factors and physiographic factors. Climatic factors vary with the seasons. Physiographic factors can be further classified as either basin or channel characteristics (Table 8).
Several complicated computer models are available that can compute runoff and flood magnitude based on rainfall and other data. ICIMOD has developed a manual on rainfall-runoff modelling using the HEC-HMS 3.1.0 model developed by the United States Army Corps of Engineers’ Hydrologic Engineering Center (USACE/HEC 2011).
RM 13.3: Discharge and methods of measuring itDischarge
The quantity of water flowing though a channel (natural or artificial) is known as discharge, sometimes it is also referred to as stream-flow. In the metric system, discharge is measured in m3/sec system and is sometimes denoted as cumecs. In the English system, discharge is typically measured in ft3/sec, sometimes denoted as cusecs. The discharge and the nature of the channel (e.g., cross-section area, slope, roughness of the channel) determines the extent of flooding in a given location. The graph showing discharge as a function of time is called a discharge hydrograph or stream flow hydrograph. The hydrograph can be an annual hydrograph or an event hydrograph. Annual hydrographs plot annual average discharge fluctuations over the course of a year while event or storm hydrographs show the peak discharges that occur during a particular storm event.
Measurement of discharge
Discharge can be measured in many ways. The following are a few of the more common methods.
Velocity area method. This is the most commonly used method. The cross-section of the river is divided into several vertical sections and the velocity of the water flow is measured at a fixed depth in each section. A current meter is used to measure the velocity of the water. Generally, the velocity is measured at 20% and 80% of the river’s depth (d) (referred to as 0.2d and 0.8d, respectively). The velocity can be measured from a cable car, or if the depth is low, a wading technique can be used. The average of the two velocity measurements gives the average velocity of that section. The velocity of each section is multiplied by the area of the section, and the products for each section are summed to derive the discharge of the entire cross-section. nQ = ∑ A
i x V
i
i=1
Table 8: Factors affecting catchment runoff
Climate Physiographic
Basin characteristics Channel characteristics
Forms of precipitation (e.g., rain, snow, hail) Geometric factors (size, shape, slope, orientation, elevation, stream density)
Carrying capacity (size and shape of cross section, slope, roughness, length, tributaries)
Types of precipitation (e.g., intensity, duration, aerial distribution)
Interception (depends on vegetation species, composition, age and density of stands, season, storm size, and others)
Evaporation (depends on temperature, wind, atmospheric pressure, nature and shape of catchment, and others)
Physical factors (land use and cover, surface infiltration condition, soil type, geological conditions such as permeability, topographic conditions such as lakes, swamps and artificial drainage)
Storage capacity (backwater effects)
Transpiration (e.g., temperature, solar radiation, wind, humidity, soil moisture, type of vegetation)
Source: Chow (1984)

85
Day 3SESSIo
N 13
whereQ = dischargeA = area of section iV = velocity of section i
Float method. The velocity can also be calculated by a simpler method if the depth is shallow and high accuracy is not required. Two markers are fixed on the stream bank at the same distance upstream and downstream from the cross-section where the discharge measurement is being conducted. The distance between the markers is measured and the cross-sectional area of the stream at the point of interest is measured. A floating object such as a cork or wooden block is released at the centre of the stream. The times at which the float crosses the first and the second marker are noted.
The velocity of the river is given by: dV = T2
– T1
where T1 and T2 are the times recorded at markers 1 and 2, respectively, and d is the distance between the two markers.
Such float measurements are conducted several times and the mean velocity, Vm is calculated. The discharge at the cross-section of interest is given by:
Q = A x Vm
where A is the cross-sectional area of the stream.
Dilution method. This method is particularly appropriate for mountain streams where due to the gradients, the turbulence is high and measurements by the current meter method are not possible. A tracer of known concentration is put in the water at the upstream end of the specified reach and its concentration is monitored in the downstream reach. The distance should be adequate to ensure thorough mixing of the tracer in the water and there should not be an inlet, outflow, or stagnant water zone within the reach. The tracer can be common salt or a fluorescent dye, which is not readily absorbed either by the bed materials of the stream or the suspended sediment. The tracer can be injected into the stream instantaneously or in a continuous manner at a constant rate. For continuous injection a special apparatus called a Mariotte bottle is used. The concentration at the downstream end is determined by collecting a water sample and analysing it using appropriate techniques. If a salt tracer is used, a conductivity meter is used to derive the concentration, while for a dye tracer, a fluorimeter is used. The discharge Q is calculated by using following equation:
C1 – C
2Q = q x
C2 – C0
where q is the injection rate of the tracer and C1, C2, and C0 are the concentrations of the tracer during injection, at the downstream end (sampling point), and in the background concentration of the stream water, respectively.
Slope area method. This method is particularly suitable for post-flood investigations; it is used to estimate the peak discharge of a flash flood after the flood has passed. This is an indirect method of obtaining discharge in streams; the velocity is not measured, but instead it is calculated using the Manning uniform flow equation. To compute the velocity, the area, the wetted perimeter, the channel slope, and the roughness of the reach where the discharge is to be determined must be known. The area, the perimeter, and the slope are measured and the roughness coefficient is estimated as accurately as possible. The Manning equation is:
21
32
1 SRnV xx=
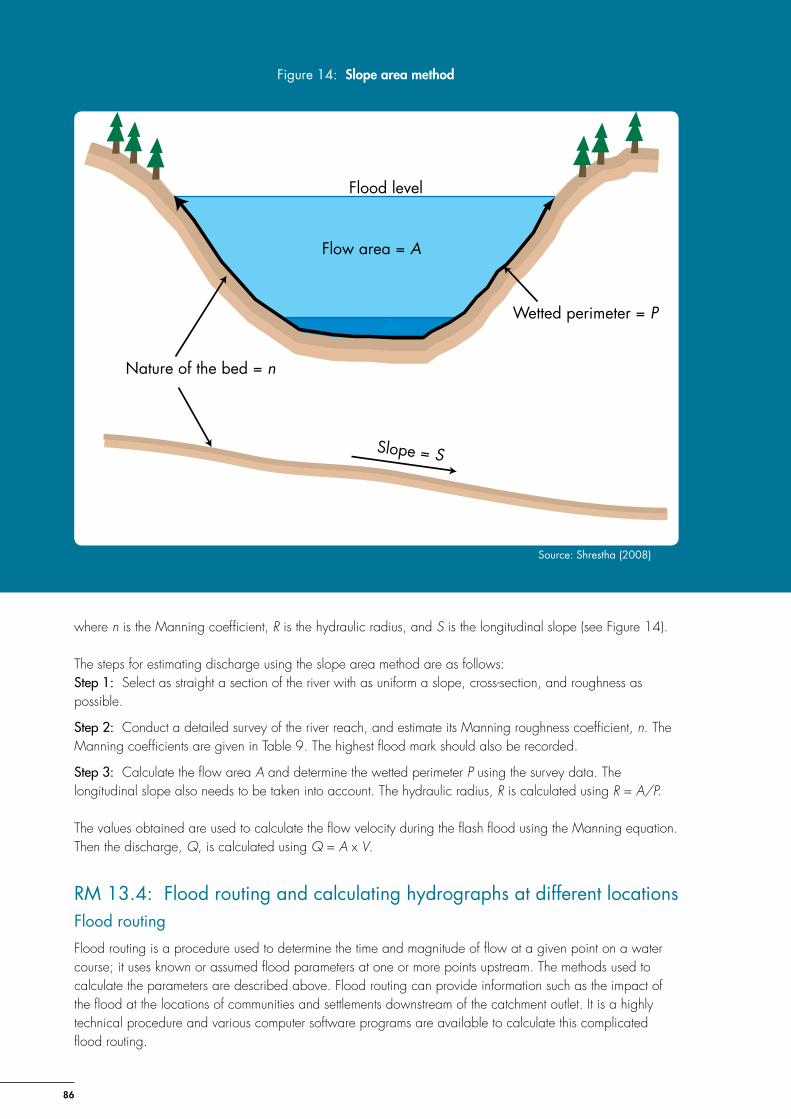
Flash Flood Risk Management: A Training of Trainers Manual
86
SESS
IoN
13
Day Three
where n is the Manning coefficient, R is the hydraulic radius, and S is the longitudinal slope (see Figure 14).
The steps for estimating discharge using the slope area method are as follows:Step 1: Select as straight a section of the river with as uniform a slope, cross-section, and roughness as possible.
Step 2: Conduct a detailed survey of the river reach, and estimate its Manning roughness coefficient, n. The Manning coefficients are given in Table 9. The highest flood mark should also be recorded.
Step 3: Calculate the flow area A and determine the wetted perimeter P using the survey data. The longitudinal slope also needs to be taken into account. The hydraulic radius, R is calculated using R = A/P.
The values obtained are used to calculate the flow velocity during the flash flood using the Manning equation. Then the discharge, Q, is calculated using Q = A x V.
RM 13.4: Flood routing and calculating hydrographs at different locations Flood routing
Flood routing is a procedure used to determine the time and magnitude of flow at a given point on a water course; it uses known or assumed flood parameters at one or more points upstream. The methods used to calculate the parameters are described above. Flood routing can provide information such as the impact of the flood at the locations of communities and settlements downstream of the catchment outlet. It is a highly technical procedure and various computer software programs are available to calculate this complicated flood routing.
Flood level
Wetted perimeter = P
Nature of the bed = n
Slope = S
Flow area = A
Figure 14: Slope area method
Source: Shrestha (2008)
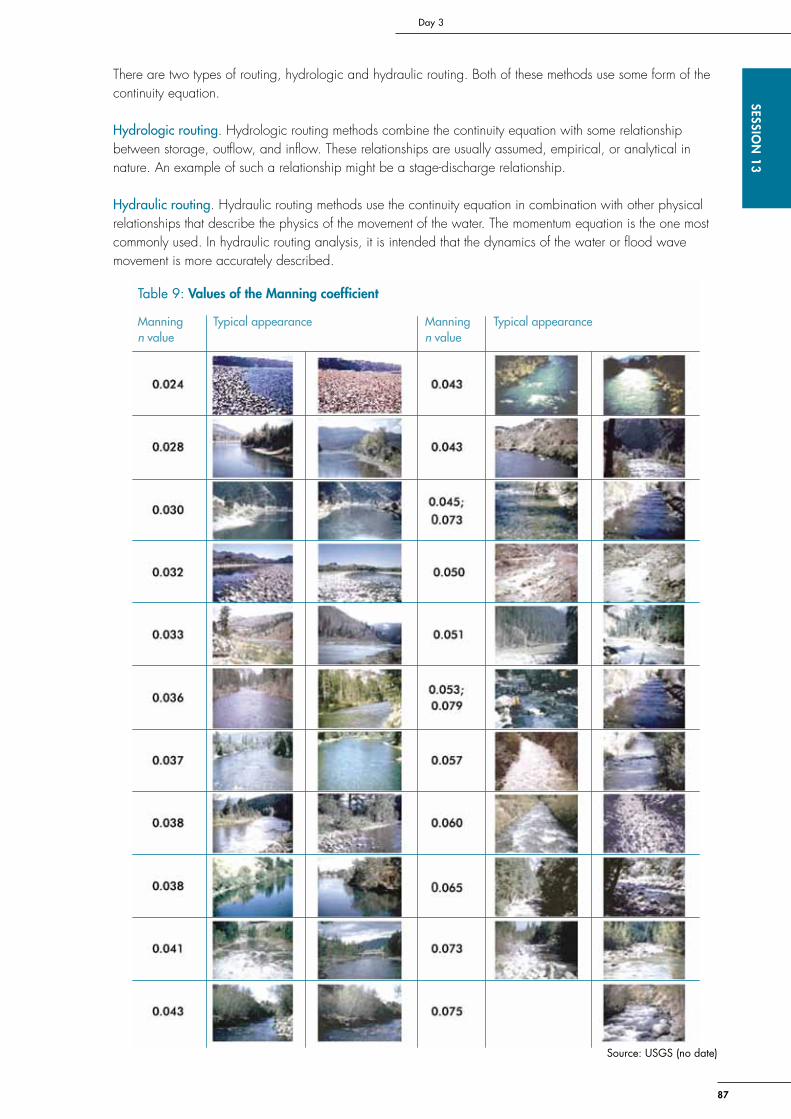
87
Day 3SESSIo
N 13
There are two types of routing, hydrologic and hydraulic routing. Both of these methods use some form of the continuity equation.
Hydrologic routing. Hydrologic routing methods combine the continuity equation with some relationship between storage, outflow, and inflow. These relationships are usually assumed, empirical, or analytical in nature. An example of such a relationship might be a stage-discharge relationship.
Hydraulic routing. Hydraulic routing methods use the continuity equation in combination with other physical relationships that describe the physics of the movement of the water. The momentum equation is the one most commonly used. In hydraulic routing analysis, it is intended that the dynamics of the water or flood wave movement is more accurately described.
Table 9: Values of the Manning coefficient
Manning Typical appearance Manning Typical appearance n value n value
Source: USGS (no date)
Flash Flood Risk Management: A Training of Trainers Manual
88
SESS
IoN
13
Routing methods
The basic principle of flood routing is the continuity of flow as expressed by the continuity equation. Several methods can be used to calculate flood routing, these include: modified plus, kinematic wave, Muskingum, Muskingum-Cunge, and dynamic (Chow et al. 1988). The following discussion is limited to the Muskingum method, a commonly used hydrological flood routing method that models the storage volume of flooding in a stream channel by a combination of wedge and prism storage.
In the Muskingum method, K and X are determined graphically from the hydrograph, while in the Musking-Cunge method they can be determined using the following equations:
kCX
K∆
= )1(21
0
max
xCBS
QX
k ∆−=and
where Ck is celerity and B is the width of the water surface.
The exercise in Box 13 makes the method much clearer. It shows the calculation of peak discharge at 6 km distance from the origin. The calculation can be carried out in a similar way for the remaining hydrographs at 12 and 18 km distance.
RM 13.5: Flood frequency and return period
Flood frequency
Floods are recurring phenomena. The chance of a flood happening at a given location can be calculated using a probability function. One of the simplest probability functions used to determine flood intensity is the return period (T). It is a statistical estimate indicating the average recurrence interval based on data collected over an extended period of time. The return period is an important parameter required for risk analysis. Return period can be determined using the following equation:
mn
T1+
=
where n is the number of years on record, and m is the rank of the flood being considered (in terms of the flood size in m³/sec).
The return period is important in relating extreme discharge to average discharge. The return period has an inverse relationship with the probability (P) that the event will be exceeded in any year. For example, a 10-year flood has 0.1 or 10% chance of being exceeded in any year while a 50-year flood has 0.02 (2%) chance of being exceeded in any year. The term ‘return period’ is actually a misnomer. It does not necessarily mean that the design storm of a 10-year return period will return every 10 years. It could, in fact, never occur, or occur twice in a single year. It is still considered a 10-year storm.
The study of return period is useful for risk analysis (such as the natural, inherent, or hydrological risk of failure). For structural design expectations, the return period is useful in calculating the risk to the structure with respect to a given storm return period given the expected design life. The equation for assessing this risk can be expressed as:
nT
n xXPTR ))(1(1)11(1
_≥−−=−−=
where )(1TxXP
T≥= expresses the probability of the occurrence for the hydrological event in question, and
n is the expected life of the structure in years.

89
Day 3SESSIo
N 13
Box13:Exerciseonfloodrouting
Example:
The hydrograph at the upstream end of a river is given in the following table (Shrestha 2008). The reach of interest is 18 km long. Using a sub-reach length Dx of 6 km, determine the hydrograph at the end of the reach using the Muskingum-Cunge method. Assume Ck = 2 m/sec, B = 25.3 m, So = 0.001 m, and there is no lateral flow.
Time (hour) 0 1 2 3 4 5 6 7 8 9 10 11 12
Flow (m3/sec) 10 12 18 28.5 50 78 107 134.5 147 150 146 129 105
Time (hour) 13 14 15 16 17 18 19 20 21 22 23 24
Flow (m3/sec) 78 59 45 33 24 17 12 10 10 10 10 10
Solution:
Step 1: Determine K
sec3,0002
6,000==∆=kcxK
Step 2: Determine X
253.0))6000) (2) (001.0) (3.25(
1501(
21)1(
21
0
max =−=∆
−=XCBS
QX
k
Step 3: Determine, C1, C2, and C3
26.03600)253.01)(3000)(2(
)253.0)(3000)(2(3600
)1(2
21 =
+−
−=
∆+−
−∆=
tXK
KXtC
633.03600)253.01)(3000)(2(
)253.0)(3000)(2(3600
)1(2
22 =
+−
+=
∆+−
+∆=
tXK
KXtC
109.03600)253.01)(3000)(2(
3600)253.01)(3000)(2(
)1(2
)1(23 =
+−
−−=
∆+−
∆−−=
tXK
tXKC
Here Dt is 1 hour= 3,600 sec. If we want our hydrograph to show a 2-hour interval, then we must take Dt = 7,200 sec, and so on.
Step 4: Calculate discharge at 6, 12, and 18 km distances.
The initial flow at 0 hours is taken as 10 m3/sec at all three locations.
The initial flow at 6 km at 0 hours ( kmQ 60 ) is 10 m3/sec.
The flow at 1 hour at 6 km distance is given by
3 m3/sec.11)10)(109.0()12)(6333.0()10)(26.0(603
012
001
61 =++=++= kmkmkmkm QCQCQCQ
Similarly, the flow at 2 hours at 6 km distance is given by
7 m3/sec.15)18)(109.0()0.18)(633.0()12)(26.0(613
012
011
62 =++=++= kmkmkmkm QCQCQCQ
The calculations can be carried out in a similar manner for the remaining part of the hydrograph at 6 km distance for the remaining times.
The flow at 1 hour at 12 km distance is given by
8 m3/sec.10)10)(109.0()9.10)(633.0)10)(26.0( (1203
612
601
121 =++=++= kmkmkmkm QCQCQCQ
For further details, see Shrestha (2008).
90
SESS
IoN
14
Flash Flood Risk Management – A Training of Trainers Manual
Session 14 Hazard-Specific Flash Flood Management: Landslide Dam Outburst Floods
Time: 60 minutes
objective To introduce landslide dam outburst floods (LDOFs) and the measures that can be used to minimise the risks they pose, including:
X Types of landslides and the factors that trigger them X Landslide dams and the factors that cause them X How landslide dams fail X Measures that can be used to reduce the risk of LDOF
Activities
Activity 14.1: Types of landslides and factors that trigger landslidesTime: 15 minutes
Step 1 Introduce the different types of landslides (e.g., fall, topple, slide, spread, and flow).
Step 2 Discuss what can cause landslides and their triggering factors.
Step 3 Discuss the causes and effects of the different types of landslides that can dam rivers.
Activity 14.2: Process of landslide damming and factors that can cause landslide damsTime: 15 minutes
Step 1 Present and explain the process of landslide damming. Highlight the characteristics of possible places where landslides can dam a river.
Step 2 Discuss the factors that can cause a landslide to dam a river. Discuss the different possible compositions of landslide dams and how their composition affects their longevity. Discuss how landslide dams fail.
Activity 14.3: Case studies of landslide dam outburst floods Time: 5 minutes
Present and discuss landslide dam outburst floods and present the case studies described in RM 14.3. Discuss the causes of landslide dam outbursts.
91
Day 3SESSIo
N 14
Activity 14.4: Measures that can reduce the risk of landslide dam outburst floods Time: 25 minutes
Present and discuss control measures that can be used to minimise the risk of LDOFs. Focus on the following issues.
Step 1 Landslide hazard assessment. Discuss the methods that can be used to identify places where hazards can occur such as landslide hazard mapping using GIS. Effective assessments focus on the places where a landslide is most likely to cause the greatest damage (e.g., narrow river valleys).
Step 2 Estimatingdownstreamflooding. Discuss how the magnitude of a potential flood caused by a landslide dam outburst can be estimated in order to implement the appropriate mitigation measures downstream. (See example in RM 14.4.)
Step 3 Estimationofpastfloods. Discuss how the extent of past floods can be estimated and how this estimation can be used as the basis for assessing possible future hazard and risk. Review some flood estimation methods, such as methods to estimate velocity, depth, width, and discharge. (See examples in RM 14.4.)
Step 4 Land use regulations. Discuss land use practices particularly in flood prone and landslide prone areas. Engage the class in a short question and answer session, asking the participants to suggest some land use regulations that can help to minimise the risk of landslide dams.
Step 5 Earlywarningsystems. Explain how early warning systems can be effective in mitigating the harmful effects of outburst floods, particularly in saving lives and property.
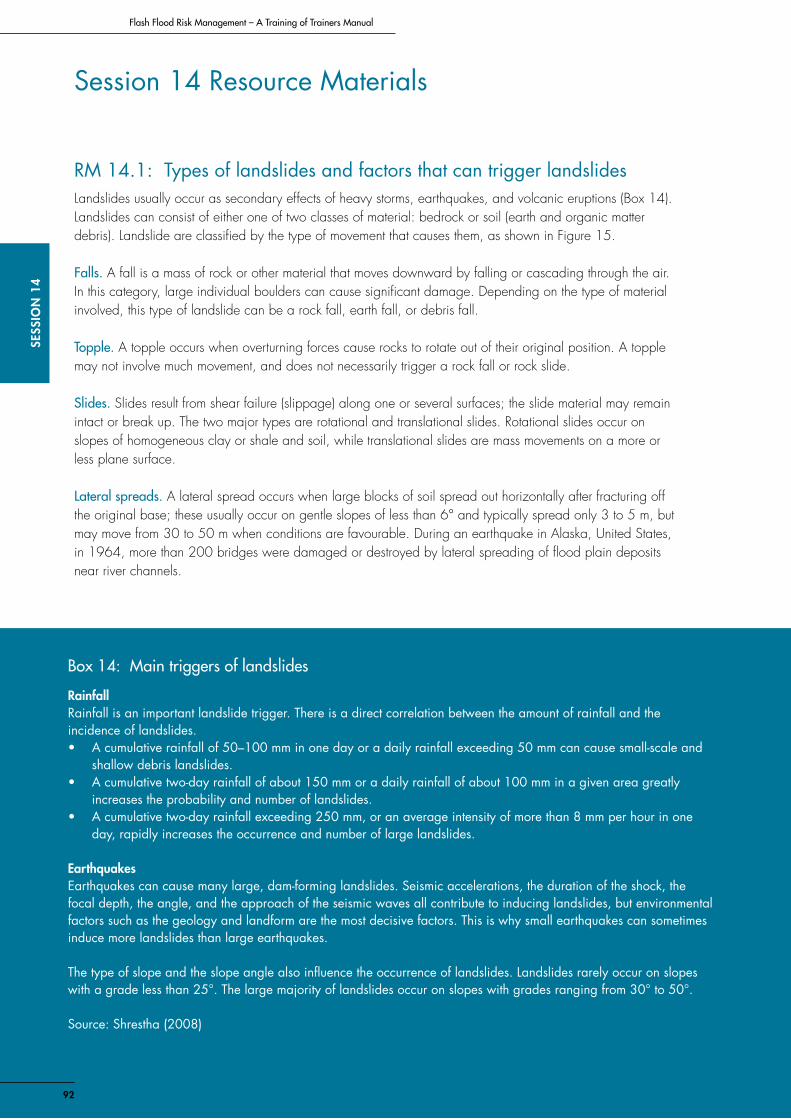
92
SESS
IoN
14
Flash Flood Risk Management – A Training of Trainers Manual
Box 14: Main triggers of landslides
RainfallRainfall is an important landslide trigger. There is a direct correlation between the amount of rainfall and the incidence of landslides.• A cumulative rainfall of 50–100 mm in one day or a daily rainfall exceeding 50 mm can cause small-scale and
shallow debris landslides.• A cumulative two-day rainfall of about 150 mm or a daily rainfall of about 100 mm in a given area greatly
increases the probability and number of landslides.• A cumulative two-day rainfall exceeding 250 mm, or an average intensity of more than 8 mm per hour in one
day, rapidly increases the occurrence and number of large landslides.
EarthquakesEarthquakes can cause many large, dam-forming landslides. Seismic accelerations, the duration of the shock, the focal depth, the angle, and the approach of the seismic waves all contribute to inducing landslides, but environmental factors such as the geology and landform are the most decisive factors. This is why small earthquakes can sometimes induce more landslides than large earthquakes.
The type of slope and the slope angle also influence the occurrence of landslides. Landslides rarely occur on slopes with a grade less than 25°. The large majority of landslides occur on slopes with grades ranging from 30° to 50°.
Source: Shrestha (2008)
92
Session 14 Resource Materials
RM 14.1: Types of landslides and factors that can trigger landslidesLandslides usually occur as secondary effects of heavy storms, earthquakes, and volcanic eruptions (Box 14). Landslides can consist of either one of two classes of material: bedrock or soil (earth and organic matter debris). Landslide are classified by the type of movement that causes them, as shown in Figure 15.
Falls. A fall is a mass of rock or other material that moves downward by falling or cascading through the air. In this category, large individual boulders can cause significant damage. Depending on the type of material involved, this type of landslide can be a rock fall, earth fall, or debris fall.
Topple. A topple occurs when overturning forces cause rocks to rotate out of their original position. A topple may not involve much movement, and does not necessarily trigger a rock fall or rock slide.
Slides. Slides result from shear failure (slippage) along one or several surfaces; the slide material may remain intact or break up. The two major types are rotational and translational slides. Rotational slides occur on slopes of homogeneous clay or shale and soil, while translational slides are mass movements on a more or less plane surface.
Lateral spreads. A lateral spread occurs when large blocks of soil spread out horizontally after fracturing off the original base; these usually occur on gentle slopes of less than 6° and typically spread only 3 to 5 m, but may move from 30 to 50 m when conditions are favourable. During an earthquake in Alaska, United States, in 1964, more than 200 bridges were damaged or destroyed by lateral spreading of flood plain deposits near river channels.
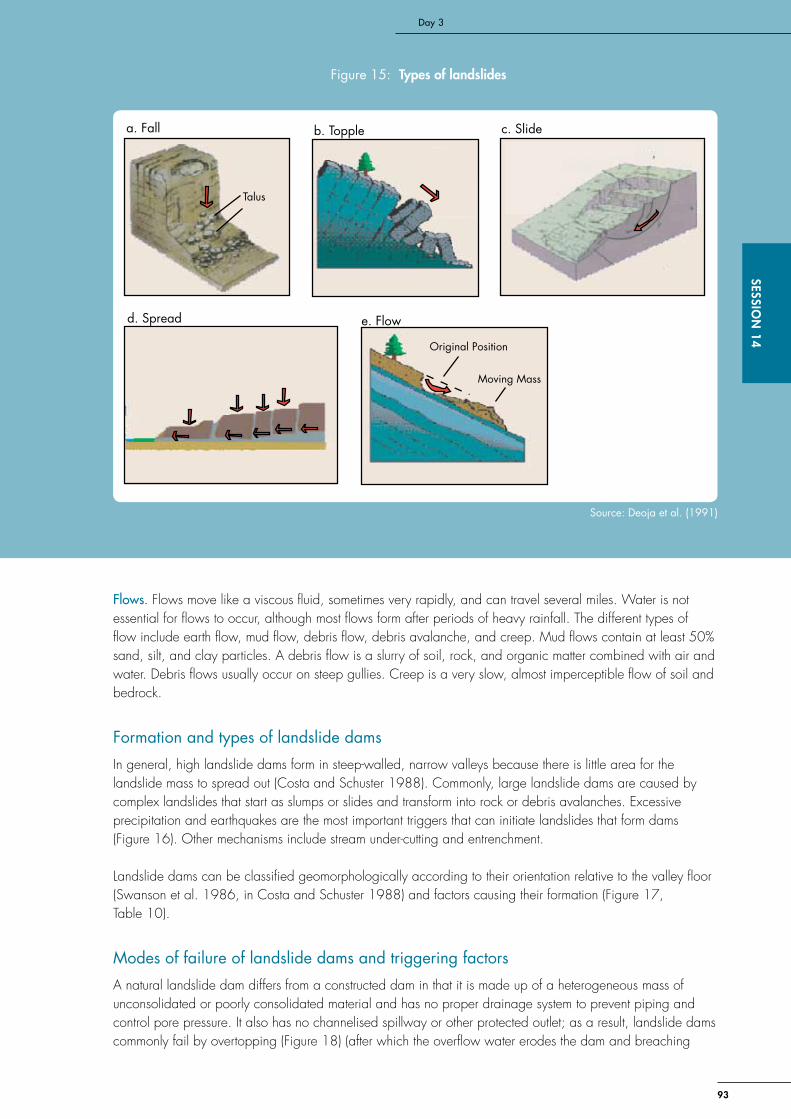
93
Day 3SESSIo
N 14
Flows. Flows move like a viscous fluid, sometimes very rapidly, and can travel several miles. Water is not essential for flows to occur, although most flows form after periods of heavy rainfall. The different types of flow include earth flow, mud flow, debris flow, debris avalanche, and creep. Mud flows contain at least 50% sand, silt, and clay particles. A debris flow is a slurry of soil, rock, and organic matter combined with air and water. Debris flows usually occur on steep gullies. Creep is a very slow, almost imperceptible flow of soil and bedrock.
Formation and types of landslide dams
In general, high landslide dams form in steep-walled, narrow valleys because there is little area for the landslide mass to spread out (Costa and Schuster 1988). Commonly, large landslide dams are caused by complex landslides that start as slumps or slides and transform into rock or debris avalanches. Excessive precipitation and earthquakes are the most important triggers that can initiate landslides that form dams (Figure 16). Other mechanisms include stream under-cutting and entrenchment.
Landslide dams can be classified geomorphologically according to their orientation relative to the valley floor (Swanson et al. 1986, in Costa and Schuster 1988) and factors causing their formation (Figure 17, Table 10).
Modes of failure of landslide dams and triggering factors
A natural landslide dam differs from a constructed dam in that it is made up of a heterogeneous mass of unconsolidated or poorly consolidated material and has no proper drainage system to prevent piping and control pore pressure. It also has no channelised spillway or other protected outlet; as a result, landslide dams commonly fail by overtopping (Figure 18) (after which the overflow water erodes the dam and breaching
Talus
a. Fall b. Topple c. Slide
d. Spread
Original Position
Moving Mass
e. Flow
Figure 15: Types of landslides
Source: Deoja et al. (1991)
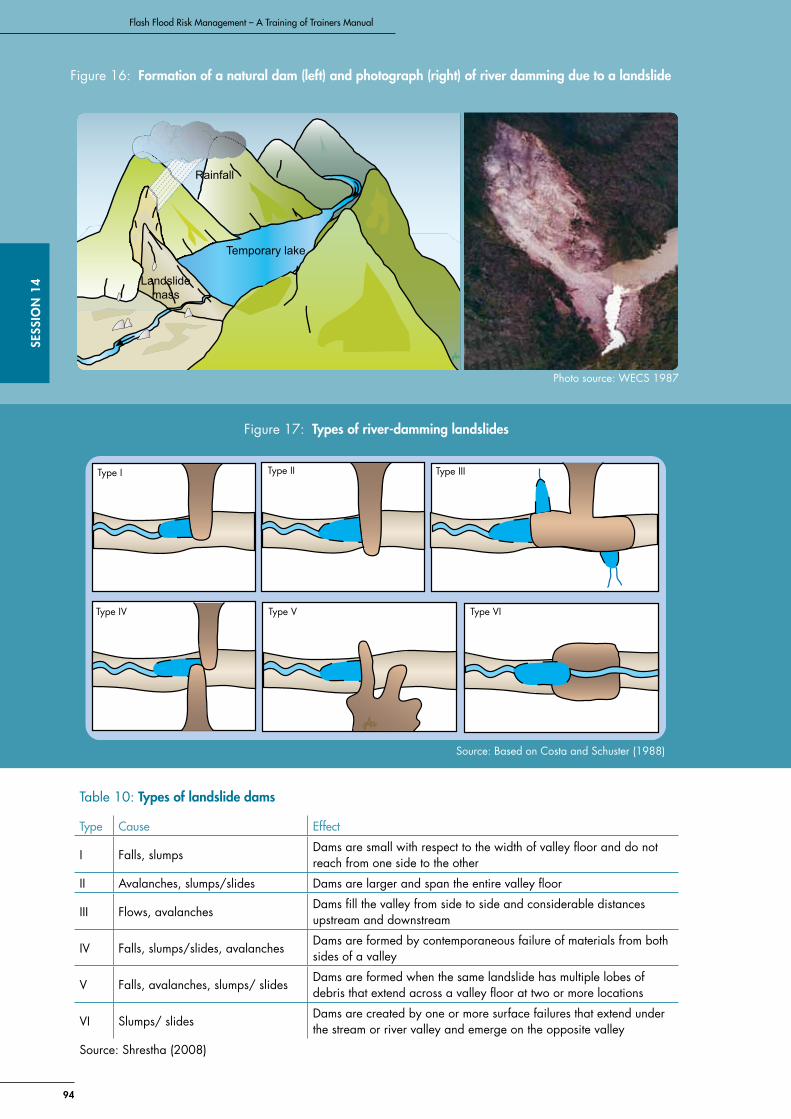
94
SESS
IoN
14
Flash Flood Risk Management – A Training of Trainers Manual
Rainfall
Temporary lake
Landslidemass
Figure 16: Formation of a natural dam (left) and photograph (right) of river damming due to a landslide
Type I Type II Type III
Type IV Type V Type VI
Figure 17: Types of river-damming landslides
Table 10: Types of landslide dams
Type Cause Effect
I Falls, slumpsDams are small with respect to the width of valley floor and do not reach from one side to the other
II Avalanches, slumps/slides Dams are larger and span the entire valley floor
III Flows, avalanchesDams fill the valley from side to side and considerable distances upstream and downstream
IV Falls, slumps/slides, avalanchesDams are formed by contemporaneous failure of materials from both sides of a valley
V Falls, avalanches, slumps/ slidesDams are formed when the same landslide has multiple lobes of debris that extend across a valley floor at two or more locations
VI Slumps/ slidesDams are created by one or more surface failures that extend under the stream or river valley and emerge on the opposite valley
Source: Shrestha (2008)
Photo source: WECS 1987
Source: Based on Costa and Schuster (1988)
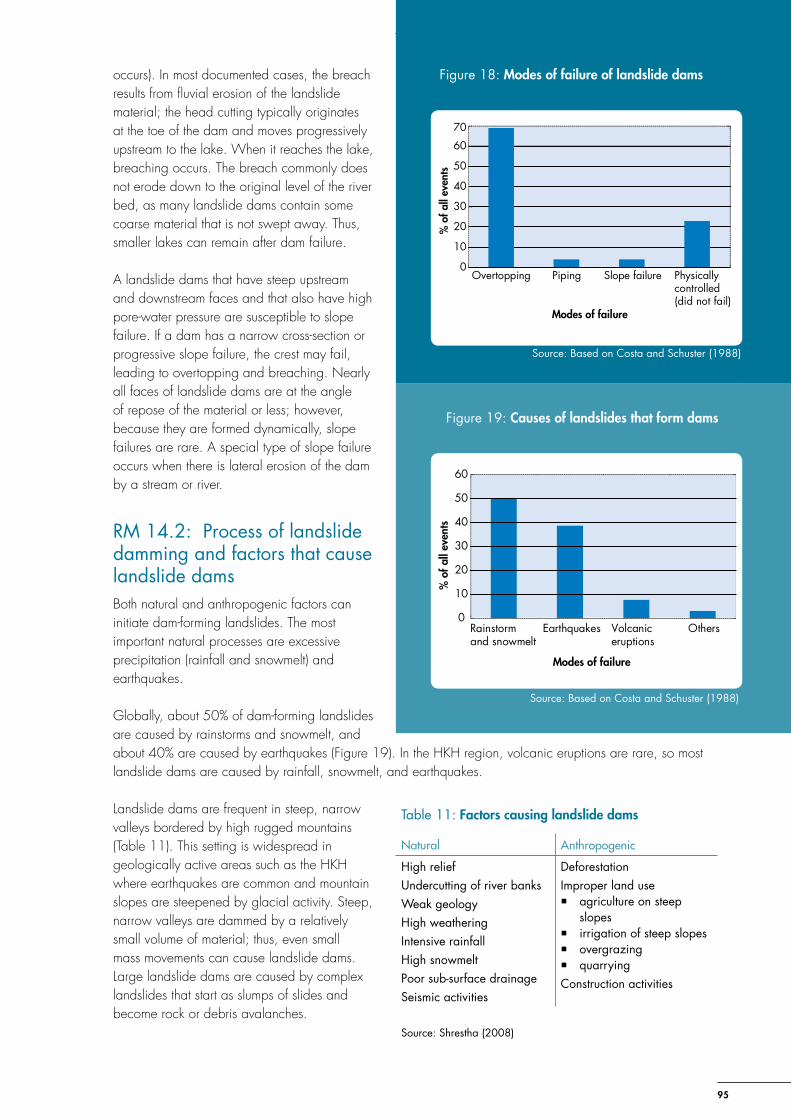
95
Day 3SESSIo
N 14
occurs). In most documented cases, the breach results from fluvial erosion of the landslide material; the head cutting typically originates at the toe of the dam and moves progressively upstream to the lake. When it reaches the lake, breaching occurs. The breach commonly does not erode down to the original level of the river bed, as many landslide dams contain some coarse material that is not swept away. Thus, smaller lakes can remain after dam failure.
A landslide dams that have steep upstream and downstream faces and that also have high pore-water pressure are susceptible to slope failure. If a dam has a narrow cross-section or progressive slope failure, the crest may fail, leading to overtopping and breaching. Nearly all faces of landslide dams are at the angle of repose of the material or less; however, because they are formed dynamically, slope failures are rare. A special type of slope failure occurs when there is lateral erosion of the dam by a stream or river.
RM 14.2: Process of landslide damming and factors that cause landslide damsBoth natural and anthropogenic factors can initiate dam-forming landslides. The most important natural processes are excessive precipitation (rainfall and snowmelt) and earthquakes.
Globally, about 50% of dam-forming landslides are caused by rainstorms and snowmelt, and about 40% are caused by earthquakes (Figure 19). In the HKH region, volcanic eruptions are rare, so most landslide dams are caused by rainfall, snowmelt, and earthquakes.
Landslide dams are frequent in steep, narrow valleys bordered by high rugged mountains (Table 11). This setting is widespread in geologically active areas such as the HKH where earthquakes are common and mountain slopes are steepened by glacial activity. Steep, narrow valleys are dammed by a relatively small volume of material; thus, even small mass movements can cause landslide dams. Large landslide dams are caused by complex landslides that start as slumps of slides and become rock or debris avalanches.
Table 11: Factors causing landslide dams
Natural Anthropogenic
High reliefUndercutting of river banksWeak geologyHigh weatheringIntensive rainfallHigh snowmeltPoor sub-surface drainageSeismic activities
DeforestationImproper land use � agriculture on steep
slopes � irrigation of steep slopes � overgrazing � quarrying
Construction activities
Source: Shrestha (2008)
0
10
20
30
40
50
60
Rainstormand snowmelt
Earthquakes Volcaniceruptions
Others
% o
f all
even
ts
Modes of failure
Figure 19: Causes of landslides that form dams
Source: Based on Costa and Schuster (1988)
0
10
20
30
40
50
60
70
Overtopping Piping Slope failure Physicallycontrolled (did not fail)
% o
f all
even
ts
Modes of failure
Figure 18: Modes of failure of landslide dams
Source: Based on Costa and Schuster (1988)
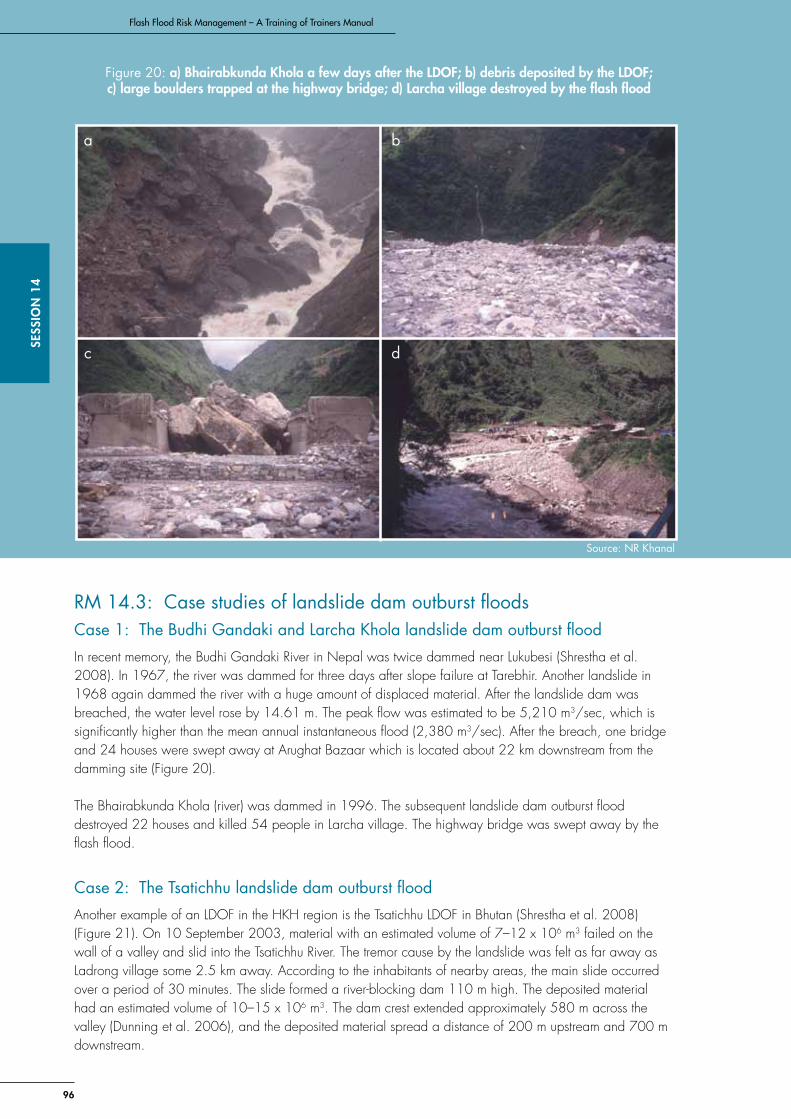
96
SESS
IoN
14
Flash Flood Risk Management – A Training of Trainers Manual
RM 14.3: Case studies of landslide dam outburst floodsCase 1: The Budhi Gandaki and Larcha Khola landslide dam outburst flood
In recent memory, the Budhi Gandaki River in Nepal was twice dammed near Lukubesi (Shrestha et al. 2008). In 1967, the river was dammed for three days after slope failure at Tarebhir. Another landslide in 1968 again dammed the river with a huge amount of displaced material. After the landslide dam was breached, the water level rose by 14.61 m. The peak flow was estimated to be 5,210 m3/sec, which is significantly higher than the mean annual instantaneous flood (2,380 m3/sec). After the breach, one bridge and 24 houses were swept away at Arughat Bazaar which is located about 22 km downstream from the damming site (Figure 20).
The Bhairabkunda Khola (river) was dammed in 1996. The subsequent landslide dam outburst flood destroyed 22 houses and killed 54 people in Larcha village. The highway bridge was swept away by the flash flood.
Case 2: The Tsatichhu landslide dam outburst flood
Another example of an LDOF in the HKH region is the Tsatichhu LDOF in Bhutan (Shrestha et al. 2008) (Figure 21). On 10 September 2003, material with an estimated volume of 7–12 x 106 m3 failed on the wall of a valley and slid into the Tsatichhu River. The tremor cause by the landslide was felt as far away as Ladrong village some 2.5 km away. According to the inhabitants of nearby areas, the main slide occurred over a period of 30 minutes. The slide formed a river-blocking dam 110 m high. The deposited material had an estimated volume of 10–15 x 106 m3. The dam crest extended approximately 580 m across the valley (Dunning et al. 2006), and the deposited material spread a distance of 200 m upstream and 700 m downstream.
a b
c d
Figure 20: a) Bhairabkunda Khola a few days after the LDoF; b) debris deposited by the LDoF; c) large boulders trapped at the highway bridge; d) Larcha village destroyed by the flash flood
Source: NR Khanal
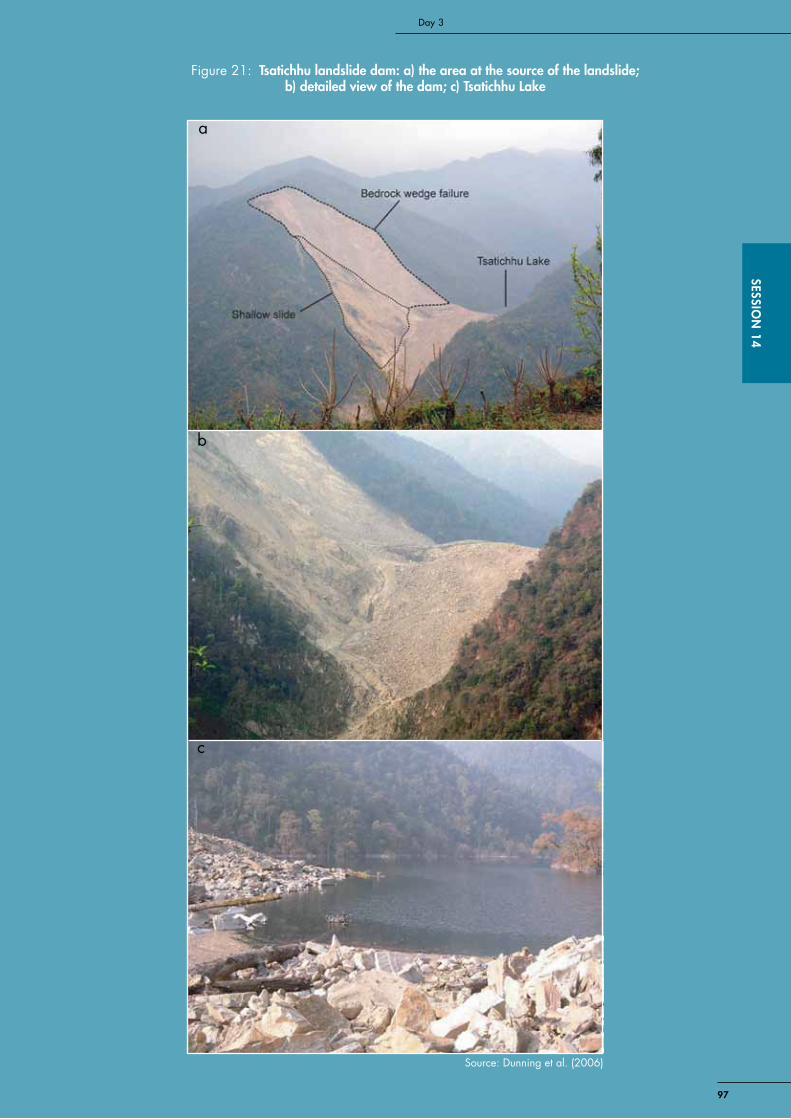
97
Day 3SESSIo
N 14
a
b
c
Figure 21: Tsatichhu landslide dam: a) the area at the source of the landslide; b) detailed view of the dam; c) Tsatichhu Lake
Source: Dunning et al. (2006)
98
SESS
IoN
14
Flash Flood Risk Management – A Training of Trainers Manual
The landslide dammed the Tsatichhu river and formed a lake which was temporarily known as Tsatichhu lake. The lake extended 1 km up-valley, and had an estimated volume of 4–7 x 10⁶ m3 at its maximum level. A small surface outflow occurred in December 2003, but did not cause the dam to fail. There was also significant seepage through the dam, which together with the surface outflow maintained an equilibrium with the river inflow of 0.53 m3/sec.
The dam survived for 10 months, then in May 2004, heavy rainfall caused some material from the downstream face of the dam to fail, but did not cause a major failure. On 10 July 2004, after a period of prolonged intense rainfall, the dam failed. The dam failed mainly due to a combination of downstream slope failure and overtopping. The failure caused an enormous flood downstream. Since 10 months elapsed between the formation and the failure of the dam, the Department of Energy had sufficient time to put early warning systems in place. Timely warnings saved the downstream hydropower plant. The water level in the reservoir was pre-lowered; this enabled it to cater to the flood with only minor damage to the main infrastructure. This LDOF did not result in any human casualties, but the loss of agricultural land was significant (Xu et al. 2006).
RM 14.4: Measures that can reduce the risk of landslide dam outburst floodsControl measures, such as the construction of spillways to drain the impounded water, have been attempted in various places around the world. Sometimes these measures are successful in preventing LDOFs, but at other times overtopping occurs before satisfactory control measures can be constructed. In some cases, constructions for structural mitigation can themselves trigger floods that can cause large-scale causalities. This manual focuses on non-structural measures to mitigate LDOFs.
Landslide hazard assessment
The first step in LDOF mitigation is to identify places where the hazard can occur. This identification can take place by preparing a landslide hazard map. A landslide in a narrow valley close to a stream can potentially cause a lake-forming dam. Additional analysis can be used to estimate of the volume of the dam, which together with the stream inflow rate, can give an indication of the rate at which a dammed lake could rise.
Hazard and risk mapping can be accomplished using any one or a combination of the following methods. � Simple qualitative methods are based on experience and use an applied geomorphic approach to
determine parameters, their weightings, and scores; overlays of parameter maps are used for pre-feasibility level studies.
� Statistical methods score the different parameters based on bivariate and multivariate statistical analysis. � Deterministic methods are based on the properties of materials. � Social mapping methods use information derived from discussions with people familiar with the area and
make use of their local knowledge, experiences, and feelings.
The potential hazard may be classified as relative (by assigning ratings to the different factors that can contribute to the hazard), absolute (by deterministically deriving factors, e.g., factor of safety), or monitored (by making actual measurements such as the deformation of roads or other structures).
To assess relative hazard, these steps are generally followed: � Determine the different factors that can contribute to slope instability. � Develop a rating scheme to score the probability of a hazard. � Identify and quantify elements at risk. � Develop a rating scheme and scores for damage potential. � Construct a hazard and risk matrix. � Map the hazard and risk.
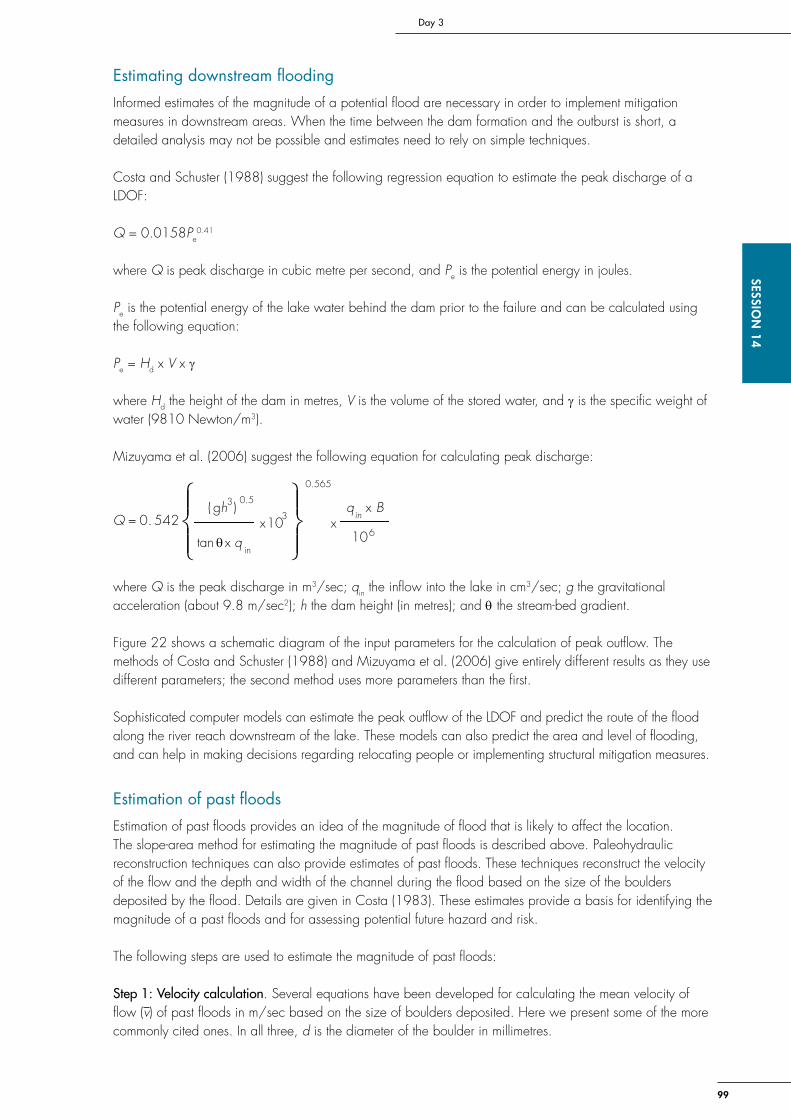
99
Day 3SESSIo
N 14
Estimating downstream flooding
Informed estimates of the magnitude of a potential flood are necessary in order to implement mitigation measures in downstream areas. When the time between the dam formation and the outburst is short, a detailed analysis may not be possible and estimates need to rely on simple techniques.
Costa and Schuster (1988) suggest the following regression equation to estimate the peak discharge of a LDOF:
Q = 0.0158Pe0.41
where Q is peak discharge in cubic metre per second, and Pe is the potential energy in joules.
Pe is the potential energy of the lake water behind the dam prior to the failure and can be calculated using the following equation:
Pe = Hd x V x g
where Hd the height of the dam in metres, V is the volume of the stored water, and g is the specific weight of water (9810 Newton/m3).
Mizuyama et al. (2006) suggest the following equation for calculating peak discharge:
( )
6
33
1010
tan
542.0Bq
q
ghQ in
in
xx
xx
=
θ
0.5
0.565
where Q is the peak discharge in m3/sec; qin the inflow into the lake in cm3/sec; g the gravitational acceleration (about 9.8 m/sec2); h the dam height (in metres); and θ the stream-bed gradient.
Figure 22 shows a schematic diagram of the input parameters for the calculation of peak outflow. The methods of Costa and Schuster (1988) and Mizuyama et al. (2006) give entirely different results as they use different parameters; the second method uses more parameters than the first.
Sophisticated computer models can estimate the peak outflow of the LDOF and predict the route of the flood along the river reach downstream of the lake. These models can also predict the area and level of flooding, and can help in making decisions regarding relocating people or implementing structural mitigation measures.
Estimation of past floods
Estimation of past floods provides an idea of the magnitude of flood that is likely to affect the location. The slope-area method for estimating the magnitude of past floods is described above. Paleohydraulic reconstruction techniques can also provide estimates of past floods. These techniques reconstruct the velocity of the flow and the depth and width of the channel during the flood based on the size of the boulders deposited by the flood. Details are given in Costa (1983). These estimates provide a basis for identifying the magnitude of a past floods and for assessing potential future hazard and risk.
The following steps are used to estimate the magnitude of past floods:
Step 1: Velocity calculation. Several equations have been developed for calculating the mean velocity of flow (v) of past floods in m/sec based on the size of boulders deposited. Here we present some of the more commonly cited ones. In all three, d is the diameter of the boulder in millimetres.
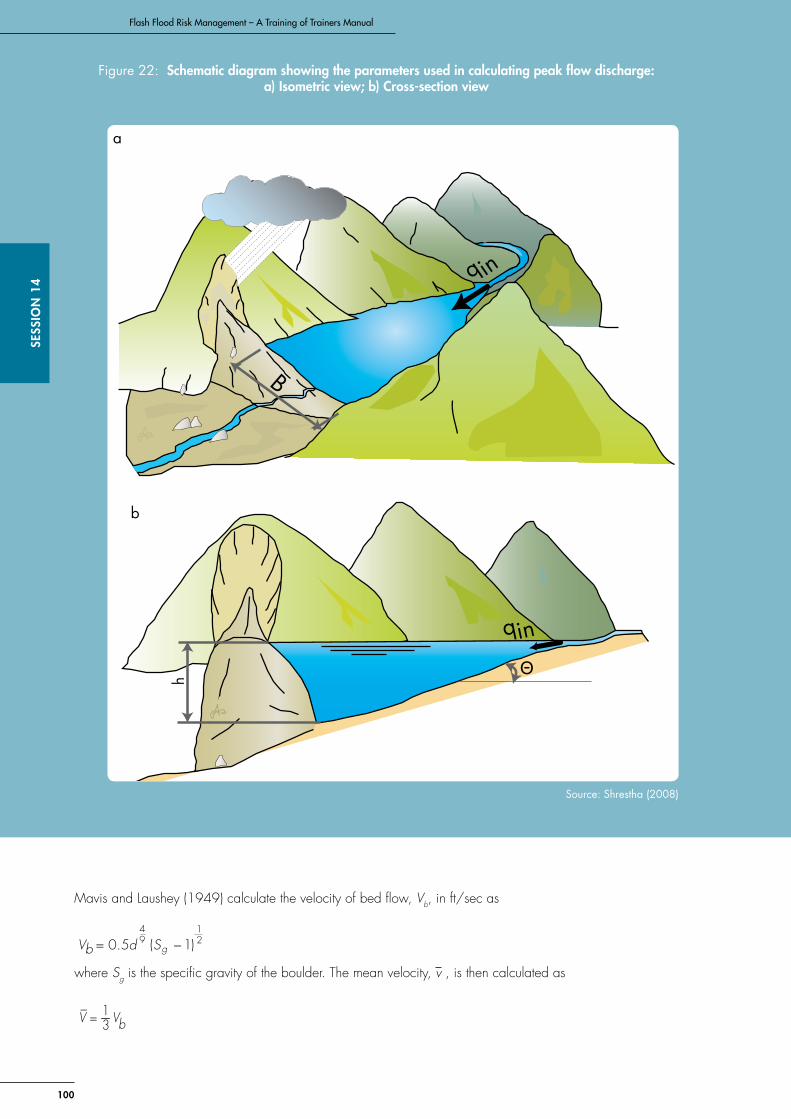
100
SESS
IoN
14
Flash Flood Risk Management – A Training of Trainers Manual
Mavis and Laushey (1949) calculate the velocity of bed flow, Vb, in ft/sec as
( ) 21
94
10.5 −= gb SdV
where Sg is the specific gravity of the boulder. The mean velocity, v , is then calculated as
VV b31_
=
h
qin
a
b
B
q in
Θ
Figure 22: Schematic diagram showing the parameters used in calculating peak flow discharge: a) Isometric view; b) Cross-section view
Source: Shrestha (2008)

101
Day 3SESSIo
N 14
Strand (1977) uses the same equation for mean velocity, but calculates the velocity of bed flow, Vb again in ft/sec), as
21
0.51dVb=
Williams (1983) suggests that
V = 0.065d 0.5
Step 2: Depth calculation. The next step is to calculate the mean depth of the flow. Several methods are available for calculating the mean depth (D).
Manning’s equation proposes
1.5__
)(SnVD =
√
where D is mean depth, V is mean velocity, n is the roughness coefficient, and S is the slope.
Sheild (1936) suggests
SD fd S /)(_
γγθ −=
where θ is dimensionless shear stress (use 0.02), gf = 1,070 kg/m3, gs = 2,700 kg/m3, and S is the slope.
Williams (1983) suggests
SfD γτ/_
= d1.017.0=τ
where t is the shear stress (N/m²),d is the boulder diameter (mm), g is the specific weight of water, and S is the slope
Step3:Widthcalculation. The width is determined using an iterative method. For the cross-section, a straight reach (neither expanding nor contracting) is selected. The site should not be abnormally wide, narrow, steep, or flat. At least one, and preferably both, valley walls should be bedrock. The site should be close to the site where the deposition took place. At least two cross-sections are selected, these should be spaced about one valley width apart. No major tributaries should enter the main channel between the cross-sections.
Once the cross-sections have been plotted, a line is drawn to represent the estimated top width of the cross section. The area of the cross-section is calculated using a planimeter; then the area is divided by the top width of the cross-section. If the value calculated in this way deviates from the estimated depth calculated in Step 2, the process is repeated by drawing a new top-width line and recalculating; the process is repeated until the two values agree. The cross-sectional area ‘A’ for the final top-width is then calculated.
Calculation of discharge. Knowing the average velocity from Step 1 and the cross-sectional area from Steps 2 and 3, a single discrete estimate of flood discharge (Q) can be made using the equation:
Q = V x A
Land use regulations
The increasing hazard and risk of LDOFs are a result of the unregulated use of land and the use of flood prone areas for infrastructure development such as buildings and roads. Regulations that encourage the proper use of land can help to prevent flood prone areas from being used for settlements or as sites for

102
SESS
IoN
14
Flash Flood Risk Management – A Training of Trainers Manual
important structures. Regulations may also involve relocating people or infrastructure away from hazardous areas, particularly if alternative sites exist. Restrictions can be placed on the type and number of buildings that can be erected in high-risk areas. Similarly, activities that might activate a landslide can be restricted to take place away from avalanche prone areas. Restrictions can be implemented through measures such as policy and building codes.
Early warning systems
An early warning system can be an effective measure to mitigate the impacts of LDOFs, particularly in saving lives and property. Depending on the situation, a variety of systems can be implemented. In many cases, the best option is to implement a community-based early warning system. This may consist of people placed at strategic locations from the dam site to the greatest distance downstream where an LDOF could have an impact. Each person should have visual contact with the person just upstream and downstream. An early warning system is part of a monitoring, warning, and response system (MWRS).
Day 4Session/Activity Activity time
(minutes)Cumulative time of session
Session 15: Country Presentations
Session16:Hazard-SpecificFlashFloodManagement:GlacialLakeOutburstFloods
16.1 Glaciers, formation of glacial lakes, and the glacial landforms 10 10
16.2 Causes of glacial lake dam failure 10 20
16.3 Impacts of GLOF events 10 30
16.4 Measures to minimise GLOF risk 30 60
16.5 Briefing for the field trip 30 30
104
SESS
IoN
15
Flash Flood Risk Management – A Training of Trainers Manual
Session 15 Country Presentations
objective To give the participants an opportunity to share their experiences and knowledge on various activities for flash flood risk management
ActivitiesAsk the participants to give a short presentation on any aspect of flash flood risk management from their own country.
A little preparation can help to make this activity a good success. Make sure that you advise the participants well ahead of time, possibly in the course requirements or even on the first day of the course, that they will have to make a presentation on Day 4. Advising the participants ahead of time will give them plenty of time to work on their presentations and to gather any materials that are required such as photos and documentation. When and as appropriate, encourage them to show how they are already using some of the concepts that they have learned in the first three days of the course.
The presentations can consist of a PowerPoint, a short video, or both. Be specific about how long the presentation should be; this will depend on the scheduling and the size of the class, but on average, country presentations are 30 minutes: 20 minutes for the presentation and 10 minutes for discussion.
There must be, at least one presentation from each country. If there are several participants from the same country they can join up for a team presentation, and if there are very many from the same country then different teams can each choose an aspect that they would like to elaborate.
The day before, collect the titles of the presentations and the names of the presenters and make a short list – this will make it easier to introduce them. Make sure that any audio-visual backup that is need is available. Introduce the country presentation in alphabetical order by country and ask participants to present accordingly. If the facilitator feels that it is appropriate, the country presentations can be shared among the participants at the end of the training. In this case, decide what is the most appropriate medium for sharing the information (e.g., photocopies, CDs) and prepare the required number of copies.
Suggestions for the facilitator – planning ahead
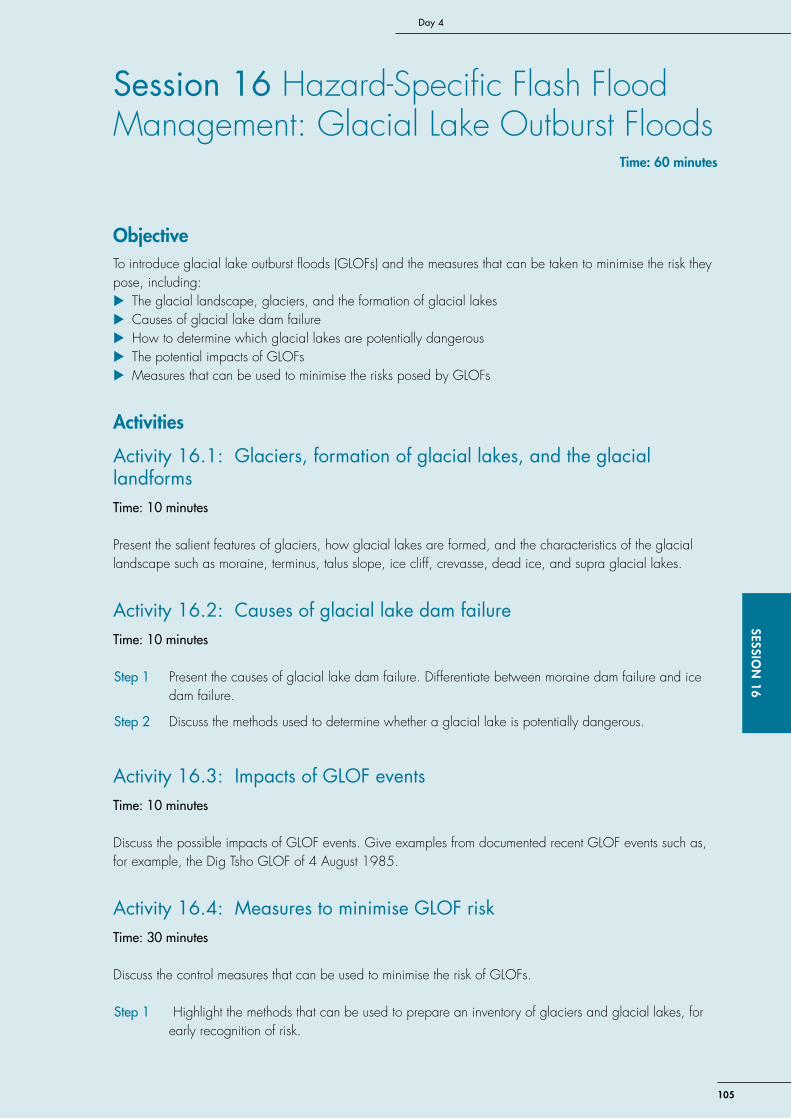
105
Day 4SESSIo
N 16
Session 16 Hazard-Specific Flash Flood Management: Glacial Lake Outburst Floods
Time: 60 minutes
objective To introduce glacial lake outburst floods (GLOFs) and the measures that can be taken to minimise the risk they pose, including:
X The glacial landscape, glaciers, and the formation of glacial lakes X Causes of glacial lake dam failure X How to determine which glacial lakes are potentially dangerous X The potential impacts of GLOFs X Measures that can be used to minimise the risks posed by GLOFs
Activities
Activity 16.1: Glaciers, formation of glacial lakes, and the glacial landformsTime: 10 minutes
Present the salient features of glaciers, how glacial lakes are formed, and the characteristics of the glacial landscape such as moraine, terminus, talus slope, ice cliff, crevasse, dead ice, and supra glacial lakes.
Activity 16.2: Causes of glacial lake dam failureTime: 10 minutes
Step 1 Present the causes of glacial lake dam failure. Differentiate between moraine dam failure and ice dam failure.
Step 2 Discuss the methods used to determine whether a glacial lake is potentially dangerous.
Activity 16.3: Impacts of GLOF eventsTime: 10 minutes
Discuss the possible impacts of GLOF events. Give examples from documented recent GLOF events such as, for example, the Dig Tsho GLOF of 4 August 1985.
Activity 16.4: Measures to minimise GLOF riskTime: 30 minutes
Discuss the control measures that can be used to minimise the risk of GLOFs.
Step 1 Highlight the methods that can be used to prepare an inventory of glaciers and glacial lakes, for early recognition of risk.

Step 2 Describe the empirical scoring system for moraine-dammed glacial lake outburst hazard.
Step 3 Discuss the methods that can be used to estimate the magnitude of a potential flood in order to estimate downstream flooding and implement appropriate mitigation measures downstream.
Step 4 Discuss GLOF risk mapping. Explain how estimating the magnitude of past floods can be used as a basis for preparing for future hazard and risk. Discuss the methods that can be used to calculate the parameters of past floods such as velocity, depth, width, and discharge.
106
SESS
IoN
16
Flash Flood Risk Management – A Training of Trainers Manual
Remember to briefly remind the class that measures such as land-use regulations and early warning systems, which were covered in previous sessions, also apply in the case of GLOFS.
Note to the trainer
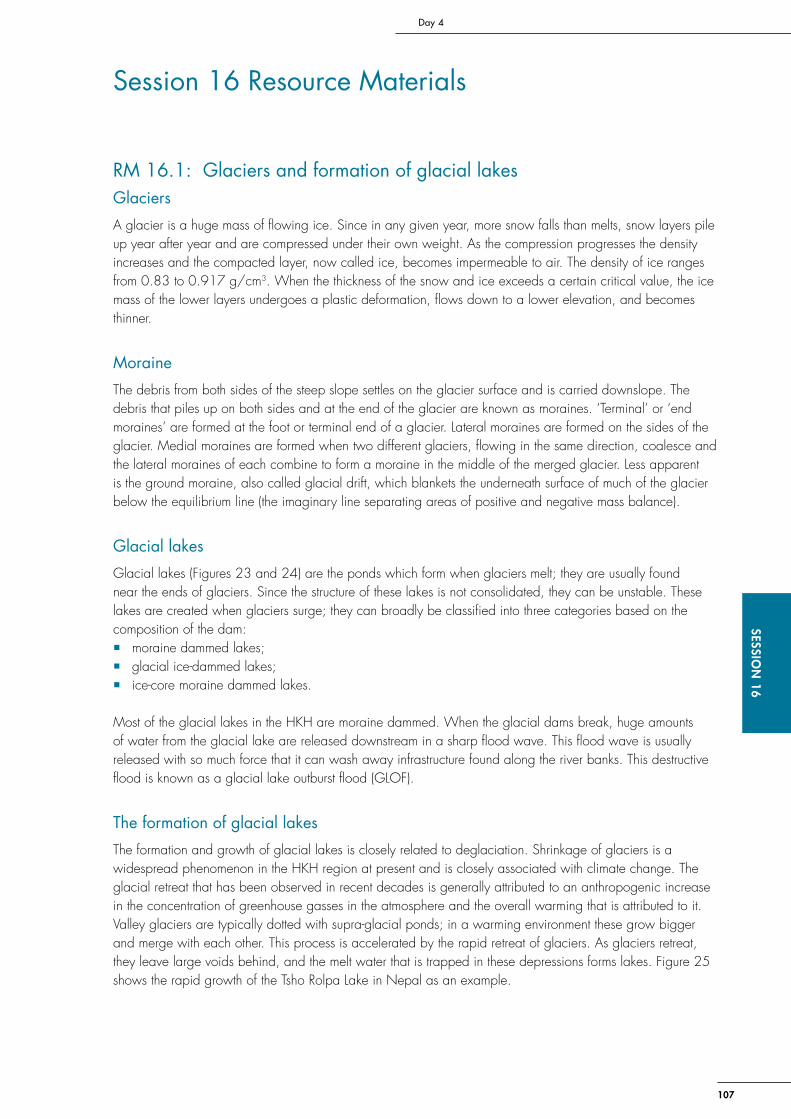
107
Day 4SESSIo
N 16
Session 16 Resource Materials
RM 16.1: Glaciers and formation of glacial lakesGlaciers
A glacier is a huge mass of flowing ice. Since in any given year, more snow falls than melts, snow layers pile up year after year and are compressed under their own weight. As the compression progresses the density increases and the compacted layer, now called ice, becomes impermeable to air. The density of ice ranges from 0.83 to 0.917 g/cm3. When the thickness of the snow and ice exceeds a certain critical value, the ice mass of the lower layers undergoes a plastic deformation, flows down to a lower elevation, and becomes thinner.
Moraine
The debris from both sides of the steep slope settles on the glacier surface and is carried downslope. The debris that piles up on both sides and at the end of the glacier are known as moraines. ‘Terminal’ or ‘end moraines’ are formed at the foot or terminal end of a glacier. Lateral moraines are formed on the sides of the glacier. Medial moraines are formed when two different glaciers, flowing in the same direction, coalesce and the lateral moraines of each combine to form a moraine in the middle of the merged glacier. Less apparent is the ground moraine, also called glacial drift, which blankets the underneath surface of much of the glacier below the equilibrium line (the imaginary line separating areas of positive and negative mass balance).
Glacial lakes
Glacial lakes (Figures 23 and 24) are the ponds which form when glaciers melt; they are usually found near the ends of glaciers. Since the structure of these lakes is not consolidated, they can be unstable. These lakes are created when glaciers surge; they can broadly be classified into three categories based on the composition of the dam: � moraine dammed lakes; � glacial ice-dammed lakes; � ice-core moraine dammed lakes.
Most of the glacial lakes in the HKH are moraine dammed. When the glacial dams break, huge amounts of water from the glacial lake are released downstream in a sharp flood wave. This flood wave is usually released with so much force that it can wash away infrastructure found along the river banks. This destructive flood is known as a glacial lake outburst flood (GLOF).
The formation of glacial lakes
The formation and growth of glacial lakes is closely related to deglaciation. Shrinkage of glaciers is a widespread phenomenon in the HKH region at present and is closely associated with climate change. The glacial retreat that has been observed in recent decades is generally attributed to an anthropogenic increase in the concentration of greenhouse gasses in the atmosphere and the overall warming that is attributed to it. Valley glaciers are typically dotted with supra-glacial ponds; in a warming environment these grow bigger and merge with each other. This process is accelerated by the rapid retreat of glaciers. As glaciers retreat, they leave large voids behind, and the melt water that is trapped in these depressions forms lakes. Figure 25 shows the rapid growth of the Tsho Rolpa Lake in Nepal as an example.
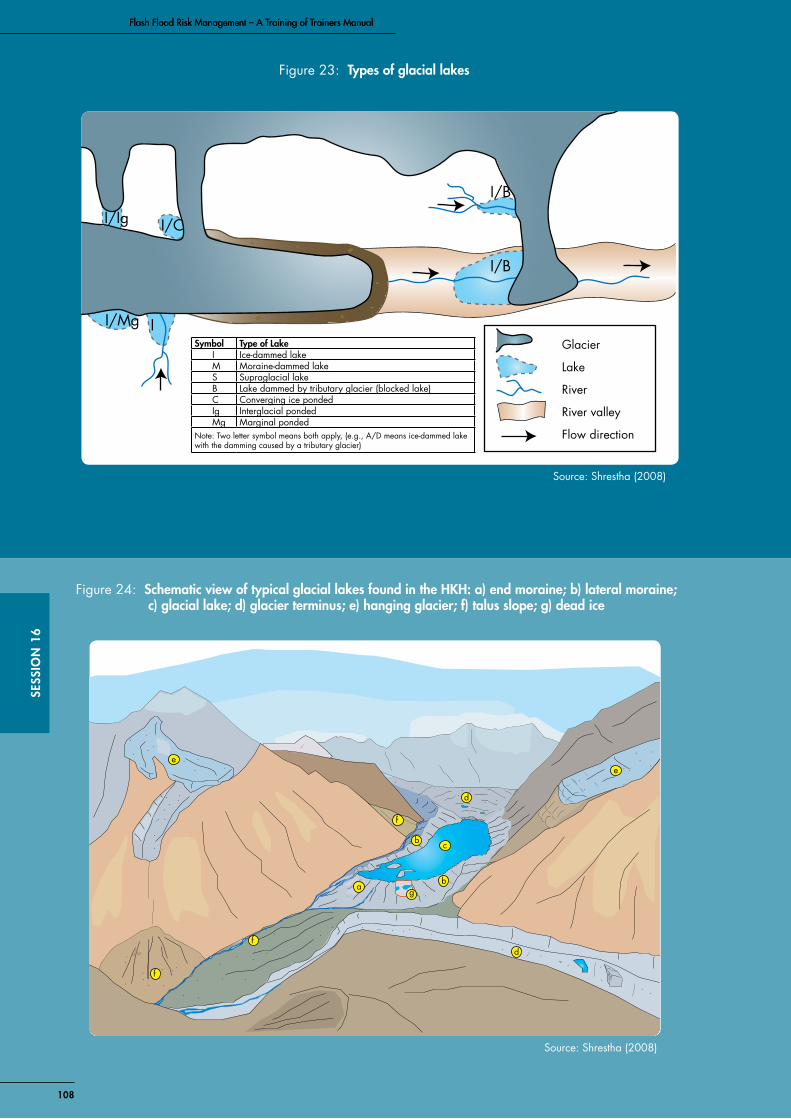
108
SESS
IoN
16
Flash Flood Risk Management – A Training of Trainers ManualFlash Flood Risk Management – A Training of Trainers Manual
a
b
b
c
d
ee
f
f
f
d
g
Figure 24: Schematic view of typical glacial lakes found in the HKH: a) end moraine; b) lateral moraine; c) glacial lake; d) glacier terminus; e) hanging glacier; f) talus slope; g) dead ice
Source: Shrestha (2008)
Glacier
Lake
River
River valley
Flow direction
I
MI/B
I/B
S
I/CI/Ig
I/MgSymbol Type of Lake
I Ice-dammed lakeM Moraine-dammed lakeS Supraglacial lakeB Lake dammed by tributary glacier (blocked lake)C Converging ice pondedIg Interglacial pondedMg Marginal ponded
Note: Two letter symbol means both apply, (e.g., A/D means ice-dammed lake with the damming caused by a tributary glacier)
Figure 23: Types of glacial lakes
Source: Shrestha (2008)
109
Day 4SESSIo
N 16
RM 16.2: Causes of glacial lake dam failureMoraine dam failure
Moraine dams can be breached in a number of ways, the mechanisms of dam failure can be classified into two broad categories: � breaches caused by the erosion of dam material; � breaches caused by the sudden collapse of a portion of the dam (as in the case of earthquakes or geo-
technical failures, for example).
A moraine dam may collapse as a result of some external trigger or because of internal failure. A huge displacement wave can cause the water to overtop the moraine; the displacement wave can be caused by a rockslide or by an avalanche of snow or ice from the glacier terminus or by hanging glaciers falling into the lake. The displacement wave can cause a large breach that leads to dam failure (Ives 1986).
The types of failure caused by erosion of the terminal moraine can be further classified as caused by: � overtopping of the dam due to a progressive rise in the lake level or by creation of a surface wave by a
landslide, a rock fall, an icefall, ice calving, or wind waves; � piping through the dam material; � intensive rain which rapidly fills up the lake and eventually overtops or pipes through the moraine.
Richardson and Reynolds (2000) analysed 26 GLOF events in the Himalayas in the twentieth century and concluded that a majority of the moraine dam failures were triggered by overtopping usually as a consequence of a displacement wave triggered by ice avalanches into the lake from hanging or calving glaciers.
1957–59
1960–68
1975–77
1979
1983–84
1988–90
1994
1997
2002
0.61 km2
0.62 km2
0.78 km2
0.80 km2
1.02 km2
1.16 km2
1.27 km2
1.39 km2
1.65 km2
1.76 km2
0 1 2 3 km
0.23 km2
1974
1972
Figure 25: Development of the Tsho Rolpa glacial lake
Source: Shrestha (2008)
110
SESS
IoN
16
Flash Flood Risk Management – A Training of Trainers Manual
Ice-dam failure
Ice is the softest type of rock and, in the conditions found in the Himalayas, it is also usually very close to its melting point. Ice-dammed lakes are mechanically very unstable, since the ice dams can be compromised by: � flotation of the ice dam; � pressure deformation; � melting of a tunnel through or under the ice; and � drainage associated with tectonic activity.
Methods to determine whether glacial lakes are potentially dangerous
Methods to determine whether a glacial lake is potentially dangerous or not, can range from simple desk-based investigations to complicated methods, involving highly specialised field tests. In general, potentially dangerous lakes can be identified based on the following:
Volume and rise in the water level of the lake. An outburst of a relatively small lake may not have a significant impact. Lakes smaller than 0.01 km3 in volume are not considered potentially dangerous. The dynamics of the water level are also important, since an increase in the water level increases the hydrostatic pressure on the moraine dam and may cause it to collapse.
Activity of a glacial lake. Rapidly increasing lake size indicates the high probability of a GLOF. Similarly, when the lake boundary and outlet position are dynamic, high risk is also indicated.
Position of the lake. Potentially dangerous lakes are generally located at the lower end of the ablation area of the glacier near the end moraine. Only when the parent glacier is sufficiently massive can it give rise to lakes that are large enough to be dangerous. Large lakes should be regularly monitored with the help of multi-temporal satellite imaging and field investigations.
Condition of the moraine dam. The condition of the moraine damming the lake determines how stable the lake is. The possibility of outburst due to collapse of the moraine dam increases if: � the dam has a narrow crest area; � the dam has steep slopes; � the dam is ice cored; � the dam is located high above the valley floor; � there are instabilities in the slopes of the dam; � there is seepage through the moraine dam.
Condition of parent glacier and glaciers on the periphery. The terminus of the parent glacier (that is in contact with the lake) can experience calving due to the development of thermokarsts on the lower part of the terminus and exploitation of crevasses on the glacier. When a large fragment of ice drops from this terminus drops into the lake, it can cause a displacement wave that has sufficient intensity to travel across the lake and cause water to overtop the moraine dam. Similarly, when the parent glacier presents at a steep angle or when it is located on a side valley it can cause ice avalanches into a lake. Such ice avalanches can cause displacement waves capable of overtopping moraine dams.
Physical condition of the surroundings. When the mountain slopes around the lake are unstable, there is always a possibility of mass movements and snow avalanches, both of which can cause displacement waves that can overtop the moraine dams. Smaller lakes located at high altitudes can also sometimes pose a danger to a glacial lake located at a lower altitudes. When the high altitude lakes outburst they can drain into the lower altitude ones and the additional water can cause overtopping and consequent failure of the moraine dam.
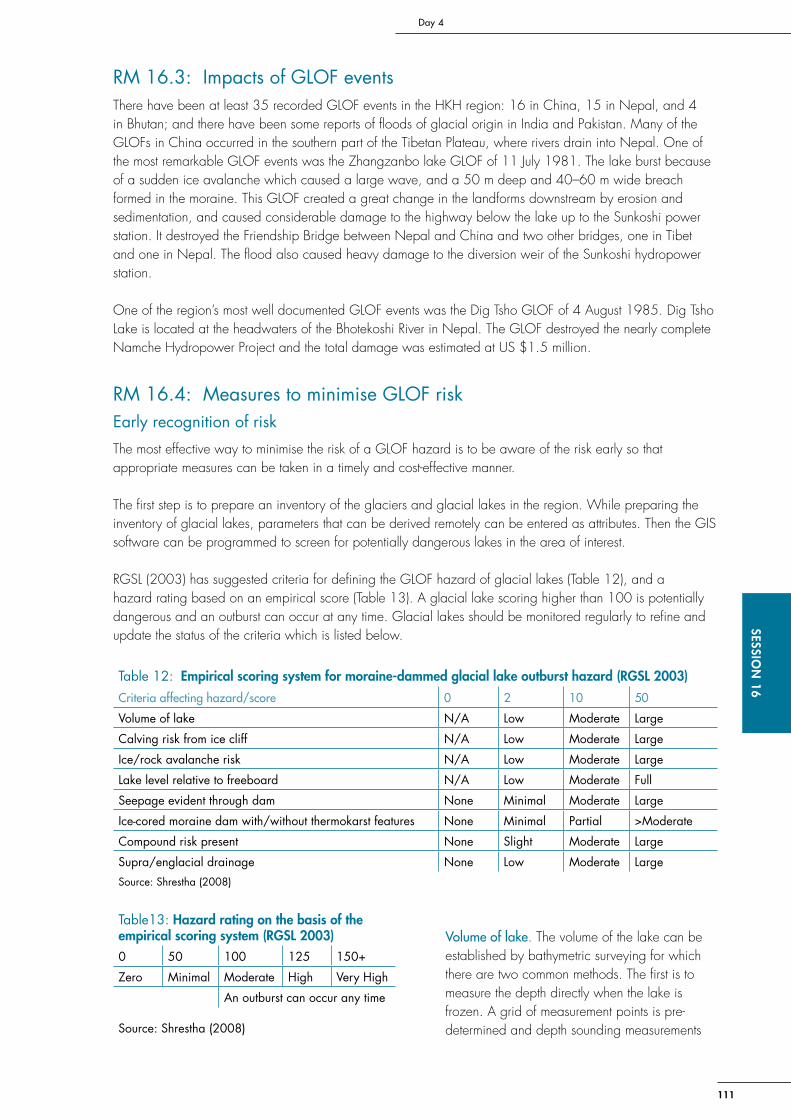
111
Day 4SESSIo
N 16
RM 16.3: Impacts of GLOF eventsThere have been at least 35 recorded GLOF events in the HKH region: 16 in China, 15 in Nepal, and 4 in Bhutan; and there have been some reports of floods of glacial origin in India and Pakistan. Many of the GLOFs in China occurred in the southern part of the Tibetan Plateau, where rivers drain into Nepal. One of the most remarkable GLOF events was the Zhangzanbo lake GLOF of 11 July 1981. The lake burst because of a sudden ice avalanche which caused a large wave, and a 50 m deep and 40–60 m wide breach formed in the moraine. This GLOF created a great change in the landforms downstream by erosion and sedimentation, and caused considerable damage to the highway below the lake up to the Sunkoshi power station. It destroyed the Friendship Bridge between Nepal and China and two other bridges, one in Tibet and one in Nepal. The flood also caused heavy damage to the diversion weir of the Sunkoshi hydropower station.
One of the region’s most well documented GLOF events was the Dig Tsho GLOF of 4 August 1985. Dig Tsho Lake is located at the headwaters of the Bhotekoshi River in Nepal. The GLOF destroyed the nearly complete Namche Hydropower Project and the total damage was estimated at US $1.5 million.
RM 16.4: Measures to minimise GLOF riskEarly recognition of risk
The most effective way to minimise the risk of a GLOF hazard is to be aware of the risk early so that appropriate measures can be taken in a timely and cost-effective manner.
The first step is to prepare an inventory of the glaciers and glacial lakes in the region. While preparing the inventory of glacial lakes, parameters that can be derived remotely can be entered as attributes. Then the GIS software can be programmed to screen for potentially dangerous lakes in the area of interest.
RGSL (2003) has suggested criteria for defining the GLOF hazard of glacial lakes (Table 12), and a hazard rating based on an empirical score (Table 13). A glacial lake scoring higher than 100 is potentially dangerous and an outburst can occur at any time. Glacial lakes should be monitored regularly to refine and update the status of the criteria which is listed below.
Table 12: Empirical scoring system for moraine-dammed glacial lake outburst hazard (RGSL 2003)
Criteriaaffectinghazard/score 0 2 10 50
Volume of lake N/A Low Moderate Large
Calving risk from ice cliff N/A Low Moderate Large
Ice/rock avalanche risk N/A Low Moderate Large
Lake level relative to freeboard N/A Low Moderate Full
Seepage evident through dam None Minimal Moderate Large
Ice-cored moraine dam with/without thermokarst features None Minimal Partial >Moderate
Compound risk present None Slight Moderate Large
Supra/englacial drainage None Low Moderate LargeSource: Shrestha (2008)
Volume of lake. The volume of the lake can be established by bathymetric surveying for which there are two common methods. The first is to measure the depth directly when the lake is frozen. A grid of measurement points is pre-determined and depth sounding measurements
Table13: Hazard rating on the basis of the empirical scoring system (RGSL 2003)0 50 100 125 150+
Zero Minimal Moderate High Very High
An outburst can occur any time
Source: Shrestha (2008)
112
SESS
IoN
16
Flash Flood Risk Management – A Training of Trainers Manual
are made through holes bored through the ice layer at these points. The measurement points are interpolated to get the total volume of the lake. Another method which is recently gaining in popularity uses echo-sounders. This method can give a relatively dense measurement in a short time. The volume thus derived can be related to the surface area of the lake and after a number of measurements the relationship of volume to area can be established.
Calving risk from ice cliffs. The status of the terminus of the parent glacier should be routinely monitored in the field. The geometry and size of the terminus can give useful information as to whether it will imminently give rise to large displacement waves. High overhanging ice-cliffs can calve, potentially giving rise to large displacement waves. A debris or ice apron in front of the ice-cliff reduces the chances that it will generate a large displacement, even when ice calving occurs. Often ice termini have a series of crevasses. The terminus and crevasses can be monitored by time lapse photography. High-resolution satellite imagery can provide some information on the crevasses, and field surveys can provide information on the height of the ice cliff.
Ice/rockavalancherisk. Ice avalanches from hanging glaciers and rock avalanches from weathered slopes can cascade into lakes where they can cause large displacement waves capable of overtopping moraine dams causing dam failure. Ice and rock avalanche areas have to be monitored regularly for early detection of possible avalanches. This can be done through a combination of visual inspection on the ground and high-resolution satellite imagery. The dynamics of the lake water level also have to be observed continuously. This can be done by establishing a lake water level measuring station. The water level data from the station can be monitored regularly by a gauge reader, or it can be read automatically using a level pressure sensor and data logger. The water level observations can be supplemented by discharge measurements, which give important additional information on the outflow from the lake.
Lake level relative to freeboard. High water level and low freeboard means that even a relatively small displacement wave can overtop the moraine dam. The dynamics of the lake water level have to be observed continually. This can be done by establishing a lake water level measuring station. The station can have a simple level gauge monitored regularly by a gauge reader, or an automatic recorder with a water level pressure sensor and data logger. The water level observation can be supplemented by discharge measurements, which will give important information on the outflow of the lake.
Seepage evident through dam. Seepage through a moraine dam may indicate that piping is taking place inside the dam; this is serious since piping is a precursor to dam failure. Seepage can also be due to rapid melting of dead ice inside the moraine dam; this is also serious since it can lead to the formation of voids inside the dam which can cause the dam to collapse. The height of the seepage outlet and seasonal fluctuations in the quantity of seepage need to be monitored. Seepage due to the infiltration of precipitation is seasonal and does not pose a serious threat to the integrity of the dam.
Ice-coredmorainedamwithorwithoutthermokarstfeatures. Thermokarsts are voids in the moraine dam caused by rapid melting of buried ice blocks. Thermokarsts reduce the structural stability of the moraine dam and make it more vulnerable to the hydrostatic pressure of the lake water. Slumping and subsidence due to the collapse of thermokarst may cause overtopping of a moraine dam and lead to its collapse. Features on the moraine such as slumping and subsidence have to be monitored regularly. Monitoring can be accomplished visually or by conducting a detailed topographic survey of the concerned area. Specialised techniques such as ground penetrating radar surveys or electro-resistivity surveys give a three-dimensional map of the buried ice.
Compound risk present. This criterion is subjective and is based on visual observations. The risk is based on the behaviour and characteristics of the end and lateral moraines and the lake surroundings. Assessment of risk involves consideration of deepening and enlargement of ponds on the moraines, presence of ponds at higher altitude above the lake, shifting and enlargement of outlet channels, etc.

113
Day 4SESSIo
N 16
Supra or englacial drainage. Parent glaciers generally contain several supra-glacial lakes and englacial channels. Occasionally these ponds drain though englacial channels into the glacial lake. Similarly, lakes at higher altitude can drain into the glacial lake. If the volume of the water released is significant, it might cause overtopping of the moraine dam. Supra-glacial ponds and high altitude lakes need to be monitored regularly. Satellite images can provide multi-temporal information on the development of supra-glacial ponds and high altitude lakes in the surrounding areas.
Estimation of peak outflow discharge
Sophisticated computer models can estimate the peak discharge of a GLOF. Due to limited resources and expertise, it is not always possible to undertake a detailed modelling exercise. Simple methods can also provide reasonably good estimates of the outburst magnitude.
Costa and Schuster (1988) suggest the following equation for predicting peak outflow discharge from a GLOF:
Q = 0.00013(Pe) 0.60
where Q is peak discharge in m3/sec, and Pe is potential energy in joules.
Pe is the energy of the lake water behind the dam prior to failure and can be calculated using the equation:
Pe = Hd x V x g
Popov (1991) suggests the following equation be used to predict flash flood peak discharge due to an outburst:
Q = 0.0048V0.896
The peak discharge depends on the volume of the glacial lake (V). The lake volume is generally not available unless a detailed bathymetric survey has been previously conducted. The surface area of the lake, however, can be easily derived from maps and satellite imagery. The volume can then be calculated using the following formula suggested by Huggel et al. (2002):
V = 0.104A1.42
The peak outburst depends on the nature of the outburst, i.e., the duration of the outburst, the nature of the outburst hydrograph, and the size and geometry of the dam breach. A simple approach is to assume a triangular breach hydrograph and to assume that the duration of the outburst is 1,000 seconds. Huggel et al. (2002) suggest that most outbursts last between 1,000 and 2,000 seconds, and that the peak discharge can be estimated as:
tVQ 2=
Estimation of the area at risk by a GLOF event
The hazard assessment should include a rough estimate of the area that can potentially be affected by a lake outburst. A worst-case scenario is generally assumed for delineating the area that could be affected. The runout (travel) distance of an outburst is related to the amount of debris that is mobilised. Outburst floods with a higher content of solid material form debris flows and stop abruptly, whereas GLOFs, that consist predominantly of water attenuate, more gradually. For a rough estimate of the maximum area that can be affected, the peak discharge is used to estimate the overall slope of the outburst flood (the average slope between the starting and the end points of an outburst event).
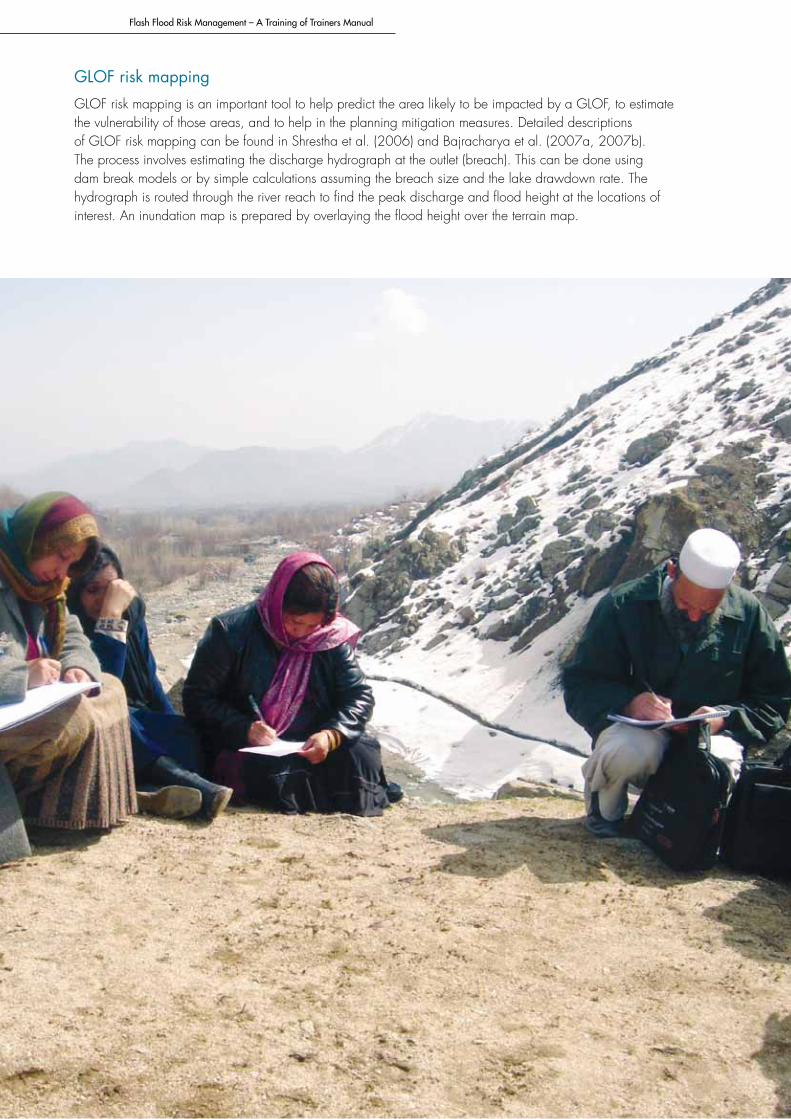
Flash Flood Risk Management – A Training of Trainers Manual
GLOF risk mapping
GLOF risk mapping is an important tool to help predict the area likely to be impacted by a GLOF, to estimate the vulnerability of those areas, and to help in the planning mitigation measures. Detailed descriptions of GLOF risk mapping can be found in Shrestha et al. (2006) and Bajracharya et al. (2007a, 2007b). The process involves estimating the discharge hydrograph at the outlet (breach). This can be done using dam break models or by simple calculations assuming the breach size and the lake drawdown rate. The hydrograph is routed through the river reach to find the peak discharge and flood height at the locations of interest. An inundation map is prepared by overlaying the flood height over the terrain map.

115
Day 4SESSIo
N 16
Briefing for the Field TripTime: 30 minutes
objectives To share information about the upcoming field trip, including
X the objectives of the trip X the list of planned activities X practical information X tips on required preparation
ActivitiesTake some time to properly orient the participants on the upcoming field trip. Make sure to mention the following. � Discuss the objectives of the field trip. � Point out each field visit site on a map, and explain how far it is and the route that will be taken. � Describe the special or unique features of each field site and relate these feature to the success or failure
of past flash flood risk management activities. � Describe the activities that the participants are going to observe, and what they are going to do in the
field. � Go over the logistics of the field trip: time of departure, time of arrival at different places, length of stay,
and what is expected at each site. � Clearly mention any necessary preparation that needs to be made beforehand; list practical items that
may be required: comfortable clothing, shoes for trekking, sun glasses, sun block, insect repellent, and other items as needed.
PreparationA little prior preparation can help to make the field trip a success. Note the following: � If at all possible, visit the sites of the field trip beforehand. � Select places where different flood risk management
measures have both been successful and unsuccessful. � Once you have decided on a location, make sure to advise
the community in-charge and others that you will be working with that you will be coming and when.
� Prepare a short description of the places to be visited, the events or activities to take place there, and any other necessary information such as the distance and the time to get there.
� Give a short presentation in which you describe the different places that the group will be visiting and point out what flood-related points of interest need to observe in each place.
� Distribute a copy of the short description of the locations to be visited to each participant after the briefing on the field trip.
Suggestions for the facilitator
(continues)

116
SESS
IoN
16
Flash Flood Risk Management – A Training of Trainers Manual
LogisticsThe following necessary items for the field trip should be provided by the facilitator: � Travel arrangement plans � Accommodation plans � Maps printed in large size (e.g., Google maps) and/or
satellite images � Drawing paper (A1 size) and camera � Drawing materials such as marker pens, pencils, tape, and
erasers
Remember to advise the local facilitator, if one is needed.
Suggestions for the facilitator (continued)

Days 5, 6, and 7Field Trip
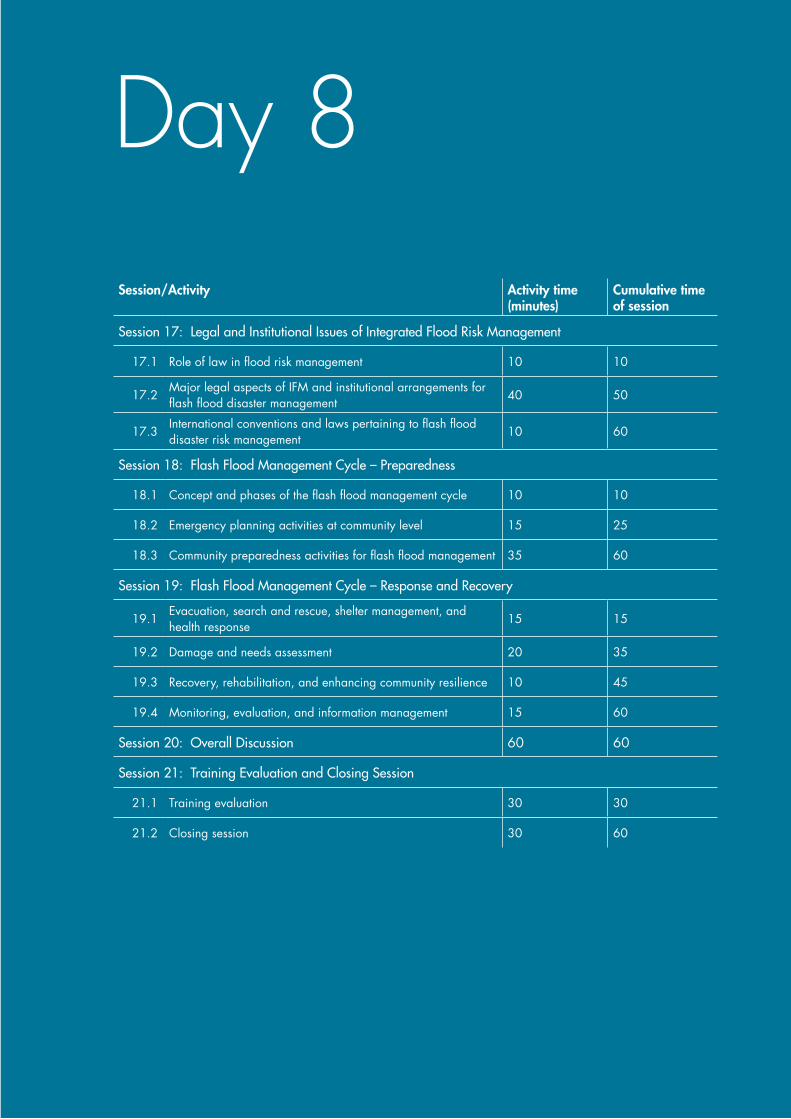
Day 8Session/Activity Activity time
(minutes)Cumulative time of session
Session 17: Legal and Institutional Issues of Integrated Flood Risk Management
17.1 Role of law in flood risk management 10 10
17.2Major legal aspects of IFM and institutional arrangements for flash flood disaster management
40 50
17.3International conventions and laws pertaining to flash flood disaster risk management
10 60
Session 18: Flash Flood Management Cycle – Preparedness
18.1 Concept and phases of the flash flood management cycle 10 10
18.2 Emergency planning activities at community level 15 25
18.3 Community preparedness activities for flash flood management 35 60
Session 19: Flash Flood Management Cycle – Response and Recovery
19.1Evacuation, search and rescue, shelter management, and health response
15 15
19.2 Damage and needs assessment 20 35
19.3 Recovery, rehabilitation, and enhancing community resilience 10 45
19.4 Monitoring, evaluation, and information management 15 60
Session 20: Overall Discussion 60 60
Session21:TrainingEvaluationandClosingSession
21.1 Training evaluation 30 30
21.2 Closing session 30 60
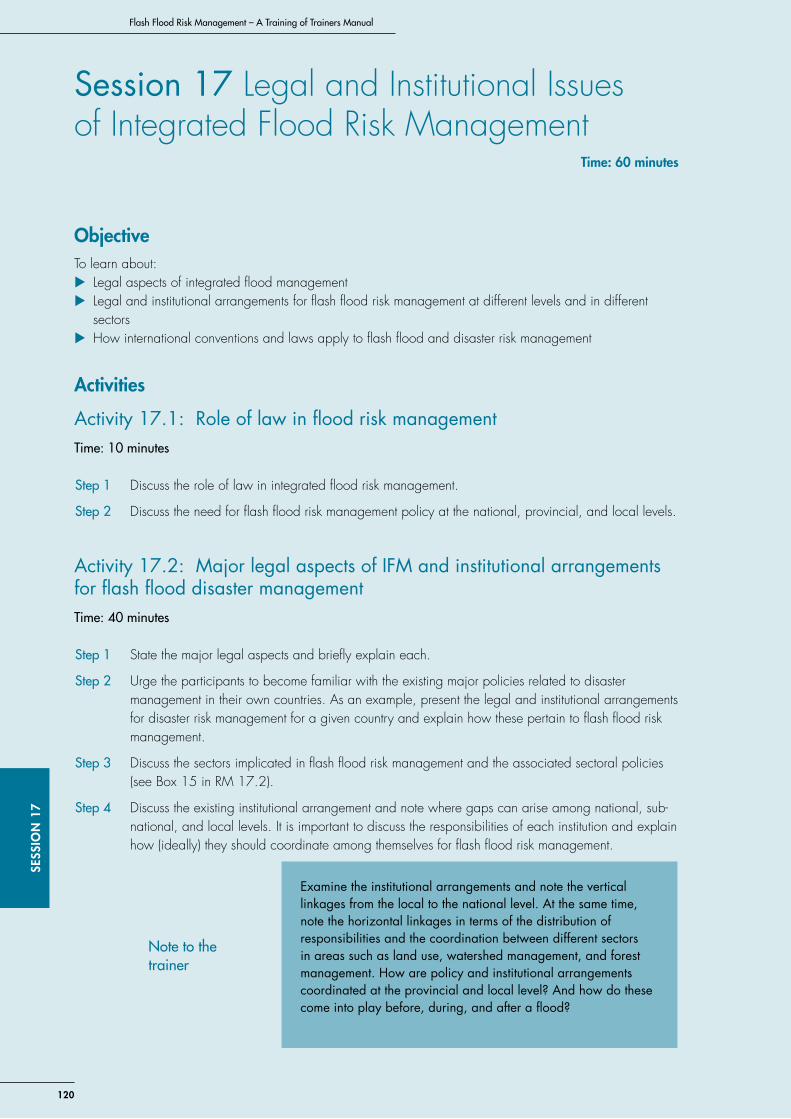
120
SESS
IoN
17
Flash Flood Risk Management – A Training of Trainers Manual
Session 17 Legal and Institutional Issues of Integrated Flood Risk Management
Time: 60 minutes
objectiveTo learn about:
X Legal aspects of integrated flood management X Legal and institutional arrangements for flash flood risk management at different levels and in different sectors
X How international conventions and laws apply to flash flood and disaster risk management
Activities
Activity 17.1: Role of law in flood risk managementTime: 10 minutes
Step 1 Discuss the role of law in integrated flood risk management.
Step 2 Discuss the need for flash flood risk management policy at the national, provincial, and local levels.
Activity 17.2: Major legal aspects of IFM and institutional arrangements for flash flood disaster managementTime: 40 minutes
Step 1 State the major legal aspects and briefly explain each.
Step 2 Urge the participants to become familiar with the existing major policies related to disaster management in their own countries. As an example, present the legal and institutional arrangements for disaster risk management for a given country and explain how these pertain to flash flood risk management.
Step 3 Discuss the sectors implicated in flash flood risk management and the associated sectoral policies (see Box 15 in RM 17.2).
Step 4 Discuss the existing institutional arrangement and note where gaps can arise among national, sub-national, and local levels. It is important to discuss the responsibilities of each institution and explain how (ideally) they should coordinate among themselves for flash flood risk management.
Examine the institutional arrangements and note the vertical linkages from the local to the national level. At the same time, note the horizontal linkages in terms of the distribution of responsibilities and the coordination between different sectors in areas such as land use, watershed management, and forest management. How are policy and institutional arrangements coordinated at the provincial and local level? And how do these come into play before, during, and after a flood?
Note to the trainer
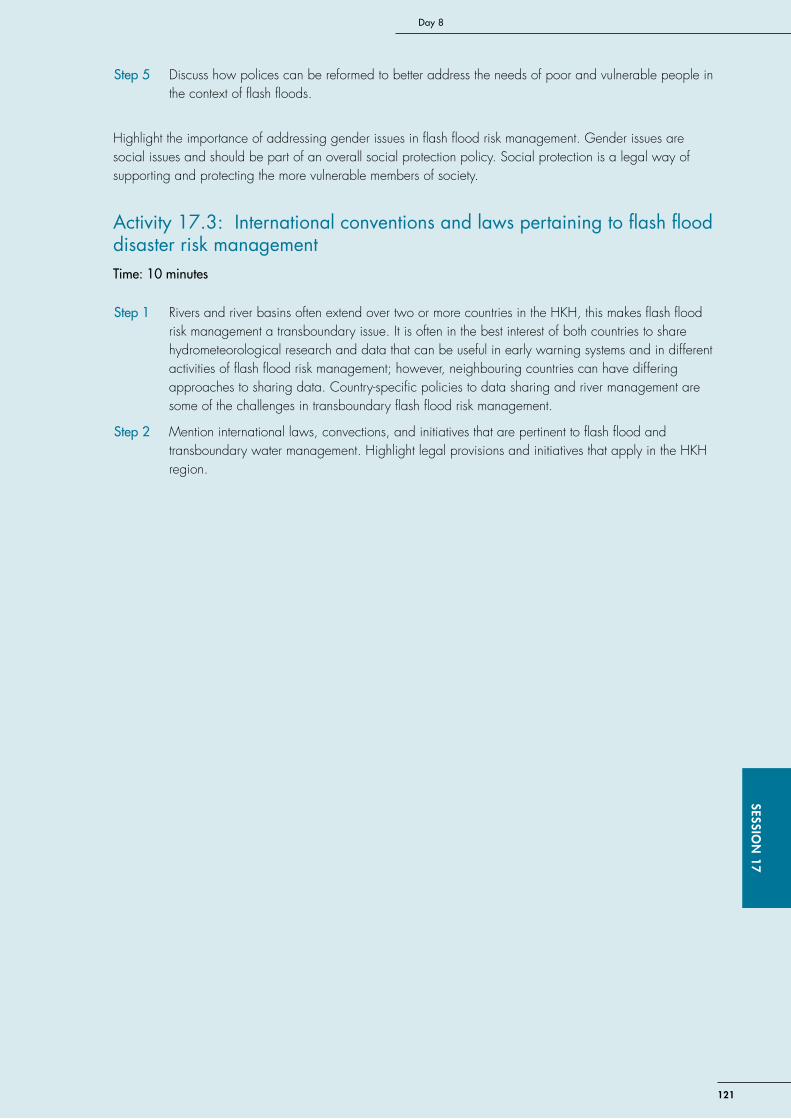
121
Day 8SESSIo
N 17
Step 5 Discuss how polices can be reformed to better address the needs of poor and vulnerable people in the context of flash floods.
Highlight the importance of addressing gender issues in flash flood risk management. Gender issues are social issues and should be part of an overall social protection policy. Social protection is a legal way of supporting and protecting the more vulnerable members of society.
Activity 17.3: International conventions and laws pertaining to flash flood disaster risk managementTime: 10 minutes
Step 1 Rivers and river basins often extend over two or more countries in the HKH, this makes flash flood risk management a transboundary issue. It is often in the best interest of both countries to share hydrometeorological research and data that can be useful in early warning systems and in different activities of flash flood risk management; however, neighbouring countries can have differing approaches to sharing data. Country-specific policies to data sharing and river management are some of the challenges in transboundary flash flood risk management.
Step 2 Mention international laws, convections, and initiatives that are pertinent to flash flood and transboundary water management. Highlight legal provisions and initiatives that apply in the HKH region.
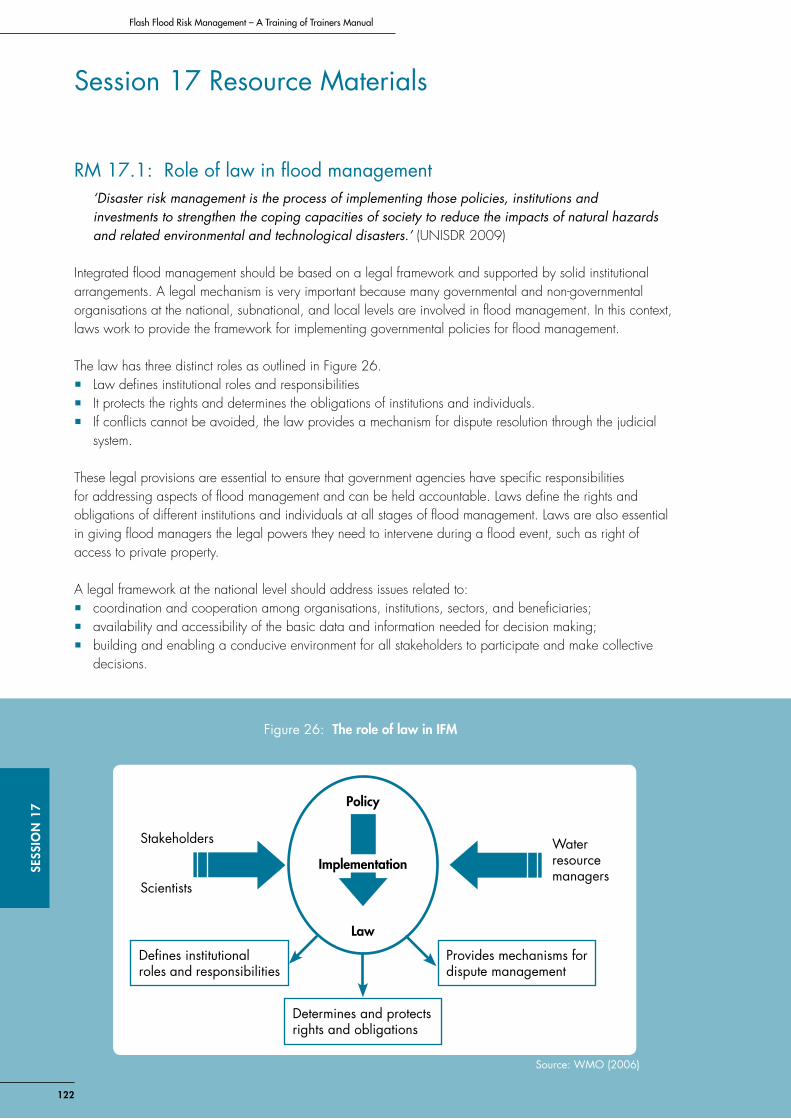
122
SESS
IoN
17
Flash Flood Risk Management – A Training of Trainers Manual
Session 17 Resource Materials
RM 17.1: Role of law in flood management‘Disaster risk management is the process of implementing those policies, institutions and investments to strengthen the coping capacities of society to reduce the impacts of natural hazards and related environmental and technological disasters.’ (UNISDR 2009)
Integrated flood management should be based on a legal framework and supported by solid institutional arrangements. A legal mechanism is very important because many governmental and non-governmental organisations at the national, subnational, and local levels are involved in flood management. In this context, laws work to provide the framework for implementing governmental policies for flood management.
The law has three distinct roles as outlined in Figure 26. � Law defines institutional roles and responsibilities � It protects the rights and determines the obligations of institutions and individuals. � If conflicts cannot be avoided, the law provides a mechanism for dispute resolution through the judicial
system.
These legal provisions are essential to ensure that government agencies have specific responsibilities for addressing aspects of flood management and can be held accountable. Laws define the rights and obligations of different institutions and individuals at all stages of flood management. Laws are also essential in giving flood managers the legal powers they need to intervene during a flood event, such as right of access to private property.
A legal framework at the national level should address issues related to: � coordination and cooperation among organisations, institutions, sectors, and beneficiaries; � availability and accessibility of the basic data and information needed for decision making; � building and enabling a conducive environment for all stakeholders to participate and make collective
decisions.
Figure 26: The role of law in IFM
Source: WMO (2006)
Policy
Law
Implementation
Stakeholders Water resource managers
Scientists
Defines institutional roles and responsibilities
Determines and protects rights and obligations
Provides mechanisms for dispute management
123
Day 8SESSIo
N 17
RM 17.2: Major legal aspects of IFM and institutional arrangementsThe four major legal aspects of integrated flood management are: � ensuring coordination and integration across institutional boundaries; � generating and sharing information; � enabling stakeholder participation; � ensuring rights, powers, and obligations.
Ensuring coordination and integration across institutional boundaries
Ensuring coordination and integration across institutional boundaries is one of the major legal themes of IFM. Within the concept of IWRM, flood management decisions must take into account both how to alleviate flood risk and how to minimise the socio-economic impact. It is more likely to achieve good results when an integrated basin approach is used; but an integrated approach requires that a number of institutions and authorities work together, and for this it is essential to ensure coordination among them (Box 15).
Ensuring coordination requires that: first, planning at the governmental level must be integrated so that the government’s strategy, which is implemented through different departments, is coherent and harmonised; and second, that it must be applied at all levels of public planning, whether national, regional or local, and involve all relevant public agencies. At the same time, there should also be some mechanism to ensure that local views and experiences are in turn fed back into the national planning processes.
Figure 27 shows how horizontal and vertical interactions work to integrate various stakeholders and interest groups at all relevant areas of government planning. The horizontal axis shows interactions between the various government departments and ministries (at all levels), and how stakeholders and interest groups are involved in the decision-making processes. The vertical axis shows consistency in the policy and planning processes and implementation at different levels of government. From the local level up, plans should be consistent with those produced at the next higher level.
The need for a coordinated and integrated approach can be illustrated by the example of land use planning. Since land use influences flood risk and water management in general, it is imperative that land use planning and water use allocation be properly coordinated. Land use in a given area (whether urban or rural) can affect flood risk elsewhere in the basin. Moreover, the consequences for flood risk from the forestry sector (e.g., uncontrolled logging) can have consequences for erosion and, to a limited extent, for flood peaks. Similarly, agricultural land use practices (e.g., topsoil compaction) can have consequences for downstream river regimes. Consequently, forestry policy and planning should be subject to flood risk assessment. The technical aspects of forestry and agricultural practices with regards to land use may also be subject to regulations but these may be more difficult to enforce.
Information generation and sharing
Robust notification and information are required. Flood management strategies need to be based on scientific data gathered by a number of agencies and need to be constantly reviewed in the light of new data
Box 15: Major sectors having policies relevant to flash flood management
� Agriculture and food security � Land use (zonation) � Forestry � River valley management � Watershed management � Health � Education � Physical planning and infrastructure
development � Water and sanitation � Information and communication
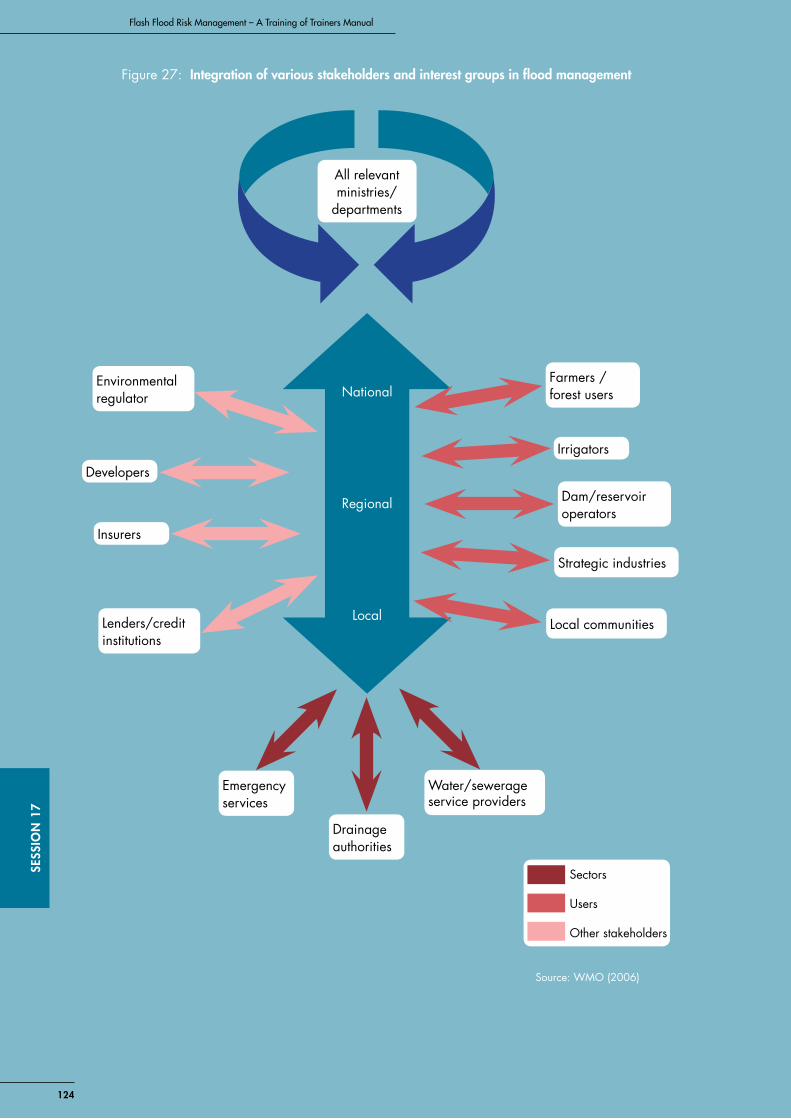
124
SESS
IoN
17
Flash Flood Risk Management – A Training of Trainers Manual
Figure 27: Integration of various stakeholders and interest groups in flood management
All relevantministries/
departments
Environmental regulator
Developers
Insurers
Lenders/credit institutions
Emergencyservices
Drainage authorities
Water/sewerageservice providers
Local communities
Strategic industries
Dam/reservoiroperators
Irrigators
Farmers / forest usersNational
Regional
Local
Sectors
Users
Other stakeholders
Source: WMO (2006)
125
Day 8SESSIo
N 17
gathered with each new flood event. Mechanisms must therefore be in place to feed basic planning data and assessments of actual performance back into the strategic planning process. Various types of information that are generated in the monitoring process are required for preparedness as well as to keep improving strategies for emergency response, and these need to be shared across administrative boundaries.
Raising the awareness of property owners and stakeholders on the risks of flooding is paramount. When stakeholders understand the risks to which they are exposed, they are more likely to participate in the planning process. The flood hazard maps and all of the plans, programmes, and strategies that have been devised form the basic information package that should be shared with all stakeholders as part of their pre-flood preparedness. These, along with the related timing and background information that have been subjected to public scrutiny, must be made available and accessible to the public at large.
Information about the rights, powers, and obligations of the concerned authorities for the provision of flood forecasting, warning, and emergency response should also be shared. The rights of access of authorities to relevant information should be made clear, and the availability of such information should be ensured (basin wide). Authorities should be obligated to broadcast flood warnings in the mass media. Unambiguous assignment of responsibilities is also essential for establishment of liabilities in the case that warnings are issued too late, inaccurately, or without just cause.
Enabling stakeholder participation
Stakeholder participation is central to the IFM concept. In order for IFM to deliver maximum benefit to the largest number of people, all stakeholders must be involved in the decision-making process. The level of participation of the different interested groups will vary depending on their expertise and whether they are involved nationally or locally, however, regardless of the level of involvement, without effective participation from all quarters, IFM cannot succeed.
The realisation that the participation of stakeholders in flood management is necessary leads to a number of questions, such as: � Who are the stakeholders? � What decisions should they be involved in? � What information should be provided, and how, to achieve effective participation? � How much consideration should be given to stakeholder views? � What rights, powers, and obligations should the stakeholders and the decision-making authorities have?
It is important to recognise that the stakeholders referred to above include not only property owners and inhabitants of the area (who are particularly vulnerable to flooding), but also other bodies that have an interest in the way the decisions affecting flood management are made. If flood management is to be sustainable, it must accommodate the economic, environmental, and social needs of the basin, and stakeholders reflecting each of these aspects must have a role in the way flood management is planned and implemented.
Ensuring rights, powers, and obligations
Institutions and individuals must have the necessary rights and power to implement the legal provisions related to flash flood management. Legislation works within the framework of the constitution of a country. Constitutional rights differ from those arising from the overall statutory framework. The rights of institutions and organisations need to be examined separately from the rights afforded to individuals. Some countries have promoted decentralisation and transferred powers to formal village groups and associations; in that context group rights have been significant. With the adoption of integrated and participatory approaches to flood management there is a growing need to develop conditions under which groups can form legally constituted associations or local self-governance units to exercise their legal rights.
126
SESS
IoN
17
Flash Flood Risk Management – A Training of Trainers Manual
In general, the property owner has a corresponding right to claim compensation for any damage caused by the construction of works which need to be implemented during a flood emergency. When private land has to be expropriated for flood defence work or for flood retention, the expropriating authority must have adequate purchasing power to be able to compensate the landowner.
RM 17.3: International conventions and laws that pertain to flash flood and disaster managementMany international laws and initiatives pertain to flood management. For example, � the 1997 United Nations Convention on the Law of the Non-navigational Uses of International
Watercourses (also known as the United Nations Watercourses Convention) – the only global framework treaty to address the use of rivers for purposes other than navigation – adopted IFM as its central policy concept in the area of water hazard and risk (UN, 2005);
� the International Flood Initiative adopted IFM as a central policy concept (UNESCO-IHP, 2007); � the Hyogo Framework for Action explicitly recognises the need for IFM strategies (UNISDR 2005).
Basic principles of the 1997 United Nations Watercourses Convention
Equitableandreasonableutilisation. In articles 5 and 6, the principle of equitable and reasonable utilisation is spelled out as follows:
Utilisation of an international watercourse in an equitable and reasonable manner … requires taking into account all relevant factors and circumstances, including:• Geographic, hydrographic, hydrological, climatic, ecological and other factors of a natural
character;• The social and economic needs of the watercourse States concerned;• The population dependent on the watercourse in each watercourse State;• The effects of the use or uses of the watercourses in one watercourse State on other watercourse
States;• Existing and potential uses of the watercourse;• Conservation, protection, development and economy of use of the water resources of the
watercourse and the costs of measures taken to that effect;• The availability of alternatives, of comparable value, to a particular planned or existing use.
… The weight to be given to each factor is to be determined by its importance in comparison with that of other relevant factors. In determining what is a reasonable and equitable use, all relevant factors are to be considered together and a conclusion reached on the basis of the whole.
No significant harm. Closely linked to the rule of equitable and reasonable utilisation is the obligation that watercourse States not cause significant harm. While the rule of equitable and reasonable utilisation focuses on balancing competing interests, the focus on ‘no significant harm’ is on the management of risk. “Watercourse States shall … take all appropriate measures to prevent the causing of significant harm to other watercourse States.”
The Convention seeks to harmonise the obligation of no significant harm with that of equitable and reasonable utilisation by stating in Article 7(2) that:
Where significant harm nevertheless is caused to another watercourse State, the States whose use causes such harm shall, in the absence of agreement to such use, take all appropriate measures, having due regard to the provisions of articles 5 and 6, in consultation with the affected States, to eliminate or mitigate such harm and, where appropriate, to discuss the question of compensation.
127
Day 8SESSIo
N 17
Precautionary principle
The precautionary principle can broadly be defined as “the imposition of controls in advance of complete scientific understanding” (WMO 2006). In the context of environmental protection, Principle 15 of the Rio Declaration provides that: “where there are threats of serious or irreversible damage, lack of full scientific certainty shall not be used as a reason for postponing cost-effective measures to prevent environmental degradation” (UN, 1992a).
A precautionary approach could equally be taken with respect to the protection of human life or property. Article 3(3) of the United Nations Framework Convention on Climate Change states that: “The Parties should take precautionary measures to anticipate, prevent or minimise the causes of climate change and mitigate its adverse effects. Where there are threats of serious or irreversible damage, lack of full scientific certainty should not be used as a reason for postponing such measures, taking into account that policies and measures to deal with climate change should be cost-effective so as to ensure global benefits at the lowest possible cost” (UN, 1992b).
Legal framework for IFM in transboundary basins
The HKH region has many transboundary river basins. The most relevant law relating to flood management issues at the transboundary level is the Law of International Watercourses, which includes United Nations Watercourse Convention. It will be necessary to explore whether other provisions, such as the protection of the environment and the principles enunciated in other related international conventions and protocols, could be drawn upon to establish a legal framework for IFM in transboundary basins.
128
SESS
IoN
18
Flash Flood Risk Management – A Training of Trainers Manual
Session 18 Flash Flood Management Cycle – Preparedness
Time: 60 minutes
objective To understand the management cycle for flash flood preparedness and its related activities, which includes understanding the following:
X The different phases of the flash flood management cycle X The importance of emergency planning and related activities X Different preparedness activities
ActivitiesActivity 18.1: Concept and phases of the flash flood management cycle Time: 10 minutes
Discuss the flash flood management cycle. Clarify that it starts with community preparedness before the flood event, follows through with response during the event, and wraps up with recovery activities after the flood.
Activity 18.2: Emergency planning activities at community levelTime: 15 minutes
Step 1 Highlight the need for emergency planning for flash flood management. Clarify who is responsible, what the activities are, and how the activities are managed.
Step 2 Discuss the major activities for emergency planning. Discuss what resources, equipment, and materials may be needed, how to plan for safe places, and how to address the specific needs of women, children, the elderly, and the disabled.
Activity 18.3: Community preparedness activities for flash flood managementTime: 35 minute
Step 1 Review what a community can do to be prepared for a flash flood. Highlight the importance of community and household awareness and preparedness (see Box 16 in RM 18.3). Engage the
Remind the class that community-based flash flood management and social hazard mapping was discussed in Sessions 7 and 9 and that the Community Flash Flood Risk Management Committee (CFFRMC) is responsible for undertaking emergency planning and preparedness activities at the community level.
Note to the trainer
129
Day 8SESSIo
N 18
class in a short question and answer session in which they are asked to come up with different methods that can be used to raise community awareness. Get the class to think about how different segments of the society can be reached.
Step 2 Quickly review the different flood forecasting and early warning systems that may be available; remember to include local knowledge for early warning. Review what a community should do if any of the warning systems signal an impending flood.
Step 3 Discuss the various systems that are used for early warning in local communities, such as the herder relay system (as in Pakistan), watchtowers with an alarm (as in Chitwan, Nepal), big fires, and the sounding of various musical instruments. Highlight the importance of communicating early warning information in a way that is easy to understand, time and cost effective, and sustainable. Discuss ways of making information from scientific early warning systems more understandable to local communities.
Step 4 Discuss what small structural and non-structural methods people can use for hazard mitigation. Mention how techniques such as bioengineering and ethno-engineering can be used for flash flood hazard mitigation.
Step 5 Explain that during an emergency situation, it is necessary to establish a control room. Go over the functions of a control room, and review related information such as where to locate it (geophysical location), minimum area requirements, how far it can be from settlements, and safe access routes.
Ask participants what community awareness measures are most effective in their region. Discuss why early warning systems, even if they are available, might not be effective. For example, communities in remote mountain communities may not have a local radio station, and if they do, not every family may own a radio. Some segments of the community, e.g., women, do not often have time to listen to radio or other reports. Since scientific warnings and data, before they are edited for mass media, are not appropriate for distribution to the community, local knowledge still plays a vital role in the community.
Emphasise that the participants need to be sensitive to community perception. In many communities, respected individuals or organisations (e.g., the village head, school teacher, or health workers) are considered the most reliable and authentic bearers of information, and their advice is heeded. The CFFRMC can mobilise these persons and organisations for effective communication and awareness rising.
Note to the trainer
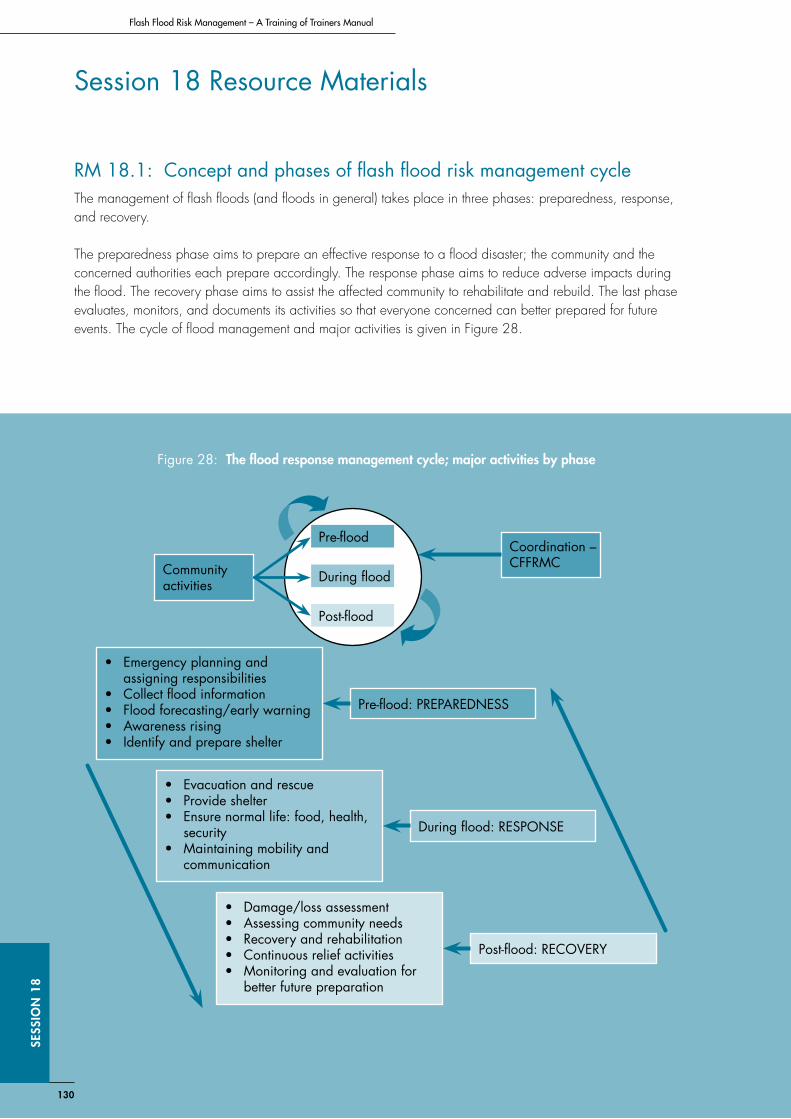
130
SESS
IoN
18
Flash Flood Risk Management – A Training of Trainers Manual
Session 18 Resource Materials
RM 18.1: Concept and phases of flash flood risk management cycleThe management of flash floods (and floods in general) takes place in three phases: preparedness, response, and recovery.
The preparedness phase aims to prepare an effective response to a flood disaster; the community and the concerned authorities each prepare accordingly. The response phase aims to reduce adverse impacts during the flood. The recovery phase aims to assist the affected community to rehabilitate and rebuild. The last phase evaluates, monitors, and documents its activities so that everyone concerned can better prepared for future events. The cycle of flood management and major activities is given in Figure 28.
Community activities
Coordination – CFFRMC
Pre-flood
During flood
Post-flood
• Emergencyplanningandassigning responsibilities
• Collectfloodinformation• Floodforecasting/earlywarning• Awarenessrising• Identifyandprepareshelter
• Evacuationandrescue• Provideshelter• Ensurenormallife:food,health,
security• Maintainingmobilityand
communication
• Damage/lossassessment• Assessingcommunityneeds• Recoveryandrehabilitation• Continuousreliefactivities• Monitoringandevaluationfor
better future preparation
Pre-flood: PREPAREDNESS
During flood: RESPONSE
Post-flood: RECOVERY
Figure 28: The flood response management cycle; major activities by phase
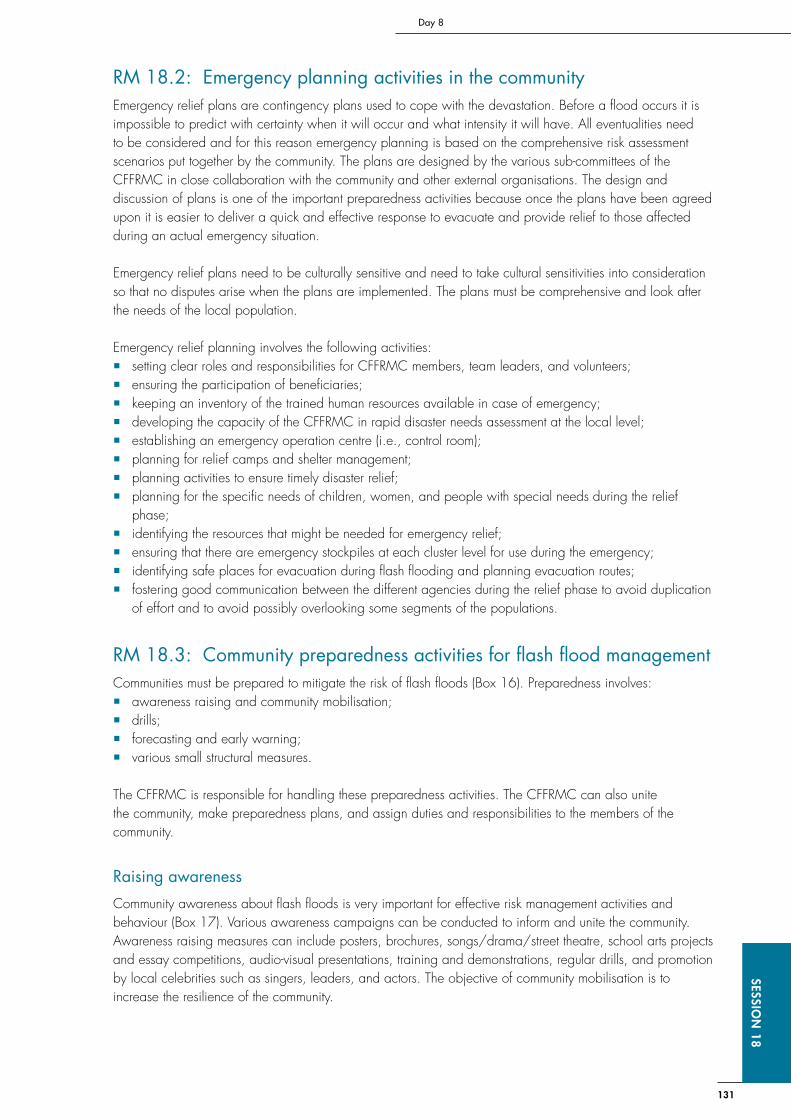
131
Day 8SESSIo
N 18
RM 18.2: Emergency planning activities in the communityEmergency relief plans are contingency plans used to cope with the devastation. Before a flood occurs it is impossible to predict with certainty when it will occur and what intensity it will have. All eventualities need to be considered and for this reason emergency planning is based on the comprehensive risk assessment scenarios put together by the community. The plans are designed by the various sub-committees of the CFFRMC in close collaboration with the community and other external organisations. The design and discussion of plans is one of the important preparedness activities because once the plans have been agreed upon it is easier to deliver a quick and effective response to evacuate and provide relief to those affected during an actual emergency situation.
Emergency relief plans need to be culturally sensitive and need to take cultural sensitivities into consideration so that no disputes arise when the plans are implemented. The plans must be comprehensive and look after the needs of the local population.
Emergency relief planning involves the following activities: � setting clear roles and responsibilities for CFFRMC members, team leaders, and volunteers; � ensuring the participation of beneficiaries; � keeping an inventory of the trained human resources available in case of emergency; � developing the capacity of the CFFRMC in rapid disaster needs assessment at the local level; � establishing an emergency operation centre (i.e., control room); � planning for relief camps and shelter management; � planning activities to ensure timely disaster relief; � planning for the specific needs of children, women, and people with special needs during the relief
phase; � identifying the resources that might be needed for emergency relief; � ensuring that there are emergency stockpiles at each cluster level for use during the emergency; � identifying safe places for evacuation during flash flooding and planning evacuation routes; � fostering good communication between the different agencies during the relief phase to avoid duplication
of effort and to avoid possibly overlooking some segments of the populations.
RM 18.3: Community preparedness activities for flash flood managementCommunities must be prepared to mitigate the risk of flash floods (Box 16). Preparedness involves: � awareness raising and community mobilisation; � drills; � forecasting and early warning; � various small structural measures.
The CFFRMC is responsible for handling these preparedness activities. The CFFRMC can also unite the community, make preparedness plans, and assign duties and responsibilities to the members of the community.
Raising awareness
Community awareness about flash floods is very important for effective risk management activities and behaviour (Box 17). Various awareness campaigns can be conducted to inform and unite the community. Awareness raising measures can include posters, brochures, songs/drama/street theatre, school arts projects and essay competitions, audio-visual presentations, training and demonstrations, regular drills, and promotion by local celebrities such as singers, leaders, and actors. The objective of community mobilisation is to increase the resilience of the community.
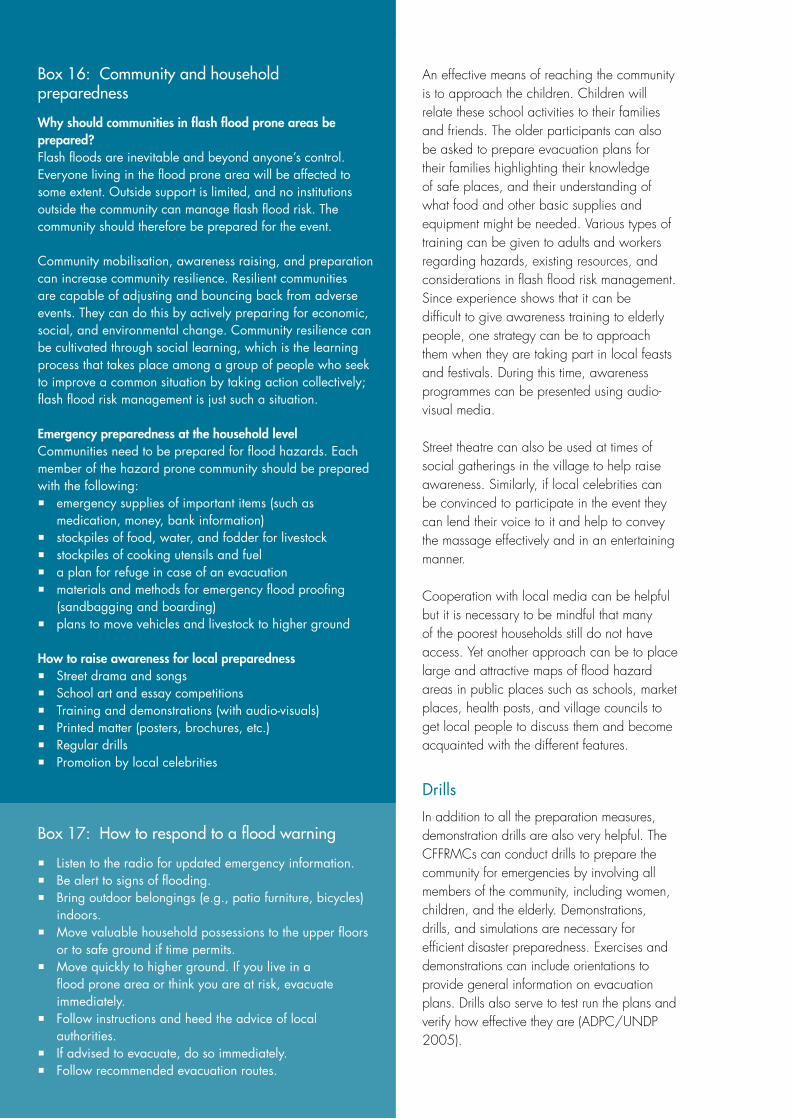
132
SESS
IoN
18
Flash Flood Risk Management – A Training of Trainers Manual
132
SESS
IoN
18
Flash Flood Risk Management – A Training of Trainers Manual
An effective means of reaching the community is to approach the children. Children will relate these school activities to their families and friends. The older participants can also be asked to prepare evacuation plans for their families highlighting their knowledge of safe places, and their understanding of what food and other basic supplies and equipment might be needed. Various types of training can be given to adults and workers regarding hazards, existing resources, and considerations in flash flood risk management. Since experience shows that it can be difficult to give awareness training to elderly people, one strategy can be to approach them when they are taking part in local feasts and festivals. During this time, awareness programmes can be presented using audio-visual media.
Street theatre can also be used at times of social gatherings in the village to help raise awareness. Similarly, if local celebrities can be convinced to participate in the event they can lend their voice to it and help to convey the massage effectively and in an entertaining manner.
Cooperation with local media can be helpful but it is necessary to be mindful that many of the poorest households still do not have access. Yet another approach can be to place large and attractive maps of flood hazard areas in public places such as schools, market places, health posts, and village councils to get local people to discuss them and become acquainted with the different features.
Drills
In addition to all the preparation measures, demonstration drills are also very helpful. The CFFRMCs can conduct drills to prepare the community for emergencies by involving all members of the community, including women, children, and the elderly. Demonstrations, drills, and simulations are necessary for efficient disaster preparedness. Exercises and demonstrations can include orientations to provide general information on evacuation plans. Drills also serve to test run the plans and verify how effective they are (ADPC/UNDP 2005).
Box 16: Community and household preparedness
Why should communities in flash flood prone areas be prepared? Flash floods are inevitable and beyond anyone’s control. Everyone living in the flood prone area will be affected to some extent. Outside support is limited, and no institutions outside the community can manage flash flood risk. The community should therefore be prepared for the event.
Community mobilisation, awareness raising, and preparation can increase community resilience. Resilient communities are capable of adjusting and bouncing back from adverse events. They can do this by actively preparing for economic, social, and environmental change. Community resilience can be cultivated through social learning, which is the learning process that takes place among a group of people who seek to improve a common situation by taking action collectively; flash flood risk management is just such a situation.
Emergency preparedness at the household levelCommunities need to be prepared for flood hazards. Each member of the hazard prone community should be prepared with the following: � emergency supplies of important items (such as
medication, money, bank information) � stockpiles of food, water, and fodder for livestock � stockpiles of cooking utensils and fuel � a plan for refuge in case of an evacuation � materials and methods for emergency flood proofing
(sandbagging and boarding) � plans to move vehicles and livestock to higher ground
How to raise awareness for local preparedness � Street drama and songs � School art and essay competitions � Training and demonstrations (with audio-visuals) � Printed matter (posters, brochures, etc.) � Regular drills � Promotion by local celebrities
Box 17: How to respond to a flood warning
� Listen to the radio for updated emergency information. � Be alert to signs of flooding. � Bring outdoor belongings (e.g., patio furniture, bicycles)
indoors. � Move valuable household possessions to the upper floors
or to safe ground if time permits. � Move quickly to higher ground. If you live in a
flood prone area or think you are at risk, evacuate immediately.
� Follow instructions and heed the advice of local authorities.
� If advised to evacuate, do so immediately. � Follow recommended evacuation routes.
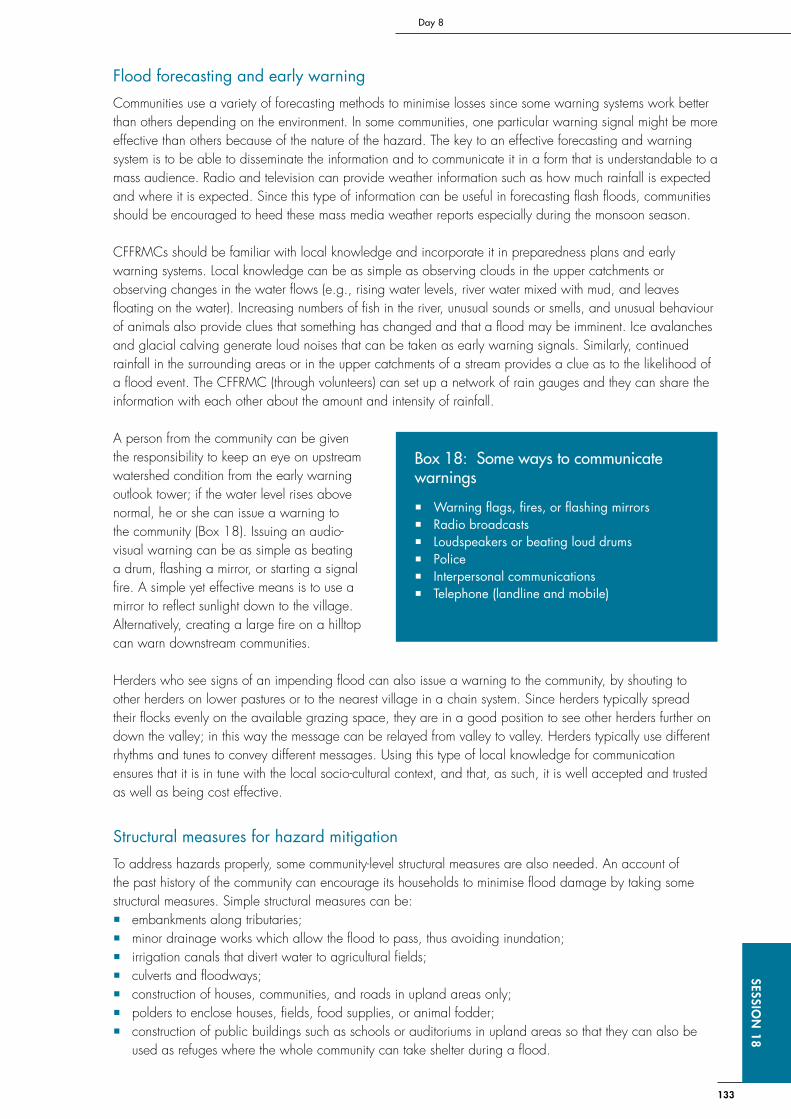
133
Day 8SESSIo
N 18
Flood forecasting and early warning
Communities use a variety of forecasting methods to minimise losses since some warning systems work better than others depending on the environment. In some communities, one particular warning signal might be more effective than others because of the nature of the hazard. The key to an effective forecasting and warning system is to be able to disseminate the information and to communicate it in a form that is understandable to a mass audience. Radio and television can provide weather information such as how much rainfall is expected and where it is expected. Since this type of information can be useful in forecasting flash floods, communities should be encouraged to heed these mass media weather reports especially during the monsoon season.
CFFRMCs should be familiar with local knowledge and incorporate it in preparedness plans and early warning systems. Local knowledge can be as simple as observing clouds in the upper catchments or observing changes in the water flows (e.g., rising water levels, river water mixed with mud, and leaves floating on the water). Increasing numbers of fish in the river, unusual sounds or smells, and unusual behaviour of animals also provide clues that something has changed and that a flood may be imminent. Ice avalanches and glacial calving generate loud noises that can be taken as early warning signals. Similarly, continued rainfall in the surrounding areas or in the upper catchments of a stream provides a clue as to the likelihood of a flood event. The CFFRMC (through volunteers) can set up a network of rain gauges and they can share the information with each other about the amount and intensity of rainfall.
A person from the community can be given the responsibility to keep an eye on upstream watershed condition from the early warning outlook tower; if the water level rises above normal, he or she can issue a warning to the community (Box 18). Issuing an audio-visual warning can be as simple as beating a drum, flashing a mirror, or starting a signal fire. A simple yet effective means is to use a mirror to reflect sunlight down to the village. Alternatively, creating a large fire on a hilltop can warn downstream communities.
Herders who see signs of an impending flood can also issue a warning to the community, by shouting to other herders on lower pastures or to the nearest village in a chain system. Since herders typically spread their flocks evenly on the available grazing space, they are in a good position to see other herders further on down the valley; in this way the message can be relayed from valley to valley. Herders typically use different rhythms and tunes to convey different messages. Using this type of local knowledge for communication ensures that it is in tune with the local socio-cultural context, and that, as such, it is well accepted and trusted as well as being cost effective.
Structural measures for hazard mitigation
To address hazards properly, some community-level structural measures are also needed. An account of the past history of the community can encourage its households to minimise flood damage by taking some structural measures. Simple structural measures can be: � embankments along tributaries; � minor drainage works which allow the flood to pass, thus avoiding inundation; � irrigation canals that divert water to agricultural fields; � culverts and floodways; � construction of houses, communities, and roads in upland areas only; � polders to enclose houses, fields, food supplies, or animal fodder; � construction of public buildings such as schools or auditoriums in upland areas so that they can also be
used as refuges where the whole community can take shelter during a flood.
Box 18: Some ways to communicate warnings
� Warning flags, fires, or flashing mirrors � Radio broadcasts � Loudspeakers or beating loud drums � Police � Interpersonal communications � Telephone (landline and mobile)
134
SESS
IoN
18
Flash Flood Risk Management – A Training of Trainers Manual
In constructing buildings with the intention that they can also be used as refuges, it should be remembered that they will need to have access to a safe supply of drinking water and sanitary facilities.
Control room
A well equipped central location is needed for the use of the early warning and communications team to use as a headquarters where they can carry out management activities. The control room should be located in a convenient and easily accessible location that is also out of immediate danger. The location of the control room needs to be decided upon before the flood season begins and needs to be operational on a 24-hour basis during the flood.
The control room not only acts as a centre for information dissemination but it can also be used as a place to: prepare advance contingency plans, to conduct rescue drills, to gather the community and assign duties during a flood, to train volunteers, and to store emergency supplies and equipment.
Some suggested features of a control room are: � convenient, safe, and easily accessible location; � the facility for an enquiry counter and information display board; � communication links such as landline telephone, FAX, mobile communication, radio, television, and
computer with Internet access; � ready access to up-to-date information;
The functions of the control room are: � to be the headquarters for receiving weather forecast information; � to be the location where villagers can learn about possible air dropping sites; � to pass on messages from every part of the affected area to the appropriate authorities; � to collect the information that will be needed for distributing relief items after the event; � to keep updated inventory of rescue items.
135
Day 8SESSIo
N 19
Session 19 Flash Flood Management Cycle – Response and Recovery
Time: 60 minutes
objective To become familiar with the response and recovery phases of the flash flood management cycle and their associated activities, such as:
X How and where to evacuate, search and rescue procedures, temporary shelter management, health and special needs
X How to carry out damage and needs assessment X The activities involved in recovery and rehabilitation, and methods of enhancing community resilience X Methods of monitoring, evaluation, and information management
Activities
Activity 19.1: Evacuation, search and rescue, shelter management, and health responseTime: 15 minutes
Step 1 Discuss the aim of evacuation and rescue. Engage the class in a short question and answer session on what factors to consider when responding to a flood. Summarise and prioritise the answers. Go over the steps that the evacuation and rescue teams of the CFFRMC should undertake. Reiterate that evacuations are most effective when the community has had a chance to think about their response beforehand either by participating in the social hazard map or by being informed through an awareness campaign.
Step 2 Go over the list of things that the community should do both inside and outside the home during a flash flood (see Box 21 in RM 19.1).
Step 3 Discuss practical aspects of search and rescue and list what major equipment can be useful.
Step 4 Discuss the importance of temporary shelters and shelter management. Emphasise the need for women to have some privacy, and the requirement for other special needs groups such as children, the elderly, and the disabled to be cared for.
Step 5 Go over the list of health issues that can be expected after a flood and what medication needs to be stocked.
Step 6 Go over the need to practice good hygiene. Mention the need for proper disposal of waste, human corpses, animal carcases, and the like.
Step 7 Make sure that everyone is aware of the special health needs of women, children, the sick, and the disabled.
Flash Flood Risk Management: A Training of Trainers Manual
136
SESS
IoN
19
Activity 19.2: Damage and needs assessmentTime: 20 minutes
Step 1 Discuss the importance of damage assessment.
Step 2 Distinguish between ‘damage assessment’ and ‘needs assessment’. List the types of damage that can be expected after a flood and for each one discuss what ‘needs’ should be considered.
Step 3 Present methods for assessing physical, quantifiable damage and non-physical damage. Physical damage refers to damage to physical entities and assets (e.g., infrastructure), while non-physical damage (which can be difficult to quantify) refers to loss of agricultural productivity, physiological stress to people, injury or death of human beings and livestock, etc. A detailed inventory of each type of damage should be prepared for damage and loss assessment. Examples of checklists for both types of damage, physical and non-physical, are given in Handout 19.2. Checklists should include detailed information on the type of damage, the location of the damage, the estimated cost, and so on. The list can be prepared using participatory rural appraisal methods. The CFFRM team members should work in collaboration with the community and external support agencies to prepare the inventory. This group may choose to organise a focus group discussion – a research methodology in which a small group including representatives from the community and a researcher or moderator gathers to discuss a specified topic. The focus group can be tasked with preparing the inventory. Another method for obtaining specific information is a key informant survey.
Activity 19.3: Recovery, rehabilitation, and enhancing community resilienceTime: 10 minutes
Step 1 Discuss the aim and major aspects of recovery and rehabilitation activities.
Step 2 Discuss how the community can participate in rehabilitation activities.
Step 3 List the different areas for recovery and rehabilitation efforts.
Step 4 Discuss what community resilience is and review the factors that contribute to it.
Step 5 Discuss how community resilience can be threatened by a flood event.
Step 6 Discuss how community resilience can be enhanced.
In the aftermath of a flood disaster it is common to focus on damage assessment rather than on needs assessment. Remind the class that both are equally important.
Note to the trainer
Review the benefits of community resilience. Being resilient means being better prepared to save lives and property and being able to recover quickly after a flood event. Resilient communities: � are in a better position to receive and make good use of
national and sub-national funds; � have better access to emergency managers and researchers; � have a well informed public; � have identified their needs; � have good core infrastructure that can address community
concerns.
Note to the trainer

137
Day 8SESSIo
N 19
Activity 19.4: Monitoring, evaluation, and information managementTime: 15 minutes
Step 1 Clarify the importance and objectives of monitoring, evaluation and information management.
Step 2 Discuss methods of monitoring, evaluation, and information management.
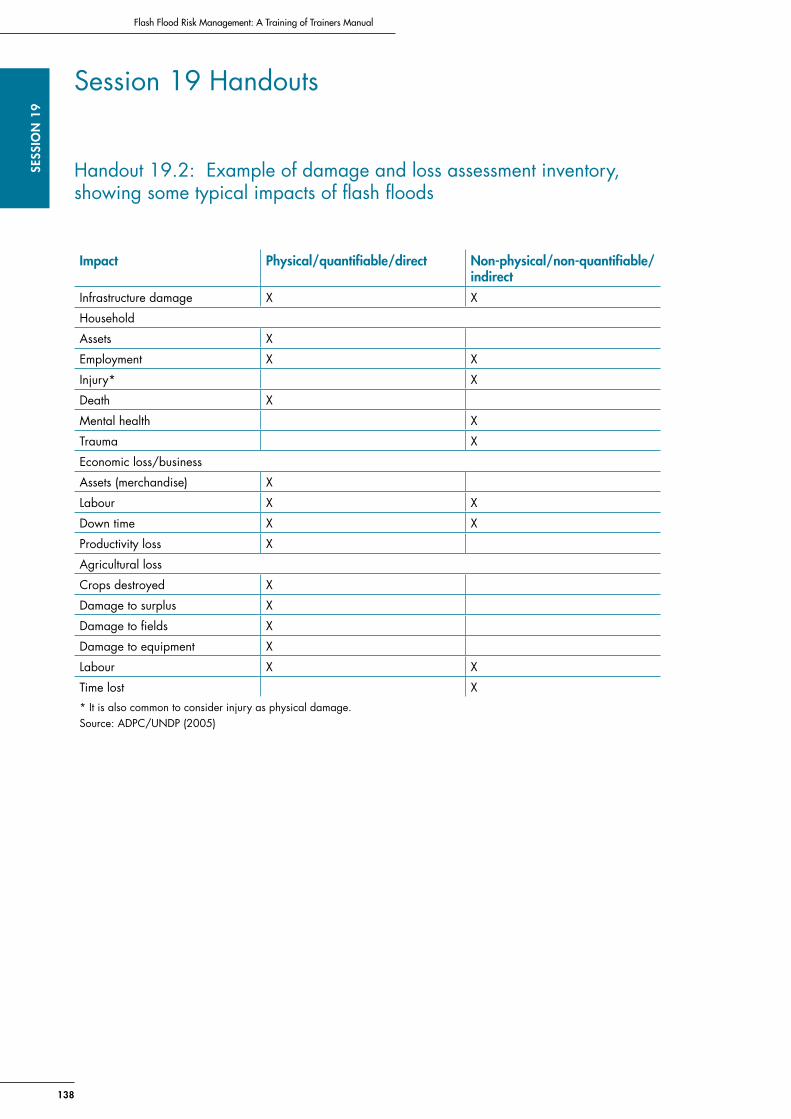
Flash Flood Risk Management: A Training of Trainers Manual
138
SESS
IoN
19
Session 19 Handouts
Handout 19.2: Example of damage and loss assessment inventory, showing some typical impacts of flash floods
Impact Physical/quantifiable/direct Non-physical/non-quantifiable/indirect
Infrastructure damage X X
Household
Assets X
Employment X X
Injury* X
Death X
Mental health X
Trauma X
Economic loss/business
Assets (merchandise) X
Labour X X
Down time X X
Productivity loss X
Agricultural loss
Crops destroyed X
Damage to surplus X
Damage to fields X
Damage to equipment X
Labour X X
Time lost X* It is also common to consider injury as physical damage.Source: ADPC/UNDP (2005)
Box 21: Responding to a flash flood – outside or inside
If you are outside during a flash flood � Avoid going to flooded areas. � Do not let children play outside. � Watch out for hanging or submerged power lines and wires. If possible, report fallen electrical lines. � Do not venture to unstable ground. � Do not go to flooded river bank areas to catch fish or retrieve logs or timber. � If you are driving, stop driving and climb to higher ground. � Do not try to drive or walk over flooded roads or bridges.
If you are inside during a flash flood � Gather together your preassembled emergency supplies. � Shut off all power and propane gas in the house. Remember, fire is the most frequent hazard after a flood. � Quickly evacuate to safer or higher ground. If there is no time, climb to a higher floor or to the roof top and signal for help. � Avoid walking around after the flooding as steps and floors are slippery and can be covered with debris and broken glass.
139
Day 8SESSIo
N 19
Session 19 Resource Materials
RM 19.1: Evacuation, preparedness for search and rescue, shelter management, and health responseIt is critical to have a well coordinated and well managed response during a flash flood event. Planning for the eventuality of a flood and establishing guidelines ahead of time are two ways to minimise loss and damage.
Evacuation
The aim of evacuation is to remove people from the flood and its associated hazards (Boxes 19 and 20). The following factors should be considered by the evacuation and rescue teams. � Have evacuation procedures in place and
available for the case in which there is little warning time.
� Have alternative evacuation routes marked on the social flood hazard map.
� Make sure that people are aware of the secondary hazards that can occur after a flash flood recedes, such as landslides, mudslides, exposed ‘live’ power cables that have snapped during the flood (which can be very dangerous), and snakes and other animals displaced from their natural habitats (which likewise can be dangerous to humans) (Box 21).
� Give special consideration to the evacuation of vulnerable groups such as children, pregnant women, the elderly, and the disabled.
Box19:Evacuationandrescue
Evacuation and rescue have different functions. During the evacuation phase, persons at risk are moved to safer ground. During rescue, the victims are resettled and provided with shelter and basic needs.
Box20:Essentialactivitiesfortheevacuationand rescue team
� Register the people who will be housed in the shelter. � Take note of any injury or medial requirements during
the registration (if possible). � Take note of any other special requirements they may
have. � Inquire whether they know if their family members and
neighbours are safe or need to be rescued. � Dispense health information. � Provide a basic level of security and see that women
and children are safe. It is important to ensure that women are protected from any violence.
The CFFRMC (in coordination with other agencies) should help to provide and maintain basic health services and hygiene.
Flash Flood Risk Management: A Training of Trainers Manual
140
SESS
IoN
19
� Determine whether people can walk or drive out of the flooded area. Help them to move to higher ground or to the tops of buildings to await assistance.
� Consider the various modes of transport such as walking, non-motorised vehicles, buses, cars, boats, helicopters, and army vehicles.
� Notify people of evacuation routes and safe areas by communicating through the CFFRMC.
Safe areas should be provided so that people can convene temporarily either before they are removed to evacuation camps or before they are assigned temporary shelters, or until they can safely return to their houses. In these safe places, victims need to have access to basic supplies such as blankets, water, food, medication, first-aid, and sanitation facilitates.
It is essential to offer safety and security to the flood victims. The military or police may be able to provide security for the period after the flood event until people can return to their homes. If it is possible to prevent looting after the emergency phase by protecting people’s assets it will facilitate the recovery phase. The CFFRMC should coordinate security with the military and the police. The safety and privacy of women must be prioritised.
Search and rescue
As soon as possible after a flash flood event, the evacuation and rescue teams should initiate search and rescue activities. Trained, untrained, or semi-trained volunteers can be mobilised and led by experienced team leaders. Volunteers are dispatched in groups and usually asked to work on a rotational basis to minimise stress and exhaustion. Search and rescue volunteers need to have communication equipment to maintain contact with the control room at all time (Box 22). Rescue work should be fast and effective.
Shelter
Temporary shelters are essential to house people who have been left homeless by the flood. The number of temporary shelters needed depends on the population of the community. Temporary shelters protect people immediately after flooding and provide them with a level of security and privacy. Volunteers can manage the logistics of registering the names of people who have been rescued and can assign shelters. It is vital to record the names of those who have been rescued in order to be able to inform relatives and to identify those who are still missing.
During the planning phase before a flood event, due consideration needs to be given to both the location of the site and to considering how many temporary shelters would be needed. The location needs to be easily accessible, yet at a safe enough distance from any hazard.
Other considerations for temporary shelters include: � Capacity: The population in each temporary shelter must be managed so that requirements do not exceed
supplies. � Relief items: These can include food, clothing, medicine, cooking utensils, and general household items. � Gender: Arrangements for women in temporary shelters are often very poor. No matter how bad the
situation is, women must be ensured at least a minimum amount of sanitation, security, and privacy.
Box 22: Suggested equipment for search and rescue
� Suitable rescue ropes � Ladders � Buckets � Torches � Loudspeakers � Blankets � Floating rescue devices, inflatable boats � Two-way radios and other reliable
communication equipment
141
Day 8SESSIo
N 19
Health
Members of the CFFRMC team responsible for health care must be able to dispense first-aid and to deal with large numbers of injured people. They also need to be aware of the possibility of secondary health problems such as water-related communicable diseases that are common after floods. Diseases such as typhoid, acute diarrhoea, skin infections, scabies, malaria, and dengue are common in flood-affected areas. It is necessary both to have an adequate supply of medicines on hand and to make people aware that some diseases can be prevented through good hygiene and sanitation practices such as preventing flies from gathering at waste disposal sites.
In a post-flood situation (Box 23) it is essential to dispose of waste properly and to manage the removal of carcasses and corpses to minimise the spread of disease. It is important to respond to the special health requirements of women, children, and the elderly. The following are some key health and sanitation issues to be prepared for after a flood event.
� Provide toilet facilities for people and make sure that the waste is disposed of in a sanitary manner.
� Protect water supplies from contamination. � Be ready to provide simple first-aid. For
example, provide oral saline when there is an outbreak of diarrhoea; administer aspirin for scorpion bites (if possible, put ice on the sting); and use calcium tablets or powdered eggshell to minimise allergic reactions. If necessary, quickly transfer the patients to the nearest hospital or health care facility.
� Hang small open bottles of carbolic acid outside shelters (but out of reach of children) to help ward off snake invasions and avoid snakebites.
� Control infestations of house flies by using deltamethrin and permathrin in and around cooking and eating places.
� Make sure to provide at least a minimum amount of water for drinking, cooking, and personal and domestic hygiene.
� Ensure that people have enough containers to collect and store clean water. � Ensure that people have sufficient cooking utensils, equipment, and fuel to cook and store food safely. � Make people aware of health hazards. � Ensure that people have soap for washing their hands.
RM 19.2: Methods and processes of damage and needs assessmentDamage assessment refers to gathering information on the extent to which the flash flood damaged life and property in the area. Flash floods can destroy physical infrastructure, houses, livelihoods, and other socio-cultural and economic establishments. The damage needs to be assessed before any sustainable rehabilitation work can begin.
Damage and needs assessment, followed by prioritisation, are the first steps towards recovery. After a disaster occurs, it is necessary to gather information on the damage incurred, but in doing so, there is also a danger
Box23:Whattodoafteraflood:Practicaltips
� If you are in a partly flooded building, get out and ask for help.
� If you are outside, stay outside until the flood water subsides.
� Help neighbours who require assistance, especially children, the elderly, and the disabled.
� Make sure that buildings are safe to reoccupy. Inspect foundations and roofs for cracks or other damage. Check for animals (such as poisonous snakes) that may have taken shelter in the house.
� Continue listening to the radio or other announcements for further instructions and warnings.
� Look for electrical damage. If you see electrical hazards (such as hanging ‘live’ wires), ask for help.
� Boil, disinfect, or distil water before drinking. � Do not eat contaminated food. � Check that a proper waste disposal system is
maintained.
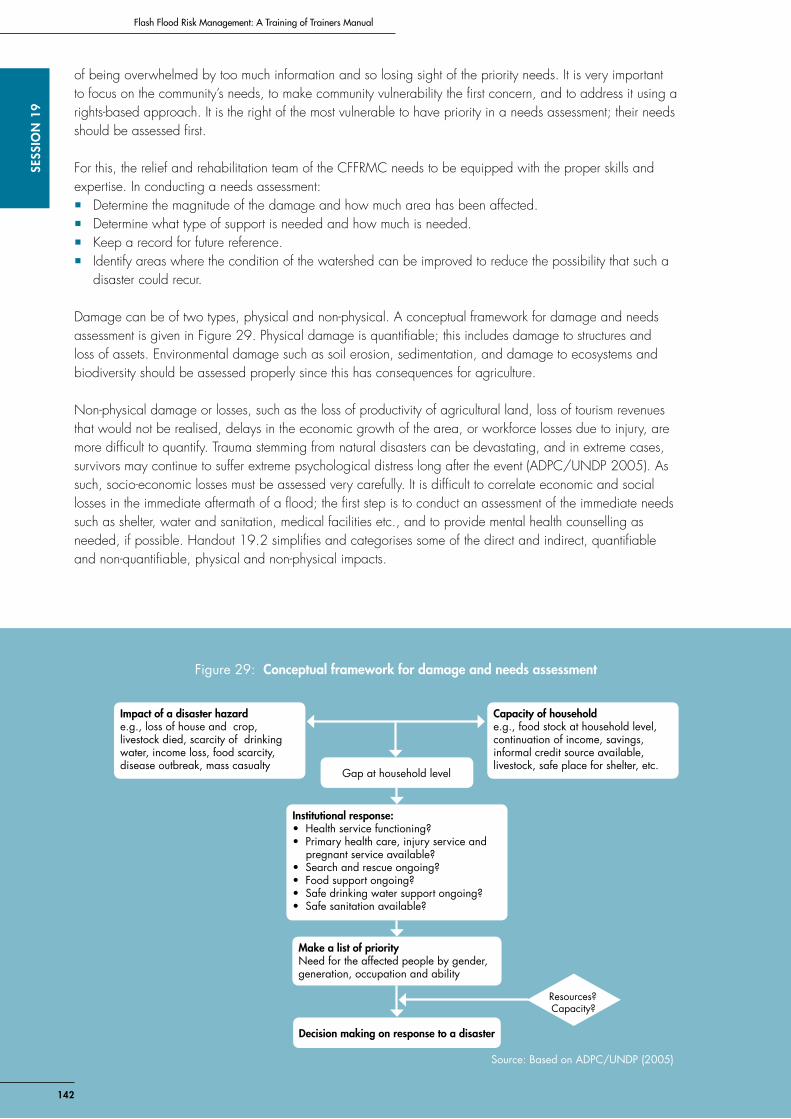
Flash Flood Risk Management: A Training of Trainers Manual
142
SESS
IoN
19
of being overwhelmed by too much information and so losing sight of the priority needs. It is very important to focus on the community’s needs, to make community vulnerability the first concern, and to address it using a rights-based approach. It is the right of the most vulnerable to have priority in a needs assessment; their needs should be assessed first.
For this, the relief and rehabilitation team of the CFFRMC needs to be equipped with the proper skills and expertise. In conducting a needs assessment: � Determine the magnitude of the damage and how much area has been affected. � Determine what type of support is needed and how much is needed. � Keep a record for future reference. � Identify areas where the condition of the watershed can be improved to reduce the possibility that such a
disaster could recur.
Damage can be of two types, physical and non-physical. A conceptual framework for damage and needs assessment is given in Figure 29. Physical damage is quantifiable; this includes damage to structures and loss of assets. Environmental damage such as soil erosion, sedimentation, and damage to ecosystems and biodiversity should be assessed properly since this has consequences for agriculture.
Non-physical damage or losses, such as the loss of productivity of agricultural land, loss of tourism revenues that would not be realised, delays in the economic growth of the area, or workforce losses due to injury, are more difficult to quantify. Trauma stemming from natural disasters can be devastating, and in extreme cases, survivors may continue to suffer extreme psychological distress long after the event (ADPC/UNDP 2005). As such, socio-economic losses must be assessed very carefully. It is difficult to correlate economic and social losses in the immediate aftermath of a flood; the first step is to conduct an assessment of the immediate needs such as shelter, water and sanitation, medical facilities etc., and to provide mental health counselling as needed, if possible. Handout 19.2 simplifies and categorises some of the direct and indirect, quantifiable and non-quantifiable, physical and non-physical impacts.
Resources?Capacity?
Impact of a disaster hazarde.g., loss of house and crop, livestock died, scarcity of drinking water, income loss, food scarcity, disease outbreak, mass casualty
Capacity of householde.g., food stock at household level, continuation of income, savings, informal credit source available, livestock, safe place for shelter, etc.
Gap at household level
Institutional response:•Healthservicefunctioning?•Primaryhealthcare,injuryserviceand pregnant service available?•Searchandrescueongoing?•Foodsupportongoing?•Safedrinkingwatersupportongoing?•Safesanitationavailable?
Make a list of priority Need for the affected people by gender, generation, occupation and ability
Decision making on response to a disaster
Figure 29: Conceptual framework for damage and needs assessment
Source: Based on ADPC/UNDP (2005)
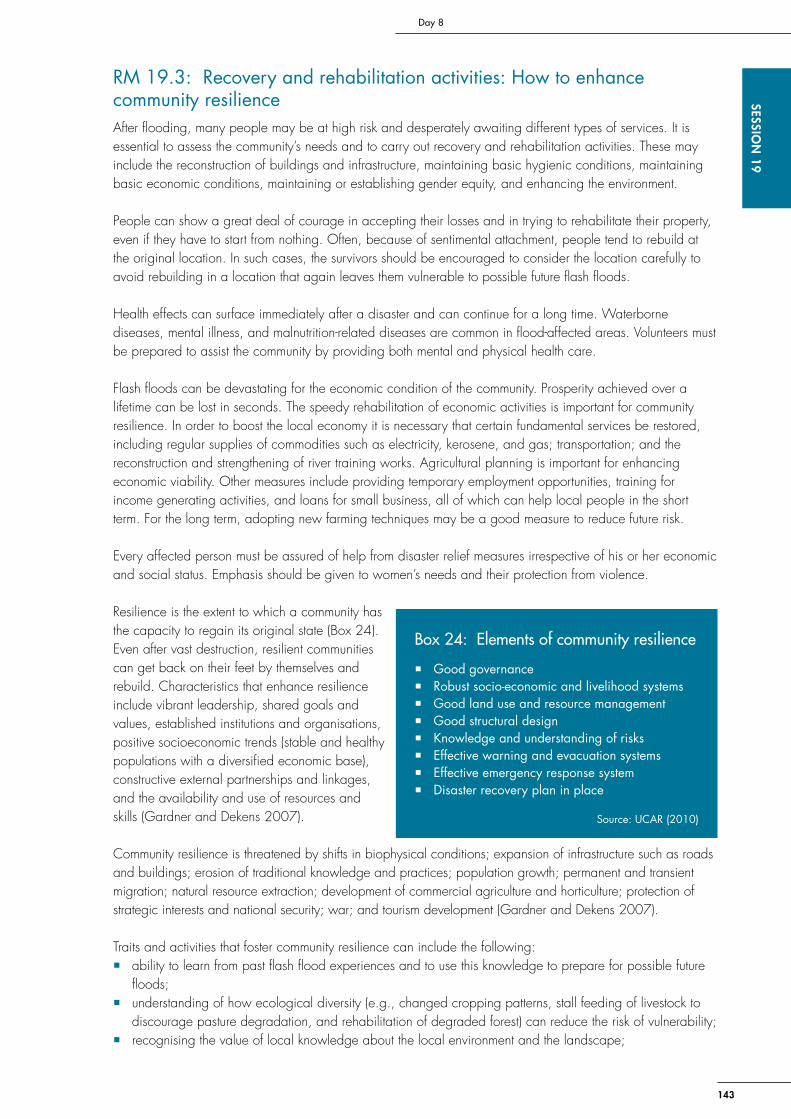
143
Day 8SESSIo
N 19
Box24:Elementsofcommunityresilience
� Good governance � Robust socio-economic and livelihood systems � Good land use and resource management � Good structural design � Knowledge and understanding of risks � Effective warning and evacuation systems � Effective emergency response system � Disaster recovery plan in place
Source: UCAR (2010)
RM 19.3: Recovery and rehabilitation activities: How to enhance community resilienceAfter flooding, many people may be at high risk and desperately awaiting different types of services. It is essential to assess the community’s needs and to carry out recovery and rehabilitation activities. These may include the reconstruction of buildings and infrastructure, maintaining basic hygienic conditions, maintaining basic economic conditions, maintaining or establishing gender equity, and enhancing the environment.
People can show a great deal of courage in accepting their losses and in trying to rehabilitate their property, even if they have to start from nothing. Often, because of sentimental attachment, people tend to rebuild at the original location. In such cases, the survivors should be encouraged to consider the location carefully to avoid rebuilding in a location that again leaves them vulnerable to possible future flash floods.
Health effects can surface immediately after a disaster and can continue for a long time. Waterborne diseases, mental illness, and malnutrition-related diseases are common in flood-affected areas. Volunteers must be prepared to assist the community by providing both mental and physical health care.
Flash floods can be devastating for the economic condition of the community. Prosperity achieved over a lifetime can be lost in seconds. The speedy rehabilitation of economic activities is important for community resilience. In order to boost the local economy it is necessary that certain fundamental services be restored, including regular supplies of commodities such as electricity, kerosene, and gas; transportation; and the reconstruction and strengthening of river training works. Agricultural planning is important for enhancing economic viability. Other measures include providing temporary employment opportunities, training for income generating activities, and loans for small business, all of which can help local people in the short term. For the long term, adopting new farming techniques may be a good measure to reduce future risk.
Every affected person must be assured of help from disaster relief measures irrespective of his or her economic and social status. Emphasis should be given to women’s needs and their protection from violence.
Resilience is the extent to which a community has the capacity to regain its original state (Box 24). Even after vast destruction, resilient communities can get back on their feet by themselves and rebuild. Characteristics that enhance resilience include vibrant leadership, shared goals and values, established institutions and organisations, positive socioeconomic trends (stable and healthy populations with a diversified economic base), constructive external partnerships and linkages, and the availability and use of resources and skills (Gardner and Dekens 2007).
Community resilience is threatened by shifts in biophysical conditions; expansion of infrastructure such as roads and buildings; erosion of traditional knowledge and practices; population growth; permanent and transient migration; natural resource extraction; development of commercial agriculture and horticulture; protection of strategic interests and national security; war; and tourism development (Gardner and Dekens 2007).
Traits and activities that foster community resilience can include the following: � ability to learn from past flash flood experiences and to use this knowledge to prepare for possible future
floods; � understanding of how ecological diversity (e.g., changed cropping patterns, stall feeding of livestock to
discourage pasture degradation, and rehabilitation of degraded forest) can reduce the risk of vulnerability; � recognising the value of local knowledge about the local environment and the landscape;
Flash Flood Risk Management: A Training of Trainers Manual
144
SESS
IoN
19
� valuing community cohesion and cooperation by bringing all the expertise to one forum to address the disaster and its effects;
� establishing linkages and partnerships with different partners and stakeholders; � making educational materials for response to flash floods available to everyone in the community; � increasing public awareness and understanding on severe weather and other hazards.
RM 19.4: Monitoring, evaluation, and information managementThe CFFRMC usually monitors and evaluates the effectiveness of programmes and gives feedback to the process. Monitoring and evaluation can also be conducted by supporting NGOs or district-level government representatives. Monitoring typically has three phases: process monitoring, effect monitoring, and monitoring of significant changes in flash flood risk management. The major aims of monitoring and evaluation are: � to determine the full extent of positive and negative outcomes and impacts, usually at the end of a project; � to identify lessons that can be applied in future and improve effectiveness; � to document experiences for the purpose of advocating for policy change and institutionalisation; � to collect data demonstrating the quality and effectiveness of the process; � to ensure and demonstrate accountability; � to improve monitoring methods; � to take stock of the programme’s strengths and weaknesses; � to compare the programme with others like it; � to share experiences; � to evaluate cost effectiveness (to see if the work is costing too much and/or achieving too little).
Information is a major resource for learning and planning. CFFRMCs should keep records of all flash flood events, damage incurred, their own activities, and how they responded to the flood. CFFRMCs should collect the relevant information for preparedness, which can be used before, during, and after flood situations. Information on how often local floods occur and the extent and duration of the inundation is very important for reviewing preparedness and action plans. CFFRMCs should keep records of maximum flood levels at different locations since this can facilitate post-flood investigations by technical agencies and can be helpful in planning for possible future events.
Managing information for future reference is important because it: � helps planners to visualise what long-term support people will need; � provides a reference point to allow development workers and researchers to determine the cause of the
disaster by knowing its magnitude and duration in the watershed – information that can be used to support integrated watershed management;
� quantifies the loss of life and property; � clarifies the constraints on preparedness that limited
intervention in the past; � clarifies what went wrong in the areas of
evacuation and temporary settlements; � can be a source of ideas for improvements and
innovations that can help to reduce future losses.
The CFFRMC can also record its own activities (Box 25) as well as those of other groups that it has worked with such as INGOs, NGOs, research institutes, and development agencies. Documentation and records should also comprise relevant audio and visual information, inventory lists of damage, and a record of dates, times, and flood levels. It is equally important to document local knowledge on the community’s general perception of the environment before the flash flood.
Box 25: Continuous evaluation and improvement of the CFFRMC
The CFFRMC can call a general meeting to discuss the strengths and weaknesses of the risk management efforts. Since community members directly or indirectly monitor the activities of the CFFRMC, their opinions can be noted and used to evaluate the CFFRMC’s risk management programme. Alternatively, the programme can be evaluated through informal interviews with key informants. The CFFRMC can also choose to assign the evaluation of its work to an independent body of villagers. This body, through interviews, questionnaires, and focus discussion groups, can prepare an independent evaluation report. It is also important to evaluate the activities of the CFFRMC from a gender perspective.

145
Day 8SESSIo
N 20
Session 20 Overall DiscussionTime: 60 minutes
objective This is an open session. Participants can choose to have a discussion on any one of the topics that has been covered during the training or that is otherwise pertinent to it. Alternatively, if the facilitator sees that there is a need to revisit a certain topic, he or she can set an agenda for the discussion.
ActivitiesIf there is no outstanding issue to be discussed, the facilitator can use this session as an opportunity to review some of the course material.
This is an interactive session; the facilitator can divide the class into three or four different groups (making sure that, to the extent possible, the groups have participants from each country that is represented in the class). The facilitator then assigns each group a problem based on any one of the themes covered in the training sessions or based on the field observations. It must be a practical problem that demands an integrated solution – it should not be too long or too complicated and should be a problem that can be worked out in the 40 minutes allotted.
Each group discusses the problem and comes up with a way of approaching it. At the end of the allotted time a spokesperson from each group makes a short (5 minute) presentation to the whole class.
146
SESS
IoN
21
Flash Flood Risk Management – A Training of Trainers Manual
Session 21 Training Evaluation and Closing Session
Time: 60 minutes
objective To evaluate the training and to conclude formally.
Activities
Activity 21.1: Training evaluationTime: 30 minutes
This is an informal session. It is expected that the participants will independently and freely evaluate the training. For this purpose, the facilitator can prepare a semi-open-ended questionnaire (for example, Handout 21.1). The questionnaire can cover different aspects of the training such as: How well prepared were the resource persons? How effective were the training methods and materials? Was enough time allotted for discussions and sharing? Were the logistics and other practical aspects of the training adequate? What is their overall assessment of the training?
The participants are asked to fill out the evaluations and return them to the facilitator.
The facilitators should scrutinise the evaluations to see what improvements can be incorporated in future training courses.
Activity 21.2: Closing sessionTime: 30 minutes
The closing session is a formality that provides an opportunity to give thanks and to distribute the certificates.
Each facilitator can design the closing ceremony as he or she sees fit. Below is a list of suggested components.
� Closing remarks: The facilitator can decide who should say a few words. � Participants’ feedback on training: This can be a short informal question and answer session, or the
facilitator can choose to summarise the feedback given on the evaluation forms. � Distribution of certificates: The facilitator should see beforehand that these are printed and filled out
appropriately. � Vote of thanks.
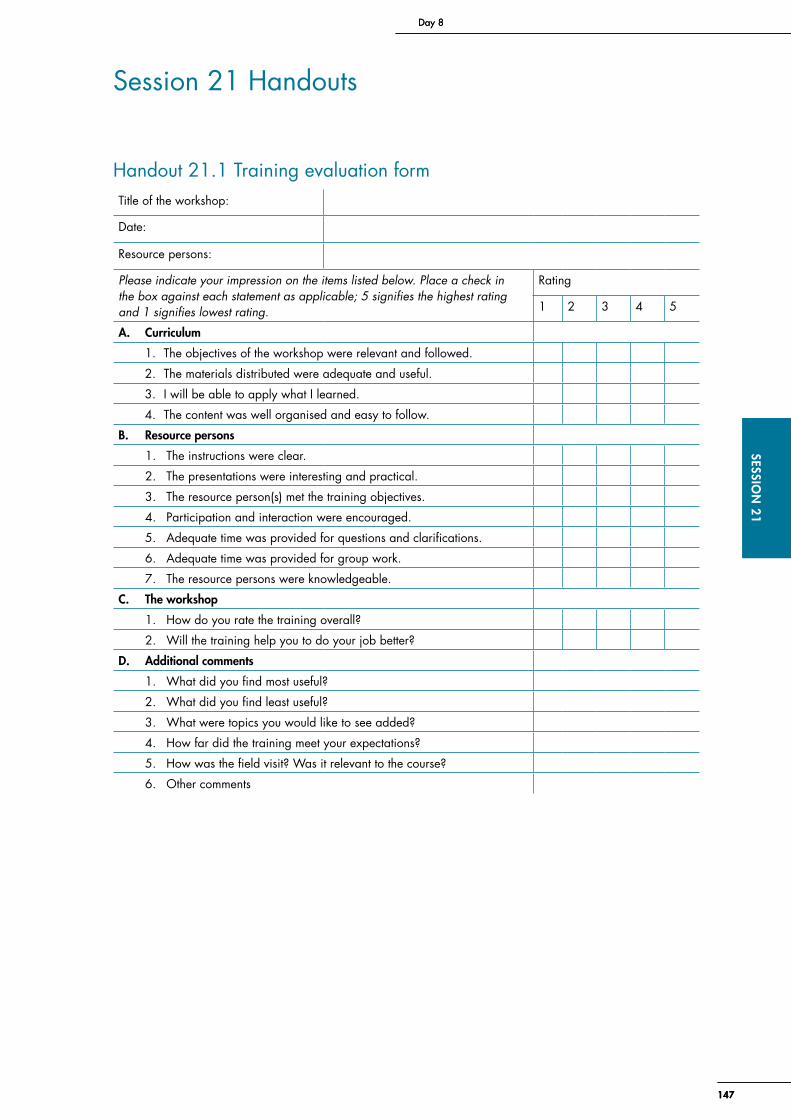
147
Day 8SESSIo
N 21
147
Day 8SESSIo
N 21
Session 21 Handouts
Handout 21.1 Training evaluation form Title of the workshop:
Date:
Resource persons:
Please indicate your impression on the items listed below. Place a check in the box against each statement as applicable; 5 signifies the highest rating and 1 signifies lowest rating.
Rating
1 2 3 4 5
A. Curriculum
1. The objectives of the workshop were relevant and followed.
2. The materials distributed were adequate and useful.
3. I will be able to apply what I learned.
4. The content was well organised and easy to follow.
B. Resource persons
1. The instructions were clear.
2. The presentations were interesting and practical.
3. The resource person(s) met the training objectives.
4. Participation and interaction were encouraged.
5. Adequate time was provided for questions and clarifications.
6. Adequate time was provided for group work.
7. The resource persons were knowledgeable.
C. The workshop
1. How do you rate the training overall?
2. Will the training help you to do your job better?
D. Additional comments
1. What did you find most useful?
2. What did you find least useful?
3. What were topics you would like to see added?
4. How far did the training meet your expectations?
5. How was the field visit? Was it relevant to the course?
6. Other comments
148
Flash Flood Risk Management – A Training of Trainers Manual
References
ADPC (2003) Project completion report of Bangladesh Urban Disaster Mitigation Project. Project Report No. 5. Bangkok, Thailand: Asian Disaster Preparedness Center and CARE-Bangladesh
ADPC/ECHO/UNESCAP (2004) Community-based disaster risk management, field practitioner’s handbook. Bangkok, Thailand: Asian Disaster Preparedness Center
ADPC/UNDP (2005) A primer for integrated flood risk management in Asia (2). Bangkok, Thailand: Asian Disaster Preparedness Center and United Nations Development Programme
Alexander, D (1993) Natural disasters. New York, USA: Chapman and Hall
Bajracharya, B; Shrestha, AB; Rajbhandari, L (2007a) ‘Glacial lake outburst floods in the Sagarmatha region: Hazard assessment using GIS and hydrodynamic modelling.’ Mountain Research and Development 27: 336–344
Bajracharya, SR; Mool, PK; Shrestha, BR (2007b) Impact of climate change on Himalayan glaciers and glacial lakes: Case studies of GLOF and associated hazards in Nepal and Bhutan. Kathmandu, Nepal: ICIMOD
Bhatta, B; Chalise, S; Myint, AK; Sharma, PN (1999) Recent concepts, knowledge, practices and new skills in participatory integrated watershed management: Participatory Watershed Management Training in Asia. Kathmandu, Nepal: ICIMOD
Blakie, P; Cannon, T; Davis, I; Wisner, B (1994) At risk: Natural hazards, people’s vulnerability and disasters. London, UK: Routledge
Brilly, M (2001) ‘The integrated approach to flash flood management.’ In Gruntfest, E; Handmer, J (eds), Coping with flash floods, pp 103–114. Dordrecht, Netherlands: Kluwer Academic Publishers
Chalise, SR; Khanal, NR (2001) ‘An introduction to climate, hydrology and landslide hazards in the Hindu Kush-Himalayan region: Landslide hazard mitigation in the Hindu Kush-Himalaya’. In Tianchi, L; Chalise, SR; Upreti, BN (eds) Landslide hazard mitigation in the Hindu Kush-Himalaya, pp 51–62. Kathmandu, Nepal: ICIMOD
Chow, VT (1984) Handbook of applied hydrology: A compendium of water resources technology. New York, USA: McGraw-Hill
Chow, VT; Maidment, DR; Mays, LW (1988) Applied hydrology. Singapore: McGraw-Hill
Colombo, AG; Hervas, J; Arellano, ALV (2002) Guidelines on flash flood prevention and mitigation. Ispra, Italy: NEDIES
Costa, JE (1983) ‘Paleohydraulic reconstruction of flash-flood peaks from boulder deposits in the Colorado Front Range.’ Geological Society of America Bulletin 94: 986–1004
Costa, JE; Schuster, RL (1988) ‘The formation and failure of natural dams.’ Geological Society of America Bulletin 100: 1054–1068
Cutter, SL (1996) ‘Vulnerability to natural hazards.’ Progress in Human Geography 20: 529–539
Dekens, J (2007) The river and the snake don’t run straight: Local knowledge on flood preparedness in the astern Terai of Nepal. Kathmandu, Nepal: ICIMOD
Deoja, B; Dhital, M; Thapa, B; Wagner, A (1991) Mountain risk engineering handbook, subject background: Part I. Kathmandu, Nepal: ICIMOD
Domroes, M (1979) ‘Temporal and spatial variations of rainfall.’ Journal of Nepal Research Centre 2: 49–67
Dunning, SA; Rosser, NJ; Petley, DN; Massey, CR (2006) ‘Formation and failure of the Tsatichhu landslide Dam, Bhutan.’ Landslides 3: 107–113
Gardner JS; Dekens, J (2007) ‘Mountain hazards and the resilience of social-ecological systems: Lessons learned in India and Canada.’ Natural Hazards 41: 317–336
Gouldby, B; Samuals, P (2005) Language of risk. Wallingford, USA: Flood Site
149
References
HAA (2002) 100 ways to energize groups: Games to use in workshops, meetings and the community. Brighton, UK: International HIV/AIDS Alliance
Heyman, BN; Davis, C; Krumpe, PF (1991) ‘An assessment of worldwide disaster vulnerability.’ Disaster Management 4: 1–23
Huggel, C; Kääb, A; Haeberli, W; Teysseire, P; Paul, F (2002) ‘Remote sensing based assessment of hazards from glacial lake outbursts: A case study in the Swiss Alps.’ Canadian Geotechnical Journal 39: 316–330
ICIMOD (2007) Inventory of glaciers, glacial lakes, and identification of potential glacial lake outburst floods (GLOFs) affected by global warming in the mountains of Himalayan Region. Kathmandu, Nepal
ICIMOD (2009) Mountain development resource book for Afghanistan. Kathmandu, Nepal: ICIMOD
IDNDR (1997) Guiding principles for effective early warning. Geneva, Switzerland: United Nations International Decade for Natural Disaster Reduction
Ives, JD (1986) Glacial lake outburst floods and risk engineering in the Himalaya. Kathmandu, Nepal: ICIMOD
Ives, JD; Shrestha, RB; Mool, PK (2010) Formation of glacial lakes in the Hindu Kush-Himalayas and GLOF risk assessment. Kathmandu, Nepal: ICIMOD
Jonkman, SN (2005) ‘Global perspectives on loss of human life caused by floods.’ Natural Hazards 34: 151–175
Kelsch, M; Caporali, E; lanza, LG (2001) ‘Hydrometeorology of flash floods.’ Gruntfest, E; Handmer, J (eds), Coping with flash floods, pp 19–35. Dordrecht, Netherlands: Kluwer Academic Publishers
Li, T (1999) ‘Bioengineering for landslide control for upland watersheds.’ In Bhatta, BR; Chalise, SR; Myint, AK; Sharma, PN (eds), Recent concepts, knowledge, practices and new skills in participatory integrated watershed management: Participatory watershed management training in Asia (PWMTA), pp 81–86. Kathmandu, Nepal: ICIMOD
Mavis, ID; Laushey, LM (1949) ‘Formula for velocity of beginning of Bedload movement is reappraised.’ Civil Engineering 19: 38-39
Mehta, M (2007) ‘Gender and natural disasters: New challenges for mountain development.’ Disaster Preparedness 53: 17–19
Mei’e, R; Renzhang, Y; Haoshend, B (1985) An outline of China’s physical geography. Beijing, China: Foreign Language Press
Messner, F; Meyer, V (2005) Flood damage, vulnerability and risk perceptions: Challenge for flood damage research. Leipzig, Germany: UFZ-Umweltforschungszentrum Leipzy-Halle
Mizuyama, T; Satohuka, Y; Ogawa, K; Mori, T (2006) Estimating the outflow discharge rate from landslide dam outbursts, disaster mitigation of debris flows, slope Failures and landslides. Tokyo, Japan: Universal Academy Press
Parker, DJ (ed) (2000) Floods. 2 Vols. London, UK: Routledge
Pike, B; Busse, C (2004) 101 more games for trainers. Amherst (MA), USA: HRD Press
Popov, N (1991) ‘Assessment of glacial debris flow hazard in the North Tien-Shan.’ In Proceedings of the Soviet-China-Japan Symposium and Field Workshop on Natural Disasters, 2–17 September 1991, Tian-Shan, pp 384–391. Shanghai, USSR: Dushanbe and Kazselezashchita
Rambaldi, G; Kwaku Kyem, AP; Mbile, P; McCall, M; Weiner, D (2006) ‘Participatory spatial information management and communication in developing countries.’ Electronic Journal of Information Systems in Developing Countries 25(1): 1–9
RGSL (2003) Methods of glacier and lake inventory compilation with specific reference to hazard assessment. Flintshire, UK, Reynolds Geo-sciences Limited
Richardson, SD; Reynolds, JM (2000) ‘An overview of glacial hazards in the Himalayas.’ Quarternary International 65/66(1): 31–47
Shamshad, KM (1988) The meteorology of Pakistan. Karachi, Pakistan: Royal Book Company
Shields A (1936) Andwendung der ahnlichkeits-mechanik und der turbalenzforschung auf die geschiebebewungung. Berlin, Germany: Mitteilung der Preussischen Versuchsanstalt fur Wasserbau und Schiffbau (in German)
Shrestha, AB (2008) Resource manual on flash flood risk management, Module 2: Non-structural measures. Kathmandu, Nepal: ICIMOD
150
Flash Flood Risk Management – A Training of Trainers Manual
Shrestha, AB; Bajracharya, B; Rajbhandari, L (2006) ‘Glacier lake outburst flood hazard mapping of agarmatha National Park.’ In Sharma, KP; Jha, R (eds), Workshop on Flood Forecasting Management in Mountainous Areas, pp 228-242. Kathmandu, Nepal: Department of Hydrology and Meteorology
Shrestha, AB; Shah, SH; Karim, R (2008) Resource manual on flash flood risk management, Module 1: Community-based management. Kathmandu, Nepal: ICIMOD
Shrestha, AB; Shrestha, SD (2008) Flash flood risk in the Hindu Kush-Himalayas: Causes and management options. Paper presented at the International Conference on Disaster and Development: Bridging the Gap between Theory and Practice, 23–24 November, Kathmandu, Nepal
Strand, RI (1977) Sedimentation in design of small dams. Washington, USA: U.S Bureau of Reclamation
Swaminathan, MS (1980) ‘Plant breeding in India: Some experiments and ecological experiences in the North Eastern hill region’ In Singh, T; Kau, J (eds), Studies in Himalayan Ecology and Development Strategies, pp 152–172. New Delhi: The English Book Store
UCAR (2010) Flash flood early warning system reference guide. Silver Spring, Maryland, USA: University Corporation for Atmospheric Research and National Oceanic and Atmospheric Adminis tration
UN (1992a) The Rio Declaration on Environment and Development (1992). New York, USA: United Nations
UN (1992b) United Nations Framework Convention on Climate Change. New York, USA: United Nations
UN (2005) Convention on the Law of the Non-navigational Uses of International Watercourses 1997. New York, USA: United Nations
UNESCO-IHP (2007) International flood initiative. Paris: UNESCO-IHP
UNISDR (2005) Hyogo Framework for Action 2005-20015. Presented at World Conference on Disaster Reduction, Kobe. Hyogo, Japan: United Nations International Strategy for Disaster Reduction
UNISDR (2009) UNISDR terminology on disaster risk reduction. Geneva, Switzerland: United Nations International Strategy for Disaster Reduction
USACE/HEC (2011) ‘HEC-HMS.’ Davis, California, USA: US Army Corps of Engineers, Hydrologic Engineering Center. Online: www.hec.usace.army.mil/software/hec-hms (accessed 20/05/2011)
USGS (no date) Surface-water field techniques: Verified roughness characteristics of natural channels. Washington, DC, USA: United States Geological Survey. Online resource: wwwrcamnl.wr.usgs.gov/sws/fieldmethods/Indirects/nvalues/index.htm (Accessed May 2007)
Wagley, M (1999) ‘Bioengineering practices for soil and water conservation.’ In Bhatta, BR; Chalise, SR; Myint, AK; Sharma, PN (eds), Recent concepts, knowledge, practices and new skills in participatory integrated watershed management: Watershed Management Training in Asia (PWMTA), pp 77–80. Kathmandu, Nepal: ICIMOD
Watts, MJ; Bohle, HG (1993) ‘The space of vulnerability: The casual structure of hunger and famine.’ Progress in Human Geography 17: 43–67
WECS (1987) Erosion and sedimentation in Nepal. Kathmandu, Nepal: Water and Energy Commission Secretariat
Weichselgartner, J (2001) Naturgefahren als soziale Konstruktion. PhD thesis, University of Bonn, Faculty of Mathematics and Natural Sciences, Bonn, Germany
West, E (1999) The big book of icebreakers: Quick fun activities for energizing meetings and workshops. New York, USA: McGraw-Hill
Williams, GP (1983) ‘Paleohydrological methods and some examples from Swedish fluvial environments I. Cobble and Boulder Deposits.’ Geografi ska Annaler 65A: 227–243
WMO (2006) Legal and institutional aspects of integrated flood management. APFM Technical Document No 2, Flood Management Policy Series. Geneva, Switzerland: World Meteorological Organization, Associated Programme on Flood Management
WMO (2009) Integrated flood management. APFM Concept Paper. Geneva, Switzerland: World Meteorological Organization, Associated Programme on Flood Management
Xu, Jianchu; Eriksson, M; Ferdinand, J; Merz, J (2006) Managing flash floods and sustainable development in the Himalayas: International Workshop on Flash Floods. Kathmandu, Nepal: ICIMOD
Zurick, D; Pacheco, J; Shrestha, B; Bajracharya, B (2006) Atlas of the Himalaya. Kathmandu, Nepal: ICIMOD


152
SESS
IoN
6Flash Flood Risk Management – A Training of Trainers Manual
© ICIMOD 2011International Centre for Integrated Mountain Development
GPO Box 3226, Kathmandu, Nepal
Tel +977-1-5003222 Fax +977-1-5003299
Email [email protected] Web www.icimod.org
ISBN 978 92 9115 222 3


