
8000
00
6000
00
ED
ate:
DE
CE
MB
ER
1999
Proj
ect:
P:\1
0002
9\..
File
:FI
G-A
TH
.PPT
nE
FF
EC
TW
EP
ITR
AD
IUS
VS
DE
PT
H
0
700
600
500
400
300
SU
RF
AC
EA
RE
AV
SD
EP
TH
200
2000
000
10000
1400
000
1200
000
100
d(6
)
4000
00
2000
00
GR
OU
ND
WA
TE
RIN
FL
OW
VS
DE
PT
H
6(6
)
4.5 4
3.5
2.5
1,5
0.5 0
8.6E
E2.4048E
+3.1936E
+3.1727
=9.
9077
E-0
I
TO
TA
LV
OL
UM
EV
SD
EP
TH
020
4060
8010
012
014
016
0
d(i
t)
SH
EP
HE
RD
MIL
LE
RI
180 •
Dat
a—
Fit
L1J
FIG
UR
EE
4-1
POL
YN
OM
IAL
RE
LA
TIO
NS
HIP
SO
FPI
TR
AD
IUS,
AR
EA
,V
OL
UM
E,
AN
DG
RO
UN
DW
AT
ER
INFL
OW
SA
SA
FUN
CT
ION
OF
DE
PTH
FO
RT
HE
NO
NE
XPA
ND
ED
CO
NT
INE
NT
AL
PIT

C 1000 900
800
700
600
500
400
300
200
100 0
EF
FE
CT
WE
Pif
RA
DIU
SV
SD
EP
TH
d(f
t)
C)
SU
RF
AC
EA
RE
AV
SD
EP
TH
In
700
80.0
60.0
40,0
20,0 0.0
GR
OU
ND
WA
TE
RIN
FL
OW
VS
DE
PT
H
010
020
030
040
050
060
070
0
SH
EP
HE
RD
MIL
LE
R
d(f
t)
•D
ata
010
020
030
040
050
060
070
0
140.
0
120.
0
100.
0
100
200
300
400
500
600
d(I
t)
E
TO
TA
LV
OL
UM
EV
SD
EP
TH
y€5
16.4
51x’
+64
6,O
296*
2.80
1551
x
R=
0.9
996
(
y=
-2.0
26E
-09x
4+
2.32
8E-0
6x3
-I.
553E
-03x
2+
S.2
14E
-Olx
+5.
153E
+01
R’=
9.97
013-
01
I
1,00
E+09
8,00
0+08
-g6,
00E
f 08
4,0€
E+08
2.O
OE+
08
—F
itL
ine
010
020
030
0d(
fl)
400
500
600
700
FIG
UR
EE
4-2
POL
YN
OM
IAL
RE
LA
TIO
NSH
IPS
OF
PIT
RA
DIU
S,A
RE
A,
VO
LU
ME
,A
ND
GR
OU
ND
WA
TE
RIN
FLO
WS
AS
AFU
NC
TIO
NO
FD
EPT
HFO
RT
HE
EX
PAN
DE
DC
ON
TIN
EN
TA
LPI
T
Dat
e:D
EC
EM
BE
R19
99
Proj
ect:
P:1
0002
9\..
File
:FI
G-A
TH
.PPT

—PIT
SIMULATEDWATER TABLE
CYLINDERREPRESENTINGPIT AT TIME = T> T1
FIGURE E4-3SIMULATION OF A PIT LAKE AS ASET OF EXPANDING CYLINDERS
SIMULATEDWATER TABLE
ACTUALWATER TABLE
CYLINDERREPRESENTINGPITATTIME=T1
_-PITGROUNDSURFACE
ACTUALWATER TABLE
SIMULATEDWATER TABLE
— PITGROUNDSURFACE
ACTUALWATER TABLE
CYLINDERREPRESENTINGPITATTIME=T3>T2
SHEPHERD MILLERINCORPORATED
Date: DECEMBER 1999
Project: I 00029\TASK5
File: CYLINDER

Ci)
ri
1i>0zHC0rn
CI)
>rnz0>rn—I- 9Cm—000owz>—>mZj.rn0ZrnH>0r0-tJ
0
rnCl)
0
H
rn
FLOWRATE(GPM)
(JiON000cC
\\___
H’\
C
C
C
C
ONC
.CDC,
0
0-oCCC
Co
iDmC-)m03m;ti
CoCoCo
-I,
G)
—I
-U-oH

0
SH
EP
HE
RD
MIL
LE
R
FIG
UR
EE
4-5
MA
GN
ITU
DE
OF
TH
EW
AT
ER
BA
LA
NC
EC
OM
PO
NE
NT
SFO
RT
HE
EX
PAN
DE
DC
ON
TIN
EN
TA
LPI
T
Dat
e:D
EC
EM
BE
R19
99
Proj
ect:
P:\1
0002
9\..
File
:FI
G-A
TH
.PPT
C0
180
160
140
120
100 80 60 40 20 0
—--
DIR
EC
TPR
EC
IPiT
AT
ION
050
100
150
200
250
300
350
400
450
DE
PT
H(F
EE
T)
—.—
GR
OU
ND
WA
TE
RIN
FL
OW
-E
VA
POR
AT
ION
500
—3E
--PI
TW
AL
LR
UN
OF
F

fJ-7Th
/ -
/ GROUNDWATERINFLOW = 97.8 gpm
SHEPHERD MILLERINCORPORATED
FIGURE E4-6CONTINENTAL PIT LAKE
WATER BALANCE AT STEADY STATE
DECEMBER 1999
100029\TASK5
WBAL-CON
DIRECT PRECIPITATION = 52.7 gpm
I
EVAPORATION 1606 gpmPIT WALL
RUNOFF 101
SEEPIE FACE=
N CONTINENTAL PIT LAKE
Date:
Project:
File:

DIRECT PRECIPITATION = 19.2 gpm
z7:Th
// GROUNDWATER
INFLOW = 29.2 gpm
WALLEVAPORATION 58 5 gpmUNOFF = 10 1 Pm
_SEEPIE
/FACE
CONTINENTAL PIT LAKE
FIGURE E4-7 I Date: DECEMBER 1999
SHEPHERD MILLER WATER BALANCE AT STEADY STATE File: WBAL-CEX
A EXPANDED CONTINENTAL PIT LAKE Project: 100029\TASK5
NCORPORATED

I
INCREASEINPLOW BASE CASE DDECRA5EThFL0W
FIGURE E4-8 Date; DECEMBER 1999SENSITIVITY OF WATER BALANCECOMPONENTS TO FINAL PIT LAKE Project; 1OOO29.
PREDICTIONS File; FIG-ATV.PPT
C
60
40
PARAMETER
SHEPHERD MILLER

Al IACHMENTSTOAPPENDIX E
WATER BALANCE MODELS FOR THE PROPOSEDCONTINENTAL MINE EXPANSION PROJECT,
GRANT COUNTY, NEW MEXICO
Prepared for:Cobre Mining Company, Inc.do Chino Mines Company
No.14 Chino BoulevardHurley, New Mexico 88043
Prepared by:Shepherd Miller, Inc.
3801 Automation Way, Suite 100Fort Collins, Colorado 80525
December 1999
SHEPHERD MILLERICORPCRATED

ATTACHMENTS TO APPENDIX E
WATER BALANCE MODELS FOR THE PROPOSED CONTINENTAL MINEEXPANSION PROJECT, GRANT COUNTY, NEW MEXICO
TABLE OF CONTENTS
INTRODUCTION e-1
PROBLEM STATEMENT AND OBIECTIVES e-1
WATER BALANCE MODELING APPROACH e-2
El-l.O CLIMATE El-i
El-l.l AvailableData El-i
El-l.2 Climate at the Continental Mine El-i
E1-i.2.l Precipitation and Temperature El-i
El-l.2.2 Evaporation E1-3
Ei-l.2.3 Runoff and Infiltration Ei-4
El-2.O REFERENCES El-i
E2-i.O INTRODUCTION: TAILINGS POND E2-1
E2-1.1 Objectives E2-1
E2-l.2 Approach E2-i
E2-2.O CALCULATIONS E2-4
E2-2.i 1997 Tailings Pond Facility Water Balance E2-4
E2-2.2 1997 Flows to the Fierro Area and Lower Bedrock Units E2-5
E2-2.3 End-of-Mining Tailings Pond Water Balance Including Flows to the FierroArea and Lower Bedrock Units E2-7
E2-2.4 End-of-Mining Water Balance E2-8
E2-2.5 Post-Closure Tailings Pond Water Balance Including Flows to the Fierro
Area and Lower Bedrock Units E2-8
E2-3.O SUMMARY E2-1i
E3-i.O INTRODUCTION: U1’TDERGROUND WORKINGS E3-i
Cobre Mining Company, Inc. Shepherd Miller, Inc.
p:UO0029repori-drafl-raappcndx-eanachs-dited.doc e-i December 1999

E3-2.O CALCULATIONS.E3-2
E3-2.1 Evaluation of the Current Ground Water Inflow Rate E3-2
E3-2.2 Prediction of the Future Ground Water Inflow Rate E3-6
E3-2.3 Evaluation of Mine Re-flooding E3-9
E3-3.O SUMMARY AND CONCLUSIONS E3-13
E3-4.O REFERENCES E3-14
E4-1.O INTRODUCTION: CONTiNENTAL PIT E4-1
E4-1.l Problem Statement and Objectives E4-1
E4-1.2 Approach E4-1
E4-2.O CALCULATIONS E4-3
E4-2. 1 Data and Assumptions E4-3
E4-2.2 Water Balance E4-5
E4-2.3 Water Balance Sensitivity E4-9
E4-3.O SUMMARY AND CONCLUSIONS E4-1 1
E5-1.O INTRODUCTION: HANOVER MOUNTAiN E5-1
E5-1.1 Problem Statement and Objectives E5-1
E5-1.2 Approach E5-l
E5-2.O CALCULATIONS E5-3
E5-2. 1 Climatic Components to the Water Balance E5-3
E5-2.2 Ground Water Components to the Water Balance E5-3
E5 —2.2.1 Horizontal Ground Water Flow Component E5-3
E5-2.2.2 Vertical Ground Water Flow Component E5-6
E5-2.2.3 Ground Water Balance E5-6
E5-2.3 WaterBalance E5-7
E5-3.O SUMMARY AND CONCLUSIONS E5-9
E6-1.O INTRODUCTION: ANALYTICAL MODEL E6-l
E6-2.O THEORETICAL DEVELOPMENT E6-2
E6-2.1 Zone 1 Analytical Solution E6-2
E6-2.2 Derivation of the Zone 1 Analytical Solution E6-4
E6-2.3 Zone 2 Analytical Solution E6-5
Cobre Mining Company, Inc. Shepherd MilIer Inc.
e—ii December 1999

E6-3.O REFERENCES.E6-7
LIST OF TABLES
Table El-i
Table E1-2
Table E2-i
Table E2-2
Table E2-3
Table E2-4
Table E3-i
Table E3-2
Table E3-3
Table E3-4
Table E3-5
Table E3-6
Table E4-i
Table E4-2
Table E4-3
Table E5-la
Table E5-lb
Table E5-2
Monthly Precipitation Distributions
Estimated Average Monthly Temperature for the Continental Mine Site
Measured Components for the 1997 Tailings Pond Facility Water Balance
Yearly Average Flow Rates for the 1997 Tailings Pond Facility
Determination of Post-Closure Water Balance Components
Partitioning of Tailings Pond Seepage Between Flow to the Fierro Areaand Flow to the Lower Bedrock Units.
Input Parameters Used in the Calculation of Bulk Hydraulic Conductivity
Calculation Summary of Hydraulic Conductivity Calibration
Parameters Used in the Calculation of Ground Water Inflows at the End ofMining
Calculation Summary of Ground Water Inflow Rate at End of Mining
Parameters Used in the Calculation of Time to Fill the UndergroundWorkings
Calculation Summary of Time to Fill Underground Workings
Parameters for the Non-expanded Continental Pit Ground Water InflowCalculations
Parameters for the Expanded Continental Pit Ground Water InflowCalculations
Worksheet Showing Development of Figures E4-4 through E4-7
Parameters for the Proposed Hanover Pit Ground Water InflowCalculations - Horizontal Flow
Parameters for the Proposed Hanover Pit Ground Water InflowCalculations - Vertical Flow
Worksheet Showing Development of Figures E4-3 through E4-4
Table E5-2 (continued) Worksheet Showing Development of Figures E4-3 through E4-4
LIST OF FIGURES
Figure E1.i Yearly Precipitation and Average Temperature Fort Bayard, New Mexico
Figure El .2 Monthly Precipitation and Daily Average Temperature Distribution FortBayard, New Mexico
Cobre Mining Company. Inc. Shepherd Miller Inc.
e-iii December 1999

Figure El .3 Monthly Evaporation Chino Mine, New Mexico
Figure E3.l Schematic Representation of Flow to the Underground Sump
Figure E4.l Polynomial Relationships of Pit Radius, Area, Volume, and Ground WaterInflows as a Function of Depth for the Non-Expanded Continental Pit
Figure E4.2 Polynomial Relationships of Pit Radius, Area, Volume, and Ground WaterInflows as a Function of Depth for the Expanded Continental Pit
Figure E4.3 Simulation of a Pit Lake as a Set of Expanding Cylinders
Figure E4.4 Magnitudes of the Water Balance Components for the Non-ExpandedContinental Pit Lake
Figure E4.5 Magnitude of the Water Balance Components for the ExpandedContinental Pit
Figure E4.6 Continental Pit Lake Water Balance at Steady State
Figure E4.7 Expanded Continental Pit Lake Water Balance at Steady State
Figure E4.8 Sensitivity of Water Balance Components to Final Pit Lake Predictions
Figure E5.l Pit Lake Storage Volume and Surface Area versus Pit Lake Depth
Figure E5.2 Hanover Pit Lake Conceptual Model Cross-Sectional View
Figure E5.3 Analytical Model Framework for Elevations 6,560 to 6,600 Feet
Figure E5.4 Analytical Model Framework for Elevations 6,600 to 6,640 Feet
Figure E5.5 Analytical Model Framework for Elevations 6,640 to 6,680 Feet
Figure E5.6 Analytical Model Framework for Elevations 6,680 to 6,720 Feet
Figure E5.7 Analytical Model Framework for Elevations Above 6,720 Feet
Figure E5.8 Magnitudes of the Water Balance Components as a Function of Depth
Figure E5.9 Filling Time of the Hanover Pit Lake
Figure E6. 1 Conceptual Model of Ground Water Flow to an Open Pit
Figure E6.2 Conceptual Model Based on Two-Part Analytical Solution of GroundWater Flow to a Pit
Cobre Mining Company. Inc. Shepherd Miller. Inc.
e-iv December 1999

INTRODUCTION
The following attachments describe the rationale and analytical models used to develop
impact predictions presented in Appendix E. Available data are presented along with
assumptions and descriptions of the computational methods used to estimate hydrologic
conditions at various stages of mining.
PROBLEM STATEMENT AND OBJECTIVES
New mining and expansion of existing operations proposed by Cobre Mining Company
will change the existing hydrology of the site area. Water-level data from monitoring
wells and piezometers, installed near the proposed Hanover open-pit mine, indicate that
the pit will intersect the local ground water table and may intersect the regional ground
water table, creating the potential for a pit lake to develop after cessation of mining. In
1997, the Continental Pit did not require dewatering because pumping of the
Underground Workings lowered the water table to below the pit bottom. However, if
pumping of the Underground Workings is discontinued, the water table will rise above
the current pit bottom and a pit lake will likely form. The proposed Continental Pit
expansion also creates the potential for a pit lake to form after mining ends. The
expanded South WRDF, 1997 proposed Tailings Pond expansion, 1997 planned
expansion of the Underground Workings, and the Fierro Leach Pad all have the potential
to affect the hydrologic regime. This attachment describes the hydrologic analyses
performed by SMI to predict the following:
• Likelihood of pit lake development in the Continental and Hanover Pits
• Final water-surface elevation in the ultimate (stable) pit lakes after cessation of
mining
• Time for the water levels in the pit lakes and Underground Workings to reach a
stable equilibrium
• Steady-state pit lake water balance components for both pits
• Magnitudes of water balance components for the 1997 Tailings Pond
Cobre Mining Company, Inc. Shepherd Mi11er Inc.
e-1 December 1999

• Magnitudes of water balance components at the end of mining (but before
dewatering ceases) for the expanded Tailings Pond, the Underground Workings,
and both open pits
• Magnitudes of water balance components, after mining ceases and reclamation is
complete, for the expanded Tailings Pond, the Underground Workings, and both
open pits.
WATER BALANCE MODELING APPROACH
The water balance conceptual models presented in the following sections are semi-
quantitative representations of the expected hydrologic regimes. The conceptual models
are different for each phase of mining (current, end-of-mine, or post-closure) and for each
location (open pits, Tailings Pond, or Underground Workings). Key components of each
conceptual model are described in the following sections.
To meet the objectives of the water balance calculations, SMI performed the following:
• Developed conceptual models and estimated each component of the water balance
for current conditions, near the end of mining, and at post-closure for the:
— Pits
— Tailings Pond
— Underground Workings
• Evaluated flow components in these areas by solving the following discrete
equation:
= [( (Inflow) - Z (Outflow)]
where:
AS = change in the storage volume
At = change in time
(Inflow) = total water inflow rate to the specifiedsystem
(Outflow) = total water outflow rate from the specifiedsystem.
Cobre Mining Company, Inc. Shepherd Miller Inc.
pIOOO29repoIrafl-reappcrnJLx.ecanachs.exlited.doc e—2 December 1999

(1)
AVERAGEANNUALPRECIPITA11ON(IN)
II
CD
-<VVV
m
-<VVV
-I,c_)VVVV
-H>
>—-<i
V
2. -
VVVV
EJmV
rm>m
CDV
V
0m
VVVVV
CD-oIii
-1C
mVV
CDV
CDVV
VV
CDCD
-Ti-IDVVV
—mV
—I
rn-II
rM
AVERAGEANNUALTEMPERATURE

4.0
3.5
3.0
2.5UI=C.,z
zo 2.0I
I—0
C)w 1.5a-
1.0
0.5
0.0
UI
I-.
UIa.
UII—
FIGURE E1-2 Date: DECEMBER 1999MONTHLY PRECIPITATION AND DAILY
SHEPHERD MILLER AVERAGE TEMPERATURE DISTRIBUTION Project 1OOO29..
., FORT BAYARD, NEW MEXICO File FIG ATV PPT
Jan Feb Mar Apr May Jun Jul Aug Sep Oct Nov Dec
MONTH
Jan Feb Mar Apr May Jun Jul Aug Sep Oct Nov Dec
MONTH

J)xri
DEPTH(INCHES)
—I-—z-<cP1mC
z>mQ rn-amo
ni>C-
XE!
oz
‘.!T0
T1UC
C
I

ATTACHMENT El
CLIMATIC INPUTS TO THE WATER BALANCES ASSOCIATED WITH THEPROPOSED CONTINENTAL MINE EXPANSION PROJECT,
GRANT COUNTY, NEW MEXICO

El-1.O CLIMATE
E1-1.1 Available Data
Earthlnfo (1996) indicates that the Fort Bayard weather station has recorded
temperature and precipitation data from 1897 through 1994. Figure El-i shows
annual precipitation and mean daily temperature for this time period. Annual
precipitation has a mean of 15.7 inches/year and a standard deviation from the mean
of 4.5 inches/year. The graph suggests that mean annual precipitation has been
gradually increasing since about 1950. Figure E1-2 shows distinct seasonal variations
in the monthly distributions of precipitation and temperature at Fort Bayard. Daily
average temperatures range from 38°F in January to 72°F in July. The average
minimum temperature is 25°F in January and the average maximum temperature is
87° in July.
Evaporation data are available from the Chino Mine. WESTEC (1997) reports that
the average annual pan evaporation at the Chino Mine is approximately 79.7
inches/year. The monthly distribution of pan evaporation at Chino Mine are shown
on Figure E1-3.
E1-1.2 Climate at the Continental Mine
No long-term, site-specific climatic data are available for the Continental Mine.
Therefore, interpretations from available climatic data must be made in order to
develop input parameters for the water balance calculations for the Continental Mine
Expansion. The following sections discuss these interpretations.
E1-1.2.1 Precipitation and Temperature
Previously, Cobre has used a mean annual precipitation of 18.3 inches/year
(WESTEC, 1997) in its water balance calculations. This value agrees with contours
on the Average Annual Precipitation Map of New Mexico (Daly et al., 1994) for the
site area. A portion of this map is reproduced on Figure E-3 of the main text. This
Cobre Mining Company. Inc. Shepherd Mil1er Inc.
El —1 December 1999

annual precipitation value is used in the various water balance calculations.
Assuming that the monthly rainfall distribution at the Continental Mine is similar to
that measured at the Fort Bayard weather station, the precipitation at the mine has
been estimated as shown in Table El-i.
Table El-i Monthly Precipitation Distributions
Fort Bayard Average Continental Mine SiteMonth Monthly Precipitation Estimated Average
(inches) Monthly Precipitation(inches)
January 0.87 1.02
February 0.85 0.99
March 0.73 0.85
April 0.39 0.45
May 0.45 0.52
June 0.77 0.89
July 3.15 3.67
August 3.34 3.88
September 2.04 2.37
October 1.26 1.46
November 0.78 0.91
December 1.10 1.28
Annual Total 15.73 18.29
Because of the proximity of the Continental Mine to Fort Bayard, mean monthly
temperatures at the site were assumed equal to those measured at Fort Bayard. Table
E1-2 shows the Fort Bayard weather station measured data and estimated monthly
temperatures for the Continental Mine site.
Cobre Mining Company, Inc. Shepherd Mil1er Inc.
El —2 December 1999

Table Ei-2 Estimated Average Monthly Temperature for the ContinentalMine Site
Month Continental MineEstimated Average Monthly
Temperature(°F)
January 38.4
February 41.4
March 45.8
April 52.9May 60.6
June 70.2
July 72.2
August 70.6September 65.9
October 56.5
November 45.6December 39.2
Annual Average 54.9
El-i .2.2 Evaporation
Pan evaporation at the Continental Mine is expected to be similar to that observed at
the Chino Mine. Pan evaporation rates are typically larger than evaporation rates
from small lakes or ponds. Thus, it is standard practice to apply a correction factor to
pan evaporation rates in order to estimate lake evaporation rates. Schwabb et al.
(1981) reports this correction factor to be 0.7 for a Class A evaporation pan.
Estimated monthly evaporation rates for open bodies of water at the Continental Mine
are computed by multiplying monthly pan evaporation rates by the above factor.
Table E1-3 summarizes average pan evaporation data from the Chino Mine and the
computed (corrected) lake evaporation rates at the Continental Mine.
Cabre Mining Company. Inc. Shepherd Miller. Inc.
p:I1OOO29report-draft-rcvsaiappcndb&cattachs-cdhlcd.doc El —3 December 1999

Table E1-3 Monthly Evaporation from the Chino Mine
Mean Monthly Pan Mean Monthly LakeMonth Evaporation at the Chino Evaporation at the
Mine Continental Mine(inches) (inches)’
January 1.55 1.09
February 3.36 2.35
March 4.03 2.82
April 10.50 7.35
May 11.78 8.25
June 12.00 8.40
July 8.37 5.86
August 8.06 5.64
September 8.40 5.88
October 6.20 4.34
November 3.90 2.73
December 1.55 1.09
Annual 79.70 55.79Total
The Continental Mine mean monthly lake evaporation is equal to 0.7 times the
Chino Mine mean monthly pan evaporation rate.
E1-1.2.3 Runoff and Infiltration
Runoff and infiltration associated with the various areas of the Continental Mine were
analyzed by others (e.g., Daniel B. Stephens and Associates, Schafer and Associates,
mc, and Brown and Root, WESTEC, and Cobre) as part of the Close-out/Closure
Plan and during ongoing mine expansion design. Several of the analyses were
completed with different average annual rainfall than that reported in Section El-
1.2.1. ‘Where appropriate, SMI scaled these estimates to ensure consistency
throughout this document.
Upland runoff will be diverted around the facilities discussed in these analyses.
Therefore, upland runoff not affected by mine changes was not incorporated into
water balances. Runoff changes due to additional capture were analyzed using the
SCS curve number method and 100 years of daily rainfall data.
Cobre Mining Company, Inc.
p1OOO29cpon-drafl-r&scMppcndb-ccatiachs-edited.doc
Shepherd Mil1er Inc.
December 1999E1-4

The SCS curve number method is an empirical method originally developed to assist
rural land planners and agriculturists in predicting runoff from agricultural fields.
Since its inception, it has become a standard method used to predict runoff volumes
for a variety of areas. The SCS curve number formulas and the assumptions used to
estimate runoff from undisturbed mine areas are as follows:
Runoff= (1a)2
depi(PIa —S)
where:
Runoffdeptjl is the depth of runoff
P is the precipitation depth (from a measured a single storm event). Using the
HELP model (Schroeder et al. 1994) synthetic weather generator, daily P
values were generated using the monthly average precipitation values
presented in Attachment E-1 and weather coefficients from El Paso, Texas. ‘a
is the initial rainfall abstraction due to small surface depressions or capture by
vegetation (typically assumed to be 0.2 times S)
S is the empirically derived formula relating the curve number (CN) to runoff:
1000
CN-10
CN is an empirically derived value used to represent land use and soil
hydrologic conditions. For undisturbed mining areas at the Continental Mine,
DBS&A (1998) assumed a CN of 58.
SMI used a spreadsheet to perform this analysis. The method estimated that over a
100-year period, rainfall runoff could range from zero to 1.61 inches/yr with an
average of 0.21 inches/yr. The area to be disturbed by the development of the
Hanover Pit is approximately 160 acres. Because this excess precipitation will no
longer overland flow to Hanover Creek, on average, approximately 2.8 acre-feet of
Cobre Mining Company, Inc. Shepherd Miller. Inc.
p E 1 —5 December 1999

runoff will be lost annually. This is equivalent to 1.7 gpm of continuous flow. Fierro
Leach Pad disturbance will be approximately 130 acres and will result in a direct
runoff loss of approximately 2.3 acre-feet annually. The additional area to be
disturbed by the expanded footprint of the South WRDF (beyond December of 1999)
is very small and not included in this analysis.
Cobre Mining Company, Inc. Shepherd Miller. Inc.
p.l1OOO29rpor,-drqfl-revLednppcndLz.ccanachs.cdftc.Ldcc E 1 —6 December 1999

E1-2.O REFERENCES
Daly, C., R.P. Neilson, and D.L. Phillips. 1994. A Statistical-topographic Model forMapping Climatological Precipitation over Mountainous Terrain. Journal ofApplied Meteorology, 33, 140-158.
Earthlnfo. 1996. “NCDC Summary of the Day.” Earthlnfo, Inc., Boulder, Colorado.
Schroeder, P.R., C.M. Loyd, and P.A. Zappi, 1994. The Hydrologic Evaluation ofLandfill Performance (HELP) Model. User’s Guide for Version 3. EPAJ600/9-94/168a. U.S. Environmental Protection Agency Risk Reduction EngineeringLaboratory, Cincinnati, OH.
Schwabb, G.O., R.K. Frevert, T.W. Edminster, and K.K. Barnes. 1981. Soil and WaterConservation Engineering, third edition. John Wiley and Sons: New York.
Cobre Mining Company, Inc. Shepherd Miller Inc.
El —7 December 1999

ATTACHMENT E2
TAILINGS POND WATER BALANCESFOR THE PROPOSED CONTINENTAL MINE EXPANSION PROJECT,
GRANT COUNTY, NEW MEXICO
E2-1.O INTRODUCTION: TAILINGS POND
The evaluation presented below is based on the 1997 proposed expansion of the Tailings
Pond and the associated analysis performed in 1997. Cobre had planned to expand the
1997 Tailings Pond and increase its height to an ultimate elevation of 7,140 feet. The
Tailings Pond includes the Tailings Pond, the Reclaim Pond, and the Toe Collection
Pond. At the time, there were no plans to increase milling production rates. Although the
water from the Tailings Pond met primary state drinking water standards, it exceeds
secondary standards for sulfate and TDS. Thus, it was important to evaluate the
significance of leakage and the potential chemical changes to ground water quality.
E2-1.1 Objectives
The objectives of this Tailings Pond water balance are to:
• Evaluate the overall water balance for 1997
• Evaluate the 1997 and future leakage rates for the facility
• Estimate the downward leakage rates from the facility to the lower bedrock units
and the Fierro Area.
E2-1.2 Approach
The general water balance equation was used to quantitatively describe the water balance
for the 1997 facility and the previously proposed expansion. Inflows and outflows of the
water balance include both measured and estimated components. Because it is a lined
pond and due to its small size, evaporation and leakage from the toe collection pond were
assumed to be negligible and were therefore excluded from the analysis.
Measured flow components and their corresponding magnitudes are summarized in Table
E2-1. The values in this table are a result of measurements taken between January and
October 1997. Also included in this table are the 1997 changes in storage in the
interstitial pore spaces of the Tailings Pond (i.e., the average water content of the settled
Cobre Mining Company. Inc. Shepherd Miller, Inc.
pIOOO29ircpon-drafl-r&scd\nppcndLt-ecauachx-edhscd.doc E2- 1 December 1999

tailings) and in the Reclaim Pond (i.e., changes in the surface elevation of the Reclaim
Pond).
Estimated flow components of the water balance are based on several different
calculations. Inflow from precipitation is a result of multiplying the planar area of the
Tailings and Reclaim Ponds by the average precipitation. Outflow due to evaporation is
calculated in a similar manner. Outflows due to leakage from the Tailings and Reclaim
Ponds are based on hydraulic potentials, cross-sectional area of flow, and measured
hydraulic conductivities. Section E2-2.0 describes these calculations in detail.
Assumptions incorporated in the water balance of the Tailings Pond facility include:
• All overland flow from areas upgradient of the Tailings Pond would be divertedaround the facility.
• The tailings are saturated and vertical flow through the tailings is a result of a unithydraulic gradient.
• The tailings have a saturated conductivity of lxio cmlsec.
• The weathered bedrock and alluvium beneath the Tailings Pond has an averagethickness of 10 feet and a saturated hydraulic conductivity of approximatelyl.5x103 to 1.0x10² cmlsec.
Cobre Mining Company, Inc. Shepherd Miller, Inc.
p:UOOO29lrcort-drafi-revLaftappcndLz-ecnnnch-edited.doc E2-2 December 1999


E2-2.O CALCULATIONS
E2-2.1 1997 Tailings Pond Facility Water Balance
Table E2-2 summarizes the yearly based, average daily flow rates of measured input
water balance components. Three of the water balance components (i.e., inflow due to
precipitation and outflows due to evaporation and leakage) shown in Table E2-2 were not
directly measured. Estimates for the precipitation and evaporation components were
based on the daily average precipitation and evaporation data presented in Attachment
El. The leakage rate estimate of 112 gpm was determined using the general water
balance equation:
—
= [( (Inflow) - (Outflow)]
where:
=6l5gpm
(Inflow) = 3,619 gpm
(Outflow) = 2,892 gpm + Leakage
Solving for the “Leakage” term yields:
Leakage = 615 gpm+2,892 gpm-3,619 gpm= 112 gpm
Cobre Mining Company, Inc. Shepherd Mi1ler Inc.
E2-4 December 1999

Table E2-2 Yearly Average Flow Rates for the 1997 Tailings Pond Facility
Average Daily Flow Rate(gpm)
INFLOWS
Water in Mill Tailings 3,288
Concentrate Decant/Filtrate 135
Collection Pond Returns 75Toe Collection Return 502
Precipitation 121
TOTAL INFLOWS 4,121
OUTPUTSReclaim 2,163
Decant Sump 360Evaporation 369
Toe Collection 502
Leakage 112
TOTAL OUTFLOWS 3,506
CHANGE IN STORAGE
Settled Tailings Interstitial 487MoistureChange in Reclaim Storage 128
TOTAL STORAGE CHANGE 615
E2-2.2 1997 Flows to the Fierro Area and Lower Bedrock Units
Figure E-13 (main text) shows the hydrologic conceptual model of the current Tailings
Pond facility and surrounding area. The total leakage from the Tailings Pond facility in
1997 (i.e., 112 gpm) derives from two areas:
1. Leakage from the Tailings Pond
2. Leakage from the Reclaim Pond.
Leakage from the Tailings Pond is controlled by the vertical hydraulic conductivity of the
tailings materials and the hydraulic head distribution within the tailings material.
Assuming that the tailings are completely saturated from top to bottom, the following
form of Darcy’s Law is applicable:
Cobre Mining Company. Inc. Shepherd Mil1er Inc.
p:UOO029Ircpon-draf?-cvLcdnppcdft-ccartachs-cdiicddoc E2—5 December 1999

Q=AK (E2-1)
where:
Q = Flow rate
A = The cross sectional area of flow (4,810,771 feet2 - the saturated, planar
area of the Tailings Pond)
K = The average (bulk) hydraulic conductivity
dh= Hydraulic gradient through the impoundment
The hydraulic gradient () through the Tailings Pond is approximately equal to one.
From the above form of Darcy’s law, the flux through the tailings was estimated to be 7.1
gpm, assuming an average saturated hydraulic conductivity of the tailings of 1x10⁷
cmlsec. The leakage from the Reclaim Pond is then 105 gpm (112 gpm - 7 gpm).
Knowing the cross-sectional area of flow and hydraulic gradient associated with the
shallow aquifer beneath the facility, the bulk hydraulic conductivity of this aquifer was
estimated from the simplified form of Darcy’s Law:
QK (E)A
Where:
Q= 105 gpm
A 10,500 feet2 (10-foot thickness times 1,050-foot width of flow)
Cobre Mining Gompany, Inc. Shepherd Miller. Inc.
p:iOOO29½pot-drafl-rcviedappendLr-eieattachs-edi:ed.doc E2—6 December 1999

dh= 0.068 (change in head from the Reclaim Pond to the toe of the
Tailings Pond [285.7 feet] divided by the flow length
[approximately 4,175 feet])
This results in an estimated hydraulic conductivity of 9.9x10³ cmlsec, which agrees well
with the geometric mean of the measured hydraulic conductivity in monitoring well MW-
24 (7.2x10³cmlsec), which is screened in the same shallow alluvial aquifer.
The leakage from the shallow aquifer into the lower bedrock units is considered to be
small because of the probable unsaturated zone created by the underground dewatering;
however, a high-end estimate of potential flow to the lower bedrock units was made
assuming saturated, unit gradient conditions. The vertical hydraulic conductivity of the
lower bedrock units was assumed to be lx107 cmlsec, and the cross-sectional area of
flow was assumed equal to the total area covered by the Tailings Pond. Because these are
the same parameters used in estimating the leakage from the tailings materials, the high
end estimated flow to the lower bedrock units is approximately 7 gpm.
E2-2.3 End-of-Mining Tailings Pond Water Balance Including Flows to the
Fierro Area and Lower Bedrock Units
At the end of mining, the final elevation of the Tailings Pond will be approximately 7,140
feet. The map area of the expanded Tailings Pond will be about 264 acres, and the
Reclaim Pond will probably occupy an area similar to the current condition. These areas
result in an estimated evaporation loss and precipitation inflow rates of approximately
760 and 256 gpm, respectively.
Using the same approach as that used for estimating the 1997 tailings-leakage rate (see
Equation E2-1), the estimated end-of-mining leakage rate is approximately 17 gpm. With
a cross-sectional area of flow of 38,140 feet2, a gradient of 0.062, and a hydraulic
conductivity of 9.9x10³ cmlsec, the estimated leakage rate from the end-of-mining
Reclaim Pond is estimated to be approximately 345 gpm. If the Lower Bedrock Units are
Cobre Mining Company, Inc. Shepherd Miller, Inc.
p1OOO29,epn-drafl-rcvgseJ’iippendi,-&cagtadzs-.di:cd.doc E2-7 December 1999
saturated, the estimated high-end flow rate from the shallow aquifer is approximately 17
gpm.
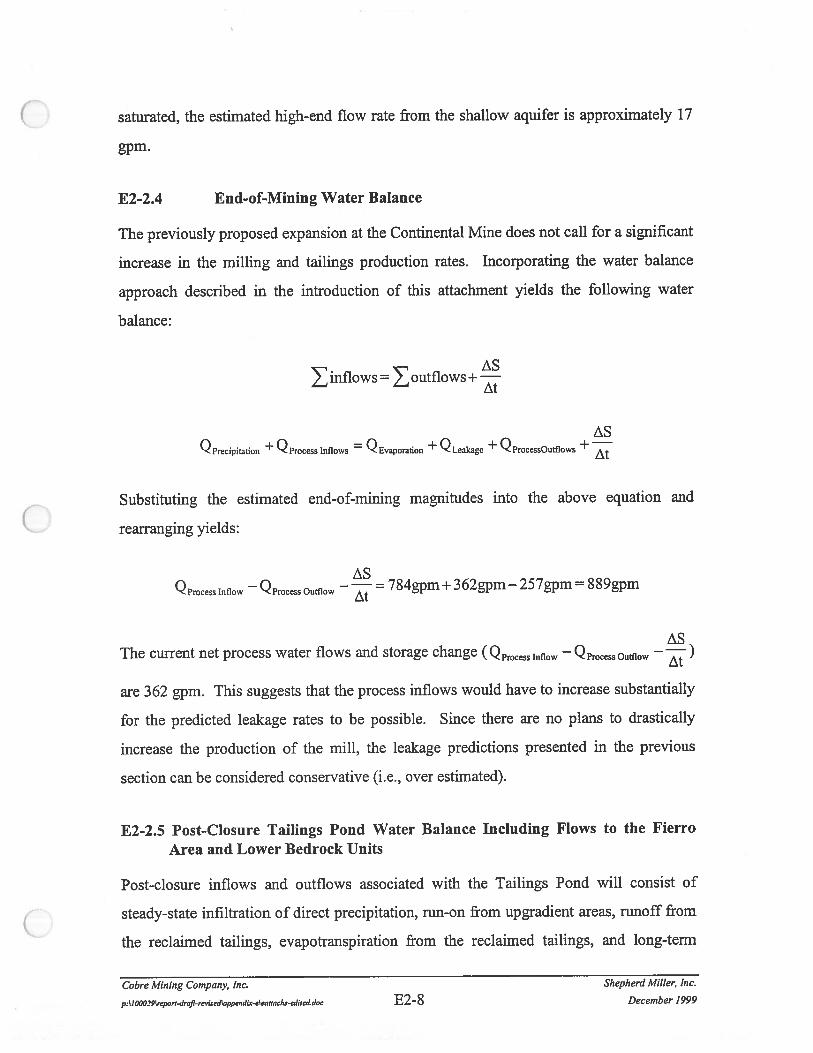
E2-2.4 End-of-Mining Water Balance
The previously proposed expansion at the Continental Mine does not call for a significant
increase in the milling and tailings production rates. Incorporating the water balance
approach described in the introduction of this attachment yields the following water
balance:
inflows outflows +
ASQ Precipitation + Qprocess Inflows = QEvaporation + QLeakage + Qrocessutows +
Substituting the estimated end-of-mining magnitudes into the above equation and
rearranging yields:
ASQprocess Inflow — Qprocess Outflow —
784gpm + 362gpm — 257gpm = 889gpm
ASThe current net process water flows and storage change (Qrocess Inflow — Qrocess Outflow —
are 362 gpm. This suggests that the process inflows would have to increase substantially
for the predicted leakage rates to be possible. Since there are no plans to drastically
increase the production of the mill, the leakage predictions presented in the previous
section can be considered conservative (i.e., over estimated).
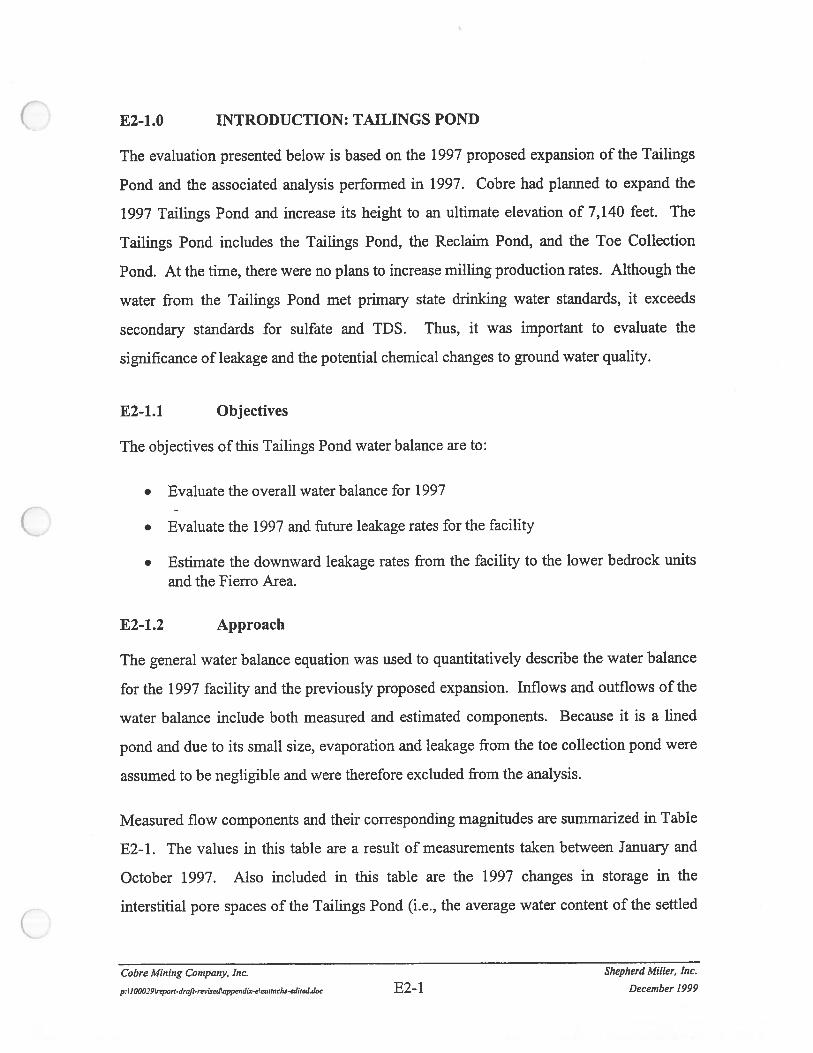
E2-2.5 Post-Closure Tailings Pond Water Balance Including Flows to the Fierro
Area and Lower Bedrock Units
Post-closure inflows and outflows associated with the Tailings Pond will consist of
steady-state infiltration of direct precipitation, run-on from upgradient areas, runoff from
the reclaimed tailings, evapotranspiration from the reclaimed tailings, and long-term
Cobre Mining Company, Inc. Shepherd Miller, Inc.
p:IOOO29eponfrafi-renppedb-eea:racks-cditai.doc E2-8 December 1999
downward seepage from the bottom of the facility. DBS&A (1999) estimated the
magnitudes of the various post-closure, Tailings Pond water balance components based
on a precipitation rate of 15.5 inches/yr and the chosen reclamation scenario. These rates
were scaled up to be consistent with previous Tailings Pond analysis based on 18.3
inches/yr precipitation (See Table E2-3). Using this approach, it was predicted that the
covered 264-acre Tailings Pond would receive approximately 249.6 gpm of precipitation
(18.3 in/yr) and approximately 0.6 gpm of run-on. Of this 250.2 gpm, approximately 1.9
gpm would run off, approximately 224.6 gpm would evaporate, and approximately 24.7
gpm would infiltrate. Assuming steady-state conditions, the seepage from the bottom of
the impoundment is equal to the infiltration. Partitioning the seepage between flow to
lower bedrock units and the Fierro Area, based on the ratio of flows presented for the
current and end-of-mine scenarios results in flow of 1.3 gpm and 23.4 gpm, respectively
(See Table E2-4).
Table E2-3 Determination of Post-Closure Water Balance Components
Water DBS&A DBS&A Scaled Post-Balance Predicted Predicted DBS&A Closure
Component Rates Rates Predicted PredictedRates Rates
(acre-ft/yr)1 (in/yr)2 (in/yr)3 (gpm)4
Average 177.0 15.54 18.30 249.6PrecipitationAverage 0.4 0.04 0.04 0.6Run onAverage 0.6 0.02 0.02 1.9RunoffAverage 159.3 13.99 16.47 224.6Actual ETAverage 17.5 1.54 1.81 24.7Infiltration‘Based on an average annual precipitation rate of 15.5 inlyr.2 DBS&A Tailings Pond area = 137 acres.‘ DBS&A Unit rates multiplied by the ratio of 18.3/15.5.Post-closure Tailings Pond area = 264 acres.
Cobre Mining Company, Inc. Shepherd Miller Inc.
p:lIOOO29report-dmfl-reviseJappendLx-eieauachs-edftcd.doc E2-9 December 1999

Table E2-4 Partitioning of Tailings Pond Seepage Between Flow to the FierroArea and Flow to the Lower Bedrock Units.
Current Flow End-of-Mine Post-ClosureRate (gpm) (gpm)(gpm)
Tailings 7 (6%) 16.4 (5%) 24.7 (100%)SeepageReclaim Pond 105 (94%) 345 (95%) -
SeepageTotal Seepage 112 (100%) 361.4(100%) 24.7(100%)
Flow to Fierro 105 (94%) 345 (95%) 23.4 (95%)AreaFlow to 7 (6%) 16.4 (5%) 1.3 (5%)Bedrock Units
Cobre Mining Company, Inc Shepherd Miller. Inc.
pIOOO29½pon4rafl-,appendiz-eent:arks-edj,j.doc E2- 10 December 1999

E2-3.O SUMMARY
The objectives set forth in Section E2-1.1 were satisfied by the calculations presented
above. The leakage rate from the current Tailings Pond were estimated to be
approximately 112 gpm based on measured components of the water balance. It is
possible that approximately 7 gpm of this total leakage may flow to the lower bedrock
units, while the remainder flows laterally downgradient to the Fierro Area. At the end of
mining, the potential leakage rate may increase to 362 gpm, of which about 17 gpm may
flow to the lower bedrock units and the remainder (about 345 gpm) to the Fierro Area.
The post-closure seepage rate will decrease to approximately 24.7 gpm with
approximately 1.3 gpm flowing to the lower bedrock units and approximately 23.4 gpm
flowing to the Fierro Area. The most important conclusion to recognize from this work is
that a majority of the leakage from the Tailings Pond flows to the Fierro Area and
relatively little leaks downward into the lower bedrock units.
Cobre Mining Company, Inc Shepherd Miller, Inc.
p:JOO029irodrafi-rappdix-eeauachs-edied.doc E2- 11 December 1999

a)a)C)
w
wC-)w
DZCI)
izzI—C
wwDujZDcD(90w
IJJ
cJ)—JUU0
0w
C
D
U)F—C)c.’JC)aa
uJz0
N
c’J
uJz0N
Uii .c)
Do
II
LU(9
IC)LU
zD0
0
uJUz
U

ATTACHMENT E3
UNDERGROUND WORKINGS WATER BALANCESFOR THE PROPOSED CONTINENTAL MINE EXPANSION PROJECT,
GRANT COUNTY, NEW MEXICO

E3-1.O INTRODUCTION: UNDERGROUND WORKINGS
This attachment has been prepared to provide a preliminary assessment of ground water
inflows into current and future Underground Workings at the Continental Mine. This
preliminary assessment includes an estimate of the ground water inflow rate into the final
mine (as previously planned) in addition to a prediction of the re-flooding time after mine
operations are terminated. Calculations are performed using analytical solutions for mine
inflow, empirical information on the current inflow rates, and available site
characterization data. This evaluation provides information that can be used for
assessment of ground water impacts.
Specific evaluations in this attachment include:
• Comparison of current inflow rates with predictions of an analytical model tocalibrate the bulk hydraulic conductivity value used in subsequent calculations
• Estimation of inflow rates into Underground Workings at the end of mining
• Evaluation of mine re-flooding time.
Cobre Mining Company, Inc. Shepherd Miller, Inc.
E3-1 December 1999
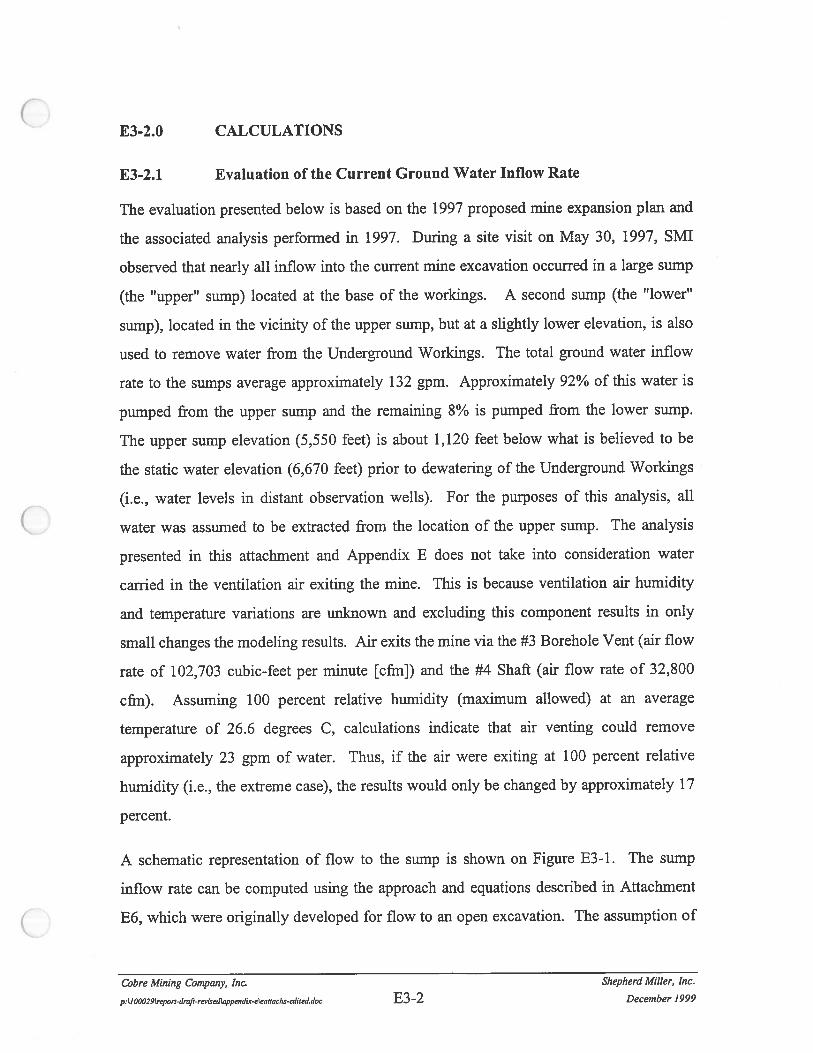
E3-2.O CALCULATIONS
E3-2.i Evaluation of the Current Ground Water inflow Rate
The evaluation presented below is based on the 1997 proposed mine expansion plan and
the associated analysis performed in 1997. During a site visit on May 30, 1997, SMI
observed that nearly all inflow into the current mine excavation occurred in a large sump
(the “upper” sump) located at the base of the workings. A second sump (the “lower”
sump), located in the vicinity of the upper sump, but at a slightly lower elevation, is also
used to remove water from the Underground Workings. The total ground water inflow
rate to the sumps average approximately 132 gpm. Approximately 92% of this water is
pumped from the upper sump and the remaining 8% is pumped from the lower sump.
The upper sump elevation (5,550 feet) is about 1,120 feet below what is believed to be
the static water elevation (6,670 feet) prior to dewatering of the Underground Workings
(i.e., water levels in distant observation wells). For the purposes of this analysis, all
water was assumed to be extracted from the location of the upper sump. The analysis
presented in this attachment and Appendix E does not take into consideration water
carried in the ventilation air exiting the mine. This is because ventilation air humidity
and temperature variations are unknown and excluding this component results in only
small changes the modeling results. Air exits the mine via the #3 Borehole Vent (air flow
rate of 102,703 cubic-feet per minute [cfm]) and the #4 Shaft (air flow rate of 32,800
cfm). Assuming 100 percent relative humidity (maximum allowed) at an average
temperature of 26.6 degrees C, calculations indicate that air venting could remove
approximately 23 gpm of water. Thus, if the air were exiting at 100 percent relative
humidity (i.e., the extreme case), the results would only be changed by approximately 17
percent.
A schematic representation of flow to the sump is shown on Figure E3-1. The sump
inflow rate can be computed using the approach and equations described in Attachment
E6, which were originally developed for flow to an open excavation. The assumption of
Cobre Mining Company, Inc. Shepherd Miller, Inc.
pJOOO3Wcpon-drafi-rcappendi-eienzrnchs-cdiccd.doc E3 -2 December 1999

flow to an “open” excavation is reasonable for the Underground Workings, due to the
following reasons:
• Nearly all inflow occurs in the floor and sides of the sump
• Continuous pumping keeps the sump essentially dewatered.
Parameters used in the sump calculations are summarized in Table E3-1.
Cobre Mining Company, Inc. Shepherd Miller, Inc.
p:1OOO29repon-drafi-resedappendLz-eieauach-edited.doc E3 -3 December 1999


E3-3.O SUMMARY AND CONCLUSIONS
The purposes of this attachment are to document the following:
• Estimation of a value for the bulk hydraulic conductivity associated with current
dewatering of the Underground Workings
• Prediction, based on the estimated bulk hydraulic conductivity value, of the end-
of-mining inflow rates into the Underground Workings
• Estimation of the flooding time required for the Underground Workings after
dewatering ceases.
Based on calculations of quasi-steady state flow into the Underground Workings, SMI
estimated that the bulk hydraulic conductivity of the formations supplying water to the
Underground Workings is 5.5x10⁶ cmls. This value agrees with the results of the
short-term aquifer testing of monitoring wells MW-5 and MW-2 1. For the previously
proposed mine expansion, the best estimated inflow rate at the end of mining is 302 gpm.
After dewatering operations are terminated, it is estimated that complete flooding of the
Underground Workings will take over 120 years.
The objectives described in Section E3-1 .0 have been satisfied. The results of this
preliminary analysis are not intended to provide a precise answer; rather, the results give
a general indication of the flow rates and refilling times that can be expected. These
results are adequate for impact assessment, but should not be used for engineering design
purposes.
Cobre Mining Company, Inc. Shepherd Miller, Inc.
p:lIOOO29rqI-draft-rcvLe7ppcnclix-cat(acks-c(Iiu’,Ldoc E3 —1 3 December 1999

E3-4.O REFERENCES
Cobre Mining Company, Inc. 1997. Personal Communications from Roger Dancause,
Cobre Mining Company. Estimate of Past and Planned Underground Mining
Production.
Cobre Mining Company, Inc. 1998. Personal Communications from Roger Dancause,
Cobre Mining Company. Table of Cobre Water Rights and Usage for the Past 5
Years.
Cobre Mining Company, inc. Shepherd Miller, Inc.
E3 —14 December 1999

ATTACHMENT E4
CONTINENTAL PIT WATER BALANCESFOR THE PROPOSED CONTINENTAL MINE EXPANSION PROJECT,
GRANT COUNTY, NEW MEXICO

E4-1.O INTRODUCTION: CONTINENTAL PIT
E4-l.l Problem Statement and Objectives
The evaluation presented below is based on a 1997 proposed expansion and the
associated analysis performed in 1997. In 1997, the Continental Pit was dry (except
during precipitation events) and required no dewatering. This condition is believed to
result from dewatering of the Underground Workings, which has depressed the water
table in the lower bedrock unit. However, observations made during blast-hole drilling
and from the water-level data in nearby wells indicate that the water table is very near the
current pit bottom (elevation 6,480 feet). After dewatering of the Underground Workings
ceases and water levels rise to their pre-mining condition, it is probable that the
Continental Pit will collect water and form a pit lake.
The objectives of this attachment are to document the following:
• Verification that a pit lake will form after the cessation of mining
• Estimation of the ultimate (stable) water level in the pit lake after closure
• Prediction of the time required for the pit lake to reach the ultimate elevation
• The input parameters provided for the predictive water quality model of the future
pit lake.
E4-1.2 Approach
The water balance components associated with the Continental Pit, both before and after
expansion, include the following:
• Direct precipitation to the pit lake surface
• Runoff and infiltration from precipitation falling on the pit walls
• Evaporation from the lake surface
• Ground water inflows from the pit walls and pit bottom.
Cobre Mining Company. Inc. Shepherd Mi1ler Inc.
pIOOO29repon-dmfl-rscdappeid-ekauachx-eJiicd.doc E4— 1 December 1999

The overall water balance and estimated filling times were accomplished using a
succession of steady-state solutions that were calculated based on average flow rates for
various pit lake water levels. The following list describes this process:
1. The geometry of the storage volume and lake area were calculated for various pitlake depths (e.g., for the expanded Continental Pit 0-20 feet depth interval, theaverage lake area = 10.1 acres, and the average end-area volume = 326,000 cubicyards).
2. The magnitude of each individual water balance component was estimated forvarious pit lake depth intervals (e.g., the precipitation to the lake for this intervalis the average area times the average yearly rainfall).
3. The water balance approach described in the introduction to the attachments wasused to estimate the time to fill the chosen depth interval.
4. This process was repeated for successive depth intervals until total inflowsbalanced the outflows, indicating no change in the pit lake volume (i.e., steady-state conditions). The pit lake elevation where total inflows equal total outflowscorresponds to the predicted ultimate pit lake elevation.
Cobre Mining Company. Inc. Shepherd Miller Inc.
E4-2 December 1999

E4-2.O CALCULATIONS
E4-2.l Data and Assumptions
The magnitudes of precipitation (18.3 inches/year) and evaporation (55.8 inches/year) are
presented in Attachment El. Runoff and infiltration from the pit walls can be estimated
from several types of runoff analyses, but for this preliminary estimate, 15% of the
precipitation (2.7 inches/year) falling on the pit walls was assumed to enter the pit lake.
Polynomial relationships were developed relating depth to pit lake surface area and
volume. Figures E4-1 and E4-2 display these relationships (developed from contour
maps) for the current and proposed Continental Pits, respectively.
Ground water inflow rates into the Continental Pit, assuming no expansion, were
computed using equations in Attachment E6 and the parameter values shown in Table
E4- 1. The curve of ground water inflow rate versus pit depth is shown on Figure E4- 1.
Table E4-1 Parameters for the Non-expanded Continental Pit Ground WaterInflow Calculations
Parameter Description Value and Units Notesh0 Depth of pit bottom below 190 feet Based on the assumed, pre-mining
static water table average static water level of 6,670feet and the current pit bottomelevation of 6,480 feet
d Depth of lake 0 to 60 feet Varies in 20 foot intervalsh Height of seepage face plus d + 10 feet
the depth of the lakerp Average pit lake radius Function of Depth 0.8 times the effective radius of the
pit lake surfaceW Regional ground water 1.24 inchlyear Assumed
recharge rateK Bulk hydraulic 5.5 x 10 cm/s Determined from the analysis of the
conductivity of rock Underground Workings (SeeSection E3-2.l)
Ground water inflow rates into the Continental Pit, assuming the proposed action
expansion occurs, were computed using equations in Attachment E6 and the parameter
Cobre Mining Company, Inc. Shepherd Miller Inc.
E4-3 December 1999

values shown in Table E4-2. The curve of ground water inflow rate versus pit depth is
shown on Figure E4-2. The calculations indicate an increase in ground water flows to the
pit lake with increasing pit lake depth. This behavior may seem counter-intuitive
because, in well hydraulics, the inflow to a well decreases as the water level in the well
rises. The difference between the pit lake calculations and what is observed in a well is
that the radius of the pit lake changes dramatically with depth. If the radius of the pit
were more uniform, this increasing trend in ground water inflow rates would not occur.
Table E4-2 Parameters for the Expanded Continental Pit Ground Water InflowCalculations
Parameter Description Value and Units Notesh0 Depth of pit bottom below 670 feet Based on the assumed, pre-mining
static water table average static water level of 6,670feet and the current pit bottomelevation of 6,480 feet
d Depth of lake 0 to 470 feet Varies in 20 foot intervalsh Height of seepage face plus D + 10 feet
the depth of the lakerp Average pit lake radius Function of Depth 0.8 times the effective radius of the
pit lake surfaceW Regional ground water 1.24 inchlyear Assumed
recharge rateK Bulk hydraulic conductivity 5.5 x 10⁻⁶ cmls Determined from the analysis of the
of rock Underground Workings (See SectionE3-2.1)
Additional assumptions used in the ground water inflow calculations are:
• Steady-state flow. While the steady-state flow assumption is not valid for shorttime periods (e.g., initial pit dewatering), it is a valid assumption for the long timeframes considered in this evaluation (i.e., several decades).
• Isotropic and homogeneous aquifer. Based on the scale of the problem and theobjectives of the calculation set, this assumption is reasonable.
• Radial flow to a terminal pit lake. For preliminary estimates, this assumption isvalid. It is based on the estimated pre-mining hydraulic gradients in the area, andthe large expected drawdown in the pit (i.e., the drawdown is sufficient to causeinflow into the pit from all directions).
Cobre Mining Company. Inc. Shepherd MiIle, Inc.
E4—4 December 1999

As the pit lake rises, the pit is modeled as a series of cylinders with increasing
E4-2.2
ji (see Figure E4-3). This assumption is inherent to the analytical equationused to predict ground water inflows. It is appropriate for the objectives of thecalculation set.
Water Balance
Figures E4-4 and E4-5 show the magnitudes of the various water balance components as
a function of depth for the non-expansion and expansion case, respectively. Figure E4-6
and E4-7 show the predictions concerning the final steady-state pit lakes. For the non-
expanded Continental Pit, the final pit lake is estimated to be 43 feet deep and have a net
evaporative loss of approximately 58 gpm. For the expanded Continental Pit, the final pit
lake is estimated to be 464 feet deep and have a net evaporative loss of 161 gpm. Table
E4-3 shows the MathCad© worksheet used to develop Figures E4-4 through E4-7.
Table E4-3 Worksheet Showing Development of Figures E4-4 through E4-7
Cobre Mining Company, Inc. Shepherd Miller Inc.
December 1999
Calculations. Non-Expanded Continental Pit
Ground water inflowsAssume the pit is a series of cylinders with ever expanding radius.
t2
ti
E4-5

car W
Using the 2 zone approach illustrated above, the following empirical relationshipbetween depth and total ground water inflows was developed.
Qgw(d) E3.78l1.lo6. gal•d3- 2.6691o•
gal•d2-0.24266
gal •d23.43l.L
min’ft3 minft2 min’ft mi
An empirical relationship was also developed for lake surface area (Alake) and
Volume (S) versus depth.
Alake(d o.2783d3- 94.507d2 r 17260ftd 290144ftft
S(d) = 4289.4 ft2 d + 460807 ft2 d
The effective radius, reff, is defined as the radius of a circle that would reproduce
the correct area.
refd)A lake(d)
Other definitions:
r :—O.8.rff(d)
Where:
Qprecip(d) :=A lake(d)
Q waiiprecip(d) 0.15P (A total — A Iake(d))
Qevap(d) :=Elake•Alake(d)
Q0t(d) :zQevap(d)
Q (d) = Q precip(d) Q waiiprecip(’) Q gw(d)
Qprecip = the flow from direct precipitation on the lake
Qwallprecip = the flow from precipitation falling on the pit walls
Qevap = the evaporative loss from the lake surface
Q, = sum of the inflows to the pit lake
Qout = sum of the outflows from the pit lake
Water balance at steady state in = Qout:
Cobre Mining Company. Inc. Shepherd Miller, Inc.
December 1999
1ZONE 1
ZONE 2
E4-6

Iterateon
duntil
therelative
percentdifference
(rpd)is
small
d=
43.44644ft
Elev
Lake
Elev
pit_botd
(Q(d
)_Q0t(
d)).2
rpdQ
(d)-f-Q0t(d)
Q(d
)—Q0t(d)
=_6.92.106
gal
rpd
=—
1.1
83
10
5%
Results:
Alake(d)
=2O
.3O4acre
ElevL
ake=6.5231&
ft
Qprecip(C
)=
19.1
73.1
Qgw
(d)=
29.2
46-
Qevap(d)
58.4
85
Qw
aiiprecip(’)=
1O.O
65.1
Calcu
lations.
Ex
pan
ded
Contin
ental
Pit
Using
the2
zoneapproach
illustratedabove,
thefollow
ingem
piricalrelationship
between
depthand
totalground
water
inflows
was
developed.
Q()
:z-.2.O
26
1O
gal•d4-2.3
281O
6gal
d3l.5
53
13._
-_.d
2O
.52
14
gal51
53
g4
.3
.2
minft
mmft
mrn•ft
min
ft
An
empirical
relationshipw
asalso
developedfor
lakesurface
area(A
lake)and
Volum
e(S)
versusdepth.
Alake(d)
-6.86l•IO
6•d4•ft
2--
7.9
19lO
4•d3ft’
12.5
2d--
l46.1
.d.ft-
65630ft
S(d)
8516.45ld
3-646.O
296d
2•ft—
2.801551d•ft
The
effectiveradius,
reff,is
definedas
theradius
ofa
circlethat
would
reproduce
thecorrect
area.
Alake(C
’)reff(d
)=
rZ
O.g.reff(d)
It
Other
definitions:Q
precip(d)zA
lake(d)
Qw
ailprecip(d):=
O.15P
.(Atotal
—A
lake(d))
Qevap(d)
:=E
lake•Alake(d)
Q0t(cfl
Qevap(’
Cobre
Mining
Com
pany,Inc.
Shepherd
Miller.
Inc.
E4—7
Decem
ber1999

Q1
1(d)
Qp
recip()
Qw
aiiprecip(C)
-i-Qgw
(d)
Where:
pre
cip
=the
flowfrom
directprecipitation
onthe
lake
Qw
aiiprecip=
theflow
fromprecipitation
fallingon
thepitw
alls
Qevap
=the
evaporativeloss
fromthe
lakesurface
Qj,
=sum
ofthe
inflows
tothe
pitlake
gout
=sum
ofthe
outflows
fromthe
pitlake
Water
balanceat
steadystate
=Q
out:
Iterateon
duntil
therelative
percentdifference
(rpd)is
small
d=
463.675ft
EIev
Lake
Elev
pit_bot-i- d
(Q(d
)-Q0(d)).2
rpdQ
(d
)-Q
0t(d)
Q(d
)—Q0t(d)
=3
.24
1O
-
rpd
=2
.O1
&1
04
.%
Results:
AIaice( d)
=55.763acre
Elev
Lake
=6.464
1&ft
Qprecip( d)
=5
2.6
57
.1Q
gw( d)
=9
7.8
29.1
Qev
ap(d
)=16
o.
61
9.L
Qw
ailprecip(d)1O
.133.1
The
estimated
time
forthe
pitlake
tofill
tothe
ultimate
depthw
ascalculated
usingthe
following
steps:
1.A
nincrem
entalvolum
ew
ascalculated
basedon
thedepth-volum
erelationships
presentedin
Table
E4-3
(e.g.,for
thenon-expansion
case,the
volume
between
depthof 0
and20
feetis
approximately
l.09x
10
7fe
et
3).
Cobre
Mining
Com
pany.Inc.
Shepherd
Mi11er
Inc.
pIO
O029,ep
ondrafi-red
WppndL
-&catw
ths-cg
litr,J4oc
E4-8
Decem
ber1999

2. The average, total inflow into the pit (inflows minus outflows) for the incrementaldepth was calculated (e.g., for the non-expansion case, the average inflow rate isapproximately 17 gpm for the 0 to 20 foot incremental depth).
3. The time to fill the incremental volume of interest was calculated as the volume ofthe increment divided by the average inflow rate (e.g., for the 0 to 20 footincrement of the non-expansion case, the estimated time to fill is approximately7.3 years).
4. This process was repeated until the ultimate depth was reached.
For the non-expansion case, this calculation method predicted that the ultimate depth (43
feet) would be reached in approximately 300 years but that the lake would fill to a depth
of 40 feet within approximately 35 years. For the expansion case, the calculations predict
that it will take approximately 680 years to reach the ultimate depth of 464 feet, and that
the pit lake would fill to a depth of 400 feet within approximately 60 years.
E4-2.3 Water Balance Sensitivity
Because the values of the input parameters are not precisely known, the results from the
calculations of the most likely cases (discussed above) have some uncertainty. Therefore,
a sensitivity analysis was used to evaluate the range of probable values. For the non-
expanded Continental Pit, Figure E4-8 displays the sensitivity of the prediction of the
final pit lake depth, time to fill, and evaporative loss as they relate to changes in hydraulic
conductivity, precipitation, evaporation, and inflows from pit wall runoff and infiltration.
A one order-of-magnitude increase in hydraulic conductivity:
• Increases the predicted depth of the lake to approximately 160 feet
• Increases the evaporative loss about two times
• Reduces the filling time to approximately 50 years
Cobre Mining Company. Inc. Shepherd MiIler Inc.
E4-9 December 1999

A one order-of-magnitude decrease in hydraulic conductivity:
• Results in a much shallower lake (3 feet deep)
• Decreases the evaporative loss by a factor of three
• Reduces the filling time to approximately 12 years (compared to approximately90 years for the base case).
Increasing the precipitation to 24 inches/year increases the predicted lake depth to
approximately 65 feet. It also results in a larger evaporative loss and a much longer time
to fill (approximately 190 years). Decreasing the precipitation to 15 inches/year
decreases the predicted pit lake depth to approximately 35 feet. This results in a smaller
evaporative loss and a shorter time to fill.
As can be expected, increasing the evaporation rate has the reciprocal effect from the
precipitation. Increasing the percentage of precipitation falling on the pit walls that
contributes flow to the pit lake has the same effect as increasing the precipitation rate.
Cobre Mining Company. Inc. Shepherd Mi1ler Inc.
pIO0O29Ireport-drafi.&d’appendLz-cIeattachs-cditcd.doc E4— 1 0 December 1999

E4-3.O SUMMARY AND CONCLUSIONS
Water balance calculations indicate a strong probability that a pit lake will form in the
Continental Pit after mining ceases and ground water levels recover from previous
dewatering of the Underground Workings. If the Continental Pit is not expanded, the
ultimate water-level elevation in the lake will be approximately 6,523 feet with a net loss
due to evaporation of approximately 58 gpm. For this condition, the pit lake depth will
be about 43 feet. If the Continental Pit is expanded, the ultimate water-level elevation in
the lake will be approximately 6,464 feet and will result in a net loss due to evaporation
of about 161 gpm. This pit lake will have a depth of about 464 feet. For the non-
expanded and expanded Continental Pits, it will take approximately 35 and 80 years,
respectively, for the lake to reach approximately 90% of its predicted ultimate depth.
Cobre Mining Company, inc. Shepherd Miller. Inc.
E4— 11 December 1999

SURFACE AREA VS DEPTH
3500000
3000000
2500000
2000000
1500000
1000000
500000
0
2.OOE+08
I .80E+0
1 .60E+08
1 .40E+08
I .20E+08
1.OOE+08
8.OOE+07
6.OOE+07
4.OOE+07
2.OOE+07
0.OOE±00
TOTAL VOLUME VS DEPTH
250
250
FIGURE E5-1PIT LAKE STORAGE AND SURFACE
P4ER AREA vs. PIT LAKE DEPTH
Date: DECEMBER 1999
Project 1 00029\..
0 50 100 150 200
d (ft)
0 50 100 150 200
d (ft)
File: FIG-ATV.PPT

0)
0Iii Z
w c’j z00<woo
c.’J
0— — a)CD =OD IL
-JLu
0
CSJ(3
LJzw.<oWD
WW
LLZU)0c100
-JI
0::Lu>0z
— 3w

?\c4os ‘--ç 0S
SCALE IN FEET
FIGURE E5-3 Date: DECEMBER 1999
ANALYTICAL MODEL FRAMEWORK Project: 100029
ELEVATIONS 6,560 TO 6,600 FEET File: iWO-DAN-MODEL

SCALE IN FEET
SHEPHERD MILLER
FIGURE E5-4 Date: DECEMBER 1999
ANALYTICAL MODEL FRAMEWORK Project: 100029
ELEVATIONS 6,600 TO 6,640 FEET File: TWO-DAN-MODELNCDRPO9ATD

fl
I
2QO
SCALE IN FEET
FIGURE E5-5ANALYTICAL MODEL FRAMEWORKELEVATIONS 6,680 TO 6,720 FEET
Date: DECEMBER 1990
Project: 100029
File: iWO-DAN-MODELSHEPHERD MILLER

Os
FIGURE E5-6 Date: DECEMBER 1999
ANALYTICAL MODEL FRAMEWORK Project: 100029
ELEVATIONS 6,720 TO 6,760 FEET File: TWO-DAN-MODELSHEPHERD MILLER
INCOPOIATEL
SCALE IN FEET

-ç0S
II
x-
0
2OO-I’
SCALE IN FEET
FIGURE E5-7 Date: DECEMBER 1999
ANALYTICAL MODEL FRAMEWORK Project 100029
ELEVATIONS ABOVE 6,760 FEET File: iWO-DAN-MODEL

40C
,
Lii
I—
300 -J U-
20
SH
EP
HE
RD
MIL
LE
R
FIG
UR
EE
5-8
MA
GN
ITU
DE
SO
FT
HE
WA
TE
RB
AL
AN
CE
CO
MP
ON
EN
TS
AS
AFU
NC
TIO
NO
FD
EPT
HFO
RT
HE
HA
NO
VE
RPI
T
Dat
e:D
EC
EM
BE
R19
99
Proj
ect:
P:\1
0002
9\..
File
:FI
G-A
TH
.PPT
C’C
C
70 60 50 10 0
020
4060
8010
012
014
0
DEP
TH(F
T)
—.--
--D
irect
Prec
ipita
tion
—G
rou
nd
Wat
erIn
flow
—&
—E
vapo
ratio
n—
-—Pi
tW
all
Run
off
160

DEPTK(FT)
C000
0
-I,
rrzN)00
H
mo-4
01o
C)
,1O0
-I0N)
-o9mo——————--—-—.__
___________

ATTACHMENT E5
HANOVER MOUNTAIN WATER BALANCESFOR THE PROPOSED CONTINENTAL MINE EXPANSION PROJECT,
GRANT COUNTY, NEW MEXICO

E5-1.O INTRODUCTION: HANOVER MOUNTAIN
E5-1.1 Problem Statement and Objectives
Exploration drilling and water level data from wells near Hanover Mountain indicate that
the water table is higher than the proposed bottom of the Hanover Pit. Thus, the potential
exists for a pit lake to form in the future excavation.
The objectives of this attachment are to:
• Verif’ that a pit lake may form after the cessation of mining
• Estimate the water level elevation of the ultimate (stable) pit lake after closure
• Estimate the time required for the pit lake to reach the stable water-level elevation
• Provide input parameters to be used in the predictive water quality model of thefuture pit lake.
E5-1.2 Approach
The chosen approach to meeting the above listed objectives is to estimate the individual
components of the water balance associated with the final Hanover Pit. The individual
components are then tied together using a dynamics system modeling approach.
The water balance components associated with the Hanover Pit after expansion include
the following:
• Direct precipitation to the pit lake surface
• Runoff and infiltration from precipitation falling on the pit walls
• Evaporation from the lake surface
• Ground water inflows and outflows from the pit walls and the pit bottom.
The overall water balance and estimated filling times were evaluated using a succession
of steady-state solutions, each based on average flow rates over an increment of time
(quasi-steady-state approach). The following list describes this process:
Cobre Mining Company. Inc. Shepherd Miller, Inc.
p:10D0291,cpon-drafr-rcviscd’.appcn,iix-ecarinchs-ediwd.doc E5 —1 December 1999

• The storage volume and lake area were characterized as a function of pit-lakedepth (see Figure E5-1).
• The average, yearly flow rate of each individual water-balance component wasestimated as a function of pit-lake depth.
• The water balance approach described in the introduction to the attachments wasused to estimate the time to fill the chosen depth interval.
• This process was integrated over the entire pit-lake depth to estimate the timerequired to reach steady state (i.e., a dynamics system modeling approach).
Cobre Mining Company. Inc. Shepherd Miller. Inc.
p:i1OOO29rcrt-drafl-rccd1tzppeuIix-ccattachs-cdicd.doc E5—2 December 1999

E5-2.O CALCULATIONS
E5-2.1 Climatic Components to the Water Balance
The magnitudes of precipitation (18.3 inches/year) and evaporation (55.8 inches/year) are
presented in Attachment El. Runoff and infiltration from the pit walls can be estimated
using several types of runoff analyses; however for this estimate, 15% of the precipitation
(2.7 inches/year) falling on the pit walls was assumed to enter the pit lake.
E5-2.2 Ground Water Components to the Water Balance
E5 —2.2.1 Horizontal Ground Water Flow Component
Horizontal ground water inflow rates into the proposed Hanover Pit were computed using
a two-dimensional, analytical-element ground water model (TWODAN) developed by
Charles R. Fitts (1995). TWODAN is a computer code based on the principle of
superposition of linear differential equations and the Analytic Element Method described
by Strack (1989). The code is well documented and publicly available through such
sources as the International Ground Water Modeling Center in Golden, Colorado.
The parameter values used in the horizontal, steady state ground water model are shown
in Table E5-la along with the justification and assumptions used to derive these values.
Additional assumptions used in the horizontal ground water inflow calculations include:
• Quasi-steady-state flow through seepage faces and the saturated zone. Given therelatively short dewatering time in the pit (i.e., excavation below the water table isexpected to take place for only a couple of years), this assumption allows anestimate of transient flow conditions with a steady-state model.
• Isotropic and horizontally homogeneous aquifer properties (within specific
formations). Based on the scale of the problem, this assumption is appropriate.Heterogeneities between significant formations were considered in allcalculations.
To calculate the horizontal flow to the pit lake, a series of 40-foot thick, 2-dimensional
models (TWODAN) were set up. Each individual model had a different sized constant
Cobre Mining Company. Inc. Shepherd Miller, Inc.
pi?OOO29bcport-drfl.,miwJuppcndix-ccnItachs-&itcd.doc ES —3 December 1999

head boundary representing the changing pit area as a function of depth. Figure E5-2
shows this conceptualization. For calculation purposes, it was assumed that a “seepage”
face would exist along the entire pit face because of the short time frame associated with
mining below the water table. This is not expected to actually happen. Rather, this is a
steady-state method to simulate the nature of the transient flow expected to occur from
mine dewatering. Calculated flows from each individual model were summed to estimate
the horizontal flow to the pit.
Figures E5-3 through E5-7 displays the analytical framework for each horizontal model.
Each horizontal model consists of three distinct hydraulic conductivity “zones,” which
are based on the formations encountered at the various model depths. The various zones
are based on geologic block modeling performed by Cobre. The geologic block modeling
shows that the lateral extent of the geologic formations do not change significantly
through the depths associated with the proposed Hanover Pit. Therefore, all TWODAN
models have the same hydraulic conductivity zone configuration.
Each horizontal model consists of a constant head boundary at the up and downgradient
ends of the model (north and south sides, respectively). These boundaries are based on
the interpretation of water level measurements presented in Appendix A. As described in
Table E5-1, the east and west sides of each horizontal model are modeled as no flow
boundaries. The four lowest models (covering elevations 6,560 feet through 6,720 feet)
are confined, each representing a single 40-foot aquifer thickness. The top horizontal
model (elevations above 6,720 feet) is unconfined.
Using the Colorado Formation geometric mean hydraulic conductivity value for data
available as of July, 1999 (approximately 1 .56x105 cmlsec), horizontal flow to the pit at
the end of mining is estimated to be approximately 33 gpm. If the maximum hydraulic
conductivity (approximately 3.0x10⁴ cmlsec) for the Colorado Formation is used, the
horizontal flow component could be as high as 640 gpm. Using the minimum hydraulic
conductivity of the Colorado Formation (approximately 4.5x10⁷ cmlsec) yields a
horizontal flow estimate of 0.72 gpm.
Cobre Mining Company. Inc. Shepherd Miller. Inc.
p1OOO29rcpon-draft-rcvcdappe,uhx-eeattachs-cdited.doc E5—4 December 1999

Table E5-la Parameters for the Proposed Hanover Pit Ground Water InflowCalculations - Horizontal Flow
Description Value and Units Notes
Aerial Recharge 0.0 Aerial recharge is expected to be a minorcomponent of the flow system, given the smallscale of the model. Constant head boundariesprovide the majority of the modeled flow
Pumping Wells none The Hanover Mountain aquifer system ishydraulically disconnected from the systemcontaining the underground workings and thesump.
North Boundary: 7,000 ft. Modeled as a line sink. The boundary is
(Upgradient) sufficiently removed from the area of interest asto not influence conclusions based on the modelresults.
South Boundary 6,560 ft. Modeled as a line sink. The boundary is(Downgradient) sufficiently removed from the area of interest as
to not influence conclusions based on the modelresults.
East Boundary No Flow (i.e., Assumed to coincide with Hanover Creek. Inflow line the area of Hanover Pit, the Barringer Fault and
boundary) Hanover Creek roughly coincide. In these areasthe no flow boundary was assumed to coincidewith Hanover Fault.
West Boundary No Flow Assumed to coincide with the surface waterdivide located west of the site.
Hydraulic Conductivity: 0.045 ftlday Equal to the geometric mean of all Colorado
Colorado Formation (1.56*105 cmls) Formation pumping test analysis results.
Hydraulic Conductivity: 0.135 ft/day Assumed to be three times more permeable than
Breccia Pipe (4.76*105 cmls) the Colorado Formation. This assumption isbased on the brecciated nature of this formation.
Hydraulic Conductivity: Un- 0.0225 ft/day The geometric mean of all pumping test analysis
weathered Hanover-Fierro (7.94*10-6 cmls) for the Hanover-Fierro Stock is 0.053 ft/day
Stock (1.88E-05 cm!s). This value is thought to bemore indicative of the weathered portion of thestock. Therefore, the hydraulic conductivity ofthe un-weathered stock was assumed to be one-half as permeable as the value used for theColorado Formation.
Reference Head 6,900 ft This is an internal value used in TWODAN toinitiate calculations. It is located outside modelspecified boundaries, therefore, the value andlocation of the reference head have no effectwithin the modeled domain.
Lake Elevation 6,560 to 6,800 feet Varies in 20 foot intervals
Model Bottom Elevation 6,560 feet This is the expected pit bottom elevation.
Cobre Mining Company, Inc. Shepherd Miller, Inc.
pJOOO29rcpori-draft-reviscdappcndL’-&earnichs-cdifcd.doc E5 _5 December 1999

E5-2.2.2 Vertical Ground Water Flow Component
Vertical ground water inflow rates into the proposed Hanover Pit bottom were computed
using the Zone 2 equation presented in Attachment E6 (Section E6-2.3) and the parameter
values shown in Table E5-lb. At the end-of-mining, ground water flow through the
bottom of the pit is predicted to be approximately 4.6 gpm. Reducing the horizontal to
vertical hydraulic conductivity ratio to one increases this predicted flow to 45.5 gpm.
Table E5-lb Parameters for the Proposed Hanover Pit Ground Water Inflow
Calculations - Vertical Flow
Parameter Description Value and Units Notes
h0 Depth of pit bottom below 238 feet Based on the assumed, pre-miningstatic water table average static water level of 6,7981
feet and the current pit bottomelevation of 6,560 feet
d Depth of lake 0 to 220 feet Varies in 20 foot intervals
h Height of seepage face plus d + 10 feetthe depth of the lake
rp Average radius of the pit lake 209 feet This is the radius required for a circlebottom to have an equivalent area to that of
the proposed pit bottom.
K Bulk hydraulic conductivity 1.56*106 cmls Assumed to be 1/10 of the geometricof rock mean of hydraulic conductivity data
near Hanover Mountain (i.e., assumea horizontal to vertical ratio ofhydraulic conductivity equal to 10 to1)
‘Average of PP-01-1, PP-01-2, PP-01-3, PP-01-4, PP-02-1, PP-02-2, PP-02-3, PP-02-4, PP-05-1 and PP
05-2 data for 11/23/96 and 12/16/96.
E5-2.2.3 Ground Water Balance
The flows from the horizontal models were summed with the flows calculated for the pit
bottom to develop a relationship between ground water flow and as a function of pit lake
depth. A second-order polynomial equation was fit to this relationship for use in the
overall water balance (See Figure E5-8).
Cobre Mining Company, Inc. Shepherd Miller, Inc.
E5 —6 December 1999

E5-2.3 Water Balance
Figure E5-8 shows the magnitudes of the various water balance components as a function
of depth. Figure E5-9 shows the water balance predictions for the ultimate pit lake. For
the proposed Hanover Pit, the final pit lake is expected to have a depth of 156 feet and a
net evaporative loss of approximately 80 gpm. Table E52 shows the dynamics system
model results used to develop Figure E-9.
Predictions of the time to fill the Hanover Pit Lake were performed in the same manner as
those described for the Continental Pit Lake. Calculations predict that it will take
approximately 21 years to reach the ultimate depth of 156 feet, and that the pit lake would
fill to a depth of 140 feet within approximately 7 years.
Table E5-2 Worksheet Showing Development of Figures E4-3 through E4-4
Pit Lake GW Pit Va11 DirectTime Depth Inflow Runoff Precipitation Evaporation
(years) (feet) (gpm) (gpm) (gpm) (gpm)
0 0.0 22.5 14.1 0.0 0.0
1 47.2 20.9 13.6 3.3 7.6
2 80.3 22.7 13.1 6.5 15.1
3 102.9 25.3 12.7 9.7 22.6
4 118.2 27.9 12.2 12.9 30.0
5 128.7 30.2 11.7 15.9 37.0
6 136.0 32.1 11.3 18.8 43.6
7 141.2 33.4 10.9 21.3 49.6
8 144.9 34.3 10.6 23.6 54.8
9 147.7 35.0 10.3 25.5 59.2
10 149.7 35.5 10.1 27.1 63.0
11 151.2 35.8 9.8 28.4 66.1
12 152.3 36.1 9.7 29.5 68.7
13 153.1 36.2 9.5 30.5 70.8
14 153.8 36.4 9.4 31.2 72.6
15 154.3 36.5 9.3 31.8 74.0
16 154.6 36.6 9.3 32.3 75.2
17 154.9 36.6 9.2 32.7 76.1
18 155.1 36.7 9.2 33.1 76.9
19 155.3 36.8 9.1 33.4 77.6
20 155.4 36.8 9.1 33.6 78.1
21 155.5 36.8 9.0 33.8 78.5
22 155.6 36.8 9.0 33.9 78.9
Cobre Mining company. Inc. Shepherd Miller, Inc.
plOO029rcpn4rafl-rcvi.wd1appwidLz-eiat&ichs-cditcd.doc E5 —7 December 1999

Table E5-2 Worksheet Showing Development of Figures E4-3 through E4-4(continued)
Pit Lake GW Pit VaII DirectTime Depth Inflow Runoff Precipitation Evaporation
(years) (feet) (gpm) (gpm) (gpm) (gpm)
23 155.7 36.9 9.0 34.1 79.2
24 155.7 36.9 9.0 34.2 79.4
25 155.7 36.9 9.0 34.2 79.6
26 155.8 36.9 9.0 34.3 79.8
27 155.8 36.9 9.0 34.4 79.9
28 155.8 36.9 9.0 34.4 80.0
29 155.8 36.9 8.9 34.5 80.1
30 155.8 36.9 8.9 34.5 80.2
31 155.8 36.9 8.9 34.5 80.2
32 155.8 36.9 8.9 34.5 80.3
33 155.8 37.0 8.9 34.6 80.3
34 155.8 37.0 8.9 34.6 80.4
35 155.8 37.0 8.9 34.6 80.4
36 155.8 37.0 8.9 34.6 80.4
37 155.8 37.0 8.9 34.6 80.4
38 155.9 37.0 8.9 34.6 80.4
39 155.9 37.0 8.9 34.6 80.5
40 155.9 37.0 8.9 34.6 80.5
41 155.9 37.0 8.9 34.6 80.5
42 155.9 37.0 8.9 34.6 80.5
43 155.9 37.0 8.9 34.6 80.5
44 155.9 37.0 8.9 34.6 80.5
45 155.9 37.0 8.9 34.6 80.5
46 155.9 37.0 8.9 34.6 80.5
47 155.9 37.0 8.9 34.6 80.5
48 155.9 37.0 8.9 34.6 80.5
49 155.9 37.0 8.9 34.6 80.5
50 155.9 37.0 8.9 34.6 80.5
51 155.9 37.0 8.9 34.6 80.5
52 155.9 37.0 8.9 34.6 80.5
53 155.9 37.0 8.9 34.6 80.5
54 155.9 37.0 8.9 34.6 80.5
55 155.9 37.0 8.9 34.6 80.5
56 155.9 37.0 8.9 34.6 80.5
57 155.9 37.0 8.9 34.6 80.5
58 155.9 37.0 8.9 34.6 80.5
155.9 37.0 8.9 34.6 80.5
60 155.9 37.0 8.9 34.6 80.5
Cobre Mining ‘ompany, Inc. Shepherd Miller. Inc.
E5-8 December 1999

E5-3.O SUMMARY AND CONCLUSIONS
Water balance calculations indicate a strong probability that a pit lake will form in the
Hanover Pit after mining ceases. The steady-state water elevation in the lake will be
approximately 6,716 feet with a net loss due to evaporation of approximately 80 gpm.
The estimated depth of the pit lake is 156 feet. It will take approximately 7 years for the
lake to reach 90% of its predicted ultimate depth.
Cobre Mining Company, Inc. Shepherd Miller, Inc.
p;iIOOO29odrafl-rcvsedappendiz-eeatrachs-cditcJ.doc E5 -9 December 1999

RE
CH
AR
GE
=W
0
SE
EP
AG
EFA
CE
GR
OU
ND
WA
TE
RIN
FLO
W
FIG
UR
EE
6-1
CO
NC
EP
TU
AL
MO
DE
LO
FG
RO
UN
DW
AT
ER
FLO
WT
OA
NO
PE
NPI
T
1111
11
PI
TN
1
Dat
e:
Pro
ject
:
File
:
DE
CE
MB
ER
1999
I000
29\T
5
CO
N-F
LO
W

C,C)C)
LUC)
LUC-)LUC
U)I—C)c..JCCC
I—Cc’J
z0C-)
C-)•cjj •,
C0 ü
CNwz0N
/II
w
IC)w
‘Ii
II.I
I—0
0-JUz
U
F—
0aI—z0
0U)
Q-JDW(DO
F0
0I
0-JU

ATTACHMENT E6
ANALYTICAL GROUND WATER MODEL FOR FLOW TO THE
CONTINENTAL PIT AND UNDERGROUND WORKINGS
FOR THE PROPOSED CONTINENTAL MINE EXPANSION PROJECT,
GRANT COUNTY, NEW MEXICO

E6-l.O INTRODUCTION: ANALYTICAL MODEL
Mine feasibility and environmental evaluations can benefit from the use of analytical
tools for predicting ground water inflow to open mine pits. While numerical
modeling may be required in some cases, analytical equations can be used in many
instances to predict inflow rates. Equations for predicting ground water inflows to
open pits and underground excavations are presented in Goodman et a!. (1965),
Verma and Brutsaert (1970, 1971), Singh and Atkins (1984), and Atkinson et al.
(1989). The solutions presented in these technical papers apply to inflow problems
with particular sets of boundary conditions and simplifying assumptions. The
applicability of a solution depends on the extent to which the real problem under
consideration is consistent with assumptions used to derive the mathematical
equations. If a solution is judged to be applicable, its accuracy is generally dictated
by the appropriateness of the bulk hydraulic conductivity value used to perform the
calculations.
This section presents two analytical solutions that can be useful for predicting the
inflow to an open mine pit which is excavated below the water table. A lake of finite
depth may or may not exist within the pit. While the equations apply to a fairly
specific physical problem, they are relevant to hydrogeologic conditions encountered
at many mine sites. The solutions, however, are not appropriate for all mining
situations. They should therefore be used only after carefully comparing the
associated mathematical assumptions to the known or inferred site conditions.
Cobre Mining company, Inc. Shepherd Miller, Inc.
p:IOOO29rcpon-Irafl-reedippcndix-eicaaachs-cditcrI.doc E6— 1 December /999

E6-2.O THEORETICAL DEVELOPMENT
• The solutions in this section address the conceptual model for pit inflow
shown on Figure E6- 1. Important assumptions of the conceptual model are
summarized below.
• The materials near the pit are assumed to be isotropic with regard to hydraulic
conductivity.
• Lowering of the water table within the pit decreases the saturated thickness of
rock materials providing inflow through the pit walls.
• Relative to inflow from the pit walls, significant inflow occurs through the pit
bottom.
• The rock formation is semi-infinite below the pit and there exists no
impermeable boundary at depth.
• Steady-state flow conditions exist near the mine pit. This assumption is
reasonable for moderate to high permeability materials and mine pits which
are excavated over a period of years.
For the purpose of calculations, the conceptual flow model on Figure E6-1 is
approximated by the analytical models shown on Figure E6-2. The flow region is
divided into two zones. Zone 1 exists above the base of the pit and represents flow to
the pit walls. Zone 2 extends from the bottom of the pit downward and considers
flow to the pit bottom. The analytical models both assume that there is no ground
water flow between Zones 1 and 2.
E6-2.1 Zone 1 Analytical Solution
The analytical solution for Zone 1 considers steady-state, unconfined, horizontal
radial flow with uniform distributed recharge. Additional assumptions of this
solution are as follows:
• The pit walls are approximated as a right circular cylinder.
• Ground water flow is horizontal. The Dupuit-Forchheimer approximation
(McWhorter and Sunada, 1977; p. 96) is used to account for changes in
saturated thickness due to depression of the water table.
Cobre Mining Company, Inc. Shepherd Miller. Inc.
pIOOO29rcpo--drufr-revi.cd’appc,,dL-cicatrnchs-cIitcd.doc E6—2 December 1999

• The static (pre-mining) water table is horizontal.
• Uniform distributed recharge occurs across the site as a result of surfaceinfiltration. All recharge within the radius of influence (cone of depression) ofthe pit is assumed to be captured by the pit.
• Ground water flow towards the pit is axially symmetric.
The following equation applies for these assumed conditions:
7 7
h0 =/h2 +f[ro2ln_’0 (E6-1)
where W is the distributed recharge flux, K1 is the hydraulic conductivity of
materials within Zone 1, r is the effective pit radius, h is the saturated thickness
above base of Zone 1 at rp, r0 is the radius of influence (maximum extent of the cone
of depression), and h0 is the initial (pre-mining) saturated thickness above the base of
Zone 1. Given the values of W, K1, rp, h, and h0, the radius of influence (i-0) is
determined from Equation (E6-1) by iteration. Once r0 is determined, the pit inflow
rate from Zone 1 is computed by:
Q1 = Wi (,,2 ,.2) (E6-2)
where Q1 represents the inflow from the pit walls. Note that the pit inflow rate is
maximized when h is set to zero.
The Dupuit-Forcitheimer approximation assumes horizontal flow within Zone 1. In
cross-section, hydraulic head contours are approximated as vertical lines that are
described by the following equation:
w 4r’r2_r2
Hi(r)=Ho_hofi!hp2+__ro2lnL_J_
(E6-3)K1 r 2
Cobre Ivilning Company, Inc. Shepherd Miller, Inc.
E6—3 December 1999

where H0 is the initial (pre-mining) elevation of the water table, H, is the steady-
state hydraulic head elevation, and r is radial distance from center of pit.
E6-2.2 Derivation of the Zone 1 Analytical Solution
The equation for steady-state, axially-symmetric, horizontal, unconfined flow is given
by (McWhorter and Sunada, 1977; p. 151; eq. 4-79):
dhQ(r) = 2ir Krh— (E6-4)
dr
where r is horizontal radial distance, Q is the flow across the cylindrical surface of
radius r, h is the saturated thickness above the base of the aquifer, and K is the
hydraulic conductivity of the aquifer materials. If it is assumed that all flow is
derived from recharge within the radius of influence (r0), then the flow rate at radius
r is given by:
Q(r) = Wic (r02 — r2) (E6-5)
where W is the distributed recharge flux. Substituting (E6-5) into (E6-4) and
integrating leads to:
w r2
— rJ dr= h
dli (E6-6)
where rp is the radial distance from the center of the pit to the pit wall and is the
saturated thickness at the pit wall. Carrying out the integration gives:
I W (r r2—r2h(r) = + r02 lnL_J
— 2(E6-7)
Hydraulic head is equal to:
C’obre Mining Company, Inc. Shepherd Miller, Inc.
E6—4 December 1999

H(r) = H0 — h0 + h(r) (E6-8)
where H is the elevation (hydraulic head) of the current water table and H0 is the
elevation of the initial static water table. Substitution of (E6-7) into (E6-8) leads to
Equation (E6-3). Evaluating (E6-7) at r = r0 and requiring that the initial saturated
thickness (h0) occurs at the radius of influence (r0) gives:
I’ ‘ 2 2W , 1 r —r
h = Ih - + r - ml —-
— o p (E6-9)° 1jP K1
0 2
which is Equation (E6-l). Evaluating (E6-7) at r = rp gives the flow rate through the
pit walls:
= Wic (r02 rp2) (E6-1O)
which is Equation (E6-2).
E6-2.3 Zone 2 Analytical Solution
The analytical solution for Zone 2 is based on steady-state, confined flow to one side
of a circular disk sink of constant drawdown. The sink represents the bottom of the
pit. This solution is based on the following assumptions:
• Hydraulic head is initially uniform (hydrostatic) throughout Zone 2. Initial
head is equal to the elevation of the initial water table in Zone 1.
• The disk sink has a constant hydraulic head that is equal to the elevation of the
pit lake water surface. If the pit is completely dewatered, the disk sink head isequal to elevation of the pit bottom.
• Flow to the disk sink is three-dimensional and axially symmetric.
The steady-state inflow rate to one side of the disk sink is given by (adapted from
Carslaw and Jaeger, 1959, p. 215, eq. 10):
C’obre Mining Company. Inc. Shepherd Miller. Inc.
p:IUOO29,-cpon-drafl-revLscthuppendix-eeattnchs-cdiIcd.doc E6—5 December 1999

0, =4K2 r(h0 —d) (E6-11)
where Q, is the pit inflow rate from Zone 2 (through the pit bottom), K2 is the
hydraulic conductivity of materials within Zone 2, and d is the depth of the pit lake.
Note that in the above equation, (h0 — d) is the hydraulic drawdown at the bottom of
the pit.
Hydraulic head contour lines within the Zone 2 region are computed by (from
Carslaw and Jaeger, 1959, p. 215, eq. 9):
2(h —d) 2rH,(r,z) = H0
2l 2 22
(E6-12)
(r_rj +z +iJ(r+rp) +
where H, is the hydraulic head elevation within Zone 2 and z is the vertical depth
below the base of the pit (positive downward).
Cobre Mining Company, Inc. Shepherd Miller, Inc.
pIOOO29rpon-drft.rcvsaMppcndb-c’cn1tnchs-cdftcd.dac E6—6 December 1999

E6-3.O REFERENCES
Atkinson, L.C., T.M. Hanna and J.W. Anthony. 1989. Investigation andImplementation of Mine Dewatering Systems. World Gold 89 Conference,
Singapore.
Bear, J. 1972. Dynamics ofFluids in Porous Media. Dover Publications, Inc., 764
p.
Carsiaw and Jaeger. 1959. Cool Heat Equations for the Ground Water Engineer.
Daly, C., R.P. Neilson, and D.L. Phillips. 1994. A Statistical-topographic Model for
Mapping Climatological Precipitation over Mountainous Terrain. Journal ofApplied Meteorology, 33, 140-158.
Goodman, R.E., D.G. Moye, A. Van Schalkwyk and I. Janvandel. 1965. GroundWater Inflows During Tunnel Driving. Engineering Geology, 2, pp. 3 9-56.
McWhorter, D.B. and D.K. Sunada. 1977. Ground Water Hydrology and
Hydraulics. Water Resources Publications, Highlands Ranch, Colorado, 290
p.
Schroeder, P.R., C.M. Loyd, and P.A. Zappi. 1994. The Hydrologic Evaluation ofLandfill Performance (HELP) Model. User’s Guide for Version 3.
EPA!600/9-94/168a. U.S. Environmental Protection Agency Risk Reduction
Engineering Laboratory, Cincinnati, OH.
Singh, R.N. and A.S. Atkins. 1984. Application of Analytical Solutions to Simulate
Some Mine Inflow Problems in Underground Coal Mines. International
Journal ofMine Water, 3(4), pp. 1-27.
Verma, R.D. and W. Brutsaert. 1970. Unconfined Aquifer Seepage by Capillary
Flow Theory. Journal of the Hydraulics Division, Proceedings of the
American Society of Civil Engineers, 96 (HY6), pp. 133 1-1344.
Verma, R.D. and W. Brutsaert. 1971. Unsteady Free-surface Groundwater Seepage.
Journal of the Hydraulics Division, Proceedings of the American Society of
Civil Engineers, 97 (HY8), pp. 1213-1229.
Cobre Mining Company, Inc. Shepherd Miller, Inc
pIOOO29rcpon-draft-rcedappcndiz-ccarwchi-cdftcd.doc E6—7 December 1999

CI)
r:j
-tJ
0
HC
cm-10z
1 -oHj• !‘C)
zm mo -1Wo >m
C,,(0(0
0

10.0
8.0
Cl,U.’
C,6.0
I-aU.’
4.0
0.0
ri
SHEPHERD MILLER
FIGURE E-2MONTHLY PRECIPITATION AND EVAPORATIONFORT BAYARD AND CHINO MINE, NEW MEXICO
Date: DECEMBER 1999
Project: P:1 00029\..
File: FIG-MAINH.PPT
0
12.0
0 0
2.0
Jan Feb Mar Apr May Jun Jul Aug Sep Oct Nov Dec
MONTH
DAVERAGE PRECIPITATION AVERAGE EVAPORATION

mC)m
m
CDCDCD
-U
0
U)C)>
ImU)
n0)-
C) -
0 0
&-‘J
0)
—mcD_-1Z-ii
>o
-l-
I. ..
-umC,-u
CC
CD
01

0
C’)UiIC)
II0Ui
12.0
10.0
8.0
6.0
4.0
2.0
0.0
C)
DAVERAGE PRECIPITATION AVERAGE EVAPORATION
FIGUREE-4MONTHLY PRECIPITATION AND LAKE EVAPORATION
CONTINENTAL MINE, NEW MEXICO
Date: DECEMBER 1999
Project: P:\1 00029\..
File: FIG-MAINH.PPT
Jan Feb Mar Apr May Jun Jul Aug Sep Oct Nov Dec
MONTH

Date:
Project:
File:
xff740S
prin
gs
95
00
Po
rkG
iloH
ot
-
rush
yMm
Flat
Perk
;4Tur
L::B
ronni
61$I
S
05.
__
iF
•k
--7%
,•\1.
Rod
Pk/
100I?*
I
%K
nht
Mth
-
‘.HiIIsb
oro
Pk,)
1••c
w-
MQ
RY
ss
MESA
•—e
Prn
Alto
!
r4
r
IL
3’
4-
Egg
,1J1M
ang
esin
gsL
V1
RIT
AI.,
If!F
iare
rF
ort
ioar
HIL.
IY
ard;
IBO
Son
Lr.n
zo
)I
(417
Zi’O
NE
4i;
•‘1,.1jj’r
__
_____
____
___
Sw
ortz
__
__
_
PLA
IN
$}
ç%
._I]3i’rç
wv
er,.
_i’2
__I
R.IO
W.
20
vi
-.
.-r
—
____
—-
7
City
of
Ros
.Sta
laP
rk.
PL
AIk
__I__
___
12
1080
APPR
OX
IMA
TESC
ALE
INM
ILES
•‘\
Ijat
°IBU
RR
O•-1-
i4
Iw
1S
—rS
\357\::*
?
Jf1
LA
NG
FOR
D..
sC2
2I
6(73
I—,5ios
SoIdersF
or
1weIl
6
I
,1&
Fr’1
123
012
AD
APT
ED
FRO
MT
RA
UG
ER
(1972)
SH
EP
HE
RD
MIL
LE
R
FIGU
RE
E-5
MIB
RE
SR
IVE
RB
ASIN
WIT
HIN
GR
AN
TC
OU
NT
Y
DE
CE
MB
ER
1999
100029\T5
RIV
BA
SIN

I.
I
-J\_
.---.
I
HF
IER
O-:‘s
Ri
——
_/_
-:
;J/_
-
:
41/
II
-
-J
i_i
2?
—I
r
3
/
-7
v--
--
—-‘,
—,--
--
/—
---
--
N--/
--
-:—
‘—
——
——
__
——
___\_
—-;7’-
-
--
-:-
—-
/--
--
-1
:R
w:
I
;:F
N
--
--_\
---
N----
-.
III
•,-
-r1
C1Av)’0
-N
”—
N:
—N
--
—---
—:-
—-
•-.
•---1
II
I
SCA
LEIN
FEE
T
1600
0
CO
NT
OU
RIN
TERV
AL
=100
FT.
FIGU
RE
E-6
SU
RF
AC
EW
AT
ER
DR
AIN
AG
ES
WITH
INT
HE
HA
NO
VE
RC
RE
EK
BA
SIN
3200

0mC)rnwm
CDCDCD
C’ C 0
-Ti -u
R
I
80

-—-—
PR
EC
IPIT
AT
ION
GR
OU
ND
WA
TE
RT
AB
LE
WItH
INC
OL
OR
AD
OFO
RM
A11O
N
THE
SO
UT
HW
RD
F
UN
ION
HIL
LPO
R11O
NO
FT
HE
SO
UT
HW
RD
F
QU
AT
ER
NA
RY
GR
AV
EL
SO
FB
UC
KH
RO
NS
PR
ING
Tha
=V
OLC
AN
ICFLO
WS
AN
DTU
FFS
Thg
=H
AN
OV
ERFIER
RO
STOC
K
Ksy
=SY
ENO
DIO
RITE
POR
PHY
RY
Kcs
CO
LOR
AD
OFO
RM
A11O
N
Kb
=B
EAR
TOO
THQ
UA
RTZITE
Pa
=A
BO
FOR
MA
TION
Pa
=O
SWA
LDO
FOR
MA
TiON
MI
=LA
KE
VA
LLEYLIM
ES11ON
E
Dp
=PE
RC
HA
SHA
LE
SOfm
FUSSELM
AN
AN
DM
ON
TOY
A
GA
LQ
UA
TERN
AR
YA
LLUV
IUM
CO
NT
INE
NT
AL
PIT
UN
DE
RG
RO
UN
DW
OR
KIN
GS
PIEZIOM
ETRIC
SUR
FAC
E
EVA
POTR
AN
SPIRA
TION
REC
HA
RG
ETO
DEEP
AN
DSH
ALLO
WG
RO
UN
DW
ATER
OV
ERLA
ND
FLOW
POR
TIO
NO
FTH
ESO
UT
HW
RD
F
BU
CK
HO
RN
PO
R11O
NO
FT
HE
SO
UT
HW
RD
F
FIGU
RE
E-8
CO
NC
EPT
UA
LH
YD
RO
LO
GIC
MO
DE
LO
FT
HE
CO
NT
INE
NT
AL
MIN
E
GR
OU
ND
WA
TE
RT
AB
LE
TH
INT
HE
PA
LE
OZ
OIC
AG
ER
OC
KS
AL
LU
VIA
LA
QU
IFE
R
DO
LOM
ITES
NO
TT
OS
CA
LE

000
‘4)
x
mI00
0z0
DC)0>co-I
C)0cz a
0m
G)G)
mz
(1)
0 C a
(I)
I
NORTH
21 .
‘iC)m
m

Cl)z0I—QCI)wo
001
w0zLU—1D
own —H> L1<i
0z
D0
(9
U
U)z0
0U
w0-0-DzU
I0
it
/
0-o0r€)
/
I-i
00•1
—
,\\\j\
//‘/
I, .rN
\..7
3
//‘S
/,
H/
I,//if;,
//
I,$,$1/1/
7I//
/“I’
//
:)/J$/
I,,,)“‘/‘‘
\‘7’
—7’
//
Ifl”//
/I
,h’.’/
(F
KL/
,I,,
II’,’
‘$‘““—,.,‘,/‘F
‘-$1
,1\
‘I’.’,/H_<Th
I...
:)/“/,‘:‘
///.,
‘7$’,
-o
-I4>LaJI—z
a::D0I—z00
0,1_0
U-)
/
$I‘/‘
Z‘}“rZ.”‘,
/1;-”
i_II“‘•/-
flI
c)
I.,’,’:
“1$-/,,,/
$$\:4’
U)z0
0Li
0-J
U
00
(0
00*(0
0

SHEPHERD MILLERL)
FIGURE E-11DISTRIBUTION OF MEASURED HYDRAULIC CONDUCTIVITY
IN BASEMENT ROCKS
C)z
60.%aLU
50.%>
40.%
Date: DECEMBER 1999
Project: P:\1 00029\..
FUe: FIG-MAINH.PPT
14
C)
100.%
>-C.)
UiDaLU
LL.
90.%
12
10
8
6
4
2
0
80.%
70.%
30.%
20.%
1 .OOE-07 1 .OOE-06 1 .OOE-05 1 .OOE-04 1 .OOE-03 1 .OOE-02 More
HYRALJLIC CONDUCTIVITY
10.%
LFrequency — Cumulative %]

I
I IIIII
VALLEY—FILLAQUIFER
FIGURE E-12COMPONENTS OF THE CONCEPTUAL
WATER BUDGET
0 0 fl
IhIII
I
I (WNfl
MINE SITE
0SURFACE WATER
() EVAPOTRANSPORTATION
0 INFILTRATION AND PERCOlATION
LAKE EVAPORATION
() SPRING DISCHARGE
() WELl. DISCHARGE
Q GROUND WATER DISCHARGETO SURFACE WATER
Q GROUND WATER RECHARGER FROM SURFACE WATER
—- GROUND WATER FLOW
— SURFACE WATER FLOW
WATER TABLE
REGIONALGROUND WATER
INFLOW
OUTFLOW
Date: DECEMBER 1999
Project: 1 00029\T5
FHe: CONCEPT
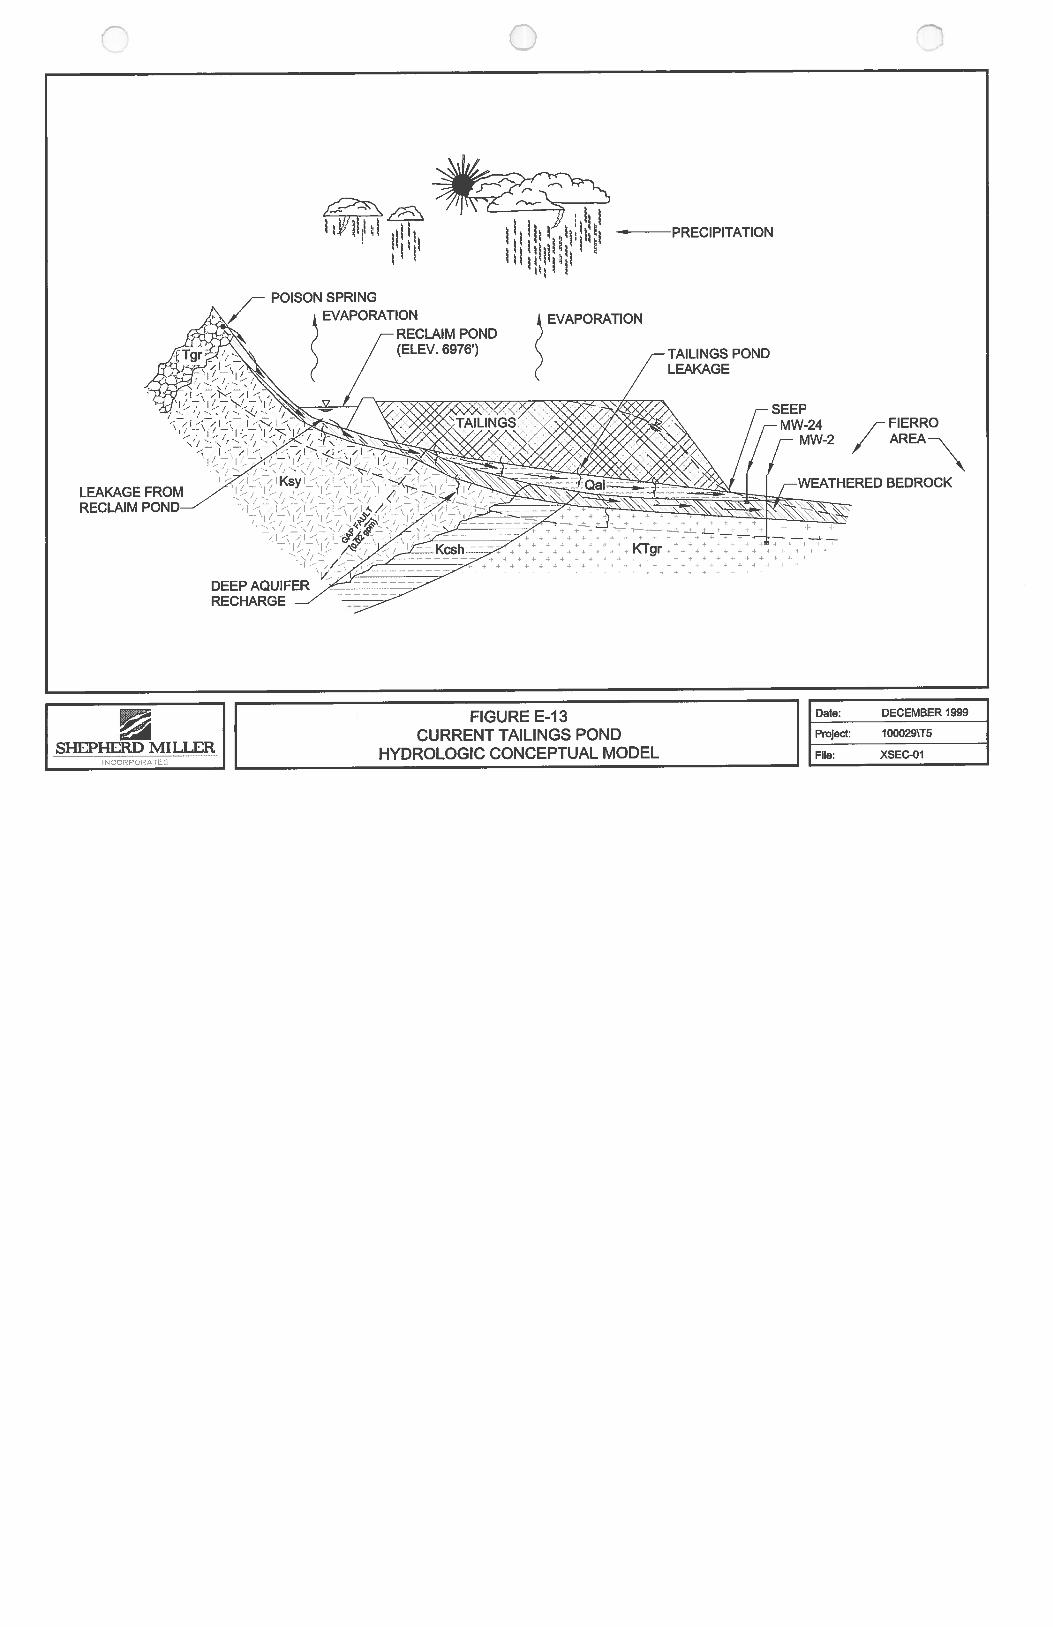
n
LEAKAGERECLAIM
0
- PRECIPITATION
n
FIERRO
fAREAm
BEDROCK
SHEPHERD MILLER
FIGURE E-13CURRENT TAILINGS POND
HYDROLOGIC CONCEPTUAL MODEL
Date: DECEMBER 1999
Project 1OOO29T5
File: XSEC-O1
POISON SPRING
RECLAIM POND(ELEV. 6976’)
EVAPORATION
TAILINGS PONDLEAKAGE
SEEP
RECHARGE
4 + 4 +
-4 -f 4 + + 4 * + 4 -f + f 4 4 * + -4
4 -4 4- 4 -4 4 * + 4 4 * -4 + -4 4- -4
4 -I- 4 + -1- 4 -4- -4- -.- 4 4- -4 + 4 4- -4 4 4-

C
EVAPORATION
0
PRECIPITATION EVAPORATION
TAI LI NGSWATER
DAILY AVERAGE WATER BALANCE
QIN -QOUT =
QIN =3,6l9gpmQOUT 2,892 gpm + QRL QTLtS 615 gpmQRL + QTL = 112 gpmQRL = 105 gpmQTL = 7 gpm
PAN EVAPORATION 79.7 in/yrLAKE EVAPORATION 55.8 in/yrPRECIPITATION = 18.29 in/yr (WESTEC, 1996)
SHEPHERD MILLER
FIGURE E-14CURRENT (1997) TAILINGS POND
WATER BALANCE
Date: DECEMBER 1999
Project: I 00029\T5
File: WAT-BAL
PRECI PITATION
Rp 8 gpm
RE23 gpm
=2,163
TP 113 gpm 346 gpm
-TOE COLLECTIONPOND
128 gpmINTERSTITIAL MOISTURE
487 gpm
DECANTSUMP
RL 105 gpm rL = 7 gpm
DECANT/FILTRATE
TOE SEEPAGE
COLLECTIONPOND RETURNS
NCORPORATED

C’
PRECIFITATIONEVAPOTRANSPIRATION
0
PRECIPITATION
NOT TO SCALE
SHEPHERD MILLER
FIGURE E-15WATER BALANCE COMPONENTS
ASSOCIATED WITH A TYPICAL WRDF
Date: DECEMBER 1999
Project: I 00029\T5
File: WBALWRDF
II III ‘I 1
II II II I I
:1 1
ORIGINALGROUNDSURFACE
WASTE ROCK
LEAKAGE
SEEPAGE
IN CORD OR A T D

m C) m m (0 (0 (0
0 0 C z
-1
0a)
-
0—
(-z
mCD
0 0
I I C-)
-<
;jQ
j
Qz
‘--I
2z
Zm
—4
Z0) C
D> I m Il
l 09
(“C
CC
z-tJ
-um
mG) 0 C z 0
m z

h>Z-riZ—1j50Zcmm>Zm
—II--mozi
r
Czc-U-I-I-f
II;->CI
(0
m
-U0
0z

Thg = HANOVER FIERRO STOCK
Kcsh = SHALE MEMBER OF COLORADO FORMATION
Kcu = COLORADO FORMATIONMI = LAKE VALLEY FORMATION
FIGURE E-18 IHANOVER MOUNTAIN ISHEPHERD MILLER
i CONCEPTUAL HYDROLOGIC MODEL IINCORPORATED
Date: DECEMBER 1999
Project: 1 00029\T5
File: CONC-I-IAN
0 C)
iii
PRECIPITATION
NORTH
EVAPORATION
SOUTH
LEGEND
_____________
Kb = BEARTOOTH QUARTZITEPa = ABO FORMATION
SZ PIEZOMETRIC SURFACE
—-- GROUND WATER FLOW DIRECTION

Date:
DE
CE
MB
ER
1999
Project
IOO
O29T5
File:D
RA
W-U
ND
—50—
LINE
OF
EQ
UI-D
RA
WD
OW
N
EP
HE
RD
MIL
LE
R
FIGU
RE
E-19
PR
ED
ICT
ED
DR
AW
DO
WN
FRO
MU
ND
ER
GR
OU
ND
DE
WA
TE
RIN
GA
TE
ND
OF
MIN
ING


C 0 0
V V
../_\/• \i/ \ /
. \ /
• I7 l
-\\‘? “ -
-
DEEP AQUiF
KTgr4±4±+*÷÷1±+±±÷+F
NOT TO SCALE
FIGURE E-22POST CLOSURE TAiLINGS POND
HYDROLOGIC CONCEPTUAL MODEL
UPLANDRUNOFF POISON SPRING
PRECIPITATION
RUNOFF
TAILINGS MW-24
MW-2LEAKAGE
QaIWEATHEREDBEDROCK
SHEPHERD MILLERtqcCRFc)A
iD;
File:
DECEMBER 1999
Project: I 00029VT5
XSEC-PC

0
\‘
0
Czo-tJ-Il —-n-iII
k>o i
__fl
Ci)
z
>01ZQG)0ZcmH>mmm
>r
mm
‘5 a!a
w0rn>oi- r m
(D
—4W
Z
CDCD
(I)ni
G)Ill
mC-)-1
m— g
-I>-I0z
--4Co
m
II
0)p0)
Co
3

n 0 0Cl)x
r:j
-Irn -
m
__
-1 ==
-ci
m C‘‘-‘,.a >
—iO’’ - zi—m z
—1r ii
-<ci)
3-1
m
&a
w>
N)
±9> -Iz
c-fl
Cz
-n--Iii->o i
-o3
(1,mrn-U
G)m>C)m
rn
—---------.-- -u0
0z
N)
•03
CmC)m
m
CDCDCD

BASELINE CHARACTERIZATION OF THEHYDROLOGY, GEOLOGY, AND GEOCHEMISTRY
OF THE PROPOSEDCONTINENTAL MINE EXPANSION PROJECT
APPENDICES E-H
Prepared fo,
Cobre Mining Company, Inc.do Chino Mines
NO. 14 Chino BoulevardHurley, NM 88043
Shepherd Miller, Inc.3801 Automation Way, Suite 100
Fort Collins, CO 80525
December 1999
SHEPHERD MILLERCOOAT!D
Prepared by

APPENDIX E
GENERAL HYDROLOGY AND WATER BALANCEMODELS FOR THE PROPOSED CONTINENTAL
MINE EXPANSION PROJECT,GRANT COUNTY, NEW MEXICO
Prepared for:Cobre Mining Company, Inc.
do Chino MinesNo.14 Chino Boulevard
Hurley, New Mexico 88043
Prepared by:Shepherd Miller, Inc.
3801 Automation Way, Suite 100Fort Collins, Colorado 80525
December 1999
SHEPHERD MILLERINCORPORATED

APPENDIX E
GENERAL HYDROLOGY AND WATER *
BALANCE MODELS FOR THE PROPOSEDCONTINENTAL MINE EXPANSION PROJECT,
GRANT COUNTY, NEW MEXICO
TABLE OF CONTENTS
1.0 LOCAL AND REGIONAL CLIMATE AND HYDROLOGY 1
1.1 Climate 1
1.1.1 Regional 1
1.1.2 Local 2
1.2 Surface Water Hydrology 2
1.2.1 Regional Surface Water Hydrology 2
1.2.2 Local Surface Water Hydrology 3
1.3 Ground Water Hydrology 7
1.3.1 Regional Ground Water Regime 7
1.3.2 Local Ground Water Regime 8
1.3.2.1 Ground Water in Basement Rock 9
1.3.2.2 Ground Water in Shallow Alluvial Systems 10
2.0 SITE WATER BALANCE COMPONENTS 12
2.1 Current Water Balance Components 12
2.1.1 Tailings Pond 12
2.1.2 Waste Rock Disposal Facilities 14
2.1.2.1 South Waste Rock Disposal Facility 14
2.1.2.2 West Waste Rock Disposal Facility 15
2.1.3 Underground Workings 15
2.1.4 Continental Pit 172.1.5 Hanover Mountain 18
2.1.6 Proposed Leach Pad Area 19
2.1.6.1 FierroLeachPad 19
2.2 Water Balance Components and Impacts at the End of Mining 202.2.1 Tailings Pond 212.2.2 Waste Rock Disposal Facilities 22
2.2.2.1 South Waste Rock Disposal Facility 222.2.2.2 West Waste Rock Disposal Facility 23
2.2.3 Underground Workings 23
2.2.4 Continental Pit 23
2.2.5 Hanover Mountain 242.2.6 Fierro Leach Pad Area 24
2.3 Post-Closure Water Balance Components 252.3.1 Tailings Pond 25
Cobre Mining Company. Inc. Shepherd Mi11er Inc.
pIOOO29frepon-draft.rsc1appcrnli-cnppc.cdi:aidoc E-i December 1999

2.3.2 Waste Rock Disposal Facilities 26
2.3.2.1 South Waste Rock Disposal Facility 26
2.3.2.2 West Waste Rock Disposal Facility 26
2.3.3 Underground Workings 27
2.3.4 Continental Pit 27
2.3.5 HanoverMountain 28
2.3.6 LeachPadArea 30
3.0 SUMMARY 31
4.0 REFERENCES 32
LIST OF TABLES
Table E-1 Predicted Steady-State Water Balance Components of the Continental Pit
Lake
Table E-2 Predicted Steady-State Water Balance Components of the Lake for the
Expanded Continental Pit
Table E-3 Predicted Steady-State Water Balance Components of the Hanover Pit
Lake
LIST OF FIGURES
Figure E- 1 Project Location
Figure E-2 Monthly Precipitation and Evaporation Fort Bayard and Chino Mine, New
Mexico
Figure E-3 Prism Estimated Precipitation within Grant County
Figure E-4 Monthly Precipitation and Lake Evaporation Continental Mine, New
Mexico
Figure E-5 Mibres River Basin within Grant County
Figure E-6 Surface Water Drainages within the Hanover Creek Basin
Figure E-7 Locations of Seeps and Springs at the Continental Mine
Figure E-8 Conceptual Hydrologic Model of the Continental Mine
Cobre Mining Company, Inc. Shepherd Miller. Inc.
E—ii December 1999

Figure E-9 Location of Existing and Proposed Monitoring Wells
Figure E-1O Ground Water Flow Directions and Hydraulic Heads
Figure E-1 1 Distribution of Measured Hydraulic Conductivity in Basement Rocks
Figure E-12 Components of the Conceptual Water Budget
Figure E-13 Current Tailings Pond Hydrologic Conceptual Model
Figure E-14 Current Tailings Pond Water Balance
Figure E-15 Water Balance Components Associated with a Typical WRDF
Figure E-16 Current Underground Workings Conceptual Model
Figure E- 17 Continental Pit Lake Water Balance at Steady State
Figure E- 18 Current Conceptual Model of Hanover Mountain
Figure E-19 Predicted Drawdown from Underground Dewatering at End of Mining
Figure E-20 Predicted Drawdown from Continental Pit Dewatering at End of Mining
Figure E-21 Predicted Maximum Drawdown from Hanover Pit Dewatering at End ofMining
Figure E-22 Post Closure Tailings Pond Hydrologic Conceptual Model
Figure E-23 Expanded Continental Pit Lake Water Balance at Steady State
Figure E-24 Hanover Pit Lake Water Balance at Steady State
Cobre Mining Company. Inc. Shepherd Mil1er Inc.
E-iii December 1999

LIST OF ATTACHMENTS
Attachment El Climatic Inputs to the Water Balances Associated with theProposed Continental Mine Expansion Project, Grant County, NewMexico
Attachment E2 Tailings Pond Facility Water Balances for the ProposedContinental Mine Expansion Project, Grant County, New Mexico
Attachment E3 Underground Workings Water Balances for the ProposedContinental Mine Expansion Project, Grant County, New Mexico
Attachment E4 Continental Pit Water Balances for the Proposed Continental MineExpansion Project, Grant County, New Mexico
Attachment E5 Hanover Mountain Water Balances for the Proposed ContinentalMine Expansion Project, Grant County, New Mexico
Attachment E6 Analytical Ground Water Model for Flow to Pits and UndergroundWorkings for the Proposed Continental Mine Expansion Project,Grant County, New Mexico
Cobre Mining Company. Inc. Shepherd Miller. Inc.
p:ilOOO29cpon-drafl-rappcndL-capp.editJ.doc E-iv December 1999

1.0 LOCAL AND REGIONAL CLIMATE AND HYDROLOGY
The Continental Mine is located approximately 3 miles north of Hanover, in Grant
County, New Mexico (see Figure E-1). The climate is semi-arid and only a few isolated
stretches of perennial surface waters exist at or near the site. Elevations at the site range
from a high of approximately 7,500 feet on Hanover Mountain to low of approximately
6,600 feet near the South Waste Rock Disposal Facility (WRDF). Ground water exists at
depths of tens of feet in shallow alluvial aquifers and hundreds of feet below the ground
surface in deeper regional bedrock aquifers. The following sections describe in more
detail the climate, hydrology, and water balance of the Cobre Continental Mine site.
1.1 Climate
1.1.1 Regional
The Continental Mine is located in a semi-arid region of New Mexico. The climate of the
area can be approximately described by meteoric data collected at Fort Bayard (Earthlnfo,
1996) and the Chino Mine (WESTEC, 1996). For the Fort Bayard weather station, the
following statistics are based on the years 1897 through 1994 for which complete data
exist (i.e., years with partial data were omitted from the analysis):
• Mean annual rainfall of 15.74 inches per year (inlyr), with a median of 15.66 inlyr
• Mean annual temperature (average of maximum and minimum daily
temperatures) of 54.8 degrees Fahrenheit (°F)
• Temperatures ranging from a mean daily minimum of 25.0°F (January) to a mean
daily maximum of 86.7°F (June and July).
An average pan evaporation rate of 79.7 inlyr was measured at the Chino Mine.
Figure E-2 shows that precipitation measured at the Fort Bayard weather station displays
a distinct wet season during the months of July, August, and September. Figure E-2 also
shows that the average mean monthly pan evaporation at the Chino Mine is greater than
precipitation, even during cooler winter months.
Cobre Mining Company, Inc. Shepherd Miller. Inc.
p:IOOO29port-drafl-rcvis&appendix.cappe-cditcd.doc E— 1 December 1999

1.1.2 Local
The limited site-specific climatic information collected at the site is inadequate to
estimate long-term climatic trends. However, climatic trends can be extrapolated from
regional climatic data and from ecological observations, such as the extent of observable
erosion and vegetative cover. Daly et al. (1994) have developed the expert system
PRISM (Parameter-Elevation Regressions on Independent Slopes Model), which
extrapolates climatic data from point measurements, including precipitation and
temperature. Cooperating with the New Mexico State Climatologist, Dr. Daly’s team at
Oregon State University generated a precipitation map of the State of New Mexico.
Figure E-3 is a copy of a portion of this map, showing that the estimated annual
precipitation at the Continental Mine Site ranges from approximately 14 in/yr at the Cron
Ranch to 18 in/yr near the town of Hanover to over 24 in/yr north of the site.
The temporal rainfall distribution at the site is probably similar to the measured
precipitation distribution at the Fort Bayard weather station (Figure E-2). Average pan
evaporation rates at the site are assumed to equal those at Chino Mine and were used to
estimate lake evaporation rates at the Continental IVIine (see Attachment El). Figure E-4
shows the SMI interpretation (see Attachment El) of the monthly precipitation and lake
evaporation data for the Continental Mine as used in the water balance predictions of the
Continental and Hanover Pits. The sum of these monthly values total 18.3 inlyr. During
an average year, the monthly lake evaporation is predicted to be greater than monthly
precipitation for all but the months of December and January.
1.2 Surface Water Hydrology
1.2.1 Regional Surface Water Hydrology
The project area is located within the Mimbres River Basin (Figure E-5), a closed basin
that recharges an extensive, alluvial-fill aquifer in Luna County, New Mexico. The
Mimbres River drains the west slope of the Black Range and the east slopes of the Piflos
Altos and Cobre Mountain Ranges (a total area within Grant County of approximately
460 square miles [mi2]). Typically, perennial surface water exists in the Mimbres River
Cobre Mining Company, Inc. Shepherd Miller, Inc.
E-2 December 1999

from a location near the mouth of McKnight Canyon, upgradient of the town of San
Lorenzo (Trauger, 1972). Irrigation diversions cause much of the river to remain dry
downstream of San Lorenzo.
A major tributary to the Mimbres River is the San Vicente Arroyo-Whitewater Creek
Drainage system. This system drains the large lowland area known as the San Vicente
Basin which is bounded by the Big Burro Mountains to the west, the Cobre Mountains
and Santa Rita Hills to the east, and the Piños Altos Range to the north (an area of
approximately 390 mi2 within Grant County). No perennial flows exist in this drainage
system, except possibly at the headwaters of tributaries. Prior to 1885, perennial flows
may have existed where the San Vicente Arroyo cuts through the Silver City area. Rio de
Arenas, Cameron Creek, and Whitewater Creek (approximately 5 miles south of the
Continental Mine) also used to contain perennial flow prior to long-term drought
conditions, which began in 1885 (Trauger, 1972).
1.2.2 Local Surface Water Hydrology
Locally, the project area is situated within the Hanover Creek Drainage system (Figure E
6). The Piflos Altos Range bounds this system on the north. Humbolt and Hermosa
Mountains, part of a northerly-trending ridge, define the western hydrologic boundary of
the system. A ridge that includes Fierro and Topknot Hills defines the eastern hydrologic
system boundary. The highest point within the Hanover Creek Drainage system is
located north of Hanover Mountain, in the Piños Altos Range, at an approximate
elevation of 7,820 feet. The lowest elevation (approximately 6,000 feet) occurs at the
mouth of Hanover Creek at its confluence with Whitewater Creek near the Chino Mine.
Over its length, Hanover Creek is generally an ephemeral stream. However, local
perennial reaches exist near Fierro Spring and also adjacent to the towns of Hanover and
Fierro, where it is suspected that local septic systems recharge the stream.
The contributing drainage area of Hanover Creek is approximately 10.9 mi2 (6,990 acres),
of which about 70 percent is downstream of previous mining activity (e.g., prospecting,
Cobre Mining Company, Inc. Shepherd Miller. Inc.
E-3 December 1999

open pit mining, and underground workings). Several ephemeral tributaries discharge
underfiow (i.e., ground water) and storm runoff to Hanover Creek. Tributaries adjacent
to or traversing the currently disturbed areas of the project area include the following:
Grape Gulch. This gulch has a drainage basin area of approximately 0.85 mi2(543 acres), which is approximately 0.2 percent of the San Vicente-Arroyo
Whitewater Creek Drainage system. It originates in the Piños Altos Range andcontinues for 11,280 feet through the Continental Mine (between the office area
and the tailings pond area) to the discharge point at Hanover Creek near the guard
shack. Perennial flow exists in this drainage only near its headwaters, where
several small seeps exist.
• Poison Spring Drainage. This drainage has an area of approximately 1.29 mi2
(823 acres), which is approximately 0.3 percent of the San Vicente
Arroyo-Whitewater Creek Drainage system. It begins approximately 3,400 feet
upgradient from Poison Spring. A perennial flow of 0.6 gpm (measured inFebruary 1996 [SMI, 1998a]) begins at the spring and exists for approximately
1,200 feet downstream, where it appears to percolate into the thickening alluvium.
Approximately 2,200 feet downgradient from the spring, the drainage isintercepted by the existing Tailings Pond. Downgradient from the Tailings Pond
and approximately 2,200 feet upgradient from its confluence with Hanover Creek,
the drainage contains a small perennial flow (0.7 gpm measured in February
1996). This flow probably occurs because of the following reasons:
— The alluvium becomes thinner in this area
— The main Tailings Pond and magnetite dam may provide enhanced recharge inthis area
— A seep, located on the north side of the South WRDF, may provide some
surface water flow.
• Buckhorn Gulch. This gulch has a drainage area of 0.99 mi2 (636 acres), which isapproximately 0.25 percent of the San Vicente-Whitewater Creek Drainage
system. It originates to the south of the existing mine area. Perennial flow issustained at the confluence of the east and west forks of this drainage by theBuckhorn Spring. Upgradient of the spring, flow is intermittent. Downgradient
of the spring, perennial flow continues for approximately 1,000 feet until itpercolates into the thickening alluvium of Buckhorn Gulch.
• Ansones and Beartooth Creeks. These creeks have a combined drainage area of6.2 mi2. The headwaters of these two creeks are located on the south side ofHermosa Mountain. Beartooth Creek, an ephemeral stream, drains approximately1,040 acres above its confluence with Ansones Creek. Ansones Creek drains
C’obre Mining Company. Inc. Shepherd Miller, Inc.
E-4 December 1999

approximately 2,900 acres of the North Star Basin, west of the Continental Mine.
Ansones Creek is an ephemeral stream and a tributary to Cameron Creek, which
flows through the Fort Bayard Military Reservation.
Other surface water of interest are springs and seeps. Several seeps and springs exist in
the area of the Continental Mine site (Figure E-7).
Perennial seeps and springs upgradient of the mine site originate at the base of a
Tertiary-age gravel unit that overlies the Colorado Formation. Precipitation falling in the
Piflos Altos Range infiltrates and percolates through overlying volcanic flows and is
collected by this relatively permeable gravel unit. The contrast in permeability between
the gravel and the underlying, lower permeability Colorado Formation causes the
percolating water to “pond” in the gravel unit. The ponded water in the gravel unit flows
to outcrop areas, where it discharges as springs and seeps. Seeps and springs associated
with this gravel unit include the following:
• Fierro Spring. This spring is located near the headwaters of Hanover Creek and
has been used by the local communities as a source of drinking water. The spring
itself has been encased in a concrete housing. As the populations of Fierro and
Hanover have decreased and a municipal supply has been provided to the town of
Hanover, the importance of the spring as a drinking water source has diminished.
• Several seeps that exist in Grape Gulch and Gap Canyon. Stream flow estimates
made in February 1996 indicate that flows from these seeps are less than 1 gallon
per minute (gpm).
• Poison Spring. This spring is located northwest of the Tailings Pond, near the
United States Forest Service and Bureau of Land Management boundary. Flow
from this spring is channeled through a small-diameter pipe to a stock-watering
tank.
Seeps and springs downgradient of the mine site include the following:
• Buckhom Gulch Spring. This spring is supplied by ground water discharging
from Tertiary- and Quatemary-age gravels extending west of the spring location
(BLM, 1997). In February 1996, a flow rate of 0.4 gpm was measured with acut-throat flume. Observations by Cobre personnel indicate that this flow rate istypical of the base flow in Buckhom Gulch Spring.
Cobre Mining Company. Inc. Shepherd Miller. Inc.
E-5 December 1999

• Several small seeps that exist along Hanover Creek. Their occurrence may
correlate with septic systems associated with housing areas. The algae growth
near these seeps indicate high nutrient levels that may result from septicleachfields.
The following seeps appear to be associated with past and current mining facilities:
• Several seeps that exist at the downradient perimeter of the Tailings Pond.Flows from these seeps are captured in surface containment facilities and thewater is recirculated into the milling process stream or pumped directly back to
the Tailings Pond. The average flow rate of recirculated seep water is 2 gpm.
• The West WRDF. Seeps from this area are intermittent and occur on the east sideof this disposal facility. The facility was started in the 1950s as a waste disposal
facility for the Pearson-Barnes workings. The facility was later expanded in the
early 1970s when a previous operator executed a “push-back” to start the
Continental Pit. The seeps are intermittent and only flow during and immediately
after precipitation events. Water from the seeps is collected in linedimpoundments and pumped into tanker trucks. The water is then trucked to adischarge point where it is introduced into the milling process water system or
gravity-fed to the make-up water tanks.
• The Buckhorn Portion of the South WRDF. This seep is located at the toe of the
South WRDF in a small branch of Buckhom Gulch, due east and directlydowngradient of the West WRDF seep. Similar to the West WRDF seeps, flow
from this seep is intermittent and appears only during and immediately followingprecipitation events. Because the chemistry of the rocks contained in theBuckhom Portion of the South WRDF do not match that measured in the seep, itis suspected that this seep is a manifestation of upgradient ground water
originating in the Pearson-Barnes and West WRDF areas. Further
characterization work is underway to better understand the hydrology associated
with this seep.
• The East Portion of the South WRDF. The seep is perennial and located on the
north side of the South WRDF, near monitoring well MW-3. A concretecontainment facility collects water from the seep and allows it to evaporate. Thecontainment facility is monitored and pumped as a water source for dust
suppression. The average flow rate from this seep is estimated at less than 1 gpm.
• The Magnetite Dam Seep. This seep is located downstream of the toe of themagnetite tailings area. Flow measurements in February 1996 indicated that theflow rate from this seep was less than 1 gpm.
Cobre Mining Company. Inc. Shepherd Miller. Inc.
E-6 December 1999

1.3 Ground Water Hydrology
1.3.1 Regional Ground Water Regime
Trauger (1972) describes the regional ground water regime in Grant County. Ground
water is the main source of municipal, domestic, livestock, agricultural, and industrial
water supplies throughout Grant County. The availability, volume, and quality of ground
water are dependent mainly on rock type. The following five main rock types are found
in Grant County:
• Metamorphic and plutonic igneous rocks. These rocks typically have lowpermeabilities, especially in non-weathered zones. Wells completed in these
rocks produce water at flow rates ranging form less than 1 gpm to slightly over 15
gpm. Weathered granitic rocks generally provide sufficient amounts of water fordomestic or livestock use. Non-weathered rocks generally make poor aquifers
and are not utilized for ground water supply.
• Volcanic rocks. Generally, these rocks make poor aquifers and are most likely tobehave as aquitards, especially in massive volcanic flows. The exception can bepyroclastic rocks, which make relatively good aquifers if the particles are large
and unconsolidated. Several stock wells in Grant County have been completed inwell-sorted, water-deposited pyroclastic rocks.
• Marine sedimentary rocks (carbonates and clastics). Generally, carbonate rocks
do not make good aquifers; however, they are likely to yield an adequate supplyof water if they have been fractured or solution channeled. In Grant County,water supplies from carbonate rocks are usually the result of fracturing near faultzones and not from solution channels. Solution channels are not conspicuous inoutcrops around the county, but some channels have been observed in brecciatedzones. Clastic rocks are not good aquifers. Generally, wells up to 300 feet deepyield small amounts of water for domestic or stock use.
• The Gila Conglomerate. This conglomerate is an extensive continentalsedimentary deposit and spans most of the north and central areas of the county.The lower part of the Gila furnishes very little water to wells and the upper part ofthe formation may provide moderate amounts of water.
• Alluvial deposits. These formations are generally the most important sources ofground water in Grant County. Some important alluvial deposits include thefollowing:
Cobre Mining Company. Inc. Shepherd Miller, Inc.
E—7 December 1999

— The Bolson Deposit (alluvial sediments that fill extensive interrnontane areas),
which is several thousands of feet thick in the lowland areas in the southern
portion of the county. This deposit produces relatively high-yielding wells.
— Isolated terrace gravels that cap low ridges and generally overlie less
permeable rocks. These are generally thin and well drained when they are
above the water table. Small amounts of ground water are found locally in
these gravels where extensive deposits overlie low permeability rocks.
— Channel alluvium in major tributaries of the Gila and Mimbres Rivers. These
deposits are typically not more than 5 to 20 feet thick and become thinner at
the headwaters of streams. They have relatively high permeabilities and may
yield small amounts of water during wet seasons.
Geologic structures play a significant role in determining the ability of an aquifer to
provide an adequate supply of ground water. For example, in the Colorado Formation,
wells that are relatively close together may exhibit artesian or non-artesian flow
conditions and have highly variable well yields. These differences are attributed to
geologic structures, such as intrusive dikes, sills, and faults, that may have enhanced or
reduced permeabilities.
In the northern portion of the county, ground water from the Piflos Altos and Black
Ranges discharges to the Gila River system. Deep ground water flows through, and is
stored in, the Gila Conglomerate and Bolson Formations in the southern portion of the
county.
1.3.2 Local Ground Water Regime
Figure E-8 shows the current conceptual hydrologic model of the Continental Mine.
Within this conceptual model, two local ground water flow regimes exist:
• Ground water in the basement (deep) rocks. This ground water is part of the
regional system and is essentially contained in the basement and intrusive rocks
underlying the Continental Mine. Locally, this ground water regime is divided
into two hydrogeologic units:
— Upper Basement Unit (Colorado and Beartooth Formations)
Cobre Mining Company, Inc. Shepherd Miller, Inc.
E— 8 December 1999
— Lower Basement Unit (Paleozoic sedimentary rocks including the Oswaldo,
Lake Valley, and Montoya Fusselman formations and the Hanover Fierro
Stock)
• Ground water in shallow alluvial and perched systems. Ground water in this
system is generally the result of surface waters percolating downward into local,
high permeability zones (i.e., alluvium, weathered bedrock), that overlie less
permeable stratum.
Figure E-9 shows the locations of existing/proposed monitoring wells and pneumatic
piezometers in the Continental Mine area. Appendix A discusses specific information
regarding the existing wells. Monitoring wells MW-i, MW-lA, MW-7, MW-8, and
MW-19 and piezometers PP-0i, PP-02, and PP-05 are located north of the Barringer
Fault. The remaining wells are located either in the fault zone (MW-5A) or south of the
fault.
1.3.2.1 Ground Water in Basement Rock
Water level data were obtained from monitoring wells, exploration drilling on Hanover
Mountain, measurements by Trauger (1972), and measurements in the sump located at
the base of the underground workings. These data were used to develop Figure E-i0,
which shows hydraulic head contours and inferred flow directions in the basement units
at the Continental Mine. Because the wells are completed in different stratigraphic units,
the following assumptions were used to generate the contour lines and flow paths shown
on the Figure E-i0:
• The hydrologic regime at the Continental Mine has been undergoing similar
stresses for over 30 years (e.g., dewatering of the underground workings and
deposition of tailings). Thus, the ground water flow regime in basement rocks isconsidered to be in a quasi-steady-state.
• The Barringer Fault behaves as a low permeability feature. This is due to the
large offset of the fault and because it displaces several different geologic units.
This assumption is supported by:
- The results from a 24-hour pumping test conducted at water test hole TH-98-5
(August, 1999) that showed the well was surrounded by low permeability
features.
Cobre Mining Company. Inc. Shepherd Miller. Inc.
E-9 December 1999

- Short-term aquifer testing results on monitoring well MW-5A
- The observation that no ground water enters the underground working where
they intersect the Barringer Fault.
Figure E- 10 shows that ground water in the Lower Bedrock Units at the Continental Mine
generally flows to the south and is strongly influenced by the dewatering of the
underground workings. It also shows that the ground water in the Upper Bedrock Units
flows to the south. A large portion of this water discharges to the underground workings.
The rest discharges to the Fierro area, combining with flow from the Tailings Pond.
Permeability of rocks comprising the basement rock aquifers are summarized from
aquifer testing results in Appendix A along with a detailed description of the
determination of hydraulic conductivity. Figure E-11 shows the distribution of measured
hydraulic conductivity data from the formations comprising the basement rocks at the
Continental Mine. The estimated values of hydraulic conductivity reported in Appendix
A (Table A-9) for monitoring wells range from 1.60 x iO centimeters per second
(cm/sec) to 7.3 x iO cm/sec. The geometric mean of the hydraulic conductivity
estimates is 2.4 x iO cm/sec. The estimated values of hydraulic conductivity reported
in Appendix A (Table A-b) for specific capacity analysis on exploration borehole data
range from 9.5 x iO centimeters per second (cm/sec) to 2.8 x 10’ cm/sec. The
geometric mean of the hydraulic conductivity estimates is 2.1 x 1 o- cm/sec.
1.3.2.2 Ground Water in Shallow Alluvial Systems
Several shallow alluvial and perched aquifers exist in the Continental Mine area. The
three main alluvial systems are the Upper Buckhorn Gulch, Poison Spring Drainage, and
Grape Gulch.
BLM (1997) provides a detailed description of the shallow aquifers in Upper Buckhom
Gulch and the Poison Springs drainage. The Buckhorn Gulch Springs are fed by the
Quatemary/Tertiary age colluvium that overlies less permeable intrusive and sedimentary
rocks. These gravels receive recharge from infiltration of precipitation and upgradient
ground water flow from beneath the West WRDF. The shallow aquifer in the Poison
Cobre Mining Company, Inc. Shepherd Miller. Inc.
E— 1 0 December 1999

——-
Springs Drainage upgradient of the Tailings Pond is composed of very shallow alluvium
and weathered bedrock. The main recharge to this system in the upper reaches of the
drainage is flow from Poison Springs and infiltration of precipitation and surface water
runoff.
Grape Gulch is very similar to the Poison Springs system. The aquifer in the upper
portions of the gulch is limited to shallow alluvial fill and weathered bedrock. The
alluvium thickens dowrislope to several tens of feet as indicated in Monitoring Well
MW-19, near the Number One Mill. Flow in the upper portions of this aquifer originates
from springs in Grape Gulch and Gap Canyon. Ground water flow in the lower portions
of the system is supplied from infiltration of precipitation and surface runoff
The hydraulic conductivity of these shallow aquifers is highly dependent on the
formations in which they are contained. The colluvial material in which MW-24 is
screened has a hydraulic conductivity of approximately 7x10³ cmlsec while the Percha
Shale, represented by an aquifer test in MW-20, has a permeability of approximately
1.6x10⁷ cmlsec.
Cobre Mining Company, Inc. Shepherd Miller. Inc.
p.II00029pcn4rafl-rseMppendLx-cLappe.eJhc.Ldoc E- 11 December 1999
2.0 SITE WATER BALANCE COMPONENTS
Components of the water balance were evaluated to provide an understanding of
processes that add or subtract site water and cause changes in water storage. Figure E-12
depicts important components to be considered in a water balance, which are as follows:
• Precipitation
• Surface runoff
• Evapotranspiration
• Infiltration and percolation
• Surface water/lake evaporation
• Spring discharge
• Well discharge
• Ground water discharge and recharge.
The pre-expansion magnitudes of some of these components are discussed in previous
sections of this report. This section focuses on the current, expansion, and post-mining
components of the water balance. Effects from previously planned expansion of the
Tailings Pond, Underground Workings, and Continental Pit are included in these
discussions to assist in the preparation of the cumulative impacts portions of the EA and
EIS. However, Cobre has no immediate plans to follow the previous planned expansion
of these facilities and may decide on an entirely different operational approach.
2.1 Current Water Balance Components
2.1.1 Tailings Pond
Figure E-13 shows the conceptual hydrologic model of the current (circa 1997) Tailings
Pond. The Tailings Pond has been in operation since the late 1960s, when the Number
One Mill was brought on-line. It was originally constructed in the Poison Springs
Drainage over an alluvial deposit. The underlying alluvium and weathered bedrock are
Cobre Mining Company. Inc. Shepherd Miller. Inc.
piIOOO29,cp,-drnfl-rcarappcndiz.cappc-cdiscd.doc E— 12 December 1999

high permeability units that collect seepage from the Tailings Pond and Reclaim Pond.
These seepage rates have likely decreased due to the progression of the Reclaim Pond
westward, away from this natural drainage material. The evaluation presented below is
based on an analysis performed in 1997. The Continental Mine went into standby status
in the summer of 1999. At the time of publication, no tailings or process water was being
discharged to the Tailings Pond nor was process water being extracted from the Reclaim
Pond. Also at the time of publication, updated information was not available regarding
the water balance components associated with the Tailings and Reclaim Ponds.
In 1996, Cobre initiated tracking methods to measure components of the water balance
associated with the Tailings and Reclaim Ponds. The results of this water balance are
shown on Figure E-14. Average inflows to the Tailings and Reclaim Ponds for 1997
were measured or estimated as follows:
• Direct precipitation on the Tailings Pond and Reclaim Pond —121 gpm, based on
18.3 inlyr of precipitation
• Water in the tailings slurry— 3,288 gpm
• Returns from the collection pond located in Grape Gulch, near Mill Number One
—75 gpm
• Water removed from the ore concentration process, also known as concentrate
decant— 135 gpm
• Seepage from the Toe of the dam — 500 gpm (this rate has declined significantly
since the summer of 1999).
Measured and estimated outflows from the Reclaim Pond were as follows:
• Reclaimed water from the Reclaim Pond — 2,163 gpm
• Decant from the Tailings Pond — 360 gpm
• Change in storage of the reclaim and Tailings Pond —615 gpm
• Evaporation from the Tailings Pond and Reclaim Pond — 369 gpm, based on
55.8 inlyr.
• Leakage from the bottom of the Tailings and Reclaim Pond — 112 gpm
Cobre Mining Company. Inc. Shepherd Mi1Ier Inc.
E- 1 3 December 1999

. Toe seepagc collection return — 500 gpm.
It is estimated that, at the present time, approximately 105 gpm of the seepage from the
Tailings Pond and the Reclaim Pond flows downvalley toward the Fierro area and
approximately 7 gpm seeps downward into the deep bedrock aquifer. Attachment E2
presents the calculations used to estimate these components of the Tailings Pond water
balance.
2.1.2 Waste Rock Disposal Facilities
The conceptual model of the current water balance for the waste rock disposal facilities
after reclamation is shown on Figure E- 15. While the magnitudes of the inflows and
outflows are different for each facility, the conceptual model holds true for each facility.
The following sections describe the magnitudes of the inflows and outflows for each of
the waste rock disposal facilities.
2.1.2.1 South Waste Rock Disposal Facility
Inflows to the current South WRDF consist of infiltration of direct precipitation. All
other surface water is diverted around this facility. Current water outflows from the
South WRDF include evaporation, seepage from the East WRDF Seep, runoff, and deep
percolation through the facility. Using a 30-year data set from Ft. Bayard to represent
average conditions, DBS&A (1999) predicted that the uncovered South WRDF
(comprised of the Buckhorn, East and Union Hill areas) receives 138.7 gpm (223.8 acre
ft/yr) of precipitation (15.5 inlyr). Of this 138.7 gpm, 88.0 gpm (142 acre-ft/yr)
evaporates and 50.7 gpm (81.8 acre-fi/yr) infiltrates. For conservatism, it was assumed
that none of the precipitation becomes runoff.
The average annual rainfall value used in DBS&A’s analysis (15.5 inlyr) is less than
average annual rainfall used in analyses presented elsewhere in this report (18.3 inlyr).
Therefore, prior to comparing the results of this analysis to analyses presented elsewhere
in this report, the results should be scaled up based on the ratio of 18.3/15.5. Scaling the
results based on this ratio results in the prediction that the uncovered South WRDF
Cobre Mining Company, Inc. Shepherd Mil1er Inc.
E— 14 December 1999

receives 163.8 gpm (264.2 acre-fi/yr) of precipitation. Of this 163.8 gpm, 103.9 gpm
(167.7 acre-ft/yr) evaporates and 59.9 gpm (96.6 acre-fi/yr) infiltrates.
2.1.2.2 West Waste Rock Disposal Facility
Inflow to the current West WRDF consists of infiltration of direct precipitation. All other
surface water is diverted around this facility. Current water outflows from the West
WRDF include evaporation, runoff, and deep percolation through the facility. Using a
30-year data set from Ft. Bayard to represent average conditions, DBS&A (1999)
predicted that the uncovered West WRDF would receive 45.4 gpm (73.3 acre-ft/yr) of
precipitation (15.5 in/yr). Of this 45.4 gpm (73.3 acre-ft/yr), 28.8 gpm (46.5 acre-ft/yr)
evaporates and 16.6 gpm (26.8 acre-fi/yr) infiltrates. For conservatism, it was assumed
that none of the precipitation becomes runoff.
Again, the average annual-rainfall value used in this analysis (15.5 inlyr) is less than
average annual rainfall used in analyses presented elsewhere in this report (18.3 inlyr).
Scaling the results based on the ratio of 18.3/15.5 results in the prediction that the
uncovered West WRDF receives 53.6 gpm (86.5 acre-fi/yr) of precipitation. Of this 53.6
gpm, 34 gpm (54.9 acre-ft/yr) evaporates and 19.6 gpm (31.6 acre-ft/yr) infiltrates.
2.1.3 Underground Workings
Prior to 1964, historic dewatering occurred in several shafts in the area of the Continental
Mine. During 1964, the Number 3 Shaft of the current underground workings was
excavated and this became the main dewatering shaft at the site (SMI, 1997). Figure E
16 shows the hydrologic conceptualization of the current underground workings.
Currently, the underground workings are dewatered at an average rate of 132 gpm.
Approximately 92% of the water is pumped from the “upper” sump while approximately
8% is pumped from the “lower” sump. For the purposes of the analysis presented in this
report, all water was assumed to be extracted from the location of the upper sump. It
should be noted that the analysis presented in this report ds not take into consideration
water exiting the mine via the #3 Borehole Vent (air flow rate of 102,703 cfin) and the #4
Cobre Mining Con,pciny, Inc. Shepherd Miller. Inc.
E— 1 5 December 1999

Shaft (air flow rate of 32,800 cfm). Assuming 100 percent relative humidity at an
average temperature of 26.6 degrees C, calculations indicate that air venting could
remove approximately 23 gpm of water.
It is believed that most of the collected water comes from the Lake Valley and Oswaldo
Formations in the deepest portions of the mine, at the location of the sump. There are no
significant seeps at the higher elevations in the underground workings or any indications
that water enters the mine from the Barringer Fault. Small amounts of water enter the
underground workings from drill holes that penetrate the overlying Beartooth Quartzite
(SMI, 1997) and also approximately 0.02 gpm flows from the intersection between the
Gap Fault and the underground workings.
Because dewatering operations in the underground workings have occurred for a
significant period of time, they can be viewed as a long-term pumping test from which a
bulk hydraulic conductivity can be estimated. Based on an evaluation of the long-term
inflow rate (132 gpm) and the estimated value of the pre-mining static head (6,670 feet),
the estimated bulk hydraulic conductivity of the Lake Valley and the Oswaldo
Formations is approximately 5.5x106 cm/sec. This value is in good agreement with the
geometric mean of hydraulic conductivities measured by single borehole tests performed
in the Lake Valley Formation.
If no new mining or expansion occurs and dewatering ceases, it is estimated that it would
take approximately 38 years to flood the underground workings to an approximate
elevation of 6,500 feet. The calculations used in this estimate are presented in
Attachment E3.
Cobre Mining Company, Inc. Shepherd Miller. Inc.
plIOOO29,n-drnft-rcWsafcippmdix-eIappc-cdiIc,J.doc E— 1 6 December 1999

2.1.4 Continental Pit’
Currently (circa 1997), no springs or seeps exist in the Continental Pit except during
precipitation events. The task of mapping seeps during precipitation events is on-going
but is highly dependent on the weather. Precipitation and runoff collected in the pit
bottom flows through historical adits to the underground workings, where it eventually is
collected in the underground sumps. The evaluation presented below is based on an
analysis performed in 1997.
If no new mining or expansions occur at the Continental Pit, modeling results indicate
that a pit lake will form in the Continental Pit after water levels have recovered from
previous dewatering of the underground workings. The pit lake would develop over a
time frame of approximately 35 years after water level recovery from underground
dewatering. The lake would probably be terminal (i.e., ground water will not flow away
from the lake), have a final stage elevation of approximately 6,523 feet, a depth of
approximately 43 feet, and a surface area of approximately 20 acres. After the pit lake
has reached steady state, the maximum drawdown around the pit lake is predicted to be
approximately 147 feet and the radius of the 1-foot drawdown contour is expected to be
approximately 1,500 feet from the center of the pit.
Figure E-17 shows the conceptual steady-state water balance model for the Continental
Pit lake. Table E-1 presents the pit inflows and outflows predicted by the pit lake
modeling. Attachment E4 provides a complete description of the inputs and calculations
used to estimate the final pit lake parameters.
‘At the time of publication, expansion of the Continental Pit has been put on hold until a new development
plan is created. Mining is not expected to resume in the Continental Pit in the near future. Therefore, no
updates to the 1997 hydrologic analyses have been conducted for this report.
Cobre Mining Company, Inc. Shepherd Miller, Inc
E— 17 December 1999

Table E-1 Predicted Steady-State Water Balance Components of the ContinentalPit Lake
COMPONENT PREDICTED FLOW RATE
gpm (acre-feet/yr)
(A positive value indicates flow into the pitlake)
Ground Water Inflow 29.2 (47.2)
Surface Water Runoff into Pit Lake from 8.7 (14.0)Precipitation Falling on Pit Walls
Direct Precipitation into Pit Lake 28.5 (46.0)
Evaporation from Pit Lake Surface -86.9 (-140.3)
2.1.5 Hanover Mountain
Figure B-i 8 shows the cunent conceptual hydrologic model of Hanover Mountain. Flow
directions and hydraulic head contours are based on site-specific information from
monitoring wells (MW-iA and MW-i), multi-level pneumatic piezometers (PP-Oi,
PP-02, and PP-03), exploration borehole drilling, and Trauger (1972). Basically,
recharge upgradient in the Piflos Altos Range (leakage through Tertiary gravels) flows
through the Colorado Formation and discharges to the upper, weathered portion of the
Hanover Fierro Stock. The lower Colorado Formation (shale unit) and the Beartooth
Quartzite act as aquitards to vertical flow. This conceptualization is based on the low
permeability of the shale unit (short-term aquifer test for MW-i presented in Appendix
A), the confined conditions encountered in the Beartooth Quartzite during the installation
of PP-05, and observations in the underground workings (see Section 2.1.3). Enhanced
infiltration through weathered bedrock and fractures on Hanover Mountain creates a
slight ground water mound beneath the mountain. The Barringer Fault, located south and
southeast of Hanover Mountain, restricts deep ground water flow and causes ground
water to flow towards the higher permeability zones of the weathered Hanover Fierro
Cobre Mining Company. Inc. Shepherd Mil1er Inc.
p:lIOOO29reporr-drafl-rifcJappernliz-cWppe.edited.doc E— 1 8 December 1999

Stock and shallow alluvial aquifers. Current lateral ground water flow through the
proposed Hanover Pit area has been estimated by Darcy’s Law to be approximately 22
gpm2. The following assumptions were used to estimate this flow:
• A 500-foot-thick aquifer
• A width of 3,200 feet
• Hydraulic conductivity of l.6x105 cm/sec (0.045 ft/day), based on hydraulicconductivity values measured near Hanover Mountain
• Hydraulic gradient equal to 0.06, based on gradients observed near HanoverMountain.
2.1.6 Proposed Leach Pad Area
2.1.6.1 Fierro Leach Pad
In the current conceptual model of ground water flow in the Fierro Area, Quaternary
alluvium in the valleys of Poison Springs and magnetite dam drainages and weathered
granodiorite overlie competent granodiorite of the Hanover-Fierro Stock. The overlying
material exhibit permeabilities ranging from 1x10⁵ (at MW-25) to 7x10³ (at MW-24)
cm/sec (Appendix A), while the lower portions of the stock exhibit hydraulic
conductivities on the order of 1x10⁶ to 1x103 cm/sec. Based on the water balance of the
Tailings Pond and the conceptual model of the Tailings Pond and Fierro Area (Figure E
13), SMI estimates that the current ground water flow through the proposed Fierro Leach
Pad area is slightly over 100 gpm.
It is currently planned that the proposed Fierro Leach Pad will be built over the existing
Magnetite Tailings Dam. The Magnetite Tailings Dam has not been in use since the late
1970s, and piezometers completed in the magnetite dam went dry in 1996.
2 This is not the expected ground water inflow to Hanover Pit. Excavation and dewatering of the pit willresult in a much wider area of influence. This value is presented only to indicate the magnitude of groundwater flow in the pre-mining area.
Cobre Mining Company, Inc. Shepherd Miller, Inc.
E— 1 9 December 1999

4:
Present day inflows to the Magnetite Tailings Dam occur only from the infiltration of
direct precipitation, and, prior to standby, emergency discharges from processing
facilities. All other surface water is diverted around this facility. Current outflows
include evaporation and downward seepage from the bottom of the facility. Using a 30-
year data set from Ft. Bayard to represent average conditions, DBS&A (1999) predicted
that the uncovered Magnetite Tailings Pond receives 15.5 gpm (25.0 acre-ft/yr) of
precipitation (15.5 inlyr). Of this 15.5 gpm, 0.2 gpm (0.4 acre-ft/yr) becomes runoff, 9.8
gpm (15.8 acre-ft’yr) evaporates and 5.5 gpm (8.8 acre-ft/yr) infiltrates.
The average annual-rainfall value used in this analysis (15.5 in/yr) is less than average
annual rainfall used in analysis presented elsewhere in this report (18.3 inlyr). Scaling
the results based on the ratio of 18.3/15.5 results in the prediction that the uncovered
Magnetite Tailings Pond receives 18.3 gpm (29.5 acre-fi/yr) of precipitation. Of this 18.3
gpm, 0.3 gpm (0.5 acre-ft/yr) becomes runoff, 11.6 gpm (18.7 acre-ft/yr) evaporates and
6.4 gpm (10.4 acre-ft/yr) infiltrates.
2.2 Water Balance Components and Impacts at the End of Mining
Changes to the local surface water regime will take place after new mining and expansion
commences. Changes to the surface water regime (from current conditions) will consist
of diverting surface water runoff around the proposed Hanover Pit, the previously
proposed enlargement of the Continental Pit, the expanded South WRDF, and the Fierro
Leach Pad. The only additional changes in surface flow will be the loss of surface water
runoff captured by the proposed Hanover Open Pit and the Fierro Leach Pad. Prior to
new mining and expansion, a portion of this flow lost to surface water runoff would have
recharged the shallow alluvial aquifers, which could have ultimately recharged deeper
bedrock aquifers. During mining, this surface water runoff would be captured by mining
facilities (i.e., heap leach pad and pit dewatering systems) and used for mine process
water.
The runoff currently contributing to the Hanover Creek watershed from the proposed
expansion areas (Hanover Pit, South WRDF, and the Fierro Leach Pad) was estimated
Cobre Mining Co,npany. Inc. Shepherd Mil1er Inc.
pIOOO2rcpon-drafl-rcvircdnppendL-cIappc-edhs&doc E—20 December 1999

using the SCS method of rainfall abstractions (SCS curve number method presented in
Attachment El). Combined, the areas from the Hanover Pit and Fierro Leach Pad
currently contribute approximately 3.2 gpm to the Hanover Creek watershed. (The post
1999 expansion of the South WRDF is small and not included in the analysis). With the
exception the South WRDF, runoff that would have occurred from these areas will no
longer contribute to the watershed following mine closure.
During new mining and previously planned expansion, changes to the ground water flow
regime would include dewatering at the Hanover Pit, possible dewatering in the
Continental Pit, increased dewatering in the Underground Workings, and increased
process water pumped from the Cron Ranch water supply wells (see Appendix B). On
average, Cobre plans to use approximately 900 gpm (1,452 acre-feet/yr) for its mining
activities over an estimated mine life of 10 years. As mining progresses, ground water
flows into the open pits and Underground Workings would increase and the water
removed during dewatering could be used as process water, reducing the amount pumped
from the other sources.
2.2.1 Tailings Pond
Components of the current (circa 1997) water balance for the Tailings Pond are discussed
in Section 2.1.1. Estimates of future process flow rates (e.g., tailings production rates and
decant sump pumping rates) are not available. However, predictions of the end-of-
mining (i.e., immediately following mining) inflows and outflows associated with the
Tailings and Reclaim Ponds can be based on ratios of the proposed increases in area and
elevation of the Tailings Pond. Natural inflows and outflows at the end of mining are
estimated to be as follows:
• Direct precipitation (256 gpm)
• Evaporation (760 gpm)
• Leakage (362 gpm).
Cobre Mining Company. Inc. Shepherd Miller. Inc.
E—2 1 December 1999

Of the estimated 362 gpm leakage, approximately 345 gpm would flow downvalley
toward the Fierro area and approximately 17 gpm would seep downward into the bedrock
aquifer. In order to sustain these flow rates, Cobre would have to increase their milling
production approximately 300 percent over 1997 rates, and the previously planned
mining production rates are not expected to increase by this much. Therefore, this
estimate is probably overly conservative. Attachment E2 presents the calculations used
to estimate inflows and outflows.
2.2.2 Waste Rock Disposal Facilities
2.2.2.1 South Waste Rock Disposal Facility
Inflow to the end-of-mining (i.e., immediately after mining and before reclamation) South
WRDF will consist of infiltration of direct precipitation. All other surface water will be
diverted around this facility. End-of-mining water outflows from the South WRDF will
include evaporation, seepage from the East WRDF Seep, runoff, and deep percolation
through the facility. In order to deterrriine the various end-of-mine water balance
components, the unit rates for the current uncovered South WRDF were applied to the
uncovered end-of-mining South WRDF. Using this approach, it was predicted that on the
end-of-mining South WRDF would receive 264.9 gpm of precipitation (15.5 in!yr). Of
this 264.9 gpm, 169.2 gpm would evaporate and 97.4 gpm would infiltrate. For
conservatism, it was assumed that none of the precipitation would become runoff.
The average annual rainfall value used in this analysis (15.5 inlyr) is less than average
annual rainfall used in analyses presented elsewhere in this report (18.3 inlyr). Scaling the
results by the ratio of 18.3/15.5 results in the prediction that the end-of-mining South
WRDF would receive 312.8 gpm (504.8 acre-ft/yr) of precipitation. Of this 312.8 gpm,
199.8 gpm (322.4 acre-ft/yr) would evaporate and 115.0 gpm (185.6 acre-ft/yr) would
infiltrate.
Cobre Mining Company. Inc. Shepherd Miller. Inc.
E-22 December 1999

2.2.2.2 West Waste Rock Disposal Facility
Inflow to the end-of-mining (i.e., immediately after mining and before reclamation) West
WRDF will consist of infllfration of direct precipitation. All other surface water will be
diverted around this facility. End-of-mining water outflows from the West WRDF will
include evaporation, runoff, and deep percolation through the facility. Since no changes
are planned for the West WRDF the water balance for the current uncovered West WRDF
is the same as the water balance for the end-of-mine West WRDF (See Section 2.1.2.2).
2.2.3 Underground Workings
The evaluation presented below is based on the 1997 planned expansion and the resulting
analysis performed in 1997 and does not include water exiting the underground workings
via ventilation shafts. The expanded underground workings would progress
approximately 200 feet deeper and 7,500 feet laterally over the current configuration.
The workings were not expected to intersect new formations; therefore, the previously
estimated bulk hydraulic conductivity (5.5x10 cm!sec) associated with the current
dewatering of the workings is considered appropriate for predicting future inflows to the
underground sumps. The estimated end-of-mining dewatering rate from the underground
workings is between 170 and 500 gpm. Figure E-19 shows the predicted drawdown cone
due to dewatering at the end of mining. Below the mine, the water level will be
depressed to about 1,450 feet below ground surface (corresponding to the final sump
elevation of 5,350 feet). At the end of mining, the radial distance to the 1-foot drawdown
contour is estimated to be approximately 5,500 feet. The calculations used to estimate
this radial distance are presented in Attachment E3.
2.2.4 Continental Pit
The evaluation presented below is based on the 1997 proposed expansion and associated
analysis performed in 1997. At the end of mining, assuming that ground water levels
have recovered from dewatering of the underground workings, the ground water level
below the Continental Pit would be about 760 feet below ground surface (corresponding
to a pit-bottom elevation of 6,000 feet). Evaporative losses would be approximately 161
Cobre Mining Company. Inc. Shepherd Mi11er Inc.
E—23 December 1999

gpm. The radial distance to the 1-foot drawdown contour would be approximately 3,000
feet from the center of the pit. Figure E-20 shows the predicted drawdown cone at the
end of mining for the expanded Continental Pit. The best estimated steady-state
dewatering rate from the Continental Pit at the end of mining was expected to range
between 60 and 120 gpm. The calculations used to estimate drawdown, radius of
influence, and dewatering rate are presented in Attachment E4.
2.2.5 Hanover Mountain
At the end of mining, the ground water level below Hanover Mountain will be
approximately 240 feet below the current average water table elevation of 6,798 feet. At
maximum drawdown, the maximum distance from the pit to the 1-foot drawdown
contour, will be approximately 8,100 feet from the center of the pit (see Figure E-21).
The expected end-of-mining dewatering rate from the Hanover Pit will be approximately
38 gpm (Attachment E5).
2.2.6 Fierro Leach Pad Area
End-of-mining inflows to the Fierro Area will consist of barren leach solution and direct
precipitation; all other runoff will be diverted around this facility. End-of-mining
outflows from the Fierro Area include evaporation and pregnant leach solution. After the
end of mining, this area will operate as zero discharge facility.
Water balance modeling conducted by Schafer & Associates (1996) for the formerly
proposed Humbolt Leach Pad predicted average seepage rates from the unreclaimed leach
pad to be approximately 65 gpm (8.1 in/yr) for an average precipitation year (18.3 inlyr).
The analysis for the formerly proposed pad also predicted an average runoff rate of 5 gpm
(0.6 inlyr), an average evaporation rate of 76 gpm (9.5 inlyr), and an average percolation
of 65 gpm (8.1 inlyr). Assuming that the 149 acre Fierro Area and the formerly proposed
150 acre Humbolt Area have similar configurations, the various water balance
components for the Fierro Leach Pad will be the same as those predicted for the Humbolt
Leach Pad.
Cobre Mining Company, Inc. Shepherd Mi11er Inc.
E—24 December 1999

2.3 Post-Closure Water Balance Components
Evaluation of post-closure water balance components is presented in the following
sections. The water balance component calculations are based on the following
assumptions:
• Dewatering of the underground workings, Continental Pit, and Hanover Pit has
ceased and inflows and outflows are at equilibrium.
• Reclamation of the waste rock disposal facilities has been completed and inflows
and outflows are at equilibrium.
• Inflows and outflows to and from the Tailings and Reclaim Ponds are at
equilibrium.
2.3.1 Tailings Pond
The conceptual model of the post-closure water balance is shown on Figure E-22. Post-
closure inflows and outflows associated with the Tailings Pond after closure will consist
of steady-state infiltration of direct precipitation, run-on from upgradient areas, runoff
from the reclaimed tailings, evapotranspiration from the reclaimed tailings, and long-term
downward seepage from the bottom of the facility. In order to determine the various
post-closure water balance components, the unit rates for the current covered Tailings
Pond (DBS&A, 1999) were scaled up to be consistent with previous Tailings Pond
analysis and applied to the covered post-closure Tailings Pond. Using this approach, it
was predicted that the covered 264-acre Tailings Pond would receive approximately
249.6 gpm of precipitation (18.3 in/yr) and approximately 0.6 gpm of run-on. Of this
250.2 gpm, approximately 1.9 gpm would run off approximately 224.6 gpm would
evaporate, and approximately 24.7 gpm would infiltrate. Assuming steady-state
conditions, the seepage from the bottom of the impoundment is equal to the infiltration.
Partitioning the seepage between flow to lower bedrock units and the Fierro Area, based
on the ratio of flows presented for the current and end-of-mine scenarios results in flow of
1.3 gpm and 23.4 gpm, respectively.
Cobre Mining Company, Inc. Shepherd Miller. Inc.
pJOOO29cpon-cfrnfl-rfvixeJ1ppcnthx.cappe-edited.doc E—2 5 December 1999

2.3.2 Waste Rock Disposal Facilities
2.3.2.1 South Waste Rock Disposal Facility
Inflow to the post-closure South WRDF will consist of steady-state infiltration of direct
precipitation. All other surface water will be diverted around this facility. Post-closure
water outflows from the South WRDF will include evaporation, seepage from the East
WRDF Seep, runoff, and deep percolation through the facility. In order to determine the
various post-closure water balance components, the unit rates for the current covered
South WRDF were applied to the covered post-closure South WRDF. Using this
approach, it was predicted that the covered South WRDF would receive 264.9 gpm
(427.6 acre-fi/yr) of precipitation (15.5 inlyr). Of this 264.9 gpm, 0.5 gpm (0.8 acre-ft/yr)
would run off, 237.6 gpm (383.5 acre-ft/yr) would evaporate and 29.1 gpm (47.0 acre
ft/yr) would infiltrate.
The average annual rainfall value used in this analysis (15.5 inlyr) is less than average
annual rainfall used in analyses presented elsewhere in this report (18.3 inlyr). Scaling the
results by the ratio of 18.3/15.5 results in the prediction that the post-closure South
WRDF would receive 312.8 gpm (504.8 acre-ft/yr) of precipitation. Of this 312.8 gpm,
0.6 gpm (1.0 acre-ft/yr) would run off, 280.5 gpm (452.8 acre-ft/yr) would evaporate and
34.4 gpm (55.5 acre-ft/yr) would infiltrate.
2.3.2.2 West Waste Rock Disposal Facility
Inflow to the post-closure West WRDF will consist of steady-state infiltration of direct
precipitation. All other surface water will be diverted around this facility. Post-closure
water outflows from the West WRDF will include evaporation, runoff, and deep
percolation through the facility. Using a 30-year data set from Ft. Bayard to represent
average conditions, DBS&A predicted that the covered West WRDF would receive 45.4
gpm (73.3 acre-ftlyr) of precipitation (15.5 inlyr). Of this 45.4 gpm, 0.1 gpm (0.2 acre
ft/yr) would run-off, 40.5 gpm (65.4 acre-fI/yr) would evaporate and 4.8 gpm (7.7 acre
ft/yr) would infiltrate. Scaling these values up as before results in 53.6 gpm of direct
precipitation to the reclaimed West WRDF of which: 0.12 gpm (0.24 acre-fi/yr) would
Cobre Mining Company, Inc. Shepherd Miller. Inc.
E—26 December 1999

run-off, 47.8 gpm (77.2 acre-ft/yr) would evaporate, and 5.7 gpm (9.1 acre-ft/yr) would
infiltrate.
2.3.3 Underground Workings
The evaluation presented below is based on the 1997 expansion plans and the associated
analysis performed in 1997. After mining and dewatering cease, it is estimated that the
expanded underground workings would flood to an elevation of 6,500 feet in
approximately 53 years. It could have taken 125 years to flood the underground
workings to the estimated pre-mining water table elevation of 6,665 feet. These times
would be much less if no further expansion takes place. The calculations used to
determine the flooding level and time to flood for the underground workings are
presented in Attachment E3.
2.3.4 Continental Pit
The evaluation presented below is based on the proposed 1997 expansion and associated
analysis performed in 1997. During the post-mining period, modeling results indicate
that a pit lake will form in the bottom of the Continental Pit. The pit lake is predicted to
reach a depth of 200 feet 8 years after the recovery of drawdown from the underground
workings. It could take approximately 60 years to reach a depth of 400 feet. The lake
will be terminal (i.e., ground water will not flow away from the lake), have a final stage
elevation of approximately 6,464 feet, a depth of approximately 464 feet, and a surface
area of approximately 56 acres. After the pit lake has reached steady state, the lake water
level will be about 206 feet lower than the estimated pre-mining water level. The
drawdown cone associated with the ultimate pit lake may extend up to 3,300 feet from the
center of the pit. Figure E-23 shows the conceptual water balance model for the
expanded Continental Pit at the end of mining. Table E-2 presents the pit inflows and
outflows used for the pit lake modeling. Attachment E4 provides a complete description
of the inputs and calculations used to determine the final pit lake parameters.
Cobre Mining C’oinpany, Inc. Shepherd Miller. Inc.
E—27 December 1999

Table E-2 Predicted Steady-State Water Balance Components of the Lake for
the Expanded Continental Pit
COMPONENT PREDICTED FLOW RATE
gpm (acre-feet/yr)
Positive value indicates flow into the pitlake
Ground Water Inflow 97.8 (157.9)
Ground Water Flow into Pit Lake from Above 64.0 (103.3)
Pit Lake Bottom (i.e., Seepage Face andHorizontal Ground Water_Flow)
Direct Precipitation into Pit Lake 64.1 (103.5)
Evaporation from Pit Lake Surface -195.5 (-315.5)
2.3.5 Hanover Mountain
After mining and dewatering cease, modeling results indicate that a pit lake will form in
the bottom of the Hanover Pit. Predictions indicate that the pit lake will be terminal (i.e.,
ground water will not flow away from the lake) and that it will take approximately 21
years to reach a steady-state elevation of 6716 feet. At this water level, the lake will have
a depth of approximately 156 feet and a surface area of approximately 22.3 acres.
Evaporative losses will be approximately 64.2 gpm. The maximum steady-state
drawdown at the pit lake is predicted to be approximately 157 feet. At the pit lake final
elevation, the distance to the 1-foot drawdown contour will be approximately 8,000 feet
from the center of the pit.
Figure E-24 shows the post-closure conceptual water balance model for the Hanover Pit.
Table E-3 presents the predicted pit inflows and outflows for the steady-state Hanover Pit
Lake. Attachment ES provides a complete description of the inputs and calculations used
to determine the final pit lake flow rates.
Cobre Mining Company, Inc. Shepherd Miller, Inc.
E—28 December 1999
Table E-3 Predicted Steady-State Water Balance Components of the Hanover
Pit Lake
COMPONENT PREDICTED FLOW RATE
gpm (acre-feet/yr)
Positive value indicates flow into the pitlake
Ground Water Flow into Pit Lake 26.8 (43.3)
Surface Water Runoff into Pit Lake from 10.0 (16.1)
Precipitation_Falling_on_Pit_Walls
Direct Precipitation into Pit Lake 27.6 (44.6)
Evaporation from Pit Lake Surface 64.2 (103.6)
2.3.6 Fierro Leach Pad
Post-closure inflows to the Fierro Leach Pad will consist only of infiltration from direct
precipitation through the reclaimed heap leach pad. All other surface water will be
diverted around this facility. Outflows will consist of long-term seepage from the
facility. This seepage will be treated passively if it does not meet water quality criteria.
For an average precipitation year (18.3 inlyr), water balance modeling conducted by
Schafer & Associates (1996) predicted average seepage rates from the formerly proposed
Humbolt Leach Pad to be less than 4 gpm (0.5 in/yr) under revegetated conditions. The
analysis for the formerly proposed pad also predicted an average runoff rate of 2.4 gpm
(0.3 inlyr), an average evapotranspiration rate of 141.6 gpm (17.7 inlyr), and an average
percolation of 1.6 gpm (0.2 inlyr). Assuming that the 149-acre Fierro Leach Pad and the
formerly proposed 150-acre Humbolt Leach Pad have similar configurations, the various
water balance components for the Fierro Leach Pad will be the same as those predicted
for the Humbolt Area.
Cobre Mining Company, Inc. Shepherd Miller, Inc.
grnnircp-drivcl 100029 E—2 9 December 1999

3.0 SUMMARY
During expansion mining, approximately 5.2 gpm of surface water runoff will no longer
contribute to recharge of the alluvial and bedrock aquifers. After Hanover Pit intersects
the water table and if the previously proposed Continental Pit and Underground
Workings expansions take place, ground water withdrawal in the area will increase from
132 gpm to approximately 380 gpm at the end of mining. This ground water can be used
to decrease the amount of process water pumped from the other water supplies.
After cessation of mining, terminal pit lakes are expected to form in the Continental and
Hanover Pits. The lake associated with the previously proposed expanded Continental Pit
will be approximately 464 feet deep, have a surface area of approximately 56 acres, and
take over 60 years to form. The Hanover Pit lake will be approximately 156 feet deep,
have a surface area of 22.3 acres, and take approximately 21 years to reach a steady state
elevation of 6716 feet. Evaporative losses will be approximately 161 gpm (260 acre
feet/yr) from the expanded Continental Pit lake and approximately 64.2 gpm (103.6 acre
feet/yr) from the Hanover Pit lake.
Cobre Mining Company, Inc. Shepherd Miller, Inc.
E—3 0 December 1999
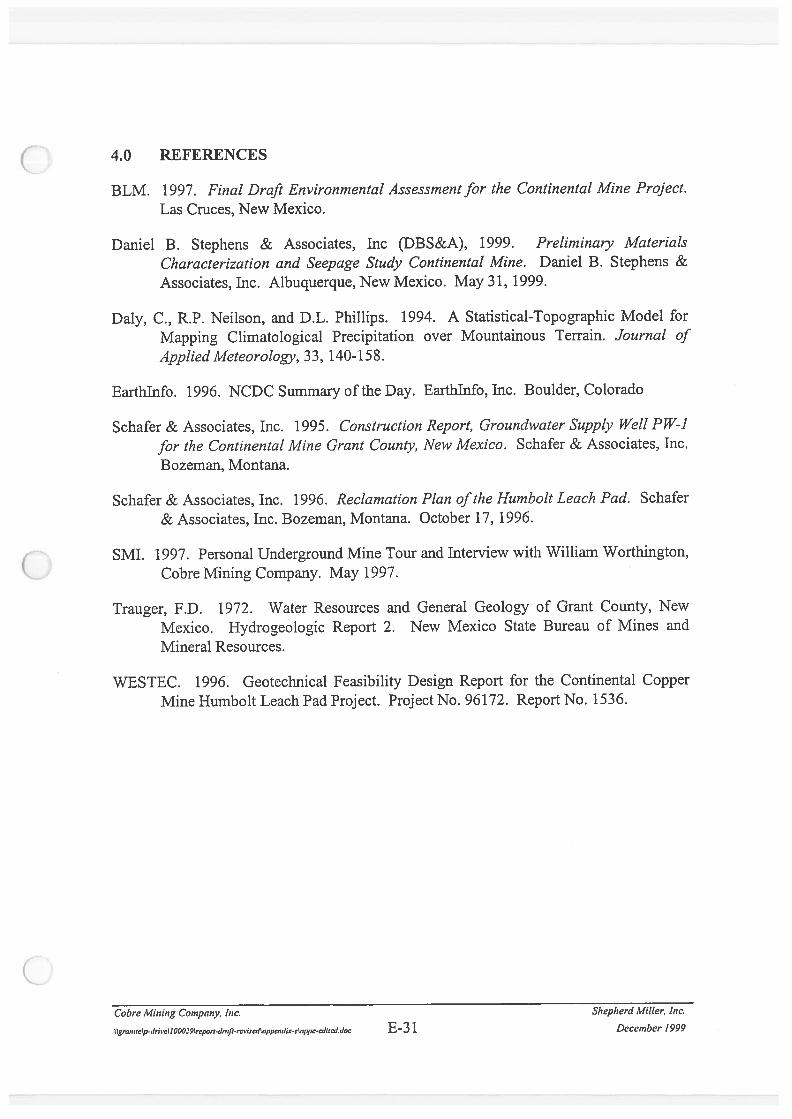
4.0 REFERENCES
BLM. 1997. Final Draft Environmental Assessment for the Continental Mine Project.
Las Cruces, New Mexico.
Daniel B. Stephens & Associates, Inc (DBS&A), 1999. Preliminary MaterialsCharacterization and Seepage Study Continental Mine. Daniel B. Stephens &Associates, Inc. Albuquerque, New Mexico. May 31, 1999.
Daly, C., R.P. Neilson, and D.L. Phillips. 1994. A Statistical-Topographic Model for
Mapping Climatological Precipitation over Mountainous Terrain. Journal of
Applied Meteorology, 33, 140-158.
Earthlnfo. 1996. NCDC Summary of the Day. Earthlnfo, Inc. Boulder, Colorado
Schafer & Associates, Inc. 1995. Construction Report, Groundwater Suppiy Well PW-1
for the Continental Mine Grant County, New Mexico. Schafer & Associates, Inc.
Bozeman, Montana.
Schafer & Associates, Inc. 1996. Reclamation Plan of the Humbolt Leach Pad. Schafer
& Associates, Inc. Bozeman, Montana. October 17, 1996.
SMI. 1997. Personal Underground Mine Tour and Interview with William Worthington,
Cobre Mining Company. May 1997.
Trauger, F.D. 1972. Water Resources and General Geology of Grant County, New
Mexico. Hydrogeologic Report 2. New Mexico State Bureau of Mines and
Mineral Resources.
WESTEC. 1996. Geotechnical Feasibility Design Report for the Continental CopperMine Humbolt Leach Pad Project. Project No. 96172. Report No. 1536.
Cobre Mining Company, Inc. Shepherd Miller, Inc.
E—3 1 December 1999


![· 4500 O [Before] + [After] 350.0 500.0 Line|l Start Depth, m End Depth, m kPa/m Gradient, 2000 2300 1500 2000 Pressure HYDROSTATIC vs. 3000 kPa](https://cdn.vdocuments.mx/doc/165x107/5e6a91da9424303f51301dc0/4500-o-before-after-3500-5000-linel-start-depth-m-end-depth-m-kpam-gradient.jpg)
