Download - Feasibility of biohydrogen production by anaerobic co-digestion of food waste and sewage sludge
International Journal of Hydrogen Energy 29 (2004) 1607–1616www.elsevier.com/locate/ijhydene
Feasibility of biohydrogen production by anaerobicco-digestion of food waste and sewage sludge
Sang-Hyoun Kim, Sun-Kee Han, Hang-Sik Shin∗
Department of Civil and Environmental Engineering, Korea Advanced Institute of Science and Technology,373-1 Guseong-dong, Yuseong-gu, Daejeon 305-701, Republic of Korea
Accepted 24 February 2004
Abstract
Anaerobic co-digestion of food waste and sewage sludge for hydrogen production was performed in serum bottles undervarious volatile solids (VS) concentrations (0.5–5.0%) and mixing ratios of two substrates (0:100–100:0, VS basis). Throughresponse surface methodology, empirical equations for hydrogen evolution were obtained. The speci5c hydrogen productionpotential of food waste was higher than that of sewage sludge. However, hydrogen production potential increased as sewagesludge composition increased up to 13–19% at all the VS concentrations. The maximum speci5c hydrogen production potentialof 122:9 ml=g carbohydrate-COD was found at the waste composition of 87:13 (food waste:sewage sludge) and the VSconcentration of 3.0%. The relationship between carbohydrate concentration, protein concentration, and hydrogen productionpotential indicated that enriched protein by adding sewage sludge might enhance hydrogen production potential. The maximumspeci5c hydrogen production rate was 111:2 ml H2=g VSS=h. Food waste and sewage sludge were, therefore, considered as asuitable main substrate and a useful auxiliary substrate, respectively, for hydrogen production. The metabolic results indicatedthat the fermentation of organic matters was successfully achieved and the characteristics of the heat-treated seed sludge weresimilar to those of anaerobic spore-forming bacteria, Clostridium sp.? 2004 International Association for Hydrogen Energy. Published by Elsevier Ltd. All rights reserved.
Keywords: Anaerobic co-digestion; Food waste; Hydrogen; Protein; Sewage sludge; VS concentration
1. Introduction
Due to the limited resources and pollutants emission(CO2, CO, CnHm, SOx, NOx, ashes, etc.), fossil fuels shouldbe substituted with renewable and non-polluting energysources [1]. As a sustainable energy source with minimal orzero use of hydrocarbons and high-energy yield (122 kJ=g),hydrogen is a promising alternative to fossil fuels. In addi-tion, hydrogen can be directly used to produce electricitythrough fuel cells [2]. Since conventional physico-chemicalhydrogen production methods (e.g. water electrolysis orchemical cracking of hydrocarbons) require electricity de-rived from fossil fuel combustion, interest in biohydrogenproduction has increased signi5cantly [3]. Between two
∗ Corresponding author. Tel.: +82-42869-3613; fax: +82-42869-3610.
E-mail address: [email protected] (H.-S. Shin).
biological processes, fermentative processes that use widerange of organic substances are technically simpler than pho-tosynthetic processes [4]. Carbohydrates are the preferredsubstrate for fermentative hydrogen-producing bacteria suchas Clostridium species (sp.). Stoichiometrically, Clostrid-ium sp. can produce 2 moles of hydrogen with 1 mole ofn-butyrate or 4 moles of hydrogen with 2 moles of acetatefrom 1 mole of hexose [5]. In most cases, using solublede5ned substrates, hydrogen production yield and a ma-jor byproduct were 0.7–2:1 mole=hexoseconsumed and a ma-jor by-product was n-butyrate, respectively [6,7]. Hydrogenwas hardly produced from protein and lipid [8–10]. How-ever, protein was indispensable, sometimes, as a nitrogensource for the hydrogen production in both pure and mixedcultures [11–13].
Organic wastes may become a plentiful source ofinexpensive organic substrate for fermentative hydrogenproduction [4]; by which reduction and stabilization of
0360-3199/$ 30.00 ? 2004 International Association for Hydrogen Energy. Published by Elsevier Ltd. All rights reserved.doi:10.1016/j.ijhydene.2004.02.018
1608 S.-H. Kim et al. / International Journal of Hydrogen Energy 29 (2004) 1607–1616
organic wastes also can be accomplished. In recent years,some experimental results using municipal solid waste[8–10,14], food manufacturing waste [8,13,15,16], wasteactivated sludge [17,18] were reported. The maximum hy-drogen production potential and hydrogen production ratewere in the range of 49–298 ml H2=g carbohydrate-CODand 17–142 ml H2=g VSS=h, respectively. However, gen-eral guideline on optimum conditions such as water content,carbohydrate concentration, carbohydrate/protein balancewas not suFciently provided yet. Besides, there was nosystematic attempt at co-digestion of diGerent substrates,which might enhance hydrogen production.
Food waste and sewage sludge are the most abundant andproblematic organic solid wastes in Korea. The generationof food waste reaches about 11; 000 tons per day, accountingfor 23% of municipal solid wastes [19]. It is the major sourceof odor emanation, vermin attraction, toxic gas emissionand groundwater contamination in collection, transportationand land5ll of solid wastes due to the high organic con-centration (volatile solids/total solids: 0.8–0.9) and mois-ture content (75–85%). However, food waste might be suit-able for fermentative hydrogen production, because it is thecarbohydrate-rich and easily hydrolysable waste [20]. Onthe other hand, approximately 5700 tons of sewage sludgecakes are generated daily [19], of which 72% is disposed byocean dumping. However, it would be prohibited accordingto London Convention in recent future [21]. The enhance-ment of anaerobic digester is, therefore, urgent to reducethe amount of the sludge cakes and to improve the qualityfor reuse. Co-digestion of sludge with carbon-rich wastes isknown as an economic and feasible approach to retro5t con-ventional digesters [22,23]. If hydrogen can be produced byanaerobic fermentation of food waste with sewage sludge,they would be the important source for hydrogen productiondue to the amount.
In this work, the feasibility of anaerobic co-digestion offood waste and sewage sludge for hydrogen production was,therefore, carried out under various VS concentrations andmixing ratios. Response surface methodology employing afull quadratic model was then conducted to 5nd out the re-lationship between VS concentration, mixing ratio and hy-drogen production.
2. Materials and methods
2.1. Seed sludge
The seed sludge was taken from an anaerobic digesterin a local wastewater treatment plant. The pH, alkalinity,and volatile suspended solids (VSS) concentration of thesludge were 7.6, 2:83 g CaCO3=l, and 5:5 g=l, respectively.It was heat-treated at 90◦C for 10 min to inactivate hy-drogen consumers and to harvest spore-forming anaerobicbacteria [3].
Table 1Characteristics of substrates
Parameter Unit Food Sewagewaste sludge
Total solids % 15.9 5.0Volatile solids % 15.2 2.5Total COD g/l 158.4 31.9Soluble COD g/l 50.3 0.14Total carbohydrate g COD/l 84.9 5.0Total protein g COD/l 37.7 18.4Total Kjeldahl nitrogen g N/l 4.4 2.3Total VFApH 4.6 7.5Alkalinity g CaCO3=l 0.4 4.7
2.2. Substrate
The substrate was a mixture of food waste and sewagesludge. Food waste, sampled from a dining hall, was crushedby an electrical blender under anaerobic condition. Sewagesludge was taken from a gravity sludge thickener into whichprimary and secondary sludges were added at the sameamount of VS. All the substrates were 5ltered through astainless steel sieve (US Mesh No. 10 with correspondingsieve opening of 2:00 mm), of which the characteristics aresummarized in Table 1.
2.3. Operating procedure
The experiments were conducted using 415 ml Wheatonmedia lab bottles. A total of 32 bottles with diGerent volatilesolids (VS) concentrations and mixing ratios of food wasteand sewage sludge were simultaneously operated. Total VSconcentrations were controlled to be 0.5%, 1.0%, 1.5%,2.0%, 3.0%, and 5.0%. The mixing ratios of food wasteto sewage sludge were designed to be 100:0, 80:20, 60:40,40:60, 20:80, and 0:100 on VS basis; however, the experi-ments at 20:80, and 0:100 for VS 3.0%, and 40:60, 20:80,and 0:100 for VS 5.0% could not be conducted due to lowVS concentration of sewage sludge. Total carbohydrate andprotein concentrations, therefore, ranged 1.0–28:0 g COD=land 1.3–22:1 g COD=l, respectively. Seed sludge of 40 ml,appropriate amounts of food waste, and sewage sludge wereadded to individual bottles, while seed sludge and distilledwater were added to the blank reactor. Each bottle was sup-plemented with 200 mg of KH2PO4, 14 mg ofMgCl2·4H2O,2 mg of Na2MoO4 ·4H2O, 2 mg of CaCl2 · 2H2O, 2:5 mg ofMnCl2 ·6H2O, and 10 mg of FeCl2 ·4H2O, which was mod-i5ed from Lay et al. [14]. NaHCO3 was also added to adjusttotal carbohydrate/alkalinity ratio to 1:0 ± 0:1. Each bottlewas then 5lled to 200 ml with distilled water and pH wasadjusted to 6.0 using either 1 M HCl or 1 M KOH. Sub-sequently, the headspaces of the bottles were Lushed withN2 gas for 1 min and the bottles were tightly sealed using
S.-H. Kim et al. / International Journal of Hydrogen Energy 29 (2004) 1607–1616 1609
open-top screw caps with rubber septa. The bottles werethen placed in a reciprocating shaker at 35◦C and 100 rpm.The biogas production was determined using a glass syringeof 20–200 ml [24]. At the same time, gas composition wasmeasured and the sample from the supernatant was taken toanalyze pH and organic concentrations. During cultivation,if the pH value was out of 5.0–6.0, it was adjusted usinginjection of either 1 M HCl or 1 M KOH by syringes.
2.4. Analytical methods
Hydrogen content in biogas was measured by a gas chro-matography (GC, Gow Mac series 580) using a thermalconductivity detector and a 1:8 m × 3:2 mm stainless-steelcolumn packed with molecular sieve 5A with N2 as a car-rier gas. The contents of CH4, N2, and CO2 were measuredusing a GC of the same model noted previously with a1:8 m × 3:2 mm stainless-steel column packed with pora-pak Q (80/100 mesh) using helium as a carrier gas. Thetemperatures of injector, detector, and column were keptat 80◦C, 90◦C, and 50◦C, respectively, in both GCs. VFA(C2–C6), and lactate were analyzed by a high performanceliquid chromatograph (Spectrasystem P2000) with anultraviolet (210 nm) detector and an 300 mm × 7:8 mmAminex HPX-97H column using H2SO4 of 0:005 M asmobile phase. Aliphatic alcohol was determined using an-other high performance liquid chromatograph (DX-600,Dionex) with an electrochemical detector (ED50A) and an250 mm × 4 mm Dionex CarboPac PA10 column usingNaOH of 0:01 M as mobile phase. The liquid samples werepretreated with 0:45 �m membrane 5lter before injectionto both HPLCs. Chemical oxygen demands (COD), Sus-pended solids (SS), VSS, TKN, ammonia, and pH weredetermined according to Standard Methods [25]. Carbohy-drate was determined by the colorimetric method of Duboiset al. [26] with wavelength at 480, 484 and 490 nm us-ing glucose as standard. Total protein was calculated fromorganic nitrogen (9:375 g COD=g organic nitrogen) [27].
2.5. Assay methods
The hydrogen production curve was 5tted to a modi-5ed Gompertz equation (1), which was used as a suitablemodel for describing the hydrogen production in batch tests[28–30].
H = P × exp[− exp
{Rm
P(− t)e + 1
}]; (1)
where H was cumulative hydrogen production (ml), P wasultimate hydrogen production (ml), Rm was hydrogen pro-duction rate (ml/day), was lag-phase time (days), and ewas exponential 1.
In many biological 5elds, the basic knowledge of phe-nomena is insuFcient to build a mechanistic model. In thiscase, response surface methodology, a collection of empir-ical models and statistical analyses, can play an extremely
important role in elucidating basic mechanisms in complexsituations and thus providing better process design and con-trol [31]. In this study, the eGects of VS concentrations andmixing ratios of food waste and sewage sludge on biohy-drogen production were analyzed using the full quadraticmodel as shown below [32].
Y = 0 + 1x1 + 2x2 + 11x21 + 22x
22 + 12x1x2; (2)
where Y was the predicted response, x1 and x2 were indepen-dent variables, 0 was the oGset term, 1 and 2 were linearcoeFcients, 11 and 22 were squared coeFcients, and 12was the interaction coeFcient.
All the parameters in Eqs. (1) and (2) were evaluatedusing the ‘Fit curve’ function with a Newtonian algorithm inSigmaplot 2001. In order to minimize the sum of the squareerrors (SSE) between the experiment and the estimation 100iterations were made. The parameters were diagnosed bySSE, correlation coeFcient (R2), standard errors (SE), 95%con5dence limits, t-values of the parameters, and F-test. Theresponse surface contour plots were also constructed usingSigmaplot 2001.
3. Results and discussion
3.1. E6ects of VS concentrations and mixing ratioson fermentative hydrogen production
Hydrogen was not produced in seven reactors includ-ing the blank in which no food waste was added orcarbohydrate concentration was lower than 2:0 g COD=l.The cumulative hydrogen production curves from the 25hydrogen-producing reactors were well described by Eq.(1). All the correlation coeFcients, R2, were larger than0.984 as shown in Table 2. Additionally, all the t-valuesfor parameters were larger than t0:025;5 = 2:571 (table value)(data not shown).
The speci5c hydrogen production potential (ml/gcarbohydrate-COD) was obtained from P and the carbohy-drate added. The obtained values were, then, subjected tothe response surface analysis to evaluate the relationshipbetween food waste composition (x1), VS concentration(x2), and the speci5c hydrogen production potential, andthey generated the following:
(Speci5c H2 production potential)
=− 39:793 + 2:069x1 + 48:431x2
−0:011x21 − 8:103x22 − 0:015x1x2
(R2 = 0:898; F = 31:52): (3)
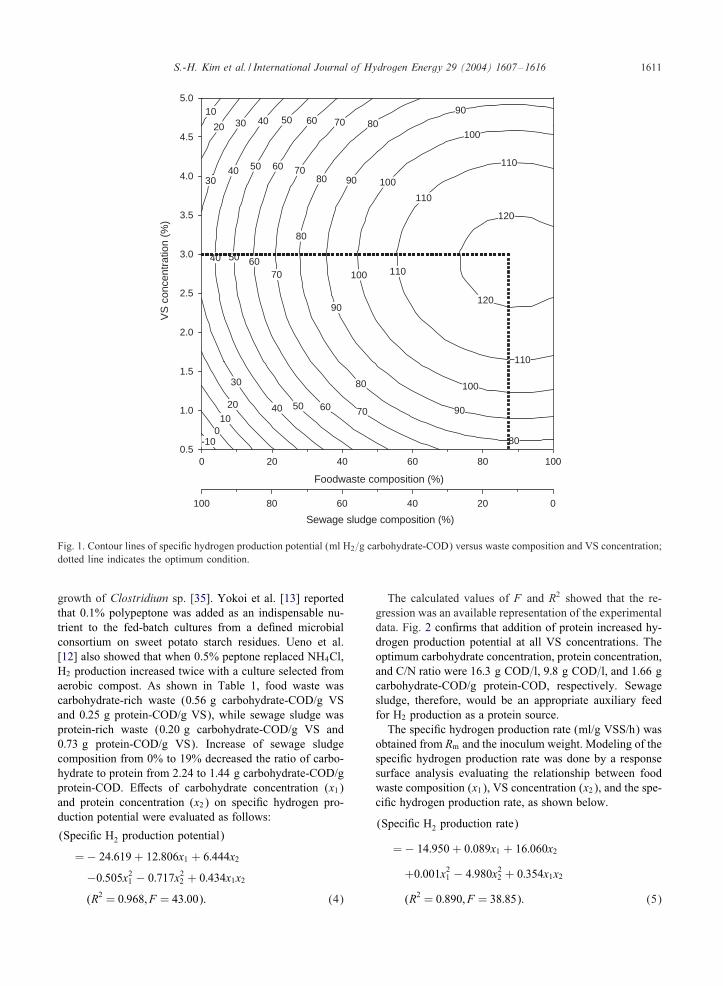
The calculated values of F were greater than F0:05;5;25 =2:60 (table value), which meant that statistically signi5-cant regression models were obtained [32]. Fig. 1 illus-trates that the speci5c hydrogen production potential wasfound to be higher than 75:2 ml=g carbohydrate-COD at
1610 S.-H. Kim et al. / International Journal of Hydrogen Energy 29 (2004) 1607–1616
Table 2Kinetic parameters on hydrogen production calculated from Eq. (1)
VS Food waste Carbohydrate Protein P Rm R2
(%) (%, VS basis) (g COD/l) (g COD/l) (ml H2) (ml/day) (days)
5.0 100 28.0 12.5 339.7 596.6 0.23 0.9935.0 80 24.4 17.3 308.0 367.0 0.23 0.9935.0 60 20.8 22.1 146.3 139.9 0.09 0.9943.0 100 16.8 7.5 355.1 504.2 0.28 0.9993.0 80 14.6 10.4 347.2 419.8 0.26 0.9933.0 60 12.5 13.3 212.5 290.4 0.15 0.9993.0 40 10.3 16.1 48.6 78.9 0.12 0.9992.0 100 11.2 5.0 208.9 359.0 0.78 0.9922.0 80 9.8 6.9 186.5 369.6 0.49 0.9932.0 60 8.3 8.8 120.0 248.2 0.34 0.9992.0 40 6.9 10.8 38.4 71.3 0.12 0.9992.0 20 5.4 12.7 8.8 29.0 0.16 0.9992.0 0 4.0 14.6 — — — —1.5 100 8.4 3.8 119.5 79.2 0.24 0.9881.5 80 7.3 5.2 105.7 150.5 0.35 0.9991.5 60 6.2 6.6 55.2 110.9 0.25 0.9941.5 40 5.2 8.1 28.8 29.0 0.23 0.9901.5 20 4.1 9.5 4.7 7.9 0.24 0.9921.5 0 3.0 11.0 — — — —1.0 100 5.6 2.5 74.4 81.8 0.44 0.9981.0 80 4.9 3.5 69.4 84.5 0.36 0.9991.0 60 4.2 4.4 47.4 71.3 0.37 0.9941.0 40 3.4 5.4 17.6 44.9 0.14 0.9921.0 20 2.7 6.3 1.9 2.6 0.27 0.9861.0 0 2.0 7.3 — — — —0.5 100 2.8 1.3 35.9 73.9 0.28 0.9990.5 80 2.4 1.7 18.2 21.1 0.00 0.9840.5 60 2.1 2.2 3.4 7.9 0.05 0.9930.5 40 1.7 2.7 — — — —0.5 20 1.3 3.2 — — — —0.5 0 1.0 3.7 — — — —
Blank — — — —
all VS concentrations and waste composition of 100:0(food waste:sewage sludge). The potential increased upto 121:6 ml=g carbohydrate-COD as VS concentrationincreased up to 3.0%. It decreased as VS concentrationincreased further, which might be due to product inhibitionby H2 and VFAs [28,33]. Sewage sludge showed lower hy-drogen production potential than food waste; the maximumvalue was 32:6 ml=g carbohydrate-COD. Less hydrogenproduction from sewage sludge might be caused by hardlyhydrolysable organics contained in the sludge [17].
However, the hydrogen production potential was en-hanced when the sewage sludge was added by 20% exceptat the VS 0.5% (Table 2). Eq. (3) also estimated that addi-tion of sewage sludge up to 13–19% (VS basis) increasedthe hydrogen production potential at all the VS concentra-tions. The maximum speci5c hydrogen production potential(122:9 ml=g carbohydrate-COD) was, therefore, found atthe waste composition of 87:13 and the VS concentrationof 3.0%. At the condition, hydrogen production based onVS was 60:1 ml=g VS, which was in the range of reported
maximum values (21–91 ml=g VS) for organic wastessuch as bean curd manufacturing waste, cabbage, rice, ricebran, and wheat bran [8,9,15]. Hawkes et al. [3] suggestedthat hydrogen production using concentrated substrateshigher than 1% TS would be feasible for suitable energyproduction system. These results, therefore, showed thatfood waste supplemented with sewage sludge could be anappropriate source for hydrogen production.
It was reported that adequate control of inorganic nu-trients could enhance biohydrogen production yield [3].However, in this study, the concentrations of nutrients suchas phosphorus and iron were suFciently supplementedin all cases [7,29]. The ratio of carbohydrate to nitrogenranged from 2.2 to 19:2 g carbohydrate-COD/g TKN-Nwithout an external dose of nitrogen, indicating that nitro-gen content was also suFcient [6,33,34]. Enriched proteinwould be an explanation for the enhanced hydrogen pro-duction by adding sewage sludge. It was well known thatprotein such as peptone or yeast extract was a better nitro-gen source than ammonium salts or urea for activation and
S.-H. Kim et al. / International Journal of Hydrogen Energy 29 (2004) 1607–1616 1611
Sewage sludge composition (%)
020406080100
Foodwaste composition (%)
0 20 40 60 80 100
VS
con
cent
ratio
n (%
)
0.5
1.0
1.5
2.0
2.5
3.0
3.5
4.0
4.5
5.090
100
110
120
120
110
110
100
100
90
90
80
80
80
110
70
70
80
100
60
60
90
7060
50
50
80
40
40
70
50
30
60
40
20
50
30
10
40
20
0
30
10
-10
Fig. 1. Contour lines of speci5c hydrogen production potential (ml H2=g carbohydrate-COD) versus waste composition and VS concentration;dotted line indicates the optimum condition.
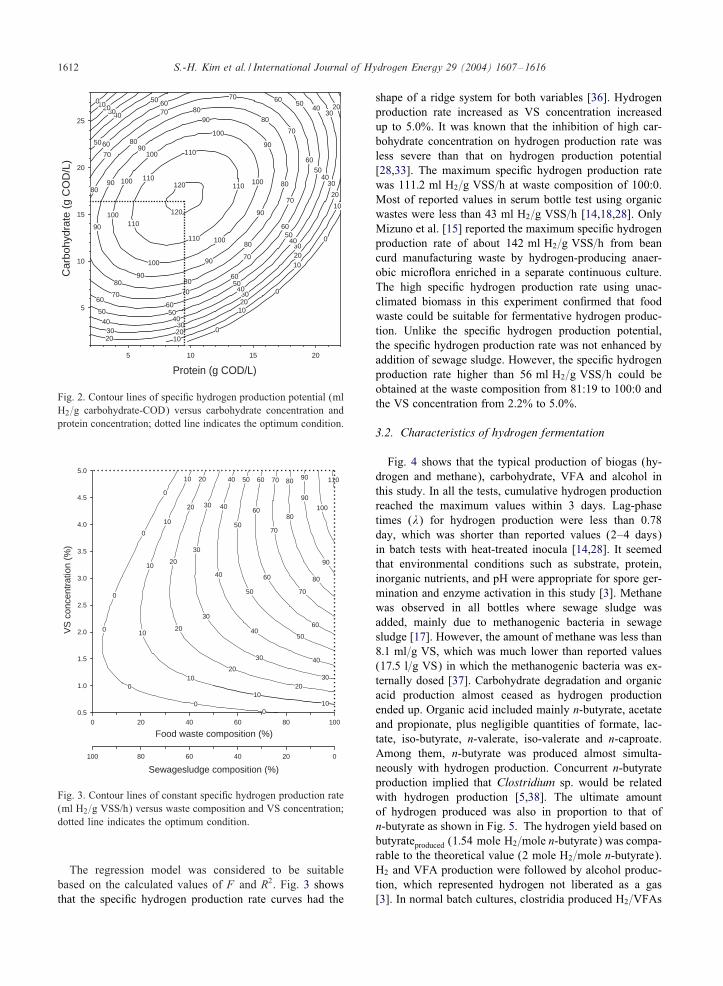
growth of Clostridium sp. [35]. Yokoi et al. [13] reportedthat 0.1% polypeptone was added as an indispensable nu-trient to the fed-batch cultures from a de5ned microbialconsortium on sweet potato starch residues. Ueno et al.[12] also showed that when 0.5% peptone replaced NH4Cl,H2 production increased twice with a culture selected fromaerobic compost. As shown in Table 1, food waste wascarbohydrate-rich waste (0:56 g carbohydrate-COD/g VSand 0:25 g protein-COD/g VS), while sewage sludge wasprotein-rich waste (0:20 g carbohydrate-COD/g VS and0:73 g protein-COD/g VS). Increase of sewage sludgecomposition from 0% to 19% decreased the ratio of carbo-hydrate to protein from 2.24 to 1:44 g carbohydrate-COD/gprotein-COD. EGects of carbohydrate concentration (x1)and protein concentration (x2) on speci5c hydrogen pro-duction potential were evaluated as follows:
(Speci5c H2 production potential)
=− 24:619 + 12:806x1 + 6:444x2
−0:505x21 − 0:717x22 + 0:434x1x2
(R2 = 0:968; F = 43:00): (4)
The calculated values of F and R2 showed that the re-gression was an available representation of the experimentaldata. Fig. 2 con5rms that addition of protein increased hy-drogen production potential at all VS concentrations. Theoptimum carbohydrate concentration, protein concentration,and C/N ratio were 16:3 g COD=l, 9:8 g COD=l, and 1:66 gcarbohydrate-COD/g protein-COD, respectively. Sewagesludge, therefore, would be an appropriate auxiliary feedfor H2 production as a protein source.
The speci5c hydrogen production rate (ml/g VSS/h) wasobtained from Rm and the inoculum weight. Modeling of thespeci5c hydrogen production rate was done by a responsesurface analysis evaluating the relationship between foodwaste composition (x1), VS concentration (x2), and the spe-ci5c hydrogen production rate, as shown below.
(Speci5c H2 production rate)
=− 14:950 + 0:089x1 + 16:060x2
+0:001x21 − 4:980x22 + 0:354x1x2
(R2 = 0:890; F = 38:85): (5)
1612 S.-H. Kim et al. / International Journal of Hydrogen Energy 29 (2004) 1607–1616
Protein (g COD/L)
5 10 15 20
Car
bohy
drat
e (g
CO
D/L
)
5
10
15
20
25
20
2020
20
20
20
10
10
10
10
0
0
0
3030
30
30
30
30
40 40
40
40
40
40
50 50
50
50
50
50
6060
60
60
60
60
70
70
70
70
70
70
7070
80 80
80
80
8080
8090
90
90
90
90
90
90
100
100
100
100
100
100
110
110
110
110
120
120
60
60
50
50
110
4030
100
20
90
100
80
Fig. 2. Contour lines of speci5c hydrogen production potential (mlH2=g carbohydrate-COD) versus carbohydrate concentration andprotein concentration; dotted line indicates the optimum condition.
Sewagesludge composition (%)
020406080100
Food waste composition (%)0 20 40 60 80 100
VS
con
cent
ratio
n (%
)
0.5
1.0
1.5
2.0
2.5
3.0
3.5
4.0
4.5
5.0110
100
90
90
80
80
70
70
60
60
60
50
50
50
40
40
40
40
30
30
30
30
20
20
20
20
1010
10
10
10
908070
00
0
0
605040
30
20
20
10
10
0
0
0
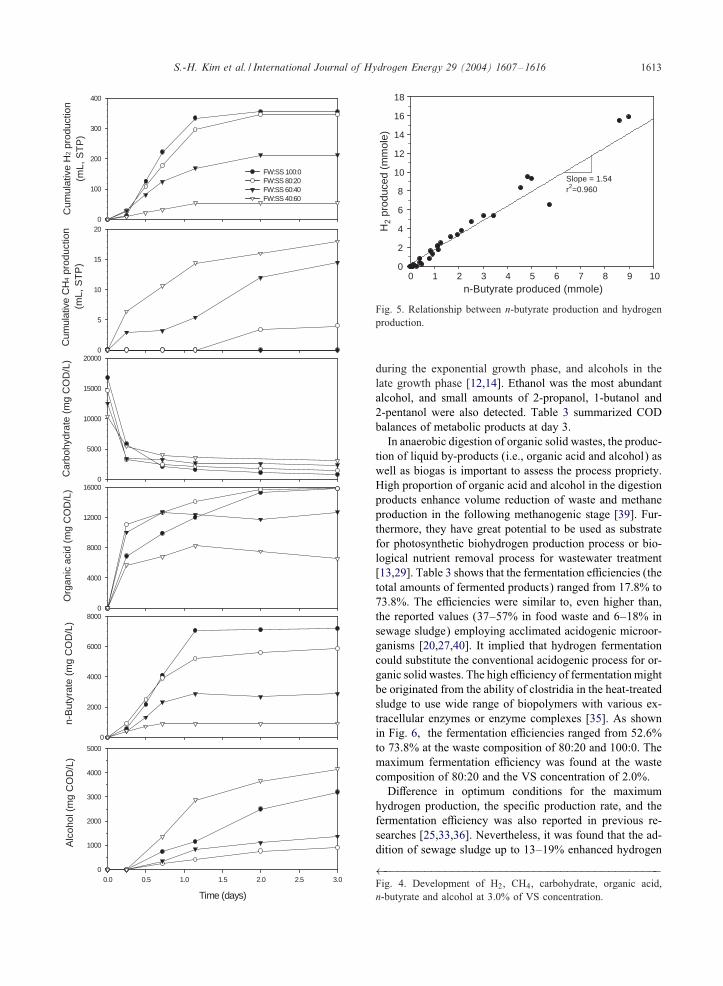
Fig. 3. Contour lines of constant speci5c hydrogen production rate(ml H2=g VSS/h) versus waste composition and VS concentration;dotted line indicates the optimum condition.
The regression model was considered to be suitablebased on the calculated values of F and R2. Fig. 3 showsthat the speci5c hydrogen production rate curves had the
shape of a ridge system for both variables [36]. Hydrogenproduction rate increased as VS concentration increasedup to 5.0%. It was known that the inhibition of high car-bohydrate concentration on hydrogen production rate wasless severe than that on hydrogen production potential[28,33]. The maximum speci5c hydrogen production ratewas 111:2 ml H2=g VSS=h at waste composition of 100:0.Most of reported values in serum bottle test using organicwastes were less than 43 ml H2=g VSS=h [14,18,28]. OnlyMizuno et al. [15] reported the maximum speci5c hydrogenproduction rate of about 142 ml H2=g VSS=h from beancurd manufacturing waste by hydrogen-producing anaer-obic microLora enriched in a separate continuous culture.The high speci5c hydrogen production rate using unac-climated biomass in this experiment con5rmed that foodwaste could be suitable for fermentative hydrogen produc-tion. Unlike the speci5c hydrogen production potential,the speci5c hydrogen production rate was not enhanced byaddition of sewage sludge. However, the speci5c hydrogenproduction rate higher than 56 ml H2=g VSS=h could beobtained at the waste composition from 81:19 to 100:0 andthe VS concentration from 2.2% to 5.0%.
3.2. Characteristics of hydrogen fermentation
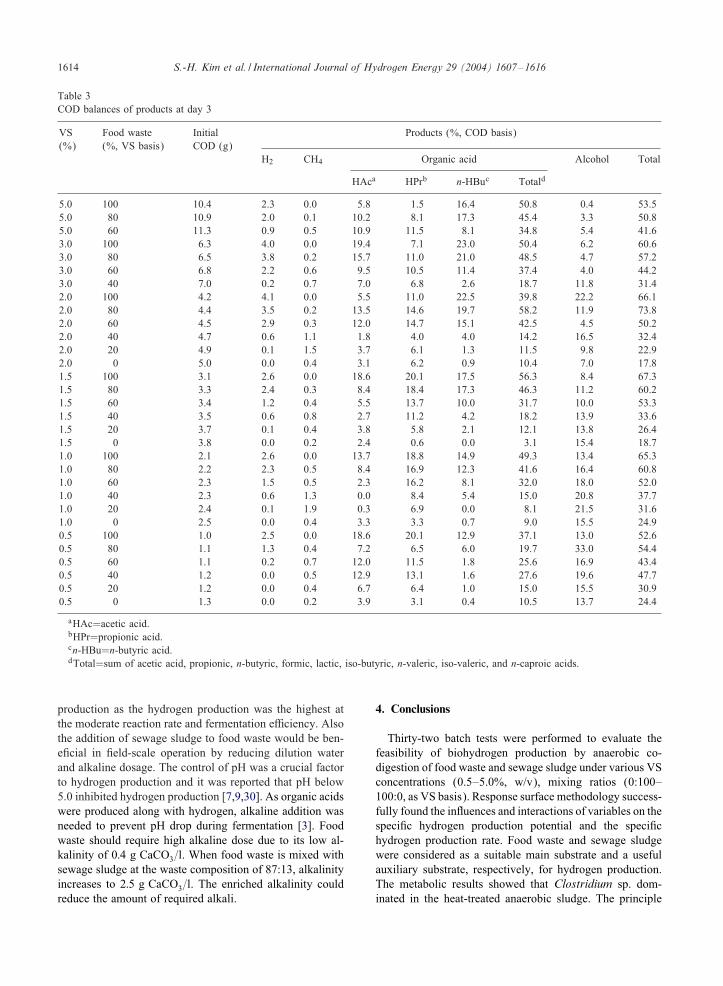
Fig. 4 shows that the typical production of biogas (hy-drogen and methane), carbohydrate, VFA and alcohol inthis study. In all the tests, cumulative hydrogen productionreached the maximum values within 3 days. Lag-phasetimes () for hydrogen production were less than 0.78day, which was shorter than reported values (2–4 days)in batch tests with heat-treated inocula [14,28]. It seemedthat environmental conditions such as substrate, protein,inorganic nutrients, and pH were appropriate for spore ger-mination and enzyme activation in this study [3]. Methanewas observed in all bottles where sewage sludge wasadded, mainly due to methanogenic bacteria in sewagesludge [17]. However, the amount of methane was less than8:1 ml=g VS, which was much lower than reported values(17:5 l=g VS) in which the methanogenic bacteria was ex-ternally dosed [37]. Carbohydrate degradation and organicacid production almost ceased as hydrogen productionended up. Organic acid included mainly n-butyrate, acetateand propionate, plus negligible quantities of formate, lac-tate, iso-butyrate, n-valerate, iso-valerate and n-caproate.Among them, n-butyrate was produced almost simulta-neously with hydrogen production. Concurrent n-butyrateproduction implied that Clostridium sp. would be relatedwith hydrogen production [5,38]. The ultimate amountof hydrogen produced was also in proportion to that ofn-butyrate as shown in Fig. 5. The hydrogen yield based onbutyrateproduced (1:54 mole H2=mole n-butyrate) was compa-rable to the theoretical value (2 mole H2=mole n-butyrate).H2 and VFA production were followed by alcohol produc-tion, which represented hydrogen not liberated as a gas[3]. In normal batch cultures, clostridia produced H2=VFAs
S.-H. Kim et al. / International Journal of Hydrogen Energy 29 (2004) 1607–1616 1613C
umul
ativ
e H
2 pr
oduc
tion
(mL,
ST
P)
0
100
200
300
400
FW:SS 100:0FW:SS 80:20FW:SS 60:40FW:SS 40:60
Cum
ulat
ive
CH
4 pr
oduc
tion
(mL,
ST
P)
0
5
10
15
20
Car
bohy
drat
e (m
g C
OD
/L)
0
5000
10000
15000
20000
Org
anic
aci
d (m
g C
OD
/L)
0
4000
8000
12000
16000
n-B
utyr
ate
(mg
CO
D/L
)
0
2000
4000
6000
8000
Time (days)
0.0 0.5 1.0 1.5 2.0 2.5 3.0
Alc
ohol
(m
g C
OD
/L)
0
1000
2000
3000
4000
5000
n-Butyrate produced (mmole)0 654321 10
H2
prod
uced
(m
mol
e)
0
2
4
6
8
10
12
14
16
18
Slope = 1.54r2=0.960
987
Fig. 5. Relationship between n-butyrate production and hydrogenproduction.
during the exponential growth phase, and alcohols in thelate growth phase [12,14]. Ethanol was the most abundantalcohol, and small amounts of 2-propanol, 1-butanol and2-pentanol were also detected. Table 3 summarized CODbalances of metabolic products at day 3.
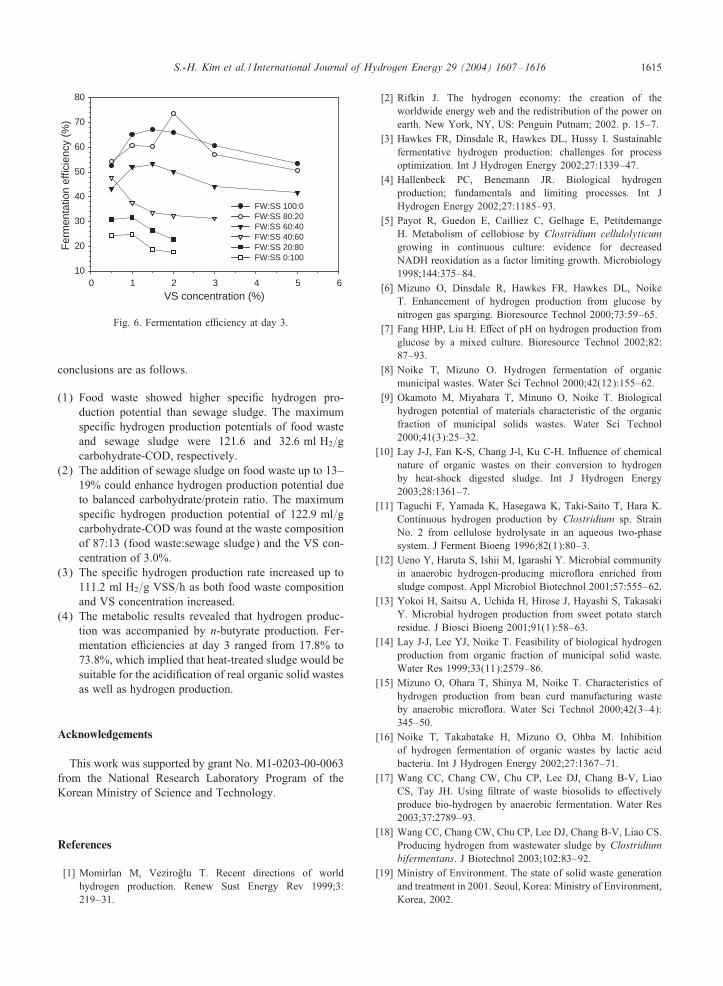
In anaerobic digestion of organic solid wastes, the produc-tion of liquid by-products (i.e., organic acid and alcohol) aswell as biogas is important to assess the process propriety.High proportion of organic acid and alcohol in the digestionproducts enhance volume reduction of waste and methaneproduction in the following methanogenic stage [39]. Fur-thermore, they have great potential to be used as substratefor photosynthetic biohydrogen production process or bio-logical nutrient removal process for wastewater treatment[13,29]. Table 3 shows that the fermentation eFciencies (thetotal amounts of fermented products) ranged from 17.8% to73.8%. The eFciencies were similar to, even higher than,the reported values (37–57% in food waste and 6–18% insewage sludge) employing acclimated acidogenic microor-ganisms [20,27,40]. It implied that hydrogen fermentationcould substitute the conventional acidogenic process for or-ganic solid wastes. The high eFciency of fermentation mightbe originated from the ability of clostridia in the heat-treatedsludge to use wide range of biopolymers with various ex-tracellular enzymes or enzyme complexes [35]. As shownin Fig. 6, the fermentation eFciencies ranged from 52.6%to 73.8% at the waste composition of 80:20 and 100:0. Themaximum fermentation eFciency was found at the wastecomposition of 80:20 and the VS concentration of 2.0%.
DiGerence in optimum conditions for the maximumhydrogen production, the speci5c production rate, and thefermentation eFciency was also reported in previous re-searches [25,33,36]. Nevertheless, it was found that the ad-dition of sewage sludge up to 13–19% enhanced hydrogen
←−−−−−−−−−−−−−−−−−−−−−−−−−−−−−−−−−−−−−−−−−Fig. 4. Development of H2, CH4, carbohydrate, organic acid,n-butyrate and alcohol at 3.0% of VS concentration.
1614 S.-H. Kim et al. / International Journal of Hydrogen Energy 29 (2004) 1607–1616
Table 3COD balances of products at day 3
VS Food waste Initial Products (%, COD basis)(%) (%, VS basis) COD (g)
H2 CH4 Organic acid Alcohol Total
HAca HPrb n-HBuc Totald
5.0 100 10.4 2.3 0.0 5.8 1.5 16.4 50.8 0.4 53.55.0 80 10.9 2.0 0.1 10.2 8.1 17.3 45.4 3.3 50.85.0 60 11.3 0.9 0.5 10.9 11.5 8.1 34.8 5.4 41.63.0 100 6.3 4.0 0.0 19.4 7.1 23.0 50.4 6.2 60.63.0 80 6.5 3.8 0.2 15.7 11.0 21.0 48.5 4.7 57.23.0 60 6.8 2.2 0.6 9.5 10.5 11.4 37.4 4.0 44.23.0 40 7.0 0.2 0.7 7.0 6.8 2.6 18.7 11.8 31.42.0 100 4.2 4.1 0.0 5.5 11.0 22.5 39.8 22.2 66.12.0 80 4.4 3.5 0.2 13.5 14.6 19.7 58.2 11.9 73.82.0 60 4.5 2.9 0.3 12.0 14.7 15.1 42.5 4.5 50.22.0 40 4.7 0.6 1.1 1.8 4.0 4.0 14.2 16.5 32.42.0 20 4.9 0.1 1.5 3.7 6.1 1.3 11.5 9.8 22.92.0 0 5.0 0.0 0.4 3.1 6.2 0.9 10.4 7.0 17.81.5 100 3.1 2.6 0.0 18.6 20.1 17.5 56.3 8.4 67.31.5 80 3.3 2.4 0.3 8.4 18.4 17.3 46.3 11.2 60.21.5 60 3.4 1.2 0.4 5.5 13.7 10.0 31.7 10.0 53.31.5 40 3.5 0.6 0.8 2.7 11.2 4.2 18.2 13.9 33.61.5 20 3.7 0.1 0.4 3.8 5.8 2.1 12.1 13.8 26.41.5 0 3.8 0.0 0.2 2.4 0.6 0.0 3.1 15.4 18.71.0 100 2.1 2.6 0.0 13.7 18.8 14.9 49.3 13.4 65.31.0 80 2.2 2.3 0.5 8.4 16.9 12.3 41.6 16.4 60.81.0 60 2.3 1.5 0.5 2.3 16.2 8.1 32.0 18.0 52.01.0 40 2.3 0.6 1.3 0.0 8.4 5.4 15.0 20.8 37.71.0 20 2.4 0.1 1.9 0.3 6.9 0.0 8.1 21.5 31.61.0 0 2.5 0.0 0.4 3.3 3.3 0.7 9.0 15.5 24.90.5 100 1.0 2.5 0.0 18.6 20.1 12.9 37.1 13.0 52.60.5 80 1.1 1.3 0.4 7.2 6.5 6.0 19.7 33.0 54.40.5 60 1.1 0.2 0.7 12.0 11.5 1.8 25.6 16.9 43.40.5 40 1.2 0.0 0.5 12.9 13.1 1.6 27.6 19.6 47.70.5 20 1.2 0.0 0.4 6.7 6.4 1.0 15.0 15.5 30.90.5 0 1.3 0.0 0.2 3.9 3.1 0.4 10.5 13.7 24.4
aHAc=acetic acid.bHPr=propionic acid.cn-HBu=n-butyric acid.dTotal=sum of acetic acid, propionic, n-butyric, formic, lactic, iso-butyric, n-valeric, iso-valeric, and n-caproic acids.
production as the hydrogen production was the highest atthe moderate reaction rate and fermentation eFciency. Alsothe addition of sewage sludge to food waste would be ben-e5cial in 5eld-scale operation by reducing dilution waterand alkaline dosage. The control of pH was a crucial factorto hydrogen production and it was reported that pH below5.0 inhibited hydrogen production [7,9,30]. As organic acidswere produced along with hydrogen, alkaline addition wasneeded to prevent pH drop during fermentation [3]. Foodwaste should require high alkaline dose due to its low al-kalinity of 0:4 g CaCO3=l. When food waste is mixed withsewage sludge at the waste composition of 87:13, alkalinityincreases to 2:5 g CaCO3=l. The enriched alkalinity couldreduce the amount of required alkali.
4. Conclusions
Thirty-two batch tests were performed to evaluate thefeasibility of biohydrogen production by anaerobic co-digestion of food waste and sewage sludge under various VSconcentrations (0.5–5.0%, w/v), mixing ratios (0:100–100:0, as VS basis). Response surface methodology success-fully found the inLuences and interactions of variables on thespeci5c hydrogen production potential and the speci5chydrogen production rate. Food waste and sewage sludgewere considered as a suitable main substrate and a usefulauxiliary substrate, respectively, for hydrogen production.The metabolic results showed that Clostridium sp. dom-inated in the heat-treated anaerobic sludge. The principle
S.-H. Kim et al. / International Journal of Hydrogen Energy 29 (2004) 1607–1616 1615
VS concentration (%)0 5 6
Fer
men
tatio
n ef
ficie
ncy
(%)
10
20
30
40
50
60
70
80
FW:SS 100:0FW:SS 80:20FW:SS 60:40FW:SS 40:60FW:SS 20:80FW:SS 0:100
4321
Fig. 6. Fermentation eFciency at day 3.
conclusions are as follows.
(1) Food waste showed higher speci5c hydrogen pro-duction potential than sewage sludge. The maximumspeci5c hydrogen production potentials of food wasteand sewage sludge were 121.6 and 32:6 ml H2=gcarbohydrate-COD, respectively.
(2) The addition of sewage sludge on food waste up to 13–19% could enhance hydrogen production potential dueto balanced carbohydrate/protein ratio. The maximumspeci5c hydrogen production potential of 122:9 ml=gcarbohydrate-COD was found at the waste compositionof 87:13 (food waste:sewage sludge) and the VS con-centration of 3.0%.
(3) The speci5c hydrogen production rate increased up to111:2 ml H2=g VSS=h as both food waste compositionand VS concentration increased.
(4) The metabolic results revealed that hydrogen produc-tion was accompanied by n-butyrate production. Fer-mentation eFciencies at day 3 ranged from 17.8% to73.8%, which implied that heat-treated sludge would besuitable for the acidi5cation of real organic solid wastesas well as hydrogen production.
Acknowledgements
This work was supported by grant No. M1-0203-00-0063from the National Research Laboratory Program of theKorean Ministry of Science and Technology.
References
[1] Momirlan M, VeziroUglu T. Recent directions of worldhydrogen production. Renew Sust Energy Rev 1999;3:219–31.
[2] Rifkin J. The hydrogen economy: the creation of theworldwide energy web and the redistribution of the power onearth. New York, NY, US: Penguin Putnam; 2002. p. 15–7.
[3] Hawkes FR, Dinsdale R, Hawkes DL, Hussy I. Sustainablefermentative hydrogen production: challenges for processoptimization. Int J Hydrogen Energy 2002;27:1339–47.
[4] Hallenbeck PC, Benemann JR. Biological hydrogenproduction; fundamentals and limiting processes. Int JHydrogen Energy 2002;27:1185–93.
[5] Payot R, Guedon E, Cailliez C, Gelhage E, PetitdemangeH. Metabolism of cellobiose by Clostridium cellulolyticumgrowing in continuous culture: evidence for decreasedNADH reoxidation as a factor limiting growth. Microbiology1998;144:375–84.
[6] Mizuno O, Dinsdale R, Hawkes FR, Hawkes DL, NoikeT. Enhancement of hydrogen production from glucose bynitrogen gas sparging. Bioresource Technol 2000;73:59–65.
[7] Fang HHP, Liu H. EGect of pH on hydrogen production fromglucose by a mixed culture. Bioresource Technol 2002;82:87–93.
[8] Noike T, Mizuno O. Hydrogen fermentation of organicmunicipal wastes. Water Sci Technol 2000;42(12):155–62.
[9] Okamoto M, Miyahara T, Minuno O, Noike T. Biologicalhydrogen potential of materials characteristic of the organicfraction of municipal solids wastes. Water Sci Technol2000;41(3):25–32.
[10] Lay J-J, Fan K-S, Chang J-l, Ku C-H. InLuence of chemicalnature of organic wastes on their conversion to hydrogenby heat-shock digested sludge. Int J Hydrogen Energy2003;28:1361–7.
[11] Taguchi F, Yamada K, Hasegawa K, Taki-Saito T, Hara K.Continuous hydrogen production by Clostridium sp. StrainNo. 2 from cellulose hydrolysate in an aqueous two-phasesystem. J Ferment Bioeng 1996;82(1):80–3.
[12] Ueno Y, Haruta S, Ishii M, Igarashi Y. Microbial communityin anaerobic hydrogen-producing microLora enriched fromsludge compost. Appl Microbiol Biotechnol 2001;57:555–62.
[13] Yokoi H, Saitsu A, Uchida H, Hirose J, Hayashi S, TakasakiY. Microbial hydrogen production from sweet potato starchresidue. J Biosci Bioeng 2001;91(1):58–63.
[14] Lay J-J, Lee YJ, Noike T. Feasibility of biological hydrogenproduction from organic fraction of municipal solid waste.Water Res 1999;33(11):2579–86.
[15] Mizuno O, Ohara T, Shinya M, Noike T. Characteristics ofhydrogen production from bean curd manufacturing wasteby anaerobic microLora. Water Sci Technol 2000;42(3–4):345–50.
[16] Noike T, Takabatake H, Mizuno O, Ohba M. Inhibitionof hydrogen fermentation of organic wastes by lactic acidbacteria. Int J Hydrogen Energy 2002;27:1367–71.
[17] Wang CC, Chang CW, Chu CP, Lee DJ, Chang B-V, LiaoCS, Tay JH. Using 5ltrate of waste biosolids to eGectivelyproduce bio-hydrogen by anaerobic fermentation. Water Res2003;37:2789–93.
[18] Wang CC, Chang CW, Chu CP, Lee DJ, Chang B-V, Liao CS.Producing hydrogen from wastewater sludge by Clostridiumbifermentans. J Biotechnol 2003;102:83–92.
[19] Ministry of Environment. The state of solid waste generationand treatment in 2001. Seoul, Korea: Ministry of Environment,Korea, 2002.
1616 S.-H. Kim et al. / International Journal of Hydrogen Energy 29 (2004) 1607–1616
[20] Han S-K, Shin H-S. Enhanced acidogenic fermentation offood waste in a continuous-Low reactor. Waste Manage Res2002;20:110–8.
[21] Kim D-S. Regulation plan for ocean dumping in Korea. JKOWREC 2003;11(1):18–21. [in Korean].
[22] La5tte-TrouquVe S, Forster CF. Dual anaerobic co-digestion ofsewage sludge and confectionery waste. Bioresource Technol2000;71:77–82.
[23] Schafer PL, Farrell JB. Advanced anaerobic digestion systems.Water Environ Technol 2000;12(11):26–32.
[24] Owen WF, Stuckey DC, Healy Jr JB, Young LY, McCartyPL. Bioassay for monitoring biochemical methane potentialand anaerobic toxicity. Water Res 1979;13:485–93.
[25] APHA AWWA WEF. Standard methods for the examinationof water and wastewater, 20th ed. Washington, DC, USA:APHA; 1998.
[26] Dubois M, Gilles KA, Hamilton JK, Rebers PA, Smith F.Colorimetric method for determination of sugars and relatedsubstances. Anal Chem 1956;28:350–6.
[27] Miron Y, Zeeman G, Van Lier JB, Lettinga G. The roleof sludge retention time in the hydrolysis and acidi5cationof lipids, carbohydrates and proteins during digestion ofprimary sludge in CSTR systems. Water Res 2000;34(5):1705–13.
[28] Lay J-J. Biohydrogen generation by mesophilic anaerobicfermentation of microcrystalline cellulose. Biotechnol Bioeng2001;74(4):280–7.
[29] Lee YJ, Miyahara T, Noike T. EGect of iron concentrationon hydrogen fermentation. Bioresource Technol 2001;80:227–31.
[30] Chen C-C, Lin C-Y, Lin M-C. Acid-base enrichment enhancesanaerobic hydrogen production process. Appl MicrobiolBiotechnol 2002;58:224–8.
[31] Yang K, Yu Y, Hwang S. Selective optimization inthermophilic acidogenesis of cheese-whey wastewater toacetic and butyric acids: partial acidi5cation and methanation.Water Res 2003;37:2467–77.
[32] Devore JL. Probability and statistics for engineering andthe sciences, 4th ed. Paci5c Grove, CA, USA: Brooks/ColePublishing Company; 1995. p. 550–4.
[33] Van Ginkel S, Sung S, Lay J-J. Biohydrogen production asa function of pH and substrate concentration. Environ SciTechnol 2001;35:4726–30.
[34] Lin CY, Lay CH. Carbon/nitrogen-ratio eGect on fermentativehydrogen production by mixed microLora. Int J HydrogenEnergy 2004;29:41–5.
[35] Mitchell WJ. Biology and physiology. In: Bahl H, PXurre P,editors. Clostrida: biotechnology and medical applications.Weinheim, Germany: Wiley-VCH; 2001. p. 53–68.
[36] Lay J-J. Modeling and optimization of anaerobic digestedsludge converting starch to hydrogen. Biotechnol Bioeng2000;68(3):269–78.
[37] Chu CP, Lee DJ, Chang B-V, You CS. Weak ultrasonicpretreatment on anaerobic digestion of polyelectrolyteLocculated activated biosolids. Water Res 2002;36:2681–8.
[38] Yokoi H, Tokushige T, Hirose J, Hayashi S, Takasaki Y. H2production from starch by a mixed culture of Clostridiumbutyricum and Enterobacter aerogenes. Biotechnol Lett1998;20(2):143–7.
[39] Fox P, Pohland FG. Anaerobic treatment applications andfundamentals: substrate speci5city during phase separation.Water Environ Res 1994;66(5):716–24.
[40] Kim H-W, Han S-K, Song Y-C, Baek B-C, Yoo K-S, Lee J-J,Shin H-S. Improved anaerobic biodegradation of biosolids bythe addition of food waste as a co-substrate. Proceedings ofBIOSOLIDS 2003, Trondheim, Norway, 2002. p. 539–45.


