LAIMAN LI
ACCOUNT MANAGER
AUSTRALIA AND NEW ZEALAND
Introducing
EZproxy® Analytics

Account Manager
Australia and New Zealand
Laiman Li
Provide seamless
access to electronic
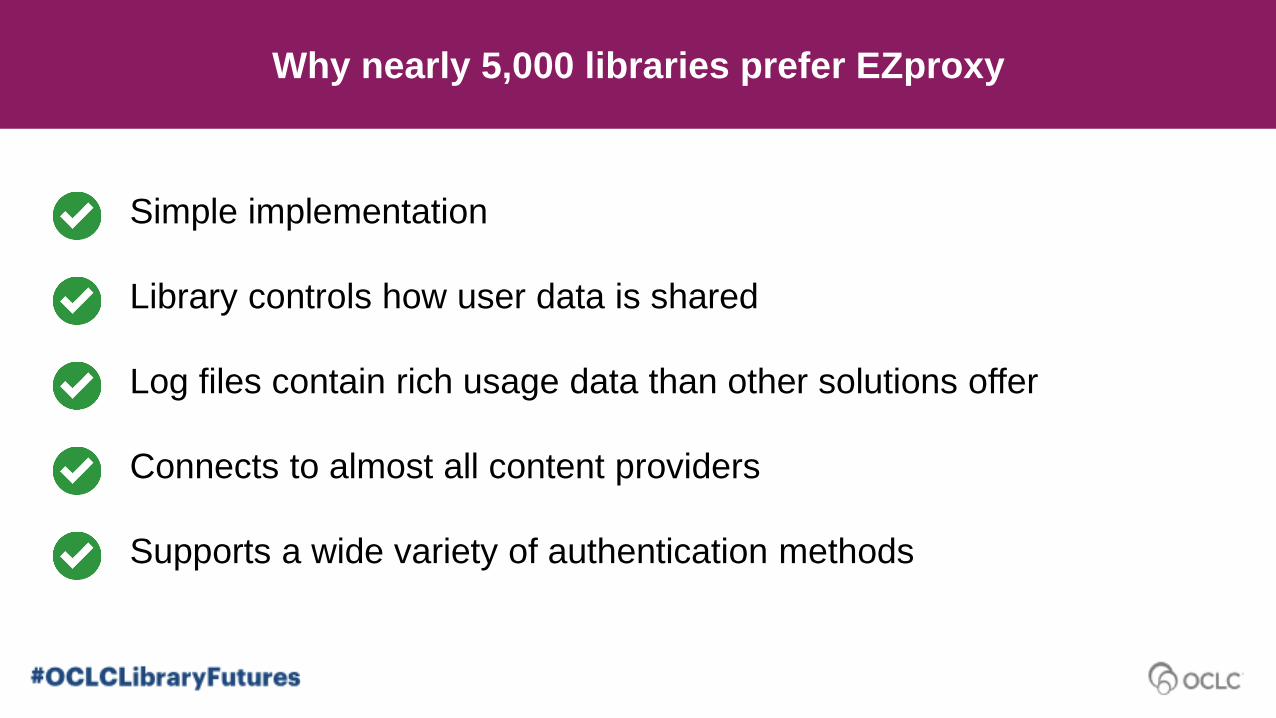
Why nearly 5,000 libraries prefer EZproxy
Simple implementation
Library controls how user data is shared
Log files contain rich usage data than other solutions offer
Connects to almost all content providers
Supports a wide variety of authentication methods
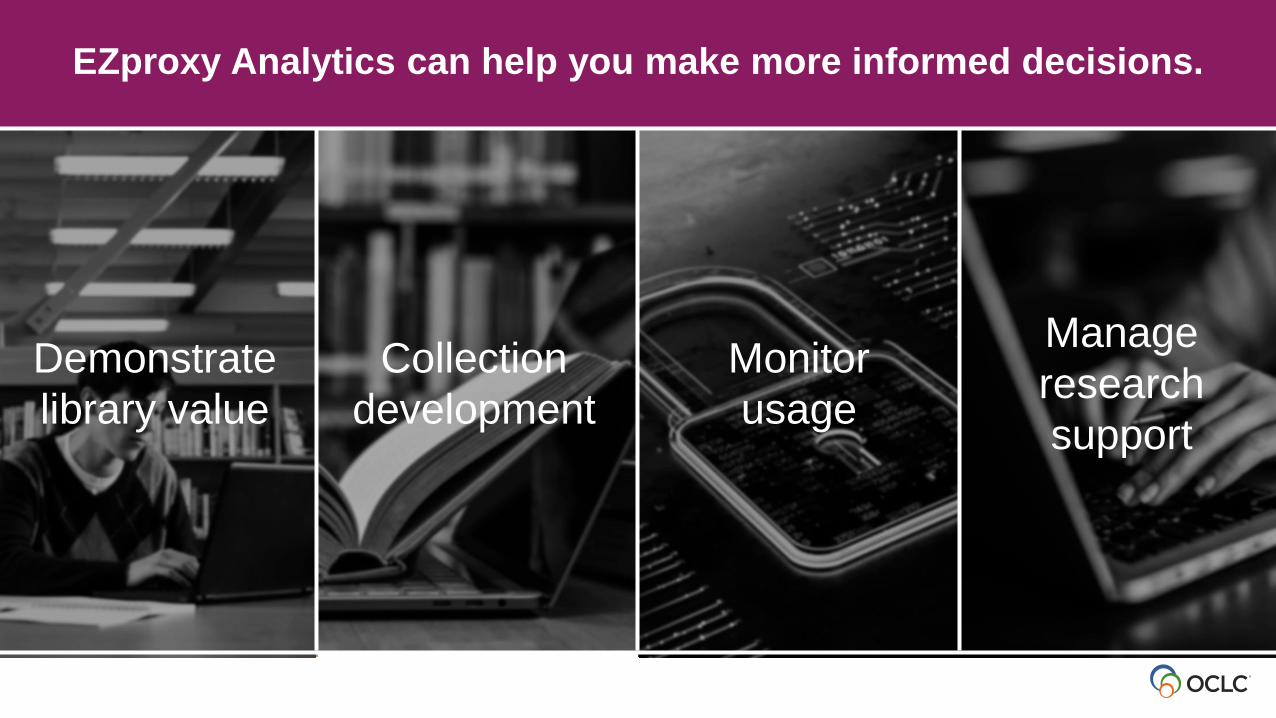
EZproxy Analytics can help you make more informed decisions.
Collection
development
Demonstrate
library value
Monitor
usage
Manage
research
support
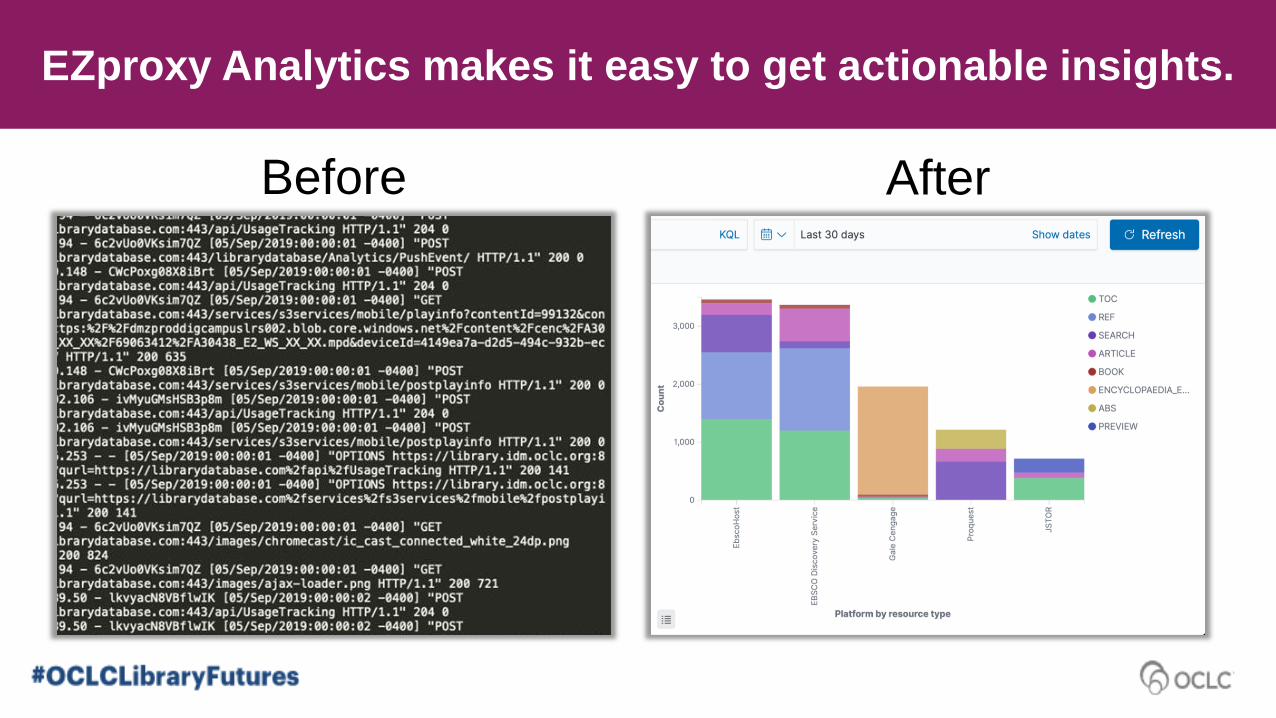
EZproxy Analytics makes it easy to get actionable insights.
Before After
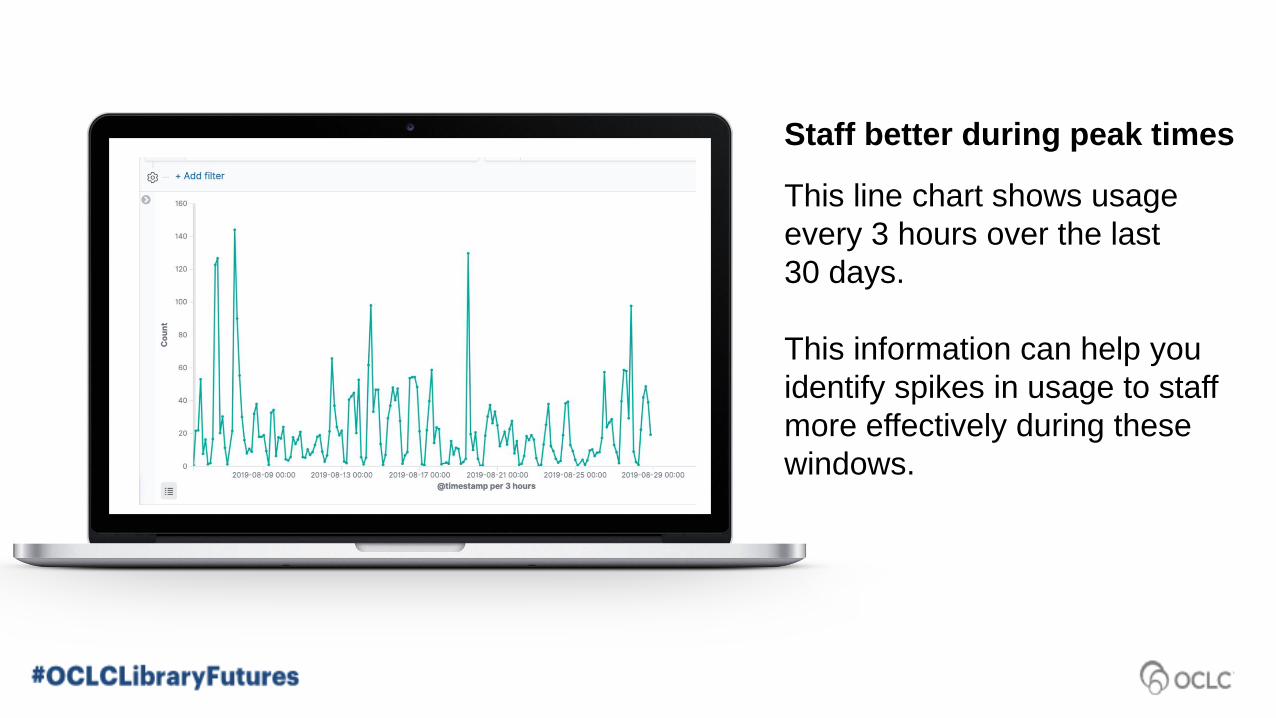
This line chart shows usage
every 3 hours over the last
30 days.
This information can help you
identify spikes in usage to staff
more effectively during these
windows.
Staff better during peak times
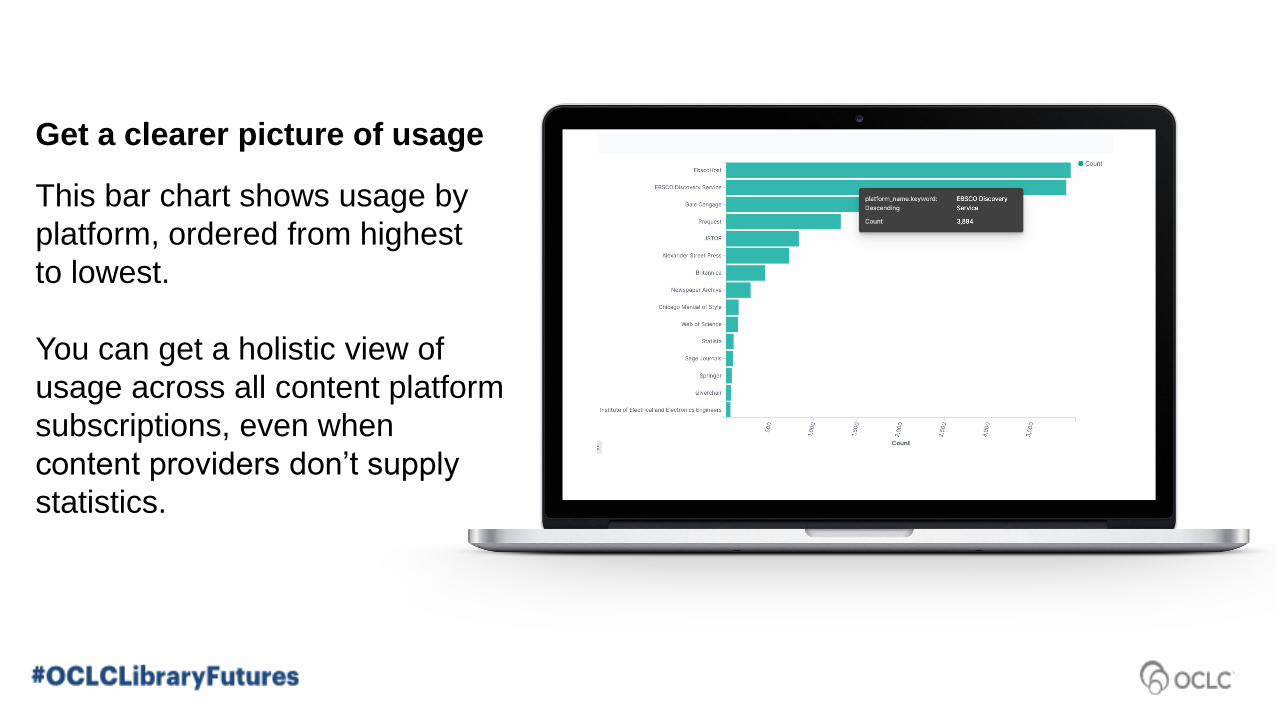
This bar chart shows usage by
platform, ordered from highest
to lowest.
You can get a holistic view of
usage across all content platform
subscriptions, even when
content providers don’t supply
statistics.
Get a clearer picture of usage
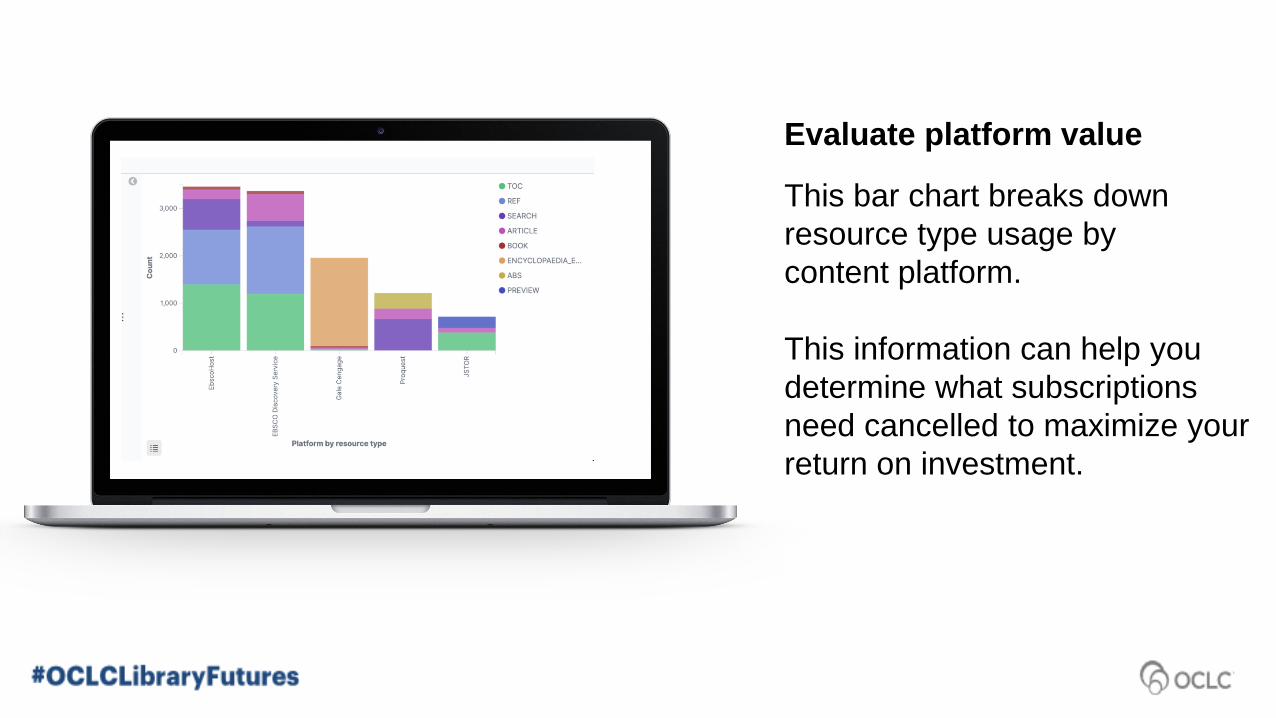
This bar chart breaks down
resource type usage by
content platform.
This information can help you
determine what subscriptions
need cancelled to maximize your
return on investment.
Evaluate platform value
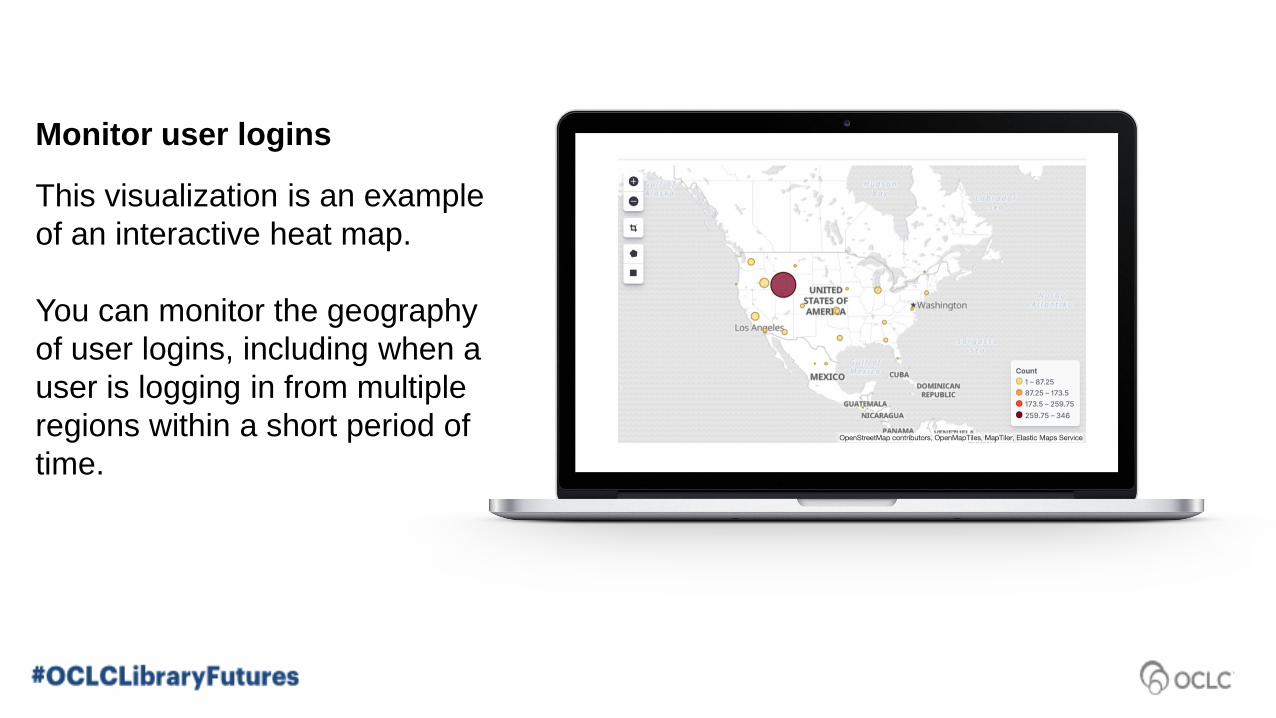
This visualization is an example
of an interactive heat map.
You can monitor the geography
of user logins, including when a
user is logging in from multiple
regions within a short period of
time.
Monitor user logins
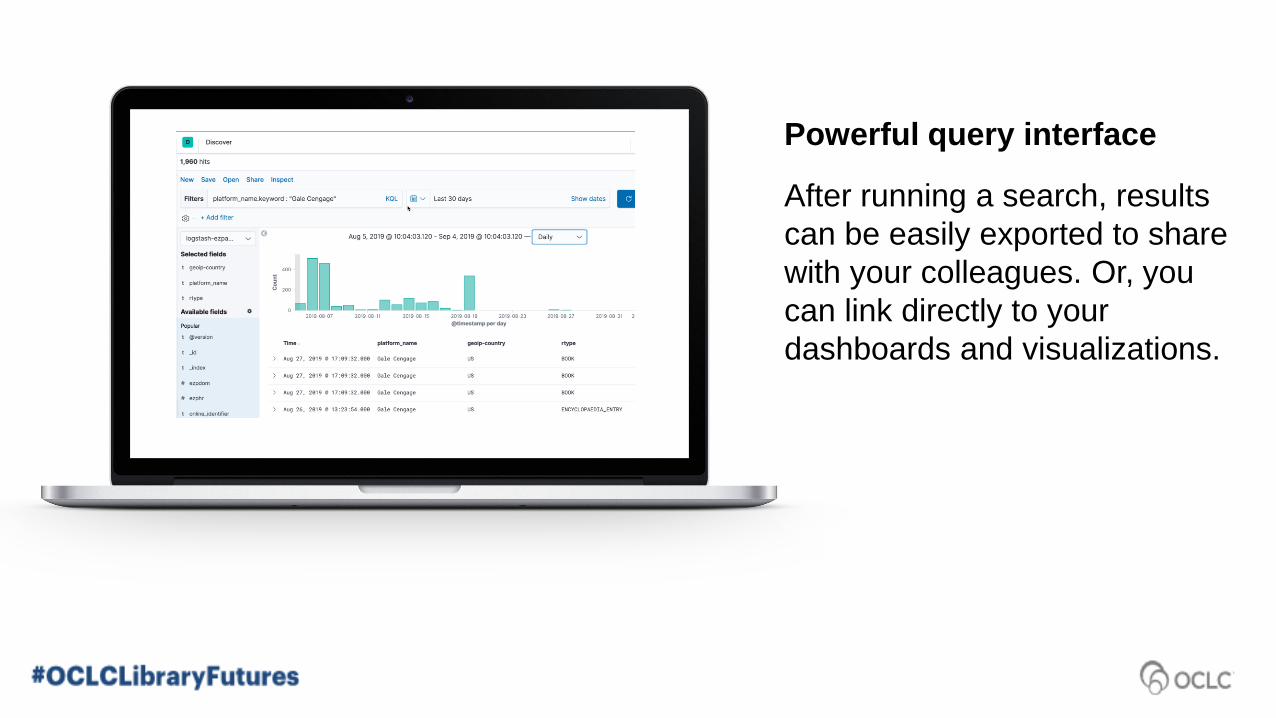
After running a search, results
can be easily exported to share
with your colleagues. Or, you
can link directly to your
dashboards and visualizations.
Powerful query interface
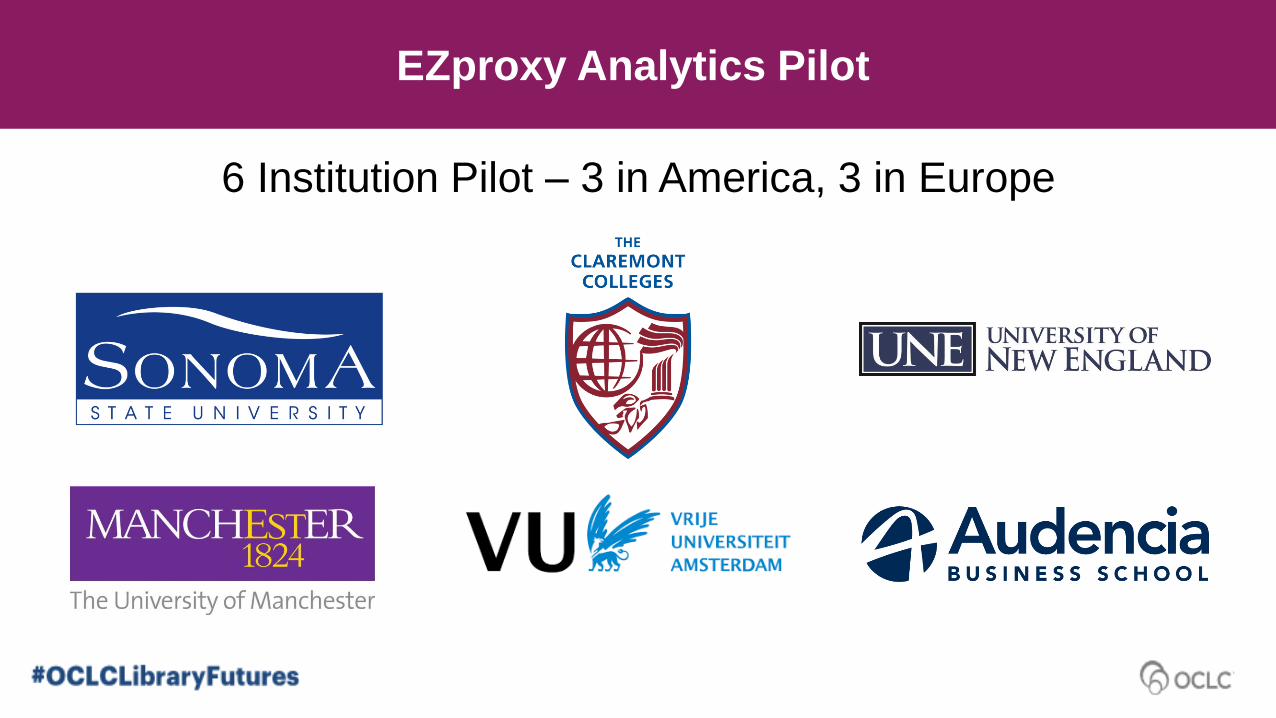
EZproxy Analytics Pilot
6 Institution Pilot – 3 in America, 3 in Europe
“I'm interested in comparing [the EZproxy Analytics student usage] data to other
data the library collects to see if it would help us paint a robust picture of library
use and value.”
Mary Wegmann
Collection Development Librarian, Sonoma State University
Paint a robust picture
“We have 28 platforms that we need usage for, worth about $23,000. [EZproxy
Analytics reports offer] a good gauge to determine which resources we need to
flag for possible cancellation next year.”
A good gauge
Margaret Hogarth
Electronic Resources and Licensing Librarian, The Claremont Colleges
EZproxy Analytics helps libraries
Make sense of usage data in EZproxy logs
Get a more holistic view of content platform usage
Validate content providers’ COUNTER reports
See meaningful data in a few clicks
Create custom reports for deeper insights
Collaborate and share with colleagues