
Evaluation of AnemiaEvaluation of Anemia
ByBy
Dr. Stephen SzaboDr. Stephen Szabo

Relevant Lab ParametersRelevant Lab Parameters
PrimaryPrimary Complete Blood CountComplete Blood Count
RBC countRBC count MCVMCV HgbHgb
Reticulocyte CountReticulocyte Count CreatinineCreatinine LDH and BilirubinLDH and Bilirubin Peripheral SmearPeripheral Smear
SecondarySecondary Hgb ElectrophoresisHgb Electrophoresis Direct Antibody TestDirect Antibody Test Serum Protein Serum Protein
ElectrophoresisElectrophoresis HaptoglobinHaptoglobin Iron PanelIron Panel B12 (MMA, B12 (MMA,
Homocystiene)Homocystiene) Bone Marrow BiopsyBone Marrow Biopsy
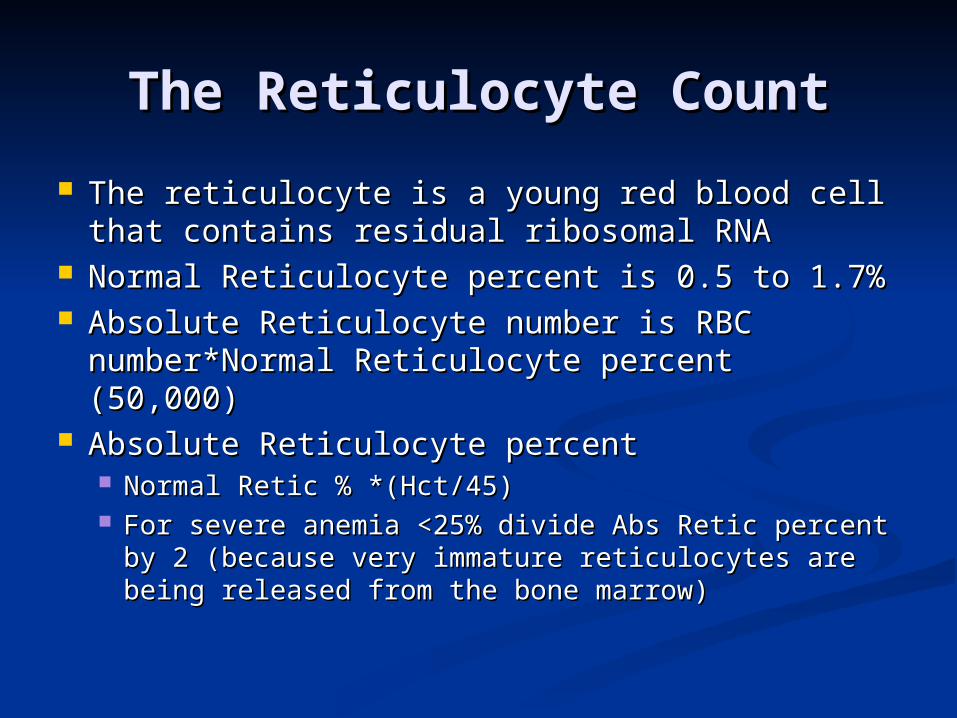
The Reticulocyte CountThe Reticulocyte Count
The reticulocyte is a young red blood cell The reticulocyte is a young red blood cell that contains residual ribosomal RNAthat contains residual ribosomal RNA
Normal Reticulocyte percent is 0.5 to 1.7%Normal Reticulocyte percent is 0.5 to 1.7% Absolute Reticulocyte number is RBC Absolute Reticulocyte number is RBC
number*Normal Reticulocyte percent number*Normal Reticulocyte percent (50,000)(50,000)
Absolute Reticulocyte percentAbsolute Reticulocyte percent Normal Retic % *(Hct/45)Normal Retic % *(Hct/45) For severe anemia <25% divide Abs Retic percent For severe anemia <25% divide Abs Retic percent
by 2 (because very immature reticulocytes are by 2 (because very immature reticulocytes are being released from the bone marrow)being released from the bone marrow)

Copyright ©2005 American Society of Hematology. Copyright restrictions may apply.
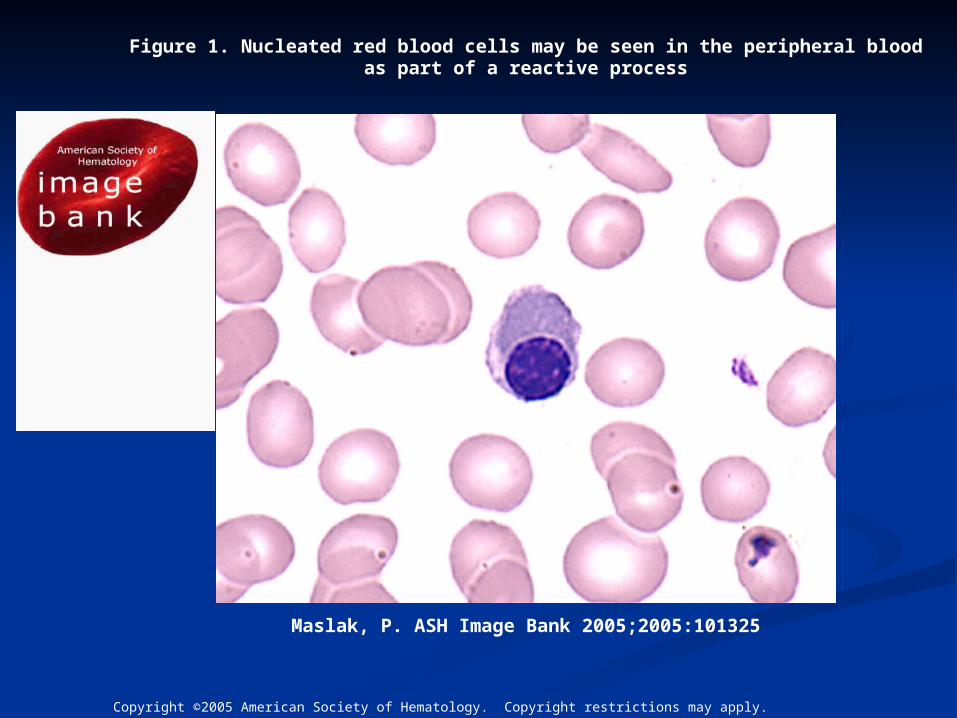
Maslak, P. ASH Image Bank 2005;2005:101299
Figure 1. Using special stains such as methylene blue or brilliant cresyl blue, reticulocytes stain with dark blue granules whereas mature erythrocytes evenly stain pale blue
Copyright ©2008 American Society of Hematology. Copyright restrictions may apply.
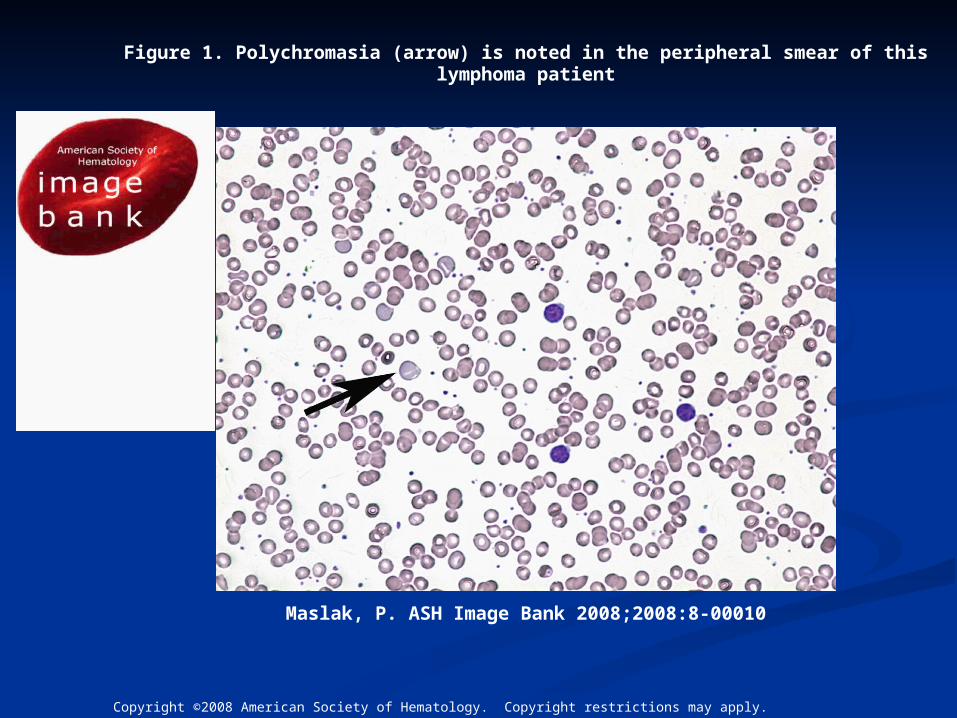
Maslak, P. ASH Image Bank 2008;2008:8-00010
Figure 1. Polychromasia (arrow) is noted in the peripheral smear of this lymphoma patient
Copyright ©2005 American Society of Hematology. Copyright restrictions may apply.
Maslak, P. ASH Image Bank 2005;2005:101325
Figure 1. Nucleated red blood cells may be seen in the peripheral blood as part of a reactive process

Functional Classification of Functional Classification of Anemia IAnemia I
Hgb<12 g/dlCBC
Retic Index
Normocytic <2
Underproduction
Macrocytic or Microcytic<2
Maturation disorder
Normocytic>3 to 5
Decreased RBC survivalIncreased Production

Anemia
UnderproductionMarrow Damage
Iron DefRenal Disease
Chronic Inflammation
Maturation DisordersIron DefB12 Def
Folic Acid DefTypes of Myelodysplasia
HemolysisHemorrhageBlood Loss
Autoimmuse diseaseMembrane diseaseHemoglobinopathy
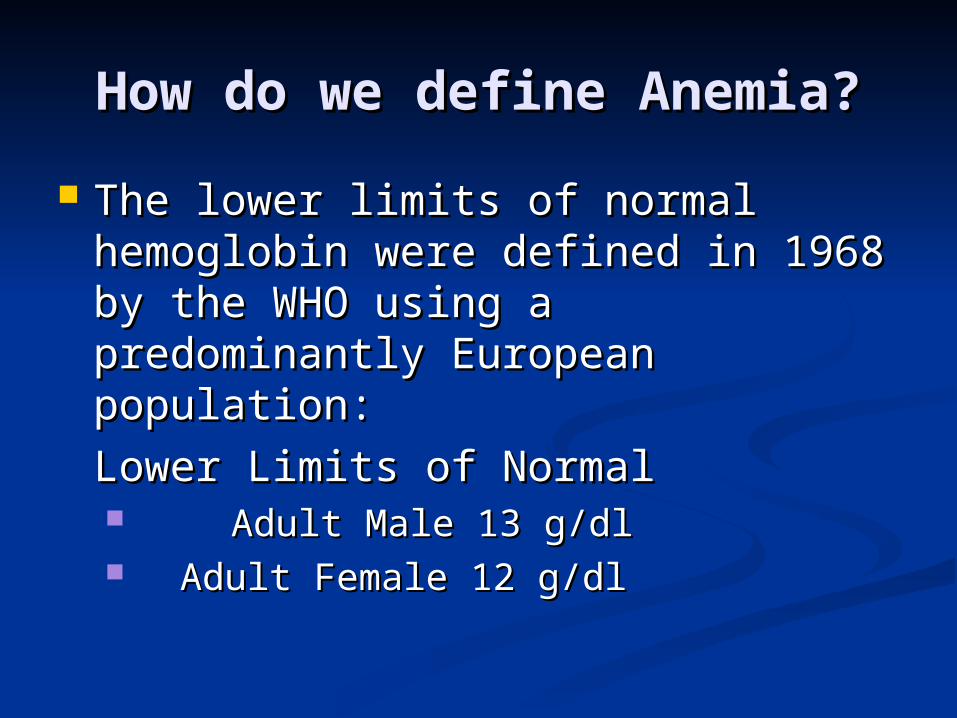
How do we define Anemia?How do we define Anemia?
The lower limits of normal The lower limits of normal hemoglobin were defined in 1968 by hemoglobin were defined in 1968 by the WHO using a predominantly the WHO using a predominantly European population:European population:
Lower Limits of NormalLower Limits of Normal Adult Male 13 g/dlAdult Male 13 g/dl Adult Female 12 g/dlAdult Female 12 g/dl

Proposed lower limits of Proposed lower limits of hemoglobin based on age, sex hemoglobin based on age, sex
and raceand race GroupGroup HemoglobinHemoglobin
White MenWhite Men
20-5920-59 13.713.7
60+60+ 13.213.2
White WomenWhite Women
20-5920-59 12.212.2
60+60+ 12.212.2
Black MenBlack Men
20-5920-59 12.912.9
60+60+ 12.712.7
Black WomenBlack Women
20-4920-49 11.511.5
50+50+ 11.511.5
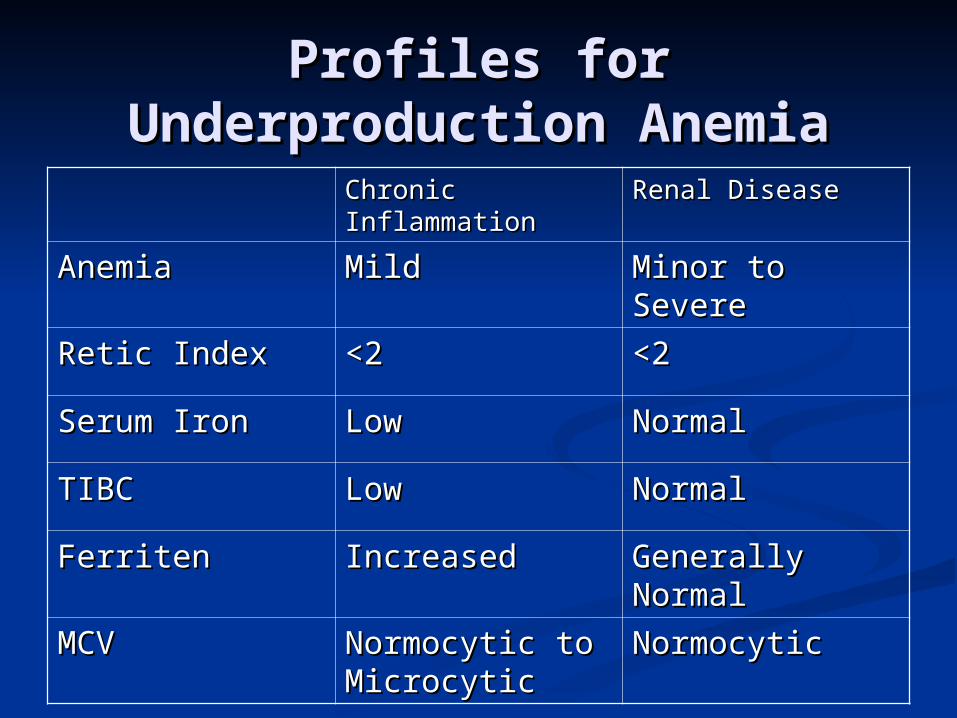
Profiles for Profiles for Underproduction AnemiaUnderproduction Anemia
Chronic Chronic InflammationInflammation
Renal DiseaseRenal Disease
AnemiaAnemia MildMild Minor to SevereMinor to Severe
Retic IndexRetic Index <2<2 <2<2
Serum IronSerum Iron LowLow NormalNormal
TIBCTIBC LowLow NormalNormal
FerritenFerriten IncreasedIncreased Generally Generally NormalNormal
MCVMCV Normocytic to Normocytic to MicrocyticMicrocytic
NormocyticNormocytic

Profiles for Iron Def AnemiaProfiles for Iron Def Anemia
Iron Store Iron Store DepletionDepletion
Iron Deficient Iron Deficient ErythropoiesiErythropoiesiss
Iron Iron Deficiency Deficiency AnemiaAnemia
HemoglobinHemoglobin NormalNormal Slight Slight DecreaseDecrease
MicrocyticMicrocytic
Serum IronSerum Iron NormalNormal <60 mcg/dl<60 mcg/dl <40 mcg/dl<40 mcg/dl
Percent Percent saturationsaturation
20 to 30%20 to 30% <15%<15% <10%<10%
FerritenFerriten <20<20 <12<12 <12<12
TIBCTIBC 360-390360-390 >390>390 >410>410
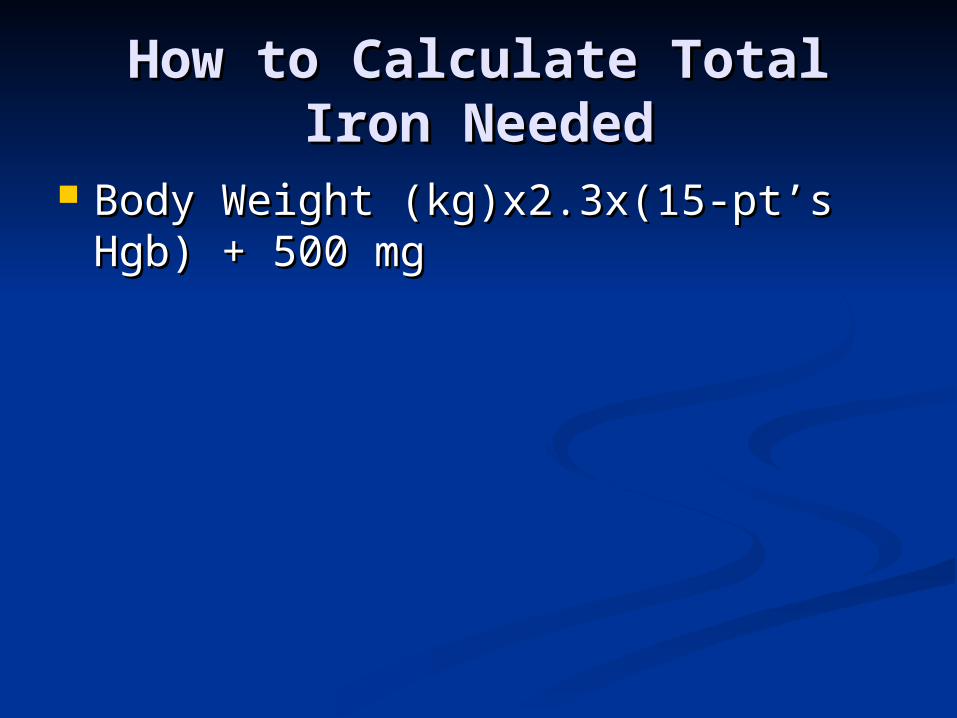
How to Calculate Total Iron How to Calculate Total Iron NeededNeeded
Body Weight (kg)x2.3x(15-pt’s Hgb) Body Weight (kg)x2.3x(15-pt’s Hgb) + 500 mg+ 500 mg
Copyright ©2002 American Society of Hematology. Copyright restrictions may apply.
Maslak, P. ASH Image Bank 2002;2002:100394
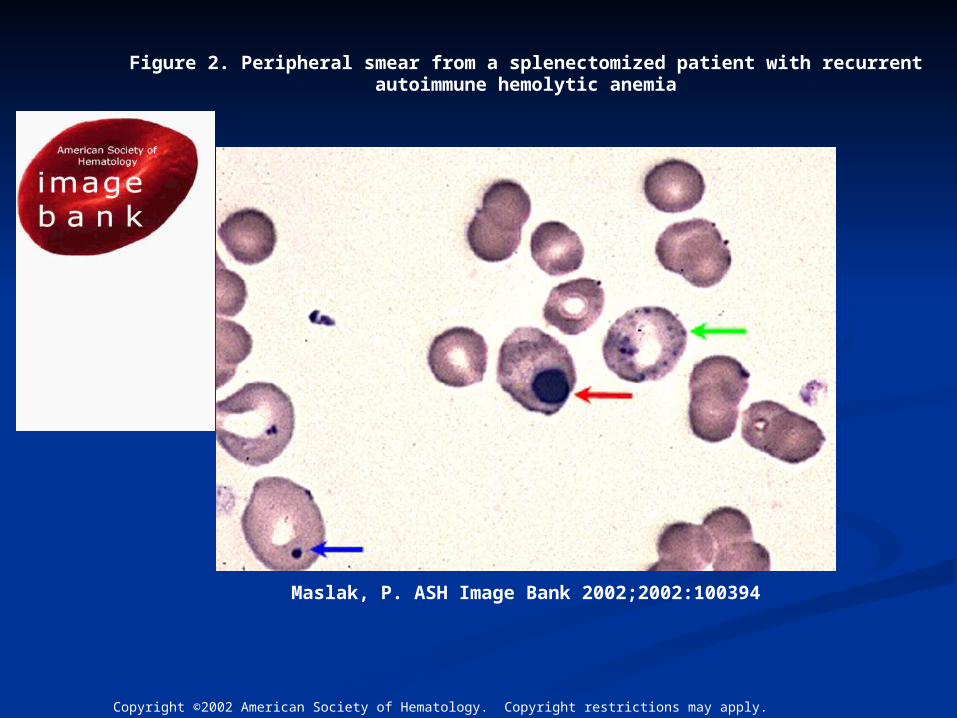
Figure 2. Peripheral smear from a splenectomized patient with recurrent autoimmune hemolytic anemia

Copyright ©2002 American Society of Hematology. Copyright restrictions may apply.
Maslak, P. ASH Image Bank 2002;2002:100394
Figure 1. Circulating nucleated RBC (arrow) in the peripheral smear of a patient with autoimmune hemolytic anemia (MacNeal Tetrachrome 1000x)
Copyright ©2002 American Society of Hematology. Copyright restrictions may apply.
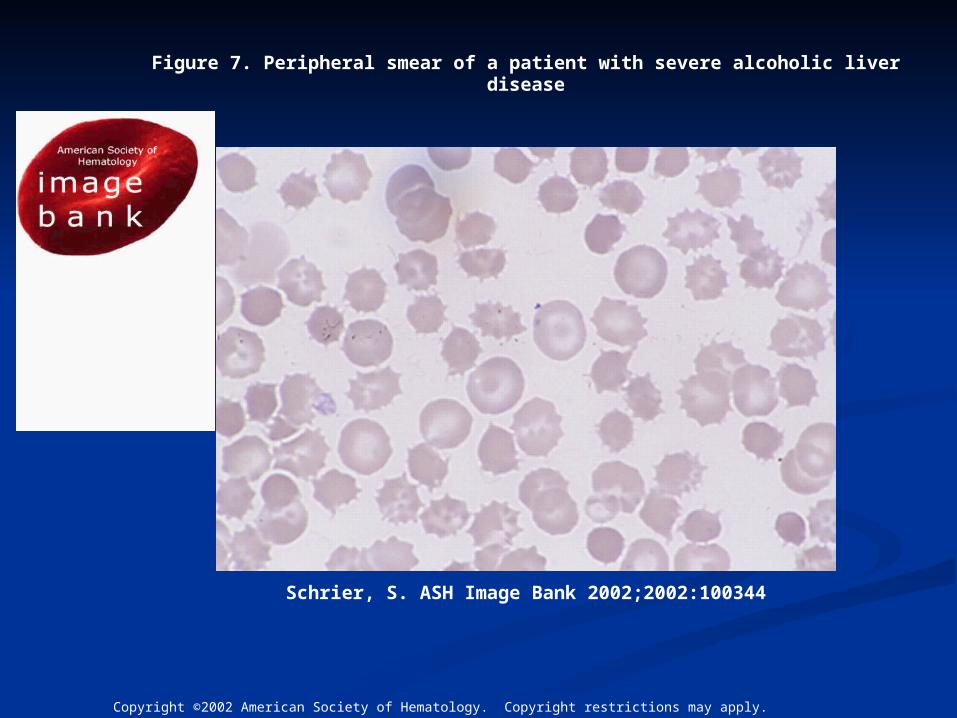
Schrier, S. ASH Image Bank 2002;2002:100344
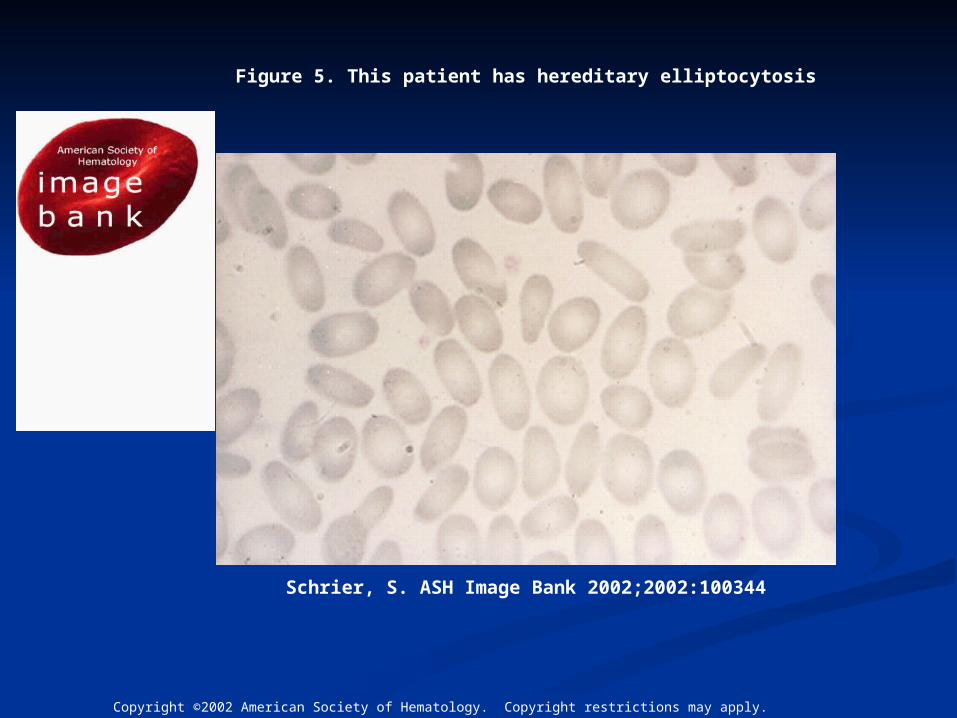
Figure 5. This patient has hereditary elliptocytosis

Copyright ©2005 American Society of Hematology. Copyright restrictions may apply.
Lazarchick, J. ASH Image Bank 2005;2005:101384
Figure 2. The crystal-like inclusions are more evident at higher magnification of the previous image
Copyright ©2002 American Society of Hematology. Copyright restrictions may apply.
Schrier, S. ASH Image Bank 2002;2002:100344
Figure 7. Peripheral smear of a patient with severe alcoholic liver disease
Copyright ©2001 American Society of Hematology. Copyright restrictions may apply.
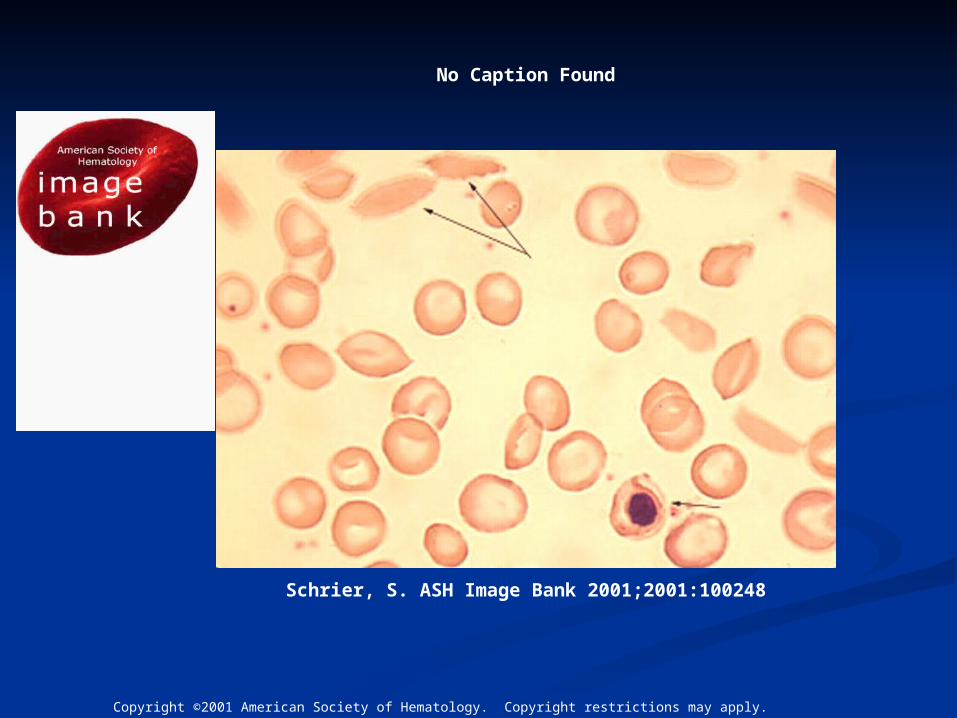
Schrier, S. ASH Image Bank 2001;2001:100248
No Caption Found
Copyright ©2001 American Society of Hematology. Copyright restrictions may apply.
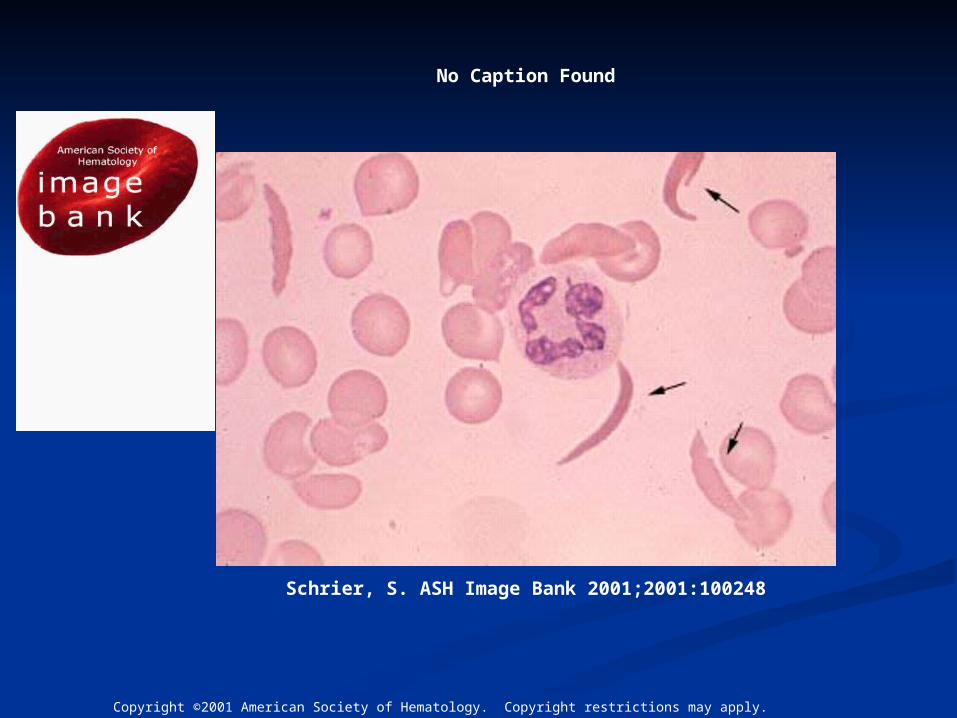
Schrier, S. ASH Image Bank 2001;2001:100248
No Caption Found

Copyright ©2001 American Society of Hematology. Copyright restrictions may apply.
Schrier, S. ASH Image Bank 2001;2001:100249
Figure 1. Note the fragmented schistocytes, burr cells, and helmet cells
Copyright ©2002 American Society of Hematology. Copyright restrictions may apply.
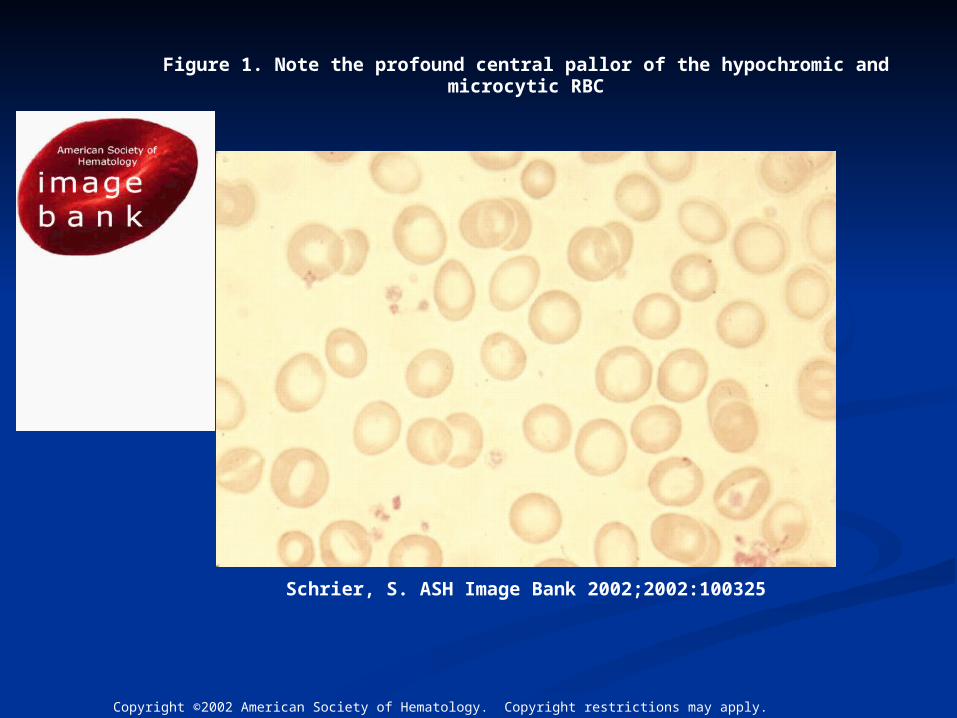
Schrier, S. ASH Image Bank 2002;2002:100325
Figure 1. Note the profound central pallor of the hypochromic and microcytic RBC
Copyright ©2001 American Society of Hematology. Copyright restrictions may apply.
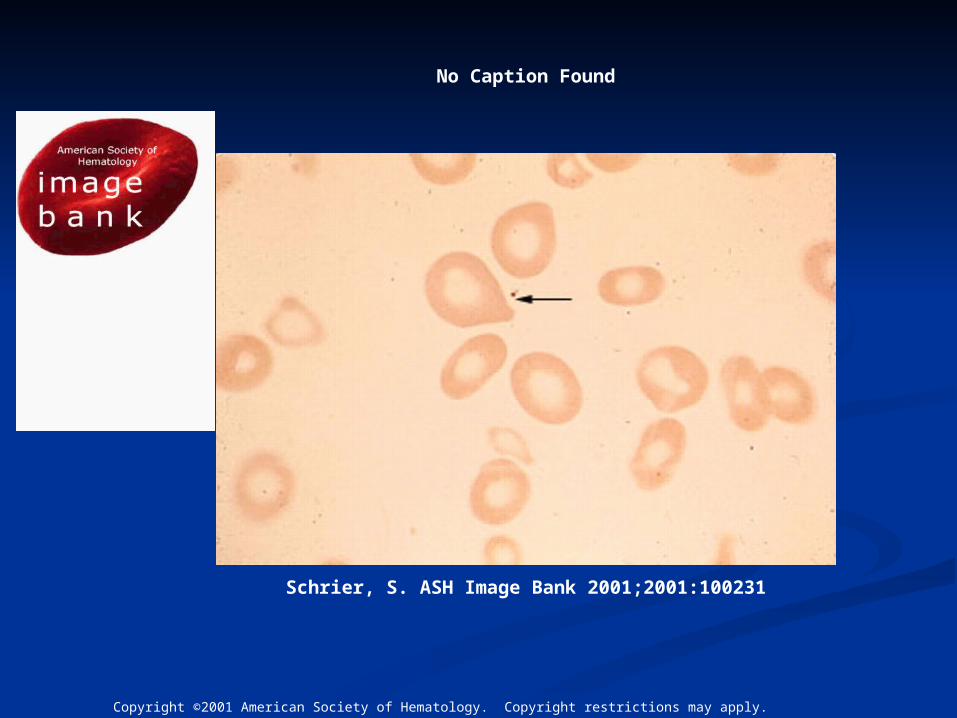
Schrier, S. ASH Image Bank 2001;2001:100231
No Caption Found
Copyright ©2001 American Society of Hematology. Copyright restrictions may apply.
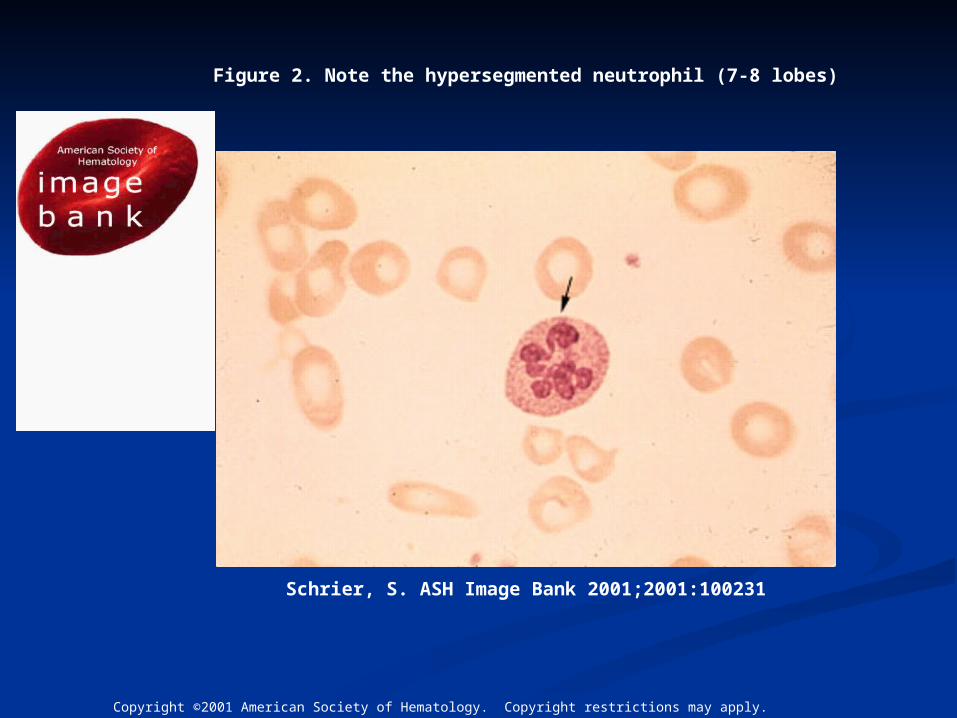
Schrier, S. ASH Image Bank 2001;2001:100231
Figure 2. Note the hypersegmented neutrophil (7-8 lobes)


