
Estimation of Eaton’s Exponent and Tectonic Strain for Horizontal Stress Magnitude in Upper Assam Basin,
India
Jenifer Alam* IIT(ISM) and Rima Chatterjee, IIT(ISM) Dhanbad, India
Keywords
Elastic properties, Horizontal Stress, Tectonic Strain, Pore Pressure, Eaton, Blanton-Olson
Summary
Horizontal stress profiles play an important role in the
design of hydraulic fracturing and the determination
of wellbore stability. The use of logs has become the
industry standard for determining the stress profile in
the reservoir. By employing such services as sonic and
density logging, reservoir properties such as
Poisson’s ratio, overburden and pore pressure may be
determined which are key parameters in calculating
minimum horizontal stress profiles. We have estimated
the Eaton’s exponent as 1 applicable for upper Assam
for pore pressure prediction in two wells in normal
and thrusted stress regime validated with MDT data.
Further, using Blanton-Olson model we have
calculated the strain value of -0.0034 in well located
in normal faulted regime and +0.002414 for well in
reverse faulted regime utilizing static Young’s
Modulus and estimated minimum horizontal stress in
each case and calibrated with known LOT data.
Introduction
Pore Pressure prediction and stress profiles are
important parameters for (1)well planning, materials
and costs estimates for construction of a safe, modern
well including logistics, operations planning and
procedural guidelines, and (2) prospect definition,
financial risk assessment, overall project viability and
basin exploration.
Being a young tectonically active belt rich in
hydrocarbon resources wellbore stability becomes a
major issue in exploration and production. Here we
have estimated pore pressure (PP), vertical stress
magnitude (Sv) and minimum horizontal stress
magnitude (Sh) from two wells located in the
tectonically active upper Assam basin.
Geological framework
The Assam province is divided into four tectonic
regions namely the eastern Himalayan fold and thrust
belt, the Mishmi Hills uplift, the Assam-Arakan thrust
belt including the Naga thrust or Schuppen Belt and
the upper Assam foreland basin. The Assam-Arakan
thrust belt is the western edge of Indo-Burman Ranges
developed due to the collision of Indian plate and
Myanmar microplate (Raoof et al., 2017). The NW
margin of this fold-thrust belt is known as Naga thrust.
The Assam Shelf lying between the main boundary
thrust (MBT) and Naga Thrust area is comparatively
free from thrust tectonics and depicting normal
faulting reaching down to basement. The two well
locations are shown in Figure 1, along with the various
thrust belts acting on and around them.
Figure 1: Geological setup of study area with well locations (after
Nandy, 2000)
Estimation of Eaton’s Exponent and Tectonic Strain for Horizontal Stress
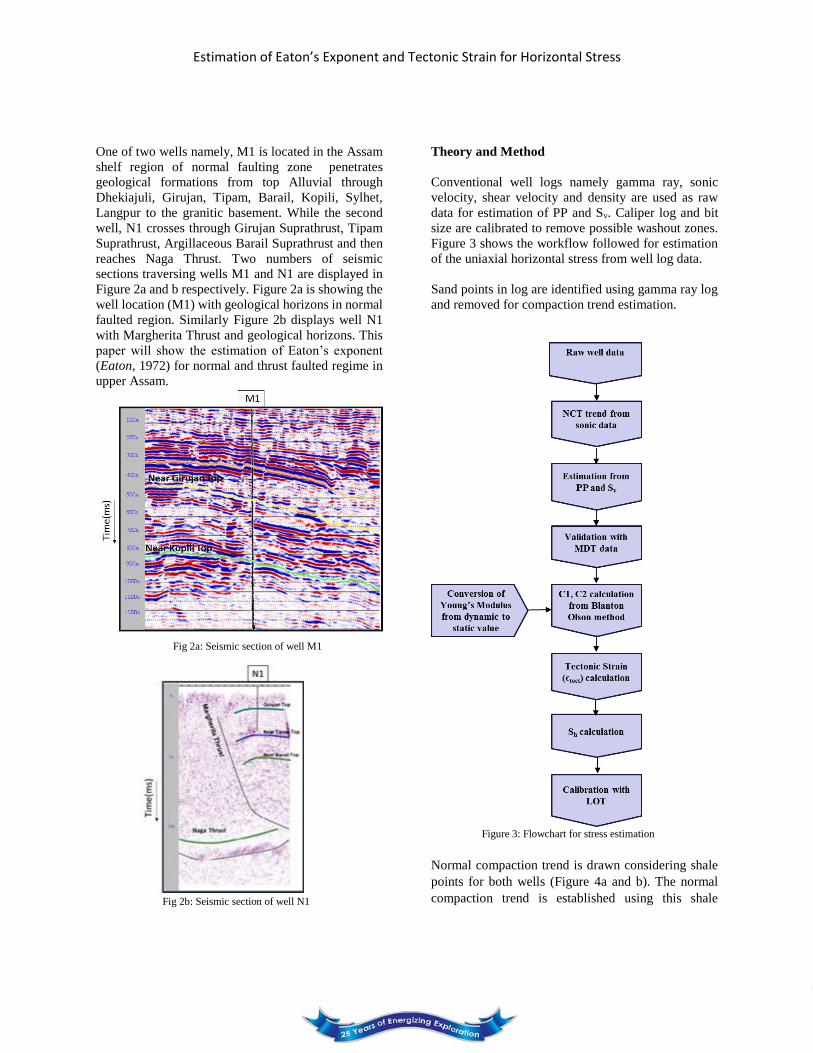
One of two wells namely, M1 is located in the Assam
shelf region of normal faulting zone penetrates
geological formations from top Alluvial through
Dhekiajuli, Girujan, Tipam, Barail, Kopili, Sylhet,
Langpur to the granitic basement. While the second
well, N1 crosses through Girujan Suprathrust, Tipam
Suprathrust, Argillaceous Barail Suprathrust and then
reaches Naga Thrust. Two numbers of seismic
sections traversing wells M1 and N1 are displayed in
Figure 2a and b respectively. Figure 2a is showing the
well location (M1) with geological horizons in normal
faulted region. Similarly Figure 2b displays well N1
with Margherita Thrust and geological horizons. This
paper will show the estimation of Eaton’s exponent
(Eaton, 1972) for normal and thrust faulted regime in
upper Assam.
Fig 2a: Seismic section of well M1
Fig 2b: Seismic section of well N1
Theory and Method
Conventional well logs namely gamma ray, sonic
velocity, shear velocity and density are used as raw
data for estimation of PP and Sv. Caliper log and bit
size are calibrated to remove possible washout zones.
Figure 3 shows the workflow followed for estimation
of the uniaxial horizontal stress from well log data.
Sand points in log are identified using gamma ray log
and removed for compaction trend estimation.
Figure 3: Flowchart for stress estimation
Normal compaction trend is drawn considering shale
points for both wells (Figure 4a and b). The normal
compaction trend is established using this shale

Estimation of Eaton’s Exponent and Tectonic Strain for Horizontal Stress
compaction curve and the relationship is obtained as
follows:
For M1
Δtn = 157.36e-0.00025*depth
For N1
Δtn = 125.02e-0.0003*depth
where Δtn = normalized sonic travel time.
Fig 4a: NCT trend for well M1
Fig 4b: NCT trend for well N1
Vertical stress (Sv) is calculated using bulk density of
the rock which is force per unit area applied by load of
rock above the point of measurement. The required
equation given by Plumb et al.(1991) is
Sv = ∫ 𝜌(𝑧)𝑔𝑑𝑧𝑧
0
where z = depth at point of measurement,
ρ (z) = bulk density of the rock which is
function of the depth.
g = acceleration due to gravity
Pore pressure is calculated using the following
formula given by Eaton (1972)
PP =Sv-(Sv-Ph)* (Δtn/ Δt)x
where Ph = hydrostatic pressure taken as 10MPa/km
Δt = sonic transit time
x = Eaton’s exponent
The PP has been calculated using Eaton’s sonic
equation with varying exponents of 1, 2 and 3 (Figure
5a and b) and calibrated with measured pressure
obtained from Modular Dynamic Tester (MDT) and
mud weight (MW) used while drilling. The results thus
obtained are plotted here.
Estimated PP is noticed to match closely with Eaton’s
exponent 1.
Fig 5a: PP^1, PP^2 and PP^3 pore pressure estimated with varying
Eaton’s exponent with hydrostatic pressure (Ph), mud weight (MW),
Modular Dynamic Tester (MDT), Sv for well M1.
Estimation of Eaton’s Exponent and Tectonic Strain for Horizontal Stress
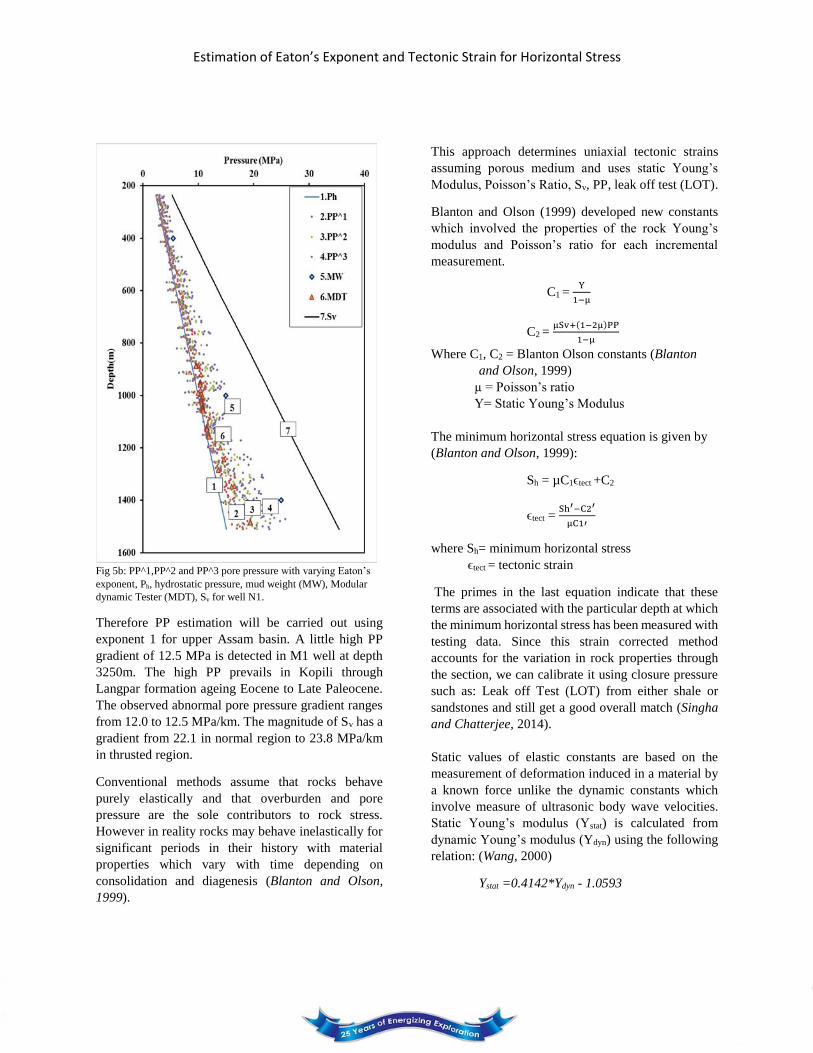
Fig 5b: PP^1,PP^2 and PP^3 pore pressure with varying Eaton’s
exponent, Ph, hydrostatic pressure, mud weight (MW), Modular
dynamic Tester (MDT), Sv for well N1.
Therefore PP estimation will be carried out using
exponent 1 for upper Assam basin. A little high PP
gradient of 12.5 MPa is detected in M1 well at depth
3250m. The high PP prevails in Kopili through
Langpar formation ageing Eocene to Late Paleocene.
The observed abnormal pore pressure gradient ranges
from 12.0 to 12.5 MPa/km. The magnitude of Sv has a
gradient from 22.1 in normal region to 23.8 MPa/km
in thrusted region.
Conventional methods assume that rocks behave
purely elastically and that overburden and pore
pressure are the sole contributors to rock stress.
However in reality rocks may behave inelastically for
significant periods in their history with material
properties which vary with time depending on
consolidation and diagenesis (Blanton and Olson,
1999).
This approach determines uniaxial tectonic strains
assuming porous medium and uses static Young’s
Modulus, Poisson’s Ratio, Sv, PP, leak off test (LOT).
Blanton and Olson (1999) developed new constants
which involved the properties of the rock Young’s
modulus and Poisson’s ratio for each incremental
measurement.
C1 = Y
1−µ
C2 = µSv+(1−2µ)PP
1−µ
Where C1, C2 = Blanton Olson constants (Blanton
and Olson, 1999)
µ = Poisson’s ratio
Y= Static Young’s Modulus
The minimum horizontal stress equation is given by
(Blanton and Olson, 1999):
Sh = µC1ϵtect +C2
ϵtect = Sh′−C2′
µC1′
where Sh= minimum horizontal stress
ϵtect = tectonic strain
The primes in the last equation indicate that these
terms are associated with the particular depth at which
the minimum horizontal stress has been measured with
testing data. Since this strain corrected method
accounts for the variation in rock properties through
the section, we can calibrate it using closure pressure
such as: Leak off Test (LOT) from either shale or
sandstones and still get a good overall match (Singha
and Chatterjee, 2014).
Static values of elastic constants are based on the
measurement of deformation induced in a material by
a known force unlike the dynamic constants which
involve measure of ultrasonic body wave velocities.
Static Young’s modulus (Ystat) is calculated from
dynamic Young’s modulus (Ydyn) using the following
relation: (Wang, 2000)
Ystat =0.4142*Ydyn - 1.0593

Estimation of Eaton’s Exponent and Tectonic Strain for Horizontal Stress
Results and Discussions
Figure 6a: PP, Ph, MDT, LOT, Sv with minimum horizontal stress
from Blanton and Olson (1999) method from M1
Figure 6b: PP, Ph, MDT, LOT, Sv with minimum horizontal stress
from Blanton and Olson (1999) method from N1
Horizontal uniaxial tectonic strain is found to vary
from -0.0034 in thrust faulting to 0.002414 Normal
faulting regime. The positive value indicates
compressive regime whereas negative value indicates
extensile/normal faulting regime.
Figure 6a and b illustrates hydrostatic pressure, PP,
MDT, Sv and estimated Sh with LOT for wells M1 and
N1 respectively. For both wells the estimated
minimum horizontal stress matches fairly well with
other known LOT points. Figure 5a shows a lesser
value of Sh as compared to Sv with Sh/Sv ratio
averaging at about 0.65 suggesting clearly that the well
lies in a normal faulted regime. On the other hand
figure 5b indicates more value of Sh than the value of
Sv with the ratio of Sh/Sv averaging at 1.01 suggesting
thrust faulting regime at N1 well location (Zoback et
al., 2003). The tectonic strain obtained in thrust
faulting regime of upper Assam matches well with the
thrust faulting regime of Lost Hill Well in California
(Blanton and Olson, 1999).
Well M1 N1
LOT 9 MPa 21 MPa
C1 229.269 4968.61
C2 12.524 17.0378
Poisson’s ratio 0.44 0.35
ϵtec -0.0034 0.002414
Table 1: Lists the LOT, constants (C1, C2), tectonic
strain (ϵtec) at well location in upper Assam.
Conclusions
Eaton’s exponent of 1 has been found to match fairly
well in both the wells for pore pressure prediction with
MDT and MW data and so can be further used in other
wells of the upper Assam region. The exponent holds
true for normal as well as thrust faulting regime.
Blanton and Olson parameters provides a good model
to calculate horizontal strain at well locations and so
can be used for estimation of minimum horizontal
stress in upper Assam basin.
Estimation of Eaton’s Exponent and Tectonic Strain for Horizontal Stress
References
Blanton, T.L. and Olson, J.E., 1999, Stress magnitudes
from logs: effect of strain and temperature; SPE
Reservoir Evaluation and Engineering, 2, 62-68.
Eaton, B.A., 1972, Graphical method predicts
geopressures worldwide; World Oil 182, 100–104.
Singha, D.K., Chatterjee, R., Sen, M.K., Sain, K.,
2014, Pore pressure prediction in gas-hydrate bearing
sediments of Krishna– Godavari basin, India; Marine
Geology, 357, 1-11.
Nandy, D.R., 2000, Geodynamics of north Eastern
India and adjoining area; acb publications, 1-10.
Plumb, R.A., Evans, K.F., Engelder, T., 1991.
Geophysical log responses and their corelation with
bed-to-bed stress contrasts in Paleozoic rocks,
Appalachian plateau; J. of Geophysical Research 96,
14,509–14,528.
Raoof, J., Mukhopadhyay, S., Koulakov, I., Kayal,
J.R., 2017, 3-D Seismic Tomography of the
Lithosphere and its Geodynamic Implications beneath
the Northeast India Region; Tectonics, American
Geophysical Union, 36, 962-980
Wandrey, C.J., 2004, Sylhet-Kopili/Barail-Tipam
composite total petroleum system, Assam geologic
province, India; U.S. Geological Survey Bulletin
2208-D, 1-17.
Zhang, J., 2011, Pore pressure prediction from well
logs: methods, modifications, and new approaches;
Earth Science Reviews, 108, 50-63.
Zoback, M.D., Barton, C.A., Brudy, M., Castillo,
D.A., Finkbeiner, T., grollimund, B.R., Moos, D.B.,
Peska, P., Ward, C.D., Wiprut, D.J., 2003,
Determination of stress orientation and magnitude in
deep wells; International J. of Rock Mechanics and
Mining Sciences, 40, 1049-1076.
Acknowledgements
Authors are thankful to Oil India Limited, Duliajan for
providing with well log, seismic dat and geological
information. Ministry of Earth Science is
acknowledged for funding the project
(MoES(11)/2015-16/456/AGP). We thank the
Department of Applied Geophysics, Indian Institute of
Technology (Indian School of Mines), Dhanbad in
helping us carry out the research work.


