
Rocky Mountain Institute Energy Efficiency Survey Aboard USS Princeton CG-59© RMI 2001 www.rmi.org 30 June 2001 unclassified
1
Energy Efficiency Survey AboardUSS Princeton CG-59
Based on surveys aboard during 11–15December 2000 and 29 January–2 February 2001
Amory B. Lovins, CEO (Research), Project Director ([email protected])Chris Lotspeich, Senior Associate, Survey Team Leader ([email protected])
Ron Perkins, Jim Rogers, P.E., and Edwin Orrett, P.E., Consulting EngineersRocky Mountain Institute, 1739 Snowmass Creek Road, Snowmass CO 81654-9199
970.927.3851, fax 970.927.4178, www.rmi.org; PictureTel videoconferencing available
30 June 2001Sponsored by the Office of Naval Research under Grant #N00014-01-1-0252
Copyright © 2001 Rocky Mountain Institute. All rights reserved. Unclassified.Unlimited reproduction permitted to the U.S. DOD, Navy, and Office of Naval Research.All views expressed are those of the authors, not of any U.S. Government organization.
Printed on 100% recycled paper (90% post-consumer waste, 10% hemp, processed chlorine free)

Rocky Mountain Institute Energy Efficiency Survey Aboard USS Princeton CG-59© RMI 2001 www.rmi.org 30 June 2001 unclassified
2
FORM 298 DOCUMENTATION PAGE AND ONE-PAGE ABSTRACT ..............i–ii
DISTRIBUTION LIST .....................................................................................................4
EXECUTIVE SUMMARY...............................................................................................5
INTRODUCTION.............................................................................................................7PROJECT BACKGROUND AND RMI WORK WITH DOD..............................................................................7PROJECT APPROACH AND OBJECTIVES ......................................................................................................8PROJECT PROPOSAL AND EXECUTION........................................................................................................9NAVAL CONSIDERATIONS ...........................................................................................................................9ACKNOWLEDGEMENTS.............................................................................................................................14HOW TO READ THIS REPORT.....................................................................................................................14
OVERVIEW OF CG-59 ELECTRICITY USE............................................................16
CG-59 ENERGY SAVING RECOMMENDATIONS .................................................18VALUE OF SAVED ELECTRICITY ONBOARD..............................................................................18COST-BENEFIT ANALYSIS CONSIDERATIONS...........................................................................20
Use empirical, not estimated or theoretical, costs...............................................................................20Optimize for lifecycle cost, not first cost. ............................................................................................20Optimize whole-system cost, not component cost. ..............................................................................20
FIRST THINGS FIRST: END-USE EFFICIENCY AND LOAD MANAGEMENT.......................22Specify premium-efficiency equipment. ..............................................................................................22Use measured, not rated or estimated, efficiencies.............................................................................22Turn off unnecessary equipment.........................................................................................................22Minimize parasitic loads. .....................................................................................................................22“Rightsize”—match equipment and output to loads served...............................................................23Optimize for efficiency over integrated load, not for any specific load. ............................................23
LOW-COST AND NO-COST RECOMMENDATIONS ....................................................................24Turn off unneeded equipment. ............................................................................................................24Increase chiller lift and reduce CHW flow rate..................................................................................25Optimize SW cooling flow rate. ...........................................................................................................25Reset CHW temperature to 1 F˚ below the highest zone temperature...............................................25
POTENTIAL RETROFIT OPPORTUNITIES....................................................................................26Improve motor, pump, and fan efficiency comprehensively. .............................................................26Use Variable-Speed Drives (VSDs) on variable loads. .......................................................................27Improve duct and pipe pressure drops and entering/leaving conditions. ..........................................28Improve power factor. ..........................................................................................................................30Improve electrical power generation efficiency..................................................................................32Improve propulsion power efficiency..................................................................................................44Improve pumping efficiency. ...............................................................................................................50Improve fan efficiency. ........................................................................................................................54
IMPROVE SPACE COOLING SYSTEMS EQUIPMENT AND OPERATIONS. .....................................................56Thermal integration: (re)use waste heat. ............................................................................................62Improve energy efficiency of potable water production, heating, and use........................................63Improve lighting efficiency and quality. .............................................................................................71Improve air compressor efficiency. .....................................................................................................75Upgrade monitoring and controls. ......................................................................................................76
POTENTIAL NEW SHIP DESIGN OPPORTUNITIES ............................................79

Rocky Mountain Institute Energy Efficiency Survey Aboard USS Princeton CG-59© RMI 2001 www.rmi.org 30 June 2001 unclassified
3
RECOMMENDATIONS ................................................................................................81
APPENDIX A: CHILLER MEASUREMENT SURVEY REPORT..........................83
APPENDIX B: ELECTRICITY USE OF LARGE PUMPS AND FANS..................86
APPENDIX C: NAVSEA CG-47 FUEL CONSUMPTION CURVES.......................88
APPENDIX D: RESOURCE-EFFICIENT DESIGN PRINCIPLES AND RMICONCEPTUAL APPROACH .......................................................................................90
APPENDIX E: MULTIPLE BENEFITS IN MOTOR SYSTEMS ............................95
APPENDIX F: MULTIPLE BENEFITS IN FLUORESCENT LIGHTINGSYSTEMS ......................................................................................................................100
APPENDIX G: OPTIMAL SEQUENCE FOR LIGHTING IMPROVEMENTS .104
APPENDIX H: OPTIMAL SEQUENCE FOR COOLING IMPROVEMENTS ..106
APPENDIX I: SENSORS, METRICS, MONITORING, AND CONTROLSYSTEMS ......................................................................................................................109
APPENDIX J: POWER FACTOR AND PHASE UNBALANCE............................112
APPENDIX K: NAVSEA ENCON ENERGY SURVEY CHECKLIST..................116
APPENDIX L: TEAM BIOGRAPHIES AND RMI QUALIFICATIONS.............119
APPENDIX M: INFORMATION SOURCES AND BIBLIOGRAPHY .................124
APPENDIX N: GLOSSARY OF TERMS, ACRONYMS, ANDABBREVIATIONS .......................................................................................................126

Rocky Mountain Institute Energy Efficiency Survey Aboard USS Princeton CG-59© RMI 2001 www.rmi.org 30 June 2001 unclassified
4
DISTRIBUTION LISTUSS Princeton CG-59
SkipperXOCHENG
USNHon. Gordon R. England, SECNAVADM Vern Clark, CNOADM William Fallon, VCNOVADM Denny McGinn, Deputy CNO (N7)Dr. Alan Roberts, Office of the CNORADM Kevin Cosgriff, Director OPAVADM Ed Moore, COMNAVSURFPACVADM Mike Bucchi, COMTHIRDFLTVADM Arthur K. Cebrowski, President, NWCADM (Ret.) Jim Hogg, Director SSG/NWCDr. Mike Stumborg, SSG/NWCRADM Michael Johnson, COMNAVFACLCDR Eric Rasmussen, MCONR
RADM Jay M. Cohen, DirectorScott Littlefield, Deputy Director, Naval Ship OfficeJudith Distler, ONR 33, Arlington, VADavid Paul, ONR N63374, Seattle, WANaval Research Laboratory 5227, Washington, DC
NAVSEAVADM Pete Nanos, COMNAVSEARADM Charlie Hamilton, Dep. PEO(S)A. Bigley, D. DiClementi, M. Hanak, H. Pehlivan, F. Showalter,
W. Stoffel, J. Varley, NSWCCDRusty Cook, CHET
DOD/DSBAndy Marshall, DNAOSDGueta Mezzetti, Office of Chairman JCSDefense Technical Information Center, Fort Belvoir, VADr. Craig Fields, ex-Chairman, DSBVADM (Ret) Richard Truly, Director, NREL; ex-Co-Chairman, DSB PanelTom Morehouse, Institute for Defense Analyses, ex-staff, DSB Panel
OTHERHon. James R. Schlesinger, ex-SECDEFHon. Richard Danzig, ex-SECNAVHon. R. James Woolsey, Esq., ex-UnderSECNAVADM Joe Lopez (Ret.), Halliburton CorporationVADM (Ret.) Lee Gunn, ex-NAVINSGENHon. William Nitze, President, GEMSTAR Group; NewRuleSets.Project, NWC

Rocky Mountain Institute Energy Efficiency Survey Aboard USS Princeton CG-59© RMI 2001 www.rmi.org 30 June 2001 unclassified
5
EXECUTIVE SUMMARYThis report describes the findings and recommendations of Rocky Mountain Institute(RMI)’s unclassified survey of energy efficiency potential aboard USS Princeton CG-59.Energy efficiency seeks to deliver the same service with less fuel and uncompromised orimproved warfighting capability via improved technologies or operational practices.RMI’s reconnaissance focused on hotel loads in cruise condition, and excluded radars,weapons, and C3I systems. This report is intended not as a definitive analysis, but to indi-cate areas for further investigation, also in new ships. It finds potential savings muchlarger than those the Navy has achieved (15% nonaviation) or expects (19% in CG-47).
The cruise-condition electric load is 2 MW in a brief observation, but may be 50+%larger under the range of seasons and conditions. The potential for reducing it is about20–50%, much of it retrofittable. This could reduce fuel use by up to 10–25%, dependingsensitively on improving turbine operating modes and efficiencies. The largest electricsavings would be realized in motors, pumps, fans, chillers, and lighting. If the identifiedelectrical savings were combined with potential improvements (not examined in detail) inelectrical generation and in propulsion, Princeton’s total fuel use could probably be re-duced by about 50% with modest effort, or by roughly 75% with more intensive effort.
VALUE OF SAVED ELECTRICITY ONBOARD
Diesel Fuel Marine is used in roughly equal quantities to propel the ship and make elec-tricity. The FY2002 shipboard delivered fuel price averages ~$54.33/bbl or ~$1.29/gal.Generating each MWh in the Gas Turbine Generators (GTGs) burns roughly 182 gal offuel, worth $235, and costs about $270 in all—roughly ten times the fuel cost of a typicalonshore civilian fossil-fueled power station. Most electrical savings are thus lucrative.
CG-59 ENERGY SAVINGS: PRINCIPAL RECOMMENDATIONS
END-USE EFFICIENCY AND LOAD MANAGEMENT PRINCIPLES
• First reduce loads and energy use, then select the optimal energy supply.• Specify premium-efficiency equipment.• Use measured, not rated or estimated, efficiencies.• Turn off unnecessary equipment.• Minimize parasitic loads.• “Rightsize”—match equipment and output to the measured loads served.• Optimize sizing, and the dispatch of multiple units, for best efficiency over the pat-
tern of various loads, not for any single loadpoint.
LOW-COST AND NO-COST RECOMMENDATIONS• Decrease chiller lift and reduce chilled water flow rate.• Optimize seawater cooling system flow rate.• Reset chilled water temperature to 1 F˚ below the highest zone temperature.

Rocky Mountain Institute Energy Efficiency Survey Aboard USS Princeton CG-59© RMI 2001 www.rmi.org 30 June 2001 unclassified
6
POTENTIAL RETROFIT OPPORTUNITIES
• Improve motor, pump, and fan efficiency comprehensively via whole-system design.• Use Variable-Speed Drives (VSDs) on variable loads.• Improve duct and pipe pressure drops and entering/leaving conditions.• Improve power factor and understanding of its importance.• Improve electrical power generation efficiency. Options include:
• Operate one gas turbine generator (GTG) rather than two in low-threat conditions.• Add a more efficient generator better matched to the load.• Explore efficient new generation technologies such as microturbines or fuel cells.
• Improve propulsion power efficiency. Options range from split-/trail-shaft operations(feasible now) to adding smaller turbines or fuel cells (more feasible in new ship de-sign). Hull and propulsor improvements are important too, but were not examined.
• Improve pumping efficiency. Options include:• Add VSDs to all pumps, particularly fire pumps, seawater (cooling) pumps,
chilled water pumps, and steering gear hydraulic pumps.• Large fire pumps constantly circulate seawater that is discharged overboard. Turn
them off, seal and pressurize the fire main with fresh water (or seawater flusheddaily), maintain pressure with a small pump, and set fire pumps to autostart.
• Improve fan efficiency.• Improve space cooling systems equipment and operations. Options include:
• Run one lead high-efficiency chiller to double efficiency, and control the backupchillers with automatic startup systems.
• Cool Combat Information Center equipment directly, not the space it occupies.• Improve space conditioning controls (e.g., on fan coil units).
• Thermal integration. Options include:• Reuse “waste” heat, matching onboard waste heat flows to potential uses (galley,
HVAC, laundry, hot water).• Explore absorption chillers (and desiccants) that use waste heat for cooling.
• Improve the energy efficiency of potable water (PW) production and heating• Use waste heat for PW production and heating, without making steam.• Conserve up to 25–50% of the PW to save energy.
• Improve lighting efficiency and quality.• Use more efficient technologies and lighting designs, including white paint.• Consider light-emitting diodes for colored and white lighting.
• Improve air compressor efficiency.• Upgrade systems monitoring, sensors, and controls.
RMI recommends making integrated whole-system life-cycle design and assessment rou-tine, and systematically applying fleetwide the NAVSEA energy conservation program’srecommendations and training, supplemented by these findings. This report invites rigor-ous scrutiny, prompt assessment, and if upheld, decisive action. That might start with ex-periments in highly integrated energy design for enhanced economy and warfighting ca-pability—perhaps one intensive retrofit and one new ship design.
Rocky Mountain Institute Energy Efficiency Survey Aboard USS Princeton CG-59© RMI 2001 www.rmi.org 30 June 2001 unclassified
7
INTRODUCTION
Project background and RMI work with DOD
This project—conducting an energy-efficiency survey aboard a warship—grew out ofRocky Mountain Institute’s (RMI’s) longstanding relationships with and work for theDepartment of Defense and particularly for the Navy. RMI’s cofounder and CEO (Re-search) Dr. Amory Lovins has been involved in national-security-related issues for morethan 30 years. Together with RMI co-founder and CEO (Strategy) Hunter Lovins, he haspublished numerous papers and books on energy and national security issues. TheLovinses conducted a study for DOD of the vulnerability of centralized energy systems,which formed the basis for the subsequent book Brittle Power: Energy Strategy for Na-tional Security—still the definitive unclassified work in this field. Its Foreword waswritten by ADM Tom Moorer, former Chairman JCS, and R. James Woolsey, formerUnder Secretary of the Navy. In the 1990s, after coordinating the nongovernmental par-ticipants in the Greening of the White House, RMI led the 1994 charrette (an integrated,intensive, transdisciplinary, whole-systems design workshop) for the “greening” of thePentagon building. Dr. Lovins and other RMI staff have also briefed or advised theServices’ staff and war Colleges, senior leadership including JCS staff, and SECNAV.
After Dr. Lovins’s 1995 brief to the Resource Requirements Review Committee underADM Lopez, the Navy asked RMI to help raise the resource efficiency of its shoresidebuildings and facilities. During 1996–98, RMI helped NAVFAC to launch and support afundamental reform of how the Navy designs all its facilities ashore. RMI trainedNAVFAC architects in integrated design, reviewed eight pilot projects, and participatedin related work at installations including Camp Lejeune, NC, and the Washington NavyYard. RMI’s integrated design approach let NAVFAC and its contractors achieve energysavings often severalfold larger than previously, but at comparable or lower capital costs.This led Dr. Lovins to wonder whether similar improvements might be available afloat.
This shipboard energy efficiency project has its origins in that hypothesis growing out ofRMI’s NAVFAC work; the Institute’s relationship with Third Fleet; and Dr. Lovins’sparticipation in a 1999–2001 Defense Science Board (DSB) panel mentioned below.
Dr. Lovins first met then-CAPT Denny McGinn about a decade ago when, about to skip-per USS Ranger, he heard Lovins lecture at the Naval War College. They renewed theiracquaintance during 1999–2000 when VADM McGinn—then COMTHIRDFLT (nowDeputy CNO)—became aware of RMI’s involvement with NAVFAC and high-levelbriefings to senior Naval officers, and of Lovins’s participation with Third Fleet on Y2Kpreparations and other projects (often with Third Fleet Surgeon LCDR Eric RasmussenMD FACP). RMI has provided both formal and informal support to Third Fleet, whichhas been designated as the test battle lab for “Navy After Next.” In summer 2000,VADM McGinn led a Third Fleet delegation to seek consultation at RMI from Dr.Lovins, Mr. Lotspeich, and other staff on a DARPA project exploring the future of ubiq-uitous computing and the Navy. In spring 1999, VADM McGinn invited Dr. Lovins toconduct a field survey with other RMI experts to test the hypothesis that new techniques

Rocky Mountain Institute Energy Efficiency Survey Aboard USS Princeton CG-59© RMI 2001 www.rmi.org 30 June 2001 unclassified
8
and design integration could raise NAVSEA’s targets for improving hotel-load effi-ciency. Third Fleet nominated USS Princeton. In conversations at the Pentagon on 19June and 11 September 2000, SECNAV also expressed to Dr. Lovins considerable inter-est in what the RMI Team could discover about hotel-load improvements, within thecontext of the expanding Navy–RMI collaboration on a variety of technical and policytopics. This opportunity was further discussed with a SSG/NWC group that visited RMIon 17 November 2000.
Meanwhile, during 1999–2001 Dr. Lovins served on VADM (Ret.) Richard Truly’s De-fense Science Board (DSB) panel examining the scope for improving energy efficiency inall DOD land, sea, and air platforms. The Panel submitted in January 2001 its reportMore Capable Warfighting Through Reduced Fuel Burden. The Panel’s work confirmedthe importance of hotel loads, highlighted indications that there is considerable scope forimproving their efficiency, and identified resulting potential warfighting and fiscal bene-fits. The DSB report mentioned this project, but came too early to report its results.
Project approach and objectives
RMI’s research and consulting work concentrates on the economic, environmental, so-cial, and security benefits of resource efficiency. RMI’s proven approach combines end-use / least-cost analysis; integrated whole-system design; advanced technology; harness-ing market forces; and organizational behavior and incentives. Together, careful attentionto these opportunities can often make very large resource savings cost less than smallones. For further discussion of RMI’s analytical approach and key design principles,please see Appendix D. The RMI Team is experienced in energy and resource efficiencyassessments, and implementation in a broad range of civilian and governmental facilities,including industrial process plants and commercial, residential, and institutional build-ings, as well as in hybrid-electric ground vehicle design.
The objective of this project is to test the hypothesis that potential energy efficiency im-provements in hotel loads, practical and cost-effective to implement aboard a typical sur-face combatant, may be considerably larger than NAVSEA’s current estimates and goals.This is in part based on Dr. Lovins’s casual observations in the past few years aboard theaircraft carrier USS John C. Stennis, the Third Fleet command ship USS Coronado, and(briefly) a submarine and a cruiser. He suspected that the hotel-load retrofit potential isprobably substantially larger than NAVSEA believes, and that in new ships, includingDD-21 where hotel-load efficiency could have major benefits for the design of the entireplatform, the potential is much larger still.
All of RMI’s recommendations and suggestions aim to increase operational effectiveness,and at a minimum, in no way to reduce combat effectiveness or resilience. Moreover,RMI’s experience ashore suggests that with highly efficient end-use, the quality of theservices provided would generally improve; existing ergonomic, reliability, physicalspace, or infrastructural (e.g., power and cooling adequacy) constraints could often becorrected; and the economics should be attractive. This analysis supports the Office of

Rocky Mountain Institute Energy Efficiency Survey Aboard USS Princeton CG-59© RMI 2001 www.rmi.org 30 June 2001 unclassified
9
Naval Research’s (ONR’s) interest in ship design and energy use, and pursues ONR’sobjective of improved operational effectiveness, resource efficiency, and cost reduction.
Project proposal and execution
In November 2000, RMI proposed to ONR to conduct an unclassified onboard survey ofhotel-load energy efficiency potential aboard a typical surface combatant. Hotel loadscomprise onboard equipment and processes that consume energy other than for propul-sion, and for launch in the case of a carrier. (Combat systems—weapons, radars,C3I—were not to be considered, so their efficiency potential would and does remain un-known to RMI and is not considered here, although analogous civilian systems oftenshow important efficiency potential.) RMI planned to observe, measure, and analyze en-ergy and efficiency potential, focusing chiefly on HVAC, lighting, pumping, desalina-tion, cooking, refrigeration, and electronics systems. The study would consider both ret-rofit and new design (e.g., DD-21) opportunities. ONR subsequently provided grant#N00014-01-1-0252 to fund this project, pursuant to the Long Range Scientific andTechnology Program, as referenced in Broad Agency Announcement BAA 00-018. Thesubject vessel selected by Third Fleet was the gas-turbine-propelled Ticonderoga-classAegis cruiser USS Princeton (CG-59), based in San Diego. She has the 6th-lowest under-way fuel intensity of the 27 in her class, and burns nearly $6 million of fuel per year.1
The RMI Team (biographies in Appendix L) made three visits to CG-59. First, a three-person team consisting of team leader Chris Lotspeich and technical specialists Ron Per-kins and Jim Rogers, joined by NAVSEA engineer Frank Showalter, acted as observersand measurement survey planners aboard Princeton during an 11–15 December 2000float. The Team provided an outbrief of preliminary findings to the crew and NAVSEArepresentatives, and subsequently prepared a measurement plan that was approved byPrinceton and participating NAVSEA personnel. Second, RMI Team member Ron Per-kins conducted measurements and installed sensors aboard CG-59 at pierside during25–26 January 2001. Third, an RMI survey team consisting of Chris Lotspeich, JimRogers, and Edwin Orrett completed the measurement survey aboard Princeton during a29 January–2 February 2001 float, and drafted a preliminary report that was reviewed bythe ship’s Chief Engineer. The report was drafted and review copies were circulated inMay 2001. Final edits based on the many helpful comments received, chiefly fromNAVSEA, were entered at the end of June 2001.
Naval considerations
RMI’s technical experience in resource efficiency consulting and research has been pri-marily in civilian industrial facilities. This project is the first RMI has conducted aboardship. Although this imposed a steeper learning curve on RMI Team members than theyusually face in unfamiliar industries, it also helped them to bring a fresh perspective andanalytical approach to marine architecture and Naval procedures. The opportunity to ob-serve Princeton’s crew and systems while underway was invaluable, and allowed the
1 $5.8M based on the FY98–00 SECAP data and the $1.29/gal FY02 delivered fuel price estimated at p. 18.

Rocky Mountain Institute Energy Efficiency Survey Aboard USS Princeton CG-59© RMI 2001 www.rmi.org 30 June 2001 unclassified
10
Team to understand better the unique cultural issues, standard procedures, and militaryconsiderations of the Naval operational context.
Within that unique context, of course, Naval procedures may conflict with optimal energyefficiency, usually for very good reasons such as battle-readiness and survivability. Awarship, after all, is neither a civilian vessel nor a factory, even if many of her mechani-cal systems are similar. Simply stated: unlike warships, factories typically are optimizedfor cost more than for performance. Their processes may be critical and hazardous, butfactories are not designed to move fast, go far, hit hard, and survive being hit by a missilefrom any vector.
Nonetheless, the RMI Team offers several recommendations gleaned from shoreside ci-vilian experience—including experience in critical applications—with the potential toreduce Naval costs and improve operational effectiveness. This report discusses some ofthese factors, and where appropriate notes the relationship between a recommendation theTeam would make in a shoreside facility and its applicability to a warship. Some of theseNaval considerations and the Team’s observations are briefly summarized below. TheRMI Team requests the pardon and solicits the instruction of readers with Naval experi-ence if any of these impressions seem obvious, naive, incorrect, or biased.
Operating conditions: Shipboard energy use is often assessed under four different opera-tional modes: shore (dockside), anchor, cruise (yoke), and battle. Each of these conditionshas different energy consumption implications for each of several types of shipboardsystems, depending on its function. For example, a ship’s propulsion, weapons, and ra-dars might use more energy in battle mode than in cruise mode or at anchor, while certainauxiliary or HVAC systems might use more energy in battle mode than at anchor—butuse more energy still in cruise mode than in battle mode. This report concentrates on en-ergy use under cruise condition. With rare if any exception, under battle conditions, com-bat effectiveness should take priority over energy efficiency if the two objectives conflict.
Marine architecture: Ship design considers factors and priorities rarely addressed ashore.Marine architecture typically seeks to reduce total mass and optimize its distribution forincreased speed and stability. Equipment volume and packaging are important due tospace limitations, often resulting in devices and systems that are seemingly crammed intosmall spaces. These factors significantly affect the volume, routing, and accessibility ofpiping, ductwork, and wiring. The commonly resulting reduced pipe, duct, and wire di-ameters, tight bends, and frequent turns combine to increase friction, resistance, pressuredrop, and energy use. Warship design further differs from civilian marine architecture inkey aspects related to combat effectiveness and casualty resilience, notably by prioritiz-ing mass reduction for increased speed; increasing the amount, sizing margins, and re-dundancy of onboard equipment; and dispersing around the ship redundant mechanicaland electrical systems’ generation and distribution capacity, for increased resilience.These factors can further reduce energy efficiency.
Redundancy for survivability: As is typical on Naval vessels, many of CG-59’s mechani-cal systems (e.g., propulsion, electrical generation and distribution, pumping, HVAC) are

Rocky Mountain Institute Energy Efficiency Survey Aboard USS Princeton CG-59© RMI 2001 www.rmi.org 30 June 2001 unclassified
11
constructed with redundant capacity situated in dispersed locations. Often two or morework-producing devices (e.g., generators, pumps) are run in parallel at partial loads andreduced energy efficiencies, sharing a load that usually could be served by one of thosedevices operating at full capacity. In general, this is done so that a combat or accidentcasualty will not reduce the function of the ship’s systems, even if one of the devices isrendered inoperable—since the other device, or a backup unit, can pick up the full loadsmoothly and rapidly. Although this redundancy reduces energy efficiency in severalsystems, often drastically, it is well-founded in Naval procedures intended to improve theship’s combat effectiveness and survivability. The RMI Team believes that it might bepossible in certain cases to modify these traditional practices so as to maintain this resil-ience yet also increase energy efficiency, as is noted in the report.
Naval standard operating procedures: Naval operational guidelines and (in RMI’s terms)SOPs (e.g., EOSS, PMS, etc.) help simplify, speed, standardize, and institutionalize op-timal operating and maintenance procedures for complex technical systems, and oftenhave been developed over many years of experience. Crews have limited ability to devi-ate from most of these guidelines. NAVSEA notes that ship's engineers may be reluctantto practice energy saving strategies because the Engineering Operating Sequencing Sys-tem (EOSS) Manual does not include them. NAVSSES Philadelphia has been tasked torevise the EOSS to allow ships to use energy conservation techniques listed in the EN-CON Guide.2 Some SOPs occasionally conflict with more energy-efficient alternativemethods, including some RMI Team recommendations. Where applicable, this reportnotes instances where a new approach might offer benefits. In other cases, RMI recom-mendations may unknowingly conflict with existing procedures, as the RMI Team wasnot able to review and assimilate all of the relevant SOPs. As with other aspects of thisreport, the Navy will doubtless decide whether these recommendations are appropriate.
Implementation of NAVSEA energy conservation recommendations: The Navy has longworked to improve energy efficiency. Experience indicates that ships can reduce fuel us-age by 10–30% through procedural and operational modifications (10–15% for diesel andgas turbine ships and 15–30% for steam ships). NAVSEA’s Incentivized Energy Conser-vation (ENCON) Program was established in the early 1990s to make ships more fuelefficient. NAVSEA calculations show that the surface fleet consumed over $600 millionof [apparently nonaviation] fuel in FY1999, and that during that year, energy efficiencysaved $26.3 million in avoided costs (or 4.2% of surface-fleet fuel expenditures). Thepotential energy savings attainable, with full implementation of the ENCON program andNAVSEA initiatives, ranges from $60 million to $90 million per year. In recognition ofthe need to provide crews with an incentive to save fuel, ENCON provides cash awardsto ships, equal to up to 40% of the fuel savings achieved. Of the remaining savings, theinstruction allows 10% for additional training and ENCON program administration. Theremaining 50% of the fuel savings can be used by the CINCs to improve ship readiness.Shipboard Energy Conservation Assistance Teams (SECATs) train CHENGs, Main Pro-pulsion Assistants, and Oil Kings that fuel and maintenance cost savings can be realizedby going to single generator operation when practicable. SECAT self-help software in-cludes the Ship Energy Conservation Assistance Program (SECAP), which generates fuel 2 “EOSS Revisions,” in the “ENCON Elements” section of www.navsea.navy.mil/encon/Frontpage.htm..

Rocky Mountain Institute Energy Efficiency Survey Aboard USS Princeton CG-59© RMI 2001 www.rmi.org 30 June 2001 unclassified
12
consumption curves and includes step-by-step procedures for conducting test runs forvarious plant alignments. SECAP software can be downloaded from the Internet, andprovides CHENGs with the ability to quickly determine best transit speeds, plant align-ments, and fuel consumption costs for any given transit time and distance.3 It did not ap-pear to the RMI Team that CG-59’s crew, nor those of other ships the Team has visited,was fully implementing the ENCON recommendations (Appendix K).
MIL-SPEC and MIL-STD parameters: Military specifications and standards define indetail the minimum performance characteristics and attributes of equipment and materielprocured by DOD. Non-MIL-SPEC devices and components may not currently be avail-able as options for Navy use, even if equivalents are widely used in the civilian world. Inrecent years DOD has continued to expand the use of commercial off-the-shelf (COTS)technology. Some RMI recommendations may unknowingly include equipment that isnot available in MIL-SPEC versions. Perhaps this report will provide some useful sug-gestions for equipment that might be purchased as a COTS option, or evaluated, devel-oped, or specified in MIL-SPEC versions.
Shipboard vs. shore-based engineering support: Warships are highly self-reliant due totheir technical complexity and mobility, and Naval shipboard organizational culture isrenowned for being adaptive and resourceful. Nevertheless, in practice it is generally im-practical for warships to carry a comprehensive complement of spare parts and technicalspecialists. Vessels therefore rely heavily on shore-based engineering support for morecomplex or extensive repairs, maintenance, and technical support. Ships are maintainedand supported by such organizations as the Combat Homeport Engineering Team(CHET) and NAVSEA; these organizations have more continuity and familiarity with agiven ship than does its given crew at any particular time. This arrangement has manypractical benefits. But to a certain degree, a ship’s crew remains a bit “behind the curve”on best practices with regard to onboard mechanical systems, while for their part theshore-based support staff might not always be as well versed in the operational particu-lars of a specific ship underway. These tradeoffs do not appear to present major draw-backs, but close coordination between ship’s engineering crew and shore-based supportpersonnel requires ongoing effort. Coordination between these groups is facilitated bythose shore-based staff with shipboard experience; interaction while the ship is in port;and increasingly, e-mail connections to ships at sea (CG-59 is among the first ships withextensive e-mail access for the crew).
Manpower, turnover, and training: Recruitment, training, and retention of qualified menand women is a perennial issue for the Navy. (RMI uses the term “manpower” with equalreference to both genders, although Princeton remained an all-male ship during this pro-ject). Officers change assignments and regularly (typically every 1–2 years or so), as doenlisted personnel (although less frequently, often staying in an assignment for up to 3–4years). Turnover of personnel presents a challenge to the organizational memory of ships’complements, despite logs, manuals, SOPs, ongoing training, and the presence of “old-
3 See www.navsea.navy.mil/encon/Frontpage.htm. SECAP software can be downloaded from eitherwww.navsea.navy.mil/encon/SECAPDescription.htm or www.seaworthysys.com. The ENCON programcontact is NAVSEA’s Pehlivan Hasan (202.781.3801/ [email protected].).

Rocky Mountain Institute Energy Efficiency Survey Aboard USS Princeton CG-59© RMI 2001 www.rmi.org 30 June 2001 unclassified
13
timers” in key positions (particularly Chief Petty Officers). Automation also presents op-portunities to reduce manpower levels in certain areas. RMI has no opinion on optimalstaffing levels aboard ship. Relatively higher levels of turnover undermine staff effec-tiveness to some degree in any organization. As in civilian facilities, the RMI Team notedcases in which it appeared that there were different opinions among Naval personnelabout SOPs or technical matters; usually the most experienced or knowledgeable personwas quickly identified, consulted, and deferred to. In a handful of cases, personnel did notappear to be aware of, or to use, normal and optimal operating procedures for mechanicalequipment’s energy efficiency in a civilian environment. Some of these cases might havereflected lack of experience or intimate knowledge of the systems; others might have in-volved such constraining factors as EOSS or other Naval practices with which RMI is notvery familiar. This report notes these issues and instances where applicable.
Generalization of officer skills: In a basic sense, by job description and organizationalculture U.S. Naval officers tend to be generalists, while enlisted personnel and especiallyChief Petty Officers tend to be specialists.4 Officers move from one area of responsibilityto another assignment in a new discipline with regularity, and might serve in severalfunctional areas—engineering, weapons, supplies, etc.—during their service. They oftenrely on more specialized and experienced Chiefs and other technicians for detailedknowledge of a particular topic or system. Overall this tradition of varied assignments hasserved the Navy well, and creates well-rounded leaders with broad direct experience of arange of shipboard functions. But there are trade-offs. Officers have commented that of-ten they are moved on to a new assignment just as they finally begin to feel comfortablewith the area they have worked in for the past year or two. One officer with experience asa liaison in a European navy said he preferred the career-long specialization and topicalmastery that other navies employ; e.g., once a weapons officer, always a weapons officer.Chiefs have found themselves contradicting the stated opinion of an officer on a giventopic with which the officer is less familiar. In a few cases it appeared to the RMI Teamthat engineering officers were not well versed in certain techniques and technologies thatare common in civilian facilities engineering, and may not always have noticed opportu-nities for their subordinates to improve systems operations.
Cost of fuel and power: The Navy must buy fuel, and from that fuel make electricalpower. More efficient use of that electricity reduces fuel use, cost, and associated emis-sions and signatures. Fuel delivered at sea costs significantly more, especially in remotesites. Cost reductions allow the Navy to stretch its limited budget, financing operationalreadiness from eliminated waste. Equipment retrofits and optimal operating procedurescan reduce fuel use in existing vessels. In new ship designs in particular, energy-savingintegrated whole-systems design techniques can reduce capital as well as operating costs.Optimal systems operations can also extend equipment life and reduce O&M costs.
4 One CG-59 officer had this familiar quotation pinned up on his wall: “A professional naval officer shouldbe able to change a diaper, plan an invasion, deliver a speech, butcher a hog, design a building, write a son-net, balance accounts, build a wall, set a bone, comfort the dying, take orders, give orders, cooperate, actalone, solve equations, analyze a new problem, pitch manure, program a computer, cook a tasty meal, fightefficiently, and die gallantly. Specialization is for insects.” — Robert A. Heinlein, USNA ’20.

Rocky Mountain Institute Energy Efficiency Survey Aboard USS Princeton CG-59© RMI 2001 www.rmi.org 30 June 2001 unclassified
14
Logistical requirements: Increased energy efficiency and reduced fuel use can increasetime on station, extend operating range, and reduce the number and frequency of in-portand underway replenishments, increasing the Navy’s tooth-to-tail ratio. This both savesmoney and reduces vulnerability to interdiction of fuel supplies. This report also ad-dresses potable water efficiency, with attendant benefits of extending limited supplies offresh water and the energy required to produce, deliver, and when membrane treatmentsystems are introduced, dispose of it.
Signatures and emissions: Increased electrical and fuel efficiency can reduce both signa-ture emissions (e.g., heat, noise, perhaps magnetics), making the ship harder to detect,and decrease its environmental impacts (e.g., combustion emissions).
Acknowledgements
The RMI Team would like to acknowledge the assistance of the many people who havesupported this project, although there are too many to name individually. This studyprobably would not have occurred without the vital initiative, direction, and senior sup-port of then-COMTHIRDFLT VADM Denny McGinn and then-Third Fleet SurgeonLCDR Eric Rasmussen MD. The Team is especially grateful to the officers and crew ofUSS Princeton for their exemplary and tireless cooperation, without which this reportwould not have been possible. Princeton’s CO CAPT Joseph Corsi, then-XO CDR BryanMcGrath, CHENG CDR Paul Hogue and his very capable engineering personnel, andmany other officers and enlisted personnel graciously and unhesitatingly afforded theRMI Team every opportunity to conduct our research and enjoy our time aboard. CG-59’s engineering staff in particular worked closely with the Team and answered its manyquestions to the best of their abilities. Dr. Alan Roberts at the Office of the CNO pro-vided expert counsel on Naval fuel efficiency and tracked down the answer to severalother questions with NAVSEA personnel.
Many NAVSEA personnel likewise provided excellent support in research and projectcoordination, particularly NSWCCD’s Carderock and Philadelphia offices. RMI espe-cially wishes to thank NAVSEA’s Frank Showalter, who joined the Team’s first floataboard CG-59. Significant research and technical support was provided by NAVSEAElectric Power Branch staffers Andrew Bigley (who has conducted much shipboardelectrical efficiency work), Bill Stoffel, and Johnson Varkey, and their colleagues Do-menic Diclementi and Matt Hanak. Other helpful NAVSEA personnel included MikeMcGovern, Tom Perry, and Richard Steck. Rusty Cook, HM&E specialist at CHET inSan Diego, was a helpful and energetic participant. Scott Littlefield at ONR assisted withand oversaw the grant funding process, and provided valuable technical information.
Besides ONR, other organizations and agencies supporting this effort—directly and for-mally or indirectly and informally—include SECNAV, Deputy CNO, NAVSEA, ThirdFleet, and the DSB panel. Financial support for this project came solely from ONR.
How to read this report

Rocky Mountain Institute Energy Efficiency Survey Aboard USS Princeton CG-59© RMI 2001 www.rmi.org 30 June 2001 unclassified
15
This project seeks both to identify important opportunities for improvement aboard CG-47 class vessels (specifically CG-59) and also to suggest topics for further, more detailedinvestigation by the Navy. Although measurements and technical analysis are vital to thisstudy, overall this report is qualitative rather than exhaustively quantitative. The scope ofwork and budget did not permit a detailed and systemic measurement of all of the ship-board systems under consideration, nor for detailed cost-benefit analyses or engineeringschematics. The survey team conducted a general assessment of potential areas for im-provement that it estimated to have a high probability of being cost-effective from a life-cycle perspective (including system capital costs as well as operating costs).
Information was gathered from four main sources: shipboard instrumentation, logs andmanuals; interviews with crewmembers and NAVSEA personnel; previous research onCG-47-class vessels’ energy use that was made available to the Team; and limited RMITeam measurements using instrumentation and sensors brought aboard CG-59 for thisproject. Certain subsystems were measured and analyzed by the Team, but most datacame from available information. Wherever practicable, this report identifies informationsources and analytical methods. While this report provides specific technical and opera-tion recommendations, overall it should be read as strategic advice rather than as an engi-neering analysis upon which procurement and operational decisions should be basedwithout further evaluation by qualified Naval authorities. It is hoped to serve as a road-map for some, but not all, of the salient opportunities meriting closer study by the Navy.
The first section of this report provides a brief overview of CG-59 electricity use. Thesecond section begins by exploring the economic value of saved electricity and fuelaboard ship, including comments on cost-benefit analysis. Energy efficiency recommen-dations follow, divided into sections that progress from the general to the specific. Ge-neric load reduction measures are described, then low-cost and no-cost recommendations.Retrofit opportunities are discussed in detail, both at the whole-ship level and in system-and device-specific terms. The report comments on both retrofit and new ship design op-portunities throughout, and offers recommendations both for clean-sheet design (e.g.,DD-21 or similar programs) and for institutional next steps The Appendices begin withinformation specific to CG-59, and then provide an overview of relevant RMI perspec-tives, guidelines, and methods for resource efficiency in technical and organizationalsystems. The appendices conclude with Team member biographies (App. L), informationsources and bibliography (App. M), and a glossary of terms and acronyms (App. N).
This report was written by Chris Lotspeich with significant input from Team membersand editing from Dr. Amory Lovins, who also drafted the Abstract and Recommenda-tions. The Team contributed to the full range of research; in particular, Mr. Perkinsworked on HVAC measurements; Mr. Rogers on pump, fan, and lighting analysis; Mr.Orrett on fuel and water use analysis; and Dr. Lovins on economic analysis. The Teamworked closely with Naval personnel, but responsibility for the conclusions is RMI’salone. As the editor melding (and hence risking distorting) the various authors’ contribu-tions, Lotspeich is responsible for any remaining errors or unclarities. Readers’ sugges-tions for improvement are requested and welcomed.

Rocky Mountain Institute Energy Efficiency Survey Aboard USS Princeton CG-59© RMI 2001 www.rmi.org 30 June 2001 unclassified
16
OVERVIEW OF CG-59 ELECTRICITY USEThis study concentrates on potential reductions in electric load on a CG-47 class cruiser,primarily of hotel loads, and particularly under cruise conditions. The RMI Team did notmeasure all of CG-59’s loads, but used available research for an overview of shipboardelectricity use. The Navy had previously conducted several relevant energy studies ofCG-47 class ships. One study of CG-60 provided the following representative overviewof that ship’s calculated summer loads under four operating conditions. This table showsboth current loads and the projected loads following Shipalt 588, the all-electric conver-sion from using steam for potable water production and heating to using reverse osmosisand electric water heating. (CG-59 has not yet undergone the all-electric conversion.)
CALCULATED ELECTRIC LOADS FOR CG-60 (KW)
CONDITION SHORE ANCHOR CRUISE BATTLE
Current load 1,814 2,092 3,248 3,492
Load post all-electric conversion 2,639 2,963 4,247 4,163
NAVSEA provided the following representative overview of a CG-47 class ship’s elec-tric load under summertime cruise conditions, broken down by major system. This tableincludes a NAVSEA composite rough estimate of shipboard energy efficiency potential,if current energy-saving programs, initiatives, and opportunities were fully implemented.It shows a summer cruise load 55% greater than the 2.0-MW winter cruise load RMI ob-served aboard CG-59; the reasons are unknown, but if the observed loads relied on in thisreport are anomalously low, the potential savings in this report could be understated.Moreover, note that NAVSEA thinks it can save ~8% of ship’s electricity in three systemsthe RMI Team didn’t survey—propulsion, power generation, and combat/command.
CG-47 CLASS SUMMER CRUISE CONDITION LOAD AND EFFICIENCY POTENTIAL5
System Average kW Efficiency potential Load after efficiencyPropulsion 345 14.5% (50 kW) 295Electric plant 511 15.5% (79 kW) 432Combat/command 780 16% (125 kW) 655Auxiliary machinery 322 14% (46 kW) 276HVAC 840 33% (277 kW) 563Outfit and furnishings 321 6% (19 kW) 302Total 3,119 19% (596 kW) 2,523
Fuel use for propulsion and electric generation is discussed at pp. 32–49. NAVSEA cal-culations of typical CG-47 total fuel use, in gph and gpnm, are in App. C.
5 “Electrical Energy Efficiency,” presentation to DSB Task Force on Improving Fuel Efficiency of Weap-ons Platforms, presentation handouts, Andrew Bigley, NAVSEA (215.897.1190 /[email protected]).

Rocky Mountain Institute Energy Efficiency Survey Aboard USS Princeton CG-59© RMI 2001 www.rmi.org 30 June 2001 unclassified
17
A ROUGH ESTIMATE OF CG-47 ELECTRICITY DISPOSITION6
The RMI Team used a Navy energy study of CG-58 to calculate components of a CG-47class ship’s electricity usage, assuming a load factor derived from that study’s differentcalculated and measured loads. The pie chart above shows the heating, ventilation and airconditioning (HVAC) systems’ large share of calculated MWh usage (see also App. B).Many of the Team’s energy efficiency recommendations are for HVAC systems. In viewof the many uncertainties about end-use allocation, including load factors (see App. M),such attempts to decompose energy use should be considered indicative, not dispositive.
CG-59 joins an oiler for an underway replenishment. Chris Lotspeich photo. 6 Based on calculated CG-47 class data, unattributed report, 16 June 2000, times 0.724 load factor [derivedfrom measured load from CG-58 on 90˚F day divided by calculated load (or 3,120/4,307 = 0.724)].
Outfitting & furnishings
7%
Command & surveillance
25%
Auxiliary systems17%
HVAC43%
400 Hz converter8%

Rocky Mountain Institute Energy Efficiency Survey Aboard USS Princeton CG-59© RMI 2001 www.rmi.org 30 June 2001 unclassified
18
CG-59 ENERGY SAVING RECOMMENDATIONSThese recommendations primarily apply to CG-59 as a representative typical surfacecombatant, and distinguish between retrofit and new-construction opportunities. All thecomments and suggestions apply to cruise (yoke) operating conditions, but have not beenanalyzed for and may not apply to battle conditions where energy consumption is not apriority. However, our recommendations should not reduce and may improve warfight-ing capability and casualty resistance.
VALUE OF SAVED ELECTRICITY ONBOARD
Onboard electricity is expensive. The FY02 DESC (Defense Energy Supply Center) stan-dard cost of F76 logistics fuel is $0.83/gal ($34.86/bbl)., excluding the cost of deliveryonboard. In FY1999, handling and delivery costs after receipt from DESC added a15–85% premium to the standard fuel price to pay for “delivery to aircraft at an air sta-tion, delivery to ships in port, and delivery to ships at sea by oilers” but not inflight air-craft refueling.7 Dr. Alan Roberts, a senior Naval advisor to the DSB task force men-tioned above, states that in that analysis, 70% of F76 fuel was delivered to ships by oilerwith an estimated delivery cost of $26.88/bbl, and 30% pierside from fuel depots with anestimated delivery cost of $2.18/bbl.8 Weighted-average delivery cost9 thus raises aver-age shipboard fuel cost to $34.86 + $19.47 = $54.33/bbl or $1.29/gal. Delivery cost isn’tnormally counted (save in annual fuel cost calculations for some life cycle cost studies10),but was strongly recommended by the DSB Task Force on Fuel Efficiency of WeaponsPlatforms. It found that omitting delivery cost was severely distorting design, investment,and operational decisions throughout DOD, harming both economy and warfighting.11
Onboard electricity is especially worth saving because it is inefficiently generated fromthis costly fuel. At a nominal underway cruise-mode GTG efficiency of about 14.6% un-der current operating procedure including air bleed for masking (Fig. 1, p. 34), generatingeach MWh burns roughly 182 gal of GTG fuel (Fig. 1 and Table 1, p. 34).12 Just the de-livered fuel cost of that MWh is thus 182 × $1.29 = $235—roughly ten times the fuel costof a typical onshore civilian fossil-fueled steam power station. Thus:
7 More Capable Warfighting Through Reduced Fuel Burden, report of the Defense Science Board TaskForce on Improving Fuel Efficiency of Weapons Platforms, R. Truly, co-Chair, Draft, January 2001, p. 20.8 Dr. Alan Roberts, Office of CNO ([email protected]), personal communication, 3 April 2001.9 The weighted average fuel delivery cost is calculated as ([0.70 × $26.88] + [0.30 × $2.18]) = $19.47.10 Ken Kenyon, NAVSEA SECAT team ([email protected]), personal communication, 27 June 2001. TheDSB report, however, did not find this to be a widespread, let alone a universal, practice.11 Op cit., note 7 above.12 The calculation, following Table 1 but applying the 14.6% conversion efficiency estimated from Fig. 1 atan underway load of ~1 MW per GTG with bleed air (from Fig. 2), is: (7,487 gal ÷ 35.38 MWh) × (12.6%÷ 14.6%) = 182 gal/MWh. Ken Kenyon, NAVSEA SECAT team ([email protected]), notes that this“would appear to be a conservative number. Referring to the nomogram for this class in the SECAP pro-gram, this is approximate[ly] the fuel burned with one GTG operating and no bleed air. For two GTG oper-ating the nomogram indicates over 250 gal/MW[h].” Pers. comm., 27 June 2001. Subject to check, thishigher figure appears to reflect the difficulty of reading a graph accurately. RMI’s figures are derived fromPrinceton personnel’s data and the Allison Gas Turbine Model Specification No. 828-D provided onboard.

Rocky Mountain Institute Energy Efficiency Survey Aboard USS Princeton CG-59© RMI 2001 www.rmi.org 30 June 2001 unclassified
19
• At an illustrative 5%/y real discount rate, a 20-year stream of just the GTG fuel costhas a present value of $11,636 for a 1-kW load in continuous duty during GTG oper-ating hours (which the RMI Team found to be a typical load profile under cruise con-ditions for much onboard equipment)13. In conditioned space, removing the heat costs~34% more.14 Thus eliminating one watt of continuous onboard electrical load inconditioned space saves fuel with a present value (at constant FY02 fuel prices) of~$15.61. That’s about the typical cost of generating an average watt from photovol-taics (solar cells)—the costliest generating option on today’s market.15 (To be sure,that’s not very practical—a CG-47 class cruise-mode load of 2 MW in typical tem-perate latitudes, without the efficiency improvements described in this report, wouldneed over 21 acres of 13%-efficient solar cells—but the cost could still beat GTGs.)
• These figures don’t count the generator’s capital cost or O&M cost, nor distributionlosses to the load terminals, so the actual value of the electricity is evenhigher—approaching $20 per continuous watt. A typical 2.5-MW GTG has a capitalcost of about $3 million and a 40-year present-valued maintenance cost of about $3.4million16. While these together are probably only about one-eighth of lifecyclecost—fuel cost dominates—they raise the cost of an onboard MWh from $235 (fuelonly) to ~$270 total17. (Lower loads make the GTG run cooler and under lower me-chanical stress, extending its life and reducing variable O&M costs.) Assuming a 96%electric distribution efficiency typical of factories, a delivered MWh costs about $281,typical of photovoltaic power costs today, and the 20-year present value of anavoided continuous watt in conditioned space is about $18.66—worth close attention.
• Even that doesn’t include the warfighting or environmental costs of wasted electric-ity—i.e., the foregone benefits of these kinds that are available from reducing on-board fuel use, such as from reduced signatures or from greater operating range with-out entailing sustainment via vulnerable fuel logistics, or from reduced emissions.
• A busbar MWh at an onshore civilian thermal power plant typically costs not $270but only about $20–30 (total fuel, operating, and capital cost). The typical civilian in-dustrial customer ashore in the U.S. in 2000 paid a $44/MWh retail utility tariff—lessthan one-sixth the cost of generating electricity aboard CG-59. Thus the conventional
13 $235/MWh × 3,974 h/y × 20 y × 0.623 discount factor × 0.001 kW/MW. The 3,974 h/y is “effective op-erating hours” for the CG-47 FY96–00 class average. It is calculated from actual operating hours (2,602 h/yunderway + 1,160 not underway = 3,762 total) by adjusting the 1,160 hours not underway by the ratio of14.6% to 12.6% GTG efficiency, normalizing all GTG consumption to GTG cruise-mode efficiency. Thusthe GTGs’ effective duty factor is 3,974 / 8,766 = 0.45. The class average operating hours and CG-59’scomparable typical (FY99) hours—2,545 underway, 1,296 not underway (port/anchor), 3,841 total—werekindly provided by Ken Kenyon, NAVSEA SECAT team ([email protected]), pers. comm., 27 June 2001.14 At the observed cooling-system efficiency of ~1.2 kW/t (p. 58), the chiller and chilled-water pump en-ergy add about 34%, not counting condenser-water pumping and air handling energy.15 Photovoltaic arrays in 2000 cost ~$3.5 per peak watt with 0.19–0.26 capacity factor so without powerconditioning or storage, typical U.S. PV DC output cost ~$14–17. This cost is falling rapidly with volume.16 “Fuel Cells for Marine Applications,” presentation handouts by Mr. Harry Skrutch (703.602.0706), Exe-cution Manager, Ship’s Service Fuel Cell program, Naval Sea Systems Command, presentation to DSBTask Force on Improving Fuel Efficiency of Weapons Platforms, 20 October 2000, p. 19.17 Back-calculated: if ref. 16 used (say) a 5%/y real discount rate, a ~$3.4M 40-year present value corre-sponds to $198k/year or, for 2.5 MW @ 3,974 effective h/y (note 13), $20/MWh. Conservatively using a5%/y real fixed charge rate, a $3M capital cost would be charged at $150k/y or $15/MWh.

Rocky Mountain Institute Energy Efficiency Survey Aboard USS Princeton CG-59© RMI 2001 www.rmi.org 30 June 2001 unclassified
20
civilian shoreside economics that yield short (~1–2-year) simple paybacks for mostenergy-saving retrofits in industry should yield 6-fold faster paybacks aboard ship,such other things as duty factors and retrofit costs being equal. Conversely, onboardsavings six times as costly as they are ashore could still pay back comparably quickly.
• Making CG-59’s ~2 MW for 3,974 effective h/y at $270/MWh costs $2 million/y18;this would rise proportionately if actual average loads are higher (pp. 16, 36, 45, 124).
• Onshore civilian industrial and commercial electricity savings typically cost less than$10 per MWh to achieve—often much less. Against CG-59’s ~$270 / 0.96 = $281/MWh delivered cost, a saving costing $10/MWh pays back in 5.3 months.
• Importantly, however, because of the current parallel-units GTG operating practice,discussed starting on p. 32, about 75–80% of the potential GTG fuel saving fromsaving electricity can’t be captured unless this operating practice is changed. If thisserious problem is not corrected, the economics of saving electricity aboard ship willbe more like those in civilian businesses ashore, rather than manyfold more favorable.
COST-BENEFIT ANALYSIS CONSIDERATIONS
The RMI Team did not examine Naval cost-benefit analytical methods. However, a num-ber of the Team’s recommendations that are typically cost-effective in shoreside civiliansettings (at manyfold lower electricity costs) were responded to informally by Naval per-sonnel as being too costly. This led the Team to suggest that the Navy reconsider its costcalculations, in certain cases. The following guidelines have proved useful ashore:
Use empirical, not estimated or theoretical, costs.
Don’t assume that high efficiency costs more up front—it may not. For example, there isno empirical correlation between the price and efficiency of the commonest kind of in-duction motor (1800-rpm TEFC NEMA Design B) up to at least 300 hp, nor of most in-dustrial pumps (p. 50) and many rooftop chillers. Motor, pump, fan, and chiller efficien-cies are particularly important to Naval electrical efficiency.
Optimize for lifecycle cost, not first cost.
Even if efficiency does cost more up front, it can usually pay for itself quickly, except inequipment operated quite infrequently.
Optimize whole-system cost, not component cost—for multiple benefits
Look for the cheapest overall cost of owning and operating the entire system of which thedevice is a component. Paying more for one component often downsizes or eliminatesothers, reducing total capital cost as well as operating cost. Optimizing components forsingle benefits, not whole systems for multiple benefits, “pessimizes” the system (p. 93).
18 Class average: (2,602 UW h/y × 2.01 MW) + (1,160 NUW h/y × 1.53 MW × (14.6%/12.6%) = 7,365effective MWh/y; that total × $270/MWh = $1.99M/y, if the conditions observed were representative. If theaverage underway load were 3.119 MW (p. 16, summer cruise condition), that would be about $3 million/y.

Rocky Mountain Institute Energy Efficiency Survey Aboard USS Princeton CG-59© RMI 2001 www.rmi.org 30 June 2001 unclassified
21
CG-59 pulls over a fuel line from an oiler. A single complete filling of CG-59’s tankswould incur a delivered cost of about $0.85 million. CG-59 uses approximately $5.8million worth of delivered fuel in a typical year, and is more efficient than three-fourths of the Navy’s 27 hulls of this class. Chris Lotspeich photo.

Rocky Mountain Institute Energy Efficiency Survey Aboard USS Princeton CG-59© RMI 2001 www.rmi.org 30 June 2001 unclassified
22
FIRST THINGS FIRST: END-USE EFFICIENCY AND LOADMANAGEMENT
An important principle of resource-efficient design is first to reduce loads and necessaryenergy consumption, then to optimize the size, type, and efficiency of energy supply.This can reduce the required capacity (hence the size, weight, and cost) of supply systems(including fuel), or permit more efficient operating modes for existing systems. General-ized energy-saving recommendations include:
Specify premium-efficiency equipment.
Premium-efficiency equipment might not cost more up front, but even if it does, the ad-ditional initial investment is usually paid back very quickly in reduced operating costs.
Use measured, not rated or estimated, efficiencies.
Measured efficiency under the actual conditions of installation and use often falls short ofrated efficiency. (It was often difficult for the RMI Team to determine the rated effi-ciency of motors, pumps, and fans due to the lack of nameplate data and lack of readyavailability of file data. The RMI Team did not measure the actual efficiency of any mo-tors, but did infer from its measurements the approximate efficiency of one chiller, whichwas lower than rated—please see p. 56.)
Turn off unnecessary equipment.
This can be as simple as turning off the lights when one leaves a room. Sensors and con-trols can help inform or automate such decisions (e.g., motion sensors for lights in infre-quently occupied spaces). Several systems operate redundant equipment on parallel orstandby status (e.g., fire pumps, GTGs, CHs) so that one component can assume the fullload instantly in case another component (or the primary system) goes off-line. This isnot always necessary despite warships’ need for system resilience. For specific examples,please see p. 24.
Minimize parasitic loads.
Parasitic loads arise when unnecessary work is required because of how a system is de-signed or operated. Just as barnacles on ship’s hull induce unwanted friction, fouledpipes—and sharp-angled pipe bends, pipes and ducts that bend too close to a pump orfan—add friction and thus increase pumping energy and add heat, much of which mustthen be removed all over again. Oversized or inefficient CHW pumps likewise heat CHWwith some of their wasted energy; inefficient fans unnecessarily heat the air they move;these and inefficient motors add more heat to conditioned space. At least a sixth of theindicated chiller load the RMI Team observed is parasitic, not native (p. 56, n. 62).

Rocky Mountain Institute Energy Efficiency Survey Aboard USS Princeton CG-59© RMI 2001 www.rmi.org 30 June 2001 unclassified
23
“Rightsize”—match equipment and output to loads served.
Excess capacity in equipment that is oversized relative to the work required (e.g., in mo-tors, pumps, fans, chillers), beyond the safety margins required by prudent engineeringpractice, often makes equipment run inefficiently at partial loads. Variable-speed drivesor other control systems can allow power devices to use only as much energy as is neces-sary to do the job. It is often worth serving small but frequent loads with a small deviceoptimized to that task, reserving big equipment for the rarer occasions when its capacityis actually required. (This study focuses on cruise condition; each equipment sizing deci-sion must take into account all ship operating conditions and commitments before rec-ommending a retrofit of smaller equipment for efficiency.)
Optimize for efficiency over integrated load, not for any specific load.
It is often worth sacrificing efficiency at an infrequently used loadpoint in order to im-prove it under the conditions more commonly experienced. Fuel is used year-round underall load conditions, not just at a single loadpoint, so the total fuel used per year can bereduced by optimizing integrated efficiency over the entire load range. This may changeunit sizing or characteristics, or encourage the dispatch of multiplex unequal units.
CG-59’s bridge. Chris Lotspeich photo.

Rocky Mountain Institute Energy Efficiency Survey Aboard USS Princeton CG-59© RMI 2001 www.rmi.org 30 June 2001 unclassified
24
LOW-COST AND NO-COST RECOMMENDATIONS
Turn off unneeded equipment.
ObservationsCG-59 consumed electricity at an essentially constant rate of about 2 MW while under-way; this load varied little regardless of time of day or activity on board. (See discussionbelow at p. 35.) The air-conditioning CHs showed a similar load pattern. A significantfraction of this energy is wasted overboard or converted to parasitic cooling load. Appar-ently two significant drivers to the size and the constancy of this load are (1) backgroundloads caused by redundant systems, and (2) equipment that lacks VSDs (yet serves vari-able loads) and is effectively oversized and operating inefficiently. Parallel systems andbackup equipment are often operated simultaneously for redundancy, even when thismight not be necessary for survivability. Using autostart systems on backup devices, ormaintaining devices in standby modes with rapid ramp-up times, might allow a primarydevice to operate at a higher utilization factor and meet the same operational require-ments while both conserving energy and maintaining resilience. Crew members weregenerally resistant to turning off backup systems because critical ship functions dependedon uninterrupted service. This seemed to be compounded in some cases by low confi-dence in automatic controls and lack of detailed knowledge of the support systems’ func-tional capability. Turning backup systems off (in autostart mode) could save perhaps 575BHP or 429 kW of electricity, or 21% of the ship’s total current electrical energy use.
RecommendationsConsider the following opportunities:
• Turn off main fire pumps. Rework fittings and the control system to maintain firesystem pressure with a VSD-equipped lead pump and a backup pump in automaticstartup mode, or small jockey pumps instead of the large fire pumps. See discussionbelow starting on p. 50.
Serving loads with one piece of equipment run efficiently at a higher output rather thansharing it among two pieces run inefficiently at lower outputs can achieve major savings.For example:
• Run one SW pump instead of two. See discussion below starting on p. 52.
• Run one chiller instead of two. One chiller running at closer to full capacity is moreefficient than two running at partial capacity. If one chiller fails, the time it takes for abackup unit to come online is brief but not problematic (particularly with automatedstart-up controls), because the thermal lags of the systems being cooled are typicallymuch longer than chiller startup/rampup time. See discussion below starting on p. 56.
• Run one GTG in routine cruise conditions instead of two. This would be facilitatedby, and would become more important with, load reduction and load management.

Rocky Mountain Institute Energy Efficiency Survey Aboard USS Princeton CG-59© RMI 2001 www.rmi.org 30 June 2001 unclassified
25
Running a GTG at partial load significantly reduces its efficiency. See discussionbelow starting on p. 35.
Increase chiller lift and reduce CHW flow rate.
Resize the CHW pump to be smaller and more efficient. This may save more energy thanthe higher chiller lift uses. Reduce or eliminate flow restriction devices such as balancingvalves, pressure reduction valves, and contorted piping.
Optimize SW cooling flow rate.
Minimize bypassing and non-productive pumping.
Reset CHW temperature to 1 F˚ below the highest zone temperature.
For example, raise the setpoint from ~44˚F to ~46–47˚F. A zone is defined an area con-trolled by sensors and thermostats modulating chilled water control valves.
CG-59 at dusk. Chris Lotspeich photo.

Rocky Mountain Institute Energy Efficiency Survey Aboard USS Princeton CG-59© RMI 2001 www.rmi.org 30 June 2001 unclassified
26
POTENTIAL RETROFIT OPPORTUNITIES
General recommendations include:
Improve motor, pump, and fan efficiency comprehensively.
ObservationsThe Navy generally uses “squirrel-cage” induction motors for shipboard applications.Shipboard motors are rugged and specified to meet shock requirements, and as a resultare reported to have efficiencies in the 90% range. For a given motor specification, it isgenerally most economical to specify the most efficient of the premium-efficiency classof motors, fans, pumps, and similar devices, rather than poorer-performing “high-efficiency” models (which generally represent the least efficient new motors available).Even modest increases of a few percentage points in efficiency can be very cost-effectivein high-duty drivepower applications. For example, a large continuous-duty motor ashoreuses its capital cost equivalent in electricity roughly every month. At the onboard fuelprices calculated above but a similar motor cost (perhaps an incorrect assumption), thatwould be about every week. At the ~$270/MWh total estimated electricity cost aboardCG-59 (p. 19), each one percentage point of efficiency gain in unconditioned space isworth $127/hp in 20-y present value, or a thousand dollars per 100-hp motor per year.19
It was difficult to determine the efficiency of CG-59’s motors, as the nameplates did notlist NEMA or other rated efficiency. No motors from major manufacturers were noted.This may be because motors are rebuilt to MIL-SPEC by vendors that then omit such in-formation from their new nameplate. NAVSEA staff report that older ships tend to havemore rebuilt motors. CG-59 has a motor census indicating location application, horse-power, and other characteristics—but not rated efficiency. The RMI Team has not beenable to obtain rated motor efficiencies from NAVSEA or vendors. Moreover, both part-loading and maintenance practices—such as repeated repainting, which inhibits the es-cape of heat—could yield actual efficiencies well below rated efficiencies. (However,commendably, the Navy is the only large organization in the country that uses internally(e.g., aboard USS John C. Stennis) the excellent Thumm method for rewinding—notstandard burnout ovens, which irreversibly increase iron losses.)
One obstacle to improving motor efficiencies in the fleet (e.g., via retrofits) is concernabout negative effects on shipboard electrical systems. More efficient motors typicallyhave lower impedance and higher inrush currents, which upon start-up produce spikes inpower demand that exceed average operating loads by as much as 10× (compared tonominally 6× in standard-efficiency NEMA Design B motors). The Navy prefers tomaintain power generation capacity margins of ~10% (better if possible) on surface com-batants, to reduce the risk that demand spikes from equipment lighting off might triggerautomatic load-shedding responses, or worse yet damage shipboard electrical systems. 19 (1/0.90) – (1/0.91) × 3,974 h/y × 20 y × 0.623 discount factor × 0.746 kW/hp × $0.27/kWh ÷ 0.96 distri-bution efficiency) = $126.85 present value per hp, or, e.g., $12,685 present value for a 100-hp motor. Theequivalent annual values are $10.18/hp-y, or $1,018/y for a 100-hp motor—all for each percentage point.
Rocky Mountain Institute Energy Efficiency Survey Aboard USS Princeton CG-59© RMI 2001 www.rmi.org 30 June 2001 unclassified
27
However, civilian best practice—if only to reduce wear and tear on mechanical and elec-trical systems—is to equip any motor of 10+ hp with a solid-state soft-start device thatlimits inrush current. This feature is already included in many modern VSDs.
Another obstacle to increased motor efficiency is perceived higher costs. Apparentlymany senior decisionmakers believe that more efficient motors are more expensive, andthat existing motors work fine. The Navy faces budgetary constraints on fleet mainte-nance. However, the RMI Team believes that, in general, maximally efficient motorswould probably reduce life-cycle costs substantially and may not even increase capitalcosts. Research using the Motor Master 3.02 database indicates that, in the U.S. market,there is no correlation between motor cost and efficiency up to at least 300 hp. Naval life-cycle costing and return on investment criteria were not examined by the RMI Team.
RecommendationsSpecify, and retrofit to, the most efficient (or very nearly so) of the premium-efficiencyclass of devices wherever possible. They are almost always the best buy. Every civilianmotor on the U.S. market is listed in DOE’s free MotorMaster software, with a searchengine that can identify the best buy for the application. The MIL-SPEC process shouldbe reexamined to see how necessary it is for various motor applications onboard, espe-cially in light of the availability of specially reliable and rugged types of civilian motorsoff-the-shelf. Where MIL-SPEC is really required, the data on the nameplate legally re-quired for civilian motors, notably efficiency and power factor, should be carried forwardto the new nameplate. Similar considerations apply to pumps and fans.
The Team suggests that life-cycle costing and return on investment criteria be reviewedto optimize decisions with regard to both capital and operating costs as well as whole-systems benefits. Any economic optimization in motor, pump, and fan purchasing shoulduse a refined version—including all costs, not just fuel—of p. 19’s onboard power costestimate. All design should be integrated across whole systems (Appendices D–E).
Only field-testing can reveal actual efficiencies at actual loadpoints and thus the potentialfor improving sizing and efficiency. NAVSEA should consider conducting some spot-checks to prospect for oversizing.20 See also Appendix E.
Use Variable-Speed Drives (VSDs) on variable loads.
ObservationsVSDs allow motors, fans, and pumps to use only as much energy as is required to servethe load in real time. They also reduce wear, startup surges, and maintenance costs. Ap-parently there aren’t any VSDs on Princeton, even though many of the applicationswould seem to merit them and they are widely used in critical civilian applications. VSDs 20 For example, see the method described in K.K. Lobodovsky, “Field Measurements and Determination ofElectric Motor Efficiency,” Energy Engineering 86(3):41–53, Association of Energy Engineers (Atlanta),1989. This test method requires no dynamometer—only about a half-hour, simple measurements (V, A,true W, Ω, T, and slip), and the ability to de-energize and unload the motor. Yet it quite accurately meas-ures the actual loadpoint and efficiency-at-loadpoint, using a combination of IEEE 112B Methods E and F.

Rocky Mountain Institute Energy Efficiency Survey Aboard USS Princeton CG-59© RMI 2001 www.rmi.org 30 June 2001 unclassified
28
nowadays are very rugged, reliable, compact, affordable, and consistent with high powerquality. They are typically designed so that in the very unlikely event of failure, they de-fault (or can easily be bypassed) to constant-speed operation rather than an open or shortcircuit. The Navy uses motor controllers that are not VSDs in many shipboard applica-tions, and they are generally considered highly reliable, although in civilian environ-ments, VSDs run drivepower systems more efficiently than such motor controllers can.
MIL-SPEC VSDs are under development and have been used in limited applications onother Navy ships (e.g., a VSD was applied to a 300 kW motor generator set on the air-craft carrier USS John F. Kennedy and is approved for that application on other CVs21),but progress has been slow. Broader VSD use has been hindered by the limited range ofMIL-SPEC options and relatively high material procurement costs (despite lowerdrivepower system life-cycle costs), particularly under perceived budgetary constraints.
NAVSEA has been investigating VSDs for several years, and coordinates an interde-partmental VSD Team. NAVSEA staff have held discussions with major motor manu-facturers about development of MIL-SPEC VSDs. Apparently most of the large manu-facturers indicated that the military market is too small to give them an incentive to over-come the economic barriers to entry. These barriers include concerns about cost and re-turn on investment (despite life-cycle economic benefits); negative impacts on shipboardpower harmonics and power quality (an issue routinely resolved in demanding civilianapplications); differences between MIL-SPEC and civilian standards and specifications;and manufacturer reluctance to retool production lines for relatively small runs to meetMIL-SPEC requirements. The cumbersome process of MIL-SPEC qualification forCOTS technologies has retarded VSD adoption, which may even then be approved onlyfor specific applications (e.g., gensets but not other motors). To address some of theseconcerns, NAVSEA has MIL-SPEC-qualified a modular-design Alstom COTS drive foruse in varied applications. The rectifier modules allow scalable application by addingmore modules to larger motors. In FY01 NAVSEA will be testing a similar module forLM 2500 GTM cooling fans at a land-based engineering site in Philadelphia.22
RecommendationsWherever practical, specify and retrofit VSDs on drivesystems (e.g., motors, pumps,fans) serving varying loads, rather than switching, throttling, bypassing, or wasting flow.
Improve duct and pipe pressure drops and entering/leaving conditions.
ObservationsEach bend in a pipe or duct increases friction, heat, vibration, turbulence, noise, andpumping or fan power requirements. For example, ventilation and exhaust fans are lo-cated in four places around the ship. Some supply fresh air to AHUs, and some ventilateturbine enclosures and engine room spaces. Many of these fans are connected to ducts via
21 Cutler-Hammer (www.ch.cutler-hammer.com/nc/) provided the VSD for this application; this firm alsomakes motor controllers and other control systems for the Navy.22 Andrew Bigley, Branch Manager, Electric Power Systems Branch, NAVSEA Philadelphia, Code 934(215.897.1190 / [email protected]), personal communication, 9 May 2001.

Rocky Mountain Institute Energy Efficiency Survey Aboard USS Princeton CG-59© RMI 2001 www.rmi.org 30 June 2001 unclassified
29
sharp-angled bends. The same, or worse, is true of pumps and pipes. The best answer isto redesign pipe and duct layouts to minimize or eliminate bends in the first place. Forexample, some pumps observed on Navy vessels would incur only about one-fourth asmany pipe bends if installed in a different orientation in the first place. According to oneONR staffer, preferably—but not always—larger shipboard rotating machinery is ori-ented with the shaft running fore-and-aft to minimize bearing loads due to ship motions(e.g., gyroscopic effects). This preference, along with limited space, may take precedenceover the desire to minimize sharp bends.23 Yet for smaller units, it may be overdone.
Bends, especially sharp bends, in pipes and ducts are especially harmful when they occurtoo close to the entry or exit of a pump or fan. They reduce the machine’s efficiency farbelow its rated value. For optimal efficiency, centrifugal pumps need smooth entry andexit pipe transitions such as long-radius reducing elbows at the suction inlet and at leastfour pipe diameters of straight pipe at the pump's discharge (some engineers recommendat least eight diameters24). Centrifugal fans have even more elaborate hydrodynamic rulesabout entrance and exit conditions.25 Marine architecture and warship design uniquelyconstrain pipe and duct layout, but RMI suspects there is nonetheless room for improve-ment, perhaps in some retrofits and certainly in new ship design. Constrained geometriescan also influence fluid-moving equipment choices: for example, a vaneaxial fan maylook no more efficient than a backward-curved centrifugal fan under free-flow laboratoryconditions, but the vaneaxial fan’s installed (in situ) efficiency is far less sensitive to con-strained entering and leaving conditions than is the efficiency of the centrifugal unit.
23 Scott Littlefield, Deputy Director, Naval Ship Science and Technology Office, Office of Naval Research(703.588.2358 / [email protected]), personal communication, 11 June 2001.24 See E SOURCE Technology Atlas Commercial Space Cooling and Air Handling (1995 ed.), p. 245,www.esource.com.25 Ibid, pp. 130–1.
Ductwork in CG-59’s hangar bay. Note the convoluted enteringconditions, including a 270° bend in airflow. Jim Rogers photo.

Rocky Mountain Institute Energy Efficiency Survey Aboard USS Princeton CG-59© RMI 2001 www.rmi.org 30 June 2001 unclassified
30
Pipe and duct sizing are also very important, because friction falls as nearly the fifthpower of diameter. Even a modestly larger size can greatly reduce friction. So can re-duced flow through the same size—perhaps via reduced cooling loads due to more effi-cient equipment in the conditioned space, for example. This can then reduce the size,weight, cost, and energy usage of the fan or pump, hence of its motor and associatedelectrical equipment. Similar compounding benefits are available from close attention tosmooth pipe and duct interior surfaces; minimizing fittings, valves, and dampers; and se-lecting those units so as to minimize friction. All these shifts in design philosophy arelikely to minimize whole-system capital cost as well as operating cost. See Appendix D.
RecommendationsSome retrofit improvements are possible in existing applications on CG-59. For example,the air intakes for the GTGs drop vertically in a rectangular shaft, at the bottom of whichthe GTG intake air makes a 90° turn into the turbine chamber. Placing fairings, baffles, orsimilar curved surfaces (“turning vanes”) in this shaft to smooth out the directionalchanges in the airflow would reduce friction and turbulence, lowering both fanpower re-quirements and noise, as well as improving airflow into the GTG. (There may also beopportunities to precool GTM and GTG intake air to improve turbine efficiencies, for ex-ample with absorption chillers run on waste heat or, in climate zones where marine airdoes not approach saturation (or downstream of a heat-driven desiccant in any climate),with turbine-inlet evaporative cooling; please see p. 63 below.)
In new installations, naval architects and mechanical engineers should place a high prior-ity on systematically minimizing fluid flow and its friction. This can leverage large up-stream savings in equipment size, cost, weight, fuel, and signatures. In civilian design,the best approach is to lay out the pipes and ducts first, then the equipment they serve.Used as far as possible, this approach is likely to pay dividends in naval architecture too.
Improve power factor.
ObservationsPF (Appendix J) was difficult to determine, as the RMI Team did not observe any PF in-dicators or DDIs on any CCS control panels elsewhere, and CG-59’s engineering staffdid not seem certain what the ship’s electrical system PF was. (Navy ships in generalseem to lack PF indicators.26) Apparently the ship’s nominal PF is 0.8. This is subopti-mal, and requires the ship to generate more power than it needs. In the civilian world, fa-cilities attempt to maintain PFs as close to 1.0 as is practical (typically in the 0.90–0.95range). The same electrical engineering principles should apply aboard ship.
Section 5.1.6.3 of MIL-STD-1399 (Navy) Section 300A, dated 13 October 1987, states:“Shipboard electric power systems are designed to operate with an overall p.f. of 0.80lagging to 0.95 leading for 60 Hz power systems and 0.80 lagging to unity for 400 Hzpower systems.” MIL-STD-1399 is considered an interface standard, characterizing the 26 Personal communications with CG-59 engineering staff while aboard, and with Andrew Bigley,NAVSEA Branch Manager, Electric Power Systems Branch, NAVSEA Philadelphia, NSWC 934(215.897.1190 / [email protected]), 9 May 2001.

Rocky Mountain Institute Energy Efficiency Survey Aboard USS Princeton CG-59© RMI 2001 www.rmi.org 30 June 2001 unclassified
31
power that equipment must deal with at the interface with the shipboard distribution sys-tem. It is not a power quality specification.27 Some of CG-59’s engineering staff believedthat PF of 0.8 is a Navy standard (one officer reported that “The Navy pays to keep it at0.8.”) A NAVSEA energy staffer reported that the Navy specifies shipboard equipment tooperate at a shipboard PF of 0.8, which is what shipboard systems tend to operate atwithout correction (e.g., banks of capacitors, such as might be found in a civilian electri-cal system). This source wasn’t sure whether there was a Naval standard for PF, butdidn’t believe there’s a standard saying that ships should not operate as close as possibleto unity PF.
All Naval and NAVSEA personnel questioned about this agreed that in principle it isbetter for PF to be as close as practicable to 1.0. So long as power factor remains gener-ally slightly lagging rather than leading, this is sound practice because it reduces thelosses in and capacity of generators and distribution equipment, stretches equipment life,and improves voltage regulation. Ashore, PFs below 0.8 or 0.9 often incur penaltycharges from the utility, which must generate and transmit extra power but cannot chargefor it; on CG-59, the ship is the utility. Power factor below unity therefore requires theGTGs to burn more fuel—increasing cost, pollution, and signatures—to generate powerthat merely heats the distribution system and cannot do useful work.
For example, a PF of 0.8 instead of 0.95 increases distribution-system losses by 42%.Conversely, a PF of 0.95 instead of 0.8 effectively increases distribution capacity by20%. Low PFs also often indicate equipment problems; by increasing shipboard distribu-tion losses, heat up distribution equipment, shortening its life; and add needless coolingand air-handling loads to conditioned space. All these civilian design considerations areespecially important aboard ship, both because of mission-critical equipment sensitive topower quality and because the very high costs estimated on p. 19 above put a specialpremium on avoiding the unnecessary generation of reactive power and associated distri-bution losses.
RecommendationsInstall PF display indicators if they are lacking (e.g., on CCS control panels). Increase theship’s PF above 0.8, aiming closer to 1.0. This need not incur the space, weight, and costof capacitors: just improved inductive loads, such as premium-efficiency motors andelectronic (rather than magnetic) lighting ballasts, would greatly improve PF as a freebyproduct of profitably saving energy.28
Each GTG is rated at 2.5 MW at 0.8 PF. Presumably, if the load’s PF improved, the gen-erator could generate less reactive power but more real power from the same fuel at thesame torque input and hence at the same point on the turbine’s performance-vs.-loadcurve. If so, the turbogenerator set’s efficiency in terms of real power per unit of fuel in-put could improve. This should be checked with the manufacturer as a potential furtherbenefit of increased PF.
27 Ken Kenyon, NAVSEA SECAT team ([email protected]), personal communication, 27 June 2001.28 See E SOURCE, Drivepower Technology Atlas, 1999, pp. 273–286, www.esource.com.

Rocky Mountain Institute Energy Efficiency Survey Aboard USS Princeton CG-59© RMI 2001 www.rmi.org 30 June 2001 unclassified
32
Specific recommendations include:
Improve electrical power generation efficiency.
ObservationsElectrical power used aboard Princeton is generated by gas turbine generator systems(GTGs). Three such systems are aboard, and two were operating in parallel at all timeswith one in cold reserve during the RMI Team’s time afloat. Each GTG includes one Al-lison 501-K17 constant speed gas turbine that drives a load-following generator capableof delivering up to 2.5 MW (~3,300 BHP). Power is varied by adjusting fuel flow to theturbine. When underway, some high-pressure air is bled from the turbine’s compressor tothe ship’s bleed air system, e.g., for use in the Prairie and Masker Air Systems. The shippays a fuel penalty for this bleed air, but the masking benefits are important.
Normal and parallel GTG operations: NAVSEA uses the term “redundant” when talkingabout parallel plant operation, and “normal/alternate” when talking about split plant op-eration. Under cruise and battle conditions, GTGs are typically operated in parallel undera load-sharing control scheme, both to maintain redundancy for fight through resilienceand to be able to serve pulsed or spiking loads (e.g., the acute power draw of the SPY-1Bradar). Operating two generators in parallel also provides additional capacity for tran-sients, and reduces harmonic distortion by lowering the internal source impedance. Dur-ing normal generator operation, one generator is designated as the standby generator, in-dicating it is aligned and ready to start.29
GTG loss and power system resilience: Battle conditions impose special restrictions onsingle GTG operations. This study focuses on cruise conditions, but the 60 Hz powerdistribution and load-shedding aspects of the system provide insight into the risks relatedto generator failure during various GTG operational alignments. Depending on the sys-tems operating and their loading level, combat systems can be operated using one gen-erator (e.g., the SPY radar has high- and low-power modes). But the normal load duringcombat may exceed the capacity of one GTG. The three GTGs feed three switchboardsand five load centers (LCs). The LCs are distributed in zones to increase fight throughresilience. The power distribution system includes three buses on a ring, with automaticbus transfer (ABT) for critical systems and manual bus transfer (MBT) for noncriticalsystems. Each critical piece of equipment or system is fed from an ABT that will switchto alternate power when normal power is lost. In parallel operation on a live ring bus, theABTs would not need to switch. When the GTGs are operating in automatic mode withone standby generator, if there is loss of power to the bus (dead bus) the standby genera-tor will automatically start and be available for use in approximately one minute. If theGTGs were in split plant mode—where one switchboard or LC would feed the normalsupply, and another switchboard or LC would feed the alternate supply—the ABT wouldswitch if normal power were to be lost. During parallel plant operation, if one GTG wereto be lost, the other would continue to feed the bus, preventing any power interruption tocombat systems. If the remaining load exceeded the capacity of one generator, the pro- 29 Frank Showalter, NAVSEA (215.897.7260 / [email protected]), personal communication,25 April 2001.

Rocky Mountain Institute Energy Efficiency Survey Aboard USS Princeton CG-59© RMI 2001 www.rmi.org 30 June 2001 unclassified
33
tective circuitry would shed non-vital circuits. CG-59 is one of two ships with the Tur-bine High Overload Recovery (THOR) system, providing three stages of automatic load-shedding of noncritical systems.30
GTG fuel use: The primary benefit of shipboard electric load reduction is GTG fuel con-servation. Diesel Fuel Marine (F76) is used to fuel the GTGs. This is provided to the tur-bines directly from four service tanks (two forward, port and starboard, and two aft, portand starboard) that have a combined volume of 81,852 gallons. The four 21,500 BHP(16-MWmech) propulsion turbines (GTMs)—each seven times larger than each GTG—arealso fed from these tanks, via the same fuel lines. Fuel is typically drawn from two serv-ice tanks simultaneously (one forward and one aft, one port and one starboard) to main-tain the ship’s trim. When a service tank is drawn down to approximately 50% full, suc-tion is shifted to the appropriate standby service tank and the half-drained tank is refilledfrom storage, after ensuring that fuel quality standards are met. The maximum volume ofF76 carried by Princeton is 659,158 gallons, costing $0.85 million at $1.29/gal delivered.
There are two means for determining fuel expenditure aboard Princeton. One method,deemed the most accurate by veteran senior crewmembers of the Engineering Depart-ment, is sounding the tanks. This is routinely done at midnight and whenever suction isshifted from one service tank to another; the result is expressed in the ship’s Daily Fuel &Water Report (24-h volumes of fuel and potable water expended). Senior engineeringpersonnel also created a special log for our study by doing hourly soundings during a 19-hour period while underway. The other method for monitoring fuel usage is to recordreadings manually from analog fuel gauges in CCS (while making appropriate adjust-ments for replenishment of tanks). This is less accurate than sounding, for two reasons.First, the rolling motion of the ship introduces errors akin to those of trying to infer thefill state of a car’s fuel tank by reading its gas gauge while going up and down hills. Sec-ond, the dials are hard to read accurately, due to logarithmically compressed sections ofthe scale and variability in interpreting values across the curved face.
Although overall fuel consumption is measurable, there is no routine means for identify-ing fuel used by individual turbines, nor even for GTGs vs. GTMs.31 Thus the very largesavings in propulsion fuel that the Navy has already achieved by real-time fuel-flowgauges that permit optimization of speed against the requirements of each mission haveno analogy in the use of fuel to generate electricity. Nevertheless, an ideal opportunitywas presented for determining the thermal efficiency of the GTGs during the RMITeam’s time aboard when Princeton was moored at the wharf at NWS Seal Beach for 40hours, with no shore power, and with its propulsion turbines secured. All fuel expendedwas therefore used solely by the GTGs to generate electricity. The efficiency of electricalgeneration in this situation was determined as follows:
30 Ibid.; also interviews with CG-59 crew.31 The RMI Team did not determine that the ship’s systems could not directly measure GTG fuel use intime to make use of portable fuel meters. Fuel meter availability was noted by Ken Kenyon, NAVSEA SE-CAT team ([email protected]), personal communication, 27 June 2001.

Rocky Mountain Institute Energy Efficiency Survey Aboard USS Princeton CG-59© RMI 2001 www.rmi.org 30 June 2001 unclassified
34
Table 1Efficiency of Gas Turbine Generators (Dockside; Minimal Electrical Load)Fuel Consumed: 7,487
gal9.58 ×108
BTU
24-hr volume from Daily Fuel and Water Re-port, 30 Jan 01. Assumptions: chemical energyis 18,400 BTU/lb (HHV); density is 6.98 lb/gal.
Electricity Gener-ated:
35.38MWh
1.21 ×10⁸
BTU
Energy output recorded from DDI hourly log.Conversion factor is 3,413 BTU/kWh.
Thermal Effi-ciency:
12.6% Output BTU / Input BTU (HHV)
Average Load perGTG on Line:
0.74 MW 29% of Full Load (max: 2.5 MW per GTG)
Data provided by Allison indicate a thermal efficiency of ~13% is not unreasonable forthis powerplant (see Fig. 1): it is caused by operating at an inefficient portion of theGTG’s performance curve.
Allison 501-K17 Gas TurbineData Provided by Allison (except as noted)
0%
5%
10%
15%
20%
25%
0.0 0.5 1.0 1.5 2.0 2.5
MW Output
Th
erm
al E
ffic
ien
cy (
HH
V)
Zero Bleed Airflow
2.37 lb/sec Bleed
Measured aboard Princeton
Fig. 1
The Team also monitored actual energy demand aboard Princeton both at the dock andwhile underway, by recording data reported by the DDI each hour. As indicated by Fig-ure 2 on p. 36, this reveals three things:

Rocky Mountain Institute Energy Efficiency Survey Aboard USS Princeton CG-59© RMI 2001 www.rmi.org 30 June 2001 unclassified
35
• Electrical demand underway is greater than when at the dock (average demand of2.01 MW vs. 1.53 MW), because more systems are operational.
• There is no obvious correlation between time of day and energy demand: while un-derway the load is especially steady—its standard deviation from the mean is only 4percent. This implies, correctly, that very few significant loads (actually none) usevariable speed controls, and that many significant loads are left on all the time.
• Even while underway, the GTGs operate at only 40% of their rated capacity. This ison the low end of their thermal efficiency curve—an efficiency of less than 15% withair bleed, or around 16% without.
This last point might seem to imply that saving one unit of electricity can save about 6–7units of fuel input to the GTG (actually a bit more because of avoided distribution losses).That would be very valuable leverage for saving fuel, cost, and signatures. However, thatleverage is not actually available, because the current practice of operating two GTGs inparallel at all times (said to be required for reasons discussed below), each serving half ofthe electrical load, comes at the price of fuel efficiency, which worsens as the load isfurther reduced. This relationship is expressed by Figures 3 and 4 on pp. 36–37.32 Thesevere penalty exacted by operating the GTGs at ever lower loads and efficiencies meansthat end-use electrical savings of, say, 20% or 50% will respectively save only 5% and12% of the fuel input to the GTG. That is, under the current operating practice, aboutthree-fourths of the fuel that should be saved by saving electricity is not saved, becausereducing the already-low load on the generators makes them even less efficient than theiralready unimpressive performance. This means that even heroic improvements in electri-cal end-use efficiency will yield only modest fuel savings unless the way of generatingelectricity is also addressed.
CG-47 class cruiser emits a plume of engine exhaust. Chris Lotspeich photo. 32 Figure 3 is plotted for one of two GTGs operating in parallel. The deviation between the lines labeled“Dockside” and “Underway” is due to the air bled from GTG compressors to serve the Prairie/Masker Airsystems. This alone requires approximately 60 gal/h of fuel (per Note 4 of a document provided aboardentitled “Nominal CG-47 Class Fuel Consumption Curves,” Enclosure (1): “60 gph for prairie/masker airfrom 2 SSGTGs”).

Rocky Mountain Institute Energy Efficiency Survey Aboard USS Princeton CG-59© RMI 2001 www.rmi.org 30 June 2001 unclassified
36
USS Princeton Electrical Demand
0.0
0.5
1.0
1.5
2.0
2.5
15:0
0
3:00
15:0
0
3:00
15:0
0
3:00
15:0
0
3:00
29 Jan -> 2 Feb 2001
Meg
awat
tsDockside Underway
Fig. 2
GTG: Fuel Consumption vs. MW Output
0
50
100
150
200
250
300
0.0 0.5 1.0 1.5 2.0 2.5
MW Output
Fu
el C
on
sum
pti
on
(g
l/hr)
Underway
Dockside
Fig. 3

Rocky Mountain Institute Energy Efficiency Survey Aboard USS Princeton CG-59© RMI 2001 www.rmi.org 30 June 2001 unclassified
37
Effect of End Use Efficiency Improvements on
GTG Fuel Consumption(Two 2.5 MW GTGs in parallel; 2.0 MW Baseline Demand)
0%
5%
10%
15%
0% 20% 40% 60%
Potential Electrical Savings
Res
ult
ing
GT
G F
uel
Sav
ing
s
Dockside
Underway
Fig. 4
RecommendationsThe analysis of end-use efficiency improvements must be integrated with supply-side ef-ficiency improvements. Treating these two opportunities sequentially and in isolationwill sacrifice about three-fourths of the fuel savings that could otherwise be achieved bysaving electricity. Among the most important opportunities we found aboard Princeton isto combine two approaches: save much of the electricity, and (if possible) seek highlyreliable ways to operate one GTG at 80% load rather than two units at 40% load.33 Thiscombination will increase the operating turbine’s efficiency by more than two-fifths, thusreducing the fuel-saving leverage of saving electricity; but it will also operate on a lesssteep portion of the turbine curve (Fig. 3), where the electrical savings will incur far lesspart-load turbine-efficiency penalty. Alternatively, the Navy might rethink the powerplant entirely.
The opportunity to combine these electric end-use and generating efficiency improve-ments with analogous propulsion-power improvements is analyzed at pp. 44–49, and isshown in Table 4 on p. 49 to have the potential to increase by 4–5-fold—to a potentialsaving on the order of perhaps three-fourths of the ship’s total fuel use—the savingsavailable just by “trailshafting” the GTGs or just by saving one-fifth of the electricalload.
33 This is well within NAVSEA’s margin policy, which permits loading to 90% of rating.

Rocky Mountain Institute Energy Efficiency Survey Aboard USS Princeton CG-59© RMI 2001 www.rmi.org 30 June 2001 unclassified
38
The Team therefore suggests that the Navy explore and contrast at least three scenarios:
1. Consider operating one GTG instead of two during routine operations.2. Replace or supplement one (or more) of the existing GTGs with one or more genera-
tors which have capacities and efficiencies better matched to the load.3. Consider replacing the “rightsized” GTG with an even more efficient and reliable
new technology such as a fuel-cell generator.
These suggestions are discussed below in more detail.
1. CONSIDER OPERATING ONE GTG INSTEAD OF TWO DURING ROUTINE OPERATIONS.
The current 2.01 MW load, and air bleed to serve Prairie/Masker air, together requiring398 gal/h of F76, would need only 299 gal/h if met with a single GTG (25% savings),because the GTGs are more efficient at higher loads. If required for redundancy until asecond GTG can be started if the primary unit fails, a source of instantaneous backuppower would be added (batteries, ultracapacitor bank, flywheel—at least for criticalloads). It is already common practice to operate only one of the four propulsion turbines(“trailshaft” mode) to save fuel when under low-threat conditions and when not facingcritical maneuvering situations. The RMI Team suggests that the same reasoning and ananalogous procedure apply to GTG operation.
If pulsed radar loads are requiring dual GTG operation for voltage regulation (sharing thepulsed load to reduce the chance of tripping critical equipment on transient low voltage),then the Navy should consider adding a mechanical flywheel instead—angular momen-tum is much cheaper than fuel. If necessary, the pulsed radars could be isolated fromother loads by a separate motor-generator set with a big flywheel, or could be buffered byultracapacitors or a ferroresonant transformer, depending on the pulse dynamics. (Fastsolid-state transient eliminators or even superconductive storage loops, both of which arein commercial use to stabilize electric utilities’ transmission and subtransmission sys-tems, may also be appropriate.) Preliminary estimates of potential fuel savings from sin-gle GTG operations are shown on Table 4 on p. 49. Single GTG operations under currentconditions (Strategy 1) offer an estimated 14% savings in total fuel use underway; singleGTG operations plus a 20% load reduction (Strategy 2) offer an estimated 18% saving.
NAVSEA staff have already explored many of these issues, and significant considera-tions and questions remain (and should continue to be explored, in the Team’s opinion).Some Naval personnel have long recognized the drawbacks of operating two GTGs atpartial loads, and have explored the benefits and challenges of single-GTG operations.The Team will attempt to summarize and characterize these issues below.34
Doctrine: Apparently ship COs (and possibly CHENGs) have the discretion to go to asingle-generator alignment, if and when they feel conditions warrant (e.g., peacetime
34 This discussion benefited greatly from the input of Dr. Alan Roberts ([email protected]) at theOffice of the CNO, and NAVSEA’s Andrew Bigley ([email protected]), Bill Stoffel([email protected]), and Jack McGroarty ([email protected]).

Rocky Mountain Institute Energy Efficiency Survey Aboard USS Princeton CG-59© RMI 2001 www.rmi.org 30 June 2001 unclassified
39
cruise conditions, independent transit in open ocean). There may be Type Commander orSquadron doctrines that dictate dual GTG operational alignment requirements for othermore critical conditions (though neither the RMI Team nor NAVSEA personnel that theTeam questioned are aware of any such directives). One NAVSEA staffer noted that,even given the prerogative to do so, it would be unlikely that a CO would consider goingto a single generator if there were any kind of potential threat, in areas of restricted navi-gation, operating in close formation, etc. As noted above, ship's engineers may be reluc-tant to practice energy saving strategies because the EOSS Manual does not includethem; NAVSEA is to revise the EOSS to allow ships to use energy conservation tech-niques listed in the ENCON Guide.35
NAVSEA support for energy conservation: Both the NAVSEA Incentivized Energy Con-servation (ENCON) Program and Shipboard Energy Conservation Assistance Teams(SECATs) train CHENGs, Main Propulsion Assistants, and Oil Kings that fuel andmaintenance cost savings can be realized by going to single generator operations whenpracticable.36 SECAT self-help software includes the Ship Energy Conservation Assis-tance Program (SECAP), which generates fuel consumption curves and includes step-by-step procedures for conducting test runs for various plant alignments. SECAP enablesCHENGs to determine quickly the best transit speeds, plant alignments, and fuel con-sumption costs for any given transit time and distance. The SECAP software package canbe downloaded from www.navsea.navy.mil/encon/SECAPDescription.htm or fromwww.seaworthysys.com. SECAP indicates potential fuel savings from single GTG op-erations. This tool, if fully exploited, is a classic example of sound energy management.
Fight through capability: The primary consideration of single GTG operations is ensur-ing fight through capability, so that the ship’s combat systems suffer no reduction in ca-pabilities due to a casualty or power interruption, even for very brief periods. As oneNAVSEA staffer put it, ships run two GTGs “because of the low confidence levels thatexist and the dangers that can occur when a ship goes dark, even for just one minute.” Itis technically possible to operate combat systems with only one GTG online, but fightthrough capabilities are lessened. If one GTG goes down, it takes approximately 90 sec-onds to bring another one online.37
Motor generators/Static Frequency utilization is currently used on Navy ships to powerup critical combat system loads. Combat systems also require redundant power feeds,primarily for critical operating scenarios (e.g., high threat conditions), as a single loadcannot be separated for redundancy via a single motor genset. If the ship’s electrical sys-tem were to be damaged, there are automatic bus transfer switches (both very fast ABT'scurrently being implemented in the fleet, as well as existing ASCO types) to switch
35 “EOSS Revisions,” “ENCON Elements” section, at www.navsea.navy.mil/encon/Frontpage.htm.36 See www.navsea.navy.mil/encon/Frontpage.htm. The ENCON program contact is NAVSEA’s PehlivanHasan (202.781.3801/ [email protected]).37 In contrast, the 1-L Otto engine of a Honda Insight hybrid-electric car restarts from idle-off to full rpm in<0.1 s via a compact 10-kW 25-ft-lb permanent-magnet pancake motor run by batteries (an ultracapacitorcould run it instead). The concept is scalable, and ship’s electrical loads could meanwhile be met by a smallelectric storage device. The aim would be to make GTG startup time limited by shaft shear, not blade stall.

Rocky Mountain Institute Energy Efficiency Survey Aboard USS Princeton CG-59© RMI 2001 www.rmi.org 30 June 2001 unclassified
40
power feeds to keep combat system up and operational. These distribution considerationsare relevant to power storage device options, as discussed below.
Generating capacity: DDGs and CGs draw electrical loads in cruise mode that would al-low them to run on one GTG. NAVSEA requires a 10% reserve generating capacity, andcurrently certain equipment could light off and increase the load close to that margin, orrisk exceeding it. One NAVSEA staffer noted that often a vessel’s power demand seemsto increase as the ship ages, and therefore the ~20% margin that may exist during singlegenerator operation on a new ship would gradually decrease over time. The RMI Team’sobservations suggest that reducing cruise mode loads—via end-use efficiency, motorsoft-start devices, and improved power factor—would markedly increase the capacitymargin, and perhaps also the security and comfort margin, of single GTG operations.
Fuel and cost savings and trade-offs: A NAVSEA engines group position paper pre-sented to SURFPAC Command in 1998 explored the potential fuel savings of singleGTG operation.38 The paper concentrated on single GTG operations during low threatconditions such as deep water peacetime voyages, as loss of power during transit at seawould not have as serious effects as it might under higher threat conditions. One authorof the study noted that allowing one GTG to remain in operation—spinning and synchro-nized—but at a no load condition would not provide any benefit, because the 2.1 gal/minrequired to operate the GTG at no load would eliminate the fuel saving of single-GTGfull power operation. There are also the other operational factors that would lead to in-creased maintenance. Nonetheless, the study recommended that ships with GTGs shouldoperate only one GTG during transit. In addition to fuel savings, operational maintenanceon one GTG is eliminated, operational hours are reduced, and program overhaul costs aredecreased. The study proposed a detailed investigation into the actual operating times andpossible ramifications of single-generator operations during transits, but that proposalwas not requested nor funded.
Alignment considerations for linked GTGs: Keeping a second GTG ready to take up loadinstantly can be achieved by means other than fuel-intensive idling. Ideally, one GTG insingle operation mode could instead be linked via a clutched shaft to an adjacent backupGTG. This practice would allow the primary GTG to maintain the backup GTG in a noload standby condition by spinning it synchronously, thus avoiding the backup GTG’sfuel use and startup delay. Apparently, such an in-line alignment is a key aspect of thebenefits of trailshafting propulsion turbines, which connect in pairs to a common spin-ning shaft. However, CG-47 GTGs are neither aligned end-to-end nor situated near eachother, which complicates this synchronized approach. This might in principle be over-come by using an electrical rather than a mechanical coupling.
Energy storage devices and systems: If linking CG-47 GTGs together mechanically is notpractical, then an energy storage system might help bring a standby GTG online quicklyand/or meet critical loads until a backup GTG can safely carry the load (see discussionbelow). For example, perhaps a flywheel could be coupled to the shaft of each GTG, witha dedicated (ideally synchronous) electric motor engaged to keep a standby GTG rotating 38 Contact Jack McGroarty ([email protected]) at NAVSEA.

Rocky Mountain Institute Energy Efficiency Survey Aboard USS Princeton CG-59© RMI 2001 www.rmi.org 30 June 2001 unclassified
41
(with its flywheel) in readiness for instant load takeup. The RMI Team did not assess thepracticality of this approach, nor the extent to which resulting windage and bearing loadsmight burden an otherwise unloaded GTG.
The Navy has considered various energy storage systems (e.g., batteries and flywheels)for shaving peak loads and surviving severe load transients that might support both fightthrough capability and single GTG ops. In the 1980s, research was done on a Battery En-ergy Storage System (BESS) specifically to address the problems of dual GTG opera-tions. However, up-front retrofit funds for implementing this system were not found.39
Because combat systems cannot tolerate power outages longer then a few milliseconds,much emphasis was placed on high speed, full power switching capability in the BESSprogram. The same requirement for high-speed load transfer would apply to other tech-nologies for electrical storage such as flywheels. It would also be vital to ensure thatcontrol systems would shed non-critical loads as necessary during unplanned GTG trans-fer events while energy storage devices serve critical loads.
Flywheels offer potentially inexpensive energy storage. The newest types typically usecarbon-fiber rotors and largely or wholly passive magnetic bearings. One NAVSEAstaffer40 reported that the Navy is looking into bidirectional flywheel energy storage de-vices that would power up off the ship’s bus at steady state power conditions and providepower during high power consumption transients. The Navy currently employs flywheelson pulsed power applications for minesweeping generators and as an energy storage de-vice on AOE-6 class auxiliary oilers. These machines have been designed with the fly-wheels on the generator shaft to enhance the inertia constant and help with the pulsedpower duration or transient loading. In this staffer’s opinion, retrofitting a Navy GTGwith a flywheel for energy storage would be a significant effort. However, that opinionwas probably based on traditional metal flywheels or on since-superseded carbon ones.
Naval research now focuses more on carbon fiber flywheels. Spinning in a vacuum athigh speed (10,000–40,000+ rpm), they can maintain a small footprint and generate highrotational energy. Large iron flywheels are seen as a greater Naval retrofit and designchallenge due to their bulk and potential impacts on weights and moments. Some of theperceived shipboard safety issues revolve around flywheels’ high speed, including failuremodes (flywheel burst, bearing failure, containment, fiber combustion), imbalance, lossof vacuum, shock and vibration requirements, and bearing loads and gyroscopic effectsduring high sea states. These issues appear, however, to have been resolved by the RMITeam’s colleagues at AFS Trinity Flywheel in Livermore, CA (www.afstrinity.com).41
This firm is shipping samples of several models to mainly military customers. Flywheelgyro effects are normally handled by either gimbals or double counterrotating wheels; thelatter is used in Trinity’s MPMF model. It stores 3 MJ, e.g., 750 kW for 3 s, in 11 ft3 anda total package mass of 500 lb, and can be combined modularly in one location or many.
39 Contact Dr. Alan Roberts at the Office of the CNO ([email protected]).40 This flywheel section is largely paraphrased or quoted from NAVSEA’s Andrew Bigley (215.897.1190 /[email protected]).41 Contact Fred Schwartz ([email protected]), head of AFS Trinity business development.

Rocky Mountain Institute Energy Efficiency Survey Aboard USS Princeton CG-59© RMI 2001 www.rmi.org 30 June 2001 unclassified
42
In addition to these safety issues, the conversion of the high rpm outputs to useable elec-trical energy is sometimes considered to be a challenge. Modern flywheels like Trinity’sovercome this with ironless Halbach Array permanent-magnet generators coupled to effi-cient high-frequency power electronics to yield DC or any desired output frequency. ANAVSEA informant described more traditional approaches: flywheel systems, in hisview, could use a gear (not desirable for several reasons), or convert to DC and distribute.Flywheels would probably require high-frequency generators (which he felt are only nowemerging from R&D); e.g., a 15,000–18,000 rpm flywheel would feed a ~1,000 Hz gen-set. Thus the ship would have to rectify the output and invert it, requiring significantcontrol systems. Current ship designs utilize 60 Hz power, so the DC would have to beconverted back to 60 Hz via power electronics. In RMI’s view, however, the requiredpower electronics should be readily available from superflywheel, switched-reluctancemotor, and other high-speed (e.g., homopolar) motor inverter technologies and vendors.
Shipboard power system design is moving away from copper wire and towards silicon-based power distribution, which may facilitate the use of flywheels or similar devices.Future ship designs may potentially utilize DC Zonal Electrical Distribution Systems,which in principle would allow flywheel output power to be rectified, put out to theship’s bus, and then inverted via local inverters. NAVSEA is also involved in the R&D ofhigh-frequency alternators that would be small and lightweight. Such alternators, cur-rently being developed for high-speed electromagnetic trains, would be linked to a fly-wheel in rail or shipboard applications.42
2. REPLACE OR SUPPLEMENT ONE (OR MORE) OF THE EXISTING GTGS WITH ONE OR MOREGENERATORS WHICH HAVE CAPACITIES AND EFFICIENCIES BETTER MATCHED TO THE LOAD.
More modern generators would probably be inherently more efficient thanks to techno-logical advances since the original GTGs were procured. Importantly, these units shouldbe sized and selected after end-use efficiency improvements have permanently reducedthe ship’s load, making the new generators smaller than the GTGs. If such alterations areconducted, consider using that opportunity to improve generator and/or turbine efficiencyat the same time. (For related discussion, see Strategy 3 shown in Table 4 on p. 49.)
If it hasn’t already done so, the Navy might consider using modular microturbine gen-erators in scalable clusters or packs. Critical loads could rely on one or more dedicatedmicroturbines and noncritical loads with one GTG, thereby increasing the generating ca-pacity reserve margin to allow single GTG operations with assured fight through capabil-ity. One COTS option is Capstone microturbines (www.capstoneturbine.com). In 30- or60-kW sizes, they are ~26–30%-efficient (about twice as efficient as Princeton’s GTGs),are very compact and quiet, have low NOX, can burn diverse liquid or gaseous fuels, andcould be dispatched modularly to fit the load profile (they come in up to 10-packs, andare hot-swappable). Capstone had shipped 1,400+ units through April 2001 and is rapidly
42 Andrew Bigley, NAVSEA (215.897.1190 / [email protected]), personal communication, 9May 2001.

Rocky Mountain Institute Energy Efficiency Survey Aboard USS Princeton CG-59© RMI 2001 www.rmi.org 30 June 2001 unclassified
43
increasing production. Current cost is ~$900/kW and falling, probably by about threefoldover the next few years. Such devices present a modular, highly resilient architecture,dispatchable stepwise to sustain high array efficiency over a wide range of loads.
3. THE “RIGHTSIZED” GTG COULD BE REPLACED BY AN EVEN MORE EFFICIENT ANDRELIABLE NEW TECHNOLOGY SUCH AS A FUEL-CELL GENERATOR.
Extending this logic, fuel cells are electrochemical devices akin to a refuelable battery.Most designs run on hydrogen, which is either extracted or “reformed” from a hydrocar-bon fuel or electrolyzed from water. Some fuel cells types could either use F76 directly,or draw hydrogen from a fuel processor that itself could be thermally integrated with ex-isting turbines. Fuel cells are highly thermally efficient, converting 50+% of the fuel’schemical energy into electricity; efficiency might rise as loads decrease. Although theyare more expensive, larger, and heavier than an equivalent gas turbine, fuel cells needless fuel, pollute less, and use less cooling. The Navy has been researching fuel cell tech-nologies, and ONR is already making good progress developing molten-carbonate on-board fuel cells with private industry.43 For example, FuelCell Energy, Inc. is developinga fuel cell for DDG-51 class ships, designed to operate on the same F76 DFM in use to-day, specifically to replace the same GTG system that is used aboard Princeton.44 (Forrelated discussion, see Strategy 4 shown in Table 4 on p. 49.) Solid-oxide fuel cells havealso been demonstrated45 that can switch on the fly between logistics fuel and natural gas.
CG-59 reverses propellers during a high-speed turn. Chris Lotspeich photo.
43 Fuel cells being investigated by the Navy for marine service use diesel fuel and have excellent thermalefficiency (~50%) and turndown characteristics. For example, see “Fuel Cells for Marine Applications,”presentation handouts by Mr. Harry Skrutch (tel 703.602.0706), Execution Manager, Ship’s Service FuelCell program, Naval Sea Systems Command, presentation to DSB Task Force on Improving Fuel Effi-ciency of Weapons Platforms, 20 October 2000. See also Abens, Ghezel-Ayagh, Steinfeld, and Sanderson(FuelCell Energy, Inc.), and Cervi (Naval Surface Warfare Center), Development of a Ship Service FuelCell, paper presented at Fuel Cell Energy Seminar 2000, Portland, OR: October 2000,http://www.ercc.com/site/products/marine.html. However, NAVSEA’s current contract to develop a 2.5-MW hotel-load fuel cell for surface combatants—the same size as current GTGs—should be reviewed as tounit size, in light of the scope for and desirability of reducing those loads first, and of modular architecture.44 Sandors Abens, FuelCell Energy, Inc., 3 Great Pasture Rd, Danbury, CT 06811, pers. comm., 19 Feb2001.45 Contact Benson Lee, 216.541.1000 / [email protected].

Rocky Mountain Institute Energy Efficiency Survey Aboard USS Princeton CG-59© RMI 2001 www.rmi.org 30 June 2001 unclassified
44
Improve propulsion power efficiency.
ObservationsAlthough this study is nominally limited to the efficiency of hotel loads, this report iden-tifies the need to expand the analysis to include the efficiency of the electrical generatorsthat serve those loads. To understand better the value of reducing hotel loads in relationto the ship’s total fuel use, and therefore mission readiness, the Team spent one day col-lecting data to estimate an approximate energy balance for the entire ship.
NAVSEA offers fuel consumption data for most Navy ships. SECAP software includesBaseline Fuel Rates for PACFLT. These are defined by three year average underway(UW) and not underway (NUW) fuel rates for each active, fossil fueled ship listed in theNavy Energy Usage Reporting System. NEURS also reports three year average UW andNUW steaming hours. Class averages are used for ships with <3 y operating time.PACFLT data were for FY 98–00 data. CG-59’s estimated total fuel use is shown below:
NEURS three year average fuel rates for CG-5946
Ship Fleet UW bbl/h Fleet UW gal/h NUW bbl/h NUW gal/h UW h/y47
CG-59 28.62 1,202 6.05 254 2,398
GTM fuel use cannot be directly measured in isolation from GTG fuel use with the ship’ssystems; NAVSEA’s free meter installation had not yet been applied to CG-59.48 TheTeam’s first step was to estimate fuel used by each of the major end-uses: propulsion,electricity generation, and compressed air (for the masking systems). As noted above, theamount of fuel used to generate electricity can be determined by working backward fromgenerator output data, which are routinely logged hourly, but only in conjunction withmeasurements made over a 24 h period at dockside when only the GTGs were running.Air obtained from the GTG compressors reportedly requires 60 gal/h.49 The differencebetween these two terms and total fuel consumption is ascribed to propulsion.
All these data came together during one 19-hour period when Princeton’s crew soundedthe fuel service tanks hourly to measure total hourly fuel consumption. The ensuing esti-mate for propulsion fuel consumption was checked for reasonableness by comparingfluctuations in fuel use with those in GTM shaft horsepower (the latter is logged hourlyby the DDI system). After adjusting for variations in the timing of fuel tank soundings by
46 See www.navsea.navy.mil/encon/BaselineFuelRateTable.htm. CG-59 has the second-lowest underwayfuel consumption rate of the 14 PACFLT hulls of this class, 11% below the PACFLT class average, or 7%below the LANT class average, for FY98–00.47 Reportedly the SECAP 3-yr-average UW hours data for all SURPAC ships is not correct and needs to beupdated. Ken Kenyon, NAVSEA SECAT team ([email protected]), pers. comm., 27 June 2001. It seemsinternally consistent to interpret the stated 7,194 UW h/y as a three-year total, so we divided it by three.48 The RMI Team determined that the ship’s systems could not directly measure GTG fuel use only too lateto use portable fuel meters instead. Machalt 370 A provides fuel meters for the main engines of gas turbineships. CG-59 can request them at its next port visit to a Navy Operating Base. The ENCON program coversthe installation of fuel meters at no cost to the ship. Ken Kenyon, NAVSEA SECAT team([email protected]), personal communication, 27 June 2001.49 “Nominal CG-47 Class Fuel Consumption Curves,” provided by Princeton personnel.

Rocky Mountain Institute Energy Efficiency Survey Aboard USS Princeton CG-59© RMI 2001 www.rmi.org 30 June 2001 unclassified
45
using three-hour moving averages, GTM fuel and power fluctuations were found to trackclosely, consistent with the fuel disaggregation model. Figure 5 presents the result.
Fuel Use Underway
0
200
400
600
800
1,000
1,200
15:0
017
:00
19:0
021
:00
23:0
01:
003:
00 5:00
1 Feb -> 2 Feb 2001
gl F
76
per
ho
ur
Propulsion (45%)
Air (8%)
Hotel (47%)
Fig. 5
The ship was operating at relatively low speed throughout this period (generally ≤12knots; powered shaft speed averaged 58 rpm).50 For this period, the GTGs, servicing boththe hotel and air loads, consumed more fuel than the GTMs (55% vs. 45%). For this tooccur in cruise mode, albeit at modest speed, confirms the importance of electrical loads,including hotel loads, although no claim is made that this spot observation is typical.
From the hourly propulsion fuel and shaft horsepower data, the thermal efficiency of thepropulsion plant was determined to be approximately 8% (see Table 3 below)—half thetypical as-used average efficiency of a car engine. This is lower than the 13% measuredfor the GTGs, but is not unreasonable because the GTMs were operating at an average ofonly 4.3% of their full load (vs. 29% load for the GTGs). With this information, the over-all fuel efficiency story, at least for this portion of time underway for which the requisitedata are available, is presented on Figure 7. This shows that roughly 88% of the fuel con-sumed during this [possibly unrepresentative] cruise period to propel the ship and run itsgenerators was converted directly to heat without doing useful work en route.51
The powerful General Electric LM-2500 marine turbines aboard Princeton are designedfor high-speed operation. Data provided by Princeton’s Engineering Department givesanother sense of the relative fuel use of hotel and propulsion loads: the latter dwarf theformer as ship speed increases. 50 Approximately half the time, the ship was operating with a “Split Plant” (one GTM per shaft); the bal-ance of the time with “Trail Shaft” (one shaft powered by one GTM with the driving propeller at 70%pitch, and the other shaft trailing in the over pitch condition, turning freely without power).51 As information required to determine the useful energy (and waste heat) associated with the Prai-rie/Masker air system is unavailable, this portion is excluded.

Rocky Mountain Institute Energy Efficiency Survey Aboard USS Princeton CG-59© RMI 2001 www.rmi.org 30 June 2001 unclassified
46
Table 3Efficiency of Propulsion Turbines (Average Shaft Speed = 58 rpm)Fuel Consumed: 4,869
gal6.23 ×108 BTU
Volume from hourly tank soundings. As-sumed fuel energy is 18,400 BTU/lb (HHV);density is 6.98 lb/gal.
Energy Output: 20,400SHP-h
5.19 ×10⁷ BTU
Energy output recorded from DDI hourlylog. Conversion factor is 2,547 BTU/SHP-h.
Thermal Effi-ciency:
8.3% Output BTU / Input BTU (HHV)
Average Loadper GTM on-line:
890 SHP (ShaftHorsepower)
4.3% of Full Load (max: 21,500 SHP perGTM)
USS Princeton Energy Performance1500 1 Feb -> 0600 2 Feb 2001
0
10
20
30
40
50
Propulsion Hotel Masker Air
Ave
rage
Btu
/hr (
mill
ions
)
Fuel Consumed
Mechanical Output
Fig. 7
Output not
measured

Rocky Mountain Institute Energy Efficiency Survey Aboard USS Princeton CG-59© RMI 2001 www.rmi.org 30 June 2001 unclassified
47
CG 47 Class Fuel Consumption
0
1,000
2,000
3,000
4,000
5,000
6,000
0 5 10 15 20 25 30 35
Speed (knots)
Fu
el C
on
su
mp
tio
n (
gl/h
r) Full Plant
Split Plan t
Trail Shaft
Fig. 8
NAVSEA data available from the ENCON Program also indicate specific fuel use undervaried GTM alignments and speeds in gal/h (GPH) and gal/nautical mile (GPNM).52
RecommendationsThis analysis, particularly as summarized by Figure 7, reveals a large opportunity to im-prove overall energy efficiency when operating below a nominal speed of 10–15 knots.Although the Split and Trail Shaft operating modes help to mitigate the propulsion tur-bines’ inherent inefficiency at low ship speed (and therefore low turbine power levels), aconsiderable opportunity remains to reduce propulsion fuel use at low speeds. The Teamdid not determine the percentage of time this class of ship cruises at low speed, its pro-pulsion plant efficiency at other speeds, and similar parameters. Lacking this baseline in-formation, and knowledge of ship design and the ramifications of different powerplantchoices, the following suggestion is offered to improve thermal efficiency alone.
The Navy might consider installing a new propulsion power source to drive one shaft (orboth) during low-speed operations, assuming the mechanical connections can be made,etc. This might be a small gas turbine—again, designed specifically to support low-speedoperation—or a fuel-cell-powered electric motor. (See Strategies 3–4 in Table 4, p. 49.)A retrofit would face space constraints and would probably require significant effort; thisapproach might be more easily undertaken during major refurbishing, or in new ship de-sign. (The new LHD design incorporates electric motors operating off the ship servicesystem for low speed operations to save fuel.53) In any case, the large gas turbines wouldremain in place to support combat operations and other full-power requirements. 52 See www.navsea.navy.mil/encon/CG47.htm.53 Ken Kenyon, NAVSEA SECAT team ([email protected]), personal communication, 27 June 2001.

Rocky Mountain Institute Energy Efficiency Survey Aboard USS Princeton CG-59© RMI 2001 www.rmi.org 30 June 2001 unclassified
48
FOUR SCENARIOS FOR FUEL SAVINGS OF GTG AND GTE OPS AND CONFIGURATION OPTIONS
Table 4, below, provides preliminary estimates of the potential fuel savings associatedwith four strategies for GTG and GTE operations and configuration, together and incombination. To summarize Table 4:
1. Strategy 1 shows that single GTG operations without reducing electric load can saveabout 14% of the ship’s total fuel use by running the GTGs more efficiently.
2. Strategy 2 assumes single GTG operations and a 20% electric load reduction. Thiscould save 18% of the ship’s total fuel use—whereas without single GTG operations,far less would be saved, because most of the hotel-load savings would be offset byeven lower GTG efficiency at the lower load.
3. Strategy 3 assumes moderate but more realistic electric load reductions (35%), plusnew small gas turbines optimized for both electricity generation and low-speed pro-pulsion. At Standard or lower speeds, this saves about 49% of the ship’s total fuel.
4. Strategy 4 combines low-speed fuel-cell-electric propulsion, a 50% electric load re-duction (which based on this analysis does not seem unreasonable with a concertedeffort), and fuel-cell generation to serve electrical loads. At Standard or lower speeds,this saves about 76% of the ship’s total fuel.
These scenarios do not directly include estimated expense and feasibility; Strategies 3and 4 would be relatively costly and complex retrofits. The Navy has not yet installed norcompleted testing and development of all of the technologies mentioned above (e.g., fuelcells). Nonetheless, these strategies suggest the potential to reduce total CG-59 fuel useby about half with modest effort, or by roughly three-fourths when making a more inten-sive effort to reduce hotel loads while simultaneously installing fuel cells. The latter op-tion would reduce fuel demand by approximately 540 gal/h when operating at Standardspeed or less.54 This level of improved within-the-skin-of-the-ship efficiency wouldquadruple the cruising radius (at this speed) without additional underway replenishment.Alternatively, every seven hours’ cruising at this speed with this improved efficiency willprovide one “free” hour of sprinting at Flank 2. External improvements, such as those inthe Navy’s Bulbous Bow program55 (akin to smoothing the HypercarSM), Stern Flap, andimproved hull husbandry, or better combat systems (p. 16), would add to this potential.
This brief overview does not incorporate other advantages of using fuel cells to serveboth propulsion and hotel loads. The enormous reduction in waste heat (by burning 75%less fuel to accomplish the same things done today) translates to reduced fan use for en-gine cooling, and a 75% reduction in the ship’s thermal signature based on heat fluxwithout regard to temperature, which may also decrease. Furthermore, the value to theNavy of reducing fleet fuel demand is surely significant. The logistics to support—andthe increased vulnerability during—underway replenishment, for example, suggest a highwarfighting value for such dramatic fuel savings. The Defense Science Board Task Forcereport described on p. 8 and cited on p. 18, n. 7, compellingly supports this approach.
54 CG-47 class ships today require ~3,850 gph at Flank 2 (p. 47, Fig. 8: fuel consumption at 28 knots).55 Bow designed for DDG-51 class ships to save 4% of fuel. Mary Zoccola, “Bulbous Bow Saves Fuel,”Wavelengths, March 1997, www.dt.navy.mil/mz/bulbous.html.

Rocky Mountain Institute Energy Efficiency Survey Aboard USS Princeton CG-59© RMI 2001 www.rmi.org 30 June 2001 unclassified
49
Table 4
LOADToday Proposed gph % Comments
Strategy 1: Operate One Instead of Two GTGs (no change in end use efficiency)
PropulsionEfficiency 8.3% 8.3%Fuel (gph) 325 325 0 0%
HotelLoad (MW) 2.01 2.01Efficiency 16% 22%Fuel (gph) 338 239 99 29%
AirFuel (gph) 60 60 0 0% Unchanged (insufficient information)
TOTAL (fuel): 723 624 99 14%
Strategy 2: Modest Hotel Load Efficiency Improvement; Operate Single GTG
PropulsionEfficiency 8.3% 8.3%Fuel (gph) 325 325 0 0%
HotelLoad (MW) 2.01 1.61Efficiency 16% 20%Fuel (gph) 338 210 128 38%
AirFuel (gph) 60 60 0 0% Unchanged (insufficient information)
TOTAL (fuel): 723 594 128 18%
Strategy 3: Moderate Hotel Load Efficiency Improvements; Right Size Gas Turbines
PropulsionEfficiency 8.3% 18%Fuel (gph) 325 150 174 54%
HotelLoad (MW) 2.01 1.31Efficiency 16% 22%Fuel (gph) 338 158 180 53%
AirFuel (gph) 60 60 0 0% Unchanged (insufficient information)
TOTAL (fuel): 723 369 354 49% (Applies at Standard or less speeds)
Strategy 4: High Efficiency Hotel Load; Low-Speed Electric Propulsion; Fuel Cells
PropulsionEfficiency 8.3% 43%Fuel (gph) 325 63 261 81%
HotelLoad (MW) 2.01 1.01Efficiency 16% 50%Fuel (gph) 338 54 284 84%
AirFuel (gph) 60 60 0 0% Unchanged (insufficient information)
TOTAL (fuel): 723 177 546 76% (Applies at Standard or less speeds)
Potential Configurations to Improve Performance at Standard Speed
SCENARIO
Provide new small turbine to power low speed propulsion
Improve end use efficiency by 50%, and install diesel fuel cell (replace one GTG or supplement existing engines)
Provide electric motor, powered by a fuel cell, to drive one shaft during low-speed cruising
SAVINGS
Improve end use efficiency by 35%, and provide new small turbine (replace one GTG or supplement existing engines)
No change in Propulsion System
Improve hotel end use efficiency by 20%, and serve load with one instead of two GTGs.
No change in Propulsion System
Serve entire hotel load with one instead of two GTGs.

Rocky Mountain Institute Energy Efficiency Survey Aboard USS Princeton CG-59© RMI 2001 www.rmi.org 30 June 2001 unclassified
50
Improve pumping efficiency.
Generally speaking, CG-59’s pumps are oversized and operate inefficiently relative to thework they are meant to do. Most pumps appear to be designed for the worst-case condi-tion, so at all other times they are oversized. Pumping systems often are throttled back tocontrol excessive flow or pressure, which means they are doing more work than is re-quired. Apparently there are no pumps with VSDs, so all of the ship’s pumps operate inone of two modes: full-on, or off. Several pumps run continuously when they don’t needto. Some systems unnecessarily discharge water overboard (which must be replaced), andsome of this water is chilled, wasting chiller energy as well as pump energy.
Pump efficiencies appear not to have kept up with the market. A 1989 Swedish studyfound, for a given flow and head, an 8–10 percentage point range of rated design-pointefficiency among manufacturers, or even among different pumps from the same manu-facturer (with 1% price difference). As with U.S. induction motors (p. 27), there was nocorrelation between Swedish industrial pumps’ price and efficiency. The best new pumpsin were 3–10 percentage points more efficient than the average new pump, which in turnwas 3–5 percentage points better than the average in-service pump. Today’s new pumpsare often better than the best were in 1989, thanks to supercomputer design optimization.
Compared to CG-59’s fans (which have similar generic characteristics), most pumps’flow and pressure requirements are better understood and managed. Nevertheless, thereare numerous opportunities to improve energy efficiency by reducing both pump speedand fluid flow. (Recall that power consumption varies as the cube of pump speed, whileflow varies directly with pump speed.) As with the air systems, there are numerous bendsand restrictions in the piping that create turbulence and decrease efficiency. Significantsavings can be achieved simply by reducing pump speed to what is necessary, rather thanoverpumping or throttling back on flow—a common but deplorable practice analogous toflooring a car’s accelerator while controlling its speed by stepping on the brake. As withfans, adding VSDs is the simplest way to achieve the desired speed reduction while sav-ing energy and extending equipment life.
Some specific pumps and pumping systems are addressed below:
FIRE PUMPS
ObservationsThe most extreme example of large background electrical loads is the fire suppressionsystem. During cruise, anchor, and shore operating modes, two of six 125 BHP electricfire pumps run continuously to maintain pressure to 150 PSIG on the network of seawater(SW) fire main piping. (They were observed actually operating at 175 PSIG.) The firemain system is interconnected with the seawater service (SWS) piping network, in casethere is a failure of the two SWS pumps. The SWS system provides water for coolingequipment (e.g., radars), toilet flushing, and other applications. There is no designed flowrequired in the fire mains if no fire condition exists when the SWS interconnect is in the

Rocky Mountain Institute Energy Efficiency Survey Aboard USS Princeton CG-59© RMI 2001 www.rmi.org 30 June 2001 unclassified
51
closed (normal) condition. To keep the fire pumps from over-pressuring and burning up,water is recirculated and ultimately discharged overboard.
This approach uses these large pumps very inefficiently at fractional loads as pressuremaintenance “jockey pumps” and to flush toilets and urinals. This is hard on both thepumps and the piping system. Pipe fouling and scaling due to seawater adds unwantedfriction and pumping energy requirements. The new pumps are made of titanium. Themotor efficiency is rated at 97% (good if actually realized), but the pump efficiency israted at 70.3%56 (this is relatively poor; it should be ≥85%). In effect, 2,200 gpm (2 ×1,100) of seawater is pumped at 150 PSIG through the ship’s fire main piping anddumped overboard, continuously, for most or all of 3,762 (actual CG-47 class average57)operating hours per year.58 The ship runs two pumps instead of one in case one fails, sothat the other will serve the load without interruption of service. (The operators were re-luctant to rely on the automatic pump control system to start off-line pumps, even thoughin principle such a control system should be no less reliable than the automatic bus trans-fer currently relied upon for the entire ship’s redundant power supply.)
This practice draws about 210 kW of electric power59 (791 MWh/y at 3,762 operatingh/y, assumed to equate to cruise + anchor + shore modes). At $270/MWh (cruise mode,p. 19), this costs ~$198,000/y—a 20-year present-valued cost of $2.66 million. Perhapsthe worst consequence is the constant seawater abrasion, erosion, corrosion, scaling, andfouling of the fire main pumps and piping. (Princeton’s CHENG reported that the pumpand first elbow had had to be converted to costly titanium to combat erosion.60) Mainte-nance and replacement costs for the whole system should be factored into this decision.On its face, a multi-million-dollar present-valued electricity cost per two fire pumps, onone ship, would seem to justify careful examination of operational alternatives.
RecommendationsTurn the fire pumps off. Substitute the shore-based technique of sealing and then pres-surizing the fire main with fresh water (or seawater, flushed regularly to reduce fouling),maintaining header pressure with a small jockey pump, and placing the main SW firepumps in “auto” control mode (i.e., start if there is a loss of header pressure). Excessivecycling of the jockey pump would indicate a leak in the fire mains. The starting of a mainfire pump would signal a fire, failure of SWS pumps, or a major pipe break. Fire pumpreliability and rapid ramp-up times could be ensured with regular testing. This approachwould provide a better fail-safe condition than the present practices, and would signifi-cantly reduce both maintenance and waste.
56 Frank Showalter, pers. comm., 26 Dec. 2000, based on a 1995 Navy standard; 215.897.7260 /[email protected] Ken Kenyon, NAVSEA SECAT team ([email protected]), personal communication, 27 June 2001.58 Using Kenyon's CG-47 class average.59 The kW usage of the two pumps, each @ 1100 gpm @ 150 psi, is given by the pump equation: (2200gpm × 346 ft w.g. × 0.746 kW/hp) ÷ (3960 gpm-ft w.g./hp × 0.703 pump efficiency × 0.97 motor effi-ciency). Measurements confirmed that one pump draws 104 kW of power: 168 amps × 452 volts × 1.73 [=√3, the three-phase correction factor] × 0.79 inferred power factor = 105.2 kW, in good agreement.60 LCDR Paul Hogue, pers. comm., 2 Feb. 2001.

Rocky Mountain Institute Energy Efficiency Survey Aboard USS Princeton CG-59© RMI 2001 www.rmi.org 30 June 2001 unclassified
52
Add VSDs to operate closer to minimum system pressure (on whatever sized pumps areused). Lower pump speeds reduce flow proportionately and energy use as the cube.
Consider using a pipe and tube cleaning system to reduce sea growth, scaling, and otherpressure-inducing buildup. Explore chemical, mechanical, and possibly magnetic meth-ods. Investigate magnetic anti-scaling devices for pipe, boiler, and condenser watertreatment. This is a somewhat disputed approach, but appears to have documented suc-cesses ashore, and might be able to reduce friction-induced parasitic loads. The scientificbasis for using a high periodic magnetic field to cause calcium carbonate to crystallize ina slippery vs. sticky form seems sound, but application success varies and requires ex-perimental verification. Magnetic signature considerations might also have to be takeninto account but are probably unimportant compared to other constant and variable fields.
System energy use could potentially be reduced by as much as 20–90+%, dependingupon the measures implemented.
SW (COOLING) PUMPS
ObservationsCG-59 uses seawater to cool some equipment (e.g., radars). The crew runs two of three125 hp SW cooling system pumps at full capacity. System pressure was observed at 60PSIG; the target is 3,000 gpm flow at 50 PSIG. Some SW bypasses equipment; all of it isvented overboard.
RecommendationsRMI recommends adding VSDs to maintain pressure at 50 PSIG (if that is actually thepressure implied by optimized system design). Because of the cube-law dependence ofpump energy on flow, reducing pressure from 60 PSIG to 50 PSIG might save as much as~40% of the electricity.
The RMI Team also suggests consideration of a novel cooling strategy, possibly for retro-fits and at least for new ship design. In a sense, the hull is one-half of a plate-exchangerHX. Consider adding cooling coils inside the hull for the other “half,” to make closed-loop condenser water for process/equipment cooling. Apparently some tugboats use thisapproach. This would be a significant retrofit project for CG-59 (assuming that the spaceto do so even exists), and would probably best be explored in new ship design.
CHILLED WATER PUMP
ObservationsThe 50 hp chilled water pumps (CHWPs) appear to be inefficient. The ship apparentlyruns two of four total pumps at yoke, with a specified flow of 720 gpm (730 gpm ob-served) and a specified ∆P of 56 psi (from 82 psig to 26 psig). Based on RMI’s observa-tions, and assuming (as there are no data available) a motor efficiency of 90% and apump impeller efficiency of 80%, the CHWP efficiency would be 0.1 kW/ton. In con-trast, best practice ashore is 0.026 kW/ton—fourfold less. A typical shore-based flow rate

Rocky Mountain Institute Energy Efficiency Survey Aboard USS Princeton CG-59© RMI 2001 www.rmi.org 30 June 2001 unclassified
53
is 2.4 gpm/ton (at ARI conditions). Apparently the ship needs 480 gpm (based on 10 F˚∆T), but is pumping 729 gpm if the ship’s flowmeter is accurate. This system has vari-able flow, but uses a constant-speed pump. It is overpumped and induces parasitic loads.Increasing the chiller lift, by slowing the CHWP or trimming the impeller, would reducepumping parasitic load considerably. Since the condenser pumping is provided by theSWS pumps, there are no condenser water pumps. These pumps are horizontal split casepumps. Although pump curves for these units were not available, the fire pump curvesshow efficiencies of less than 80%.
Operating conditions vary, and cooling must be done in warmer waters (e.g., the PersianGulf). As the sea water temperature rises, more flow will be required to remove the sameamount of heat. The system should be controlled to produce a set amount of ∆T (10 F˚).
Chilled water pump. Note the constrained entering and leaving conditions of thepiping, with immediate 90° turns. Ron Perkins photo (camera date was mis-set).
RecommendationsAdd a VSD to the CHWPs, trim the impeller, and increase motor efficiency to match andserve the load more efficiently. Balance flow at CIC Fan Coil Units (FCUs) by eliminat-ing or opening balancing valves.
Rocky Mountain Institute Energy Efficiency Survey Aboard USS Princeton CG-59© RMI 2001 www.rmi.org 30 June 2001 unclassified
54
STEERING GEAR HYDRAULIC PUMPS
ObservationsAt yoke, each of the rudders typically operates on one (of two) 100 hp hydraulic pumps(four total, all of which operate under battle conditions). The RMI Team observed all fouroperating at yoke. These pumps maintain 700 PSIG hydraulic pressure for steering theship; an undetermined amount of hydraulic fluid is bypassed when not needed. However,much of the energy is expended on—wasted in—a hydraulic bypass system because theload varies, since most rudder orders (minor and continual fluctuations to maintain asteady course) require relatively little energy to carry out.
RecommendationsUse VSDs on these pumps, set to maintain desired pressure. For example, at yoke set thefirst pump to maintain pressure at 700 PSIG, and set the second (backup) pump to comeon anytime the pressure drops below a certain setpoint (e.g., 650 PSIG).
Improve fan efficiency.
ObservationsThe GTMs (propulsion turbines) have four 80 hp turbine cooling fans, one per turbine;the GTGs have six 60 hp fans, two per turbine. There are about 78 supply and exhaustfans on CG-59. Of these, 50 are 2 hp or larger and 32 are 5 hp or larger. There are about138 FCUs with The RMI Team was unable to measure this fan load, but estimated the fanperformance in a typical FCU to be about 0.5 kW/ton, at 1/5 hp. The design static pres-sures range from 5" to 0.5" w.g. TSP.
Many of the supply and exhaust systems need a complete analysis and balancing. Somefans appear to be oversized and either supply too much air or must be throttled back tocontrol excessive air flow—very inefficient either way. All fans on the ship operate es-sentially in binary mode: on or off. There are no VSDs. By definition, the fan systems aredesigned for the worst-case condition, so at all other times they are oversized. Some fansrun continuously, often 24/7, unnecessarily (e.g., in the galley and scullery). Exhaust fansthat unnecessarily vent conditioned air waste chiller and pump as well as fan energy.
RecommendationsOne approach is to replace oversized fans with properly sized units. However, that iseasier said than done on a Navy ship. Another, often better, solution is to install VSDs onthe larger fans that have variable loads, then control the speed to maintain desired para-meters (e.g., temperature, static pressure, etc.). The best candidates are the turbine cool-ing fans. (As noted above, in FY01, NAVSEA will be testing a VSD module for LM2500 GTM cooling fans at a land-based engineering site in Philadelphia.61) Install con-trols that turn off fans when they are not needed. For example, the galley and scullerycould have “Melink” controls that slow the hood fans in the galley when there is nocooking activity. Install premium efficiency motors in units with long run times (FCUs).
61 Personal communication, Andrew Bigley, Branch Manager, Electric Power Systems Branch, NAVSEAPhiladelphia, Code 934 (215.897.1190 / [email protected]), 9 May 2001.

Rocky Mountain Institute Energy Efficiency Survey Aboard USS Princeton CG-59© RMI 2001 www.rmi.org 30 June 2001 unclassified
55
The VSD approach will produce major savings at least cost. If fan speed and flow volumecan be reduced by only 20%, the energy saved is 49% because of the cube law (actually afew points less due to inverter losses). If the speed of a fan can be reduced by 50%, theenergy savings will be about 87% (ditto). On Princeton, and probably other ships, thesavings could be even greater because of the turbulent flow conditions in many ventila-tion ducts as a result of the numerous bends and restrictions. A representative example:
The Outside Make-up Air Fanshown here is one of four unitsproviding ventilation air to theship. The axial fan motor draws 5kW,* producing an external staticpressure of 1.83" w.g. Not visiblein this picture is the fan inlet lo-cated 3" off deck. The restrictedinlet and outlet, 180° change inflow direction, and short transi-tion to cooling coil section se-verely degrade the fan system’saerodynamics. The photographshows the very congested equip-ment space (not large enough toenter for maintenance or repair).Future designs should use thecompartment as the air duct andeliminate ductwork and transi-tions. The fan should be aimed inthe direction of airflow into theship. In this case, one fan wouldbe pointing downward, and onehorizontally exiting through thecoiling coil. This arrangementwould minimize pressure dropand duct losses, and lower the fanpower by at least 2/3 (3.3 kW).The inefficiencies of the systemcreate heat in the air stream andload for the chiller. The suggestedfan power and weight reductionwould translate into generator,turbine, chiller sizing, and fuelsavings. A less familiar conceptworth considering is a passivelatent heat exchanger (App. H, p.107, n. 125).
air leaks cooling coil
*[(7.4 + 7.7 + 7.5A) ÷ 3] × 450 V × √3 × 0.85 inferred PF = 4.95 kW (measured).

Rocky Mountain Institute Energy Efficiency Survey Aboard USS Princeton CG-59© RMI 2001 www.rmi.org 30 June 2001 unclassified
56
Improve space cooling systems equipment and operations.
Space-cooling efficiency is best considered in a far wider context than mere equipmentimprovements. An optimal sequence, especially for new ship design and to some degreefor retrofits, is summarized in Appendix H. Although its further elaboration is largely be-yond the scope of this report, it should systematically inform Naval design philosophy.
IMPROVE CHILLER EFFICIENCY.
ObservationsPrinceton has four 200 ton York centrifugal chillers for space cooling, and runs two ofthem under cruise conditions with two manually off, held in reserve (she runs four in bat-tle). Each CH draws an indicated ~184 kW, or ~0.9 kW/ton chiller at ARI condi-tions—among the most inefficient centrifugal chillers the RMI Team has ever evaluated.The rated efficiency is affected by entering CW temperature (SW); the efficiency in-creases about 1.2% for every degree the CW temperature is depressed below 85°F. At65˚F CW temperature, the rated efficiency of the existing units would be about 0.72kW/t, while the best York chillers would be rated at about 0.45 kW/ton at these condi-tions. CHW design temperature is 50.6˚F entering and 44˚F leaving, a lift of 6.6 F˚. Thechiller’s 250 hp motor is oversized.
The RMI Team observed CHs One and Two operating 60% loaded at an indicated 1.1kW/ton at a CW temperature of 61˚F. One CH could handle the native load if the otherone were turned off, but standard procedure is to run two at all times.62 (The redundancy-for-resilience strategy is to operate two CHs in distributed spaces; the RMI Team on itsfirst float observed two CHs operating in the same space.) Each of the two CHs that areoperated in parallel runs at ~40% capacity; it would be more efficient to run one CH at~60% capacity. The CHs are started manually, taking about 15–20 minutes to positionthe valves and start the CHW pump. This long start cycle was cited as the primary obsta-cle to running one lead CH with a lagging backup CH, instead of running two CHs inparallel. If this procedure were automated, as is done at most plants ashore, the CHscould be started automatically or remotely from the Central Control Station (CCS). TheCHs are specified with a low lift (6.6 F˚) and require 720 gpm CHW flow to offset thelow ∆T (instead of 480 gpm for 10 F˚∆T).
CH measurement: The RMI Team observed (App. A) that CH Four appeared to be con-strained from reaching its full output, perhaps by its current limiter; controls and sensorsindicated that the CH had reached 97% of FLA at only 120 tons—about 60% of its ratedcapacity of 200 tons. The Team was unable to determine why this occurred, and referredthe problem to NAVSEA and CG-59’s crew for investigation. The Team also suspected 62 Two chillers were running at 4 F° ∆T and 67% FLA (indicating 60% load at 240 tons), but at least 40tons of this load appears to be parasitic.

Rocky Mountain Institute Energy Efficiency Survey Aboard USS Princeton CG-59© RMI 2001 www.rmi.org 30 June 2001 unclassified
57
that hydronic problems (i.e., pumping, piping, and distribution) might be reducing theCHW system’s effectiveness. If so, such problems might not allow the ship to use oneCHW pump to serve the load more efficiently.
Refrigerant replacement: The Navy is eliminating ozone-depleting refrigerants from thefleet. All four of Princeton’s AC compressors have been converted from CFC-114 toHFC-236fa. Princeton is one of the few ships to have been converted to date, so her sys-tems are not representative of those currently installed on most Navy ships. The balanceof the Navy's R-114 plants will be converted over the next 12 years or so. Only the shipscurrently using CFC-114 will be converted to HFC-236fa. Future ships will be equippedwith compressors designed for HFC-134a.63
As part of the conversion process, the R-114 compressors are modified to accommodate asmaller impeller and other upgrades. NAVSEA has a parallel R&D program working oncompressor efficiency improvements that can be incorporated into the machines duringthe conversion process. These improvements will not be available soon enough to benefitsuch early conversions as Princeton. One NAVSEA report projects that compressor im-provements (e.g., due to numerical optimization methods) that can be made to CG-47class ships during the refrigerant replacement could increase efficiency by 10%, saving~57 kW of power during cruise and battle conditions.64
Chiller One. Ron Perkins photo (camera date was mis-set).
63 Bill Stoffel, NAVSEA (215-897-7109 / [email protected]), personal communication, 19January 2001.
64 Ibid.; see also “Air Conditioning Compressor Improvements,” handouts of presentation to DSB TaskForce on Improving Fuel Efficiency of Weapons Platforms by NAVSEA’s Thomas Bein([email protected]) and Dr. Yu-Tai Lee ([email protected]), 21 June 2001.

Rocky Mountain Institute Energy Efficiency Survey Aboard USS Princeton CG-59© RMI 2001 www.rmi.org 30 June 2001 unclassified
58
RecommendationsTurn off all but one CH, doubling efficiency. Retrofit to use one lead high-efficiency CH.Retrofit the CHs to use high-efficiency York Code Pak compressors. Use automaticstartup systems to get each CH online in ≤3 minutes. If one chiller fails, the brief time ittakes for a backup unit to come online is not problematic, because the thermal lags of thesystems being cooled are typically much longer than chiller startup/rampup time.
CG-59 CHILLER PERFORMANCE65
observedkW/ton
ratedkW/ton
best practicekW/ton
obs’d – bestkW/ton
Potential savings/2 CHs, MWh/y
Chiller 1.1 0.9 0.45 0.65 1,140CHWP 0.1 0.07 0.026 0.074 130CWP unknown 0.024 0.021 unknown unknownTotal system 1.2 1 0.5 0.72 1,270
At 96% electric distribution efficiency, the right-hand column implies potential fuel sav-ings, per two chillers, of 241,000 gal/y (at the cruise-mode 182 gal/MWh on p. 18), withan annual energy cost of $357,000 (p. 19) and 20-y gross present value of ~$4.5 million.
EQUIPMENT COOLING SYSTEM
ObservationsA closed-loop fresh water cooling system provides cooling for other dedicated refrigera-tion and electronic equipment. This cooling loop rejects its heat via a shell-and-tube heatexchanger to the SW cooling system. This system appears to be overpumped, based on anobserved low temperature rise across the supply and return piping.
Equipment cooling heat exchanger. Ron Perkins photo.
65 Based on calculations by Ron Perkins; assumes a 200-ton total average load and 8,766 h/y operation peryear (ship’s crew said the chillers are turned off only in drydock), and ignores part-loading and load profile.

Rocky Mountain Institute Energy Efficiency Survey Aboard USS Princeton CG-59© RMI 2001 www.rmi.org 30 June 2001 unclassified
59
RecommendationsUse VSDs on both primary SW pumps and the secondary closed loop pump to reducepower consumption and better match the load being served. Consider using a plate-and-frame heat exchanger, as it would both outperform the shell-and-tube heat exchanger, andrequire less pumping horsepower (implementation would be easier in new ship designs).
OPTIMIZE EQUIPMENT AND SPACE COOLING REQUIREMENTS (E.G., IN THE CIC)
ObservationsIn cases where equipment cooling requirements drive space cooling temperature setpointsand energy use, consider the benefits of cooling that equipment directly and lowering thespace conditioning requirements. The Combat Information Center (CIC) appears to be thearea of greatest potential in this regard. The CIC is maintained at 61–62°F; some person-nel regularly wear jackets in the CIC. Keeping the CIC so cold renders the space verysensitive to CHW fluctuations. The reason given for this low target temperature was tomeet the cooling requirements of vital electronic systems. The RMI Team did not deter-mine which CIC systems were cooled by the SW equipment cooling loop. Directly cool-ing electronic equipment is often more efficient and effective than cooling the spacearound it. In civilian electronics and information technology facilities (e.g., mainframecomputer rooms), the prevailing wisdom for many years was that cooling the space wasthe optimal equipment cooling strategy, but by the late 1980s to early 1990s, direct equip-ment cooling became generally accepted. Moreover, the target temperature was often re-laxed once the equipment’s actual engineering-based needs were more closely examined.

Rocky Mountain Institute Energy Efficiency Survey Aboard USS Princeton CG-59© RMI 2001 www.rmi.org 30 June 2001 unclassified
60
RecommendationsExplore expanded use of direct cooling of equipment that might allow an increase in CICtemperature. More direct equipment cooling strategies might include induction coolingfrom the floor (e.g., via ducts or raised flooring), or connecting equipment and housingsto a dedicated cooling loop (e.g., the existing SW system). Investigate whether heatpumps might remove equipment heat reliably and reuse it for other purposes.
IMPROVE SPACE CONDITIONING CONTROLS
ObservationsMore than 70 Fan Coil Units (FCUs), linked to the 44˚F water cooling loop, are distrib-uted throughout the ship’s spaces, typically suspended from the overhead. Although thereare controls on the FCUs, many apparently provide air that is relatively cool (e.g., thelogroom [2-268-O-Q] FCU emitted air at 60–61°F).
Overhead fan coil unit. Jim Rogers photo (camera date was mis-set).
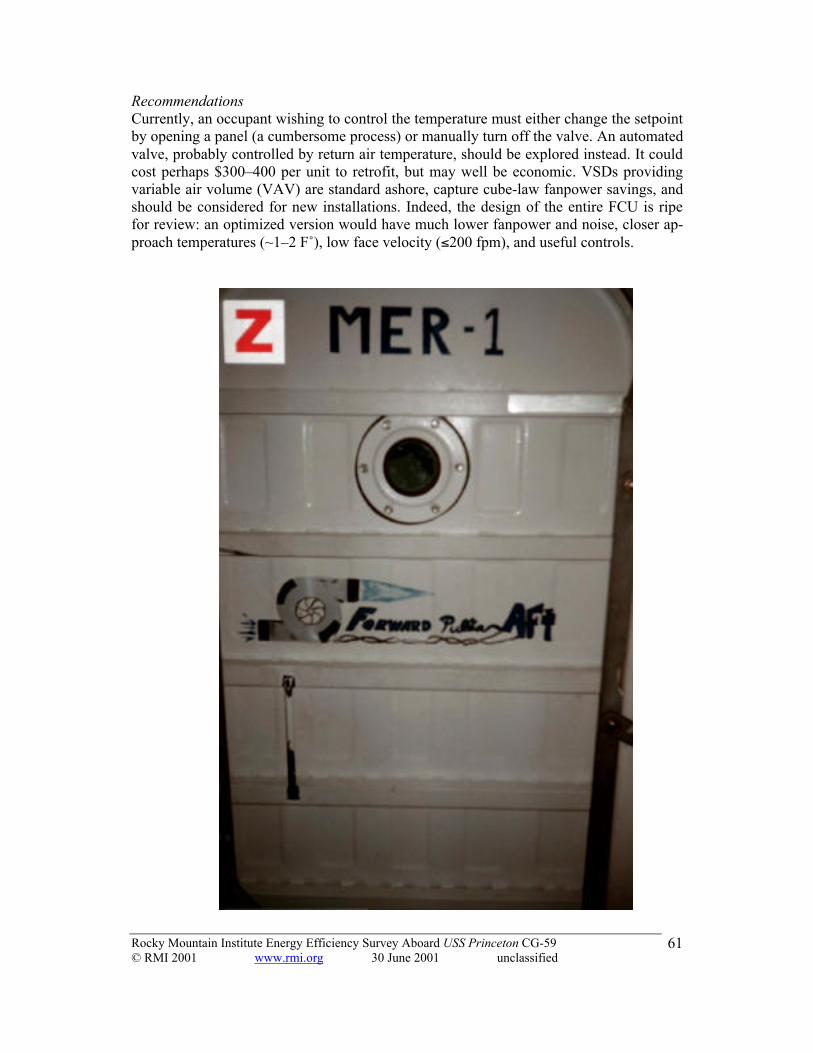
Rocky Mountain Institute Energy Efficiency Survey Aboard USS Princeton CG-59© RMI 2001 www.rmi.org 30 June 2001 unclassified
61
RecommendationsCurrently, an occupant wishing to control the temperature must either change the setpointby opening a panel (a cumbersome process) or manually turn off the valve. An automatedvalve, probably controlled by return air temperature, should be explored instead. It couldcost perhaps $300–400 per unit to retrofit, but may well be economic. VSDs providingvariable air volume (VAV) are standard ashore, capture cube-law fanpower savings, andshould be considered for new installations. Indeed, the design of the entire FCU is ripefor review: an optimized version would have much lower fanpower and noise, closer ap-proach temperatures (~1–2 F˚), low face velocity (≤200 fpm), and useful controls.

Rocky Mountain Institute Energy Efficiency Survey Aboard USS Princeton CG-59© RMI 2001 www.rmi.org 30 June 2001 unclassified
62
Thermal integration: (re)use waste heat.
ObservationsIn nature, there is essentially no waste: everything is food for something else, and wasteis really just a resource out of place. The same is true of thermal resources aboard CG-59.Not only can “waste” heat utilization reduce electrical consumption and save fuel, but itcan also help the ship lower its thermal emissions, reducing its IR signature and increas-ing its survivability. Unfortunately, the Navy is in the process of moving away from re-capturing this valuable resource on CG-47 class cruisers.
CG-59’s GTMs and GTGs produce high-temperature exhaust. GTM exhaust is cooled forsignature reduction by mixing it with outside air (passively, via the Venturi effect withexhaust stack louvers). GTM heat is not recaptured. The ship uses GTG waste heat tomake steam for potable water (PW) production via evaporation and condensation, as wellas for water heating (see below). However, steam has a high “hassle factor” and signifi-cant maintenance costs, so the ship is scheduled to undergo an “all-electric” conversion(Shipalt CG47-00588). This will replace the waste heat boiler and PW evaporator andcondenser with an electrically pressurized reverse osmosis (RO) system for producingPW from SW via a membrane system, plus—more significantly—electric resistanceheating for water and for certain oil supplies that are currently heated with steam. CG-58USS Philippine Sea has already undergone this conversion. According to the crew, GTGexhaust stack air is ~400˚F now, but after the all-electric conversion it will be ~700˚F,indicating the increased energy use and signature. Electricity use for RO pumping willalso increase.
The RMI Team agrees that removing the steam system is a good idea. However, theTeam is concerned that the Navy has thrown the baby out with the bathwater—more pre-cisely, with the potable water. The concept of waste heat recapture seems to have beenrejected because of understandable problems with steam production and distribution. Butthere are other ways to use waste heat, including for PW heating, without making steam.The heat recovery system can be designed to be low-maintenance and reliable.
RecommendationsRMI suggests that the crew or NAVSEA create an inventory of all the heating systemsand heat flows on board, and evaluate them as potential waste heat users to be matchedwith a corresponding inventory of heat requirements at various temperatures. These sys-tems would include cooking, space heating, laundry, and domestic hot water systems.Heat can be very efficiently transferred over long distances via passive phase-change heatpipes if the relative heights are suitable (heat source below load); unlike a runaroundloop, this requires only a single pipe, no control, no moving parts except the workingfluid, no pump, and no electricity.

Rocky Mountain Institute Energy Efficiency Survey Aboard USS Princeton CG-59© RMI 2001 www.rmi.org 30 June 2001 unclassified
63
USE WASTE HEAT FOR SPACE COOLING
ObservationsOne way to make use of the significant waste heat resource is to use an absorption CH togenerate CHW to pre-cool supply air in the turbine intake, to increase the turbine effi-ciency. This would require space for another CH(s), e.g., in the engine rooms.
RecommendationsConsider replacing one of the relatively inefficient electric CHs with a 500- to 800-tonabsorption unit. This unit could also act as a backup to the remaining three electric CHs,or as a baseload machine to keep the electric chillers off line most of the time, avoidingtheir high fuel cost. The capacity, hence the number and size, of CH units would also bereviewed once the native and parasitic cooling loads throughout the ship had been sys-tematically reduced. This recommendation might be more practical for new ship de-signs.66
USE WASTE HEAT FOR PW PRODUCTION AND WATER HEATING
CG-59 currently uses gas turbine exhaust heat to make steam for PW production, but thisis to be replaced with a reverse osmosis unit under the Shipalt 588 all-electric conversion.The RMI Team agrees with the Navy’s reasons for eliminating the maintenance-intensivesteam production and (especially) distribution system. However, valuable opportunitiesremain to use waste heat for PW heating in particular, and to augment the PW productionprocess. Opportunities to conserve PW also permit significant energy savings in produc-tion, heating, and distribution. These issues are discussed in detail in the next section.
Improve energy efficiency of potable water production, heating, and use
ObservationsPW production: The ship currently makes PW from SW by steam-heated evaporation andcondensation. Until the all-electric conversion described above is completed, CG-59 isfitted with two 12,000 gpd flash-type distilling systems. These use waste heat from theGTGs to convert seawater to fresh water (95°F distillate). A pressure reducer decreasesmain steam line pressure from 100 PSIG to 15 PSIG before it is fed into the evaporators.(Perhaps a turboexpander might be considered for this letdown.) There the energy is con-sumed in the water-making process, in a vacuum created by an air ductor. The system israted at 500 gph (12,000 gpd)67 of PW production. Factors including scaling, water tem-perature, and other engineering dynamics can reduce actual output.
This water is directed to either the potable or the steam-raising feedwater tanks via aflowmeter, or (infrequently) is discharged overboard. The total volume of water ex-pended from the potable and feed systems is tabulated daily (Distiller Plant & Potable
66 Another potential space cooling option using otherwise wasted turbine heat is a high-temperature desic-cant (which could be cascaded with absorption cooling, in either order) for latent cooling. It could also pro-vide excellent sensible cooling if followed by a direct/indirect evaporative cooler—the Pennington cycle.67 Personal communication, CG-59 engineering staff, 1/29/01.
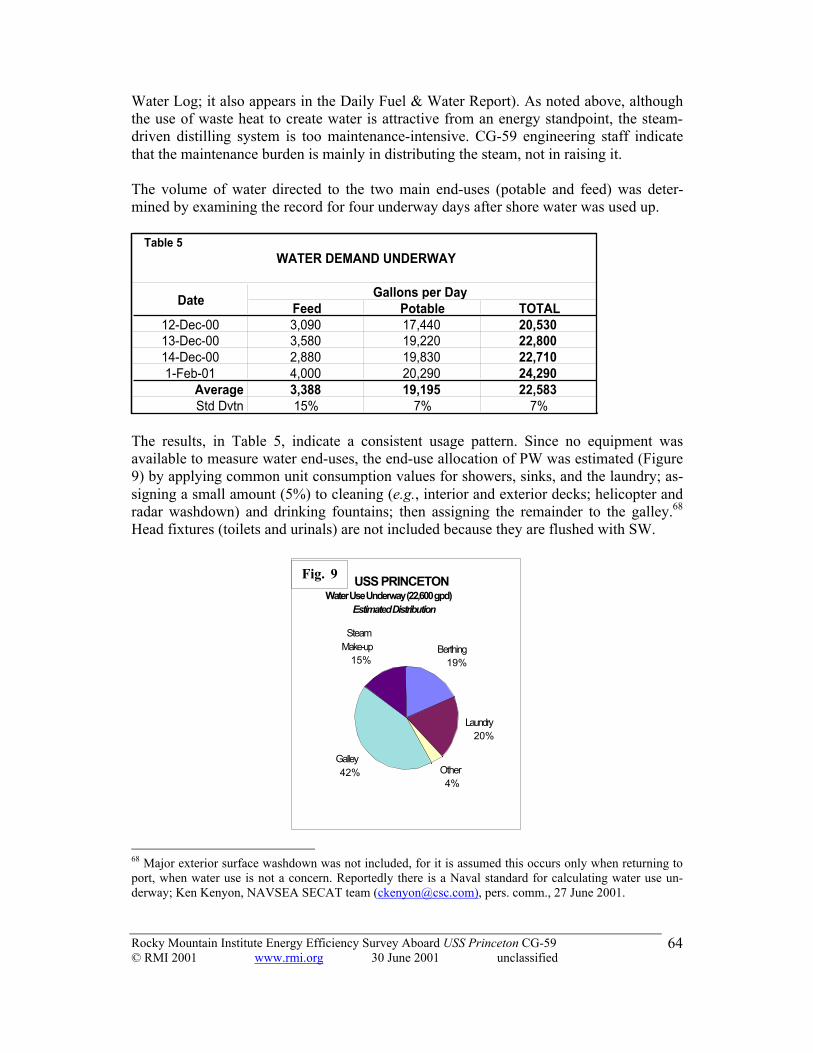
Rocky Mountain Institute Energy Efficiency Survey Aboard USS Princeton CG-59© RMI 2001 www.rmi.org 30 June 2001 unclassified
64
Water Log; it also appears in the Daily Fuel & Water Report). As noted above, althoughthe use of waste heat to create water is attractive from an energy standpoint, the steam-driven distilling system is too maintenance-intensive. CG-59 engineering staff indicatethat the maintenance burden is mainly in distributing the steam, not in raising it.
The volume of water directed to the two main end-uses (potable and feed) was deter-mined by examining the record for four underway days after shore water was used up.
Feed Potable TOTAL12-Dec-00 3,090 17,440 20,53013-Dec-00 3,580 19,220 22,80014-Dec-00 2,880 19,830 22,7101-Feb-01 4,000 20,290 24,290
Average 3,388 19,195 22,583Std Dvtn 15% 7% 7%
Date
WATER DEMAND UNDERWAY
Gallons per Day
Table 5
The results, in Table 5, indicate a consistent usage pattern. Since no equipment wasavailable to measure water end-uses, the end-use allocation of PW was estimated (Figure9) by applying common unit consumption values for showers, sinks, and the laundry; as-signing a small amount (5%) to cleaning (e.g., interior and exterior decks; helicopter andradar washdown) and drinking fountains; then assigning the remainder to the galley.68
Head fixtures (toilets and urinals) are not included because they are flushed with SW.
USS PRINCETONWater Use Underway (22,600 gpd)
Estimated Distribution
Berthing19%
Other4%
Galley42%
Steam Make-up
15%
Laundry20%
Fig. 4
68 Major exterior surface washdown was not included, for it is assumed this occurs only when returning toport, when water use is not a concern. Reportedly there is a Naval standard for calculating water use un-derway; Ken Kenyon, NAVSEA SECAT team ([email protected]), pers. comm., 27 June 2001.
Fig. 99ig. 9

Rocky Mountain Institute Energy Efficiency Survey Aboard USS Princeton CG-59© RMI 2001 www.rmi.org 30 June 2001 unclassified
65
Shipboard PW efficiency improvements should be cost-effective and simple to install andmaintain. In the future, water supply will be via RO69, and wastewater management willincur the cost of membrane treatment.70 These changes may place a premium on efficientuse of PW. For illustration, a CG-60 load study indicated that each of the two RO unitsalone would draw 75 kW at 0.5 LF under cruise conditions.71 The conversion also addstwo 125-kW water heaters and 97 kW of booster heaters, among many other changes topumps, fans, ventilation air heaters, etc. Data from a post-Shipalt 588 conversion on CG-58 indicates that, under summertime cruise conditions in 90°F air, the PW-related por-tions of the all-electric conversion package have a measured peak load of 230 kW and anaverage load of 77 kW. CG-58’s RO unit used 19.5 average kW to produce an unstatedamount of PW.72 If the PW output is the same as the maximum output that an uncon-verted CG-47’s waste-heat boiler recovery system can produce by distillation—24,000gpd or 16.67 gpm (including 3,400 gpd now used to make steam to drive the evapora-tors)—then the RO unit uses at least 0.0195 kWh/gal. At the nominal cruise-mode GTGelectricity cost of $270/MWh estimated on p. 19, and assuming 96% electric distributionefficiency, the cost of making 1,000 gallons of RO water is thus at least $5.48 plus mem-brane and equipment maintenance. For comparison, typical municipal water in Californiacosts about $2/1,000 gal—two-fifths as much as the energy to make RO PW aboard ship.
PW heating: PW is currently heated by a combination of waste heat and (in some areas)electric heaters located close to the point of use. Following the all-electric conversion,PW will then be heated by 125-kW electric water heaters; such a heater will use (whenenergized) 6.4 times as much electricity as the RO unit. Thus PW is valuable, and hotwater is especially valuable to save or to reduce in temperature.
RecommendationsPW production: As noted above, the RMI Team agrees with the benefits of convertingfrom costly steam-based PW production to an RO system. RMI has not reviewed the effi-ciency of the RO unit, where best practice would be to recover backstroke pressure. Con-sider preheating SW with waste heat (or perhaps graywater discharge) to obtain a signifi-cantly greater flux across the low-pressure RO membrane, especially when CG-59 is op-
69 An example: OffShore Marine Laboratories of Gardena, CA builds systems for the U.S. Navy and othermarine clients. Its Model PW 10000, producing 10,000 gpd (35,000 ppm sea water at 77˚F), draws 27 ampsat 440 VAC (60 Hz): www.offshore-marine.com/pw1.html.70 “In response to the worldwide rising cost associated with the pierside off loading of sewage and gray-water, the anticipated future need for U.S. Navy ships to operate for extended periods in littoral waters, andanticipated discharge regulations, the Naval Surface Warfare Center, Carderock Division, in conjunctionwith the Naval Sea Systems Command, is currently developing shipboard graywater membrane treatmentsystem concepts.” Drew J. Demboski, et al., “Evolutions in U.S. Navy Shipboard Sewage and GraywaterPrograms,” Naval Sea Systems Command, Arlington, VA ~1997, p. 1. A follow-up paper: John Benson etal., “Blackwater and Graywater on U. S. Navy Ships: Technical Challenges and Solutions,” Procs. ASNEDay 1999 Annual Meeting and Exposition, May 1999, www.navyseic.com/propapers.htm.71 “Calculated Loads for CG-60”, unattributed report (NAVSEA?), esp. Sheet 1, p.5. However, most of theprojected 1-MW average load increase is apparently from 1.36 MW connected load of fuel and lube oilheaters. The conversion’s calculated loads, too, appear to be higher than the measured loads (Appendix M).72 See “Power Monitoring Project, Part One: Summertime Sea Trial,” Ingalls Test and Trials, Litton ShipSystems Full Service Center, 20 November 2000.

Rocky Mountain Institute Energy Efficiency Survey Aboard USS Princeton CG-59© RMI 2001 www.rmi.org 30 June 2001 unclassified
66
erating in relatively colder waters. Consider using waste heat to heat PW (if not to sup-port PW production) with methods that avoid the costly problems associated with steamproduction and distribution.
PW heating: The Navy might reconsider the electric-resistance PW heating strategy forCG-47 class cruisers, as it is a very inefficient means of converting fuel into hot water.(Essentially all the electrical energy ends up in hot water, but turning fuel into electricityvia GTGs is very inefficient.) RMI encourages the use of waste heat recaptured fromother uses (e.g., gas turbines) for primary water heating, for example via a heat ex-changer, with efficient backup water heaters run on available fuel or electricity.
Other ships heat PW with waste heat but no steam. For example, FFG-7 Perry-class frig-ates have a waste heat recovery system that uses diesel generator jacket water to heat PW(as well as fuel and lube oil), and serves as the heat source for two submerged tube dis-tilling plants. This system does not generate steam. There are also two 300 kW electricheaters in the system to augment the jacket water heat when it is necessary to operateboth distilling plants at one time. The PW heater is a 500 gal storage-type heater (in placeof the compact instantaneous steam heaters used on ships with steam available). The twosubmerged tube distilling plants are to be replaced with higher capacity RO units on thisship class also, but the jacket water waste heat system will be retained for heating PW,fuel, and lube oil.73
After CG-59’s steam distillation system (and therefore the feedwater associated with it) iseliminated by substituting RO, the only remaining use of steam will be to heat water inberthing spaces and the galley (hot water for the laundry is now provided by a 65 kW,430 gal electric heater). For reasons discussed elsewhere, these few remaining loads maybe more simply met with point-of-use electric heaters, or by circulating water that isheated centrally with waste heat (e.g., from an engine, absorption chiller, or heat pump).Replacing the steam system will relieve significant maintenance duties.
Delivery temperatures should be rethought and reset lower to increase safety and crewcomfort and to reduce wasted water (e.g., one must now wait for water to stabilize to acomfortable temperature before showering). Faucet water was measured at 134°F in acrew berthing space—a serious scalding risk, and far above the ~110˚F that analysesashore have found ample for all household uses (except dishwashing, whose 120–130˚Frequirement using enzymatic detergent is typically achieved by a 20 F˚ booster heater inthe dishwasher).74 Showers require only 108˚F at the showerhead; higher temperaturestend to be uncomfortable or unsafe, and scalding is a risk above 110˚F, the maximum al-lowed by Federal law in most hospitals and similar facilities.
In addition to turbine waste heat recapture, alternative water heating approaches include:
73 Richard Steck (215.897.7912 / [email protected]), NAVSEA Fluid Systems, personal com-munication, 14 May 2001.74 Extensive 1991 analysis by RMI (The State of the Art: Water Heating) found that this setpoint does notincur a health risk from Legionella spp. for the general population; for immune-compromised individuals atspecial medical risk, even 140˚F setpoints are neither a desirable nor a sufficient way to prevent exposure.

Rocky Mountain Institute Energy Efficiency Survey Aboard USS Princeton CG-59© RMI 2001 www.rmi.org 30 June 2001 unclassified
67
Instantaneous Water Heaters (also called tankless or point-of-use water heaters) useheater elements such as electric coils or gas heaters to heat water passing through theunit. They are tankless or have small tanks, and are located at or near the point of use,reducing line losses. They typically have relatively high electric demand but very lowstandby losses; require less piping than parallel hot-and–cold water systems; and needonly a cold water feed and an energy supply. CG-59 has no tankless water heaters, butdoes have some small “booster” water heaters (e.g., ~30 gal unit for the Captain’s cabin).
Heat pump water heaters remove heat from the air and transfer it into water, with the ad-ditional benefit of cooling the air around it. Similar to a water-cooled air conditioner, theywork best in warm areas (e.g., kitchens, laundries, boiler rooms), with paybacks typicallyaround a couple of years or less at the far lower energy prices prevalent ashore. Heatpump water heaters don’t produce heat, but rather move it—typically providing over 3kW of heat for each kW of electricity used. They have a relatively slow recovery rate (thetime required to heat a full batch of initially cold water), and usually require thermal stor-age in civilian applications ashore; but conditions aboard ship may be more favorable.
CG-59 HOT WATER USES, SOURCES, AND HEATING ALTERNATIVESUse Hot Water Source - Now Source - Proposed
Galley – Cooking area cleanup Steam water heater with circulat-ing pump
1. Heat pump water heater2. Electric instantaneous3. Electric point-of-use
Scullery - Sink Uses galley HW Same as nowScullery - Dishwasher Uses galley HW plus steam. Also
electric backupEliminate steam and useelectric
Berthing - Sinks Steam water heater with circulat-ing pump
1. Heat pump water heater2. Electric Instantaneous3. Electric Point-of-Use
Berthing - Showers Steam water heater with circulat-ing pump
1. Heat pump water heater2. Electric instantaneous3. Electric point-of-use
Laundry Electric HW heater with storagetank
Same plus heat pump wa-ter heater
Maintenance Cleaning Uses galley or berthing HW Same as now
PW CONSERVATION OPPORTUNITIES
Where practical, conserve PW, especially HW, to save energy and free up PW productioncapacity for desired uses (e.g., drinking, cooking, maintenance—or Hollywood showers,for quality of life!). To the extent water is conserved or treated and reused aboard, thetotal volume of water flowing through the ship will be reduced, as will the size and costof both the supply and discharge treatment systems.
Showers: Vigorous showers needn’t require high water flow or high pressure: low-costCOTS high-performance showerheads can give an excellent sensation with only 1.2–1.5

Rocky Mountain Institute Energy Efficiency Survey Aboard USS Princeton CG-59© RMI 2001 www.rmi.org 30 June 2001 unclassified
68
gpm, even at low pressure. More elaborate blower-driven air/mist showers, originally de-signed for submarines, use only 0.5 gpm, and their 432-W electric blowers use only 1%as much electricity as they save in water heating. The RMI Team observed a few high-performance, low-flow showerheads aboard CG-59, but most showerheads could be use-fully upgraded. Reportedly there is a Navy standard that requires all ships to have low-flow showers and spring-loaded shutoff valves.75
Galley: This deserves a closer look, including time to measure specific uses. The dishrinsing station in the scullery is a particularly attractive candidate. Instead of using low-pressure PW to flood waste off dishes, better mechanical scraping might be considered,followed by a quick scrub in a periodically replenished basin. All dishes and utensils arethereafter washed and sanitized in a conventional dishwasher equipped with internal wa-ter recycling. In addition, modern enzymatic detergents using amylase, lipase, and prote-ase can provide superior dishwashing performance at only 120–130˚F, saving significantwater-heating energy. Graywater heat recovery may be worthwhile.
Laundry: Laundries provide an excellent opportunity for reusing water (and heat and al-kalinity). The ship’s laundry is equipped with three washer-extractor machines manufac-tured by The Edro Corporation. Two have a 60-dry-lb capacity; the third is 20 lb.76 TwoFridgidaire “Gallery” tumble-action washers and four Fridgidaire electric dryers, all resi-dential-size, are also provided for individual use by the crew. Hot water (180°F) is pro-vided by a 430-gallon electric water heater.77
Edro Dyna Wash washers. Jim Rogers photo (camera date was mis-set). 75 See App. M, K, #21–22. Ken Kenyon, NAVSEA SECAT team ([email protected]), personal communi-cation, 27 June 2001. The RMI Team did not compare this standard to the performance of the best availableCOTS options. Non-DOD Federal standards for such fixtures fall well short of the best available.76 DynaWash machines manufactured by The Edro Corporation, East Berlin, CT, in Oct 1999. Larger ma-chines: model number DW600 PNSWE238 (each has three pockets capable of holding 20 lb dry weight oflaundry); smaller machine: model number DX25N.77 The Electric Heater Company S/N N1282N. 430V, 3 phase, 85A, 65 kW; installed ~ June 1998.

Rocky Mountain Institute Energy Efficiency Survey Aboard USS Princeton CG-59© RMI 2001 www.rmi.org 30 June 2001 unclassified
69
The laundry load is mostly uniforms and linens, mostly only lightly soiled. Approxi-mately twenty loads are run six days per week in the large machines (ten loads per ma-chine). Assuming ten loads are also run by the smaller machine, the total load is thereforeapproximately 1,400 lb/workday.
The horizontal-axis residential washers are fairly efficient and appear to have a relativelylow usage rate, so are not addressed here as targets for ozonation (see below). However,their 180˚F feedwater temperature appears far too high. Such hot water will greatly re-duce the operating life of clothing, and is not necessary for effective cleaning with mod-ern detergents. For example, the average Veterans’ Administration hospital laundry oper-ates at a peak water temperature of 110˚F; the maximum allowed by the VA is 120˚F; andthe VA found that 72˚F laundry, as part of a modern laundry cycle, yielded satisfactorydisinfection, whiteness, and stain removal.
The RMI Team suggests that the Navy explore alternative laundry techniques. Ozonesystems save water and improve cleaning and clothing life. For conventional laundryprocesses, lint removal followed by membrane separation is the norm. A vibrating mem-brane process (to enhance shear forces across the membrane by tenfold) has a smallphysical footprint and good laundry service examples. These options are discussed next.
OZONE: The greatest energy and water saving opportunity that is appropriate and imme-diately available is to introduce ozone into the 60-lb Edro washers’ washwheels to reducethe energy, water, and chemicals now used by the two 60-lb-capacity washer-extractors.RMI does not currently recommend similarly converting the 20-lb machine, which shouldremain in its present configuration to handle the heavily soiled items for which there isnot yet a parallel example ashore for handling with an ozone system.78
The laundry’s three principal washing machines presently consume approximately 1,300gal and 2,900 gal of cold and very hot (180°F) water per day, respectively.79 Conversionto ozone washing should reduce total water use by approximately 25%, saving approxi-mately 1,000 gpd.80 More importantly, because ozone performs best in cold water, thevolume of hot water required will decline by at least 90%.81 Approximately 740 kWh/d,worth about $200/d in electricity, will be saved by not heating this volume of water.82 Netelectrical savings for this conversion are estimated at 680 kWh/d, worth about $184/d or$67k/year, after allowing for 60 kWh to produce the required ozone.83 Additional energy
78 Experiments conducted by International EcoScience indicate this will soon change. See Ira Krepchin,Ozone Laundering: A Technology Ready to Clean Up? E SOURCE ER-99-4 (March 1999), p. 11.NAVFAC’s positive experience washing oily rags is even more compelling (see footnote 81 below).79 Ozone Laundering: A Technology Ready to Clean Up? E SOURCE ER-99-4 (March 1999), p. 9 (Table 3).This reflects usage reported by a traditional laundry processing 2,100 lb/day at a healthcare facility.80 The water savings level of 25% is a mean value reported for five sources consulted.81 Water heating was eliminated completely when an ozone wash system was tested at the Public WorksCenter San Diego’s Oily Rag Laundry located at NAS North Island. See B. Holden, P.E., UDP-2007-ENV,User Data package for Ozone Oily Rag Laundry System, Naval Facilities Engineering Service Center, Dec.1999 (https://www.denix.osd.mil/denix/Public/Library/Air/Oilyrag/udp2007.html).82 (2,900 gal × 8.35 lb/gal × 104 F° ∆T) ÷ 3,413 BTU/kWh.83 Ozone Laundering: A Technology Ready to Clean Up? (cited above). Derived from Table 3.

Rocky Mountain Institute Energy Efficiency Survey Aboard USS Princeton CG-59© RMI 2001 www.rmi.org 30 June 2001 unclassified
70
savings will accrue when ships are equipped with membrane technology for both desali-nation and wastewater disposal (see the membrane filtration discussion below).
The introduction of an ozone washing system provides additional benefits. These in-clude:84
• Chemical reduction of up to 65%.
• Wastewater quality improved by the oxidizing power of ozone as it breaks downbacteria and other microorganisms before they reach the drain.
• Increased linen life due to less chemical usage and shorter wash cycle.• Increased comfort by leaving less chemical residue on the fabric.• Increased washing machine daily capacity due to shorter wash cycles. As lower doses
of chemicals are used, a number of rinses can be eliminated.• Increased dryer capacity, as less chemical film is left on fabric after washing.
Ozone is a strong oxidant that must be handled carefully. There is considerable experi-ence available to design a system to handle ozone safely during its short life before it de-cays naturally to oxygen.85 Developmental and demonstration projects have included theNavy (e.g., International EcoScience’s work to develop an ozone washing system for asubmarine, and the extensive analysis of Cyclopss Corporation’s Eco-Wash LaundrySystem at Coronado Island, where superior results were demonstrated for cleaning oilyrags86). As a result of these efforts, an ozone wash system is being installed at the indus-trial laundry operated by the Navy Public Works Center, Pearl Harbor.87
MEMBRANE FILTRATION: Another approach that will save much more water is to cleanand reuse wash and rinse water, perhaps leaving the final rinse for fresh water. This maybe done together with an ozone wash system, or independent of it (that is, the conven-tional chemical / hot water wash system is left in place, but with a much lower tempera-ture as noted below). When a membrane treatment system is used to recover water from aconventional laundry process, it also recovers heat and alkalinity. Using a membranesystem to treat and reuse water at its point of use will become more attractive as mem-branes come to be used anyhow where water is both introduced to and discharged fromthe ship.
One of the most promising technologies for this purpose is a novel membrane filtrationsystem provided by New Logic International, Inc., called VSEP (Vibratory Shear En-
84 From Vanessa Hill and Marty Ahad, Ozone Laundry Systems Pilot Study, Executive Summary, May2000 (prepared for and published by BC Hydro).85 E SOURCE (footnote 78) indicates more than 200 laundry installations to date. Ozone, employed to purifydrinking water for nearly 100 years, is also used in tens of thousands of other industrial applications.86 See B. Holden, PE, UDP-2007-ENV, User Data package for Ozone Oily Rag Laundry System, NavalFacilities Engineering Service Center, Dec. 1999,https://www.denix.osd.mil/denix/Public/Library/Air/Oilyrag/udp2007.html.87 See “Cyclopss Eco-Wash System Sets Sail For Pearl Harbor,” www.cyclopss.com/navyins.htm. Thearticle reads in part: “The Navy has proven the Eco Wash system saves energy, water and labor, and re-duces pollution for this industrial laundry application. The Navy has a potential need for as many as 100 ofthese types of systems that sell for approximately $70,000 each.”

Rocky Mountain Institute Energy Efficiency Survey Aboard USS Princeton CG-59© RMI 2001 www.rmi.org 30 June 2001 unclassified
71
hanced Processing).88 This system is achieving water savings on the order of 65–75% forthe HCSA Laundry (hospital) in Seattle, WA, and Cal Linen in Oakland, CA. The stan-dard system requires approximately 20 ft2 and no chemicals. Fouling is avoided by sub-jecting the entire membrane stack to an oscillating motion that maintains clean filtrationsurfaces. The horizontal oscillation of the membrane stack, the key to the system’s per-formance, requires a vertical alignment for the equipment, and therefore a height re-quirement of approximately 11'–14', depending upon the model selected. (The RMI Teamdid not measure the overhead clearance in the laundry to determine whether this wouldfit.) Other aspects to be investigated include the nature of the concentrate produced fromthis system; how to manage it if it is too viscous to flow easily through the ship’s drain;and the size and possible location for equalization tanks before and after the membranesystem.
Improve lighting efficiency and quality.
ObservationsCG-59’s total lighting load is less than 10% of total power consumption while cruising,unlike commercial facilities where lighting can be as much as 50% of a building’s elec-tric load. However, the ship’s lighting electrical load could be reduced by approximately40% without reducing light levels or quality, and that reduction would also reduce HVACloads, so it should not be ignored. Ashore, efficient lighting is often a very cost-effectiveretrofit opportunity and can significantly increase human productivity.
Using data from a load study of CG-60 USS Normandy89, CG-59 has a connected lightingload of approximately 394 kW, of which 175.9 kW is vital lighting and 218.5 kW is non-vital lighting. The CG-60 study assigned utilization factor of 0.33 for vital lighting and0.39 for nonvital lighting (although the Team thinks these factors seem to be very low).Based on these numbers, total lighting loads under cruise conditions would be 143.2 kW.During the floats the RMI Team was on, the majority of the lighting was on 24/7, andonly the berthing areas and darkened ship areas reduced lighting at night. (Darkened shipsettings on many fixtures use either the same number, or half at best, of the normal com-plement of white fluorescent lamps (FLs). A few small areas with local switching alsoturned off their lights at night.)
Based on this as-used average lighting load, which may be understated to the degree ac-tual load factors are higher, the potential estimated by the RMI Team to save at least one-third of the lighting would save at least 48 kW and probably a good deal more, plus asso-ciated HVAC loads to take away the heat of the lights. At the observed HVAC perform-ance of about 1.2 kW/t (COP 2.9), excluding air-handling energy, the “HVAC bonus”would increase direct lighting savings by roughly one-third, raising the 48 to 65 kW.90
88 New Logic International, Inc.: www.vsep.com.89 “Calculated Loads for CG-60,” unattributed report, p. 40.90 The actual value could differ substantially under different operating and climate conditions, differentpart-load penalties for the HVAC components, and <100% lighting in conditioned space. It would also de-crease with a more efficient chiller system due to reduced parasitic loads fed back from HVAC equipment.

Rocky Mountain Institute Energy Efficiency Survey Aboard USS Princeton CG-59© RMI 2001 www.rmi.org 30 June 2001 unclassified
72
Nearly all lighting is provided by 700+ MIL-SPEC fluorescent fixtures, most of whichare about 30" long with magnetic ballasts and T12 FLs, and vary only in the number andcolor of lamps. All fixtures have a heavy plastic lens, mostly opaque white; a few areclear. The most common fixture has three 20 watt T12 lamps. The fixture variations aresingle lamp, double lamp and combinations of white and red lamps. The 3-lamp fixturesconsume approximately 70 watts each. Newer, more efficient T8 lamps with electronicballasts would consume about 40% less energy while producing the same light output andimproving color rendering and visual acuity. Red lights are used in perimeter and berth-ing areas during darkened ship conditions, including most of the nighttime period. Redand blue light is provided by putting colored mask sleeves over white FLs to filter out allbut the desired color, thereby also reducing lumen output.
Typical overhead lighting fixture. Jim Rogers photo (camera date was mis-set).
Apparently the Navy is aware that these fixtures have “low efficiency, low power factorsand harmonic distortion problems.”91 The Navy is currently developing or investigatingnew lighting and standards and fixtures. The primary difference between the existingfixtures and the new one is improved ballasts. One NAVSEA staffer reported: “All newconstruction ships are getting the high-efficiency fixtures developed by NSWCCD. Thenew fixtures have much higher efficiencies and power factor, and they also meet the
91 Bill Stoffel, NAVSEA (215.897.7109 / [email protected]), personal communication, 10January 2001.

Rocky Mountain Institute Energy Efficiency Survey Aboard USS Princeton CG-59© RMI 2001 www.rmi.org 30 June 2001 unclassified
73
MIL-STD requirements for harmonic distortion (which the original fixtures never did).The new fixtures are identical to the original except for the ballast, therefore achievingdramatic improvements at virtually no increase in cost. Retrofitting the low- with high-efficiency fixtures is not conventionally considered cost-effective (although any addi-tional fixtures procured through the stock system will also be high-efficiency). [However,that conclusion may merit review, since skilled civilian lighting designers ashore wouldoften reach the opposite conclusion, taking all benefits into account.] At this time there isonly one qualified supplier for Navy lighting fixtures and the MIL-SPEC has not beenwaived for lighting.”92 On existing ships, either the fixtures could be upgraded as theywear out and are replaced, or they could be retrofitted en masse with new T8 (or perhapseven thinner) lamps and electronic ballasts.
The helicopter hangar is the one area of the few areas of the ship with a different lightingscheme: eight 18" × 4' fixtures with six 2' T12 lamps mounted at a height of about 18'.There are also six of the same fixture with red lamps. These could also be upgraded orreplaced with fixtures using T8 lamps and electronic ballasts.
There is some task lighting aboard ship. Most racks and desks in berthing areas had fixedfixtures with basic asymmetric reflectors, although several appeared to lack lamps.
RecommendationsUse fixtures with low-harmonics electronic ballasts, and upgrade the lamps to more effi-cient white T8 FLs. The Navy should continue to investigate further improvements toluminaires, such as imaging specular reflectors. A comprehensive retrofit of reflectors,ballast, lamp, and controls often yields excellent economics ashore, and may have analo-gies afloat. Indeed, RMI suggests a comprehensive approach to lighting improvements,combining superefficient lamps, ballasts, controls, fixture optics (reflectors and lenses),and—importantly—lighting design.93 Please see Appendices F and G for a summary of asystematic and comprehensive approach that typically saves 80–90% of lighting energyashore, with better visibility and esthetics and excellent economics. The high value ofsaving onboard electricity may make this package attractive for retrofit even in conditionswhere it wouldn’t be cost-effective in a civilian building ashore.
As part of such a whole-system approach, consider—if other circumstances per-mit—painting interior compartments’ overhead, and ideally bulkheads and fittings, matteor low-gloss white rather than gray. Where appropriate, the improvement in cavity re-flectance will permit better visibility with far less light.
Explore the applicability of using red or blue LEDs for colored lighting (and indeed, forwhite lighting). LEDs are rugged, extremely durable, relatively small, very energy-efficient, excellent at optical control (to deliver light in the desired place and pattern), andbuilt to emit only the desired colors. LEDs are gaining favor in many specialized appli-cations such as traffic lights and exit signs. Energy savings in the order of 80–95% areprobably possible with red LEDs, but a new light fixture design would have to be devel- 92 Ibid.93 See E SOURCE TECHNOLOGY ATLAS, Lighting (1997 ed.), www.esource.com.

Rocky Mountain Institute Energy Efficiency Survey Aboard USS Princeton CG-59© RMI 2001 www.rmi.org 30 June 2001 unclassified
74
oped and tested. Investigate whether an LED lamp manufacturer (e.g., Ledtronics,www.ledtronics.com) could develop a lamp that simply replaces the existing red fluores-cent lamp. Because LEDs have no fragile cathode, they can have extremely high resis-tance to shock, increasing survivability.
NAVSEA has cost-effectively installed LEDs that fit into screw-type bulb sockets on theislands of some aircraft carriers, significantly reducing maintenance costs. ApparentlyNAVSEA has not explored LEDs for use in the standard shipboard overhead fixtures.Reportedly the Navy is developing Neals lighting that might eliminate the red sleevesover the fluorescent tubes.94
Battle lanterns: About 700–800+ small (and often portable) yellow battle lanterns aredispersed around the ship. Their 7-V batteries automatically kick in if ship’s power islost. The RMI Team suggests the Navy consider using solid-state circuits with a lowdraw (and no parasitic draw) instead of the electromechanical relays now used.
Potential productivity improvements: The Navy might consider the potential for in-creased labor productivity (and possibly better retention and crew health) from improvedlighting quality and design. Case studies ashore show 6–16% increases in productivity(including reduced absenteeism) in assembly, retail, and office environments.95 In short,if people can see better what they’re doing, they tend to do more and better work.
Other lighting measures considered: Several other measures commonly employed ashoreto improve lighting efficiency were considered but are not recommended as strong candi-dates for shipboard application. These included:
T5 FLS AND INDIRECT LIGHTING: T5s are very bright and work well in high bay applica-tions where they excel at replacing metal halide. But CG-59 does not have enough highbay areas to justify this. In low bay areas, T5s’ use is limited to indirect lighting reflectedoff the overhead. This would not work on CG-59 because the overhead is too low andcluttered with pipes, ducts and cables.
DAYLIGHT HARVESTING AND REMOTE SOURCE LIGHTING: This lighting technology bringsavailable daylight into a structure without glare, and uses dimming ballasts to reduce lightfixture output proportionately and automatically. This approach has apparently been ex-perimented with on hanger decks in Navy carriers; reportedly DDG-78 uses fiber opticremote-source lighting on one area of its hangar deck.96 However, there are essentially noportholes on CG-59, skylights are out of the question, and other light piping techniquesare probably impractical due to structural and space constraints; thus daylight harvestingis not suitable. However, for new ships, simple daylight concentrators and light-pipe orfiber-optic delivery may be worth considering: a concentrating harvester of only a few
94 Andrew Bigley, NAVSEA (215.897.1190 / [email protected]), personal communication, 9May 2001.95 See Greening the Building and the Bottom Line, 1994/98, www.rmi.org/images/other/GDS-GBBL.pdf.96 Andrew Bigley, NAVSEA (215.897.1190 / [email protected]), personal communication, 9May 2001.

Rocky Mountain Institute Energy Efficiency Survey Aboard USS Princeton CG-59© RMI 2001 www.rmi.org 30 June 2001 unclassified
75
square yards can nicely light thousands of square yards of interior space. This techniqueis used in Japan to grow gardens many stories underground—and is reportedly worth-while there at electricity prices lower than those aboard ship. At night or in cloudy condi-tions, the same delivery system can deliver light from extremely efficient electricallypowered sources such as a large metal-halide lamp with the heat filtered out (and perhapsused). Lighting maintenance costs could be nearly eliminated and survivability enhanced.
Occupancy Sensors: These devices automatically turn off the lights in unoccupied spaces.They are not recommended for shipboard use due to high cost and complex controls. Theconnected load for each occupancy sensor would be very small, and the control would beexpensive to install. Also, a delay in a light’s coming on during battle conditions is unac-ceptable. Reportedly NAVSEA has considered various lighting controls improvements,including motion sensors, but has not found any that successfully address concerns aboutsafety and cost.97
Improve air compressor efficiency.
ObservationsCG-59 has both reciprocating high-pressure air compressors (HPAC) with a rated outputof 20 ft3 of air per hour98 at 3,000 PSIG, and axial low-pressure air compressors (LPAC)with a rated output of 100 CFM of air at 125 PSIG. Both use desiccant dehumidification(the LPAC has both refrigerative and desiccant dehumidifiers), at least partially to protectrubber gaskets in Leslie valves.
LPAC compressor skid. Jim Rogers photo (camera date was mis-set).
97 Ibid.98 As stated in Section 28, p. 99, of CG-59 Engineering Department Handbook, undated.

Rocky Mountain Institute Energy Efficiency Survey Aboard USS Princeton CG-59© RMI 2001 www.rmi.org 30 June 2001 unclassified
76
RecommendationsConsider replacing the desiccant dryers with refrigerated dryers. Consider checking thesystem for leaks comprehensively. Evaluate the efficiency of the compressors when theyoperate at partial loads (it is probably poor). Investigate using a small “pony” compressorto maintain system pressure during periods of reduced pressure needs, rather than runningthe main compressors all the time to do so. Investigate the potential advantages of theunique fast (millisecond-timescale) control systems made by Compressor Controls Com-pany of Des Moines, IA (www.compressorcontrols.com) for both axial and centrifugal(but not reciprocating) compressors.
As noted above on pp. 34–35, compressed air is also drawn from the 14th stage of theGTGs and used as bleed air for hull friction sound masking and PRAIRIE prop cavitationsound masking. (The GTMs have a bleed valve at the 16th stage of the turbines, but thebleed air is typically drawn from the GTGs). The air is cooled from ~800°F to ~200°F bya SW HX cooling system before it is released. When the bleed air valve is engaged, theturbine runs hotter; shutting it down when one GTG is producing all of the bleed air re-duces turbine temperature by ~100°F, increasing its capacity by about 200–300 kW ofload. The ship pays a fuel penalty for this bleed air, but the masking benefits are impor-tant. Apparently the volume of air required for masking prohibits economical use of acompressor instead.
Upgrade monitoring and controls.
ObservationsAs the saying goes, if you can’t measure it, you can’t manage it. CG-59 has a wide arrayof monitoring and controls, but there remains room for improvement, including in engi-neering systems. There are many analog gauges in CCS and on devices (several of whichare regarded skeptically by veteran engineering crew). Hourly readings for numerous me-chanical systems indicators are recorded, printed out, and stored on paper—but not inautomated spreadsheets that would allow for ready analysis, trending, graphing, and othermanipulation of the data so it can be effectively interpreted. Some systems’ performance(e.g., CHs) are logged manually. There is minimal submetering of systems components;for example, the fuel consumption of any of the GTGs and GTMs cannot be directlymeasured in operation, as they all share a common fuel line. The lack of graphical capa-bility limits the ability to understand the behavior of complex systems, since the brain hasorders of magnitude less bandwidth for numbers than for pictures. Data are not real-time.
In these respects the capable crew lack the ability to view real-time mechanical systemsperformance(s) at a detailed level of resolution, and thus do not have the opportunity toemploy certain advanced management techniques. Nor are they readily able to log, re-cord, trend, and display basic systems performance data over long periods under variedoperational conditions (or in real time), which can be a valuable method of identifyingproblems and potential improvements. Three-dimensional graphical software can be veryuseful in discovering hidden trends in complex systems’ behavior over long periods, andcan instantly identify the existence (and, almost instantly, track down the cause) of in-cipient inefficiencies and failures, greatly improving preventive maintenance. Archived

Rocky Mountain Institute Energy Efficiency Survey Aboard USS Princeton CG-59© RMI 2001 www.rmi.org 30 June 2001 unclassified
77
data also support benchmarking, continuous improvement, alignment of performanceevaluations with objectives, and the other fundamentals of total quality management.
The Navy is working constantly to improve control systems; indeed, most civilian expertsin direct digital controls became experts in the Navy. Full Authority Digital Control(FADC) systems under development help bring intelligence to the component level, in-creasing operational efficiency (e.g., GTG controls and diesel motor electronic fuel in-jectors). NAVSEA is conducting R&D on smart motor controllers, lighting controls, andpower-saving shipboard network infrastructures for electrical power management andmachinery remote command/control/communication.99 Perhaps casualty control anddamage control assessment (DCA) network systems under development that display thestatus of critical shipboard systems100 might also support more optimal engineering op-erational decisions. For example, it might be possible now to use the damage control con-sole to see valve positions in pumped systems.
Yet regardless of the amount and quality of data available, optimal systems managementstrategies are impotent without the ability to control the systems being monitored. CG-59has limited ability to vary power or supply outputs to match variable loads, apart from theGTMs and GTGs (and constraints apply even there). The ship typically has to run itsequipment in binary on/off mode: most motors, fans, and pumps operate either all-out ornot at all. Redundant systems and EOSS procedures enhance resilience and consistency(especially under duress), but also can limit useful, more resource-efficient options (e.g.,single-GTG or single-CH operations). Simplified operations can impose significant andcostly penalties through increased fuel and maintenance costs.
CG-59’s Central Control Station. Chris Lotspeich photo.
99 “Electrical Energy Efficiency,” presentation to DSB Task Force on Improving Fuel Efficiency of Weap-ons Platforms, presentation handouts, Andrew Bigley, NAVSEA (215.897.1190 /[email protected]), and personal communication, 9 May 2001.100 CG-59 XO CDR Bryan McGrath, personal communication, 2 February 2001.
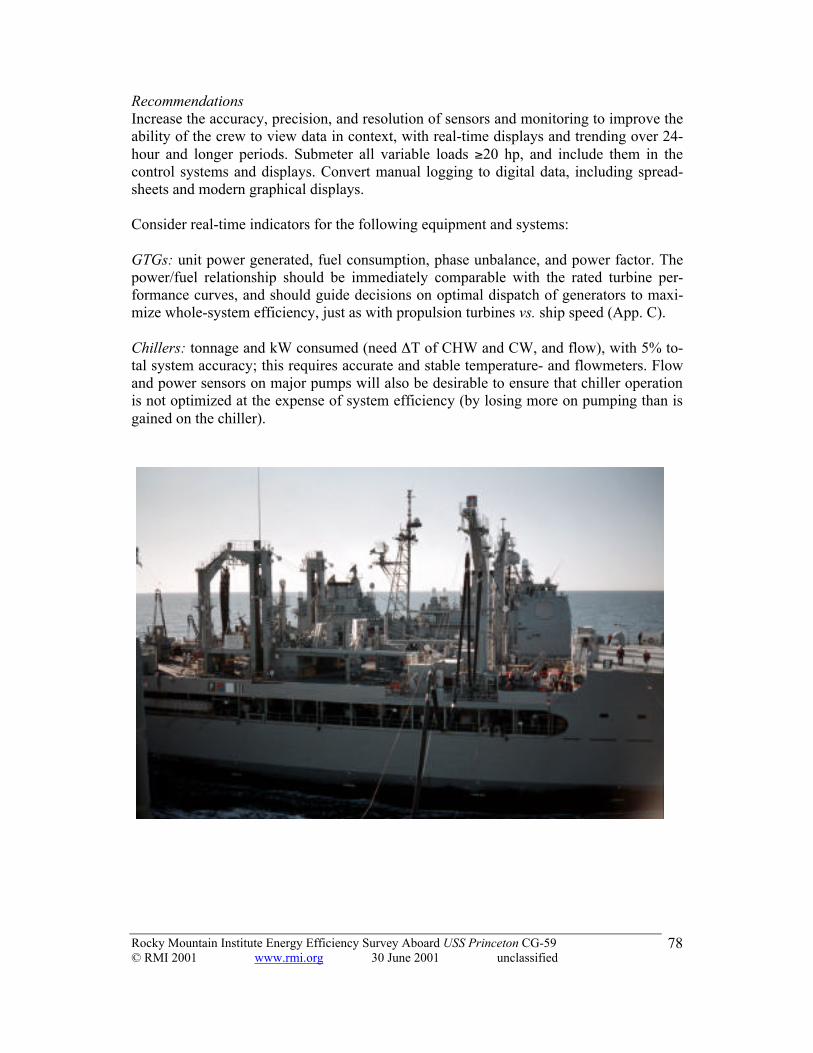
Rocky Mountain Institute Energy Efficiency Survey Aboard USS Princeton CG-59© RMI 2001 www.rmi.org 30 June 2001 unclassified
78
RecommendationsIncrease the accuracy, precision, and resolution of sensors and monitoring to improve theability of the crew to view data in context, with real-time displays and trending over 24-hour and longer periods. Submeter all variable loads ≥20 hp, and include them in thecontrol systems and displays. Convert manual logging to digital data, including spread-sheets and modern graphical displays.
Consider real-time indicators for the following equipment and systems:
GTGs: unit power generated, fuel consumption, phase unbalance, and power factor. Thepower/fuel relationship should be immediately comparable with the rated turbine per-formance curves, and should guide decisions on optimal dispatch of generators to maxi-mize whole-system efficiency, just as with propulsion turbines vs. ship speed (App. C).
Chillers: tonnage and kW consumed (need ∆T of CHW and CW, and flow), with 5% to-tal system accuracy; this requires accurate and stable temperature- and flowmeters. Flowand power sensors on major pumps will also be desirable to ensure that chiller operationis not optimized at the expense of system efficiency (by losing more on pumping than isgained on the chiller).

Rocky Mountain Institute Energy Efficiency Survey Aboard USS Princeton CG-59© RMI 2001 www.rmi.org 30 June 2001 unclassified
79
POTENTIAL NEW SHIP DESIGN OPPORTUNITIESThis report addresses both retrofit opportunities on a CG-47 and implied new ship designopportunities throughout the Navy. This section briefly summarizes recommendations forclean-sheet design (e.g., DD-21 or similar programs); some weren’t previously discussed.
HULL AND SUPERSTRUCTURE
Consider ultralight fiber-reinforced composites with high strength, enhanced ballisticprotection, and reduced radar signature. RMI has found that in automotive design, athreefold mass reduction and a severalfold drag reduction open up a new design space:conversion to hybrid-electric propulsion makes the platform’s mass, cost, and complexitygo down rather than up, permitting radical simplification (www.hypercar.com). Navalarchitecture is very different, but some useful analogies appear worth exploring.
PROPULSION
Optimize motor size, efficiency, and torque/speed curve, then dispatch to maximizethermal or conversion efficiency and most efficiently meet real-time power requirements.Continue electric drive development using the most modern motor designs (RMI has pro-vided NAVSEA with new technical information on switched reluctance drives).
POWER GENERATION
Maximize end-use energy efficiency to minimize loads before sizing generating capacity.Optimize generator size, then dispatch to maximize conversion efficiency and most effi-ciently meet loads integrated over the range of operating conditions. Consider modular-ity, e.g., microturbines and fuel cells. Explore UPS, load-smoothing, and transient-stabilization options including superflywheels and ultracapacitors. Thoroughly integrateproduction of electricity, heating, and cooling to achieve system efficiencies above 90%.
DRIVEPOWER AND MECHANICAL SYSTEMS
First minimize flow, friction, and resistance. The resulting savings will multiply back up-stream, making upstream components successively smaller, cheaper, lighter, and moreefficient. Use fat, short, straight, sweet, smooth pipes and ducts wherever possible. Over-sized pipes, ducts, and wires reduce flow losses and downsize pumps, fans, motors, andsuch control electronics as VSDs. Minimize valves and their losses (and likewise in air-handling systems); for example, generally avoid globe valves. Where architectural con-siderations permit, lay out the pipes and ducts first, then the equipment that they connect.Seek to “untangle” layouts to eliminate bends wherever possible. Do not “dress” layoutsto be neat and orthogonal; diagonals, where they fit, often cut cost and friction better.
Specify the most efficient models among the premium-efficiency range of motors,pumps, fans, and other devices. Don’t assume this will raise capital cost. (“In God wetrust”; all others bring data.) Use VSDs on all variable loads and soft-start devices on all

Rocky Mountain Institute Energy Efficiency Survey Aboard USS Princeton CG-59© RMI 2001 www.rmi.org 30 June 2001 unclassified
80
motors ≥10 hp. Optimize device size. Dispatch multiplex unequal units to serve varyingloads efficiently. Automate backup device and system startup for fight through resilience.
HVAC
First optimize the human comfort range and minimize unwanted heat gains. Then con-sider passive heating and cooling by taking advantage of ambient conditions. For exam-ple, consider the hull as half of a plate-exchanger HX. Consider adding cooling coils in-side the hull for the other “half” to make closed-loop condenser water for proc-ess/equipment cooling. Then consider nonrefrigerative cooling—typically combinationsof desiccant, absorption, and evaporative, such as the Pennington cycle—run from prime-mover waste heat, and separately sized and optimized for latent and for sensible loads.
To the extent refrigerative cooling is required, optimize chiller size, then dispatch to meetloads most efficiently. Use low-face-velocity (≤200 fpm), high-coolant-velocity coils.Dedicate cooling systems to meet clusters of needs within narrow, empirically definedtemperature ranges, to avoid overcapacity or supplying more cooling or lower tempera-ture than is actually required elsewhere. Recapture and use available waste heat.
LIGHTING
Apply comprehensive, integrated lighting design to maximize visibility, productivity, andcomfort while minimizing energy use. Provide the right amount and quality of light forthe task. Prefer indirect to direct lighting where feasible. Use optically efficient lumi-naires. Consider daylight harvesting, dimming controls, and resilient, low-maintenancefiber/tube distribution. Avoid magnetic ballasts. Use LEDs for white and colored light.
CONTROLS
Submeter loads and systems extensively with sensors and metrics that accurately indicatephysical performance. Link high-quality sensors to multiuse real-time graphical displaysthat measure, archive, trend, and display data. Automate device controls and backup sys-tem startup sequences to optimize energy efficiency and fight through resilience.
MOST IMPORTANTLY—INTEGRATE
Pending discussions proposed by NAVSEA with the Blue and Gold Teams, RMI cannotbe sure that the highly integrated whole-platform design approach it developed for auto-motive design is being applied to DD-21. If not, energy savings would be smaller, andboth capital and operating costs higher, than necessary. Inform design by the whole-system marginal value of saving each watt of electricity. In automotive design, that valueis understated by an order of magnitude—based essentially on alternator sizing. It omitsthe cost, bulk, and mass of wiring; ignores mass compounding; and most importantly,omits the whole-platform benefits of peeling a slice off the top of the engine map so thatat all times the engine becomes smaller, lighter, cleaner, cheaper, and more efficient.Avoiding this common fallacy probably has useful analogies in Naval architecture.

Rocky Mountain Institute Energy Efficiency Survey Aboard USS Princeton CG-59© RMI 2001 www.rmi.org 30 June 2001 unclassified
81
RECOMMENDATIONSBased on these observations and findings, the RMI Team recommends that the Navy:
1. Subject this report to rigorous scrutiny. Tear it apart, find and fix its inevitable errorsand omissions, make it better (as only your vastly greater knowledge permits), thenreassess the broad validity of its general findings. Determine whether next steps thenwarrant the high priority that the RMI Team would suggest. If the basic conclusionshold up, consider decisive action to accelerate the capture of these opportunities, onthe lines urged by the Defense Science Board’s Jan. 2001 Task Force report MoreCapable Warfighting Through Reduced Fuel Burden. That compelling analysis foundthat capturing the vast potential for energy efficiency in all DOD platforms is vital forsatisfying the demands of both Joint Doctrine and tight budgets. RMI concurs.
2. Give NAVSEA’s fine programs on basic energy stewardship the high priority theyhave long deserved, while building on them with these additional ideas as merited.Consider the suggested improvements in technical training and operational practice.
3. Expand NAVSEA’s efforts to measure the disaggregated efficiency of the main on-board systems surveyed—drivepower, pumping, air handling, chilling, lighting, andhot water—from end-use back to primary fuel, using physical performance metrics.
4. Intensify efforts to resolve, perhaps with the help of new energy-storage techniques,the longstanding debate over single-GTG operations. Examine the feasibility of morefundamental improvements to electric generating efficiency, such as updated turbine,microturbine or fuel-cell retrofits. Remember that electrical savings without improv-ing GTG operations or technology will save little net fuel.
5. For routine low-threat operations, test the Team’s off-plus-autostart, VSD, and otherrecommendations to modify normal practice, and see if they can be made prudent.
6. Improve Naval energy design philosophy and practice as this survey illustrates. Cur-rent design achieves many difficult objectives with great skill. However, greater em-phasis on highly integrated energy-efficient design, adapting best civilian practice tothe Navy’s unique requirements, should be able to improve warfighting and savemoney to an unexpected degree, creating not conflict but synergy with other goals.The Navy’s talented engineers should be able to grasp these opportunities smartly.
7. Consider a prompt intensive retrofit pilot project on a single vessel, based on the fol-lowing analogy. The sizes and modes of improvement found here are strikingly simi-lar to those RMI found in the Navy’s facilities ashore (p. 7). Joint design workshops,invited in 1995 by ADM Lopez and arranged by both uniformed and civilian leader-ship, tested a new design approach integrating many synergistic techniques, first inone pilot project, then in eight more. Another successful analog RMI helped establishwas Pacific Gas & Electric Co.’s $9M 1990s “ACT2” design/build efficiency test. ForNaval vessels, two intensive experiments may be warranted—one retrofit, one new.
8. Consider emulating NAVFAC’s next step—indoctrinating in-house and contract de-sign professionals in whole-system thinking. This achieved exceptional energy effi-ciency at the same or lower cost. Now it’s so institutionalized that designers unskilledin such work can’t even bid for NAVFAC jobs. Naval architecture is more special-ized and complex, but analogous design innovation should be applicable afloat.
9. Please give RMI your feedback to support its own efforts at continuous improvement.

Rocky Mountain Institute Energy Efficiency Survey Aboard USS Princeton CG-59© RMI 2001 www.rmi.org 30 June 2001 unclassified
82
APPENDICES
Appendix A: Measurement survey report
Appendix B: Electricity use of large pumps and fans
Appendix C: NAVSEA CG-47 fuel consumption curves
Appendix D: Resource-efficient design principles and RMI conceptual approach
Appendix E: Multiple benefits in motor systems
Appendix F: Multiple benefits in fluorescent-lighting systems
Appendix G: Optimal sequence for lighting improvements
Appendix H: Optimal sequence for cooling improvements
Appendix I: Sensors, metrics, monitoring, and control systems
Appendix J: Power factor and phase unbalance
Appendix K: NAVSEA ENCON energy survey checklist
Appendix L: Team bios and RMI qualifications
Appendix M: Information sources and bibliography
Appendix N: Glossary of terms and abbreviations
Endnotes

Rocky Mountain Institute Energy Efficiency Survey Aboard USS Princeton CG-59© RMI 2001 www.rmi.org 30 June 2001 unclassified
83
APPENDIX A:CHILLER MEASUREMENT SURVEY REPORT
USS Princeton Measurement Phase Trip Report, Thu–Fri 25–26 January 2001
The RMI Team, represented by Ron Perkins, boarded the ship at pier at about 9:30 andfound the crew busy with preparations for sea. The Team was escorted to engine roomAUX-1 and unpacked three boxes of instruments and sensors. The Team and crew se-lected chiller #4 for efficiency measurement, because the crew planned to run chillers #1and #4 at sea and chiller #4 was out of the way. The Team and crew removed the analogthermometers on the chilled water supply and return lines as well as the seawater (con-denser water) lines replacing them with hand matched, calibrated thermistors. Thermalgrease was used to ensure good conduction and eliminate insulating air pockets. Thechiller appeared to be 37% loaded as indicated by the York control panel, and the ther-mistor temperatures were within 0.6 F˚ of the control panel readings. The Team mountedthe Dynasonics flow meter on a vertical section of rubber isolating hose and programmedthe data logger. The readings were erratic with abnormal values, and were accompaniedby a low signal error message. Evidently the rubber hose contained a layer of reinforce-ment steel or other material that prevented the sonic waves from penetrating the material.There is no straight section of steel pipe in the space, so the Team abandoned the attemptto measure flow and instead adopted the control panel reading of 730 gpm for calculatingload. Calculations from water transport factor formulas indicated that this flow rate isreasonable.
The Team accidentally tripped the chiller off line while attempting to measure power,although this provided a good opportunity to observe what would happen if a chiller wentdown. Alarms alerted the crew and soon technicians were scrambling around trying toclear the safety cutouts. The chiller was restarted in about 15 minutes. It is interesting thatthe current limiter control prevents the chiller from ramping up quickly as most York ma-chines have done at other sites ashore. It took about 20 minutes for the chiller to stabilizeat about 37% of full load. To reduce the risk of tripping a chiller off line, the Team de-cided to trust the onboard CT readings to obtain power readings.
Ultimately, measuring the chillers’ efficiency proved impractical for two reasons:
(1) apparently the chillers cannot come to full load, and(2) hydronic problems might impel the crew to run two chillers instead of one.
To test the capability of single-chiller operating mode, the Team asked the supervisingChief Petty Officer to turn one chiller off for an hour so chiller #4 could load up. This testbegan at 9:00 AM. The Chief said they would get a call from CIC complaining aboutgetting hot. That call arrived within 15 minutes. The Team then sent an EM to CIC with adata logger fitted with a temperature and humidity sensor, which measured that it was67°F and 37% RH in CIC. Before restarting the second chiller, the Team went back toAUX-1 and read the chiller panel and delta sensors. The chiller was still producing 44°F

Rocky Mountain Institute Energy Efficiency Survey Aboard USS Princeton CG-59© RMI 2001 www.rmi.org 30 June 2001 unclassified
84
chilled water (at set point) and the load was 120 tons. This is good evidence that 120 tonswas the ship's total load on that winter morning (outside conditions were ~63°F and 34%RH). The main propulsion turbines were not running, but they would not load the chillersmuch because the engine room air is not re-circulated. When the chiller indicated 120tons, it was using 97% of its full load amps (FLA), indicating that it could not have pro-duced more cooling if it had to, because the current limiter kicks in at 100% FLA. Thus itappeared that the chiller could not produce its rated capacity of 200 tons. The Team doesnot know why this occurred, and suggests that the Navy investigate further, and test theother chillers to determine whether this applies to them as well.
Because the temperature rose in CIC from 62°F to 67°F while the one remaining chillerwas only 50% loaded, the factors described above led the Team to suspect that there wasa problem in the chilled water distribution system. The Team turned on a second chilledwater pump without starting the second chiller to see if that would reduce the temperaturein CIC; it did not. The Team still suspects that this is a hydronic problem, but started thesecond chiller without taking time for further investigation. Maintaining such cool tem-peratures in CIC seems to be unusual, as this makes the space very sensitive to chilledwater fluctuations, and apparently most or all of the electronic equipment is cooled by aseparate system. The Team did not determine other motivations for this approach, andsuggests that the Navy might reconsider this space cooling strategy.
The Team continued to measure power, flow, and ∆T at the equipment cooling heat ex-changer, the air compressor, and outside air supply fan. The Team did not measure atypical Fan Coil Unit because the chilled water valve was closed (no load) and the fan is1/5 HP. The insulation was rigid and plastered in place, so the Team was unsure the in-sulation could be replaced easily and was reluctant to cut into it.
The following chart shows the operating parameters of CH #4 during the monitoring pe-riod, measured at one-minute intervals. The top two lines show the outside air conditionsin temperature and relative humidity; peaks and valleys are driven by varying insolation.The next two lines down show the seawater temperature (condenser water supply tem-perature) and the condenser water return temperature. The return water temperature(brown line) varies as the load in the seawater pumps changes due to shifting load pat-terns aboard ship. These variations cause the flow rate through the condenser to change,and this causes the return water temperature to rise and fall. The seawater (heat-sink)temperature remained quite constant at 57˚F. The bottom two lines (chilled water supplyand return temperature) show that the heat rejected through the chiller is relatively con-stant at 3 F° (about 950 tons at 750 gpm flow rate). The convergence of the bottom fourlines at mid-chart indicate when the chiller was off-line. The trends then stabilized as thechiller returned to service.

Rocky Mountain Institute Energy Efficiency Survey Aboard USS Princeton CG-59© RMI 2001 www.rmi.org 30 June 2001 unclassified
85
OA RH
OA T
CWST
CWRT
CHWRTCHWST

Rocky Mountain Institute Energy Efficiency Survey Aboard USS Princeton CG-59© RMI 2001 www.rmi.org 30 June 2001 unclassified
86
APPENDIX B:ELECTRICITY USE OF LARGE PUMPS AND FANS
The following calculated data are primarily drawn from connected loads and load factorsprovided in the CG-60 energy study, representing cruise condition energy use.101 Meas-ured loads may differ substantially. Available measurements are described in the text.These calculations were part of an a priori effort to estimate how much of CG-59’s elec-tricity might be going to these particular loads, as summarized in the pie chart.
ENERGY USE OF LARGE FANS
Main engine cooling fans
• 4 fans @ 80 hp (65 kW) each; 2 run @ cruise condition• (65 kW × 0.52 LF = 33.8 kW) × 2 fans = 67.6 kW
GTG enclosure cooling fans
• 6 fans @ 12.5 hp (9.6 kW) each; 2 run @ cruise condition• (9.6 kW × 0.9 LF = 8.6 kW) × 2 fans = 17.2 kW
ENERGY USE OF LARGE PUMPS
Seawater pumps
• 3 pumps @ 125 hp (101.4 kW) each; 2 run @ cruise condition• (101.4 kW × 0.7 LF = 71 kW) × 2 pumps = 142 kW
Fire water pumps
• 6 pumps @ 150 hp (120.5 kW) each; 2 run @ cruise condition• (120.5 kW × 0.54 LF = 65.1 kW) × 2 pumps = 130.2 kW
Rudder hydraulic pumps
• 4 pumps @ 100 hp (80.6 kW) each; 2 run @ cruise condition• (80.6 kW × 0.19 LF = 15.3 kW) × 2 pumps = 30.6 kW
Chilled water pumps
• 4 pumps @ 50 hp (41 kW) each; 2 run @ cruise condition• 41 kW × 0.7 LF = 28.7 kW [ × 2 pumps = 57.4 kW?]
101 “Calculated Loads for CG-60,” unattributed study, sheet 1, pp. 1–54.

Rocky Mountain Institute Energy Efficiency Survey Aboard USS Princeton CG-59© RMI 2001 www.rmi.org 30 June 2001 unclassified
87
Main LO service pumps
• 4 pumps @ 50 hp (38 kW) each; 2 run @ cruise condition• (38 kW × 0.32 LF = 12.2 kW) × 2 pumps = 24.4 kW
CPR hydraulic pumps
• 2 pumps @ 125 hp (99.1 kW) each; 2 run @ cruise condition• (99.1 kW × 0.48 LF = 47.6 kW) × 2 pumps = 95.2 kW
Initially estimated electricity use of large pumps and fans, CG-47
Main LO
pumps5%
SW pumps26%
GT cool fans13%
Fire pumps24%
CHW pumps
5%Rudder hydrc pumps
6%
CPR hydrc pumps18%
GTG fans3%

Rocky Mountain Institute Energy Efficiency Survey Aboard USS Princeton CG-59© RMI 2001 www.rmi.org 30 June 2001 unclassified
88
APPENDIX C:NAVSEA CG-47 FUEL CONSUMPTION CURVES
These charts are from www.navsea.navy.mil/encon/CG47_files/sheet004.htm.

Rocky Mountain Institute Energy Efficiency Survey Aboard USS Princeton CG-59© RMI 2001 www.rmi.org 30 June 2001 unclassified
89

Rocky Mountain Institute Energy Efficiency Survey Aboard USS Princeton CG-59© RMI 2001 www.rmi.org 30 June 2001 unclassified
90
APPENDIX D:RESOURCE-EFFICIENT DESIGN PRINCIPLES
AND RMI CONCEPTUAL APPROACH
KEY PRINCIPLES
The following principles provide a framework for the RMI Team’s approach to resourceefficiency in technical systems and facilities:
• Use integrated, whole-system design• Start at the end-use, so savings compound going back upstream• Reduce loads first• Passive before active energy applications• Use only enough energy needed to do the job• Reduce resistance, friction, flow, and velocity• Increase pipe/duct size to cut velocity yet maintain flow• Fan/pump cube law savings: 1/2 speed = 1/8 energy use
Mechanical systems and equipment
• Chilled water temperatures should generally be as high as possible to help reducechiller energy use.
• Two-temperature parallel loops are more efficient. Higher-temperature loads can beserved by a dedicated chiller and piping system, while a separate cooling loop isserved by chillers running at lower temperatures. This way the facilities’ loads aresegregated into subsystems that enables optimal allocation of total cooling energy,and each chiller and associated equipment can be more accurately sized to serve theload and operate at peak efficiency.
• “Big Pipes / Small Pumps.” Increased pipe and duct diameters decrease friction, re-sistance, pressure drops, flows and velocities in air and water handling. This in turnallows reductions in size and capital cost of the pumps, fans, motors, inverters, andelectrical equipment that serve the load, thereby reducing the total cost of the system.
• Pressure drop is proportional to velocity squared. Cutting velocity in half reducespressure drop by 3/4ths (neglecting minor inverter losses).
• Power is proportional to volume cubed. Cutting velocity in half reduces fan or im-peller energy use by 7/8ths (neglecting minor inverter losses).
• Reuse surplus of available low level heat. Make use of available “waste” energy be-fore consuming fuel to accomplish a task.
• Use the best of the premium efficiency motors, pumps and fans with variable speeddrives. This is particularly valuable with continuous-duty applications and varyingloads. Select best-in-class units using MotorMaster or similar software.

Rocky Mountain Institute Energy Efficiency Survey Aboard USS Princeton CG-59© RMI 2001 www.rmi.org 30 June 2001 unclassified
91
Instrumentation and control systems
TQEM: You can’t manage what you don’t measure. Submeter with accuracy and preci-sion; link sensors to real-time controls. Archive, mine, and graphically analyze the data.Use metrics that drive continuous improvement. Physical metrics are best (App. I).
DESIGN CONSIDERATIONS
Integrated design methodology allows architectural and mechanical designers and proc-ess engineers to optimize the relationships of building envelope and major mechanicaland electrical systems. This effort will lower a facility’s first cost and increase the effi-ciency of its mechanical systems. The performance of many mechanical systems is com-promised by lack of space, location or orientation. An integrated design approach couldhave recognized and mitigated these effects at the same or reduced construction cost. Ef-ficient distribution systems and low velocity air handling systems require larger cross-sectional areas (often offset by reduced native and parasitic loads) and smooth, straight,short runs of piping and ductwork. It is much more cost-effective to integrate these ele-ments into the design at the schematic design phase than to try to squeeze them into re-stricted spaces during the design development phase.
The old saying “Haste makes waste”, is confirmed by the second law of thermodynamics’“…entropy is directly related to the rate of change.” While brisk execution is important,“fast track” design should not become standard procedure, because speed comes at theprice of lost efficiency and project value. Designing in haste is generally a recipe for re-penting and retrofitting at leisure; so is “infectious repetitis.” A concerted effort to evalu-ate and improve upon past designs using operator feedback and careful measurementshould be standard practice. Often the perceived need for fast design and construction iscaused by lack of planning and preparation. Over time, fast design can inadvertently be-come a substitute for these vital steps. It should be seen for what it is: a fast track tocapital waste in the short term and to operational costs and headaches later.
Maximal savings are achieved by first minimizing load at the end-use application, beforeapplying an energy-saving measure such as a variable speed drive. This sequence startsnot by making design assumptions but by accurately measuring actual performance. Thedata will reveal opportunities for load reduction (removing restriction points, etc.) andprovide a baseline for tracking progress. Then systematically move “upstream” towardthe motor, eliminating energy losses at each step. The resulting Resource EfficiencyModel typically looks like this:
1. Identify variables that define the system’s performance.2. Calculate how accurately, precisely, and stably it’s worth measuring performance. (In
general, all performance measurement sensors should be designed to produce ±5%system-level—not local single-parameter—accuracy.)
3. Measure the system’s performance to that accuracy. Managers and operators are fly-ing blind without the valid information that only accurate measurement provides.Measurement promotes insight, credibility, and confidence.
4. Analyze the measurements and identify key steps to cut load and improve results.

Rocky Mountain Institute Energy Efficiency Survey Aboard USS Princeton CG-59© RMI 2001 www.rmi.org 30 June 2001 unclassified
92
5. Reduce load and parasitic losses in the system.6. Resize motors for ~75–85% load at best available efficiency.7. Size and select VFD to modulate between 50% and 100% load.8. Repeat step 3 and evaluate ESM effectiveness.9. Publicize measured results to all ST energy managers and designers.10. Repeat from the beginning to achieve continuous improvement.
RMI TEAM CONCEPTUAL APPROACH AND KEY PRINCIPLES
End-use, least-cost analysis
Historically, energy resource discussions have focused on supply. But energy users don’twant barrels of oil or kilowatt-hours of electricity per se; they want the services that en-ergy ultimately provides: hot showers, cold beer, comfortable buildings, light, torque,mobility, etc. Focusing on these desired services, delivered by the end-use application ofenergy, allows consideration of a broader range of options than simply the energy sup-plied by the local grid or pipeline. RMI’s end-use, least-cost analytical approach evalu-ates both demand- and supply-side options to determine the cheapest, cleanest way to de-liver each of these services. Often the better, more cost-effective approach is to use lessenergy more productively, with smarter technologies. Efficient end-use can thus competewith new supply as an energy resource, and leverage bigger savings in resources, cost,and pollution upstream, across the whole system.
Harnessing market forces and using widely demonstrated and synergistic design, tech-nology, and management techniques can deliver energy services at far lower financialand environmental cost. Industry surveys of “demand-side management” efforts to saveelectricity show saved watts—or “negawatts”—typically cost ~0.5–2.5 cents per savedkilowatt-hour. Most good industrial and commercial programs fall toward the low end.102
Resource efficiency provides benefits beyond saving commodity costs. For example, the6–16 percent labor productivity gains in efficient buildings—due to their superior visual,acoustic and thermal comfort—are typically worth at least ten times more than the energysavings themselves, but are absent from all economic models of whether building pro-prietors will improve their energy efficiency.103
Integrated, whole-systems design
Whole-system design techniques offer some of the most significant savings opportunities.Inventor Edwin Land once remarked that “people who seem to have had a new idea haveoften simply stopped having an old idea.” This is particularly true when designing sys-tems for resource savings. The old idea is one of diminishing returns—that the greater the
102 See Amory Lovins, “Apples, Oranges, and Horned Toads: Is The Joskow & Marron Critique of ElectricEfficiency Costs Valid?” Electricity Journal, 7, no. 4 (May 1994) pp. 29–49. Available as Rocky MountainInstitute (RMI) Publication #U94-16 (Snowmass, CO: RMI, 1994).103 See Joe Romm and W. D. Browning, “Greening the Building and the Bottom Line: Increasing Produc-tivity Through Energy-Efficient Design,” RMI Publication #D94-27 (Snowmass, CO: RMI, 1994).
Rocky Mountain Institute Energy Efficiency Survey Aboard USS Princeton CG-59© RMI 2001 www.rmi.org 30 June 2001 unclassified
93
resource saving, the higher the cost. But that old idea is giving way to the new idea thatbigger savings can cost less: that saving a large fraction of resources can actually costless than saving a small fraction of resources (or saving nothing).
Interface Corporation, the leading maker of materials for commercial interiors, appliedsuch an approach to a standard “pumping loop” (a common feature in many factories andmost large buildings) in its new Shanghai carpet factory. A top European company haddesigned the system to use pumps requiring a total of 95 horsepower. But before con-struction began, Jan Schilham, a Dutch engineer at Interface, realized that two embar-rassingly simple design changes would cut that power requirement to only 7 horse-power—a 92 percent reduction. Yet the redesigned system cost less to build, involved nonew technology and worked better in all respects.
What two design changes achieved this twelvefold saving in pumping power? Schilhamapplied techniques pioneered by Singapore engineer Eng Lock Lee of SupersymmetryServices (www.supersym.com.sg). First, Schilham chose larger-diameter pipes, whichgenerate much less friction than smaller-diameter pipes and therefore need far lesspumping energy. The original designer had chosen the smaller pipes because, accordingto the traditional method, the extra cost of larger ones wouldn’t be justified by thepumping energy they would save. While this standard design trade-off optimizes thepipes by themselves, it “pessimizes” the system as a whole. Schilham optimized thewhole system by counting not only the higher capital cost of the larger pipes but also thelower capital cost of the smaller pumping equipment that would be needed. The pumps,motors, motor controls and electrical components could all be much smaller because ofthe reduced friction. Capital cost would fall far more for the smaller equipment than itwould rise for the larger pipes, because friction falls as nearly the fifth power, but pipecost rises as only about the second power, of pipe diameter. Choosing larger pipes andsmaller pumps—not smaller pipes and larger pumps—would therefore make the wholesystem cheaper to build, even without regard to its twelvefold reduction in energy use.
Schilham’s second innovation was to reduce the friction even more by making the pipesshort and straight rather than long and crooked. He did this by laying out the pipes first,then positioning the various tanks, boilers and other equipment that they connected. De-signers normally locate the production equipment in arbitrary positions, and then have apipefitter connect the components. Awkward placement, exacerbated by trade-schooltraining to dress pipes neatly at right angles rather than taking a more direct route or un-tangling the layout, forces the pipes to make numerous bends that greatly increase fric-tion. In addition to saving on installation, materials and electrical costs, Schilham’s short,straight pipes were easier to insulate, saving an extra 70 kilowatts of heat loss and repay-ing the insulation’s cost in three months. A half-dozen further benefits were achieved too.
This small example has important implications. Pumping is the largest use of motors, andmotors use three-quarters of all industrial electricity in the United States (or three-fifthsof all electricity).104 Second, the lessons are very widely applicable. Interface’s pumping 104 See E SOURCE, Drivepower Technology Atlas, E SOURCE Publication #TA-DP-96 (Boulder, CO: ESOURCE, 1996), www.esource.com.

Rocky Mountain Institute Energy Efficiency Survey Aboard USS Princeton CG-59© RMI 2001 www.rmi.org 30 June 2001 unclassified
94
loop shows how simple changes in design mentality can yield huge resource savings andreturns on investment. This isn’t rocket science; often it’s just a rediscovery of goodVictorian-era engineering principles, lately overlooked because of specialization.
Barrier Busting
A common example of breaking down barriers can be found in the behavior of the differ-ent parties involved in commercial building construction. Consider four such actors: theowner, the designer, the construction contractor and the tenant. The owner is not likely tospecify target levels of energy performance beyond meeting building codes, particularlyfor a structure intended for lease. The architect probably has not been trained in whole-system, resource-efficient design. If she is familiar with these techniques, she may notwish to struggle with the owner or contractor to explain the benefits of such an approach.In any event, the structure of her compensation typically rewards her for what she spends,not for what she saves. The contractor wishes to capture as much profit as possible fromthe bid price and has the incentive to install the least expensive components he can find,regardless of how inefficiently they use energy or water. The tenant has no say and isstuck with the utility bills. All of these people are acting in their economic self-interest,within the bounds of their knowledge; yet the outcome is a relatively inefficient building.
For example, the after-tax return on increasing the diameter of wire by just one size in astandard U.S. office lighting circuit typically approaches 200 percent per year. The wire-size table in the National Electrical Code is meant only to help prevent fires, not savemoney, and hence specifies wire with half the diameter—with four times the electricallosses due to greater resistance—that would be economically desirable. But an electricianaltruistic enough to buy the larger (and more expensive) wire would no longer be the lowbidder and wouldn’t get the job. This example embodies two barriers: a life-safety mini-mum-requirement code misinterpreted as an economic optimum, and a split incentivebetween the party who chooses the wire size and the one who later pays the electric bills.
There are numerous remedies for these barriers to achieving efficient buildings. Betterawareness of demonstrated techniques for more resource-efficient construction wouldbenefit all the above parties. An integrated design workshop where all the parties in-volved in the building participate in an intensive, multidisciplinary and facilitated meet-ing to optimize the plans and specifications often radically improves a building's design.Performance-based fees, which reward the designer in part based upon measured savingsin energy and water efficiency relative to pre-agreed standards, can provide the incentivefor more efficient design. A former Commander of NAVFAC expressed interest in pro-curing design services in that fashion; RMI’s five successful experiments with such feesindicate that experimentation with them is a realistic and valuable priority for the Navy.

Rocky Mountain Institute Energy Efficiency Survey Aboard USS Princeton CG-59© RMI 2001 www.rmi.org 30 June 2001 unclassified
95
APPENDIX E:MULTIPLE BENEFITS IN MOTOR SYSTEMS
This appendix for more technically inclined readers explains how premium-efficientmotors can deliver about 16 different benefits from a single retrofit expenditure.
Motor systems: 16-for-one benefits
What answer you get depends on what question you ask. In car design, if you focus onjust the engine of a normal car, you may find it’s rated at over 30% efficient. So itis—when run under ideal conditions. Yet the suboptimal way it’s typically used cuts itsaverage efficiency to about 15%. Some more torque is lost en route to the wheels, andonly 1% of the fuel energy ends up moving the driver, whose body weighs only about 5%as much as the vehicle does. Electric motor systems in factories and big buildings aresimilar: the motor itself may be very efficient under ideal conditions, but the way it’susually used is often very inefficient, wasting most of the motor’s torque before it can dothe desired task. Avoiding that inefficiency requires not just an efficient motor, but ap-plying it in an efficient system.105
When asked how to save some of the three-fifths of U.S. electricity that goes into motors,most practitioners emphasize only two improvements:
• premium-efficiency induction motors, which gain several percentage points’ effi-ciency because they’re better designed and built, using a larger quantity and higherquality of copper and iron to reduce electrical and magnetic losses; and
• variable-speed drives (VSDS) using electronic inverters to vary the frequency of thealternating current that drives the motor in order to adjust its speed to what the taskrequires at the time. The output of many pumps, blowers, and fans is controlled byrunning them at full speed against a mechanical obstruction like a “throttling valve.”Yet pumps’ and fans’ power consumption varies roughly as the cube of their flowrate, so if only half the full flow were needed, seven-eighths of the full input power,less minor VSD circuit losses, could be saved by removing the obstruction and halv-ing the speed. VSDs’ full use could thus save ~20%106 or ~14% to 27%107 of all U.S.motor energy, with typical paybacks estimated at about 1 to 21/2 years respectively.
105 The original analysis is in Lovins, A.B., Neymark, J., Flanigan, T., Kiernan, P.B., Bancroft, B., &Shepard, M. 1989: The State of the Art: Drivepower, COMPETKTEK / Rocky Mountain Institute, SnowmassCO 81654-9199. For later, less thorough, but somewhat more up-to-date versions, see Nadel, S., Shepard,M., Greenberg, S., Katz, G., Almeida, A. 1991: Energy-Efficient Motor Systems: A Handbook on Technol-ogy, Program and Policy Opportunities, American Council for an Energy-Efficient Economy(www.aceee.org), Washington, D.C. and Howe, B., Shepard, M., Lovins, A.B., Stickney, B.L. & Hough-ton, D.J. 1996: Drivepower Technology Atlas, E SOURCE, www.esource.com. Motor data are periodicallyupdated by the comprehensive MotorMaster database sponsored by USDOE (800/862-2086, FAX 360/586-8303, Motor Challenge Information Clearinghouse, Box 43717, Olympia WA 98504-3171).
106 Fickett, A.P., Gellings, C.W., & Lovins, A.B. 1990: “Efficient Use of Electricity,” Scientific American263(3):64–74, Sept.

Rocky Mountain Institute Energy Efficiency Survey Aboard USS Princeton CG-59© RMI 2001 www.rmi.org 30 June 2001 unclassified
96
So far, so good. But adding 33 further drivesystem improvements—in the choice, sizing,maintenance, and life of motors, in control systems of three further kinds, and in up-stream electrical supplies and downstream mechanical drivetrains—can at least doublethe savings from these two measures.108 It can also cut total retrofit cost by perhaps five-fold109, because of the 35 combined measures, 28 are free byproducts of the other seventhat must be paid for, yielding greater savings at no extra cost.110 In short, whole-systemdesign, by capturing multiple benefits, tunnels through the cost barrier.
Immediately retrofitting an in-service standard-efficiency induction motor to a premium-efficiency model, without waiting for it to burn out, is commonly assumed to be a baddeal: the energy saved by the new motor’s higher efficiency is often said to take 10–20years to pay for the entire cost of the new motor. This comparison counts just the fol-lowing single benefit:111
• The more efficient new motor will need less energy than the inefficient old one toproduce the same torque; how much less is conventionally calculated from their full-load rated efficiencies and from how many hours a year they operate.
But in fact, immediate retrofit usually pays for itself within just a few years, because thepremium-efficiency motor yields many more benefits than just saving energy through ahigher “nameplate” efficiency rating:
• Many U.S. motors are so grossly oversized that probably half never exceed 60%, anda third never exceed 50%, of their rated load. This oversizing often makes actual effi-ciency, operating at the actual loadpoint, lower than the nameplate rating implies.Quite commonly the efficient new motor, properly sized, will be one frame sizesmaller than the old inefficient motor; sometimes two sizes smaller; occasionallythree. Making the new motor even one size smaller makes it cheaper—saving morecapital cost than the extra cost, if any112, of making it more efficient.
107 Lovins et al. 1989, op. cit., updated and supplemented by Howe et al. 1996, op. cit.
108 Lovins et al. 1989, op. cit.
109 Fickett et al. 1990, op. cit.
110 Lovins et al. 1989, op. cit.
111 Actually this is two benefits, because saving electricity reduces both energy charges and demandcharges, but it might be considered just the single benefit of “saving electricity and hence reducing the util-ity bill.”
112 There is no such extra cost of efficiency up to at least 250–300 horsepower. However, even if the usualrule-of-thumb were right about how much extra you have to pay for a more efficient motor, making thenew motor the right size would typically reduce the payback of immediate retrofit to about three years.

Rocky Mountain Institute Energy Efficiency Survey Aboard USS Princeton CG-59© RMI 2001 www.rmi.org 30 June 2001 unclassified
97
• Motors that are too big—run at below their optimal load—not only become less effi-cient; they also run faster. When they are running a pump or fan, the faster speed pro-duces more flow that’s typically unwanted, but increases energy use as the cube ofthe flow rate. Making the motor the right size provides exactly the desired flow andeliminates this waste, so the new, right-sized motor will cost less and save more thanyou’d expect just be comparing rated full-load efficiencies for motors the same size.
• The new motor will typically stay highly efficient across a wide range of operatingconditions—speed and torque. This “bigger bull’s-eye” on the “efficiency map”maximizes energy savings not just at a narrowly defined operating point but throughmuch or all of the range of conditions in which the motor will actually be called uponto operate. It can greatly increase calculated savings compared with a small-bull’s-eyemotor that operates most of the time at far from its optimal load.
• The efficient new motor, even though it’s more fully loaded, will run cooler becauseit typically halves the losses that route electricity into making the motor hot ratherthan making it turn. Heat is the enemy of motors: every 18 F˚ of increase in motortemperature cuts the life of the insulation and other oxidizable materials about in half.This also works backwards: every 18 F˚ of decrease in temperature makes these keymaterials last about twice as long. Running cooler therefore stretches motor life, re-ducing the costs of maintenance or downtime or both.
• Running cooler also decreases electrical resistance in the copper, boosting efficiency.• Premium-efficiency motors tend to come already equipped with higher-quality bear-
ings than standard-efficiency motors. Three-fourths of medium-sized motor failuresare caused by bearing failures, so better bearings mean longer motor life.113 Thismeans that the energy plus maintenance savings of the new motor will, over time,typically more than pay for immediately substituting it for the old motor.
• Cooler operation makes bearing grease last longer. This means either greater reliabil-ity on the same lubrication schedule or the same reliability with less frequent lubrica-tion, which reduces maintenance cost. Greater liability reduces, and less frequent lu-brication might reduce, downtime, which can range from a minor nuisance to a mul-timillion-dollar charge, depending on the nature of the process and the function of themotor.
• The new motor automatically eliminates any increased magnetic losses that may havebeen caused by improper past repair of the old motor.114 Adding this benefit to propermotor sizing yields direct electrical savings roughly twice as big as would be ex-pected from the new motor’s better nameplate efficiency alone.
113 Changing to a premium-efficiency motor also makes it easy to add at the factory some “bearing sealisolators” that keep traces of water or other contaminants from getting into the bearing and causing it tofail—cheap insurance that can greatly increase motor life at very low cost.
114 Normal rewinding methods cook the nonrotating iron parts of the motor in an oven, often causing subtleand irreversible magnetic damage that wastes about $1–3 billion a year worth of electricity in the UnitedStates. Better methods that are faster, cheaper, and nondamaging are on the market but little-known. TheNavy may have avoided such damage by using the superior Thumm method for rewinds at sea, thoughRMI does not know whether some outsourced repairs done ashore might not use burnout ovens: the engi-neering crew aboard USS John C. Stennis who were using the Thumm method seemed unaware of its ad-vantages and importance for protecting motor efficiency.

Rocky Mountain Institute Energy Efficiency Survey Aboard USS Princeton CG-59© RMI 2001 www.rmi.org 30 June 2001 unclassified
98
• The high-efficiency motor generally has a better power factor115 as a free byproductof its better design. This avoids most or all of the cost of capacitors otherwise neededto compensate for bad power factor, as well as the cost of extra generation and distri-bution capacity and operating costs to deliver unnecessary reactive power.
• Higher power factor also reduces electrical losses in the wiring within the plant.• The high-efficiency motor tends to heat up less when exposed to harmonics (multi-
ples of the frequency of the alternating current). This helps it run cooler and more ef-ficiently at variable speed.
• The new motor is more tolerant of improper supply voltage, which is quite common.• The new motor loses much less efficiency and lifetime if the three phases of its power
supply don’t have almost perfectly matched voltages—another common conditionthat can dramatically degrade inefficient motors’ power output and their lifetime.
• The new motor’s energy savings let it draw less current than the old motor. Losses inthe plant’s wires, transformers, and other electrical supply equipment vary as thesquare of current: lower current, much lower losses.
• All the reduced losses, direct and indirect, release less heat into the plant. In air-conditioned space, that means less cooling and air-handling energy and capacity.
The premium-efficiency, right-sized motor thus provides at least 16 important operationaladvantages; but it needs to be paid for only once. However, many of these savings de-pend on others.116 For example, both efficiency and motor life depend on other energy-saving improvements too: reducing voltage imbalance between the phases, improvingshaft alignment and lubrication practice, reducing overhung loads (sideways pulls) on theshaft that can cut bearing life by at least 5- to 10-fold, and improving housekeeping—notsiting motors in the sun or next to steam pipes, not smothering them beneath multiplecoats of paint, etc.
Motor choice, life, sizing, controls, maintenance, and associated electrical and mechani-cal elements all interact intricately. For example, suppose you’re replacing an old fanmotor with a right-sized, premium-efficiency motor. Most fans are driven by V-belts,which stretch, slip, wear out, require frequent maintenance, and waste about 5–15% ofthe torque they transmit. It would be better to use a 98–99%-efficient, virtually zero-maintenance belt, such as a “synchronous belt” that doesn’t slip because its teeth engagesprocket lugs, doesn’t stretch because it has fiberglass or aramid bands inside like a radialtire, and saves so much maintenance that the electricity it saves costs about minus a dollarper kilowatt-hour. But such a belt doesn’t have much “give,” and fans take a lot of torqueto start up, so the first time you turn it on, the belt’s teeth may well strip with an awfulscreech. The answer is to use a stretchier but still extremely efficient flat belt, or to equip
115 Power factor (Appendix J) is the cosine of the phase angle between current and voltage. It reflects thedegree to which the power source must provide out-of-phase current that it must generate and transmit butcannot charge for. Induction motors cause this problem to a degree which, if not adequately compensatedby nearby capacitors, may incur a utility penalty charge in civilian facilities ashore, and certainly incureconomic and operational penalties afloat even if they are not recognized, charged for, and designed out.
116 Lovins et al. 1989. op. cit.

Rocky Mountain Institute Energy Efficiency Survey Aboard USS Princeton CG-59© RMI 2001 www.rmi.org 30 June 2001 unclassified
99
the motor with an electronic soft-start device—often a free feature of the VSD that mostfan drives should use anyway.
But there’s another catch: if you didn’t carefully choose the slip of the motor—a measureof how fast it turns—you may find it’s higher with the efficient new motor than with theold one, threatening to waste more energy through extra fan flow than the motor’s higherefficiency saves. If so, then you’d better notice it in time to make the new belt sprockets adifferent size, or electronically adjust the fanspeed with the VSD, so you capture the fullsavings available from the better motor.
Without going into further detail on all the interactions, the unfavorable ones are far out-weighed by the favorable ones. Their collective effect is to make the savings of the wholedrivepower package far larger and cheaper than would appear from considering just a fewfragmented measures, as most analyses do. The bottom line117: retrofitting approximately35 kinds of improvements, installed in between the electric motor and the input shaft ofthe machine that the motor is driving, can typically save about half of the drivesystem’senergy, even with no improvements further downstream (e.g., in pumps, pipes, flow re-duction, etc.). These savings pay for themselves in an average of about 16 months or lessat a five-cent-per-kilowatt-hour industrial rate. They’re that cheap because if you pay forthe right seven savings up front, you get 28 more savings as free byproducts. Seven ex-penditures, 35 benefits. More tunneling through the cost barrier.
117 Id., Fickett et al. 1990 op. cit., Nadel et al. 1991 op. cit. The first reference provides the most detailedscoping calculation, although it conservatively omits the overspeeding of underloaded induction motors.

Rocky Mountain Institute Energy Efficiency Survey Aboard USS Princeton CG-59© RMI 2001 www.rmi.org 30 June 2001 unclassified
100
APPENDIX F:MULTIPLE BENEFITS IN
FLUORESCENT LIGHTING SYSTEMSThis appendix for more technically inclined readers explains how dimming electronicballasts get about 18 different benefits from a single retrofit expenditure.
Dimming electronic ballasts for commercial fluorescent lighting: 18 benefits andcounting
A cornucopia unfolds in commercial fluorescent lighting.118 What do you do to retrofit,say, a ~65%-efficient enclosed two-by-four-foot recessed ceiling luminaire119—the mostcommon type of major fixture? The fixture classically uses 180 watts of electricity for itsfour 40-watt lamps driven by two 16-watt electromagnetic ballasts. Inserting an imagingspecular reflector—a very shiny, computer-designed, specially shaped piece of sheet-metal—above these lamps nearly doubles the fixture’s optical efficiency. (That’s becauseeach exit ray bounces barely more than once off a very shiny surface, rather than nearlythree times off a not-so-shiny surface like white enameled sheetmetal.) Half the lampscan then be removed, the rest relocated, and approximately the same delivered light ob-tained as before. The removed lamps appear to be still there, but they are only virtual im-ages, and virtual lamps require no electricity or maintenance. The avoided maintenancecosts end up, over time, paying for half the retrofit package. While being relocated, thelamps can also be replaced, at no extra labor cost, with new lamps whose “tristimulus”phosphors—tuned to red, green, and blue retinal cones—emit up to 18% more light perwatt, with more pleasant and accurate color that probably helps you see better. The newlamps are also skinnier, making them up to about 25% more efficient and making it easierto control optically the exact distribution of where the light goes in the room. The twotwo-lamp ballasts can then be replaced with a single four-lamp high-frequency electronicballast shared between two adjacent luminaires.
118 The original analysis is in Lovins, A.B. & Sardinsky, R. 1988: The State of the Art: Lighting, COM-PETITEK / Rocky Mountain Institute, Snowmass CO 81654-9199. Its fourth update, Audin, L., Houghton,D., Shepard, M., & Hawthorne, W. 1998: Lighting Technology Atlas, E SOURCE, Boulder, CO, is consid-erably more up-to-date (www.esource.com). Fluorescent lighting in the late 1980s was using about half ofU.S. lighting energy. The remaining savings are chiefly in incandescent systems and to a much lesser extentin high-intensity discharge lighting. For all lighting retrofits, total cost is typically negative because mostreplacements of incandescent lamps by compact fluorescents or other longer-lived alternatives are morethan paid for by saved maintenance costs (Lovins & Sardinsky 1988). New construction shouldn’t usedownlights—indirect uplights are more visually effective, attractive, flexible, and cost-effective—and ret-rofits should consider converting to indirect lighting, but this may not be feasible in some situations such aswith low ceilings.
119 The “luminaire” is the light fixture together with the equipment that produces the light. Its efficiency ishow much of the produced light comes out.

Rocky Mountain Institute Energy Efficiency Survey Aboard USS Princeton CG-59© RMI 2001 www.rmi.org 30 June 2001 unclassified
101
This retrofit has two important lessons. First, doing all these measures together as a pack-age saves much more energy, at much lower cost, than fragmenting the package or omit-ting parts of it.120 Second, the key to success—the dimming electronic ballast and itscontrol systems—can save electricity in at least 18 ways:
1. The ballast wastes only two watts less per lamp because it’s electronic, comparedwith eight with a standard electromagnetic ballast or 3–4 with a “high-efficiency”electromagnetic ballast.121
2. The lamps also produce more light at high frequency (about 20,000–40,000 cycles persecond) than at the 60-cycle line frequency. These first two effects can boost lightoutput per watt by upwards of 40%.
3. Because the ballast dissipates so much less heat per lamp, circuitry for four (or per-haps even six) lamps, not just two, can be installed in a single ballast can without itsoverheating. This in turn means that a single ballast can control at least two adjacentfixtures, reducing capital and installation costs for both the ballast and its controlsystems.
4. The more efficient lamps and ballasts can make the lampwall temperature—on whichefficiency strongly depends—more nearly optimal.122
5. The electronic ballast, depending on design, can be less sensitive to or can automati-cally compensate for lampwall temperature.
6. It can also provide the same insensitivity to or compensation for abnormally high orlow supply voltage. This plus effect #5 can reduce by one-eighth the overlightingnormally designed in as a precaution to cope with these potential conditions.
7. The electronic ballast can continuously dim the lamps to match available daylight,often saving 50% or more of the lighting energy in the “perimeter zones” around thedaylit sides of the building.
8. The same dimming control automatically brightens the lamps as they dim with ageand dirt, so they need not be too bright when young, fresh, and clean in order to pro-vide enough light when old, tired, and dirty. This saves at least a seventh of the en-ergy over each group relamping cycle.
120 Installing just a reflector duplicates the relamping labor, adds labor for reballasting later, and may savenothing if the reflector is badly designed. Installing a nondimming electronic ballast captures about 3–4kinds of savings but loses about 14 others; it delivers only one-third the savings of a dimming ballast, butdoesn’t save enough capital cost to justify that sacrifice. Not switching to the better lamps means unpleas-ant light, wasted electricity, and a need to change the lamps and ballast later, duplicating labor on both, tocorrect those problems. (Using 34-watt “energy-saving” lamps also introduces additional technical prob-lems, and reduces light output as much as power input.) Leaving out the controls slashes the savings, andusually requires a costly retrofit later to make computer screens readable and the space reconfigurable. Re-markably, most lighting retrofits make one or more of these mistakes, partly because many utility rebateprograms reward specific pieces of hardware rather than integrated packages.
121 This interim technology uses copper instead of aluminum wire, but is still much less efficient than anelectronic ballast. It also runs at line frequency, so it hums and the lamps flicker, and it can’t dim. In essen-tially no applications is it a wise choice.
122 Mainly for this reason, starting with three 34-watt “energy-saver” lamps and two “high-efficiency”electromagnetic ballasts in a modern louvered parabolic fixture will save, within a few percentage points,the same amount of energy as replacing the less efficient initial equipment assumed in this example.

Rocky Mountain Institute Energy Efficiency Survey Aboard USS Princeton CG-59© RMI 2001 www.rmi.org 30 June 2001 unclassified
102
9. The reduced heat from the lamps and ballasts reduces convective air currents that de-posit dust on the lamps and fixtures, so more light output is maintained on the samecleaning schedule, or less frequent cleaning is needed to maintain a given light out-put.
10. Dimming the lamps stretches their lifetime, saving maintenance costs.11. It also reduces the rate at which the lamps’ efficiency deteriorates, saving energy.12. High-frequency operation may further slow that loss of efficiency by about 2–5%.13. The dimming controls permit light levels to be adjusted or “tuned” in different parts
of the room according to the tasks being done there (more light over your desk, lessoff in the corner), and easily changed if the furniture is rearranged. This saves around12–20% of the energy.
14. Being able to control ambient lighting levels to exactly the level you want will oftenmean you actually choose, especially if you’re relatively young, lower light levelsthan official standards assume you’ll want. Conversely, if you want more light thanusual, you can get it without also superfluously providing it to everyone else whodoesn’t want it. Experiments suggest this better matching to individual preferencesmay save upwards of 20%.
15. The electronic ballast facilitates smart automatic control occupancy sensors, whichturn lamps down or off in empty rooms, often saving 25–50%.
16. An electronic ballast also makes it easier to use timers or digital control circuits toturn off lights automatically after hours (unless you choose to turn them back on).
17. The lamps can be slightly dimmed during peak-load periods, reducing utility peakdemand charges for both the lighting energy and the associated space-cooling and fanenergy needed to combat the heat of the lights. This valuable peak-dimming is imper-ceptible because the eye, being able to adjust by a million millionfold between sun-light and starlight, has a logarithmic response that can’t detect small changes ifthey’re gradual enough.
18. The electronic ballast can shut down the lamps, and itself, in certain common kinds offailures, rather than wasting energy trying to restart a failed lamp or keeping ener-gized a ballast that’s providing no light.
Together, these ballast and control mechanisms can typically save about half the energyper unit of delivered light in the center of a large building, and 70% to 80% or more in atypical mix of core and perimeter zones. The better lamp phosphors and reflector opticscut electricity per unit of delivered light by a further ~15% and ~35+% respectively—acumulative total saving of about 83% to 91%, all from a whole-system retrofit.
An important example of effects not included in the above list of 18 engineering-economic benefits, but vital to users, is that since the high-frequency operation of thelamps eliminates both flicker and hum, fatigue is much reduced, typically requiring lesslight per person-hour of work to achieve the same visual performance and labor henceproductivity.
Such savings are not unusual even in awkward cases, because further opportunities areavailable from other aspects of the whole lighting system (not just what’s in the fixture):

Rocky Mountain Institute Energy Efficiency Survey Aboard USS Princeton CG-59© RMI 2001 www.rmi.org 30 June 2001 unclassified
103
• reducing endemic overlighting (most offices are lit not only far above official rec-ommendations, but at levels that actually violate those standards by making it diffi-cult to read computer screens);
• concentrating local light on the visual task with a user-controllable swing-arm tasklamp that lets you spill light evenly across the paper tasks on your desk without alsowashing out the computer screen;
• making the light more visually effective by bouncing light off the ceiling and walls soit doesn’t wash out the contrast between paper and ink, or by equipping overheaddownlights with radial polarizers that reduce veiling glare;
• using lighter-colored surfaces to bounce light around better in the room;• bouncing daylight several times as far into the room (via lightshelves, top-reflective
blinds, glass-topped partitions, etc.); and• improving maintenance, such as replacing lamps all at once before they lose too much
efficiency.
In all, 70% to 90% or greater savings on electricity used for lighting are typically avail-able from comprehensive retrofits, with the same delivered light and great improvementsin quality and attractiveness. The cost of such a retrofit is typically equivalent, at a six-cent-per-kilowatt-hour commercial tariff ashore, to about a one-year payback if you countsaved air-conditioning savings and long-term maintenance savings (from having only halfas many lamps and a quarter as many ballasts to maintain). If you didn’t count thosesavings, the payback could be up to about three years. A three-year payback is equivalentto an aftertax annual return on investment of about 32%. At the CG-59 electricity cost ofabout 27¢/kWh (p. 19), conservatively assuming operating hours no greater than the of-fice norm of ~2,500 h/y, the payback afloat would be more than four times faster.
As with motors, however, achieving both such large lighting savings and such improvedquality of service depends on harnessing complex thermal, optical, and electrical interac-tions between all the components. It requires including all the right parts, and combiningthem into something greater than their sum. It demands doing the right things, in the rightorder, at the right time. This isn’t as complicated as it sounds, but it isn’t simply pluggingin one “magic-bullet” gadget and turning it on. Rather, it requires new ways to deliverintegrated packages of modern hardware plus managerial and cultural changes.123 Thatisn’t easy; but neither is expanding electrical supplies.
123With motors, for example, an important cultural need is to change lubrication from a low-caste, dirty-hands occupation to a high-caste, white-lab-coat occupation.

Rocky Mountain Institute Energy Efficiency Survey Aboard USS Princeton CG-59© RMI 2001 www.rmi.org 30 June 2001 unclassified
104
APPENDIX G:OPTIMAL SEQUENCE FOR
LIGHTING IMPROVEMENTSWhat’s the right order for improving office lighting? Most retrofitters start by improvingthe lighting equipment. But that starts at the wrong end of the problem. Even the mostefficient lighting equipment is useless if it lights the wrong place, or at the wrong time, orat the wrong angle so it causes glare. The Illuminating Engineering Society and seasonedlighting professionals would instead recommend the following sequence for, say, retro-fitting the lighting in an ordinary office where people main read papers and computerscreens:
1. Improve the quality of the visual task.124
2. Rearrange the room to make the lighting comfortable.125
3. Improve the quality of the light by reducing “veiling reflections”—glare that bouncesfrom the light source off the page to your eye so you can’t distinguish ink from paper.This is typically about ten times as important as adding more light. Indirect lighting,which bounces light off the room’s surfaces from all directions, can let you see aswell with 20 indirect footcandles as with 100 footcandles from glaring direct down-lights.
4. Rather than overlighting the whole room to a uniformly high level—which would beas inappropriate as controlling a big building with a single thermostat—get the rightamount of light on each of your tasks by adjusting the ambient lighting levels to whatyou need for walking around and doing non-desk tasks, then filling in on your deskwith an efficient swing-arm task lamp.126
5. Try to lighten the colors of the ceiling, walls, floor, and furniture so that the light willbounce around better within the space. The smaller the areas of dark colors that soakup light, and the more you lighten those colors (without, of course, making them daz-zlingly bright), the less light you’ll need to add to the room in order to get a givenamount bounced onto your desk.
124 If you’re having trouble reading because the papers have been photocopied on a machine with dust onthe lenses and mirrors, clean out the machine first to make the image crisper. If there’s glare off the paper,consider using matte paper.
125 If there’s “discomfort glare” from harsh overhead sources, so shading your eyes with your hand like abaseball-cap brim makes your face muscles relax from squinting, control the glare with louvers or lightingredesign. If bright spots are glaring in your computer screen from lights or windows behind you, shadethem or change the layout of the room so they’re no longer behind you. If you can’t read your computerscreen because it’s in front of a bright window, move the screen or shade the window. If windows are toobright compared to walls, adjust the blinds properly, or use microperforated blinds or diffusing curtains.
126 You need more light when you’re older, or your eyes are more tired, or when you’re doing finer or morecritical tasks. Task lamps make it easy to get just the amount of light you want, where and when you wantit.

Rocky Mountain Institute Energy Efficiency Survey Aboard USS Princeton CG-59© RMI 2001 www.rmi.org 30 June 2001 unclassified
105
6. Harvest and distribute free daylight.127
7. Improve the technical efficiency of your electric lighting equipment, for example asdescribed in Appendix F for standard fluorescent-tube fixtures, by using better lightfixtures, lamps, ballasts, and controls.
8. Train people how to use these systems.128
9. Improve maintenance and management of these systems so they’ll stay at top per-formance and least cost.
Interestingly, most “lighting retrofitters” do only step 7. Doing steps 1–6 first saves moremoney and yields better results, because smaller, simpler and less equipment will beneeded to deliver nicer light.
127 Modern techniques such as double-curved lightshelves can do this quite evenly and without glare, evenas much as 50+ feet in from the nearest window. Lightshafts and atria can bounce soft daylight many sto-ries downward. Special methods, such as lightpipes and fiber optics, can even collect concentrated sunlighton the roof or outside the building, then deliver it as intense daylight far underground. In general, directsunlight is too strong, producing glare that makes it harder to see, so instead of being “dumped” into thespace, direct sunrays should generally be bounced back up onto the ceiling. Glass-topped partitions for pri-vate offices can preserve privacy, yet spread daylight better into adjacent rooms.
128 For example, how to operate Venetian blinds: they’re supposed to be not closed like opaque curtains,but tilted so they throw daylight upward onto the ceiling. Then you can still see out, but the outside isn’tunpleasantly bright.

Rocky Mountain Institute Energy Efficiency Survey Aboard USS Princeton CG-59© RMI 2001 www.rmi.org 30 June 2001 unclassified
106
APPENDIX H:OPTIMAL SEQUENCE FOR
COOLING IMPROVEMENTSConsider the proper sequence in which to help people feel comfortable in hot weather:129
1. Expand the range of conditions in which, according to the official ASHRAE standards,people feel comfortable. There are at least ten ways to do this besides air tempera-ture.130
2. Keep unwanted heat out of the room.131
3. If you still need to cool the people, first do so passively by “ground coupling”(building on an uninsulated slab that connects the space to the cool earth beneath),ventilative cooling like the Queens Building in Leicester described inwww.naturalcapitalism.org/images/other/NCchapter5.pdf, or radiative cooling. Just ashallow roof pond, which stores up heat during the day and radiates it away to thenight sky, and a ceiling fan can maintain ASHRAE comfort standards in August in Mi-ami.
4. If still more cooling is needed, use alternative methods: absorption, which turns heatinto coolth; desiccant, which turns heat into dryness; or evaporative, which cools dryair by evaporating water, and can deliver either moist or dry cool air into the space.132
129 Cler, G., Shepard, H., Gregerson, J., Houghton, D.J., Fryer, L., Elleson, J., Pattinson, B., Hawthorne,W., Webster, L., Stein, J., Davis, D. & Parsons, S. 1997: Commercial Space Cooling and Air HandlingTechnology Atlas, E SOURCE, Boulder CO, www.esource.com.
130 Herman Miller’s “Aeron” chair lets you sit not on insulating upholstery but on a ventilative net or mesh,keeping your backside 4–7 F˚ cooler. (In a nice example of design synergy, that “pellicle” also costs lessthan upholstery, so Herman Miller could afford to include extremely thorough and effective ergonomicadjustments to the chair without making it cost more.) Ceiling fans or other turbulent vertical air move-ment—not so strong that it would blow papers off your desk—can make you feel about 9 F˚ cooler. “Su-perwindows” or other ways to block radiant heat from windows can greatly increase comfort. Efficient of-fice equipment similarly radiates less heat at you than inefficient equipment. Appropriate dress codes cangreatly increase comfort, and can also reduce the hard-to-accommodate differences in comfort requirementsbetween men in suits and women in skirts and blouses. Just these kinds of measures can together save20–30% or more of the cooling energy, and can eliminate the need for air-conditioning in many cli-mates—even quite humid ones.
131 This means designing the building with the right shape, orientation, shading, surface properties, mass,insulation, landscaping, and ventilation design, and then not releasing unwanted heat indoors through inef-ficient lights and equipment. Many of these improvements can be retrofitted: for example, dark roofs canbe changed to lighter colors specifically designed to bounce solar heat away without looking uncomfortablybright to your eye. Shading devices or vegetation can be added where they were originally lacking. Carefulcontrol of external and internal heat gains typically lets a refrigerative ton (3.518 thermal kilowatts) ofcooling suffice not just for 250–400 square feet of officespace (a typical number in the U.S.), but for about800–1,000 square feet in a retrofitted building and 1,200 (more in milder climates) in state-of-the-art newoffices. As we’ll see, that severalfold reduction in required cooling power can save a lot of capital cost.
132 An experimental office retrofit for Pacific Gas and Electric Company designed a mainly indirect-evaporative cooling system with a whole-system design power of 0.14 kilowatts per ton—25 units of cool-ing per unit of electricity.

Rocky Mountain Institute Energy Efficiency Survey Aboard USS Princeton CG-59© RMI 2001 www.rmi.org 30 June 2001 unclassified
107
Combining these methods into hybrids, like an absorption chiller whose waste heatregenerates a desiccant to pre-dry the air, or a desiccant to make hot dry air plus di-rect/indirect evaporative cooling to convert it to cool dry air—can be especially ef-fective. Various combinations of these nonrefrigerative techniques can meet coolingdemand anywhere in the world, and can often be operated not by electricity but bywaste heat available for free from some other device.
5. To conserve coolth once you’ve got it, use outgoing air to cool the incoming airthrough an air-to-air heat exchanger, or to dry the incoming air through a desiccantwheel or passive latent heat exchanger133, or both.134
6. If you really want refrigerative cooling—though the previous methods can make thisunnecessary, avoiding potential climatic harm by the refrigerant135—then make it ex-tremely efficient. Techniques first proven in East Asia can make big central air-conditioning systems about three times more efficient than the norm, yet less costly tobuild and more effective and reliable.
7. The fancier systems (#4 or #6) may require controls, which can almost always be im-proved to save about 20–30% of the remaining energy. Control savings can even riseto 50% with careful training of building operators on simulators analogous to thoseused in flight training: big buildings are far too complicated for operators to under-stand intuitively without such help.
8. Peak electric loads and some energy can finally be saved by storing coolth in bigtanks in the form of chilled water, ice, etc.
Many practitioners not versed in whole-system thinking pursue these steps in exactly thereverse order—worst buys first. In fact, many air-conditioning retrofitters pursue items 8,7, and a small part of 6 without ever getting to the cheaper ones before that. Doing thisgives up all the potential to reduce the need for costly cooling capacity in the first place.Such reversed priorities maximize expenditure, minimize savings, and destroy synergiesbetween measures. But done in the right order, the savings can be phenomenal. Referringto examples described in this and the Buildings chapters of Natural Capitalism(www.natcap.org), imagine combining these steps:
133 This ingenious device, invented by Eng Lock Lee and concurrently by several U.S. heat-pipe companiesfor hot, humid climates, works like this. Precool the air coming into the building (you’ll learn how in amoment). This will condense water out of the moist incoming air. Collect that condensate. Run it out of thebuilding by gravity in a small pipe. Evaporate the water into the outgoing air, which, having already beendehumidified, is drier than the ambient air outside. This evaporatively cools the outgoing air nearly to thewetbulb ambient temperature. Capture that coolth with a heat exchanger and bring it back inside passivelywith a heat pipe. That is the source of cooling that you use to precool the incoming air.
134 This can be done either passively or with a very small and efficient fan, and can readily be added tomost conventional ventilation systems.
135 Hydrocarbons, ammonia, or other relatively benign materials can be used with appropriate care, buthalogenated refrigerants are a problem. Even once manufacturers complete the transition from outlawedozone-destroying CFCs to interim HCFCs to chlorine-free HFCs, those HFCs will still be greenhouse gasesthousands to tens of thousands of times more potent than CO2—partly because once released, they can stayaloft for millennia.

Rocky Mountain Institute Energy Efficiency Survey Aboard USS Princeton CG-59© RMI 2001 www.rmi.org 30 June 2001 unclassified
108
• Expand the “comfort envelope” to save 20% of the cooling energy;• Reduce the cooling requirement by 70% by improving the building and its lights, ap-
pliances, etc.—less than was saved in two Vancouver office buildings;• Reduce energy per unit of cooling supplied by passive or alternative methods .• If remaining refrigerative cooling is needed, save 50% of its energy (60–70% is avail-
able); and• Save 20% from controls, normally near the low end of the range, and nothing from
storage.
These savings multiply over each stage in the sequence to 98%. As usual with chains ofsuccessive savings, you needn’t save much at each step in order to get the total savings tomultiply to a very large level, simply because there are so many steps.
Rocky Mountain Institute Energy Efficiency Survey Aboard USS Princeton CG-59© RMI 2001 www.rmi.org 30 June 2001 unclassified
109
APPENDIX I:SENSORS, METRICS, MONITORING,
AND CONTROL SYSTEMSSensors and metrics for continuous improvement of energy efficiency
A key concept of resource efficiency in the field of industrial ecology is dematerializationof goods and services, often achieved by improved design that substitutes information formass. In facilities management, information can be used to displace kilowatts and otherforms of energy use. The most valuable forms of information in this effort are perform-ance metrics, especially those that drive continuous improvement. This puts the focus onthe type of question that is asked, for only that which is measured can be effectivelymanaged.
Currently many manufacturers’ internal energy efficiency analysis concentrates on theamount of energy used per unit of product. But such kWh/widget metrics are prone todistortion. Dividing metrics by product output is suboptimal or misleading due to vari-ables including the effects of yield; product complexities; the stage of the product life cy-cle; myriad tools and processes; and other factors that affect energy usage more than dothe efficiencies of utilities usage. Many factors can dramatically decrease a factory’syield, increasing its apparent energy intensity when in fact its technical efficiency has notchanged. Consider these everyday analogies:
• If taxis charged only per km traveled, drivers’ income would drastically decreaseevery time they got stuck in traffic—so they also charge for time.
• A hotel can have wonderfully efficient comfort and lighting systems, yet see its en-ergy-per-guest index can soar with any sudden drop in guest arrivals (e.g., Bangkokand Jakarta in their 1998 economic slumps).
• An award-winning hard-disk factory achieved 13.5 kWh/disk drive on existing mod-els. On switching to Giant Magnetoresistive (GMR) technology, this metric shot upto an unimpressive 51 kWh/drive, almost four times worse, not because plant effi-ciency changed in any way, but only because ramp-up took longer than expected,many vendors’ new products needed debugging, and other operational factors drasti-cally decreased yield, so the plant produced far fewer drives than previously.
The remedy is to isolate energy-using subsystems, and apply physical efficiency metricsto each individually, so that every metric can be driven toward improvement. This is justlike financial cost controls, where numerous line items are each controlled for variance tobudget. In engineering as in finance, the key to success is detailed and exact record-keeping so all transactions can be tracked and people held accountable. No factory couldrun for long without detailed financial data, but many factories’ utility plants, and proba-bly all the Navy’s ships, routinely run without basic metrics like kW/ton. Applying finan-cial-like standards of accounting to facilities engineering data will yield rich returns.

Rocky Mountain Institute Energy Efficiency Survey Aboard USS Princeton CG-59© RMI 2001 www.rmi.org 30 June 2001 unclassified
110
Monitoring system performance (energy efficiency) is important because it allows com-parison of the system to the best known technology in use at the time. The RMI Teamtypically checks the energy “performance” of a facility by comparing the system kWh asbilled by the utility. However, it is crucial to realize what determines the system kWh:
kWh = hours load efficiency
Since the hours and load cannot be significantly affected because they are determined byproduction requirements, the only factor that can be affected by technical improvementsis the system efficiency, and it is this factor that should be used to compare systems to theState of the Art.
The objective of heating and cooling system monitoring is to determine, via calculation,the useful thermal energy output of the system. In the U.S., the efficiency of the chilledwater plant is usually expressed as kW/ton, which indicates kW of electrical energy con-sumed per 3.518 kW of useful thermal energy produced, allowing easy additive break-down of the system efficiency into its components. This is inversely proportional to thecoefficient of performance (COP), which is used both more commonly in Europe. Toconvert between kW/t and COP, divide 3.518 by either to get the other.
Sensor type and accuracy
Performance metrics should reflect utilities design, choice of equipment, climate respon-sive design, operations and maintenance, and the like. Accurate comparison between theactual operational efficiency of a system and the State of the Art requires accurate sen-sors. These include:
• power transducers to measure kW consumed by individual system components;• high-accuracy temperature sensors on chilled and CW loops;• dewpoint sensors to measure compressed-air dewpoint;• airflow meters to measure cfm per kW of compressed air;• airflow meters to measure cfm per kW of air handlers and recirculation fans;• vortex flowmeters to measure cfm per kW for low and high vacuum;• airflow meters to measure cfm per kW for exhaust systems;• time-of-flight ultrasonic flowmeters to measure gpm/kW for Ultrapure Process Water
plants; and• drybulb and wetbulb psychrometers at cooling tower and MUAH inlet locations.
We believe that partly because a 10% flow error is about a 30% energy error, the cost ofenergy implies that the required minimum efficiency measurement accuracy should notbe worse than ±5% of the actual conditions. In order to attain this goal, we look for sen-sors that provide ±1% accuracy (at worst) for each of the three measurements: ±1% ofactual power is achievable with modern sensors, ±1% of water flow requires full-boremagnetic flow meters, and ±1% of temperature difference requires that each of the sen-sors have an accuracy of about ±0.05°F—achievable only with high-accuracy, super-stable thermistors. Such good sensors cost more, but save far more still.

Rocky Mountain Institute Energy Efficiency Survey Aboard USS Princeton CG-59© RMI 2001 www.rmi.org 30 June 2001 unclassified
111
Consider the example of chiller instrumentation. A 1,000-ton shoreside chiller uses~$300,000/y worth of energy, and thus “eats itself” in financial terms in 1 year. Yetchiller performance generally isn’t measured. When it is, measurement always showssub-optimum performance. The sensors cost around $30,000, or roughly 10% of capitalcost of the chiller; that seems high, but it’s worth it. Businesspeople have a fiduciary re-sponsibility to manage expenditures. A bank note sorting machine has zero error toler-ance; why should chiller be held to a different standard? At high shipboard electricitycosts, each of CG-59’s 200-ton chillers, if it runs full-time at (say) half-load, eats nearly$300,000 worth of electricity per year—equivalent to the capital cost of an equivalentcivilian chiller about every five months.136
Facilities Management Control Systems
Many industrial FMCS installations have characteristics that make benchmarking diffi-cult: many of the metrics discussed above are not represented; sensors are not correct orhave failed; and it is hard to trend historical data on system performance automatically.The Navy would benefit from an efficiency page or similar display that could collect andtrend each ship’s systems performance metrics, indicators, and operational targets.
Thorough efficiency measurements should be made possible with an FMCS in order tobenchmark one vessel against others, and because efficiency monitoring can lead to largeenergy savings as engineers recognize poor performance and pinpoint its causes. For ex-ample, at one client factory, the RMI Team’s measurements revealed chiller condensertube fouling whose correction represented potential annual savings exceeding $350,000.It would be surprising if ships were free of such currently invisible opportunities.
Disseminating Information
Information can be conveniently harnessed to displace horsepower with thorough anddetailed analysis, presentation and dissemination. Performance metrics and other waste-reducing information such as payback criteria, AutoCAD drawings, schematics, and en-ergy-efficient equipment specifications can be conveniently shared Navy-wide withgraphical software, videos, Websites, time-series charts, and the like, from actual vesselsand their specific systems, both in real-time and with archived historical data. Onboardand ashore, energy efficiency champions and managers can be networked virtually or inperson to compare methods and collaborate, sharing and competing in best practices.
Key Value Metrics
What is the dollar value to the Navy of a unit of pressure, a watt of heat, or a one-percentage-point increase in system efficiency? Some firms have relabeled meters andgauges with such financial metrics. A few are used in this report. Dollar-equivalent unitscan also be incorporated into FMCS and similar systems software displays. Calculatingand disseminating this type of information can help engineering crew and officers to un-derstand (and therefore improve) the effect of their decisions on the Navy’s bottom line. 136 200 t × 1.2 kW/t (p. 58) × 8,766 h/y × 0.5 assumed LF (without part-load penalty) × $0.27/kWh (p. 19) /0.96 assume electric distribution efficiency = $296,000/y. A 200-t civilian chiller costs of order $120,000.

Rocky Mountain Institute Energy Efficiency Survey Aboard USS Princeton CG-59© RMI 2001 www.rmi.org 30 June 2001 unclassified
112
APPENDIX J:POWER FACTOR AND PHASE UNBALANCE
The following is from the E SOURCE Drivepower Atlas, Chapter 13, “Power Quality.”
Power quality is a gauge of how well electric power performs its intended task—rotatinga motor, providing heat, energizing an integrated circuit—without causing undesirableside-effects. Measures of power quality can take many forms, including phase powerfactor, voltage unbalance, harmonics, transients, and outages.
Power factor
In utility circles, power factor is a familiar and long-lived concern. Power factor is an in-dicator of how much of a power system’s capacity is available for productive work—making it an important and constant concern for utilities and large power users alike.Power factor and drivepower are inseparably linked: induction motors require reactivepower to operate (to create magnetic fields in their windings) and this reactive power di-rectly manifests itself in reduced power factor.
Industry is concerned about power factor primarily because of the penalties assessed onthem (by utilities) if power factor in their facilities drops too low (usually less than 0.85or 0.90). However, poor power factor in industrial plants can reduce in-plant power sys-tem capacity as easily as it does on a utility’s grid. [The same is true aboard any ship.]
Power factor concerns are on different scales for utilities and power users: utilities mustcorrect system power factor to efficiently generate and distribute quality power; powerusers should correct poor power factor to improve capacity and performance of theirpower systems, as well as to avoid utility power factor penalties.
Phase power factor correction
Lagging power factor can be increased by five methods:
• better-designed, energy efficient motors with high power factor;• proper sizing of the motor, especially important for induction motors;• capacitors: their leading power factor counterbalances the inductive load’s lagging
one;• electronic controls;• the use of synchronous motors, which can be designed to provide a leading power
factor, adjustable as needed by varying the DC excitation current.
Power-factor correction can increase the capacity of power systems for expansion, aswell as reduce utility penalties for poor power factor. Power factor is best corrected asclose to the load as possible (load compensation) to gain the maximum benefit in in-creased wiring and transformer capacity. However, facility-wide power factor correction

Rocky Mountain Institute Energy Efficiency Survey Aboard USS Princeton CG-59© RMI 2001 www.rmi.org 30 June 2001 unclassified
113
(bank compensation) may often be most cost-effective from a capital-cost perspective.Phase voltage unbalance is widespread and potentially very harmful to motor efficiencyand longevity. Studies show that some 25% of facilities have over 1% voltage unbal-ance—a level that can cause significant harm to motor systems.
Power factor correction capacitors can interact with harmonics to create harmonic reso-nance—a dramatic and often damaging increase in the flow of harmonic currents within aplant. Any addition of such capacitors, as well as the addition of adjustable-speed drivesor new transformers, should be preceded by a harmonics survey to assess the potential forresonance.
When motors are oversized and operate for extended periods at significantly less than fullload, there are three significant operational penalties—reduced efficiency, reduced slip(important if the load is a cube-law type), and reduced power factor.
Reduced power factor is a common problem with underloaded motors. The average stan-dard efficiency 100-hp motor loses about 10 percentage points in power factor from full-load to 50% load and almost 20 more points from 50–25% load. Poor motor power factoraffects the user’s bottom line in diverse ways because poorly loaded induction motorsrequire a disproportionate percentage of reactive current, creating the “positive VARs”that cause poor power factor. Another benefit of correctly sized motors is that they im-prove system power factor and reduce the need for and cost of correcting poor powerfactor within the facility.
The Three Benefits of Power Factor Correction
Why should end users care about this arcane matter of power factor correction? There arethree main reasons, listed in decreasing order of importance: to avoid power factor penal-ties, to free up transformer capacity, and to realize energy savings in transformers andwiring.
Avoided Utility Power Factor Penalties
Much of the cost of poor power factor falls on utilities. Consequently, many utilities as-sess penalties for poor power factor (typically below thresholds that range from0.85–0.99) to prod their customers into taking corrective action. The penalties can be afixed amount, but frequently are an added cost per kVA. In some cases, they can be quitesubstantial, often exceeding $100,000 annually in industrial facilities. For example, abeef packing plant in southwestern Kansas with a 12-MW load paid $43,200 per year inpower factor penalties. [Naval vessels have no penalties—just wasted fuel and money.]
In many cases, the savings the end user can realize by avoiding utility power factor pen-alties are several times larger than the other benefits listed below. For a customer who iscurrently paying power factor penalties, the investment in power factor correction equip-ment will often pay for itself within several months just by eliminating the penalties.

Rocky Mountain Institute Energy Efficiency Survey Aboard USS Princeton CG-59© RMI 2001 www.rmi.org 30 June 2001 unclassified
114
Extra Transformer Capacity
Electric transformers are limited by the total amount of electric current they can provideat a particular voltage. Since improved power factor reduces the electrical current drawnby the facility, it frees some additional transformer capacity, thereby allowing for opera-tion of additional equipment or future expansion, and possibly avoiding the cost of a new,larger replacement transformer down the road. If a facility is limited by transformer ca-pacity, installing power factor correction equipment may be a very economically attrac-tive alternative to a new transformer. If a facility has excess transformer capacity thisbenefit may be of negligible value.
Reduced Energy Losses
Resistive losses in power circuits are a function of the resistance of the system compo-nent (such as a copper wire) times the square of the current—so called I2R losses. Sinceimproved power factor results in reduced overall current levels, resistive losses in thetransformer and copper wires feeding the facility’s loads are also reduced. The potentialsavings in the transformer are far greater than those in the wires feeding the loads.
Some vendors claim that their products can offer energy savings of 10–25% due to powerfactor correction. In E SOURCE’s view, such claims should be viewed with caution, as theenergy savings from power factor correction in typical commercial and industrial facili-ties is less than 5% and typically at or below 1%.
Power Factor Correction Technologies
Poor power factor is usually corrected by installing some form of capacitance on thepower system at the customer’s service entrance, on a specific offending load, or at astrategic point on the grid that allows the utility to correct the power factor for a particu-lar geographical area. Placed together in a circuit, capacitance and inductance work tocounteract each other. But there is a hitch. Inductance varies greatly with the type, mix,and variation of loads. This makes it fans, mine machines, and pit equipment difficult todetermine how much capacitance to install. Historically, capacitors of fixed capacitywere installed and would be switched on manually when they were needed. In the pastten years, static, dynamic, and rotary power factor correction systems that provide vary-ing levels of capacitance as conditions warrant have become available. Capacitors andother power factor correction technologies are available in nearly all voltage ratingsfound in facilities and on distribution systems (zero to 69 kV). Larger capacitors are alsoavailable for transmission systems. For many applications, particularly residential andcommercial utility service, the fixed-bank capacitor will continue to be the most popularcorrection technology, due to its low cost and the abundance of inventory. For large in-dustrial and grid-related utility applications, the static VAR system is likely to continuegaining in prominence due to its ability to produce large amounts of VARs at higher volt-ages and its low maintenance.

Rocky Mountain Institute Energy Efficiency Survey Aboard USS Princeton CG-59© RMI 2001 www.rmi.org 30 June 2001 unclassified
115
Voltage unbalance—and the excess heating it causes—pose a serious threat to the lon-gevity of induction motors, seriously stressing their insulation and reducing useful life.Although most of the heating from voltage unbalance occurs in the rotor, it is also sig-nificant in the stator. In the phase with the highest current, the temperature rise of thestator coils will increase in percentage by roughly twice the square of the percentagevoltage unbalance. Therefore a 3.5% unbalance, in the phase with the highest current,will increase the coil temperature by approximately 2 × (1 – 1.0352 ), or 14.3%. In themost common insulation system (Class F), in a normal fully loaded NEMA motor, thewinding temperature during normal operation may already be, for example, as high as40°C ambient plus a 115 C° rise, or 155°C. A 3.5% phase unbalance can further increasethis by over 30 C°—enough, using the “halving per 10 C° rise” rule of thumb, to decreaseexpected insulation life by about 88%. A 5.4% unbalance, on the same terms, can cause a40 C° extra rise, enough to slash insulation life by about 94%. Roughly consistent withthis, an earlier assessment of fully loaded 1.15-service-factor Class F motors operatingcontinuously at 40°C ambient temperature found that a 1% unbalance decreases expectedinsulation life by about an eighth; 3%, by nearly one-third; 3%, by over 90%. For fullyloaded 1.0-service-factor motors, “a very serious loss of insulation life [by a third tonearly a half in fully loaded motors] can be expected even with voltage unbalance as lowas two percent.” The torque produced by an induction motor also declines as a worse-than-linear function of unbalance. Operation with unbalance greater than 5% is not rec-ommended at all because of the steeply rising risk of failed windings. Derating, however,is a last resort and an admission of failure; if at all possible, the unbalance should be per-manently corrected.
Reverse, or negative sequence, torques caused by voltage unbalance can have serious im-pact on both usable torque and motor heating. The negative sequence voltage induced inthe rotor is at nearly twice the supply frequency, or about 200 times the frequency in-duced during normal balanced operation, so rotor heating is further enhanced by skin ef-fect (more of the current flows near the surface of the conductors). For example, a 6.4%voltage unbalance in a typical induction motor can increase rotor losses by 50%, and an8.85% unbalance by 85%: skin-effect heating increases the rotor resistance to about 3–8times its value with normal positive-sequence current. The corresponding current unbal-ance, too, is normally 6–10 times as large as the unbalance in the applied voltage. Andthe entire motor power required to produce the negative torque is a loss that producesonly heat.

Rocky Mountain Institute Energy Efficiency Survey Aboard USS Princeton CG-59© RMI 2001 www.rmi.org 30 June 2001 unclassified
116
APPENDIX K:NAVSEA ENCON ENERGY SURVEY CHECKLIST
This checklist is posted at http://www.navsea.navy.mil/encon/checklist.htm.
ENERGY SURVEY CHECKLIST FOR IMPROVED FUEL ECONOMY
The purpose of this checklist is to provide a periodic qualitative self-assessment of shipprogress in following good energy conserving practices.
The energy survey check list given below is generally applicable to all types of non-nuclear ships. It can be utilized by ship's command to identify the areas where a shipneeds better energy conservation practices which will result in improved fuel economy.An area needing improvement is identified with a negative response.
1. Is energy conservation considered: a. When planning ship operations? b. When re-viewing fuel and water consumption?
2. Is an energy efficient plant alignment consciously selected for each day's operations inaccordance with the POG?
3. Are fuel consumption and economical speed curves maintained to reflect current per-formance?
4. Are reasonably current fuel consumption and economical speed curves posted on thebridge, engine room and fire room?
5. Are machinery alignment tables and fuel consumption tables available for developmentof fuel curve data?
6. Are fuel consumption and economical speed curves used for planning ship's daily op-erations?
7. Are a minimum number of evaporators operated when water supplies are adequate formission to meet anticipated periods of peak demand?
8. Are the minimum number of ship service generators operated when the total electricalload is below 90 percent rated capacity of the generators in operation?
9. Are the minimum number of fire pumps used whenever possible? Are MD vice TD firepumps operated when needed?
10. Is a machinery alignment status board conscientiously maintained?
11. Is permission obtained from EOOW for all equipment status changes?

Rocky Mountain Institute Energy Efficiency Survey Aboard USS Princeton CG-59© RMI 2001 www.rmi.org 30 June 2001 unclassified
117
12. Is EOSS validated, properly maintained, and routinely used?
13. Does ship attempt to operate at or near economical speed as much as possible duringindependent operations or long transits?
14. Does ship attempt to minimize speed change: whenever possible while maintainingstation (frequency and magnitude)?
15. Does ship use acceleration/deceleration tables?
16. Are all gauges critical to plant performance properly calibrated?
17. Does ship have personnel trained and certified in gauge calibration?
18. Does ship have an on-condition hull and propeller maintenance program (e.g., wheninspection determines need based on significant fouling)?
19. Does engineering department have a valve maintenance program?
20. Is there a program to minimize fresh water usage such as daily announcements forwater conservation?
21. Are low flow shower heads installed and in good operating condition?
22. Are faucets in heads spring loaded or metering and in good operating condition?
23. Does ship minimize fresh water leaks throughout ship (e.g;, laundry, showers, galley,etc.)?
24. Is there a program to promote electric load reduction?
25. Does ship secure electrical/electronic equipment when not required to meet ship op-erational requirements?
26. Are minimum number of A/C units operated when conditions permit?
27. Are A/C boundary doors in good condition and identified with posted signs?
28. Are light fixtures clean and well maintained?
29. Are lights turned off in unmanned spaces?
30. Is the insulation of piping in machinery spaces and throughout ship maintained ingood condition?

Rocky Mountain Institute Energy Efficiency Survey Aboard USS Princeton CG-59© RMI 2001 www.rmi.org 30 June 2001 unclassified
118
31. Is crew responsive to maintenance requirements and the need to promptly correct de-ficiencies?
32. Are interdepartmental zone inspections conducted to uncover deficiencies such asleaks, missing insulation, etc., for tagging and corrective action?
33. Does ship adjust liquid load for slight trim by bow prior to getting underway and doesengineering department assure maintenance of trim by the bow?
34. Does ship keep speed at a minimum while independent steaming overnight (6 knotsor less)?
35. Is fuel and water usage: a. Documented for trend analysis? b. Published in Plan of theDay?
36. Does ship utilize shore services to: a. Minimize in port steaming? b. Minimize use ofits distilling plant?
37. Are ship's personnel aware of the importance of energy conservation?
38. Does ship have an Energy Officer recognized as such with his responsibilities desig-nated in writing?

Rocky Mountain Institute Energy Efficiency Survey Aboard USS Princeton CG-59© RMI 2001 www.rmi.org 30 June 2001 unclassified
119
APPENDIX L:TEAM BIOGRAPHIES AND
RMI QUALIFICATIONSChris Lotspeich (Team Leader)Independent consultant; Senior Associate, Rocky Mountain Institute, 1994–2001PO Box 6203, Snowmass, Village Colorado 81615-6203Tel: +1.970.948.3280 / Fax: + 1.970.927.4510Internet: [email protected], [email protected]
CHRIS LOTSPEICH, Senior Associate at Rocky Mountain Institute 1994–2001 and now anindependent consultant, focused on the business community for RMI’s Natural Capital-ism Practice, and also worked on security, energy, and forestry issues. He earned twomaster’s degrees from Yale—in public and private management from the School of Man-agement, and in environmental studies from the School of Forestry and EnvironmentalStudies. He earlier earned a BA in International Politics from Wesleyan University inMiddletown, CT, and participated in the politics exchange program with Warwick Uni-versity near Coventry, England in 1985–86. He was a teaching assistant for undergradu-ate courses on military and intelligence topics at both Wesleyan and Yale. He served as awilderness emergency medical technician, firefighter, and hazardous materials technicianon volunteer rescue services. He has been recycling coordinator for three Maine commu-nities, a hazardous materials emergency response planner, and a mental health worker.He speaks French and is widely traveled.
Amory B. Lovins (Project Director)CEO (Research)1739 Snowmass Creek Road, Snowmass, Colorado 81654-9199Tel: +1.970.927.3128 / Fax: + 1.970.927.4178Internet: [email protected] / www.rmi.org / www.natcap.org
AMORY LOVINS cofounded and directs research and finance at Rocky Mountain Institute.He also founded and chairs RMI’s fourth for-profit spinoff, Hypercar, Inc.(www.hypercar.com), and cofounded its third, E SOURCE (www.esource.com), which wassold to the Financial Times group in 1999. At E SOURCE and its in-house predecessor, heled perhaps the world’s deepest examination of advanced techniques for efficient use ofelectricity through integrative design—later expanded into a method for making big re-source savings cost less than small or no savings (“tunneling through the cost barrier”).
A consultant physicist educated at Harvard and Oxford, he has received an Oxford MA(by virtue of being a don), seven honorary doctorates, a MacArthur Fellowship, theHeinz, Lindbergh, World Technology, and Hero for the Planet Awards, the HappoldMedal, and the Nissan, Mitchell, “Alternative Nobel,” Shingo, and Onassis Prizes; heldvisiting academic chairs; briefed 14 heads of state; published 27 books and several hun-dred papers; and consulted for scores of major industries and governments worldwide.

Rocky Mountain Institute Energy Efficiency Survey Aboard USS Princeton CG-59© RMI 2001 www.rmi.org 30 June 2001 unclassified
120
The Wall Street Journal’s Centennial Issue named him among 39 people in the worldmost likely to change the course of business in the 1990s; Newsweek, “one of the Westernworld’s most influential energy thinkers”; and Car magazine, the 22nd most powerful per-son in the global automotive industry, due to his invention of the HypercarSM
(www.rmi.org/sitepages/pid18.asp). His work focuses on transforming the car, real-estate, electricity, water, semiconductor, and several other sectors of the economy towardadvanced resource productivity. His latest book is Natural Capitalism: Creating the NextIndustrial Revolution (with Paul Hawken and L. Hunter Lovins, 1999, www.natcap.org).His next book will be Small Is Profitable: The Hidden Economic Benefits of MakingElectrical Resources the Right Size (2001).
His national-security work includes devising the first logically consistent approach to nu-clear nonproliferation (technical papers and two books); performing for DOD the defini-tive unclassified study of domestic energy vulnerability and resilience (Brittle Power);co-developing a “new security triad” comprising conflict prevention, conflict resolution,and nonprovocative defense; lecturing at NDU and NWC on least-cost security and onhow new technologies will transform missions and force structures; leading for ADMLopez the overhaul of NAVFAC’s design process; supporting similar facilities efforts byUSMC; several projects in collaboration with Third Fleet; and 1999–2001 service on aDefense Science Board panel on major fuel savings and their warfighting benefits in allland, sea, and air platforms.
Edwin B. “Ned” Orrett, PE Owner and PrincipalPacific Technology Associates210 Fourth ST, Suite B, Petaluma, CA 94952-4201Tel 707.769.5335 / fax [email protected]
EDWIN “NED” ORRETT is Owner and Principal of Pacific Technology Associates, an en-gineering consulting firm based in Petaluma, CA Since 1989 Pacific Technology Associ-ates has developed strategic applications of proven technologies that pay for themselvesby using less water, energy, and material resources than conventional practice. Areas ofemphasis include industrial water and wastewater, municipal water conservation plan-ning, and environmental policy analysis. A Professional Civil Engineer (California Reg-istration C26331), Ned earned a B.S. in Civil Engineering from the University of Califor-nia at Berkeley in 1971, and an M.S. in Ecology from the University of California atDavis in 1982. He is a member of the honorary engineering fraternities Chi Epsilon andTau Beta Pi. From 1985–1988 he was Chief Executive Officer of Bio Energy, Inc., whichdeveloped a commercial process for recovering nutrients and energy from dairy manureusing anaerobic digestion. From 1983–1985 he was Vice President for R&D (and earlier,Manager of Pennsylvania Operations) for National Conservation Corp. / REEP, Inc.,where he evaluated energy conservation programs and directed a $1 million residentialenergy conservation project. From 1975–1978 Ned was a Civil Engineer at Stetson Engi-neers, Inc. of San Francisco, CA, focusing on a broad range of water-related issues. Hehas also been a planning consultant and recycling center. Mr. Orrett served as a Civil En-

Rocky Mountain Institute Energy Efficiency Survey Aboard USS Princeton CG-59© RMI 2001 www.rmi.org 30 June 2001 unclassified
121
gineer Corps Officer in the U.S. Navy from 1971–1975, and was honorably dischargedwith the final rank of Lieutenant. During his service he was consistently rated in the topone percent of his peers, and was recommended for early promotion. Assigned to a Con-struction Battalion (Seabees), he was responsible for all construction materials for a 1,000man construction force at Diego Garcia in the Indian Ocean, and was Officer-in-Chargeof all Battalion construction projects in Japan for nine month deployment comprisingthree sites and 75 men.
Ron PerkinsChief Executive OfficerSupersymmetry USA, Inc.P.O. Box 10, Plantersville, TX 77363-0010, USATel/Fax: +1.800.755.2819 / Tel: +1.936.894.2819 / Fax: +1.936.894.3124Internet: [email protected] 22154 West Magnolia ForestNavasota, TX 77868
RON PERKINS has been involved in the design, construction and operation of commercialand light industrial facilities for the past 20 years. He has a BS in Industrial Arts fromSam Houston State University with a minor in Mathematics. He has worked for ToddShipyards Corporation, Offshore Power Systems, Texas Instruments, Inc. and CompaqComputer Corporation. For eight years, ending in July 1990, Ron Perkins held the posi-tion of Facilities Resource Development Manager at Compaq Computer Corporation. Hemanaged a 50-member design team of architects, engineers, contractors and scientiststhat designed over 2,000,000 square feet of state-of-the-art commercial office and factoryspace housing Compaq Computer Corporation’s World Headquarters in Houston, Texas.Perkins formed a team that researched and applied energy efficient technology. As theresult of the team’s efforts, Compaq’s new buildings cost less to build and were 30%more efficient. In 1991, Ron Perkins joined Eng Lock Lee and founded SupersymmetryUSA, Inc. where he provides energy-efficient design consultation for owners, operatorsand designers of office buildings, manufacturing plants, semiconductor manufacturers,and utility companies. During the past year, Ron’s work has also emphasized sustainabledesign in retail, industry and educational buildings.
James K. Rogers, PEOne Blacksmith Rd, Chelmsford, MA 01824Tel: 978.256.1345 / Fax: 978.256.2226Internet: [email protected]
JAMES K. (JIM) ROGERS is a facilities consultant who specializes in identifying, quantify-ing and implementing all types of energy measures and facility upgrades for corporate,institutional, government and utility energy efficiency projects and programs. He hasbeen involved in energy efficiency improvement programs for more than twenty yearsand has managed successful programs for reducing energy consumption and costs for awide range of operations worldwide. Mr. Rogers has proven knowledge and experiencewith lighting, HVAC, process and most other energy systems. He was a Vice-president ofEUA Cogenex, an energy service company engaged in energy management, conservation

Rocky Mountain Institute Energy Efficiency Survey Aboard USS Princeton CG-59© RMI 2001 www.rmi.org 30 June 2001 unclassified
122
and cogeneration for industrial, commercial, and institutional clients nationwide. Duringhis four years at Cogenex he managed energy efficiency projects that totaled 20 mega-watts of reductions including the 1.4 megawatt energy efficiency upgrade project at theDOE's Headquarters in Washington. Prior to joining Cogenex, Mr. Rogers spent eightyears as Corporate Manager of Energy and Environmental Affairs for Digital EquipmentCorporation. In that role he coordinated energy management and environmental compli-ance activities at the company's major facilities worldwide. Before joining Digital, hespent thirteen years at Raytheon Company where he was Director of Environmental andEnergy Conservation for ten years. Mr. Rogers holds a BS in Chemical Engineering fromthe University of Massachusetts and an MBA from Northeastern University. He is amember of the Association of Energy Engineers and the Association of Energy ServiceProfessionals. He is a Certified Energy Manager, a Certified Lighting Efficiency Profes-sional, a Certified Demand Side Management Professional and a Registered ProfessionalEngineer in Massachusetts. Mr. Rogers has published numerous articles on energy man-agement and environmental control, and lectures extensively at professional meetings andconferences.
RMI Team, 11–15 Dec 2000: (L to R) Ron Perkins, Jim Rogers, Chris Lotspeich.

Rocky Mountain Institute Energy Efficiency Survey Aboard USS Princeton CG-59© RMI 2001 www.rmi.org 30 June 2001 unclassified
123
RMI Team, 29 Jan–2 Feb 2001: (L to R) Jim Rogers, Chris Lotspeich, Ned Orrett.
About Rocky Mountain Institute (RMI)
Rocky Mountain Institute (www.rmi.org) is a 19-year-old, ~50-person, independent, en-trepreneurial, nonprofit applied research center in Old Snowmass, Colorado. RMI fostersthe efficient and restorative use of natural and human capital to create a secure, prosper-ous, and life-sustaining world. RMI has unique expertise in extremely efficient technolo-gies and design integration for HVAC, lighting, fluid movement, drivesystems, electron-ics, and most other end-uses of electricity. RMI consults extensively on energy and re-source efficiency and integrated, whole-systems engineering and design in industrial, ar-chitectural, institutional, automotive, water, energy, and other systems, for private- andpublic-sector clients, and draws upon a global network of leading technical specialistcolleagues for this work. RMI’s end-use, least-cost analytical approach seeks to identifythe desired task or service to be accomplished by a technical system, and to considerwhether more cost-effective and resource-efficient alternatives systems and strategiesmight be better. Unlike traditional component-based efficiency analyses, RMI’s workemphasizes optimizing whole systems for multiple benefits. This often permits very largeenergy and resource savings to cost less than small or no savings. RMI has spun off fourprivate companies, including E SOURCE (www.esource.com)—the world’s most currentand detailed source of energy efficiency information, embodied in the Electronic Ency-clopedia library of technical atlases (to which NAVFAC subscribes)—and Hypercar Inc.(www.hypercar.com), a developer of ultralight hybrid-electric vehicles. RMI’s 1999book Natural Capitalism: Creating the Next Industrial Revolution (www.natcap.org)offers numerous practical examples of profitable practices that protect the environment.

Rocky Mountain Institute Energy Efficiency Survey Aboard USS Princeton CG-59© RMI 2001 www.rmi.org 30 June 2001 unclassified
124
APPENDIX M:INFORMATION SOURCES AND BIBLIOGRAPHY
PRIMARY DATA AND INFORMATION SOURCES
Data and other information for this report were drawn from several sources, including thefollowing main sources:
Shipboard observations. These included measurements made using both ship’s instru-mentation and RMI Team measurements of systems performance, as well as ship’s logsand crew commentary and estimates. Due to the limited scope of this project and specialcircumstances of the kinds illustrated in App. A, measurements were mainly illustrative.The RMI Team would recommend a more complete measurement campaign on a suitableship to fill data gaps and gain understanding of intended vs. actual component efficiency.
CG-59 USS Princeton Engineering Department Handbook. This little blue manual,prepared and maintained by CG-59’s Engineering Department, was an invaluable techni-cal reference.
CG-58 USS Philippine Sea load assessment. This is based on the Ingalls Test and Trialsreport of CG-58’s “all-electric” conversion. Researchers measured loads that were 18.4%lower than calculated loads in cruise condition, and 29.3% in OCSOT (All Up CombatSystem) condition. (Note that the implication—oversized GTGs—will not only costmore, but also run less efficiently all the time because they’re even more underloaded.)
CG-60 USS Normandy load assessment. This is based on a report of CG-60 energyloads, provided by NAVSEA. CG-60 has not yet undergone an all-electric conversion.The report presents calculated loads, obtained essentially by multiplying the CG-58measured loads by an assumed across-the-board load factor of 0.9.
CG-68 USS Anzio load assessment. This is the Final Report for Class Services Engi-neering Task TI 2111-2-047, “Measurement of Equipment Loads,” conducted under con-tract N00024-88-C-2111. Measured load data from select equipment under operationwere compared to the existing load analysis and found to be roughly 60–70% of the loadsoriginally predicted. The analysts therefore updated load factors to make the actual loads~75–85% of those originally predicted. (The RMI team infers that this continuing dis-crepancy reinforces the case for further and more detailed load measurements until thecauses of disparities are thoroughly understood and fed back into design methodology.)The study also indicated that for cruise and battle conditions, respective loads would in-crease by 70 kW and 140 kW on a 10°F day or by 50 kW and 120 kW on a 90°F day.
NAVSEA personnel: As noted in the acknowledgements, many NAVSEA staff weresupportive of this research and provided invaluable assistance and information. NAVSEAwebsites were also useful (e.g., www.navsea.navy.mil/encon/Frontpage.htm).

Rocky Mountain Institute Energy Efficiency Survey Aboard USS Princeton CG-59© RMI 2001 www.rmi.org 30 June 2001 unclassified
125
BIBLIOGRAPHY
In addition to the information sources cited above, the following is a partial bibliographyof useful publications:
Abens, Ghezel-Ayagh, Steinfeld, and Sanderson (FuelCell Energy, Inc.), and Cervi (Na-val Surface Warfare Center), Development of a Ship Service Fuel Cell , paper presented atFuel Cell Energy Seminar 2000, Portland, OR: October 2000,www.ercc.com/site/products/marine.html.
“Air Conditioning Compressor Improvements,” handouts of presentation to DSB TaskForce on Improving Fuel Efficiency of Weapons Platforms by NAVSEA’s Thomas Bein([email protected]) and Dr. Yu-Tai Lee ([email protected]), 21 June 2001.
“Electrical Energy Efficiency,” presentation to DSB Task Force on Improving Fuel Effi-ciency of Weapons Platforms, presentation handouts, Andrew Bigley, NAVSEA(215.897.1190 / [email protected]).
E SOURCE Technology Atlas series (particularly Cooling, Drivepower, and Lighting),available from www.esource.com. (These definitive syntheses were first written at RMIunder Dr. Lovins’s direction and are now in updated and well-illustrated later editions.)
“Fuel Cells for Marine Applications,” presentation handouts by Mr. Harry Skrutch (tel703.602.0706), Execution Manager, Ship’s Service Fuel Cell program, Naval Sea Sys-tems Command, presentation to DSB Task Force on Improving Fuel Efficiency of Weap-ons Platforms, 20 October 2000.
More Capable Warfighting Through Reduced Fuel Burden, report of the Defense ScienceBoard Task Force on Improving Fuel Efficiency of Weapons Platforms, Draft, January2001.
“Power Monitoring Project, Part One: Summertime Sea Trial” (conducted on CG-58 USSPhilippine Sea during 22 August–31 September 2000), Ingalls Test and Trials, LittonShip Systems Full Service Center, 20 November 2000.
Ira Krepchin, Ozone Laundering: A Technology Ready to Clean Up? E SOURCE ER-99-4(March 1999), www.esource.com.
Vanessa Hill and Marty Ahad, Ozone Laundry Systems Pilot Study, Executive Summary,May 2000 (prepared for and published by BC Hydro).

Rocky Mountain Institute Energy Efficiency Survey Aboard USS Princeton CG-59© RMI 2001 www.rmi.org 30 June 2001 unclassified
126
APPENDIX N: GLOSSARY OF TERMS,ACRONYMS, AND ABBREVIATIONS
AHU: Air handler.
All-electric conversion: see Shipalt 588 all-electric conversion.
BBL: Barrel (e.g., of oil, which contains 42 U.S. gallons).
BHP: Brake Horsepower; essentially, rated or nominal hp.
CCS: Central Control Station, a ship’s engineering control center.
CFS: Cubic foot [or feet] per second.
CG-47: Ticonderoga-class Aegis cruiser.
CG-59: USS Princeton, a Bunker Hill-class Aegis cruiser (Bunker Hill class is a subset ofthe CG-47 Ticonderoga class).
CH: Chiller, a machine for making coolth.
CHW: Chilled water, produced by a chiller.
CHENG: Chief Engineer.
CIC: Combat Information Center, the ship’s tactical control center.
CO: Commanding Officer.
COTS: Commercial off-the-shelf technology.
CT: Current transformer (a device placed around wires to measure their current flow).
CW: Condenser water, used to transport to a heat sink the heat extracted by a chiller.
DDI: Demand Display Indicator (e.g., a control panel gauge or indicator).
Delta P (∆P): Pressure drop or pressure difference (e.g., across a coil or filter).
Delta T (∆T): Temperature difference.
DESC: Defense Energy Supply Center.

Rocky Mountain Institute Energy Efficiency Survey Aboard USS Princeton CG-59© RMI 2001 www.rmi.org 30 June 2001 unclassified
127
DFM: Diesel Fuel Marine (similar to JP-5, but with slightly higher viscosity, lower en-ergy content, and more combustion residues).
DSB: Defense Science Board. This RMI study’s director, Dr. Amory Lovins, served onthe DSB Task Force on Improving Fuel Efficiency of All Weapons Platforms, which inJanuary 2001 submitted its report, More Capable Warfighting Through Reduced FuelBurden.
EOSS: Engineering Operational Sequencing Systems; equivalent to (shipboard) engi-neering SOPs.
ENCON: NAVSEA Incentivized Energy Conservation Program (seewww.navsea.navy.mil/encon/Frontpage.htm).
FCU: Fan Coil Units, which supply cooled or heated air to many of the ship’s spaces.
FL: Fluorescent lamp or light bulb.
FLA: Full Load Amperes.
FPM: Feet per minute.
GAL or GL: U.S. gallon (equal to 3.785 liters).
GPD: [U.S.] gallon per day.
GTE: Gas Turbine Engine for propulsion of the ship. On CG-59 the GTEs are GeneralElectric LM-2500 engines rated at 21,500 BHP each. See also GTM.
GTG: Gas Turbine Generators for electricity. On CG-59 the GTGs are Allison 501-K17single shaft, axial flow, aircraft derivative gas turbine engines with a rated generation ca-pacity of 2500 kW – 4000 amperes of ship’s service 60 Hz electrical power.
GTM: Gas Turbine Module, which provides a controlled environment for the gas turbineengine (GTE) along with connections for controls and support systems for the GTE. Seealso GTE.
H: hour(s).
HVAC: Heating, Ventilation, and Air Conditioning.
HW: Hot water (potable).
HX: Heat exchanger.
Hz: Hertz (cycles per second, measuring the frequency of alternating current).

Rocky Mountain Institute Energy Efficiency Survey Aboard USS Princeton CG-59© RMI 2001 www.rmi.org 30 June 2001 unclassified
128
JP-5: Jet fuel (essentially a form of kerosene) used in such aircraft as the SH-60 Seahawkhelicopters.
kW: Kilowatt, or 1,000 watts, e.g., of electric power (a measure of how quickly electricenergy is delivered).
kWh: Kilowatt-hour, a measure of the amount of electricity generated or consumed.
LED: Light-Emitting Diode, a durable energy-efficient lighting technology.
LF: Load factor (or duty factor), the average inferred, assumed, or observed operationalutilization of a device or system relative to its rated capacity and full-time usage (8,766h/y).
LPAC: Low-Pressure Air Compressor.
MIL-SPEC / MIL-STD: Military specifications and -standards, designed to ensureequipment is functional and durable in a wide range of operating and environmental con-ditions required or assumed to be required for reliable military use.
MW: Megawatt, or 1,000,000 watts, or 1,000 kW, of electric power or generating capac-ity.
MWh: Megawatt-hour, a measure of electricity generated or consumed; 1,000 kWh.
NAVSEA: Naval Sea Systems Command.
Negawatt(-hour): A saved or conserved watt(-hour). For example, if a system’s electricalload is reduced by a kilowatt through end-use efficiency measures, those savings could beconsidered as equivalent to one thousand negawatts.
NSWCCD: Naval Surface Warfare Center, Carderock Division; Naval engineering anddesign center, based in Carderock, VA and Philadelphia, PA. Part of NAVSEA.
PMS: Planned Maintenance System, similar to a preventative maintenance schedule.
PSIG: Pounds per Square Inch Gauge; i.e., pressure as read by a meter or indicator.
PW: Potable (drinking-quality) water.
RO: Reverse osmosis, a technology for purifying water (e.g., to make seawater into pota-ble water).
s: Second [of time].

Rocky Mountain Institute Energy Efficiency Survey Aboard USS Princeton CG-59© RMI 2001 www.rmi.org 30 June 2001 unclassified
129
SECAP: Ship Energy Conservation Assistance Program; self-help software to assist per-sonnel in developing underway fuel consumption curves. Available atwww.navsea.navy.mil/encon/SECAPDescription.htm or www.seaworthysys.com.
SECAT: NAVSEA Ship Energy Conservation Assist Team, which trains shipboard per-sonnel in energy conservation techniques.
Shipalt 588 all-electric conversion: A common abbreviation of the Shipalt CG47-00588program to replace steam production and distribution—used primarily for PW productionand heating—with RO PW production and electric resistance coil PW heating.
SOP: Standard Operating Procedure.
SW: Seawater.
SWS: Seawater Service.
t: Ton [of refrigeration, equal to 12,000 BTU/h or 3.518 thermal kW of cooling; so calledbecause it is the latent heat required to melt one short ton of ice in 24 hours].
TSP: Total static pressure.
TQEM: Total quality environmental management.
VSD: Variable-Speed Drive, a device that allows drivepower system output to match theload served in real-time. Strictly speaking, it may be electrical or mechanical. Also calledAdjustable-Speed Drive (ASD). The most common kind, often used synonymously, is theelectronic Variable-Frequency Drive (VFD), also called a Variable-Frequency Inverter(VFI), which supplies electronically synthesized variable-frequency power to a motor.
w.g.: Water gauge, the standard measure of air pressure or water head used by most U.S.mechanical engineers; 1 inch w.g. = 250 Pascals.
XO: Executive Officer (second in command).
y: Year. The average year contains 8,766.3 hours.


