
Hammill Institute on Disabilities
Effects of Self-Recording on High-School Students' On-Task BehaviorAuthor(s): Deborah W. Blick and David W. TestSource: Learning Disability Quarterly, Vol. 10, No. 3 (Summer, 1987), pp. 203-213Published by: Sage Publications, Inc.Stable URL: http://www.jstor.org/stable/1510493 .
Accessed: 17/06/2014 01:35
Your use of the JSTOR archive indicates your acceptance of the Terms & Conditions of Use, available at .http://www.jstor.org/page/info/about/policies/terms.jsp
.JSTOR is a not-for-profit service that helps scholars, researchers, and students discover, use, and build upon a wide range ofcontent in a trusted digital archive. We use information technology and tools to increase productivity and facilitate new formsof scholarship. For more information about JSTOR, please contact [email protected].
.
Sage Publications, Inc. and Hammill Institute on Disabilities are collaborating with JSTOR to digitize,preserve and extend access to Learning Disability Quarterly.
http://www.jstor.org
This content downloaded from 188.72.96.102 on Tue, 17 Jun 2014 01:35:48 AMAll use subject to JSTOR Terms and Conditions

EFFECTS OF SELF-RECORDING ON HIGH- SCHOOL STUDENTS' ON-TASK BEHAVIOR
Deborah W Blick and David W Test
Abstract. Twelve mildly handicapped (9 learning disabled, 2 educable mentally handicapped, and 1 emotionally handicapped) high-school students served as sub- jects in a study conducted to determine the effects of self-monitoring and record- ing on student on-task performance. Although only four students from three classes were targeted for data collection, all students in each class were taught how to self- monitor and record -first in the presence of audible cues and later independently as audible cues were faded. A multiple-baseline design across groups revealed a func- tional relationship between the intervention and increased on-task behavior. Changes were maintained as audible cues were faded. In addition, student accuracy data showed a relationship between increased on-task behavior and accurate self- recording. Anecdotal data indicated that students' academic performance improved in both training and nontraining settings.
Learning disabled, educable mentally handi- capped, and emotionally handicapped students often are plagued by short attention spans or, more specifically, erratic on-task behavior (Acker- man & Shapiro, 1984; Rooney, Hallahan, & Lloyd, 1984). Research has shown that if teachers can help these students increase their on-task behavior, learning increases (Gettinger & Fayne, 1982; McKinney, Mason, Perkerson, & Clifford, 1975).
Two strategies may be employed to reduce in- attentive student behavior: observer / teacher monitoring and student/ self-monitoring. Since the latter has been shown to produce results similar to those of other cuing procedures (Hayes & Nelson, 1983) while also freeing teachers to concentrate on academics rather than behavior management (Rhode, Morgan, & Young, 1983; Rosenbaum & Drabman, 1979), self-monitoring appears to offer a viable strategy for increasing on- task behavior.
Self-monitoring is often the preferred procedure because it: (a) insures that the cue to self-record occurs close to the monitoring behavior (Hayes & Nelson, 1983); and (b) utilizes the student as
an active participant who evaluates, records, and reinforces positive behavior (Christie, Hiss, & Lozanoff, 1984), thus increasing the value of the cue (Hayes & Nelson, 1983). Self-management of behavior is also a proven means of mediating generalization (Stokes & Baer, 1977) -the ultimate goal of education. Additionally, self- monitoring of attentive behavior has led to in- creased academic productivity (Hallahan & Sa- pona, 1983). For these and other reasons, self- monitoring has been utilized with normal (Hayes & Nelson, 1983), behaviorally handicapped (Rhode et al., 1983), mentally handicapped (Ackerman & Shapiro, 1984), head-trauma (Ga- jar, Schloss, Schloss, & Thompson, 1984), and learning disabled (Rooney et al., 1984) persons to modify a variety of behaviors.
DEBORAH W BLICK, M.A., is a teacher, Catawba County Schools. DAVID W
TEST, Ph.D., is Assistant Professor, Special Education, University of North Carolina at Charlotte.
Volume 10, Summer 1987 203
This content downloaded from 188.72.96.102 on Tue, 17 Jun 2014 01:35:48 AMAll use subject to JSTOR Terms and Conditions

Although self-recording can be successfully im- plemented in the regular classroom (Christie et al., 1984), many regular classroom teachers refuse to implement individual behavior management pro- cedures. Students can be successfully weaned from an auditory cue to record and continue to record / monitor their own behavior (Hallahan & Sapona, 1983). Since such training is not likely to occur in the regular class, teaching students to self-record in the resource room during a "stimulated" regular class environment, which in- cludes such common stimuli as class discussion, reading, and individual seatwork, should facilitate successful generalization to the regular classroom (Cameron & Robinson, 1980; Christie et al., 1984; Stokes & Baer, 1977).
The relationship between recording accuracy and the effectiveness of self-monitoring must be considered in any self-monitoring study. To date, no consensus has been reached on this issue. That is, some researchers maintain that the accuracy of a student's self-recorded behavior is not as im-
portant as the consistency with which the same behavior is recorded (Rooney et al., 1984), others have shown increases in attentive behavior when accuracy was stressed (Hallahan & Sapona, 1983; Rhode et al., 1983).
The purposes of this study were to: (a) deter- mine the effects of self-recording on student on- task behavior in the absence of an audible cue; and (b) investigate the relationship between ac- curacy of student self-recording and effectiveness of self-recording as a behavior-change technique.
METHOD Subjects
The study was conducted in three cross-cate- gorical resource periods (all class periods were 55 min. long) taught by the same teacher (the first author) in the same high-school classroom. The school, located in a rural setting, provides resource services to 60 of the district's 670 students.
All students in the participating classes exhibited some off-task behavior and self-monitored their own behavior. However, for data-collection pur- poses, only four students in each class were ob- served. The targets were chosen by the teacher because they exhibited a variety of off-task behaviors-most of them disruptive to other class members as well as the teacher. The four students from each class had been subject to disciplinary action through the assistant principal's office two
to four times during the preceding school year. In addition, target students had been receiving special education services since the third or fourth grade. They now had to enroll in regular educa- tion classes in order to meet high-school gradua- tion requirements.
Class A. Class A was composed of three fresh- men, three sophomores, and four juniors study- ing economics and government (ages ranged from 15-0 to 17-3 with a mean of 16-3 yr.). According to state guidelines, seven students were classified as learning disabled, three as educable mentally handicapped. Reading recognition grade-equiv- alent scores, as measured by the Peabody In- dividual Achievement Tests (PIAT), ranged from 2.3 to 7.3 with a mean of 4.0. Reading compre- hension grade-equivalent scores, also measured by the PIAT, ranged from 2.8 to 8.4 with a mean of 4.7.
The four Class A targets (students 1 through 4) were learning disabled with reading-recognition scores ranging from 2.3 to 4.8 and reading- comprehension scores from 2.8 to 5.0. Two stu- dents were sophomores, two were juniors (see Table 1).
Class B. Class B consisted of 10 freshmen and 5 sophomores who were studying learning strategies, writing, and reading skills. Their ages ranged from 14-5 to 17-1 with a mean of 15-8 years. Twelve students were labeled learning disabled, two educable mentally handicapped, and one emotionally handicapped. Their reading- recognition scores, as measured by the PIAT, ranged from 2.5 to 8.4 with a mean of 4.6, while their reading-comprehension scores ranged from 3.0 to 10.2 with a mean of 4.9.
The four target students from Class B (students 5 through 8) included two freshmen and two sophomores; three were labeled learning disabled, one emotionally handicapped. Reading-recogni- tion scores, as measured by the PIAT, ranged from 3.5 to 6.6; reading-comprehension scores from 3.9 to 8.8 (see Table 1).
Class C. Class C included 10 juniors and 1 senior who were studying material necessary to pass the reading section of the state competency test. These students' ages ranged from 16-4 to 18-3 with a mean of 17-3 years. Seven students were labeled learning disabled, four educable mentally handicapped. According to PIAT grade- equivalent scores, their reading recognition ranged from 3.1 to 9.4 with a mean of 4.6; reading com-
204 Learning Disability Quarterly
This content downloaded from 188.72.96.102 on Tue, 17 Jun 2014 01:35:48 AMAll use subject to JSTOR Terms and Conditions

Table 1 Description of Subjects 1-12
Reading Scoresd Subject Gender Age Ethnicity' Grade IQ Recognition Comprehension Classification
1 M 15.9 C 10 89-101b 2.3 2.8 LD 2 F 16.4 C 11 71c 4.8 5.0 LD 3 F 15.4 B 10 83b 3.8 3.5 LD 4 M 17.0 C 11 90C 3.4 4.2 LD 5 M 17.0 C 10 91b 6.0 8.8 LD 6 M 16.6 B 9 75c 4.7 6.9 LD 7 M 15.5 C 10 80b 6.6 3.9 EH 8 M 17.1 C 9 94b 3.5 3.9 LD 9 M 17.1 B 11 70-820 5.0 5.2 LD
10 M 16.8 C 11 55-67b 3.1 4.4 EMH 11 M 18.2 C 12 71b 3.1 3.3 EMH 12 M 18.0 C 11 84c 2.8 3.2 LD
'C = Caucasian; B = Black. bAs measured by the WISC-R. CAs measured by the WAIS-R. dAs measured by the PIAT
prehension from 2.7 to 6.0 with a mean of 4.3. The four Class C students' (students 9 through
12) reading-recognition scores ranged from 2.8 to 5.0; their reading-comprehension scores from 3.2 to 5.2, as measured by the PIAT in grade- equivalent scores. One student was a senior, three were juniors. Two target students were learning disabled, two were educable mentally handi- capped (see Table 1). Data-Collection Procedures
Students self-monitored their on-task behavior. For the purposes of this study, on-task behavior was defined as the student being actively engaged in one of the following: (a) looking at the teacher or movie, (b) talking with the teacher, (c) reading assigned material, or (d) writing on an assignment. Students marked a (+) on the recording sheet if they were on task; all other behaviors were re- corded as (0).
Students received daily recording sheets listing the four on-task behaviors and a block for each recording time. The teacher monitored the four target students in each class on a master sheet. Because all class members were self-recording, the four target students in each room did not realize that the teacher was recording only their on-task behavior. Data were collected daily during the middle 40 min. of each 55-min. period. This ar-
rangement allowed time for preparing recording sheets and gathering materials at the beginning of the period and for cleaning up and totaling re- sponses at the end.
The teacher recorded data utilizing the Placheck Recording System (Tawney & Gast, 1984); that is, the behavior of the four targeted students was recorded at the end of each 5-min. interval for a total of eight observations each session. The percentage of intervals on task was then calculated from the teacher-recorded data by counting inter- vals on task, dividing by total intervals observed, and multiplying by 100. Throughout all interven- tions, the teacher / experimenter recorded behav- ior for each of the four students in each class at 5-min. intervals, as cued by a chime or the verbal cue "record" on an audio tape.
Finally, student accuracy data were calculated by dividing the number of interval agreements be- tween student and teacher by the total number of intervals recorded and multiplying by 100.
Interobserver reliability. Due to personnel limitations at the high school, observers were on- ly able to take data twice in each class, during two different phases, for a total of 12 times. However, reliability data were collected in all phases of the study. Observers were school volunteers or coun- selors trained in the recording process. Reliability
Volume 10, Summer 1987 205
This content downloaded from 188.72.96.102 on Tue, 17 Jun 2014 01:35:48 AMAll use subject to JSTOR Terms and Conditions

was calculated using the interval-by-interval meth- od (number of interval agreements divided by to- tal number of agreements and disagreements mul- tiplied by 100). Nonoccurrence reliability (using the interval-by-interval formula but counting only those intervals in which a nonoccurrence was recorded) was also calculated because the target behavior occurred in more than 75% of the in- tervals (Tawney & Gast, 1984). Interval-by-interval reliability was 94.7%; nonoccurrence reliability was 77.5%.
Experimental Design A multiple-baseline design across groups was
utilized. The teacher/ experimenter collected baseline data in each class for five days before in- troducing Intervention I to Class A. The presence or absence of the dependent variable was noted every 5 min. for the four target students in each class. Class A received the intervention while Class B and Class C remained in baseline. To change interventions, students were required to maintain a minimum on-task percentage of 30% above the baseline mean for at least three consecutive days. Procedures
Materials. Four 40-min. audio tapes were used. The first, which had a chime every 5 min., was utilized during baseline and Intervention IV. The second tape emitted a verbal cue of "record" every 5 min. with a chime between each verbal cue. This tape was utilized during Intervention I. The third tape, used for Intervention II, had a chime at 5, 15, 25, 35 min., with the verbal cue "record" occurring at 10, 20, 30, and 40 min. On the last tape, utilized during Intervention III, a chime sounded at 5, 10, 15, 25, 30, and 35 min., and the verbal cue "record" at 20 and 40 min.
Two different recording sheets were used by each student. Both listed the target behaviors and contained spaces for name, date, and intervention number. In addition, one form had eight blanks to be used in Intervention I, the other contained four blanks (for Interventions II, III, and IV).
The teacher's daily master recording sheet con- sisted of a single sheet with spaces for the neces- sary data grouped by class. The sheet contained space for the date, intervention number, class, and percentage, plus eight blanks for recording each of the four students per class. This master sheet was also used by the outside observers.
General procedure. Each day the appropriate audio tape was started 5-10 min. after the begin- ning of the class period (i.e., as soon as roll had
been taken, forms distributed, all "secretarial" chores completed, and the academic plan for the class presented). At this point all students had their assignments and knew what to expect from the class. Thus, they had full opportunity to exhibit on-task behavior when the first chime or verbal cue "record" occurred. Each period progressed as usual with discussion, reading, written assign- ments, and / or movies or filmstrips.
Baseline. During baseline, the tape with a chime every 5 min. was played so the teacher could record the behavior of the four target students in each class. Students were not told why the chime was sounding or why the tape was play- ing. If they asked about the tape, they were told that the teacher was trying a new teaching method and to ignore the chime.
Training. Students were given the definition of on-task behavior with specific examples of "+" behavior (e.g., watching a movie, completing a worksheet) and "0" behavior (e.g., writing a letter to a friend, staring at the teacher when an essay has been assigned). Students were also told that with increased on-task behavior, their grades would probably improve, hassles with teachers over incomplete assignments would decrease, and their chances of successfully entering regular classes would increase. Recording forms were distributed and students were asked to record "+" when the tape cued "record", only if they were ac- tively engaged in any one of the four on-task behaviors at that moment. Otherwise, they were to mark "O" in the appropriate block. For two days, the teacher reminded the students of what they must be doing to mark a "+" when each "record" cue was heard. Each day students were told that the teacher was checking accuracy and that ac- curacy was important. At the end of the class the teacher either praised accuracy or encouraged honest recording, whichever was appropriate. The 12 target students were not aware that the teacher collected data on only them.
Intervention I-(5-min. self-record). Dur- ing this phase procedures were identical to those under training, except that students were no longer reminded of what constituted "+" or "O" behavior for each cue. Every two days, students were reminded of the four target behaviors and the need for accuracy, but only at the beginning of the class period. The second cuing tape was used- students recorded at the sound of the cue "record" whereas the teacher recorded at both the verbal
206 Learning Disability Quarterly
This content downloaded from 188.72.96.102 on Tue, 17 Jun 2014 01:35:48 AMAll use subject to JSTOR Terms and Conditions
0)
O
e
0_ ci 0.
Baseline T I II I11 IV 100 90
80
70 60
v) (, 50 r(
40 30 20
10
0
100
90
80
70
r 60 o,
60 50 40 30
20
10
0
100
90 80 70 60
U, , 50 40 30 20 10
0 5 10 15 20 25 30 35
Days
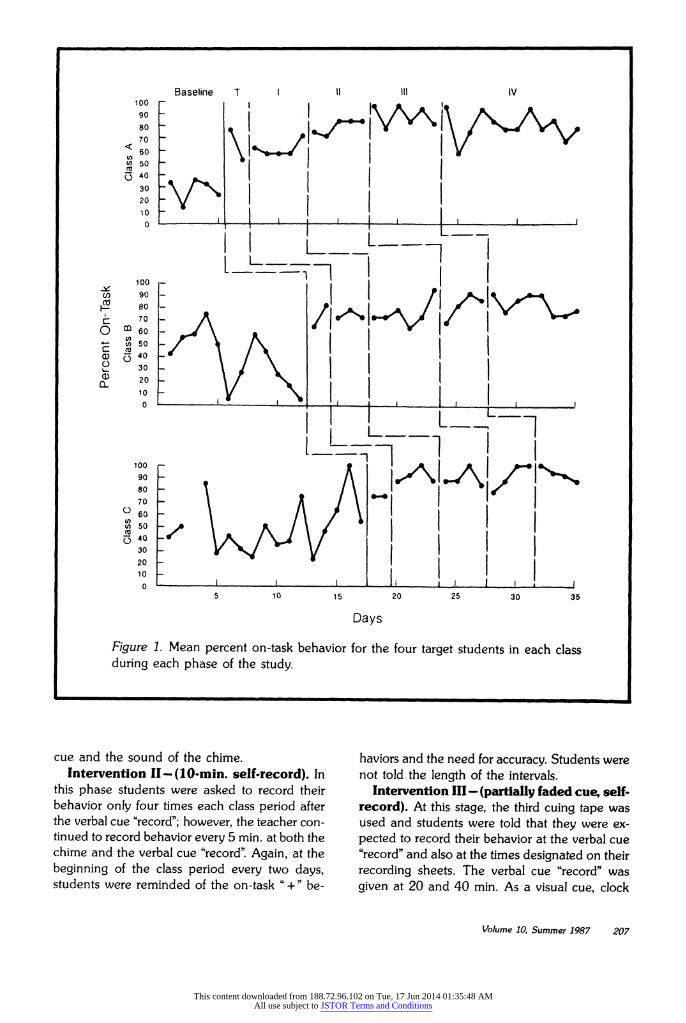
Figure 1. Mean percent on-task behavior for the four target students in each class during each phase of the study.
cue and the sound of the chime. Intervention II-(10-min. self-record). In
this phase students were asked to record their behavior only four times each class period after the verbal cue "record"; however, the teacher con- tinued to record behavior every 5 min. at both the chime and the verbal cue "record". Again, at the beginning of the class period every two days, students were reminded of the on-task "+" be-
haviors and the need for accuracy. Students were not told the length of the intervals.
Intervention III - (partially faded cue, self- record). At this stage, the third cuing tape was used and students were told that they were ex- pected to record their behavior at the verbal cue "record" and also at the times designated on their recording sheets. The verbal cue "record" was given at 20 and 40 min. As a visual cue, clock
Volume 10, Summer 1987 207
This content downloaded from 188.72.96.102 on Tue, 17 Jun 2014 01:35:48 AMAll use subject to JSTOR Terms and Conditions

Baseline T I II 111 IV A, .A A A A .. . . . . . .A
70
<1
ci (n
io
I
c
03
C
Co
.Cf
0
c_
4-4
c 0)
C)
a- 0) (Va
0C) a.
100 90 80 70 60
c (D 50
40 U) 30
20 10 0
100 90 80 70 60 50
40 W 30
20 10 0
100 90 80 70 60 50
" 40 S 30 20 10 0
100 90 80
,. 70 60
- 50 40 30 20 10 0
5 10 15 20 25 30 35
Days
Figure 2. Percent on-task behavior and recording accuracy for students 1-4 in Class A.
208 Learning Disability Quarterly
This content downloaded from 188.72.96.102 on Tue, 17 Jun 2014 01:35:48 AMAll use subject to JSTOR Terms and Conditions

times for 10 and 30 min. into the intervention were written beneath the appropriate blocks on each recording sheet. (A clock was hanging at the front of the classroom.) As always, the teacher record- ed target student behavior every 5 min. The audio tape was started so that teacher and students were recording at the same time, making it possible to calculate accuracy data. Reminders were given as in the previous phases.
Intervention IV-(no audio cue, self-re- cord). The students received the recording sheets containing four blocks, each with clock times at 10-min. intervals added underneath. They were told that they were now capable of monitoring their own behavior without the verbal cue "record" and that they were expected to record their behavior at the appropriate times. As usual, behavior and accuracy reminders were also given. The audio tape was started so the students' record- ing accuracy could be calculated at the 10-min. intervals. The baseline tape with only the chime was played so the teacher could continue to record the target students' behavior at 5-min. intervals.
RESULTS Both group and individual student data revealed
a functional relationship between self-monitoring and recording and increased on-task behavior. In addition, student on-task behavior maintained at a high level even as the audible recording cues were faded. Class Data
Figure 1 presents the percent of on-task behavior for each class, as measured by the four target students. As illustrated, on-task behavior in- creased above the 30% criterion in all three classes upon introduction of self-recording and main- tained at a high level throughout the study as audi- ble cues were faded.
Class A. During baseline, mean on-task percentage was 29.4% with a range from 15.6%- 34.4%. In Intervention I mean on-task percentage increased to 59.4% with a range of 53.1% to 79%. On-task behavior again increased during In- tervention II to 79.8% with a range from 71.9% to 84.4%. During Intervention III, mean on-task percentage continued to increase to 88.6%, range: 78.1%-97%. Finally, during Intervention IV (all audio cues withdrawn), Class A's mean on-task percentage was 80.7% with a range of 59.4%- 96.9%.
Class B. During baseline Class B's mean on-
task percentage was 40.5% with a range from 4.0%-59.4%. Mean on-task percentage increased to 73.5% during Intervention I with a range of 65.6% to 81.3%. During Intervention II mean on- task percentage increased slightly to 75.4%, range: 62.5%-96.9%. Again, during Intervention III mean on-task percentage increased to 82.1% with a range of 68.8% to 90.6%. Class B's mean on- task percentage during Intervention IV (all audio cues withdrawn) was 83.3% with a range of 75%-90.6%.
Class C. During baseline Class C's mean on- task percentage was 48.9% with a range of 21.9% to 100%. Mean on-task percentage increased dur- ing Intervention I to 86% with a range from 75%-100%. During Intervention II the class mean on-task percentage continued to increase to 89.9%, range: 84.4%-100%. During Intervention III mean on-task percentage increased to 91.4% with a range from 78.1%-100%. Finally, Class C's mean on-task percentage during Intervention IV (all audio cues withdrawn) was 93.2%-range: 88%- 100%. Student Data
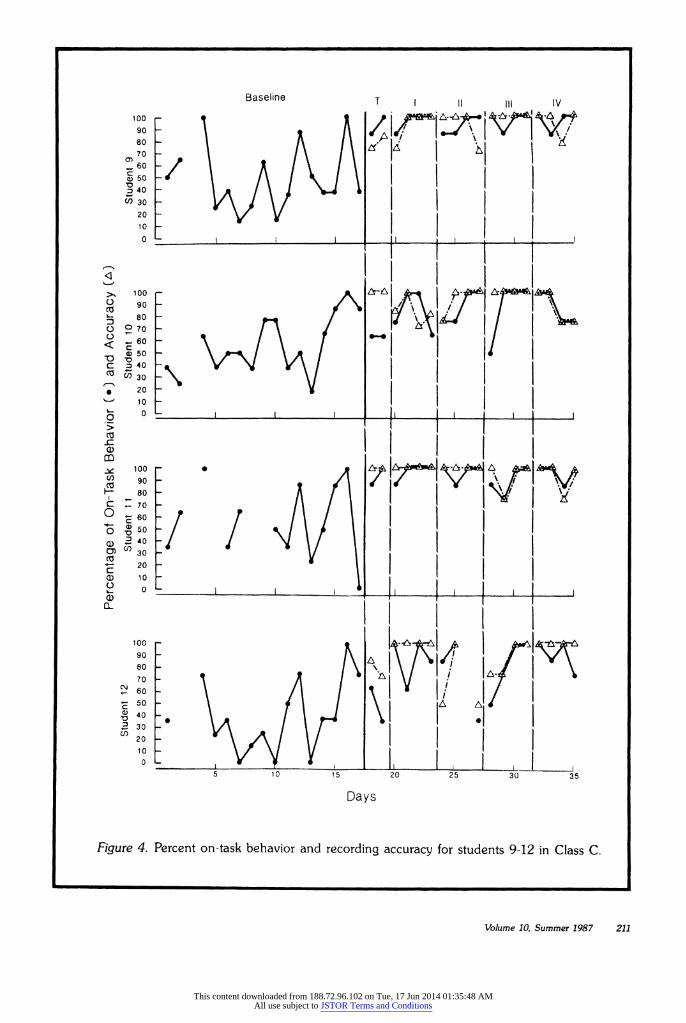
Figures 2, 3, and 4 present the percentage on- task behavior and accuracy of the four target students from the three classes. During interven- tion all but one student maintained a mean of at least 30% higher than baseline. (Student 10 main- tained at least a 29% higher average during in- tervention.) As illustrated, Student 4, who started with the lowest baseline mean, demonstrated the greatest increase (60.2%).
Accuracy. Table 2 shows the percent accuracy of self-recording during each intervention for all target students. In general, accuracy improved throughout the study. All but one student (Stu- dent 7) achieved an overall average accuracy greater than 83%. Student 7 had the lowest on- task percentage throughout, with the exception of Student 1 during Intervention IV. During Interven- tion IV, Student 1's self-recording declined as did his on-task behavior.
DISCUSSION The results of the study indicate that through
self-monitoring and self-recording students' on- task behavior increased and maintained at an ac- ceptable level (80.4%-91.5%) in the absence of audible cues. On-task behavior decreased slight- ly during the last four days of the study. This decrease could be due to the excitement generated
Volume 10, Summer 1987 209
This content downloaded from 188.72.96.102 on Tue, 17 Jun 2014 01:35:48 AMAll use subject to JSTOR Terms and Conditions

Baseline T f It Itl IV
<) O
\_
0
O O
a
O
a) i,0
CO
Co C-
0
a_
a) a)
0)
100
90 80
70 60
c 50 "o
40
CO 30
20
10
0
100 90
80
70 60 50
c a) 40
30
. 20 10
0
100 90
80
70
b- 60
E 50 * 40
30 20
10
0
100 90
80 70
60 c 50
t 40
S30 U) 20
10 0
5 10 15 20 25 30 35
Days
Figure 3. Percent on-task behavior and recording accuracy for students 5-8 in Class B.
210 Learning Disability Quarterly
This content downloaded from 188.72.96.102 on Tue, 17 Jun 2014 01:35:48 AMAll use subject to JSTOR Terms and Conditions
Baseline T I II ill IV
0C 0 0
(T
-C
O O
c
CL
CO
0)
O•
100
90
80
70
60
50 40
u) 30
20
10
0
100
90
80
70
S60 c 4) 50 z 40 ) 30
20
10 0
100
90
80
70
60
0 50 3 40
30
20
10
0
100
90 80
70
60
50
40
2 30 20
10 0
5 10 15 20 25 30 35
Days
Figure 4. Percent on-task behavior and recording accuracy for students 9-12 in Class C.
Volume 10, Summer 1987 211
This content downloaded from 188.72.96.102 on Tue, 17 Jun 2014 01:35:48 AMAll use subject to JSTOR Terms and Conditions

by an approaching 10-day vacation. The on-task behavior of students in Class C not only increased but stabilized throughout intervention, making the students more predictable and pleasant to work with. Due to school calendar restrictions, Class C did not undergo Intervention IV long enough to determine if their increased on-task behavior would maintain in the absence of audible cues.
The results of this study suggest that most stu- dents continued to self-record in the absence of the audible cue "respond". However, since the cue (chime) for teacher recording continued to be audible, to the extent that students associated the chime with teacher recording (assuming that teacher recording served to prompt on-task be- havior), it may be said that the audible cues were not completely faded. Two points argue against students associating the chime with teacher re- cording: (a) students appeared to ignore the chime after the first few days of the study; and (b) since all students in the class were self-recording, the four target students were not aware that the teach- er recorded only their behavior. Nevertheless, re- search should investigate the effects of audible ver- sus inaudible teacher cuing techniques on stu- dents' self-recording.
With the exception of students 1 and 7, all sub- jects' on-task behavior increased and maintained throughout Intervention IV, when the audible cues were no longer used. Student 7 achieved both the lowest percent recording accuracy and on-task behavior throughout the study and Student 1 ob- tained his lowest recording accuracy and on-task percentages during the same intervention (in fact,
Student 1 refused to self-record two of the last three days of the study). These findings lend sup- port to the results of Hallahan and Sapona (1983) and Rhode et al. (1983), who found that the most accurate recorders were on task more often than their less accurate counterparts. Student 7 was the only emotionally handicapped student targeted in the study. Although previous research (Rhode et al., 1983) has demonstrated the efficacy of self- recording procedures with emotionally handi- capped students, the present findings point to the need for further research to determine what fac- tors lead to successful self-recording interventions with this population of high-school students.
No differences in intervention effectiveness were found between students classified as learning dis- abled and those labeled mentally retarded. There- fore, the results of the present study lend support to the use of self-recording techniques with these populations of handicapped adolescents. Overall, the results support Hayes and Nelson's (1983) and Christie et al's (1984) findings that students react positively when actively participating in observing and recording their own behavior.
Although not directly measured in this study, academic work also increased as evidenced in the students' school records. For example, Student 4, who always had several (5-10) uncompleted assignments at the end of a 9-week grading period, did not owe work in any of his classes at the end of the study. Student 7's grades increased from 60-70% to 75-90% for the grading period during which the study took place. Similarly, students 2, 5, and 9 increased their grades in
Table 2 Total Percent Accuracy of Self-Recording during Each Intervention for Students 1-12
Intervention 1 2 3 4 5 6 7 8 9 10 11 12
I 80.4 83.3 97.8 80.3 90.0 87.5 72.5 97.5 89.6 91.7 100 93.7 II 87.5 100 85.0 95.0 95.0 95.0 75.0 85.0 93.7 93.7 100 83.3 III 91.7 79.2 87.5 83.3 99.2 100 83.3 93.7 100 100 93.7 87.5 IV 80.0 97.7 93.8 97.5 92.8 90.6 90.6 95.8 93.7 87.5 93.7 100
Total 83.1 82.3 86.5 87.9 92.0 91.6 79.6 94.0 92.7 92.7 97.9 92.2
212 Learning Disability Quarterly
This content downloaded from 188.72.96.102 on Tue, 17 Jun 2014 01:35:48 AMAll use subject to JSTOR Terms and Conditions

all regular education classes by 2-8 percentage points. Thus, academic performance improved in both the training (resource room) and nontrain- ing settings (resource and regular classes). These increases support the results of Gettinger and Fayne (1982), McKinney et al. (1975), and Hallahan and Sapona (1983), who also found that increased on-task performance was accompanied by increased academic performance. The increase in academic performance in nontraining settings is particularly important because changes are often setting-specific.
The students' enjoyment of the strategy was an added bonus. All students agreed that they were able to complete more work in class and that their grades were improving. Further, they noted that the absence of teacher "griping" about getting work done and paying attention was a pleasant change, making the experimental periods more fun than other classes. One student who was in both Class A and Class C (but only served as a target stu- dent in Class A) asked several times when record- ing would begin in the other class because it helped him "stay awake" and get his work done. Also, after the end of the study several students requested the recording sheets and half the stu- dents in the three target classes asked to continue the self-recording process using Intervention IV standards.
A final point must be made regarding the rela- tionship between on-task behavior and class ac- tivities. Anecdotal records kept by the teacher revealed that student percent on-task behavior was higher when direct instructional methods were used compared to films, slides, and lecture/ discussion. Further research must investigate the relationship between type of task and on-task behavior.
REFERENCES Ackerman, A.M., & Shapiro, E.S. (1984). Self-
monitoring and work productivity with mentally retarded adults. Journal of Applied Behavior Analysis, 17, 403-407.
Cameron, M.I., & Robinson, V.M.J. (1980). Effects of cognitive training on academic and on-task behavior
of hyperactive children. Journal of Abnormal Child Psychology, 8, 405-419.
Christie, D.J., Hiss, M., & Lozanoff, B. (1984). Modifica- tion of inattentive classroom behavior. Behavior Modification, 8, 391-406.
Gajar, A., Schloss, R.J., Schloss, C.N., & Thompson, C.K. (1984). Effects of feedback and self-monitoring on head trauma youths' conversation skills. Journal of Applied Behavior Analysis, 17, 353-358.
Gettinger, M., & Fayne, H.R. (1982). Classroom behaviors during small group instruction and learn- ing performance in learning disabled and non-disabled children. Journal of Educational Research, 75, 182-187.
Hallahan, D.P., & Sapona, R. (1983). Self-monitoring of attention with learning-disabled children: Past research and current issues. Journal of Learning Disabilities, 16, 616-620.
Hayes, S.C., & Nelson, R.O. (1983). Similar reactivity produced by external cues and self-monitoring. Behavior Modification, 7, 183-196.
McKinney, J.D., Mason, J., Perkerson, K., & Clifford, M. (1975). Relationship between classroom behavior and academic achievement. Journal of Educational Psychology, 67,198-203.
Rhode, G., Morgan, D.P., & Young, K. R. (1983). Generalization and maintenance of treatment gains of behaviorally handicapped students from resource rooms to regular classrooms using self-evaluation pro- cedures. Journal of Applied Behavior Analysis, 16, 171-188.
Rooney, K.J., Hallahan, D.P., & Lloyd, J.W. (1984). Self-recording of attention by learning disabled students in the regular classroom. Journal of Learn- ing Disabilities, 17, 360-364.
Rosenbaum, M.S., & Drabman, R.S. (1979). Self- control training in the classroom: Review and a criti- que. Journal of Applied Behavior Analysis, 12, 467-485.
Stokes, T.R., & Baer, D.M. (1977). An implicit technology of generalization. Journal of Applied Behavior Analysis, 10, 349-367.
Tawney, J.W., & Gast, D.L. (1984). Applied behavior analysis for teachers. Columbus, OH: Charles R. Merrill.
Requests for reprints should be addressed to: David W. Test, Special Education Program, University of North Carolina at Charlotte, Charlotte, NC 28223.
Volume 10, Summer 1987 213
This content downloaded from 188.72.96.102 on Tue, 17 Jun 2014 01:35:48 AMAll use subject to JSTOR Terms and Conditions


