
ORIGINAL ARTICLE
Effects of nano- and micro-limestone addition on early-ageproperties of ultra-high-performance concrete
J. Camiletti • A. M. Soliman • M. L. Nehdi
Received: 18 October 2011 / Accepted: 4 September 2012 / Published online: 5 October 2012
� RILEM 2012
Abstract In this study, the effects of micro- and
nano-CaCO3 addition on the early-age properties of
ultra-high-performance concrete (UHPC) cured at
simulated cold and normal field conditions were
investigated. The micro-CaCO3 was added at rates of
0, 2.5, 5, 10 and 15 %, while the nano-CaCO3 was
added at rates of 0, 2.5, and 5 %, both as partial
volume replacement for cement. Results indicate that
micro-CaCO3 acted mainly as an inert filler, creating a
denser microstructure and increasing the effective w/c
ratio. In addition, nano-CaCO3 accelerated the cement
hydration process through nucleation, and also acted
as an effective filling material. Mixtures combining
both micro- and nano-CaCO3 resulted in similar or
enhanced mechanical properties compared to that of
the control, while achieving cement replacement
levels up to 20 %. Thus, through the use of micro-
and nano-CaCO3, more environmentally friendly
UHPC can be produced by reducing its cement factor,
while achieving enhanced engineering properties.
Keywords Nano-CaCO3 � Micro-CaCO3 �Early-age � Green concrete � Drying shrinkage
1 Introduction
Concrete is the most widely used construction material
in the world. Over 10 billion tons are produced annually
[1], with a serious environmental and economic impact.
Just one ton of portland cement produced emits*1 ton
of carbon dioxide (CO2) into the atmosphere [1]. In
addition, it consumes substantial natural resources and
energy. In order to achieve ‘‘greener’’ concrete, cement
can be partially replaced by inert materials such as
calcium carbonate (CaCO3), or by supplementary
cementitious materials (SCM’s) such as fly ash, silica
fume, and ground granulated blast furnace slag [2].
The use of CaCO3 is an attractive alternative. It can
be found in limestone, marble and chalk, or produced
artificially by combining calcium with carbon dioxide.
Variations in temperature and pressure during pro-
duction are able to produce CaCO3 in the form of
calcite, aragonite, and vaterite [3]. Previous studies
focused primarily on using micro calcite because it is
the most stable form of CaCO3. This compound is
known to react chemically, accelerate the hydration
process, and in turn, increase the early-age strength of
conventional cementitious materials [4].
With recent enormous developments in concrete
technology, new generations of concrete are being
produced, such as very high-strength concrete (VHSC)
and ultra-high-performance concrete (UHPC). These
new concrete types are characterized by very low
water-to-cement (w/c) ratios [5]. Hence, high percent-
ages of the added cement will not hydrate and will
J. Camiletti � A. M. Soliman � M. L. Nehdi (&)
Department of Civil and Environmental Engineering, The
University of Western Ontario, London, ON, Canada
e-mail: [email protected]
Materials and Structures (2013) 46:881–898
DOI 10.1617/s11527-012-9940-0

merely act as filler (*42 %) [6]. Therefore, replacing
cement with a non-costly filler material will reap
economic and environmental benefits. It has been
suggested [7] that cement can be partially replaced
with limestone (consists mainly of CaCO3), with little
or no effect on the hydration process and compressive
strength. Limestone has been commonly used in
European cements, but remains limited by cement
standards in North America [7]. The Canadian Stan-
dards Association has been discussing protocols for
the use of limestone additions in cement-based
materials and the allowable amount limits for various
applications and environments [8].
On the other hand, since the invention of nano-
materials, the concrete industry has made significant
investments into exploring the effects of nano-mate-
rials in concrete and their potential applications [9–12].
Many nano-additives create superior results to that of
their micro counterparts. For example, a previous study
showed that the addition of nano-silica (&40 nm (1.57
lin)) had improved the early-age compressive strength
of mortar by approximately twice that induced by
micro-silica fume (SF) addition (0.1 lm (3.94 lin))
[13]. The advantage of nano-CaCO3 compared to other
nano-materials is that it has a relatively reasonable cost
[14]. Limited research has investigated the effect of
nano-CaCO3 addition in cement-based materials, its
benefits and potential applications.
This paper investigates the effects of incorporating
micro- and nano-CaCO3, both individually and com-
bined, as partial replacement for cement on the early-
age properties of UHPC. This will emphasize the
difference in the cement hydration accelerating effect
induced by nano-CaCO3 as opposed to the reagent
grade micro-CaCO3. To the best of the authors’
knowledge, no previous research has been conducted
on the effects of using combined micro- and nano-
sized CaCO3 in UHPC. Hence, this work should
contribute to the body of knowledge on the influence
of different sizes of limestone particles, and their
combinations on the early-age properties of UHPC.
2 Research significance
The use of micro- and nano-sized CaCO3 additives,
single and combined, as partial replacement for
cement has not yet been studied in depth. In UHPC,
which is characterized by very low w/c, a high portion
of the portland cement remains unhydrated, and thus
could be partially replaced by more economical and
environmentally friendly materials. From what is
currently known about nano-materials, the ultrafine
size offers significant beneficial properties compared
to coarser additives. Thus, in this paper the effects of
micro- and nano-CaCO3 as partial replacement for
cement, and their benefits in UHPC have been
investigated. The study provides an innovative solu-
tion for reducing the cement factor in UHPC, thus
achieving ‘‘greener’’ concrete.
3 Experimental program
This experimental program aims at gaining an under-
standing of the mechanisms involved in using micro-
and nano-CaCO3 in UHPC. In this study, monitoring
of the hydration process (degree of hydration, heat of
hydration, setting time), characterizing of the mechan-
ical properties and microstructural development have
been carried out on UHPC mixtures incorporating
micro- and nano-CaCO3 in order to evaluate its
efficiency as a partial replacement for portland
cement.
3.1 Materials and mixture proportions
An ordinary portland cement (OPC) and SF were used
as binders. The chemical and physical properties of the
various binders are listed in Table 1. According to the
suggestions of [15], coarse aggregates were not used
in UHPC. Quartz sand having a particle size in the
range of 0.1–0.8 mm (0.004–0.031 in) was used
instead. A polycarboxylate high-range water-reducing
admixture (HRWRA) was added at a rate of 3 % by
mass of cement. Micro-CaCO3 having 3 lm average
particle size, and a nano-particle sized (15–40 nm
(0.59–1.57 lin)) CaCO3 were added as a white powder
at rates of 0, 2.5, 5, 10, and 15 % for micro-CaCO3 and
0, 2.5, and 5 % for nano-CaCO3 as partial volume
replacement for cement. Figure 1a, b shows the parti-
cle-size distribution for the used micro-CaCO3 and an
SEM micrograph of the nano-CaCO3 powder. The
particle size distribution shows slightly higher sizes due
to agglomeration of the fine particles [16]. The mixtures
are labeled with respect to their dosage: #N–#M;
‘‘N’’ indicating nano-particles, ‘‘M’’ indicating micro-
particles, and ‘‘#’’ representing the corresponding
882 Materials and Structures (2013) 46:881–898

dosage. For example, 2.5 N–5 M represents a mixture
with 2.5 % nano-CaCO3 and 5 % micro-CaCO3,
together partially replacing 7.5 % of cement by volume.
Before mixing the UHPC, nano-CaCO3 particles were
dispersed in the mixing water using the ultrasonic
dispersion method [17]. Water from the HRWRA was
included in the specified w/c. The selected composition
of the control mixture, which is a well-known class of
UHPC without coarse aggregate [18, 19], and the
characteristics of the tested mixtures are shown in
Tables 2 and 3, respectively.
3.2 Test methods and specimens preparation
The workability of each mixture was evaluated based
on the flow index (F), which is defined as follows
(Eq. 1):
Fð%Þ¼R25 � R0
R0
� 100 ð1Þ
where R25 is the radius of the mortar pile after the 25th
drop and R0 is the initial radius of the mortar pile
according to ASTM C 1437 (standard test method for
flow of hydraulic cement mortar) [20].
Compressive strength testing was conducted on
50 mm (2 in.) UHPC cubes at the ages of 6, 8, 10, and
12 h, and 1, 3, 7, and 28 days using a 200-ton (441 kip)
compression testing machine (innovative instru-
ments). Specimens were moist cured under burlap
for the first 24 h, and then submerged in lime-saturated
water for the remainder of the curing period. Two
curing regimes, namely at 10 and 20 ± 1 �C (50 and
68 �F), were conducted in a walk-in environmental
chamber to simulate cold and normal site conditions.
The time of setting was measured on three replicate
paste specimens using a Vicat needle according to
ASTM C191 (standard test method for time of setting
of hydraulic cement by Vicat needle) [21].
Semi-adiabatic calorimetry studies were conducted
on UHPC specimens during the first 2 days of
hydration using a custom-built experimental setup.
Table 1 Chemical and physical properties of cement and
supplementary cementitious materials
OPC Silica fume Limestone
SiO2 (%) 19.8 94.0 –
CaO (%) 63.2 0.4 –
Al2O3 (%) 5.0 0.1 –
Fe2O3 (%) 2.4 0.1 –
MgO (%) 3.3 0.4 \0.45
K2O (%) 1.2 0.9 –
SO3 (%) 3.0 1.3 –
Na2O (%) 0.1 0.1 –
TiO2 (%) 0.3 0.3 –
CaCO3 (%) – – 99.0
Loss on ignition (%) 2.5 4.7 –
Specific surface area (m2/kg) 410 19,530 3,200
Specific gravity 3.17 2.12 2.70
C3S 61 – –
C2S 11 – –
C3A 9 – –
C4AF 7 – –
0
1
2
3
4
5
6
7
8
0.01 0.1 1 10 100
Volu
me
(%)
Particle Size (µm)
(b)(a)
Fig. 1 Particle size distribution of CaCO3 powders: a SEM micrograph for nano-CaCO3, b laser diffraction spectrometry for
3 lm-CaCO3
Materials and Structures (2013) 46:881–898 883

The UHPC was prepared and cast into a prismatic
mold [60 9 100 9 250 mm (2.5 9 4 9 10 in.)]. The
mold was immediately placed in a micro-porous
insulation box. Three type-T thermocouples were
inserted into the center of the concrete volume along
its length to monitor its temperature. Replicate spec-
imens indicated a standard deviation of 1.8 �C (35 �F)
for the maximum specimen temperature.
Thermo-gravimetric analysis (TGA) combined
with derivative thermo-gravimetric (DTG) was used
to determine the evolution of the bound water (BW)
content during hydration. This indirect method has
been commonly used e.g. [22, 23] to quantify the
degree of hydration. Since only one binder composi-
tion was used, a linear correlation between the amount
of BW and the degree of hydration was assumed, in
agreement with previous studies [22, 23]. The sample
preparation and test procedure are presented in greater
detail elsewhere [22]. These tests were conducted
using a simultaneous DSC-TGA (Model SDT 2960).
For the drying shrinkage measurements, prismatic
specimens 25 9 25 9 285 mm (1 9 1 9 11 in.) were
prepared according to ASTM C 157 (standard test
method for length change of hardened hydraulic-
cement mortar and concrete) [24]. Immediately after
demolding (i.e. at age 24 h), the initial lengths of
specimens were measured, then specimens were moved
inside the walk-in environmental chamber. Drying was
conducted at 10 and 20 ± 1 �C (50 and 68 �F) inside
the environmental chamber with a relative humidity of
40 %. The unrestrained one-dimensional deformations
have been measured using a digital comparator pro-
vided by a dial gauge with an accuracy of 10 lm/m.
Small prismatic cross-section [25 9 25 mm (1 9
1 in.)] specimens were chosen to reduce the moisture
gradients effect induced by drying [23] and to assure
quick dissipation of the hydration heat [25, 26].
Table 2 Composition of control mixture
Material (Mass/
cement mass)
Cement 1.00
Silica fume 0.30
Quartz sand (0.1–0.5 mm) 0.43
Quartz sand (0.3–0.8 mm) 1.53
Water 0.25
HRWRA 0.03
Table 3 Tested mixtures
Mixture Nano-CaCO3
content (%)aMicro-CaCO3
content (%)aTotal cement
replacement (%)aCompressive strength (% of control)
24 h 28 days
10 �C
(50 �F)
20 �C
(68 �F)
10 �C
(50 �F)
20 �C
(68 �F)
Control 0.00 0.00 0.00 100.0 100.0 100.0 100.0
0 N–2.5 M 0.00 2.50 2.50 153.3 122.2 98.7 105.4
0 N–5 M 0.00 5.00 5.00 143.7 103.5 101.6 103.1
0 N–10 M 0.00 10.00 10.00 126.7 101.9 96.9 100.3
0 N–15 M 0.00 15.00 15.00 107.0 97.0 94.4 97.3
2.5 N–0 M 2.50 0.00 2.50 132.5 161.9 113.7 93.8
2.5 N–2.5 M 2.50 2.50 5.00 162.9 121.6 95.7 97.4
2.5 N–5 M 2.50 5.00 7.50 176.8 108.4 98.0 82.3
2.5 N–10 M 2.50 10.00 12.50 159.9 92.0 97.2 88.9
2.5 N–15 M 2.50 15.00 17.50 162.3 81.6 101.6 85.0
5 N–0 M 5.00 0.00 5.00 174.8 161.4 123.7 90.3
5 N–2.5 M 5.00 2.50 7.50 163.2 108.1 107.5 100.0
5 N–5 M 5.00 5.00 10.00 172.8 111.8 105.0 100.6
5 N–10 M 5.00 10.00 15.00 164.2 111.9 99.0 98.6
5 N–15 M 5.00 15.00 20.00 149.7 87.9 103.8 91.0
a As a volume replacement of cement
884 Materials and Structures (2013) 46:881–898
Prismatic specimens 25 9 25 9 280 mm (1 9 1 9
11 in.) were made for measuring mass loss for each
mixture. Specimens were demolded at the time of
starting drying shrinkage measurements (24 h after
casting). Prisms were transferred to the walk-in envi-
ronmental chamber after measuring the initial mass of
each prism using a balance with an accuracy of 0.01 g
(0.00035 oz.). Mass measurements were taken for all
prisms along with measurements of shrinkage strains.
Each mass loss test result in this study represents the
average value obtained on three identical prisms
(maximum standard deviation of 0.18 g (0.0063 oz)).
Particle sizes were obtained using a Mastersizer
2000 laser diffraction particle analyzer (Malvern
Instruments) for micro-limestone, while scanning
electron microscopy (Hitatchi S-4500 Field Emission
SEM) was used for illustrating the particles size at the
nano level and examining the internal microstructure
of the tested mixtures.
4 Results
4.1 Flowability
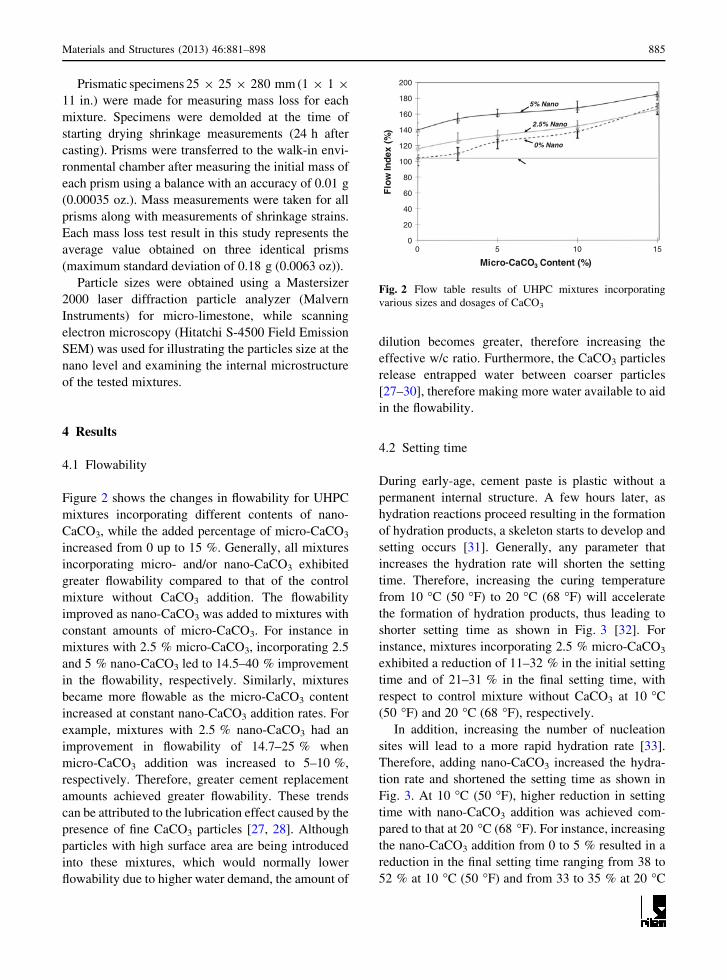
Figure 2 shows the changes in flowability for UHPC
mixtures incorporating different contents of nano-
CaCO3, while the added percentage of micro-CaCO3
increased from 0 up to 15 %. Generally, all mixtures
incorporating micro- and/or nano-CaCO3 exhibited
greater flowability compared to that of the control
mixture without CaCO3 addition. The flowability
improved as nano-CaCO3 was added to mixtures with
constant amounts of micro-CaCO3. For instance in
mixtures with 2.5 % micro-CaCO3, incorporating 2.5
and 5 % nano-CaCO3 led to 14.5–40 % improvement
in the flowability, respectively. Similarly, mixtures
became more flowable as the micro-CaCO3 content
increased at constant nano-CaCO3 addition rates. For
example, mixtures with 2.5 % nano-CaCO3 had an
improvement in flowability of 14.7–25 % when
micro-CaCO3 addition was increased to 5–10 %,
respectively. Therefore, greater cement replacement
amounts achieved greater flowability. These trends
can be attributed to the lubrication effect caused by the
presence of fine CaCO3 particles [27, 28]. Although
particles with high surface area are being introduced
into these mixtures, which would normally lower
flowability due to higher water demand, the amount of
dilution becomes greater, therefore increasing the
effective w/c ratio. Furthermore, the CaCO3 particles
release entrapped water between coarser particles
[27–30], therefore making more water available to aid
in the flowability.
4.2 Setting time
During early-age, cement paste is plastic without a
permanent internal structure. A few hours later, as
hydration reactions proceed resulting in the formation
of hydration products, a skeleton starts to develop and
setting occurs [31]. Generally, any parameter that
increases the hydration rate will shorten the setting
time. Therefore, increasing the curing temperature
from 10 �C (50 �F) to 20 �C (68 �F) will accelerate
the formation of hydration products, thus leading to
shorter setting time as shown in Fig. 3 [32]. For
instance, mixtures incorporating 2.5 % micro-CaCO3
exhibited a reduction of 11–32 % in the initial setting
time and of 21–31 % in the final setting time, with
respect to control mixture without CaCO3 at 10 �C
(50 �F) and 20 �C (68 �F), respectively.
In addition, increasing the number of nucleation
sites will lead to a more rapid hydration rate [33].
Therefore, adding nano-CaCO3 increased the hydra-
tion rate and shortened the setting time as shown in
Fig. 3. At 10 �C (50 �F), higher reduction in setting
time with nano-CaCO3 addition was achieved com-
pared to that at 20 �C (68 �F). For instance, increasing
the nano-CaCO3 addition from 0 to 5 % resulted in a
reduction in the final setting time ranging from 38 to
52 % at 10 �C (50 �F) and from 33 to 35 % at 20 �C
0
20
40
60
80
100
120
140
160
180
200
0 5 10 15
Flo
w In
dex
(%
)
Micro-CaCO3 Content (%)
5% Nano
2.5% Nano
0% Nano
Fig. 2 Flow table results of UHPC mixtures incorporating
various sizes and dosages of CaCO3
Materials and Structures (2013) 46:881–898 885

(68 �F) as micro-CaCO3 addition was increased from
2.5 to 15 %. This is likely due to the effect of the added
nano-CaCO3 on accelerating cement hydration reac-
tions. Apparently, the relatively slower rate of hydra-
tion and microstructure development at the low
temperature of 10 �C (50 �F) was compensated for
by the presence of nano-CaCO3, leading to more
hydration products and consequently a stronger
microstructure [27]. Hence, the acceleration effect of
the nano-CaCO3 particles was more prominent at the
colder temperature for these mixtures.
Regardless of the curing temperature, adding nano-
CaCO3 to UHPC mixtures at a constant micro-CaCO3
content decreased the initial and final setting times
compared to that of mixtures without nano-CaCO3.
For instance, in mixtures with 10 % micro-CaCO3
cured at 10 �C (50 �F), the final setting time was
reduced by 39–48 % when the amount of nano-CaCO3
increased to 2.5–5 %, respectively, compared to that
of mixtures without nano-particles (Fig. 3c). This is
due to both an increased number of contact points
between hydration products in the mixtures due to the
presence of CaCO3 [34], along with the accelerated
hydration promoted by the nano-particles due to the
nucleation effect [2], as can be observed in the heat of
hydration results discussed later in this text.
At both curing temperatures, mixtures with similar
nano-CaCO3 content experienced a slight increase, if
any, in the setting time when the amount of micro-
CaCO3 was increased. For instance at 20 �C (68 �F), the
final setting time for mixtures incorporating 5 % nano-
CaCO3 increased by only 6 % when the added amount
of micro-CaCO3 increased from 0 to 15 % (Fig. 3d).
This can be attributed to two compensating effects:
dilution and filling. The cement dilution effect results in
the formation of less hydration products within mixtures
having high cement replacement levels, therefore
causing slower setting times [35]. This is offset by the
0
2
4
6
8
10
12
14
0 5 10 15
Set
tin
g T
ime
(Ho
urs
)
Micro-CaCO3 Content (%)
(a) T = 10°C
Control
0% Nano
2.5% Nano
5% Nano
0
2
4
6
8
10
12
14
0 5 10 15
Set
tin
g T
ime
(Ho
urs
)
Micro-CaCO3 Content (%)
(b) T = 20°C
Control
0% Nano
2.5% Nano
5% Nano
0
2
4
6
8
10
12
14
0 5 10 15
Set
tin
g T
ime
(Ho
urs
)
Micro-CaCO 3 Content (%)
(c) T = 10°CControl 0% Nano
2.5% Nano
5% Nano
0
2
4
6
8
10
12
14
0 5 10 15
Set
tin
g T
ime
(Ho
urs
)
Micro-CaCO3 Content (%)
(d) T = 20°C
Control
0% Nano
2.5% Nano
5% Nano
Fig. 3 Setting time results for UHPC mixtures incorporating various sizes and dosages of CaCO3, a Initial [T = 10 �C (50 �F)],
b Initial [T = 20 �C (68 �F)], c Final [T = 10 �C (50 �F)] and d Final [T = 20 �C (68 �F)]
886 Materials and Structures (2013) 46:881–898

added micro-CaCO3 particles, which densify the micro-
structure through enhanced particle packing, and con-
sequently reduce the amount of available space for
hydration products to form. Furthermore, the micro-
CaCO3 particles act as contact points between hydration
products, eventually solidifying the microstructure to
result in shorter setting time [35].
Apparently, there are three interrelated factors
influencing the setting time of UHPC mixtures incor-
porating micro/nano-CaCO3: filling, dilution and
nucleation sites. Initially, for mixtures incorporating
micro-CaCO3 alone, adding 2.5 % micro-CaCO3
exhibited lower setting time compared to that of the
control mixture (Fig. 3). This can be ascribed to the
increase in the number of contact points (i.e. filling)
and reduction in the inter-particle space that needs to
be filled by hydration products [36]. However,
replacing cement with micro-CaCO3 also induces a
cement dilution effect. The filling effect seems to be
the dominant at that level of CaCO3 addition.
Increasing the micro-CaCO3 content (i.e. [2.5 %)
accentuates the dilution effect and reduces the rate of
hydration products formation, thus leading to a longer
setting time. This prolonging in setting time was more
pronounced at 10 �C (50 �F) than that at 20 �C
(68 �F). At 10 �C (50 �F), the slower rate of hydration
due to the dilution effect is boosted by the reduction in
the rate of cement hydration reactions induced the low
curing temperature as mentioned earlier. Conversely,
at 20 �C (68 �F), the hydration acceleration due to the
higher curing temperature offsets the retardation
induced by the dilution effect.
At higher micro-CaCO3 contents, the setting time
starts to decrease as the micro-CaCO3 content increases.
This indicates that the filling effect starts to dominate the
behaviour over the dilution effect. Lower amount of
hydration products is needed to fill the inter-particle
space, which minimizes the effect of the low hydration
reactions rate induced by dilution. This was confirmed
via the degree of hydration results as explained later.
On the other hand, adding nano-CaCO3 induces
additional nucleation sites and consequently accelerates
the hydration process and offsets the dilution effect.
Therefore, mixtures incorporating nano-CaCO3 exhib-
ited shorter setting time compared to that of mixtures
without nano-CaCO3. At high micro-CaCO3 content,
increasing the nano-CaCO3 (i.e. providing more nucle-
ation sites to accelerate the hydration process) may not
affect the setting time significantly since at this cement
replacement level the dilution effect is dominant over
some increase in the hydration rate.
4.3 Compressive strength
UHPC mixtures are characterized by a very low w/cm
ratio; leading to very limited space for cement
hydration products to form [6]. Moreover, capillary
pores in such concrete typically become discontinuous
relatively early; further improvement in mechanical
strength depends on the ability of the cementitious
materials to hydrate [35]. Therefore, adding nano-
CaCO3 can impart two key effects: (i) It can enhance
the packing density of the granular skeleton, and
consequently few hydration products are needed to
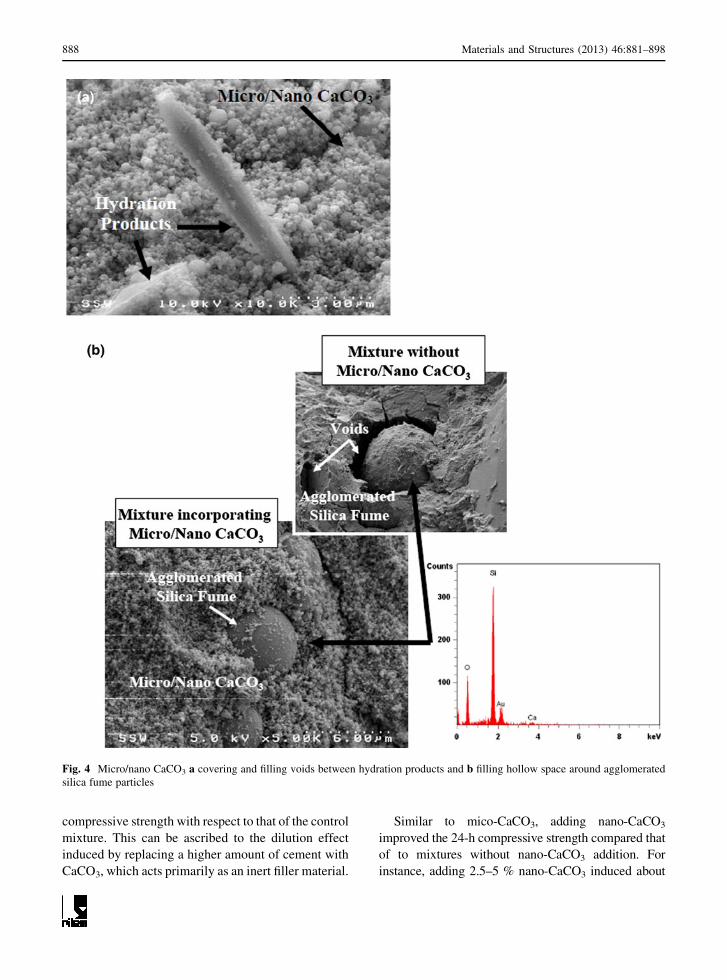
gain strength [37]. As shown in Fig. 4, micro- and
nano-CaCO3 effectively fill voids leading to denser
microstructure. Moreover, (ii) these ultra-fine materi-
als fill-up the hollow space formed around agglomer-
ated SF particles; hence, providing a solution for a
common problem that occurs in UHPC and affects its
strength [38, 39]. Furthermore, CaCO3 acts as crys-
tallization nucleus for the precipitation of CH [40]
leading to an acceleration of the hydration of cement
grains. These simultaneous effects result in a higher
early strength gain of UHPC.
Experimental results indicate that the curing tem-
perature can significantly affect the early-age com-
pressive strength of UHPC. Figure 5a, b illustrates the
24-h compressive strength results for UHPC mixtures
cured at 10 �C (50 �F) and 20 �C (68 �F). Higher
curing temperature resulted in higher compressive
strength as expected. For instance, the compressive
strength at 24-h for mixtures incorporating 0–2.5 %
micro-CaCO3 cured at 10 �C (50 �F) achieved only
40–52 % of that cured at 20 �C (68 �F), respectively.
As shown in Fig. 5a, for mixtures cured at 10 �C
(50 �F), adding nano and/or micro CaCO3 resulted in
higher 24-h compressive strength compared to that of
the control mixture without CaCO3 addition, which is
in agreement with previous work [41]. For instance,
adding 2.5 % mico-CaCO3 exhibited about 50 %
higher 24-h compressive strength compared to that
of the control mixture. This improvement in the 24-h
compressive strength for mixtures incorporation
micro-CaCO3 with respect to the control mixture
decreased as the micro-CaCO3 content increased. For
instance, mixtures incorporating 15 % mico-CaCO3
exhibited only about 8 % improvement in the 24-h
Materials and Structures (2013) 46:881–898 887
compressive strength with respect to that of the control
mixture. This can be ascribed to the dilution effect
induced by replacing a higher amount of cement with
CaCO3, which acts primarily as an inert filler material.
Similar to mico-CaCO3, adding nano-CaCO3
improved the 24-h compressive strength compared that
of to mixtures without nano-CaCO3 addition. For
instance, adding 2.5–5 % nano-CaCO3 induced about
Fig. 4 Micro/nano CaCO3 a covering and filling voids between hydration products and b filling hollow space around agglomerated
silica fume particles
888 Materials and Structures (2013) 46:881–898

32–75 % improvement in the 24-h compressive strength
with respect to that of the control mixture without
CaCO3, respectively. This can be attributed to nucle-
ation effect induced nano particles as discussed earlier.
Moreover, adding nano-CaCO3 to mixtures incorporat-
ing micro-CaCO3 also improved the achieved early
strength. For instance, adding 2.5 % nano-CaCO3 to the
mixture incorporating 15 % micro-CaCO3 resulted in
about 40 % increase in the 24-h compressive strength.
On the other hand, increasing the nano-CaCO3
addition beyond 2.5 % did not induce a significant
difference (i.e. ±4 %) in the achieved 24-h compressive
strength, regardless of the micro-CaCO3 content
(Fig. 5a). Although the nano-particles accelerate the
hydration process through nucleation [2], mixtures with
5 % nano-CaCO3 may not have sufficient available
space for hydration products to form, therefore limiting
this accelerating effect. In addition, as the micro-CaCO3
content increased from 2.5 to 15 %, the 24-h compres-
sive strength for mixtures incorporating a constant level
of nano-CaCO3 did not change significantly (i.e. ±7 %).
This can be considered as a resultant of two compen-
sating effects induced by nano-CaCO3 addition: accel-
eration and dilution. During early-age, the nucleation
effect induced by nano-CaCO3 accelerates the hydration
process [2]. Simultaneously, adding this nano-CaCO3 as
a replacement for cement increases the dilution effect,
thus leading to lower cement hydration progress.
At 20 �C (68 �F), similar to mixtures cured at 10 �C
(50 �F), increasing the added amount of nano-CaCO3 in
mixtures from 2.5 to 5 % did not show a significant
effect on the 24-h compressive strength. For instance,
increasing the added amount of nano-CaCO3 from 2.5 to
5 % resulted in a variation in the 24-h compressive
strength ranging between -0.5 and ?9.8 % for mix-
tures incorporating 0–15 % micro-CaCO3. Moreover,
mixtures incorporating nano-CaCO3 exhibited similar
24-h compressive strength to that of mixtures with only
micro-CaCO3. This can be explained as follows: the
development rate of early age strength is strongly linked
to the progress of hydration reactions. As mentioned
earlier, the limited space for hydration products to form
is the main obstacle in UHPC. At a low curing
temperature [i.e. 10 �C (50 �F)], the relatively slow
rate of hydration reactions is a dominant factor; hence, it
longer time is needed to form enough hydration product
to fill the limited available space. Therefore, the main
source for early strength gain at that low curing
temperature is the hydration acceleration induced by
nano-CaCO3 addition, which offsets the low rate of
hydration as mentioned previously. Conversely, at
higher curing temperature [i.e. 20 �C (50 �F)], the main
hurdle is not the rate of hydration but the available space
for precipitation and growth of hydration products [42].
Therefore, the nano-CaCO3 hydration acceleration
effect will have a limited influence, while particle
packing density will play a major role in compensating
for the dilution effect [43].
Figure 6a, b illustrates the 28-days compressive
strength results for mixtures cured at 10 �C (50 �F)
and 20 �C (68 �F). At 10 �C (50 �F), mixtures incor-
porating only nano-CaCO3 exhibited *15–25 %
higher compressive strength compared to that of the
control mixture without CaCO3. However, adding
0
1
2
3
4
5
6
7
8
9
10
0
10
20
30
40
50
60
70
Co
mp
ress
ive
Str
eng
th (
kpsi
)
Co
mp
ress
ive
Str
eng
th (
MP
a)
Micro-CaCO3 Content (%)
0%2.5%5%Control
Nano-CaCO3Content
(a)T = 10°C
0
1
2
3
4
5
6
7
8
9
10
0
10
20
30
40
50
60
70
0 5 10 15 0 5 10 15
Co
mp
ress
ive
Str
eng
th (
kpsi
)
Co
mp
ress
ive
Str
eng
th (
MP
a)
Micro-CaCO3 Content (%)
0%2.5%5%Control
Nano-CaCO3Content
(b)T = 20°C
Fig. 5 Twenty-four hours compressive strength results for UHPC mixtures incorporating various sizes and dosages of CaCO3 cured at
a 10 �C (50 �F) and b 20 �C (68 �F)
Materials and Structures (2013) 46:881–898 889
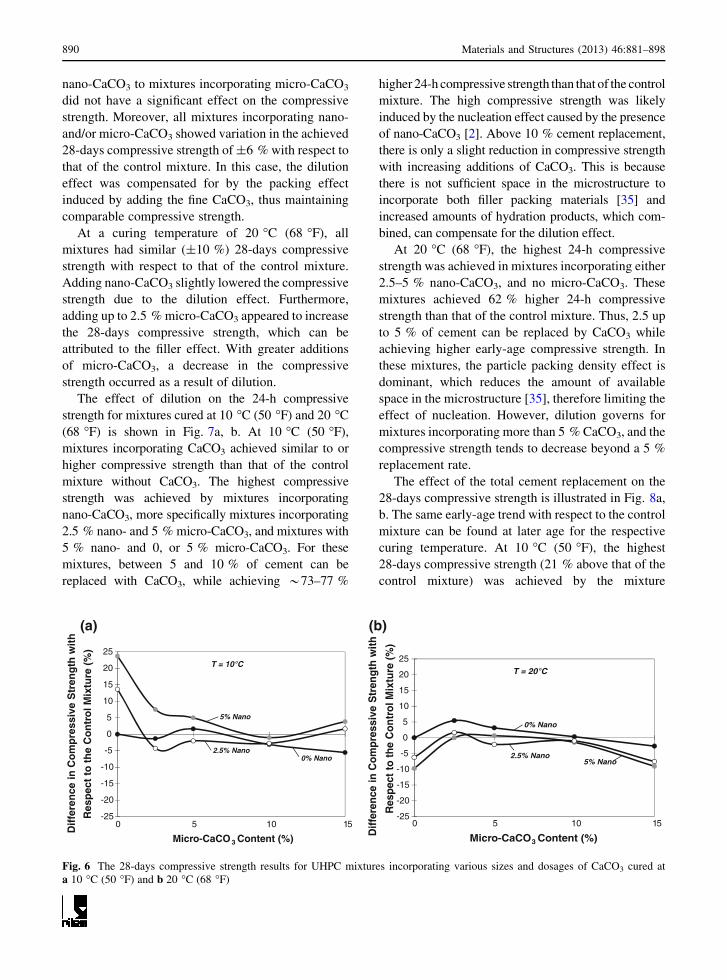
nano-CaCO3 to mixtures incorporating micro-CaCO3
did not have a significant effect on the compressive
strength. Moreover, all mixtures incorporating nano-
and/or micro-CaCO3 showed variation in the achieved
28-days compressive strength of ±6 % with respect to
that of the control mixture. In this case, the dilution
effect was compensated for by the packing effect
induced by adding the fine CaCO3, thus maintaining
comparable compressive strength.
At a curing temperature of 20 �C (68 �F), all
mixtures had similar (±10 %) 28-days compressive
strength with respect to that of the control mixture.
Adding nano-CaCO3 slightly lowered the compressive
strength due to the dilution effect. Furthermore,
adding up to 2.5 % micro-CaCO3 appeared to increase
the 28-days compressive strength, which can be
attributed to the filler effect. With greater additions
of micro-CaCO3, a decrease in the compressive
strength occurred as a result of dilution.
The effect of dilution on the 24-h compressive
strength for mixtures cured at 10 �C (50 �F) and 20 �C
(68 �F) is shown in Fig. 7a, b. At 10 �C (50 �F),
mixtures incorporating CaCO3 achieved similar to or
higher compressive strength than that of the control
mixture without CaCO3. The highest compressive
strength was achieved by mixtures incorporating
nano-CaCO3, more specifically mixtures incorporating
2.5 % nano- and 5 % micro-CaCO3, and mixtures with
5 % nano- and 0, or 5 % micro-CaCO3. For these
mixtures, between 5 and 10 % of cement can be
replaced with CaCO3, while achieving *73–77 %
higher 24-h compressive strength than that of the control
mixture. The high compressive strength was likely
induced by the nucleation effect caused by the presence
of nano-CaCO3 [2]. Above 10 % cement replacement,
there is only a slight reduction in compressive strength
with increasing additions of CaCO3. This is because
there is not sufficient space in the microstructure to
incorporate both filler packing materials [35] and
increased amounts of hydration products, which com-
bined, can compensate for the dilution effect.
At 20 �C (68 �F), the highest 24-h compressive
strength was achieved in mixtures incorporating either
2.5–5 % nano-CaCO3, and no micro-CaCO3. These
mixtures achieved 62 % higher 24-h compressive
strength than that of the control mixture. Thus, 2.5 up
to 5 % of cement can be replaced by CaCO3 while
achieving higher early-age compressive strength. In
these mixtures, the particle packing density effect is
dominant, which reduces the amount of available
space in the microstructure [35], therefore limiting the
effect of nucleation. However, dilution governs for
mixtures incorporating more than 5 % CaCO3, and the
compressive strength tends to decrease beyond a 5 %
replacement rate.
The effect of the total cement replacement on the
28-days compressive strength is illustrated in Fig. 8a,
b. The same early-age trend with respect to the control
mixture can be found at later age for the respective
curing temperature. At 10 �C (50 �F), the highest
28-days compressive strength (21 % above that of the
control mixture) was achieved by the mixture
-25
-20
-15
-10
-5
0
5
10
15
20
25
Dif
fere
nce
in C
om
pre
ssiv
e S
tren
gth
wit
h
Res
pec
t to
th
e C
on
tro
l Mix
ture
(%
)
Micro-CaCO 3 Content (%)
(a)
T = 10°C
0% Nano2.5% Nano
5% Nano
-25
-20
-15
-10
-5
0
5
10
15
20
25
0 5 10 15 0 5 10 15
Diff
eren
ce in
Com
pre
ssiv
e S
tren
gth
with
Res
pec
t to
the
Con
tro
l Mix
ture
(%
)
Micro-CaCO3 Content (%)
(b)
T = 20°C
5% Nano
0% Nano
2.5% Nano
Fig. 6 The 28-days compressive strength results for UHPC mixtures incorporating various sizes and dosages of CaCO3 cured at
a 10 �C (50 �F) and b 20 �C (68 �F)
890 Materials and Structures (2013) 46:881–898
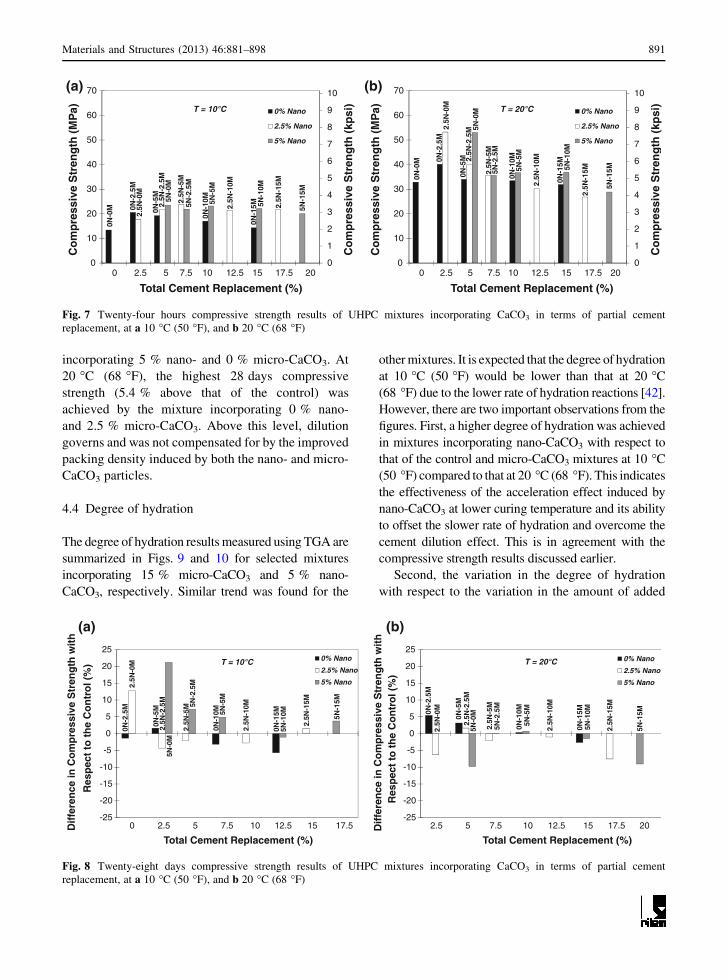
incorporating 5 % nano- and 0 % micro-CaCO3. At
20 �C (68 �F), the highest 28 days compressive
strength (5.4 % above that of the control) was
achieved by the mixture incorporating 0 % nano-
and 2.5 % micro-CaCO3. Above this level, dilution
governs and was not compensated for by the improved
packing density induced by both the nano- and micro-
CaCO3 particles.
4.4 Degree of hydration
The degree of hydration results measured using TGA are
summarized in Figs. 9 and 10 for selected mixtures
incorporating 15 % micro-CaCO3 and 5 % nano-
CaCO3, respectively. Similar trend was found for the
other mixtures. It is expected that the degree of hydration
at 10 �C (50 �F) would be lower than that at 20 �C
(68 �F) due to the lower rate of hydration reactions [42].
However, there are two important observations from the
figures. First, a higher degree of hydration was achieved
in mixtures incorporating nano-CaCO3 with respect to
that of the control and micro-CaCO3 mixtures at 10 �C
(50 �F) compared to that at 20 �C (68 �F). This indicates
the effectiveness of the acceleration effect induced by
nano-CaCO3 at lower curing temperature and its ability
to offset the slower rate of hydration and overcome the
cement dilution effect. This is in agreement with the
compressive strength results discussed earlier.
Second, the variation in the degree of hydration
with respect to the variation in the amount of added
0
1
2
3
4
5
6
7
8
9
10
0
10
20
30
40
50
60
70
Co
mp
ress
ive
Str
eng
th (
kpsi
)
Co
mp
ress
ive
Str
eng
th (
MP
a)
Total Cement Replacement (%)
0% Nano
2.5% Nano
5% Nano
0N-0
M 2.5N
-10M
5N-5
M0N
-10M2.
5N-5
M
5N-0
M2.
5N-2
.5M
0N-5
M
2.5N
-0M
0N-2
.5M
5N-2
.5M
0N-1
5M 5N-1
0M
5N-1
5M
2.5N
-15M
(a)
T = 10°C
0
1
2
3
4
5
6
7
8
9
10
0
10
20
30
40
50
60
70
0 2.5 5 7.5 10 12.5 15 17.5 20 0 2.5 5 7.5 10 12.5 15 17.5 20
Co
mp
ress
ive
Str
eng
th (
kpsi
)
Co
mp
ress
ive
Str
eng
th (
MP
a)
Total Cement Replacement (%)
0% Nano
2.5% Nano
5% Nano
0N-0
M
2.5N
-10M
5N-5
M0N
-10M
2.5N
-5M
5N-0
M2.
5N-2
.5M
0N-5
M
2.5N
-0M
0N-2
.5M
5N-2
.5M
0N-1
5M 5N-1
0M
5N-1
5M
2.5N
-15M
(b)
T = 20°C
Fig. 7 Twenty-four hours compressive strength results of UHPC mixtures incorporating CaCO3 in terms of partial cement
replacement, at a 10 �C (50 �F), and b 20 �C (68 �F)
-25
-20
-15
-10
-5
0
5
10
15
20
25
Dif
fere
nce
in C
om
pre
ssiv
e S
tren
gth
wit
h
Res
pec
t to
th
e C
on
tro
l (%
)
Total Cement Replacement (%)
0% Nano
2.5% Nano
5% Nano
2.5N
-10M
5N-5
M0N
-10M
2.5N
-5M
5N-0
M2.
5N-2
.5M
0N-5
M
2.5N
-0M
0N-2
.5M 5N
-2.5
M
0N-1
5M5N
-10M 5N
-15M
2.5N
-15M
(a)
T = 10°C
-25
-20
-15
-10
-5
0
5
10
15
20
25
0 2.5 5 7.5 10 12.5 15 17.5 2.5 5 7.5 10 12.5 15 17.5 20Dif
fere
nce
in C
om
pre
ssiv
e S
tren
gth
wit
h
Res
pec
t to
th
e C
on
tro
l (%
)
Total Cement Replacement (%)
0% Nano
2.5% Nano
5% Nano
2.5N
-10M
5N-5
M0N
-10M
2.5N
-5M
5N-0
M2.
5N-2
.5M
0N-5
M
2.5N
-0M0N
-2.5
M
5N-2
.5M
0N-1
5M5N
-10M
5N-1
5M
2.5N
-15M
(b)
T = 20°C
Fig. 8 Twenty-eight days compressive strength results of UHPC mixtures incorporating CaCO3 in terms of partial cement
replacement, at a 10 �C (50 �F), and b 20 �C (68 �F)
Materials and Structures (2013) 46:881–898 891
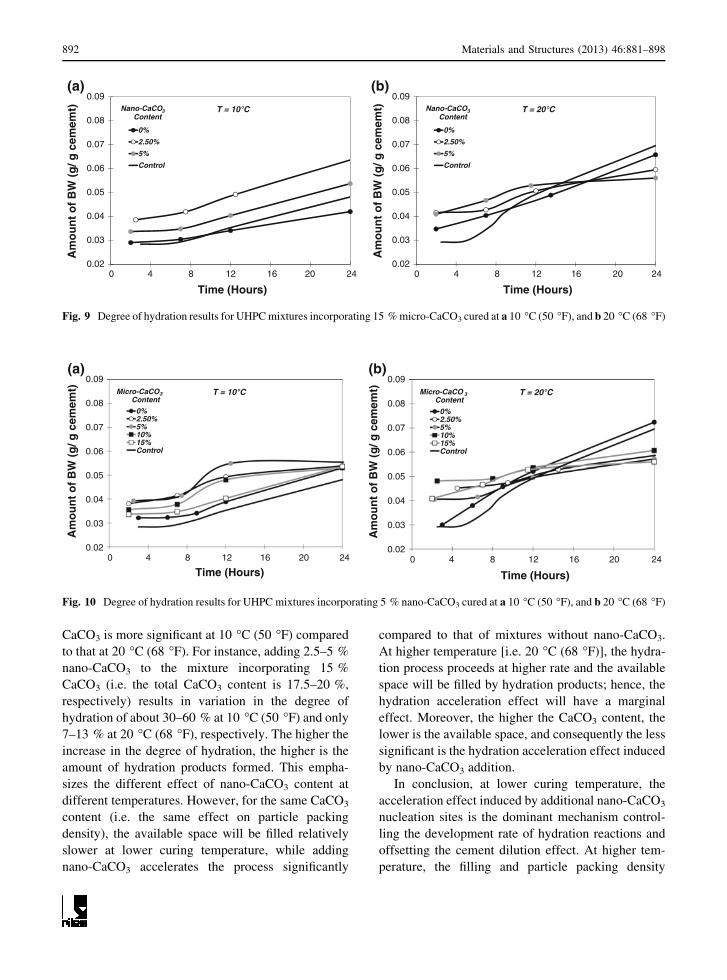
CaCO3 is more significant at 10 �C (50 �F) compared
to that at 20 �C (68 �F). For instance, adding 2.5–5 %
nano-CaCO3 to the mixture incorporating 15 %
CaCO3 (i.e. the total CaCO3 content is 17.5–20 %,
respectively) results in variation in the degree of
hydration of about 30–60 % at 10 �C (50 �F) and only
7–13 % at 20 �C (68 �F), respectively. The higher the
increase in the degree of hydration, the higher is the
amount of hydration products formed. This empha-
sizes the different effect of nano-CaCO3 content at
different temperatures. However, for the same CaCO3
content (i.e. the same effect on particle packing
density), the available space will be filled relatively
slower at lower curing temperature, while adding
nano-CaCO3 accelerates the process significantly
compared to that of mixtures without nano-CaCO3.
At higher temperature [i.e. 20 �C (68 �F)], the hydra-
tion process proceeds at higher rate and the available
space will be filled by hydration products; hence, the
hydration acceleration effect will have a marginal
effect. Moreover, the higher the CaCO3 content, the
lower is the available space, and consequently the less
significant is the hydration acceleration effect induced
by nano-CaCO3 addition.
In conclusion, at lower curing temperature, the
acceleration effect induced by additional nano-CaCO3
nucleation sites is the dominant mechanism control-
ling the development rate of hydration reactions and
offsetting the cement dilution effect. At higher tem-
perature, the filling and particle packing density
0.02
0.03
0.04
0.05
0.06
0.07
0.08
0.09
Am
ou
nt
of
BW
(g
/ g c
emem
t)
Time (Hours)
0%
2.50%
5%
Control
Nano-CaCO3Content
(a)
T = 10°C
0.02
0.03
0.04
0.05
0.06
0.07
0.08
0.09
0 4 8 12 16 20 24 0 4 8 12 16 20 24
Am
ou
nt
of
BW
(g
/ g c
emem
t)
Time (Hours)
0%
2.50%
5%
Control
Nano-CaCO3Content
(b)
T = 20°C
Fig. 9 Degree of hydration results for UHPC mixtures incorporating 15 % micro-CaCO3 cured at a 10 �C (50 �F), and b 20 �C (68 �F)
0.02
0.03
0.04
0.05
0.06
0.07
0.08
0.09
Am
ou
nt
of
BW
(g
/ g c
emem
t)
Time (Hours)
0%2.50%5%10%15%Control
Micro-CaCO3Content
(a)
T = 10°C
0.02
0.03
0.04
0.05
0.06
0.07
0.08
0.09
0 4 8 12 16 20 24 0 4 8 12 16 20 24
Am
ou
nt
of
BW
(g
/ g c
emem
t)
Time (Hours)
0%2.50%5%10%15%Control
Micro-CaCO 3Content
(b)
T = 20°C
Fig. 10 Degree of hydration results for UHPC mixtures incorporating 5 % nano-CaCO3 cured at a 10 �C (50 �F), and b 20 �C (68 �F)
892 Materials and Structures (2013) 46:881–898

mechanism is dominant, densifying the microstructure
and leading to higher compressive strength with
relatively lower hydration products formed.
4.5 Heat of hydration
The heat of hydration results for UHPC mixtures
containing 5 % nano-CaCO3 are shown in Fig. 11.
The heat of hydration peaks shifted to the left when
nano-CaCO3 was incorporated into mixtures at con-
stant micro-CaCO3 content, indicating an acceleration
of hydration reactions. This is mainly due to the
nucleation effect [2], which supports the early-age
compressive strength results discussed earlier. For
mixtures with a constant nano-CaCO3 content, incor-
porating micro-CaCO3 resulted in temperature peaks
that were shifted downwards, and at times slightly to
the right, relative to mixtures with only nano-CaCO3.
This trend signifies that the micro-CaCO3 particles act
as a filling material, and do not contribute significantly
to the hydration process [2]. Therefore, the downward
shift is apparently due to the dilution effect. The
outcome of this trend can be observed in the setting
time results since micro-CaCO3 had little effect, and if
any, a slight increase in the setting time compared to
mixtures with only nano-CaCO3.
4.6 Drying shrinkage
Up to 7-days, generally adding nano-CaCO3 to UHPC
mixtures at constant micro-CaCO3 cured at 10 �C
(50 �F) resulted in decreased shrinkage and similar
mass loss compared to that of mixtures with only micro-
CaCO3. For instance at 7 days, in mixtures with 15 %
micro-CaCO3, increasing the nano-CaCO3 content
from 0 to 5 % resulted in 18 % lower shrinkage and
3 % lower mass loss (Fig. 12). The presence of ultrafine
CaCO3 particles releases entrapped water [27, 28],
which is then incorporated into the hydration process to
produce more hydration products. At that low level of
w/c, this free water increases the internal relative
humidity, leading to lower capillary stresses according
to Kelvin’s law [44], and consequently reducing the
amount of autogenous shrinkage [45]. Furthermore, the
nano-particles accelerate the hydration process through
inducing the nucleation effect, leading to faster devel-
opment of internal microstructure, which acts as an
internal restraint against shrinkage [46]. Therefore, the
reduction in shrinkage strains can be attributed to the
lower autogenous shrinkage and the presence of an
internal restraint mechanism. Although higher amounts
of free water are expected in mixtures with larger
quantities of fine particles, the mass loss remained
similar due to water being incorporated into the
hydration products. In addition, the accelerated hydra-
tion process allows for faster depercolation of capillary
pores compared to that of mixtures with only micro-
CaCO3, which lowers the amount of evaporable water.
At 20 �C (68 �F), adding nano-CaCO3 to UHPC
mixtures incorporating micro-CaCO3 resulted in higher
shrinkage strains compared to that of mixtures with
only micro-CaCO3. Figure 13 illustrates the drying
shrinkage and mass loss for mixtures incorporating
15 % micro-CaCO3 cured at 20 �C (68 �F). At 7-days,
mixtures with 15 % micro-CaCO3 incorporating either
2.5 or 5 % nano-CaCO3 exhibited 27 and 13 % higher
shrinkage, respectively, than that of mixtures without
nano-CaCO3. At the warmer temperature of 20 �C
(68 �F), mixtures containing up to 2.5 % nano-CaCO3
experienced slightly accelerated hydration induced by
the nucleation effect, resulting in higher amounts of
autogenous shrinkage. Furthermore, mixtures contain-
ing more than 2.5 % nano-CaCO3 had reduced amount
of space for hydration products to form, limiting the
accelerating effect, and causing the remainder of the
nano-CaCO3 to act as an inert filler, restraining further
shrinkage by creating a denser microstructure. Mixtures
with 15 % micro-CaCO3 experienced a slight, if any,
increase in the mass loss due to slightly more free water
evaporating [46], since less water has been combined
into the hydration process due to the limited space in the
microstructure.
0
8
16
24
32
40
48
56
64
0
2
4
6
8
10
12
14
16
18
20
0 4 8 12 16 20 24
Tem
per
atu
re (
°F)
Tem
per
atu
re (
°C)
Time (Hours)
Control
15% Micro
10%Micro
5% Micro
2.5%Micro
0%Micro
Fig. 11 Heat of hydration results for UHPC mixtures incorpo-
rating 5 % nano-CaCO3 and various dosages of micro-CaCO3
Materials and Structures (2013) 46:881–898 893

Mixtures incorporating various dosages of micro-
CaCO3 with a constant nano-CaCO3 content cured at
10 �C (50 �F) had reduced shrinkage strains and
generally higher mass loss compared to that of
mixtures with only nano-CaCO3 (Fig. 14). For
instance at 7-days, the shrinkage decreased by 23 %,
and the mass loss increased by 6.6 % for the mixture
with 2.5 % nano- and 15 % micro-CaCO3 compared
to that of the mixture containing only 2.5 % nano-
CaCO3. The addition of micro-CaCO3 released some
entrapped water, leading to higher evaporation levels
as indicated by the results. Higher dilution levels can
account for the lower shrinkage rates [47], as less
autogenous shrinkage is expected.
At a curing temperature of 20 �C (68 �F), adding
micro-CaCO3 to mixtures incorporating a constant
level of nano-CaCO3 resulted in increased shrinkage
and higher mass loss with respect to the mixtures with
only nano-CaCO3 (Fig. 15). Furthermore, increasing
the amount of micro-CaCO3 from 2.5 to 15 % resulted
in no change in shrinkage, but greater mass loss. For
instance at 7 days, mixtures incorporating 2.5 %
nano-CaCO3 resulted in 4 % lower shrinkage and
15 % higher mass loss when increasing the amount of
micro-CaCO3 in the mixture from 5 to 15 %. With
greater quantities of fine particles, more entrapped
water is released [27, 28]. Since micro-CaCO3 does
not affect the hydration process, higher evaporation
results are expected, which leads to higher drying
shrinkage [46].
Seven days drying shrinkage and mass loss results
for mixtures cured at 10 �C (50 �F) are presented in
Fig. 16. All mixtures incorporating CaCO3 exhibited
similar or lower shrinkage strains compared to that of
the control mixture without CaCO3. The smallest
amount of shrinkage was found in the mixture
-800
-700
-600
-500
-400
-300
-200
-100
0
Sh
rin
kag
e (µ
εε)Time (Days)
0%
2.50%
5%
Control
Nano-CaCO3Content
(a)
-3
-2.5
-2
-1.5
-1
-0.5
00 1 2 3 4 5 6 7 0 1 2 3 4 5 6 7
Mas
s L
oss
(%
)
Time (Days)
0%
2.50%
5%
Control
Nano-CaCO3Content
(b)
Fig. 12 a Drying shrinkage, and b mass loss results for UHPC mixtures incorporating 15 % micro-CaCO3, cured at 10 �C (50 �F)
-800
-700
-600
-500
-400
-300
-200
-100
0
Sh
rin
kag
e (µ
εε)
Time (Days)
0%
2.50%
5%
Control
Nano-CaCO3Content
(a)
-3
-2.5
-2
-1.5
-1
-0.5
00 1 2 3 4 5 6 7 0 1 2 3 4 5 6 7
Mas
s L
oss
(%
)
Time (Days)
0%
2.50%
5%
Control
Nano-CaCO3Content
(b)
Fig. 13 a Drying shrinkage, and b mass loss results for UHPC mixtures incorporating 15 % micro-CaCO3, cured at 20 �C (68 �F)
894 Materials and Structures (2013) 46:881–898

incorporating 2.5 % nano- and 5 % micro-CaCO3. For
this mixture, the reduction in shrinkage was 35 %
compared to that of the control mixture. Above this
cement replacement value, higher shrinkage rates can
be attributed to more free water available for evapo-
ration, therefore leading to higher mass loss.
Figure 17 illustrates the effect of the total cement
replacement on the 7 days drying shrinkage and mass
loss of mixtures cured at 20 �C (68 �F). Similar to
mixtures cured at 10 �C (50 �F), all mixtures incor-
porating CaCO3 exhibited less shrinkage compared to
that of the control mixture. Three mixtures tied for the
smallest amount of shrinkage: 2.5 % nano- and 0 %
micro-CaCO3, 0 % nano- and 10 % micro-CaCO3,
and 0 % nano-15 % micro-CaCO3, with *31–34 %
decrease in shrinkage compared to that of the control
mixture. Apparently, it is possible to replace up to
15 % of cement with micro-CaCO3, and achieve
similar shrinkage results to that when replacing 2.5 %
of cement with nano-CaCO3.
5 Conclusions
This study investigated the effects of incorporating
micro- and nano-CaCO3, both individually and com-
bined, as partial replacement for cement on the early-
age properties and compressive strength of UHPC.
Mixtures were tested at both simulated cold [10 �C
(50 �F)] and normal [20 �C (68 �F)] conditions. From
the experiments conducted with the materials used in
this study, it can be concluded that:
-800
-700
-600
-500
-400
-300
-200
-100
0
Sh
rin
kag
e (µ
εε)Time (Days)
0%2.50%5%10%15%Control
Micro-CaCO3Content
(a)
-3
-2.5
-2
-1.5
-1
-0.5
00 1 2 3 4 5 6 7 0 1 2 3 4 5 6 7
Mas
s L
oss
(%
)
Time (Days)
0%2.50%5%10%15%Control
Micro-CaCO3Content
(b)
Fig. 14 a Drying shrinkage, and b mass loss results for UHPC mixtures incorporating 2.5 % nano-CaCO3, cured at 10 �C (50 �F)
-800
-700
-600
-500
-400
-300
-200
-100
0
Sh
rin
kag
e (µ
εε)
Time (Days)
0%2.50%5%10%15%Control
Micro-CaCO3Content
(a)
-3
-2.5
-2
-1.5
-1
-0.5
00 1 2 3 4 5 6 7 0 1 2 3 4 5 6 7
Mas
s L
oss
(%
)
Time (Days)
0%2.50%5%10%15%Control
Micro-CaCO3Content
(b)
Fig. 15 a Drying shrinkage, and b mass loss results for UHPC mixtures incorporating 2.5 % nano-CaCO3, cured at 20 �C (68 �F)
Materials and Structures (2013) 46:881–898 895

1. Incorporating micro and/or nano-CaCO3 resulted in
higher flowability of UHPC mixtures compared to
that of the control mixture. Increasing the cement
replacement level led to more flowable mixtures.
2. Incorporating both nano- and micro-CaCO3 into
cement reduced the setting time significantly,
regardless of the curing temperature. Mixtures
consisting of 5 % nano-CaCO3 and 0–15 %
micro-CaCO3 achieved the shortest setting times,
at both 10 �C (50 �F) and 20 �C (68 �F).
3. At 10 �C (50 �F), densifying the microstructure
through enhanced particle packing density, and the
more rapid growth of hydration products induced
by nano-CaCO3 through additional nucleation
sites were the main contributors to the improved
early-age compressive strength. The highest 24-h
compressive strength was achieved by partially
replacing cement with 2.5 % nano- and 5 %
micro-CaCO3, and 5 % nano- and 0 %, or 5 %
micro-CaCO3. The highest 28-days compressive
strength occurred in the mixture incorporating
5 % nano- and 0 % micro-CaCO3.
4. At 20 �C (68 �F), densifying the microstructure
through enhanced particle packing density was
the main contributor to the comparable to or
higher early-age compressive strength than that of
the control mixture. The lack of available space for
hydration products to form limited the accelerated
hydration induced by the presence of nano-
CaCO3. The highest 24-h compressive strength
was achieved by replacing cement with 2.5 or 5 %
nano- and 0 % micro-CaCO3. The highest 28-days
compressive strength was achieved in the mixture
incorporating 0 % nano- and 2.5 % micro-CaCO3.
5. At 10 �C (50 �F), partially replacing cement with
2.5 % nano- and 5 % micro-CaCO3 achieved the
-800
-700
-600
-500
-400
-300
Sh
rin
kag
e (µ
εε)Total Cement Replacement (%)
0% Nano 2.5% Nano 5% Nano2.
5N-1
0M
5N-5
M0N
-10M
2.5N
-5M
5N-0
M2.
5N-2
.5M
0N-5
M
2.5N
-0M0N
-2.5
M
5N-2
.5M
0N-1
5M5N
-10M
5N-1
5M
2.5N
-15M
(a)
0N-0
M
-3
-2.5
-2
-1.5
-10 2.5 5 7.5 10 12.5 15 17.5 20 0 2.5 5 7.5 10 12.5 15 17.5 20
Mas
s L
oss
(%
)
Total Cement Replacement (%)
0% Nano 2.5% Nano 5% Nano
2.5N
-10M
5N-5
M0N
-10M2.5N
-5M
5N-0
M2.5N
-2.5
M0N
-5M2.5N
-0M
0N-2
.5M
5N-2
.5M
0N-1
5M5N
-10M
5N-1
5M
2.5N
-15M
(b)
0N-0
M
Fig. 16 Results for 7 days a drying shrinkage, and b mass loss, in terms of partial cement replacement, cured at 10 �C (50 �F)
-800
-700
-600
-500
-400
-300
Sh
rin
kag
e (µ
εε)
Total Cement Replacement (%)
0% Nano 2.5% Nano 5% Nano
0N-0
M
2.5N
-10M
5N-5
M0N
-10M
2.5N
-5M
5N-0
M2.
5N-2
.5M
0N-5
M
2.5N
-0M
0N-2
.5M
5N-2
.5M
0N-1
5M5N
-10M 5N
-15M
2.5N
-15M
(a)
-3
-2.5
-2
-1.5
-10 2.5 5 7.5 10 12.5 15 17.5 20 0 2.5 5 7.5 10 12.5 15 17.5 20
Mas
s L
oss
(%
)
Total Cement Replacement (%)
0% Nano 2.5% Nano 5% Nano
0N-0
M
2.5N
-10M
5N-5
M0N
-10M
2.5N
-5M
5N-0
M2.
5N-2
.5M
0N-5
M
2.5N
-0M
0N-2
.5M
5N-2
.5M
0N-1
5M5N
-10M
5N-1
5M
2.5N
-15M
(b)
Fig. 17 Results for 7 days a drying shrinkage, and b mass loss, in terms of partial cement replacement, cured at 20 �C (68 �F)
896 Materials and Structures (2013) 46:881–898

smallest amount of shrinkage at 7-days. At 20 �C
(68 �F), the smallest shrinkage strains were
measured in mixtures incorporating 2.5 % nano-
and 0 % micro-CaCO3, and 0 % nano- and 10 or
15 % micro-CaCO3.
6. Through the combination of nano- and micro-
CaCO3, cementitious materials can have the benefits
of accelerated early-age hydration and enhanced
particle-packing density, while achieving similar, if
not enhanced mechanical properties compared to
that of the control mixture without CaCO3.
References
1. Meyer C (2009) The greening of the concrete industry.
Cement Concr Compos 31(8):601–605
2. Sato T (2006) Applications of nanotechnology for the sus-
tainable development of cement-based materials, PhD
Thesis, University of Ottawa, 171 p
3. Myers R (2007) Calcium carbonate, 100 most important
chemical compounds: a reference guide. Greenwood Press,
Westport, pp 59–61
4. Pera J, Husson S, Guilhot B (1999) Influence of finely
ground limestone on cement hydration. Cement Concr
Compos 21(2):99–105
5. Granger S, Loukili A, Pijaudier-Cabot G, Chanvillard G
(2005) Mechanical characterization of self-healing effect of
cracks in Ultra High Performance Concrete (UHPC) In:
Proceedings of 3rd international conference on construction
materials, performance, innovations and structural impli-
cations, Vancouver, August 22–24
6. Soliman AM, Nehdi ML (2011) Effect of drying conditions
on autogenous shrinkage in ultra-high performance concrete
at early-age. Mater Struct 44(5):879–899
7. Bentz D (2005) Replacement of ‘coarse’ cement particles by
inert fillers in low w/c ratio concretes: II. Experimental
validation. Cem Concr Res 35(1):185–188
8. Thomas M, Hooton D, Cail K, Smith B, De Wal J, Kazanis
K (2010) Field trials of concrete produced with Portland
limestone cement. Concr Int 32(1):35–41
9. Balaguru PN (2005) Nanotechnology and concrete: Back-
ground, opportunities and challenges. In: Proceedings of
international conference on applications of nanotechnology
in concrete design, Thomas Telford Services Ltd., Scotland,
pp 113–122
10. Nazari A, Riahi S (2010) Micro-structural, thermal, physical
and mechanical behavior of the self-compacting concrete
containing SiO2 nano-particles. Mater Sci Eng A 527(29–30):
7663–7672
11. Nazari A, Riahi S (2010) The effect of TiO2 nano-particles
on water permeability and thermal and mechanical proper-
ties of high strength self-compacting concrete. Mater Sci
Eng A 528(2):756–763
12. Nazari A, Riahi S (2011) Improvement of compressive
strength of cementitious composites in different curing
media by Al2O3 nano-particles. Mater Sci Eng A 528(3):
1183–1191
13. Jo B, Kim C, Tae G, Park J (2007) Characteristics of cement
mortar with nano-SiO2 particles. Constr Build Mater
21(6):1351–1355
14. Sato T, and Beaudoin JJ (2006) The effect of nano-sized
CaCO3 addition on hydration of OPC containing high vol-
umes of ground granulated blast-furnace slag. In: Proceed-
ings of the 2nd International RILEM symposium on
advances in concrete through science and engineering,
Quebec City, pp 355–366
15. Paolini M, Khurana R (1998) Admixtures for recycling of
waste concrete. Cement Concr Compos 20(2–3):221–229
16. Sato K, Li J, Kamiya H, Ishigaki T (2008) Ultrasonic dis-
persion of TiO2 nanoparticles in aqueous Suspension. J Am
Ceram Soc 91(8):2481–2487
17. Bentz DP, Sato T, De la Varga I, and Weiss J (2011) Fine
limestone additions to regulate setting in high volume fly
ash mixtures. Date retrieved August 3. http://concrete.nist.
gov/*bentz/Finelimestoneadditions061011.pdf[18. Ma J, Orgass M, Dehn F, Schmidt D, and Tue NV (2004)
Comparative investigations on ultra-high performance
concrete with and without coarse aggregates. In: Proceed-
ings of international symposium on ultra high performance
concrete, Germany, pp 205–212
19. Holschemacher K, Dehn F, Klotz S, and Weiße D (2005)
Experimental investigation on ultra high-strength concrete
under concentrated loading. In: Proceedings of 7th interna-
tional symposium on utilization of high-strength/high per-
formance concrete, vol 2, Washington DC, pp 1145–1158
20. ASTM C 1437-7 (2007) Standard specification for flow of
hydraulic cement mortar. American Society for Testing and
Materials, Philadelphia, 2 p
21. ASTM C191-08 (2008) Standard test method for time of
setting of hydraulic cement by Vicat needle. American
Society for Testing and Materials, Philadelphia, 8 p
22. Loukili A, Khelidj A, Richard P (1999) Hydration kinetics,
change of relative humidity, and autogenous shrinkage
of ultra-high-strength concrete. Cem Concr Res 29(4):
577–584
23. Mounanga P, Khelidj A, Loukili A, Baroghel-Bouny V
(2004) Predicting Ca(OH)2 content and chemical shrinkage
of hydrating cement pastes using analytical approach. Cem
Concr Res 34(2):255–265
24. ASTM C 157/157M-08 (2008) Standard test method for
length change of hardened hydraulic-cement mortar and
concrete. American Society for Testing and Materials,
Philadelphia, 7 p
25. Pane I, Hansen W (2005) Investigation of blended cement
hydration by isothermal calorimetry and thermal analysis.
Cem Concr Res 35(6):1155–1164
26. Jensen OM, Hansen PF (1995) A dilatometer for measuring
autogenous deformation in hardening Portland cement
paste. Mater Struct 28(181):406–409
27. Elkhadiri I, Diouri A, Boukhari A, Aride J, Puertas F (2002)
Mechanical behavior of various mortars made by combined
fly ash and limestone in Moroccan Portland cement. Cem
Concr Res 32(10):1597–1603
28. Esping O (2008) Effect of limestone filler BET(H2O)-area
on the fresh and hardened properties of self-compacting
concrete. Cem Concr Res 38(7):938–944
Materials and Structures (2013) 46:881–898 897

29. Liu X, Chen L, Liu A, Wang X (2012) Effect of nano-
CaCO3 on properties of cement paste. Energy Procedia
16(Part B):991–996
30. Liu XY, Wang XR, Liu AH, Chen L (2012) Study on the
mechanical properties of cement modified by nanoparticles.
Appl Mech Mater 157–158:161–164
31. Nehdi M, Soliman A (2011) Early-age properties of con-
crete: overview of fundamental concepts and state-of-the-
art research. ICE Constr Mater 164(2):57–77
32. Schindler AK (2004) Effect of temperature on hydration of
cementitious materials. ACI Mater J 101(1):72–81
33. Mark JM, Chan GW (2009) Growth of cement hydration
products on single-walled carbon nanotubes. J Am Ceram
Soc 92(6):1303–1310
34. Lea FM, (1998) Lea’s chemistry of cement and concrete 4th
(edn). Hewlett PC (Ed), Wiley, New York, 1053 p
35. Bonavetti V, Donza H, Menendez G, Cabrera O, Irassar EF
(2003) Limestone filler cement in low w/c concrete: a
rational use of energy. Cem Concr Res 33(6):865–871
36. Bentz DP, Peltz MA, Winpigler J (2009) Early-age prop-
erties of cement-based materials: II. Influence of water-to-
cement ratio. ASCE J Mater Civil Eng 21(9):512–517
37. Opoczky L (1992) Progress of the particle size distribution
during the intergrinding of a clinker-limestone mixture.
Zement-Kalk-Gips 45(12):648–651
38. Shihada S, Arafa M (2010) Effects of silica fume, ultrafine
and mixing sequences on properties of ultra-high perfor-
mance concrete. Asian J Mater Sci 2(3):137–146
39. Tafraoui A, Escadeillas G, Lebaili S, Vidal T (2009)
Metakolin in the formulation of UHPC. Constr Build Mater
23(2):669–674
40. Soroka I, Setter N (1977) The effect of fillers on strength of
cement mortars. Cem Concr Res 7(4):449–456
41. Xu QL, Meng T, Huang MZ (2011) Effects of nano-CaCO3
on the compressive strength and microstructure of high
strength concrete in different curing temperature. Appl
Mech Mater 121–126:126–131
42. Amen DKH (2011) Degree of hydration and strength
development of low water-to-cement ratios in silica fume
cement system. Int J Civil Environ Eng 11(5):10–16
43. Wang Y, Wang W, Guan X (2011) Physical filling effects of
limestone powders with different particle size. Adv Mater
Res 163–167:1419–1424
44. Coussy O, Dangla P, Lassabatere T, Baroghel-Bouny V (2004)
The equivalent pore pressure and the swelling and shrinkage of
cement-based materials. Mater Struct 37(1):15–20
45. Holt E (2005) Contribution of mixture design to chemical
and autogenous shrinkage of concrete at early ages. Cem
Concr Res 35(3):464–472
46. Bucher B (2009) Shrinkage and shrinkage cracking behav-
ior of cement systems containing ground limestone, fly ash,
and lightweight synthetic particles. M.Sc Thesis, Purdue
University, 190 p
47. Soliman A (2011) Early-age shrinkage of ultra high-per-
formance concrete: mitigation and compensating mecha-
nisms, PhD Thesis, University of Western Ontario, 382 p
898 Materials and Structures (2013) 46:881–898


