doi: 10.20964/110496
Int. J. Electrochem. Sci., 11 (2016) 3908 - 3920
International Journal of
ELECTROCHEMICAL SCIENCE
www.electrochemsci.org
Effect of Short Term Aging on Microstructure Evolution,
Pitting and Intergranular Corrosion Behaviour of UNS31254
Yipeng Liu1, Ning Zhong
2, YangTing Sun
1, Yiming Jiang
1,*
1 Department of Materials Science of Fudan University, Shanghai, PR China
2 Institute of Marine Materials Science and Engineering of Shanghai Maritime University, Shanghai,
PR China *E-mail: [email protected]
Received: 24 February 2016 / Accepted: 19 March 2016 / Published: 1 April 2016
Here the intergranular and pitting corrosion resistance of super austenitic stainless steel Type
UNS31254 was investigated, whose performance declined obviously after aging at 900 °C for short
terms. Test methods including the nitric acid immersion test and the potentiostatic pulse technique
(PPT) were applied respectively, and the results showed that the samples were highly sensitive to those
two types of localized corrosion after aging within 180 minutes. Then the segregation between the
interior and boundaries of grains eased while the general corrosion became dominated. The
transmission electron microscope (TEM) further revealed molybdenum-rich Laves-related phases
formed along the boundaries for only 10 minutes and they were the main culprit for the degradation.
Finally, to offer guidance for the process of UNS31254, the welding joints were also checked and the
evaluation method of pitting corrosion was discussed.
Keywords: Super Austenitic Stainless steel; Pitting corrosion; Precipitation; Potentiostatic Pulse
Technique
1. INTRODUCTION
Compared with ordinary austenitic stainless such as 300-series, super austenitic stainless steel
(SASS) Type UNS31254 has drawn much more attention because of providing an excellent
combination of mechanical properties and corrosion resistance within a wide temperature range [1].
UNS31254 exhibits outstanding impact toughness and high strength, and also offers high resistance to
localized corrosion due to its high level of nickel and molybdenum contents. Therefore, it has been
widely used as structural materials in several marine applications such as piping and heat exchangers,
which handle seawater containing Cl- [2-7]. It has also been extensively used in other aggressive media
Int. J. Electrochem. Sci., Vol. 11, 2016
3909
for making some critical components like tubulars in petroleum industry, chemical and power industry
[8-12]. Besides, since UNS31254 is a technically adequate substitute for nickel-based alloys in several
conditions [13], it is more economical environmentally friendly. However, detrimental secondary
phases can be rapidly formed at evaluated temperatures for high alloy UNS31254, which consequently
deteriorate both mechanical properties and corrosion resistance. So attention must be paid to avoid
forming damaging amounts of these phases during operations such as annealing, welding or explosion
cladding.
In previous studies, some basic parameters of Type UNS31254 localized corrosion resistance in
chloride contained solutions have gained, like critical pitting and crevice temperature of the matrix [4,
11, 14-17], simulating the seawater environment of its application. Recently, researches have been
done to understand its precipitation behaviour and mechanical performance after long-term aging. The
stable σ phase is deemed as the dominant intermetallic phase under the treatment with temperature
higher than 850 °C [18], and its existence contributes to the decline of toughness [19, 20]. Other
typical ones such as χ and Laves-type phases have been found as well, and the conclusions
demonstrate that these metastable phases form at lower temperature and could finally transform into σ
phase [18, 21, 22]. All these phases result in an increase of both yield stress and ultimate tensile stress.
Nevertheless, most of the existing work has analysed its pitting and intergranular corrosion behaviour
or microstructure evolution separately and little research has been devoted to associate them together,
especially the results after short term aging.
Hence, the objective of present work attempts to investigate the negative effects that the
precipitations bring to the intergranular and pitting corrosion resistance of UNS31254 at 900°C, the
most sensitive temperature of its time-temperature-precipitation curves. Besides the traditional test
methods, the potentiostatic pulse technique (PPT) is also introduced in the present work to detect the
weak point of passive film and the precipitation sites. This technique has been widely used in the
investigation of organic coating failure [23, 24], and here aims to induce the formation of stable pits at
the certain sites, where secondary phases form and the passive film becomes discontinuous[25, 26].
Based on the identification of these phases, the relation between precipitation behaviour and corrosion
resistance is clear, further providing guidance for the application or production of UNS31254.
2. EXPERIMENTAL PROCEDURES
2.1. Specimens and heat treatment
The investigated material was a commercial SASS plate (approximately 5mm thickness) of
type UNS31254, whose composition was shown in Table1. The plate was cut into 20mm × 30mm
specimens for the immersion test and 12mm × 12 mm for critical pitting temperature (CPT) tests. Then
the as received specimens were submitted to heat treatment at 900 °C for different timings (10, 30, 60,
90, 180 and 360 minutes). The Gleeble3800 Thermal Simulator was also applied to simulate the
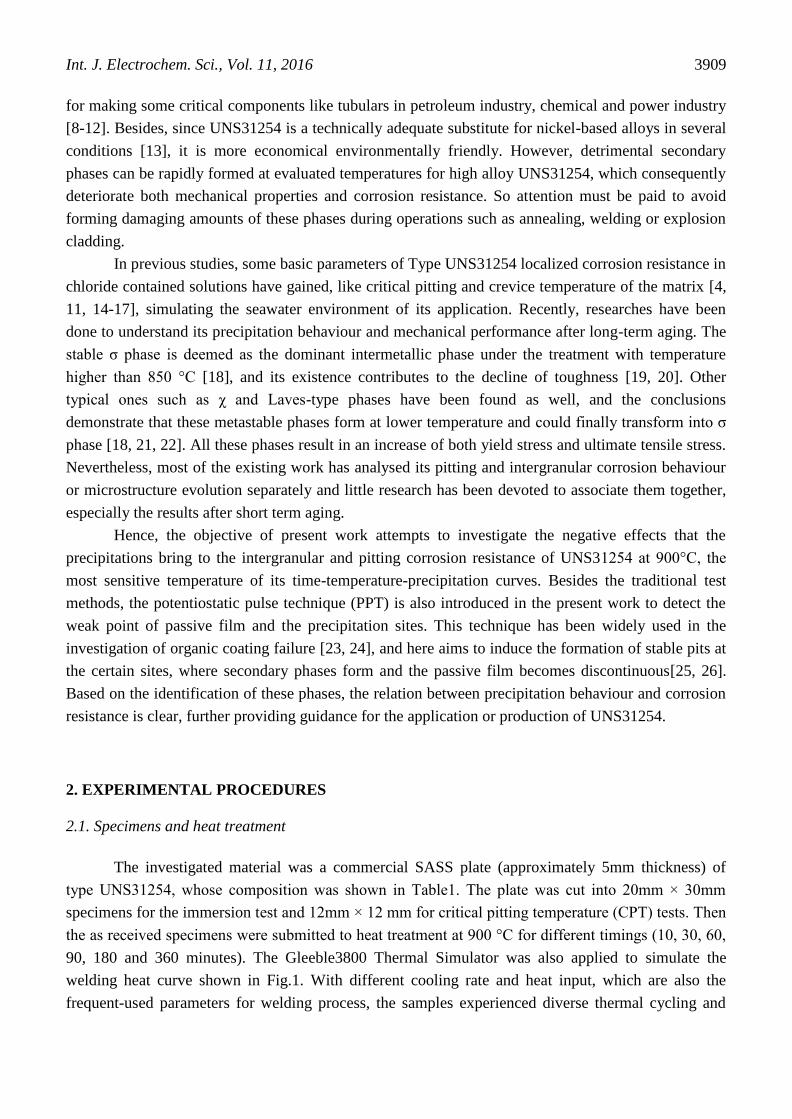
welding heat curve shown in Fig.1. With different cooling rate and heat input, which are also the
frequent-used parameters for welding process, the samples experienced diverse thermal cycling and
Int. J. Electrochem. Sci., Vol. 11, 2016
3910
passed through the sensitive temperature range briefly. Next, the specimens for electrochemical tests
were embedded in epoxy resin and grounded mechanically from 180 to 2000 grit. They were
subsequently polished with diamond pastes of 2.5μm and 1.5μm granulation, then remained the
exposure area of 1cm2 after degreased with ethanol and blow-dried.
Figure 1. The welding heat curves for simulation.
Table 1 The chemical compositions of UNS31254 (wt %).
C Cr Ni Mo N Cu S P Si Mn Fe
<0.020 19.5 17.5 6.0 0.18 0.5 <0.01 <0.03 <0.8 <1.0 Bal.
2.2. Localized corrosion tests
2.2.1 Intergranular corrosion test
The boiling 65wt% nitric acid solution was selected for testing susceptibility of intergranular
corrosion, which offered a potential near the transpassivation region of Tafel polarization curve. This
test could detect the low-chromium zone and dissolve molybdenum-rich phases combining with the
weight loss. Referring to the standard ASTM A262-C [27], the test was divided into two periods. Each
of them lasted 48 hours and the solution was renewed every period keeping the same samples on test.
2.2.2 Pitting corrosion test
All other electrochemical tests were conducted with an electrochemical workstation
PARSTAT2273, using the three electrodes cell. The samples were used as the working electrode, a
saturated calomel electrode (SCE) was served as the reference electrode and a platinum foil was the
counter one. The stable pitting behaviour was investigated through the critical pitting temperature
(CPT) test in 3 mol/L NaCl aqueous solution, which is aggressive enough to accelerate the pitting
process. By raising the temperature by 1 °C per minute at a constant potential of +700 mV (vs. SCE),
Int. J. Electrochem. Sci., Vol. 11, 2016
3911
the value was defined as the temperature when the current increased irreversibly. All the CPT values
obtained through this fast method were the average values after repeating for at least three times.
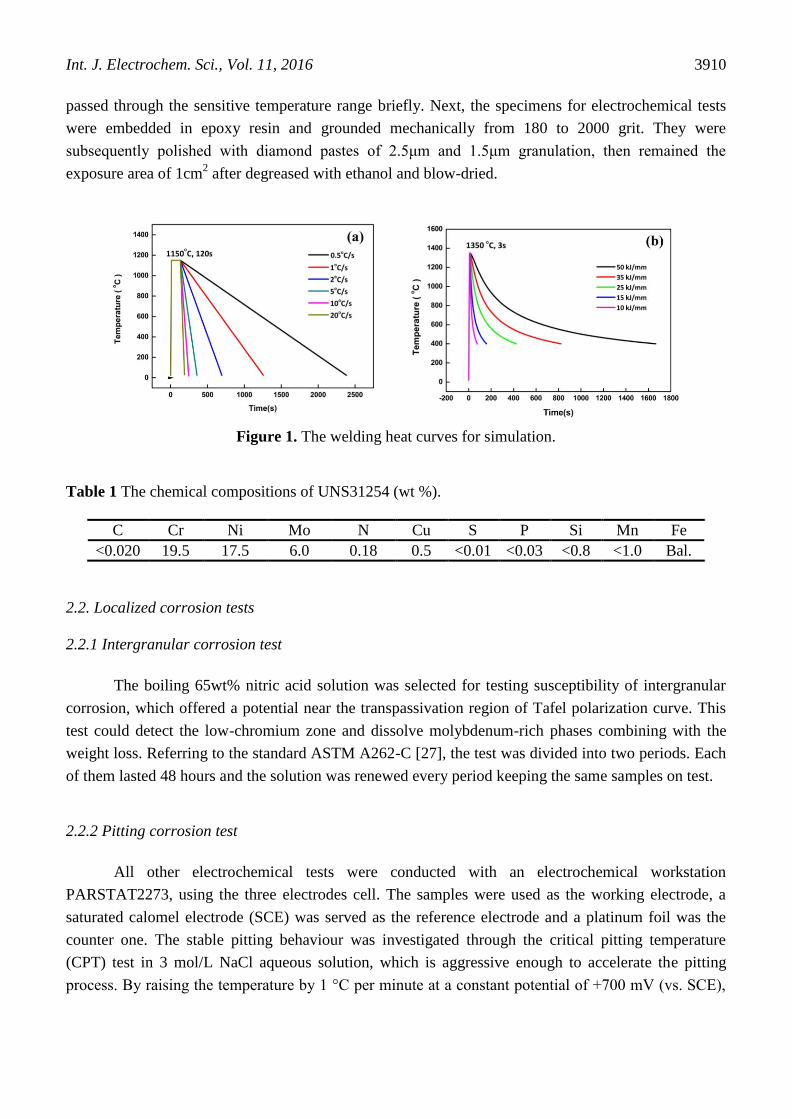
The pitting behaviour was also detected through the PPT in the same solution. The typical
schematic diagram of PPT was showed in Fig.2, illustrating the square-wave potentiostatic pulse and
its corresponding current-time curve. It could be found out that sometimes the current not recovered as
the applied polarization potential dropping (marked with dot oval), which indicated that the pitting
occurs randomly. For optimizing the parameters of this test, the Tafel polarization curves were
measured in advance at the CPT of each sample separately, with a scan rate of 0.5 mV/s. Then the
potential of CPT test +700 mV (vs. SCE) was chosen as the higher potential E2, while one potential in
the passive region of the Tafel curve was selected as the lower potential E1 for each sample. The duty
cycle of t1 and t2 were set as 4 seconds and 2 seconds respectively to ensure the enough time for
passivation after pulse, in other words, the pitting corrosion of the samples was under control.
Figure 2. The potentiostatic pulse and corresponding current of PPT.
2.3. Morphology
The microstructure features were revealed by electrochemical etching in 10%wt ammonium
persulphate solution, applying a constant current density of 1 A/cm2 at room temperature. Here,
ammonium persulphate solution was selected because it was more suitable for molybdenum-contained
stainless steels [28] and sensitive to molybdenum-rich inclusions. The transmission electron
microscope (TEM JEOL-2100F) with energy dispersive spectrometer (EDS) probe was used to
identify the crystal structure and analysis the composition of precipitate phases.
3. RESULTS
3.1 The degradation of corrosion resistance after short-term aging
3.1.1 Intergranular corrosion resistance
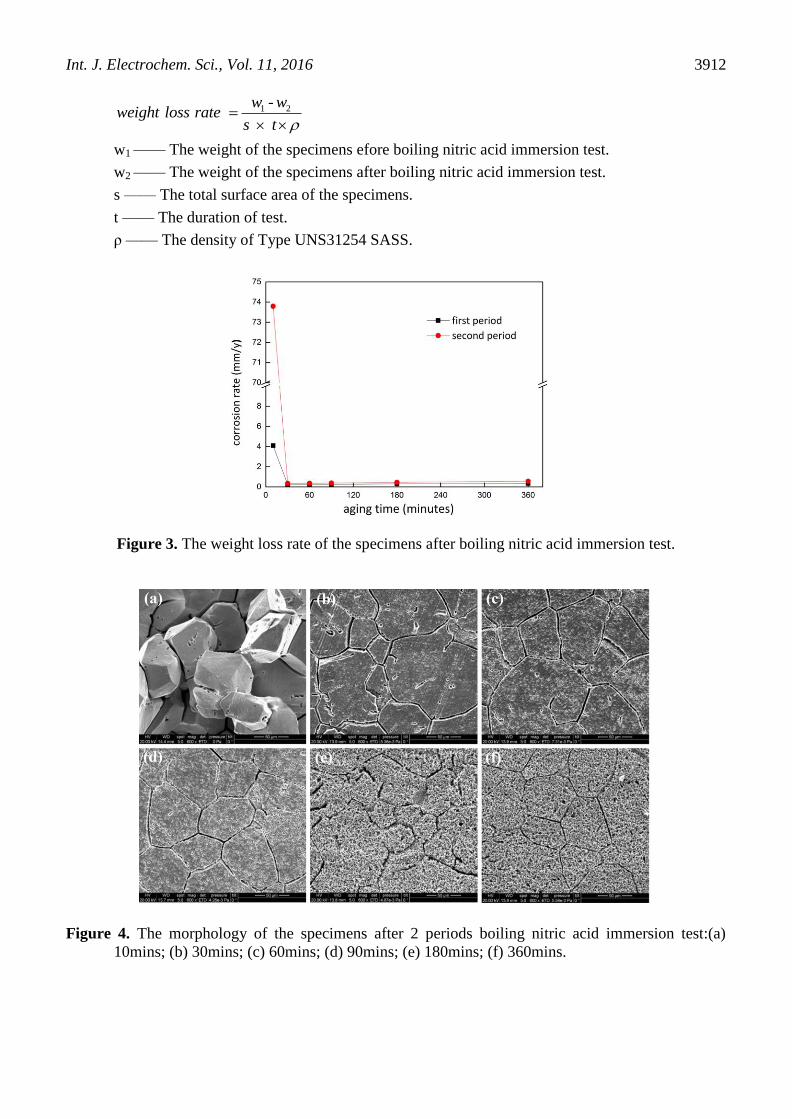
The weight loss rate of the specimens after boiling nitric acid immersion test was depicted in
Fig.3, which was calculated according to the formula below:
Int. J. Electrochem. Sci., Vol. 11, 2016
3912
1 2-
w wweight loss rate
s t
w1 —— The weight of the specimens efore boiling nitric acid immersion test.
w2 —— The weight of the specimens after boiling nitric acid immersion test.
s —— The total surface area of the specimens.
t —— The duration of test.
ρ —— The density of Type UNS31254 SASS.
Figure 3. The weight loss rate of the specimens after boiling nitric acid immersion test.
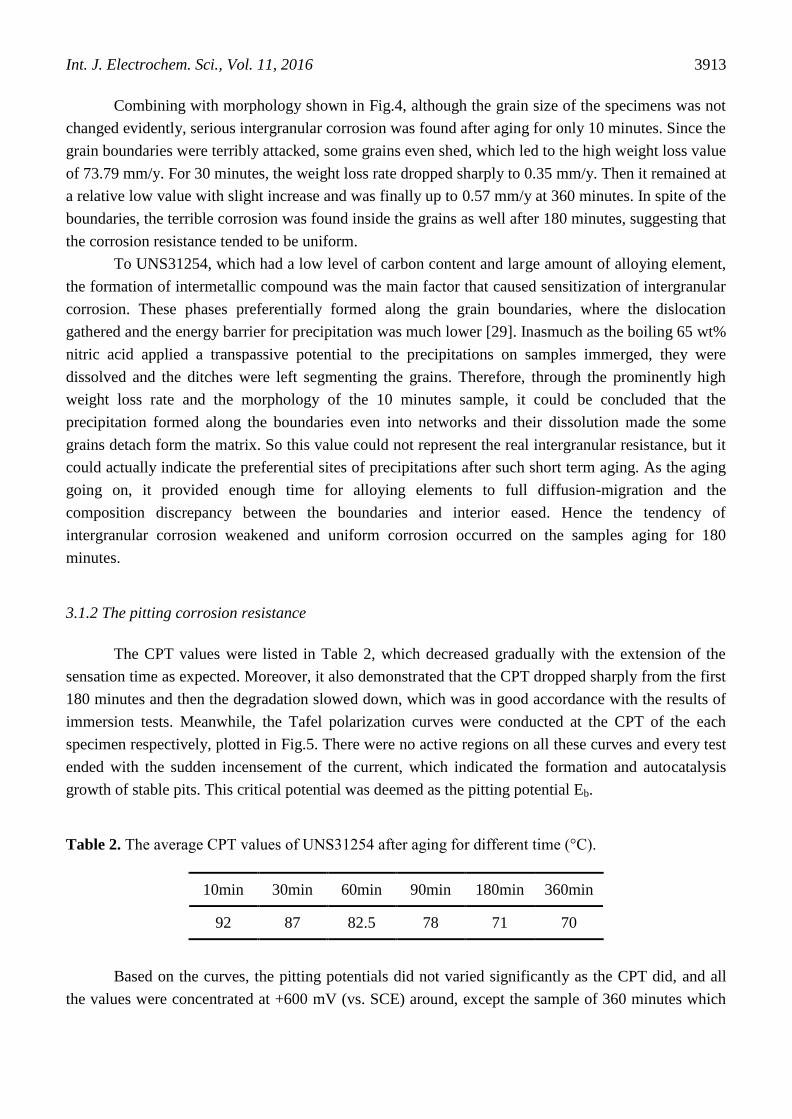
Figure 4. The morphology of the specimens after 2 periods boiling nitric acid immersion test:(a)
10mins; (b) 30mins; (c) 60mins; (d) 90mins; (e) 180mins; (f) 360mins.
Int. J. Electrochem. Sci., Vol. 11, 2016
3913
Combining with morphology shown in Fig.4, although the grain size of the specimens was not
changed evidently, serious intergranular corrosion was found after aging for only 10 minutes. Since the
grain boundaries were terribly attacked, some grains even shed, which led to the high weight loss value
of 73.79 mm/y. For 30 minutes, the weight loss rate dropped sharply to 0.35 mm/y. Then it remained at
a relative low value with slight increase and was finally up to 0.57 mm/y at 360 minutes. In spite of the
boundaries, the terrible corrosion was found inside the grains as well after 180 minutes, suggesting that
the corrosion resistance tended to be uniform.
To UNS31254, which had a low level of carbon content and large amount of alloying element,
the formation of intermetallic compound was the main factor that caused sensitization of intergranular
corrosion. These phases preferentially formed along the grain boundaries, where the dislocation
gathered and the energy barrier for precipitation was much lower [29]. Inasmuch as the boiling 65 wt%
nitric acid applied a transpassive potential to the precipitations on samples immerged, they were
dissolved and the ditches were left segmenting the grains. Therefore, through the prominently high
weight loss rate and the morphology of the 10 minutes sample, it could be concluded that the
precipitation formed along the boundaries even into networks and their dissolution made the some
grains detach form the matrix. So this value could not represent the real intergranular resistance, but it
could actually indicate the preferential sites of precipitations after such short term aging. As the aging
going on, it provided enough time for alloying elements to full diffusion-migration and the
composition discrepancy between the boundaries and interior eased. Hence the tendency of
intergranular corrosion weakened and uniform corrosion occurred on the samples aging for 180
minutes.
3.1.2 The pitting corrosion resistance
The CPT values were listed in Table 2, which decreased gradually with the extension of the
sensation time as expected. Moreover, it also demonstrated that the CPT dropped sharply from the first
180 minutes and then the degradation slowed down, which was in good accordance with the results of
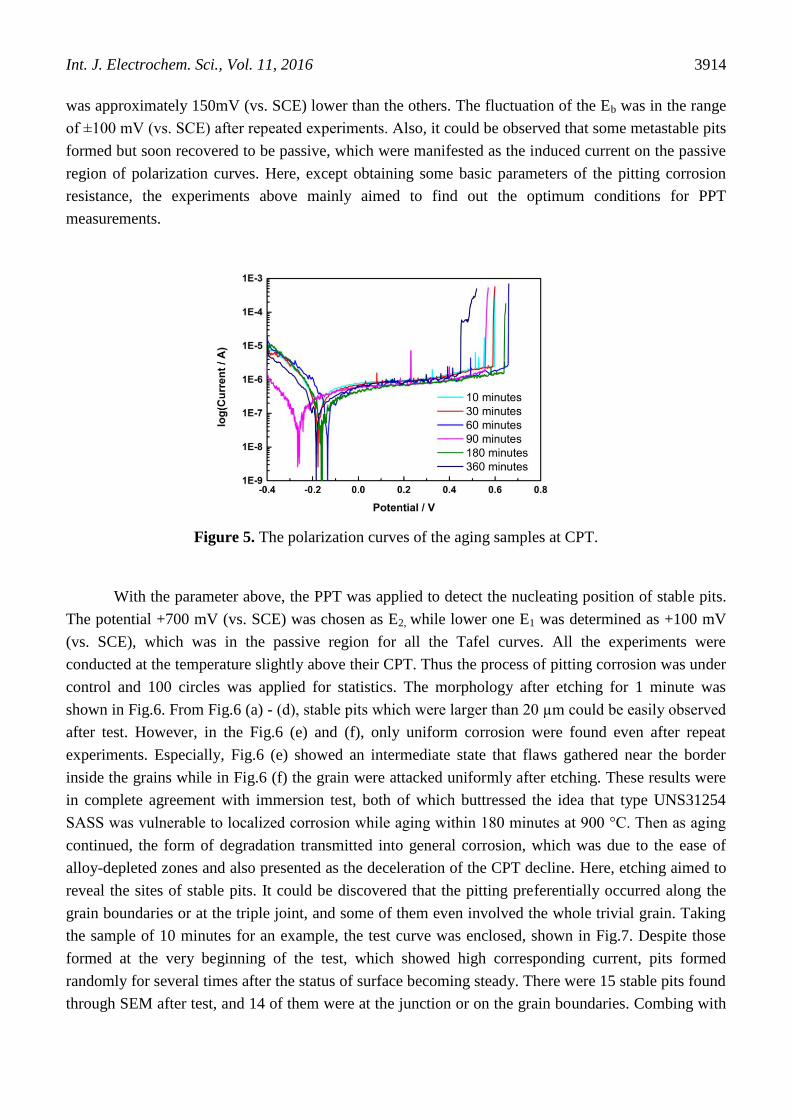
immersion tests. Meanwhile, the Tafel polarization curves were conducted at the CPT of the each
specimen respectively, plotted in Fig.5. There were no active regions on all these curves and every test
ended with the sudden incensement of the current, which indicated the formation and autocatalysis
growth of stable pits. This critical potential was deemed as the pitting potential Eb.
Table 2. The average CPT values of UNS31254 after aging for different time (°C).
10min 30min 60min 90min 180min 360min
92 87 82.5 78 71 70
Based on the curves, the pitting potentials did not varied significantly as the CPT did, and all
the values were concentrated at +600 mV (vs. SCE) around, except the sample of 360 minutes which
Int. J. Electrochem. Sci., Vol. 11, 2016
3914
was approximately 150mV (vs. SCE) lower than the others. The fluctuation of the Eb was in the range
of ±100 mV (vs. SCE) after repeated experiments. Also, it could be observed that some metastable pits
formed but soon recovered to be passive, which were manifested as the induced current on the passive
region of polarization curves. Here, except obtaining some basic parameters of the pitting corrosion
resistance, the experiments above mainly aimed to find out the optimum conditions for PPT
measurements.
Figure 5. The polarization curves of the aging samples at CPT.
With the parameter above, the PPT was applied to detect the nucleating position of stable pits.
The potential +700 mV (vs. SCE) was chosen as E2, while lower one E1 was determined as +100 mV
(vs. SCE), which was in the passive region for all the Tafel curves. All the experiments were
conducted at the temperature slightly above their CPT. Thus the process of pitting corrosion was under
control and 100 circles was applied for statistics. The morphology after etching for 1 minute was
shown in Fig.6. From Fig.6 (a) - (d), stable pits which were larger than 20 µm could be easily observed
after test. However, in the Fig.6 (e) and (f), only uniform corrosion were found even after repeat
experiments. Especially, Fig.6 (e) showed an intermediate state that flaws gathered near the border
inside the grains while in Fig.6 (f) the grain were attacked uniformly after etching. These results were
in complete agreement with immersion test, both of which buttressed the idea that type UNS31254
SASS was vulnerable to localized corrosion while aging within 180 minutes at 900 °C. Then as aging
continued, the form of degradation transmitted into general corrosion, which was due to the ease of
alloy-depleted zones and also presented as the deceleration of the CPT decline. Here, etching aimed to
reveal the sites of stable pits. It could be discovered that the pitting preferentially occurred along the
grain boundaries or at the triple joint, and some of them even involved the whole trivial grain. Taking
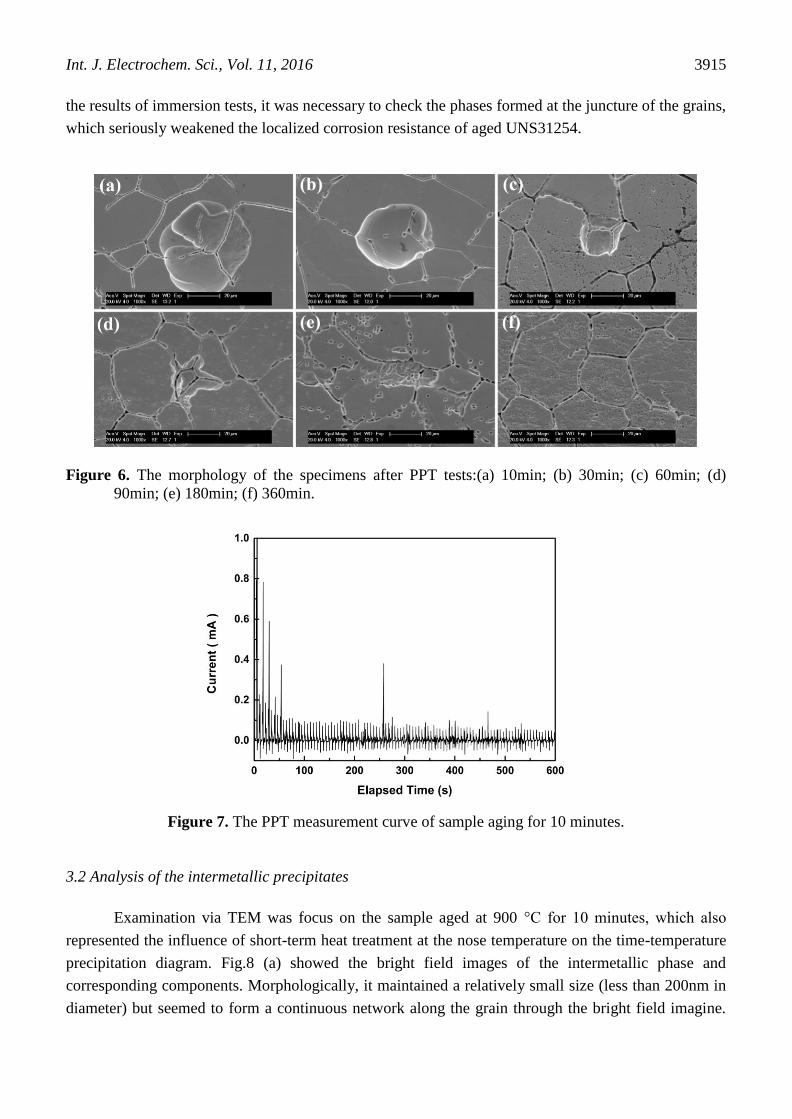
the sample of 10 minutes for an example, the test curve was enclosed, shown in Fig.7. Despite those
formed at the very beginning of the test, which showed high corresponding current, pits formed
randomly for several times after the status of surface becoming steady. There were 15 stable pits found
through SEM after test, and 14 of them were at the junction or on the grain boundaries. Combing with
Int. J. Electrochem. Sci., Vol. 11, 2016
3915
the results of immersion tests, it was necessary to check the phases formed at the juncture of the grains,
which seriously weakened the localized corrosion resistance of aged UNS31254.
Figure 6. The morphology of the specimens after PPT tests:(a) 10min; (b) 30min; (c) 60min; (d)
90min; (e) 180min; (f) 360min.
Figure 7. The PPT measurement curve of sample aging for 10 minutes.
3.2 Analysis of the intermetallic precipitates
Examination via TEM was focus on the sample aged at 900 °C for 10 minutes, which also
represented the influence of short-term heat treatment at the nose temperature on the time-temperature
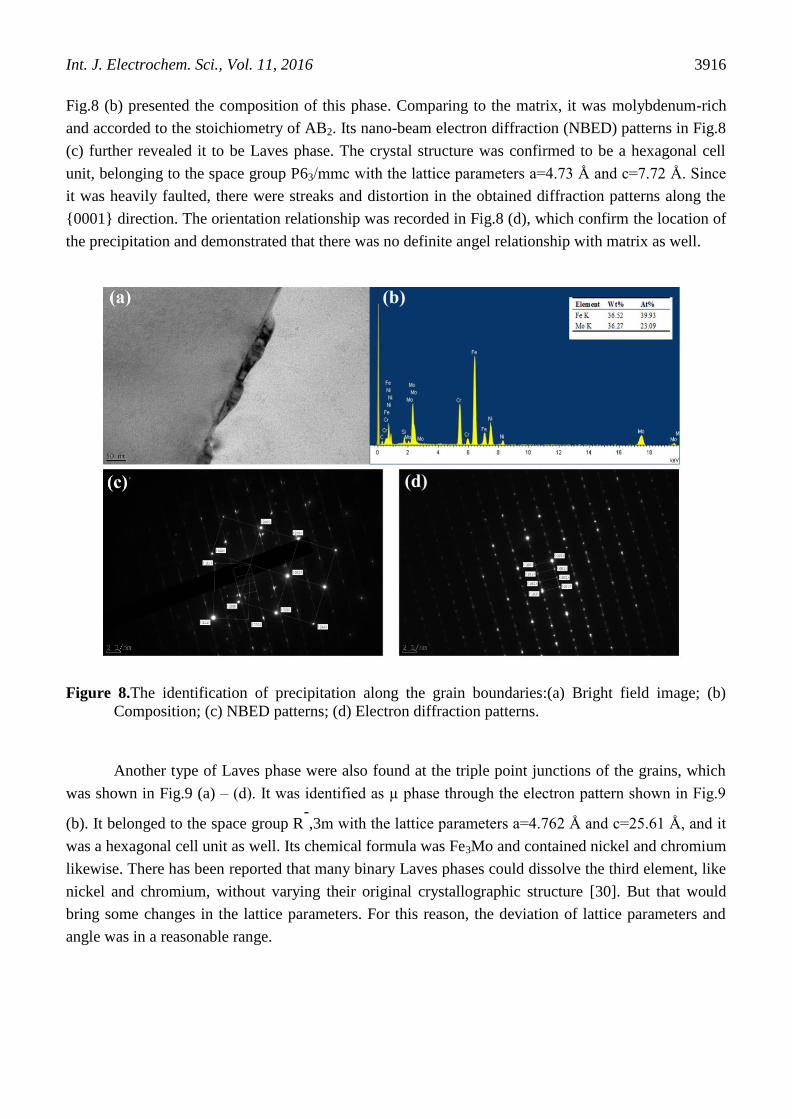
precipitation diagram. Fig.8 (a) showed the bright field images of the intermetallic phase and
corresponding components. Morphologically, it maintained a relatively small size (less than 200nm in
diameter) but seemed to form a continuous network along the grain through the bright field imagine.
Int. J. Electrochem. Sci., Vol. 11, 2016
3916
Fig.8 (b) presented the composition of this phase. Comparing to the matrix, it was molybdenum-rich
and accorded to the stoichiometry of AB2. Its nano-beam electron diffraction (NBED) patterns in Fig.8
(c) further revealed it to be Laves phase. The crystal structure was confirmed to be a hexagonal cell
unit, belonging to the space group P63/mmc with the lattice parameters a=4.73 Å and c=7.72 Å. Since
it was heavily faulted, there were streaks and distortion in the obtained diffraction patterns along the
{0001} direction. The orientation relationship was recorded in Fig.8 (d), which confirm the location of
the precipitation and demonstrated that there was no definite angel relationship with matrix as well.
Figure 8.The identification of precipitation along the grain boundaries:(a) Bright field image; (b)
Composition; (c) NBED patterns; (d) Electron diffraction patterns.
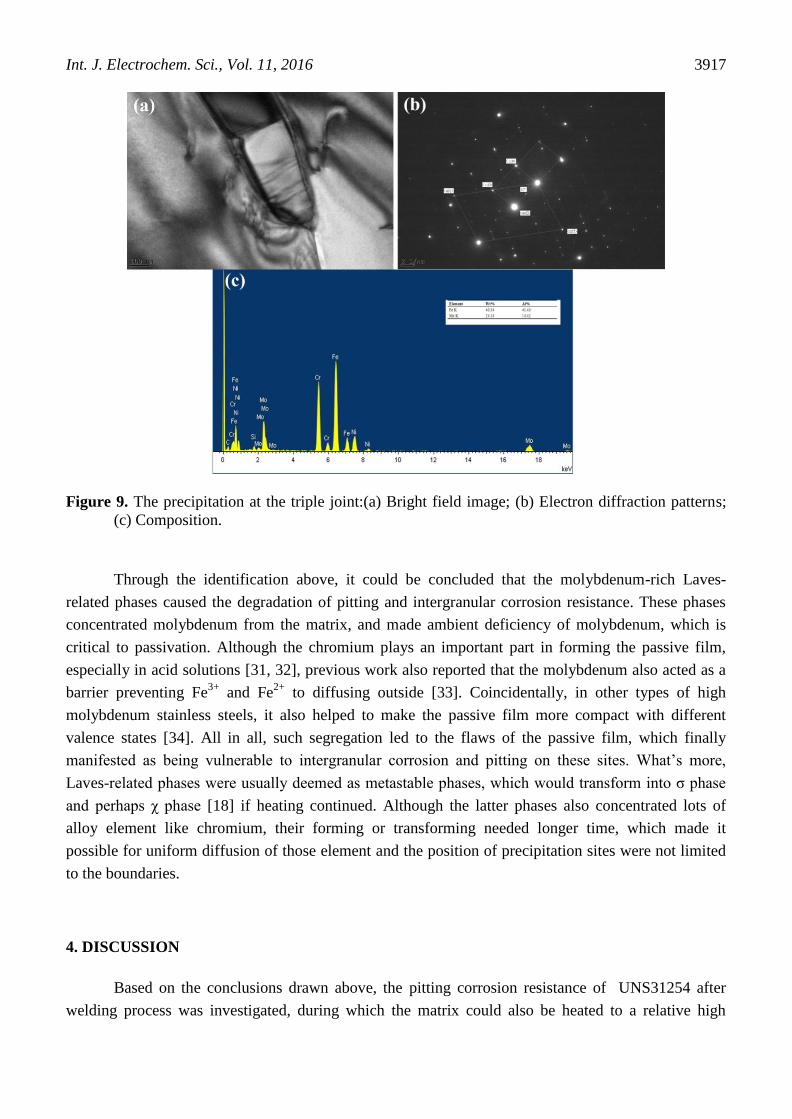
Another type of Laves phase were also found at the triple point junctions of the grains, which
was shown in Fig.9 (a) – (d). It was identified as µ phase through the electron pattern shown in Fig.9
(b). It belonged to the space group R-,3m with the lattice parameters a=4.762 Å and c=25.61 Å, and it
was a hexagonal cell unit as well. Its chemical formula was Fe3Mo and contained nickel and chromium
likewise. There has been reported that many binary Laves phases could dissolve the third element, like
nickel and chromium, without varying their original crystallographic structure [30]. But that would
bring some changes in the lattice parameters. For this reason, the deviation of lattice parameters and
angle was in a reasonable range.
Int. J. Electrochem. Sci., Vol. 11, 2016
3917
Figure 9. The precipitation at the triple joint:(a) Bright field image; (b) Electron diffraction patterns;
(c) Composition.
Through the identification above, it could be concluded that the molybdenum-rich Laves-
related phases caused the degradation of pitting and intergranular corrosion resistance. These phases
concentrated molybdenum from the matrix, and made ambient deficiency of molybdenum, which is
critical to passivation. Although the chromium plays an important part in forming the passive film,
especially in acid solutions [31, 32], previous work also reported that the molybdenum also acted as a
barrier preventing Fe3+
and Fe2+
to diffusing outside [33]. Coincidentally, in other types of high
molybdenum stainless steels, it also helped to make the passive film more compact with different
valence states [34]. All in all, such segregation led to the flaws of the passive film, which finally
manifested as being vulnerable to intergranular corrosion and pitting on these sites. What’s more,
Laves-related phases were usually deemed as metastable phases, which would transform into σ phase
and perhaps χ phase [18] if heating continued. Although the latter phases also concentrated lots of
alloy element like chromium, their forming or transforming needed longer time, which made it
possible for uniform diffusion of those element and the position of precipitation sites were not limited
to the boundaries.
4. DISCUSSION
Based on the conclusions drawn above, the pitting corrosion resistance of UNS31254 after
welding process was investigated, during which the matrix could also be heated to a relative high
Int. J. Electrochem. Sci., Vol. 11, 2016
3918
temperature and then cooled down rapidly. Generally, the temperature peak appeared near the weld
pool in a range of 1200-1400 °C, which was named high temperature heat-affected zone (HTHAZ). It
was expected that the prolonging of staying at high temperature led to an increase of the released
precipitates amount, which finally decreased the resistance to pitting corrosion of HTHAZ. To qualify
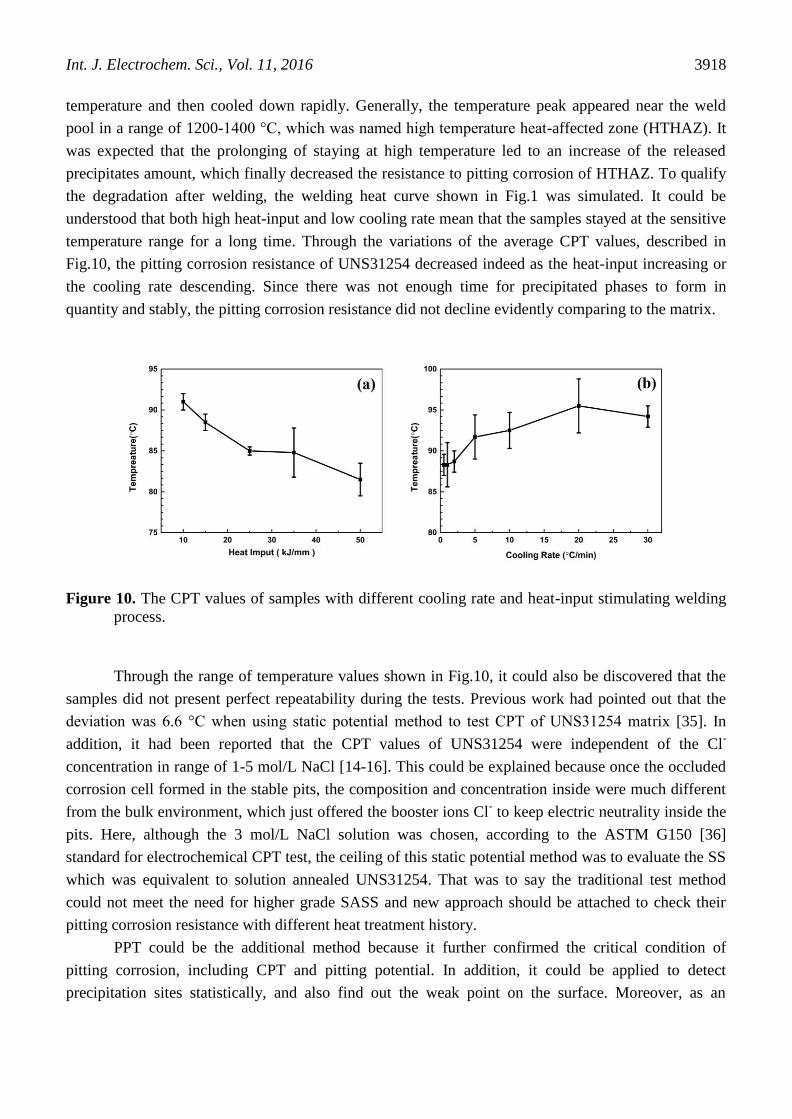
the degradation after welding, the welding heat curve shown in Fig.1 was simulated. It could be
understood that both high heat-input and low cooling rate mean that the samples stayed at the sensitive
temperature range for a long time. Through the variations of the average CPT values, described in
Fig.10, the pitting corrosion resistance of UNS31254 decreased indeed as the heat-input increasing or
the cooling rate descending. Since there was not enough time for precipitated phases to form in
quantity and stably, the pitting corrosion resistance did not decline evidently comparing to the matrix.
Figure 10. The CPT values of samples with different cooling rate and heat-input stimulating welding
process.
Through the range of temperature values shown in Fig.10, it could also be discovered that the
samples did not present perfect repeatability during the tests. Previous work had pointed out that the
deviation was 6.6 °C when using static potential method to test CPT of UNS31254 matrix [35]. In
addition, it had been reported that the CPT values of UNS31254 were independent of the Cl-
concentration in range of 1-5 mol/L NaCl [14-16]. This could be explained because once the occluded
corrosion cell formed in the stable pits, the composition and concentration inside were much different
from the bulk environment, which just offered the booster ions Cl- to keep electric neutrality inside the
pits. Here, although the 3 mol/L NaCl solution was chosen, according to the ASTM G150 [36]
standard for electrochemical CPT test, the ceiling of this static potential method was to evaluate the SS
which was equivalent to solution annealed UNS31254. That was to say the traditional test method
could not meet the need for higher grade SASS and new approach should be attached to check their
pitting corrosion resistance with different heat treatment history.
PPT could be the additional method because it further confirmed the critical condition of
pitting corrosion, including CPT and pitting potential. In addition, it could be applied to detect
precipitation sites statistically, and also find out the weak point on the surface. Moreover, as an
Int. J. Electrochem. Sci., Vol. 11, 2016
3919
electrochemical test method, it could be conducted in lab and less time consuming. So this work
recommend PPT as an attached method of SASS pitting corrosion test for pre-detection of precipitate
phase and inclusions.
5. CONCLUSIONS
In this study of UNS31254, the corrosion resistance after short term heat treatment was
investigated. Herein, the PPT was applied to detect the pitting corrosion sensitivity. After the
identification of precipitate phases through TEM, the following results were obtained:
1. There was no change in grain size, but the corrosion resistance decreased evidently after
short term aging at 900 °C. The ease of intergranular corrosion occurred after treating for 180 minutes,
and the decrease of CPT values slowed down at the same time.
2. PPT test could be used to detect the nucleation sites of the precipitation sites. The
morphology showed that the stable pits preferentially formed at the triple point junctions of grain
boundaries, where the precipitation formed. Through the samples aging longer than 180 minutes, on
which no stable pit was found, it could be further confirmed that the form of degradation transmitted
from localized corrosion into general corrosion.
3. TEM results revealed that Laves related phase formed at 900 °C for only 10 minutes, which
sample was heavily attacked through the immersion test. The µ phase Fe3Mo trended to nuclear at the
triple point junctions whilst the Laves phase Fe2Mo grew along the grain boundaries. The presence of
Laves-related phases could break the integrity and the uniformity of passive film and leads the samples
vulnerable to pitting and intergranular corrosion in chloride contained solutions.
ACKNOWLEDGEMENT
The authors would like to acknowledge the helpful collaboration of Baosteel. This work is supported
by the National Science Foundation of China (Grants No. 51371053, 51131008).
Reference
1. C.J.O. Alonso, M.A. Lucio-Garcia, I.A. Hermoso-Diaz, J.G. Chacon-Nava, A. Martinez-Villafane
and J.G. Gonzalez-Rodriguez, Int. J. Electrochem. Sci., 9 (2014) 6717
2. X. Feng, X. Lu, L. Guo and D. Chen, Int. J. Electrochem. Sci., 10 (2015) 10677
3. Y.A. Albrimi, A. Eddib, J. Douch, Y. Berghoute, M. Hamdani and R.M. Souto, Int. J. Electrochem.
Sci., 6 (2011) 4614
4. G. Gusmano, G. Montesperelli, G. Forte, E. Olzi and A. Benedetti, Desalination, 183 (2005) 187
5. J. Nordstrom and J. Olsson, Desalination, 97 (1994) 213
6. A. Al Odwani, M. Al-Tabtabaei and A. Abdel-Nabi, Desalination, 120 (1998) 73
7. A.K. Singh and G. Singh, Anti-Corros. Method M. , 49 (2002) 417
8. A. Malsnes and B. Hauge, Zinc and Lead Processing, (1998) 613
9. M. Oberndorfer, K. Thayer and M. Kastenbauer, Mater. Corros., 55 (2004) 174
10. R. Singh and A.K. Singh, Indian J. Chem. Technol., 9 (2002) 141
11. B. Wallen, M. Liljas and P. Stenvall, Mater. Corros., 44 (1993) 83
Int. J. Electrochem. Sci., Vol. 11, 2016
3920
12. C.J. Ortiz-Alonso, J.G. Gonzalez-Rodriguez, J. Uruchurtu-Chavarin and J.G. Chacon-Nava, Int. J.
Electrochem. Sci., 10 (2015) 5249
13. L. De Micheli, C.A. Barbosa, A.H.P. Andrade and S.M.L. Agostinho, Br. Corros. J., 35 (2000) 297
14. R. Qvarfort, Corros. Sci., 29 (1989) 987
15. E.A.A. El Meguid and A.A.A. El Latif, Corros. Sci., 46 (2004) 2431
16. E.A.A. El Meguid and A.A.A. El Latif, Corros. Sci., 49 (2007) 263
17. S. Ahmad and A.U. Malik, J. Appl. Electrochem., 31 (2001) 1009
18. T. Koutsoukis, A. Redjaimia and G. Fourlaris, Solid-Solid Phase Transformations in Inorganic
Materials, Pts 1-2, 172-174 (2011) 493
19. T. Koutsoukis, A. Redjaimia and G. Fourlaris, Mater. Sci. Eng., A, 561 (2013) 477
20. E. Pu, W. Zheng, J. Xiang, Z. Song, H. Feng and Y. Zhu, Acta Metallurgica Sinica-English Letters,
27 (2014) 313
21. S. Heino, Metall. Mater. Trans. A, 31 (2000) 1893
22. A. Von Keitz and G. Sauthoff, Intermetallics, 10 (2002) 497
23. J. Gao, Y. Jiang, B. Deng, Z. Ge and J. Li, Electrochim. Acta, 55 (2010) 4837
24. J.H. Kang and G.S. Frankel, Z. Phys. Chem., 219 (2005) 1519
25. C.O.A. Olsson and D. Landolt, Electrochim. Acta, 48 (2003) 1093
26. S.M. Qidwai, V.G. DeGiorgi, A.C. Leung and Asme, Proceedings of the Asme International Design
Engineering Technical Conferences and Computers and Information in Engineering Conference,
2011, Vol 2, Pts a and B, (2012) 161
27. ASTM A262, Standard Practices For Detecting Susceptibility To Intergranular Attack In Austenitic
Stainless Steels, 2014
28. J. Reiter, C. Bernhard and H. Presslinger, Mater. Charact., 59 (2008) 737
29. K.H. Lo, C.H. Shek and J.K.L. Lai, Mater. Sci. Eng., R, 65 (2009) 39
30. F. Stein, A. Palm and G. Sauthoff, Intermetallics, 13 (2005) 1056
31. I. Betova, M. Bojinov, T. Laitinen, K. Makela, P. Pohjanne and T. Saario, Corros. Sci., 44 (2002)
2699
32. T.L.S.L. Wijesinghe and D.J. Blackwood, J. Electrochem. Soc., 154 (2007) C16
33. C.T. Liu and J.K. Wu, Corros. Sci., 49 (2007) 2198
34. R.M. Fernandez-Domene, E. Blasco-Tamarit, D.M. Garcia-Garcia and J. Garcia-Anton, Thin Solid
Films, 558 (2014) 252
35. H. Andersen, C.O.A. Olsson and L. Wegrelius, Electrochemical Methods in Corrosion Research Vi,
Pts 1 and 2, 289-2 (1998) 925
36. ASTM G150 - 13, Standard Test Method for Electrochemical Critical Pitting Temperature Testing
of Stainless Steels, 2013
© 2016 The Authors. Published by ESG (www.electrochemsci.org). This article is an open access
article distributed under the terms and conditions of the Creative Commons Attribution license
(http://creativecommons.org/licenses/by/4.0/).


