EMPLOYMENT PAPER
2001/19
Economic growth,social policy and decent work
Nomaan MajidMacroeconomic and Development Policy group
Employment Strategy Department
Employment SectorInternational Labour Office Geneva


ISBN 92-2-112579-3
EMPLOYMENT PAPER
2001/19
Economic growth,
social policy and decentwork
Nomaan Majid
Employment Sector

Employment Sector
This ILO Sector has the responsibility for assisting and advising ILO constituents inanalysing national and global employment and labour market developments in order toelaborate and negotiate policies and programmes for employment promotion and humanresources development. The Employment Sector encourages them to invest more intraining and human resources development for enhanced employability; to implementspecial employment promotion programmes in situations of high unemployment,particularly in the context of different types of crisis; to promote the creation of qualityjobs in enterprises; upgrade the informal sector and promote gender promotion inemployment.
Employment papers
Cahiers de l'emploiEstudios sobre empleo
2000/1The impact of European integration on the development of national labour markets
Philip Raines, 2000
2000/2Ageing of the labour force in OECD countries. Economic and social consequences
Peter Auer; Mariàngels Fortuny, 2000
2000/3Trade liberalization and manufacturing employment
Ajit K. Ghose, 2000
2000/4Poverty and structural adjustment. Some remarks on tradeoffs between equity and growth
Rolph van der Hoeven, 2000
2000/5Productivity and unit labour cost comparisons: A database
Bart van Ark; Erik Monnikhof, 2000
2000/6Methods for producing world and regional estimates for selected key indicators of the labour market
Wes Schaible, 2000
2000/7Achieving full employment in the transition economies
Geoffrey Renshaw, 2000
2000/8“Assessing aid” and global governance
Rolph van der Hoeven, 2001
2000/9The ILO and the informal sector: An institutional history
Paul Bangasser,2000
2001/10 Redistribution matters: Growth for poverty reduction
Hulya Dagdeviren, Rolph van der Hoeven, John Weeks, 2001
2001/11 Self-regulation in the workplace: Codes of conduct, social labelling and socially responsible investment
Michael Urminsky (ed.), cancelled
2001/12 Global economic inequality and international trade
Ajit K. Ghose, 2001
2001/13 Is minimum wage an effective tool to promote decent work and reduce poverty ? The experience of selected developing
countries
Catherine Saget, 2001
2001/14 Peter Auer, forthcoming
2001/15 Assessing labour market dynamics: European evidence
Thomas Kruppe, 2001
2001/16 The size of the working poor population in developing countries
Nomaan Majid, 2001
2001/17 Galtier et Gaudié, forthcoming.
2001/18 Flexibility and commitment in the United States labour market,
Paul Osterman, 2001
2001/19 Economic growth, social policy and decent work
Nomaan Majid, 2001
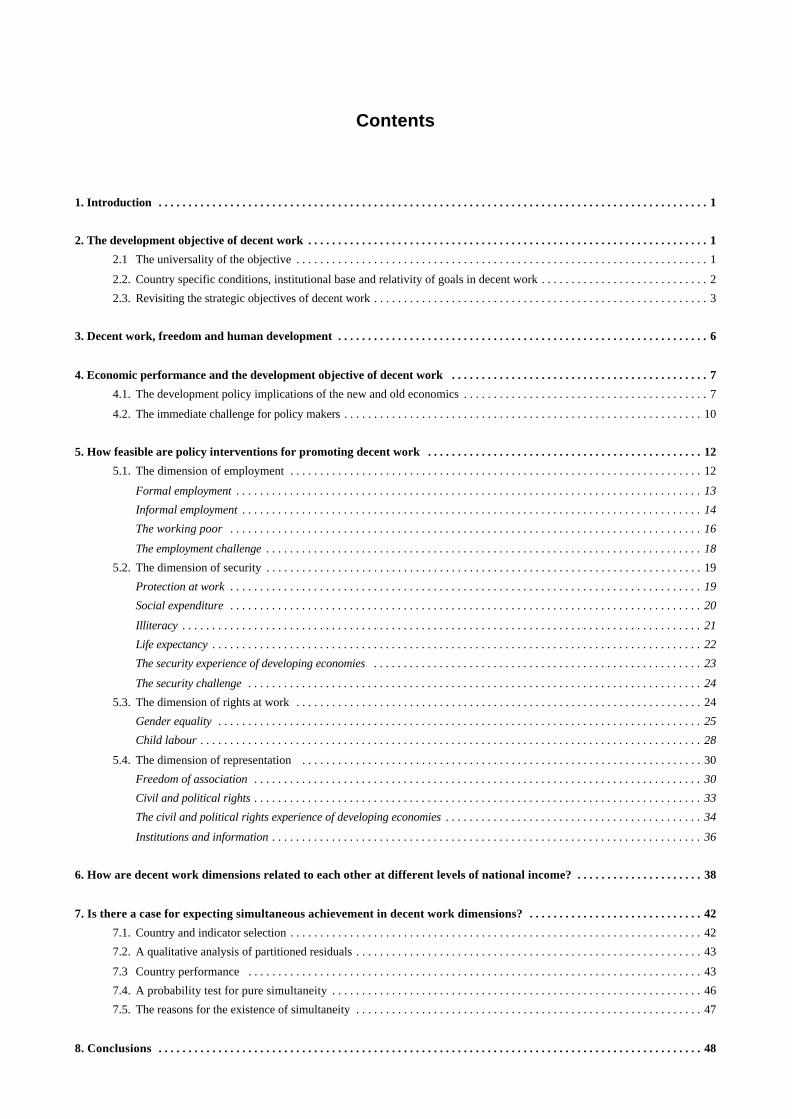
Contents
1. Introduction . . . . . . . . . . . . . . . . . . . . . . . . . . . . . . . . . . . . . . . . . . . . . . . . . . . . . . . . . . . . . . . . . . . . . . . . . . . . . . . . . . . . . . . . . . . . 1
2. The development objective of decent work . . . . . . . . . . . . . . . . . . . . . . . . . . . . . . . . . . . . . . . . . . . . . . . . . . . . . . . . . . . . . . . . . . . 1
2.1 The universality of the objective . . . . . . . . . . . . . . . . . . . . . . . . . . . . . . . . . . . . . . . . . . . . . . . . . . . . . . . . . . . . . . . . . . . . . 1
2.2. Country specific conditions, institutional base and relativity of goals in decent work . . . . . . . . . . . . . . . . . . . . . . . . . . . . 2
2.3. Revisiting the strategic objectives of decent work . . . . . . . . . . . . . . . . . . . . . . . . . . . . . . . . . . . . . . . . . . . . . . . . . . . . . . . . 3
3. Decent work, freedom and human development . . . . . . . . . . . . . . . . . . . . . . . . . . . . . . . . . . . . . . . . . . . . . . . . . . . . . . . . . . . . . . 6
4. Economic performance and the development objective of decent work . . . . . . . . . . . . . . . . . . . . . . . . . . . . . . . . . . . . . . . . . . . 7
4.1. The development policy implications of the new and old economics . . . . . . . . . . . . . . . . . . . . . . . . . . . . . . . . . . . . . . . . . 7
4.2. The immediate challenge for policy makers . . . . . . . . . . . . . . . . . . . . . . . . . . . . . . . . . . . . . . . . . . . . . . . . . . . . . . . . . . . . 10
5. How feasible are policy interventions for promoting decent work . . . . . . . . . . . . . . . . . . . . . . . . . . . . . . . . . . . . . . . . . . . . . . 12
5.1. The dimension of employment . . . . . . . . . . . . . . . . . . . . . . . . . . . . . . . . . . . . . . . . . . . . . . . . . . . . . . . . . . . . . . . . . . . . . 12
Formal employment . . . . . . . . . . . . . . . . . . . . . . . . . . . . . . . . . . . . . . . . . . . . . . . . . . . . . . . . . . . . . . . . . . . . . . . . . . . . . . 13
Informal employment . . . . . . . . . . . . . . . . . . . . . . . . . . . . . . . . . . . . . . . . . . . . . . . . . . . . . . . . . . . . . . . . . . . . . . . . . . . . . 14
The working poor . . . . . . . . . . . . . . . . . . . . . . . . . . . . . . . . . . . . . . . . . . . . . . . . . . . . . . . . . . . . . . . . . . . . . . . . . . . . . . . 16
The employment challenge . . . . . . . . . . . . . . . . . . . . . . . . . . . . . . . . . . . . . . . . . . . . . . . . . . . . . . . . . . . . . . . . . . . . . . . . . 18
5.2. The dimension of security . . . . . . . . . . . . . . . . . . . . . . . . . . . . . . . . . . . . . . . . . . . . . . . . . . . . . . . . . . . . . . . . . . . . . . . . . 19
Protection at work . . . . . . . . . . . . . . . . . . . . . . . . . . . . . . . . . . . . . . . . . . . . . . . . . . . . . . . . . . . . . . . . . . . . . . . . . . . . . . . 19
Social expenditure . . . . . . . . . . . . . . . . . . . . . . . . . . . . . . . . . . . . . . . . . . . . . . . . . . . . . . . . . . . . . . . . . . . . . . . . . . . . . . . 20
Illiteracy . . . . . . . . . . . . . . . . . . . . . . . . . . . . . . . . . . . . . . . . . . . . . . . . . . . . . . . . . . . . . . . . . . . . . . . . . . . . . . . . . . . . . . . 21
Life expectancy . . . . . . . . . . . . . . . . . . . . . . . . . . . . . . . . . . . . . . . . . . . . . . . . . . . . . . . . . . . . . . . . . . . . . . . . . . . . . . . . . . 22
The security experience of developing economies . . . . . . . . . . . . . . . . . . . . . . . . . . . . . . . . . . . . . . . . . . . . . . . . . . . . . . . 23
The security challenge . . . . . . . . . . . . . . . . . . . . . . . . . . . . . . . . . . . . . . . . . . . . . . . . . . . . . . . . . . . . . . . . . . . . . . . . . . . . 24
5.3. The dimension of rights at work . . . . . . . . . . . . . . . . . . . . . . . . . . . . . . . . . . . . . . . . . . . . . . . . . . . . . . . . . . . . . . . . . . . . 24
Gender equality . . . . . . . . . . . . . . . . . . . . . . . . . . . . . . . . . . . . . . . . . . . . . . . . . . . . . . . . . . . . . . . . . . . . . . . . . . . . . . . . . 25
Child labour . . . . . . . . . . . . . . . . . . . . . . . . . . . . . . . . . . . . . . . . . . . . . . . . . . . . . . . . . . . . . . . . . . . . . . . . . . . . . . . . . . . . 28
5.4. The dimension of representation . . . . . . . . . . . . . . . . . . . . . . . . . . . . . . . . . . . . . . . . . . . . . . . . . . . . . . . . . . . . . . . . . . . 30
Freedom of association . . . . . . . . . . . . . . . . . . . . . . . . . . . . . . . . . . . . . . . . . . . . . . . . . . . . . . . . . . . . . . . . . . . . . . . . . . . 30
Civil and political rights . . . . . . . . . . . . . . . . . . . . . . . . . . . . . . . . . . . . . . . . . . . . . . . . . . . . . . . . . . . . . . . . . . . . . . . . . . . 33
The civil and political rights experience of developing economies . . . . . . . . . . . . . . . . . . . . . . . . . . . . . . . . . . . . . . . . . . . 34
Institutions and information . . . . . . . . . . . . . . . . . . . . . . . . . . . . . . . . . . . . . . . . . . . . . . . . . . . . . . . . . . . . . . . . . . . . . . . . 36
6. How are decent work dimensions related to each other at different levels of national income? . . . . . . . . . . . . . . . . . . . . . 38
7. Is there a case for expecting simultaneous achievement in decent work dimensions? . . . . . . . . . . . . . . . . . . . . . . . . . . . . . 42
7.1. Country and indicator selection . . . . . . . . . . . . . . . . . . . . . . . . . . . . . . . . . . . . . . . . . . . . . . . . . . . . . . . . . . . . . . . . . . . . . 42
7.2. A qualitative analysis of partitioned residuals . . . . . . . . . . . . . . . . . . . . . . . . . . . . . . . . . . . . . . . . . . . . . . . . . . . . . . . . . . 43
7.3 Country performance . . . . . . . . . . . . . . . . . . . . . . . . . . . . . . . . . . . . . . . . . . . . . . . . . . . . . . . . . . . . . . . . . . . . . . . . . . . . 43
7.4. A probability test for pure simultaneity . . . . . . . . . . . . . . . . . . . . . . . . . . . . . . . . . . . . . . . . . . . . . . . . . . . . . . . . . . . . . . 46
7.5. The reasons for the existence of simultaneity . . . . . . . . . . . . . . . . . . . . . . . . . . . . . . . . . . . . . . . . . . . . . . . . . . . . . . . . . . 47
8. Conclusions . . . . . . . . . . . . . . . . . . . . . . . . . . . . . . . . . . . . . . . . . . . . . . . . . . . . . . . . . . . . . . . . . . . . . . . . . . . . . . . . . . . . . . . . . . . 48

Annex . . . . . . . . . . . . . . . . . . . . . . . . . . . . . . . . . . . . . . . . . . . . . . . . . . . . . . . . . . . . . . . . . . . . . . . . . . . . . . . . . . . . . . . . . . . . . . . . . . 51
Selected bibliography . . . . . . . . . . . . . . . . . . . . . . . . . . . . . . . . . . . . . . . . . . . . . . . . . . . . . . . . . . . . . . . . . . . . . . . . . . . . . . . . . . . . . 59
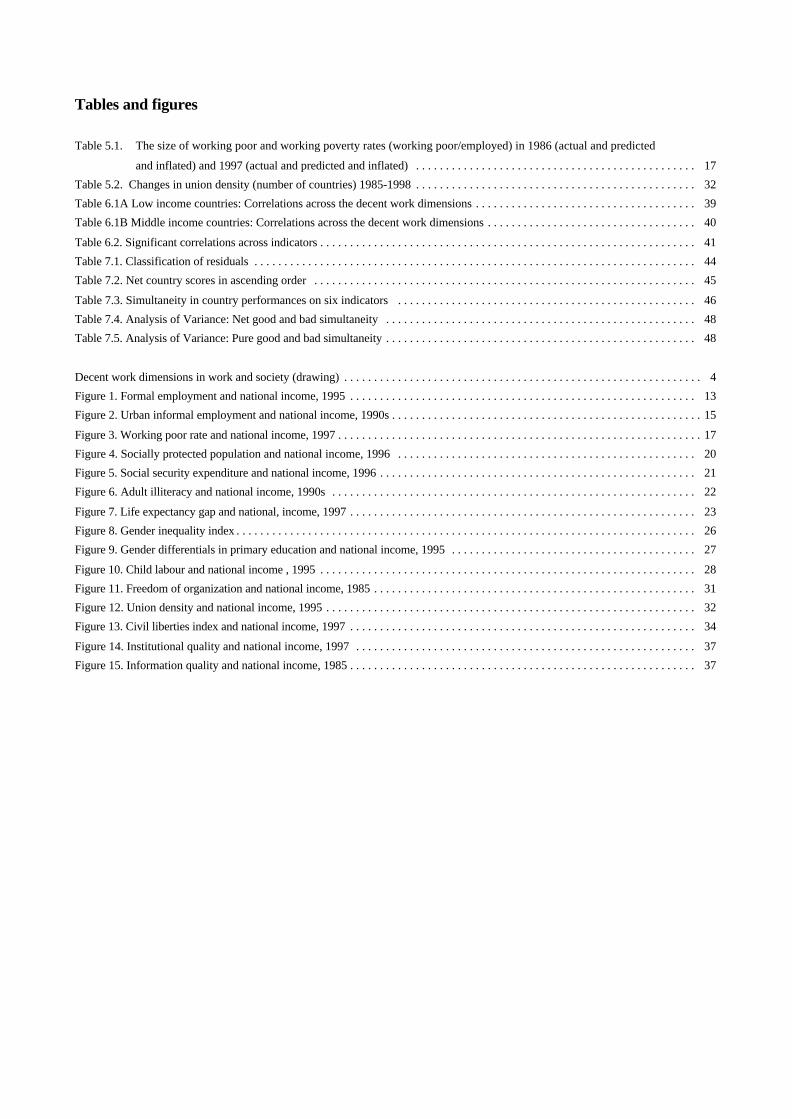
Tables and figures
Table 5.1. The size of working poor and working poverty rates (working poor/employed) in 1986 (actual and predicted
and inflated) and 1997 (actual and predicted and inflated) . . . . . . . . . . . . . . . . . . . . . . . . . . . . . . . . . . . . . . . . . . . . . . . 17
Table 5.2. Changes in union density (number of countries) 1985-1998 . . . . . . . . . . . . . . . . . . . . . . . . . . . . . . . . . . . . . . . . . . . . . . . 32
Table 6.1A Low income countries: Correlations across the decent work dimensions . . . . . . . . . . . . . . . . . . . . . . . . . . . . . . . . . . . . . 39
Table 6.1B Middle income countries: Correlations across the decent work dimensions . . . . . . . . . . . . . . . . . . . . . . . . . . . . . . . . . . . 40
Table 6.2. Significant correlations across indicators . . . . . . . . . . . . . . . . . . . . . . . . . . . . . . . . . . . . . . . . . . . . . . . . . . . . . . . . . . . . . . . 41
Table 7.1. Classification of residuals . . . . . . . . . . . . . . . . . . . . . . . . . . . . . . . . . . . . . . . . . . . . . . . . . . . . . . . . . . . . . . . . . . . . . . . . . . 44
Table 7.2. Net country scores in ascending order . . . . . . . . . . . . . . . . . . . . . . . . . . . . . . . . . . . . . . . . . . . . . . . . . . . . . . . . . . . . . . . . 45
Table 7.3. Simultaneity in country performances on six indicators . . . . . . . . . . . . . . . . . . . . . . . . . . . . . . . . . . . . . . . . . . . . . . . . . . 46
Table 7.4. Analysis of Variance: Net good and bad simultaneity . . . . . . . . . . . . . . . . . . . . . . . . . . . . . . . . . . . . . . . . . . . . . . . . . . . . 48
Table 7.5. Analysis of Variance: Pure good and bad simultaneity . . . . . . . . . . . . . . . . . . . . . . . . . . . . . . . . . . . . . . . . . . . . . . . . . . . . 48
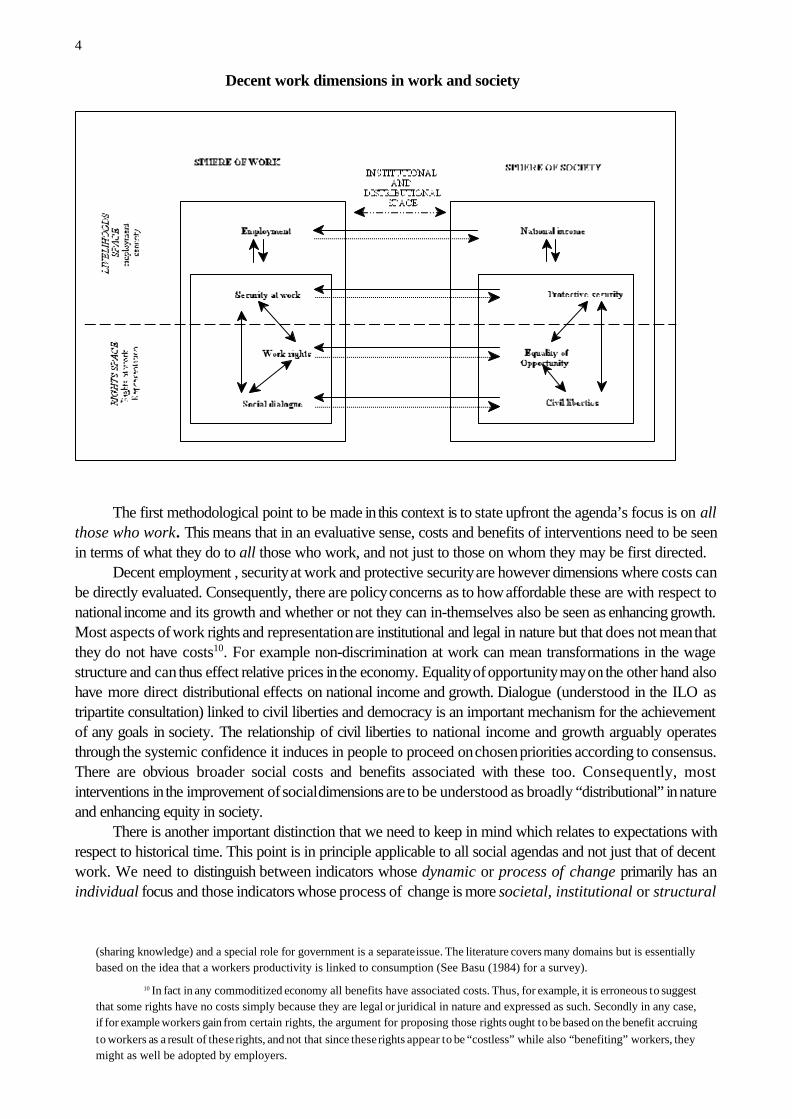
Decent work dimensions in work and society (drawing) . . . . . . . . . . . . . . . . . . . . . . . . . . . . . . . . . . . . . . . . . . . . . . . . . . . . . . . . . . . . 4
Figure 1. Formal employment and national income, 1995 . . . . . . . . . . . . . . . . . . . . . . . . . . . . . . . . . . . . . . . . . . . . . . . . . . . . . . . . . . 13
Figure 2. Urban informal employment and national income, 1990s . . . . . . . . . . . . . . . . . . . . . . . . . . . . . . . . . . . . . . . . . . . . . . . . . . . . 15
Figure 3. Working poor rate and national income, 1997 . . . . . . . . . . . . . . . . . . . . . . . . . . . . . . . . . . . . . . . . . . . . . . . . . . . . . . . . . . . . . 17
Figure 4. Socially protected population and national income, 1996 . . . . . . . . . . . . . . . . . . . . . . . . . . . . . . . . . . . . . . . . . . . . . . . . . . 20
Figure 5. Social security expenditure and national income, 1996 . . . . . . . . . . . . . . . . . . . . . . . . . . . . . . . . . . . . . . . . . . . . . . . . . . . . . 21
Figure 6. Adult illiteracy and national income, 1990s . . . . . . . . . . . . . . . . . . . . . . . . . . . . . . . . . . . . . . . . . . . . . . . . . . . . . . . . . . . . . 22
Figure 7. Life expectancy gap and national, income, 1997 . . . . . . . . . . . . . . . . . . . . . . . . . . . . . . . . . . . . . . . . . . . . . . . . . . . . . . . . . . 23
Figure 8. Gender inequality index . . . . . . . . . . . . . . . . . . . . . . . . . . . . . . . . . . . . . . . . . . . . . . . . . . . . . . . . . . . . . . . . . . . . . . . . . . . . . 26
Figure 9. Gender differentials in primary education and national income, 1995 . . . . . . . . . . . . . . . . . . . . . . . . . . . . . . . . . . . . . . . . . 27
Figure 10. Child labour and national income , 1995 . . . . . . . . . . . . . . . . . . . . . . . . . . . . . . . . . . . . . . . . . . . . . . . . . . . . . . . . . . . . . . . 28
Figure 11. Freedom of organization and national income, 1985 . . . . . . . . . . . . . . . . . . . . . . . . . . . . . . . . . . . . . . . . . . . . . . . . . . . . . . 31
Figure 12. Union density and national income, 1995 . . . . . . . . . . . . . . . . . . . . . . . . . . . . . . . . . . . . . . . . . . . . . . . . . . . . . . . . . . . . . . 32
Figure 13. Civil liberties index and national income, 1997 . . . . . . . . . . . . . . . . . . . . . . . . . . . . . . . . . . . . . . . . . . . . . . . . . . . . . . . . . . 34
Figure 14. Institutional quality and national income, 1997 . . . . . . . . . . . . . . . . . . . . . . . . . . . . . . . . . . . . . . . . . . . . . . . . . . . . . . . . . 37
Figure 15. Information quality and national income, 1985 . . . . . . . . . . . . . . . . . . . . . . . . . . . . . . . . . . . . . . . . . . . . . . . . . . . . . . . . . . 37
Acknowledgements
I am grateful to Gerry Rodgers and Ajit Ghose for extremely valuable discussions and detailedcomments on various parts of this paper. Farhad Mehran gave guidance on a particular statistical issue.Philippe Egger kindly read the final version and made some useful suggestions. Y.Nejad provided statisticalassistance. The usual disclaimer applies.
Foreword
This paper is the first empirical attempt to examine the International Labour Organisation’s agenda ofdecent work from a development policy perspective. Decent work has four dimensions or strategic objectives:employment, security, rights at work and representation. The objective of employment is important for allowingworkers to realise decent returns from labour. The objective of security in the workplace, covering physicalworking conditions (as well as protective security in society for all), gives those who possess labour, securityin using it. The objective of work rights allows for social conditions of work to be improved anddiscrimination to be levelled, thereby giving all workers the possibility of achievement from work. Theobjective of representation and dialogue is both important in itself and can be instrumental in achieving theother objectives in the domain of work This paper seeks to ask four questions with respect to ILO’s decentwork agenda. These are:
• What is the link between the decent work agenda and the theoretical welfare literature?
• Is there a scope for policy interventions on decent work dimensions in developing countries?
• Are the four decent work dimensions of decent work linked to each other with respect to levels of
national income?
• Is there a case to be explored for complementarities in decent work dimensions?
In answering the first question, the paper begins with an interpretation of the “development objective”of decent work and explores how it maybe related to contemporary approaches in human development. Itdiscusses two important conceptual links to the agenda. The first link is with the capability based humandevelopment framework which allows for the dimensions of decent work to be expressed as societal goals.The second link is with developments in economic theory that allow for efficiency and equity considerationsto be addressed simultaneously in policy making.
In answering the second question, the paper empirically illustrates the relationship between particulardimensions of decent work and economic growth. The basic point of the illustrations in this section is that whilethe economic resource position of a country is critical with respect to what one may “expect” to achieve ona social dimension, there is a case to argue for some degrees of freedom in interventions on many of thesedimensions even for countries at lower levels of wealth.
For the third question, the paper shows that there are discernible linkages that are observable betweendecent work dimensions in low and middle income countries respectively.
In answering the fourth question, the paper suggests that there is a case for simultaneity of achievementbetween different social dimensions of decent work. It then proposes some provisional explanations for theexistence of simultaneity where it may be found.
Rashid Amjad Officer-in-Charge
Employment Strategy Department
1
1Decent Work, International Labour Conference 87th Session 1999, Geneva, ILO.
2Essentially relationships established from reduced-form regression equations with cross-country data cannot sayvery much either about causality between variables, or about what that relationship means at the level of particular policyinstruments.
3The question of the manner in which components of decent work are consistent with the idea of a “decent life” is aseparate issue.
4 See Gerry Rodgers, (2000), “Decent work as a development objective”. Lecture to the 42nd Annual Meeting of theIndian Society of Labour Economics, Madhya Pradesh, India.
1. Introduction
The aim of this paper is to examine the International Labour Organisations’s agenda, decent work1 forall, from a development policy perspective. The paper begins with an interpretation of decent work and howthis maybe related to contemporary approaches in human development. This section also outlines thedimensions of decent work (sometimes referred to as strategic objectives), their broad expected relationshipto each other and suggests how one can plausibly and very generally interpret these dimensions as goals incountry specific circumstances. Having set the outline of the agenda two important links to it are discussed.The first link is conceptual and suggests how the decent work agenda may be connected to a framework thatis fast gaining ground in the human development literature. This link is with the capability based humandevelopment framework which, it is argued, allows for the dimensions of decent work to be expressed associetal goals. The second link is both conceptual but also of operational value because it indicates why thedecent work agenda and indeed other social development agendas are more “realisable” in a practical sensetoday because of changes emerging in mainstream economic policy making. These changes are driven bydevelopments in economics that allow for efficiency and equity considerations to be addressedsimultaneously in policy making. It is suggested that in order to join serious on-going policy debates, it iscritical for an international institution with a social agenda to address, as a first step , the economic feasibilityof its proposed social interventions, i.e. interventions with which its institutional agenda is associated. This isthe applied focus of the present exercise with respect to the ILO agenda. Thus the next part of this paperempirically illustrates the relationship between particular dimensions of decent work and economic growth. Thebasic point made through the illustrations is that while the economic resource position of a country is criticalwith respect to what one may “expect” to achieve on a social dimension, there is a case to argue for degreesof freedom in interventions on many of these social dimensions even for countries at lower levels of economicdevelopment. Given the limitation of the data base and cross-country regression exercises as such, theillustrations are only used for the limited purpose of highlighting intervention possibility2. The paper then goeson discuss if there are any discernible linkages that are observable between decent work dimensions indeveloping countries. The last section explores how one may examine the case for simultaneity of achievementbetween different social dimensions of decent work. We then propose some provisional explanations for theexistence of simultaneity where it may be found. A summary of the preceding discussion and results concludes.
2. The development objective of decent work
2.1 The universality of the objective
Decent work argues for making interventions in enabling dimensions of living that affect thecircumstances in which a working person, given her labour and personal characteristics, starts out to achievea decent life3. These dimensions have been expressed as the strategic objectives of decent work. These areemployment, security, rights at work and representation4.
2
5There is the related larger question (still unresolved) concerning the appropriate rights based framework in whichone can place this new agenda. Since most international institutional agendas are being cast in terms of rights today, this is ageneral issue relevant to most development agencies. It is of importance because the phrase “rights based framework “ is used,in this context, more in a rhetorical sense. The issue in question is one of framework and a separate one from the constitutive,instrumental and constructive roles that freedoms play in society according to Sen (A. Sen (1999), Development as Freedom,A. Knopf , New York).There are a few frameworks to chose from. The traditional approaches are of a rights constraints varietyand rights consequentialist variety. In one rights are constraints on individual action (with no consequential justification) in theother rights are viewed as instrumental in achieving broads rights-independent goals. One is more legalistic in spirit, the otherutilitarian. Neither approach can seriously accommodate rights-realisation in the evaluation of resulting states. A third framework(which is probably more suitable to a social agenda of a development agency) can be called a goal-rights- framework . It allowsfor the realisation of rights themselves to play a role in evaluation of states. According to Sen : “A moral system in whichfulfilment and non-realisation of rights are included among the goals, incorporated in the state of affairs, and then applied to thechoice of actions through consequential links will be called a goals rights system”.(A.Sen, 1981, Rights and Agency, Philosophyand Public Affairs. Vol 11 no 1.1981).
The development objective of decent work can be characterised as being about improvements in thelived life of persons inhabiting the world of work. Since this is an agenda, expected to evolve in to aframework for policy advice in the future, its starting point is necessarily an evaluative one5. It recognises thatwhile solutions to problems in development do centrally involve economic and social policy interventions, thatoperate through society and her institutions in country-specific circumstances, the evaluation of these policy“efforts” in development, need to be ultimately seen in terms of what they do to actual lives of all people insociety. In fact the evaluation of an achievement on a decent work “goal” (i.e a strategic objective) is, in thischaracterisation, primarily in terms of how this achievement improves the lives of all in society. Thisdevelopment objective is common to all societies, because all societies are in a state of transformation anddevelopment. It is probably also the simplest common ground that universalises the aims of the ILO’s agendato societies at different levels of development. An evaluative starting point that makes it applicable to allcountries and to everyone who works in them.
2.2. Country specific conditions, institutional base and relativity of goals in decentwork
There are a few important points of perspective that ought to be noted with respect to interventions forachieving decent work . The first point is concerned with the focus on all those who work and each of the fourdimensions / strategic objectives of decent work; the second is of an institutional variety that is concerned withthe specificity of society itself; and the third, which is derivative of the first two, addresses the relativity ofdecent work goals.
While it is true that the core of policy intervention in developing countries ought to concern itself more(or at least not less) with issues of well being of their largely poor working populations many of whom do noteven have basic needs satisfied, this focus ought not to mean that objectives of decent work that are notdirectly focussed on employment generation (and therefore sometimes by implication not directly on growth)can be ignored. Typical institutional and resource circumstances tend to demarcate the set of pursuable policiesin developing countries from those that are pursuable in developed countries. This is a matter of realism, insofaras ignoring this issue makes policy prescriptions infeasible. Given the importance of keeping in view eachobjective for all on the one hand and the specificity of institutional and resource circumstances for effectivepolicy making on the other, it is important to recognise the issue of relativity of weights attached to decentwork’s universal principles in the real world. Decent work cannot argue for an absolute universal that allsocieties must adhere to, rather it argues for a given society to set its own targets on decent work objectives,and periodically re-set them at higher levels as and when it achieves these goals The role of internationalorganisations and donors can and ought to be one to facilitate countries in achieving these goals, not inimposing them in any circumstance. Therefore it is crucial to understand that the weights attached to these
3
6Clearly “democracy” facilitates this setting of weights within society, although as discussed later the question isabout the democratic process and not only about voting.
7There is definitely a characterisation issue here. Security, work rights, and representation based dimensions of decentwork are not only connected but can also be seen as ‘attributes’ of employment.
8This space between society and work spheres is, in addition to distributional processes, also reflective of the extentto which non-market transactions obtain in society that affect both relative prices and well being.
9There is some literature that shows that efficiency wages improve productivity, just as efficiency benefits can bereaped by worker involvement in decision-making. So workers’ participation and better wages can in principle be demonstratedas a part of the profit motive itself. Whether this can be achieved through the market only or if there is a role for both advocacy
objectives are best set by society itself 6, and that these can differ according the social and economicconditions in which a society finds itself. This does not preclude the idea of a critical minimum or floor,determined by society, that each of these objectives can be subject to.
Thus global goal relativity, country specific civil society determined priorities within objectives, andpossible minimums that each objective may be subject to in any concrete situation are issues that are importantto recognise. Practical and useful policy making that is meaningful in a real society must keep these featuresin mind.
2.3. Revisiting the strategic objectives of decent work
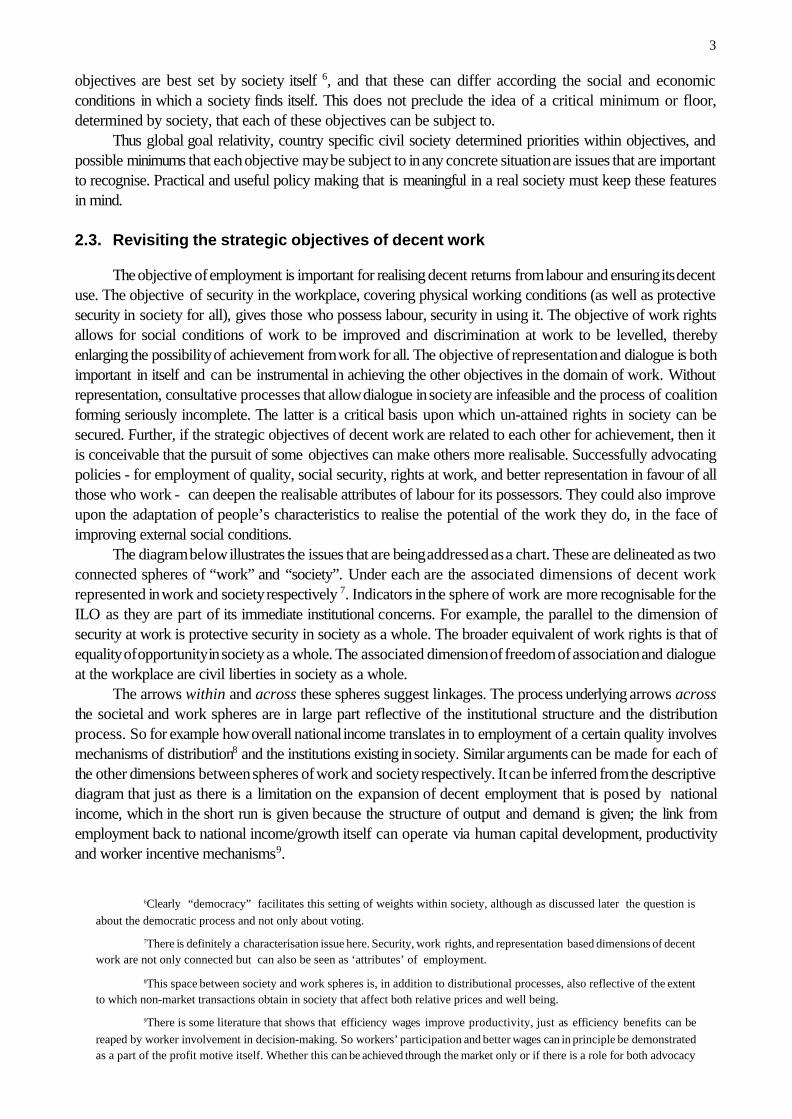
The objective of employment is important for realising decent returns from labour and ensuring its decentuse. The objective of security in the workplace, covering physical working conditions (as well as protectivesecurity in society for all), gives those who possess labour, security in using it. The objective of work rightsallows for social conditions of work to be improved and discrimination at work to be levelled, therebyenlarging the possibility of achievement from work for all. The objective of representation and dialogue is bothimportant in itself and can be instrumental in achieving the other objectives in the domain of work. Withoutrepresentation, consultative processes that allow dialogue in society are infeasible and the process of coalitionforming seriously incomplete. The latter is a critical basis upon which un-attained rights in society can besecured. Further, if the strategic objectives of decent work are related to each other for achievement, then itis conceivable that the pursuit of some objectives can make others more realisable. Successfully advocatingpolicies - for employment of quality, social security, rights at work, and better representation in favour of allthose who work - can deepen the realisable attributes of labour for its possessors. They could also improveupon the adaptation of people’s characteristics to realise the potential of the work they do, in the face ofimproving external social conditions.
The diagram below illustrates the issues that are being addressed as a chart. These are delineated as twoconnected spheres of “work” and “society”. Under each are the associated dimensions of decent workrepresented in work and society respectively 7. Indicators in the sphere of work are more recognisable for theILO as they are part of its immediate institutional concerns. For example, the parallel to the dimension ofsecurity at work is protective security in society as a whole. The broader equivalent of work rights is that ofequality of opportunity in society as a whole. The associated dimension of freedom of association and dialogueat the workplace are civil liberties in society as a whole.
The arrows within and across these spheres suggest linkages. The process underlying arrows acrossthe societal and work spheres are in large part reflective of the institutional structure and the distributionprocess. So for example how overall national income translates in to employment of a certain quality involvesmechanisms of distribution8 and the institutions existing in society. Similar arguments can be made for each ofthe other dimensions between spheres of work and society respectively. It can be inferred from the descriptivediagram that just as there is a limitation on the expansion of decent employment that is posed by nationalincome, which in the short run is given because the structure of output and demand is given; the link fromemployment back to national income/growth itself can operate via human capital development, productivityand worker incentive mechanisms9.
4
(sharing knowledge) and a special role for government is a separate issue. The literature covers many domains but is essentiallybased on the idea that a workers productivity is linked to consumption (See Basu (1984) for a survey).
10 In fact in any commoditized economy all benefits have associated costs. Thus, for example, it is erroneous to suggestthat some rights have no costs simply because they are legal or juridical in nature and expressed as such. Secondly in any case,if for example workers gain from certain rights, the argument for proposing those rights ought to be based on the benefit accruingto workers as a result of these rights, and not that since these rights appear to be “costless” while also “benefiting” workers, theymight as well be adopted by employers.
Decent work dimensions in work and society
The first methodological point to be made in this context is to state upfront the agenda’s focus is on allthose who work. This means that in an evaluative sense, costs and benefits of interventions need to be seenin terms of what they do to all those who work, and not just to those on whom they may be first directed.
Decent employment , security at work and protective security are however dimensions where costs canbe directly evaluated. Consequently, there are policy concerns as to how affordable these are with respect tonational income and its growth and whether or not they can in-themselves also be seen as enhancing growth.Most aspects of work rights and representation are institutional and legal in nature but that does not mean thatthey do not have costs10. For example non-discrimination at work can mean transformations in the wagestructure and can thus effect relative prices in the economy. Equality of opportunity may on the other hand alsohave more direct distributional effects on national income and growth. Dialogue (understood in the ILO astripartite consultation) linked to civil liberties and democracy is an important mechanism for the achievementof any goals in society. The relationship of civil liberties to national income and growth arguably operatesthrough the systemic confidence it induces in people to proceed on chosen priorities according to consensus.There are obvious broader social costs and benefits associated with these too. Consequently, mostinterventions in the improvement of social dimensions are to be understood as broadly “distributional” in natureand enhancing equity in society.
There is another important distinction that we need to keep in mind which relates to expectations withrespect to historical time. This point is in principle applicable to all social agendas and not just that of decentwork. We need to distinguish between indicators whose dynamic or process of change primarily has anindividual focus and those indicators whose process of change is more societal, institutional or structural
5
11 Recent work suggest that social dimensions improve in a certain sequence with individual life conditions improvingfirst and fast and the structural or what the author calls social organisational components changing more slowly and unevenly(B. Hughes (2001), Global Social Transformation: The Sweet Spot, The Steady Slog and the Systemic Shift, EconomicDevelopment and Cultural Change Vol 49. No.2 , 2001).
12 Trade-offs can be shown exist both between social dimensions and between groups. Any two social interventionsthat have costs can be expressed as competing claims for finite resources, and thus preference for one may be seen as apreference over the other. These posited trade-offs between interventions in social dimensions taken on their own are not veryrealistic, since they implicitly assume that all populations will equally benefit from any intervention. The issue here thenbecomes an abstract one of social choice. The other type of trade-off is more complex and also more relevant to socialinterventions in a typical unequal (more realistic) society. Here the benefits of social interventions by the State made in the nameof society can become subject to “capture” by particular groups. Therefore in this case, the manner in which and the assumptionsunder which an intervention is made (however general and encompassing for all in society it may be in intent) becomes crucial.Here the trade-offs (from the point of view of the social intervention which needs to keep as true to its intent of maintaining thewidest possible coverage as is possible) are between social groups who can or cannot respectively access the benefits of a socialintervention or a societal right. There is also the important related issue here of whether we assume that “targeted” approachesto social interventions can work additively. If we do, then this would mean that groups initially un-targeted (or excluded) couldsmoothly and costlessly be brought in to the population benefiting from the intervention over time . On the other hand, it couldbe also be held that additivity cannot be assumed and that coalition-forming and exclusion become such endemic characteristicsof benefiting and non-benefiting populations respectively , that expanding the targeted populations and the intervention’sbenefits over time to a wider set of people is neither a smooth nor a costless process.
13 A. Sen (1999), Development as Freedom, Knopf. New York
in nature. For example better employment or greater security are directly enjoyable by individuals, while it isless meaningful to talk of the achievement of democracy or gender equality or the freedom of association byan individual. The latter come about as society-wide changes and imply transformations in the social structures.Clearly individuals can gain from these societal changes, however the categories are different and there arereasons why we may find that they move differently during the process of growth11.
From the point of view of policy intervention there are two types of concerns we have. The first can becalled an intrinsic set of concerns and the second an instrumental set. Intrinsic concerns are reflected in anobserved deficiency with respect to a social dimension. So for example, if some form of gender inequality, anindicator of discrimination, is observed in a society (which arguably results in inequality of rights between sexesat work), this observation on its own ought to be sufficient to trigger some policy action. Such a policy actcould also in itself be seen as an effort to reach an independent developmental goal (gender equality). In otherwords, intrinsic concerns only need the establishment of inequity in a given social dimension for society-widepolicy action. Instrumental concerns on the other hand are about the effects of a deficiency/excess in anindicator in one development dimension on indicators in other development dimensions. There are also twotypes of questions to look at here. One concerns the possibility of virtuous and vicious circles resulting froma possible simultaneity or connectedness in achievement of social indicators. This is an area explored in thispaper. The second question is that of trade-offs, between indicators of social dimensions on the one hand andbetween social groups affected (or not affected) by actual interventions in those social dimensions on theother12. The latter are critical to appreciate but can be more appropriately examined at a country specific level.Although the discussion here does touch on the latter, it does not do so sufficiently. This should be a subjectof further research.
3. Decent work, freedom and human development
Decent work is only an agenda of an international institution, while the capability approach, (of whichdevelopment seen as freedom is an example), is more of a general theory of evaluation of human welfare.Decent work is connected to both as a point of departure. The connection between the notion of“development as freedom” due to the work of Sen13 and the spirit of the decent work agenda is at one level
6
14 A. Sen, (2000), Work and Rights, International Labour Review, 2000, Vol 139, No. 2.
15 In fact the interesting link between Section 4.1 below and the discussion here is on the freedom to transact.
16 A. Sen (1987), Commodities and Capabilities, Oxford University Press; A. Sen (1992), Inequality Re-examined,Oxford University Press.
17 In the second part of this paper, we identify a policy position- that is arguably a representation of the commoditybased view- that focuses on national income only.
1 8Although the capability approach is presented normally in terms of the individual, it has important normativeimplications for distribution and equality in the (macro) world in which the individual may be deemed to have a greater chanceof realising her capabilities. Another issue that needs to be the subject of further research to deepen the link between thecapability approach and the individual in the decent work agenda concerns the type of application of the capability approach.
an obvious one14. Sen’s conception of development consists of the idea of expanding freedoms in both socialand economic spheres of life. For societies in which individuals or groups face obvious un-freedoms in thesespheres, development means the removal of un-freedoms. An unfreedom must be removed in a sphere of lifein a meaningful sense if freedom in it is to be expanded in it a positive sense. These un-freedoms can beexpressed variously, for example as goals of: freedom from hunger, or the freedom from the lack of basichuman rights, or the freedom from avoidable illness and so on15. The expansion of freedoms/ removal ofun-freedoms and the advancement towards these goals in one sphere of life (e.g freedom from hunger) areboth important in themselves as goals, and they can have enhancing effects for overcoming other un-freedoms(e.g advancing on freedom from hunger arguably also advances one on the front of freedom from avoidableillness). Taken individually or together these social advances- that have a meaning in themselves- can haveinstrumental effects too. They can also furnish the building blocks on which consensus coalesces and provideplatforms to society for determining priorities and act according to its expressed values (e.g in the presentexample, this could be an open debate on minimum acceptable standards of living and well being in thatsociety). Decent work that is in part a rights based-agenda (which sees certain rights in the world of work asgoals for societies to strive for) can be characterised as being close to such a conception of “development asfreedom”.
This brings us to the connection of decent work with the capability approach16. Initially developed bySen as an ethical investigation in to the issues of distribution and inequality, it has been developed and appliedby him and others to the understanding of dimensions of well-being ranging from poverty, famines, gender,justice to development itself. In contrast to competing theories of welfare, the capability approach can dealwith interpersonal differences between individuals, as it is focussed on the chosen ends for which thepossession of commodities requires a “conversion”. This essentially means that not only is the possession ofan asset or commodity important in the approach, but also what a person is able to do with it17. Secondly, forour purposes we need to note that the capability approach takes in to account external conditions under whichindividuals deem themselves to be “satisfied”, such that the idea of satisfaction is not restricted to a sociallydisconnected metric of individual utility or happiness. This essentially means that not only is the possession ofa commodity or asset and the intended aim of using it by the individual important in the approach, but also thefact that people must be considered on a universal basis. In other words the fact that some persons may besatisfied by less, simply because they take their un-freedom as a fait accompli, does not mean that inevaluating their position we should share their despondency. Consequently the importance of individualsatisfaction does not allow one to take as given social and structural exclusion between persons and groupsin society.
The capability approach is thus centrally concerned with what a person actually succeeds in doing witha commodity or asset given (1) its characteristics; (2) her own personal characteristics; and (3) the external(natural and social) circumstances faced. When we place the decent work agenda here, what we canimmediately see is that it focuses on labour. It aims to enhance the characteristics and attributes of labour forall its individual possessors, taking in to account the actual external circumstances faced by them such thatthey succeed in living a decent life. These links of the ILO agenda with the capability approach need to be thesubject of further conceptual work18.
7
There are two types of application of the capability approach. It can be used to examine the options a person has (given hercapability set) or the choice of the actual functioning combination a person makes (given by her chosen functioning vector). SeeJ. Foster and A. Sen, Annex in A. Sen, (1997) On Economic Inequality, expanded edition, Oxford, Clarendon.1997. It needs tobe worked out which application is more appropriate for the individual focus of the decent work agenda.
19 There is a vast literature on this topic. For an overview of issues, See, Kanbur, R. and N. Lustig, 1999, “Why isInequality Back on the Agenda, Paper prepared for the Annual Bank Conference on Development Economics, World Bank,Washington DC, April 28-30, 1999. Although it needs to be said that there are (political) reasons why in a globalizing (post-coldwar) single world, with easy information access, the need for international institutions to at least “appear” to address social andeconomic policy issues simultaneously in developing countries also becomes politically expedient .
20 Since we are concerned with labour it may be useful follow through the implications for it in an orthodox framework,at the economy-wide and firm-level respectively. The core of orthodox macro policy for labour is regulatory, and only in so faras it ensures that market failure is avoided. Influencing the returns to labour directly (i.e. wages) is considered counter productiveas it is an “equity-driven intervention” and in the framework leads to a loss of jobs at a macro level. However at a micro leveldespite its restrictive informational and market assumptions, the framework can yield results with different implications. Forexample it can recognise bargaining as a method of arriving at efficient solutions and can thus make a case for the improvementof workers conditions at the level of the firm. Therefore policy positions that allow for worker involvement in decision-makingat wage setting at the enterprise level may nonetheless hold that interventions in wage formation at a macro level producesunemployment. See J. Stiglitz, Democratic Development as the Fruits of Labour, Keynote address, IRRA, Boston, 2000.
21 The first two fundamental theorems of welfare economics demonstrate that every equilibrium in a perfectlycompetitive economy is Pareto-efficient , and secondly under a set of conditions every Pareto-efficient allocation can be achievedby an equilibrium in a perfectly competitive economy.
4. Economic performance and thedevelopment objective of decent work
4.1. The development policy implications of the new and old economics
The agenda of decent work recognises the importance of economic growth to development. The first question that is to be addressed in this context is about the relationship of decent work
dimensions to the level and growth of national income. The answer to this question is needed both forillustration and for persuading policy makers, who are agnostic on social agendas (for example in the ILOcontext- the decent work agenda) when confronted with the issue of growth, to change their minds. This maybe less difficult to accomplish today than it may have been in the past, because of both an internal and anexternal reason. The external reason is that the need to reassess the impact of economic policy on the worstoff has become imperative because of the slow progress in eradicating human misery in the world. The internalreason is to a significant extent theoretical, namely that economics as a discipline has undergone a changethat can allow for the simultaneous examination of “social” and “economic” spheres of society more readily19.The implication of this change for institutions with social agendas (agendas that were previously taken on boardas auxiliary additions to the mainstream of economic policy making) is serious. The basis of this change isoutlined in the present section.
A position still not uncommon in developmental policy making today is a legacy from the past that allowsfor the separation between efficiency (read economic) and equity (read social) issues. This position in itsstricter theoretical versions argues that economic policy should focus on efficiency and need only beconcerned with optimising resource use (including labour20) and social policy needs to focus on equity and thisbe geared towards effecting non-distortionary lump-sum transfers and improving public good access, that dealwith inequities produced by the market mechanism .These powerful and important results of welfare economicswere importantly based on special competitive market and costless information assumptions as well as the ideathat instruments for lump-sum transfers existed 21. The crucial point however is that the separability of efficiencyand equity in policy making is more amenable to justification if its underlying real world also corresponds tothe one accompanying the traditional welfare results. These traditional assumptions have been relaxed overthe years to yield results which show that resulting equilibria with the now relaxed assumptions need not be
8
22 Theoretically, it is well accepted now that with costly information (often in models with external uncertainty aswell), a whole host of situations can ensue ranging from those involving externalities to market failure, and that informalinstitutional arrangements and implicit contracts are precisely the ways in which society tries to overcome these problems. Ifresource allocation is not necessarily optimal and efficient with free markets in any real word situation then the raison d’etreof separating economic and social policies becomes redundant as well. The technical literature is vast in this area, but for anaccessible development application see Karla Hoff and J. Stiglitz,(1993) Imperfect Information and Rural Credit Markets, in TheEconomics of Rural Organisation, K.Hoff, A. Braverman and J. Stiglitz (ed) , World Bank, Oxford, 1993; and for a broader viewon development policy implications of this see J. Stiglitz , Towards a New Paradigm for Development: Strategies, Policies andProcesses, Raul Prebisch Lecture, UNCTAD, Geneva, 1998.
23 For an on-going research programme in this field, See Pranab Bardhan and Samuel Bowles (1998), The Effects of Inequality onEconomic Performance: A Progress Report and Proposal,1998, Network on the Effects of Inequality on Economic Performance. Institute of InternationalStudies; UC Berkeley. This is a MacArthur Foundation - funded Network on the Effects of Inequality on Economic Performance.
24 Following from footnote 21, the two theorems of welfare economics, (apart from being re-examined under morereal world assumptions and generating results that show inefficient outcomes), have also been examined (mostly by Sen)in terms of freedom. Amongst other things this has produced a distinction between two roles of the market, and brings us tothe question of the freedom to transact. This may indeed be what is partly at stake in the linkage between the two directionsthat the re-examination of welfare theory has taken. The traditional welfare results established the “superiority” of the marketmechanism in the sense that the market was shown to have instrumental value (when governed by perfectly competitiveassumptions) in generating an efficient allocation of resources . While challenging these results affects the argument about the
efficient 22. While the non-existence of or imperfections in lump-sum transfer instruments in theory haverevealed the “substituting” nature of efficiency and equity interventions (i.e. trade-offs), literature oninstitutional arrangements especially in developing country contexts (by relaxing costless information and otherassumptions) have sometimes shown “complementarity” between equity and efficiency23. In short economicefficiency and equity are not separable in the real world, they can be shown to be either complementary orsubstituting, which also means that “re-distribution” (read: interventions in social spheres) in principle can eitherincrease or decrease economic efficiency. There are therefore both complementarity emphasising results andthose that emphasise trade offs.
Orthodox theoretical views of course translated easily in growth-exclusivist policy positions, whichgenerally hold that policy for economic growth should proceed as if efficiency and equity issues are separable.Today in the context of theory with more realistic assumptions about the world newer versions of earliergrowth exclusivist positions often assume that policy should proceed as if those decisions that are bound byefficiency-equity trade-offs ought to be decided in favour of efficiency. Quite apart from the issue of thelegitimacy of inferring “policy positions” in this way from the original theory, these positions also tend toreproduce a base-line model of the world in which the welfare potential of human beings (and issues pertainingto collective and individual human behaviour that can enhance or block that potential) is separated from theheart of policy making or can be ignored in fundamental respects.
In the area of development, there is work that is beginning to challenge such policy positions moresystematically. Of course, in order to do this these positions must rely on results that either suggest that someinterventions for equity enhancement can lead to increased efficiency or not affect it, or argue that efficiencyconcerns under some conditions, where trade-offs do exist, could to be decided in favour of equity. Assuggested some of this work is now systematically engaged in micro level analysis on the efficiency enhancingeffects of inequality reduction. There is of course other more direct work, especially in non-economicsdisciplines, that tends to argue that policy instruments for growth are not always good for the poor, especiallyin the short-run and in the more “dis-aggregated” perspective of a community or in group-specific cases.
It is of course still not clear what an inclusive notion of human development on the one hand andeconomic policy making that does genuinely allow for efficiency and equity concerns to be addressedsimultaneously (as opposed to holding to the primacy of one on the other on a priori grounds), will bringforth as an applicable policy framework in the future. There are important advances but we are still a distancefrom an alternative full fledged “human development policy framework”. Movement towards the integrationof the new economics and the capability based human development literature is possibly one of the areas fromwhere this alternative can be expected to emerge in the future 24.
9
instrumentality of the market, it does not directly mean that the market mechanism insofar as it still gives constitutive freedomsto people is not potentially superior in this respect.
25In terms of general acceptability while this is a relatively less difficult task for institutional agendas on health andeducation for reasons mentioned , it is more difficult for other agendas, e.g. as on employment or the environment.
26These positions are also often compounded when one group of nations (e.g. often developed ) is seen by another(e.g often developing) to offer “advise” that can be seen in terms of such divides. The compounding factors are other relateddebates like the one on protectionism, trade and labour standards . For example a rights exclusivist position coming fromdeveloped nations as advice can be interpreted as diversionary and protectionist by developing countries (who may then takeon a growth exclusivist view in reaction).
27 This view may not be as clear cut in a prescriptive sense in the present globalized world. The historical counter-factual, which such arguments ultimately entail, are nearly impossible to demonstrate.
28 Libertarian views of a stronger variety imply an absolute priority on grounds of liberty to certain libertarian rights,which cannot be violated even if they lead to violating substantive freedoms of others and entail morally horrific results. Thiskind of objection is linked to libertarian views on redistribution mechanisms themselves as these suggest that if there is acompelling moral reason for supporting the worst off in a society then it should be through private charity. (See RobertNozick,(1974) Anarchy State and Utopia, Basic Books , New York). In contrast liberal views that allow for interventions forsocial redress, like Rawlsian ones tend to suggest that inequality is tolerable because it enhances motivations and incentives. Infact sometimes this position can be interpreted to suggest that inequality is “just” when and because it is neccessary to improvethe position of the worst off.(J. Rawls (1971), A Theory of Justice , Oxford University press, 1971)
29 It has been suggested above that there is literature that shows that at a micro level inequality can lead toinefficiencies. At a macro level the views go either way (See R.Kanbur, 2000, Income Distribution and Development, inHandbook of Income Distribution , Vol. 1 , North Holland). It is however not clear whether removing inequalities at the micro
4.2. The immediate challenge for policy makers
Historically the expansion of growth-exclusivist policy positions towards a more inclusive notion ofdevelopment came about importantly in the 1980s when the inclusion of health and education as validdimensions of poverty were accepted by many international and national policy making bodies. The focus on“institutions” as a part of making policy effective is going through a similar process of absorption today in theinternational system. Therefore differences between policy positions are increasingly being focussed not somuch on ends but on means. Namely on the appropriate policy instruments.
For institutions espousing specific social agendas, however, one necessary step in this direction -i.e. offully engaging in debates on policy instruments - is to try and first demonstrate the feasibility of intervening ontheir chosen social agendas with respect to national income, and exploring the wider characteristics of suchagenda-specific interventions. This is in fact the central empirical aim of this paper, with respect to the ILOagenda. As suggested this could also be useful to have in place for taking the next step, i.e. to participate indebates on impact assessments of appropriate policy instruments25 - a direction in which the important policydebates are moving.
A challenge for policy makers is thus to resist conceptualising the development process in particularnational economy contexts as either-or situations. If on the one hand we have growth exclusivist viewswhich hold social dimensions and associated rights as “secondary” for countries at low income levels, we canalso have social dimension centric-rights exclusivist positions that argue for the “primacy” of the latter atall levels of income. What is at stake is the assumption we make on the interaction between the two. Thesepositions either suggest that growth definitely produces well-being and rights for all (for which economy-widelonger-run evidence is often cited) or that well-being and rights definitely produce growth (for whichenterprise, firm or group level evidence of a shorter run and of a more case specific variety is cited)26 . Since decent work is a social agenda we focus here on growth exclusivist positions as views to bequalified. At an historical level, as was suggested above, arguments based on the cases of sequencing ofgrowth preceding rights, as in the histories of parts of present day Western Europe, are invoked to suggestwhat may have been the case in the past must be true for today27. Second, it is argued that interventions forequity which improve or alter distribution, important as they may be, are best avoided on a mix of grounds ofliberty (negative freedoms)28 and generating disincentives for investment and therefore growth itself 29 . Thirdly,
10
level (or in the world of implicit contracts) always translates in to inequality reduction at the macro level, and that when it doeswhether it leads to greater economy-wide efficiency as well.
30 The point is that advocacy based on participation is a solution to problems of monitoring. Thus in an institutionalcontext, the role of an advocacy organisation is about providing individuals and groups in society information to use and actupon. So the scaling-up of freedoms assumes the participation of citizens and their leading the process of change. Similarly thisissue of monitoring and agency comes up seriously if a set of values is imposed, not if it is built up by consensus in society.
31 The results are based on the nation state taken as a unit of analysis, and are therefore valid at that level ofaggregation. Recent literature on this topic concurs on the negative relationship between growth and poverty. (See for exampleE.Anderson and H. White (2000), Growth versus Distribution : Does the Pattern of Growth Matter, Institute of DevelopmentStudies, Sussex (mimeo); David Dollar and Aart Kraay, 2000, Growth is Good for the Poor , World Bank (mimeo), J.Litchfieldand M. Lipton, 2001 , Successes in Anti-Poverty : National Level Poverty Performance (ILO , Employment Paper, 22,(forthcoming)). It has however also been suggested that low levels of initial inequality are also good for growth. If this is thecase, then one policy challenge would be how to move from one steady state of high inequality to another steady state of lowerinequality without sacrificing on growth. See M. Ravallion,2001, Growth Inequality and Poverty: Looking beyond averages,WIDER Development Conference (mimeo).
32 This is of course not to say that systemic changes alter past distributions immediately. This is a point we mentionlater in Section 7 in discussing country performance on decent work indicators in transition economies.
it is suggested that effective interventions in rights-based spheres of society suffer from an agency problem.This means that implementation of direct social policy when attempted on-scale is both difficult and is un-monitorable 30. Important as these arguments are, suffice is to say that there is more room for debate andempirical research on these matters. The position of policy makers agnostic to the simultaneous pursuit ofhuman development with growth (on “practical” grounds) is summed up well by the rhetorical question:
Important as they are, can countries at low levels of “development” really affordprotective and active freedoms before sufficient growth and accumulation have takenplace ?
This question, as should be apparent from the foregoing, is equally about the way social policy is madeas it is about what social policy is. In fact this is where one part of the debate relevant for policy makers issituated. Economic growth we know is good for reducing poverty, this is an empirical result that has rightlybeen emphasised in the literature and cannot be seriously questioned 31 . However in the last two decades ithas also been true that the poverty problem has not been reduced to the extent desired. The emphasis onproportions (which have gone down in many instances) in preference to numbers (that have gone up in manyinstances) has sometimes been misleading and at other times simply disingenuous. The point is that good asit is, growth has often not been enough. It is also true in an historical sense that the sole focus on equity (inmaterial terms at least) embodied in the experience of ex-socialist countries now “in transition”, led to a growthfailure. Here equity de-linked from growth may have become unsustainable32.
However, the matter at hand is that for those directly affected by poverty, policy designed to generategrowth has brought with it levels of employment quality, health, education and rights that have not allowedentire populations to be freed of poverty. Correspondingly for national governments it has generated afundamental concern for their citizens (levels of corruption and institutional imperfections notwithstanding). Forother organisations, especially international institutions advising countries on policies of growth and its socialdimensions respectively, there is a jurisdictional crisis. This is why most development agencies today have acommon stated goal of “poverty reduction”. The challenge, however, is not simply one of joining forces togenerate “additive” programmes but one of conceiving policy advice simultaneously.
The question then is both one of policy integration and institutional coordination. Integration howeverhas to be real, and there are some signs that institutions with policy leverage concerned with growth arerecognising that “poverty reduction” needs be addressed and seen simultaneously with the formulation of
11
33 The joint responsibility of the IMF and World Bank in the Poverty Reduction Strategy Papers (PRSP) process, andthe PRSP’s consistency requirement with the IMF’s lending facility (the Poverty Reduction Growth Facility (PRGF)) showspotential for this. However it remains to be seen whether there is real scope for countries proposing “alternative ways” ofachieving growth in the PRGF. As suggested above, this would entail a discussion on policy instruments and their impactassessment on at least all the worst off in society.
34 Some points that are made in the empirical illustrations are more focussed on qualifying the views that are heldwithin the institution, and which in some cases may be more obvious to those outside it.
35 The literature is vast as the discipline of economics itself. A. Sen (1988), The Concept of Development, inHandbook of Development Economics Vol.1 , North Holland (1988).
growth strategies and not merely as an add-on33. The focus on growth and the centrality accorded to it isnecessary but if we are to reach for an inclusive developmental objective, growth on its own is unlikely to besufficient to deliver the internationally set goals on poverty reduction within an acceptable time period.
Although we have briefly put the issue of interventions in social dimensions in its wider developmentpolicy context, the aim of this paper is both a specific and a preliminary one. It is namely, to ask howeconomic growth (understood as an expansion of per capita national income), relates to indicators of socialdimensions that an international institution focussing on work and labour is concerned with34. We explore threespecific questions in this regard.
• First, whether there is some demonstrable scope for interventions in these dimensions, given the
ultimate “constraints” that resource levels and their growth may impose on countries?
• Second, are there any linkages that are discernible between the four dimensions of ILO’s agenda ?
• Third, if there is a basis to look for simultaneous movement on these dimensions.
5. How feasible are policy interventionsfor promoting decent work?
5.1. The dimension of employment
There is little doubt that the expansion of wealth in society must make a contribution to employment.Consequently the link between economic growth and the quality of employment has rightly been central toboth the discipline of economic development and development policy making35. The positive link betweenthe quality of employment achieved with higher level of resources, is not moot, it is however notstraightforward to show. We use a few examples to illustrate the issue.
12
36 GNP per capita is gross national product divided by midyear population. PPP GNP is gross national productconverted to international dollars using purchasing power parity rates. An international dollar has the same purchasing powerover GNP as the U.S. dollar in the United States. For more information, see World Development Indicators Tables 1.1, 4.11,and 4.12.
37The country classification is the World Bank’s. The World Bank's main criterion for classifying economies is grossnational product (GNP) per capita. An economy is classified as low-income, middle-income (subdivided into lower-middle andupper-middle), or high-income. Low-income and middle-income economies are referred to as developing economies. For example,for the 1990ss economies are divided among income groups according to 1998 GNP per capita, calculated using the Atlas method.The groups are: low-income, $760 or less; lower-middle-income,$761–3,030; upper-middle-income, $3,031–9,360; andhigh-income, $9,361 or more. See any recent World Development Report for details.
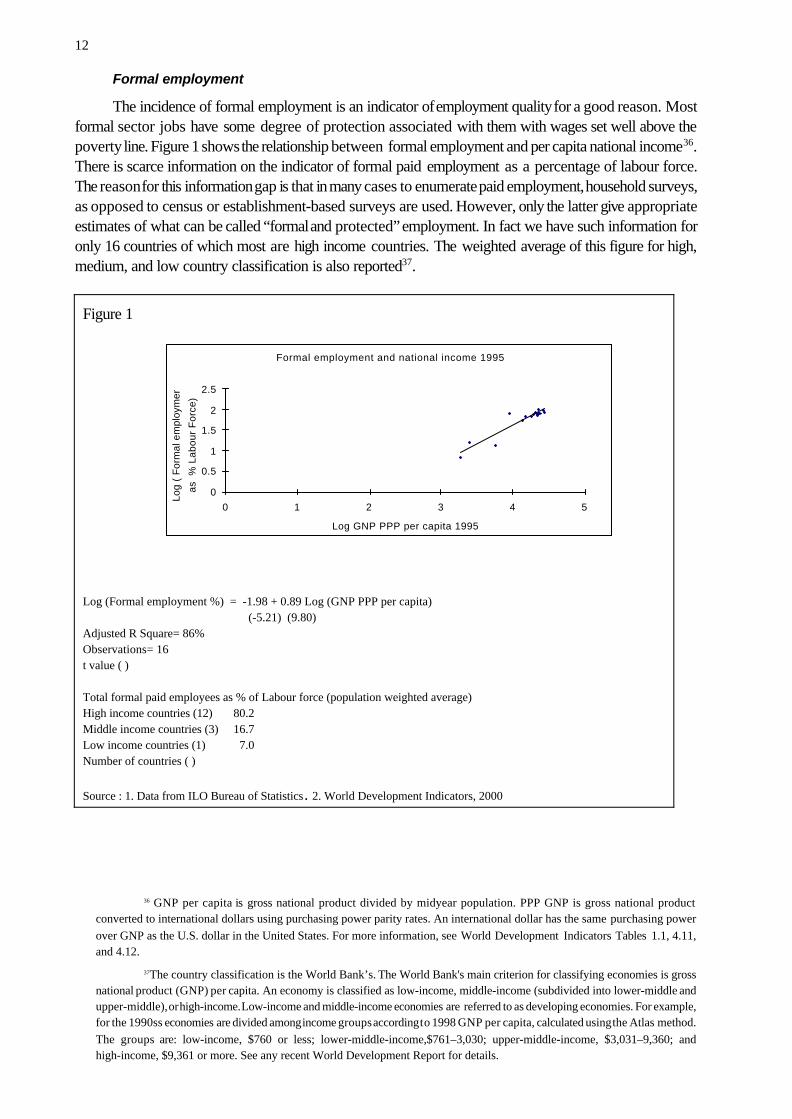
Formal employment and national income 1995
0
0.5
1
1.5
2
2.5
0 1 2 3 4 5
Log GNP PPP per capita 1995
Log
( F
orm
al e
mpl
oym
ent
as %
Lab
our
For
ce)
Formal employment
The incidence of formal employment is an indicator of employment quality for a good reason. Mostformal sector jobs have some degree of protection associated with them with wages set well above thepoverty line. Figure 1 shows the relationship between formal employment and per capita national income36.There is scarce information on the indicator of formal paid employment as a percentage of labour force.The reason for this information gap is that in many cases to enumerate paid employment, household surveys,as opposed to census or establishment-based surveys are used. However, only the latter give appropriateestimates of what can be called “formal and protected” employment. In fact we have such information foronly 16 countries of which most are high income countries. The weighted average of this figure for high,medium, and low country classification is also reported37.
Figure 1
Log (Formal employment %) = -1.98 + 0.89 Log (GNP PPP per capita) (-5.21) (9.80)
Adjusted R Square= 86% Observations= 16t value ( )
Total formal paid employees as % of Labour force (population weighted average)High income countries (12) 80.2Middle income countries (3) 16.7Low income countries (1) 7.0Number of countries ( )
Source : 1. Data from ILO Bureau of Statistics. 2. World Development Indicators, 2000
13
38 A social floor can be conceived of as a redistribution provision by the State to cover those whose incomes fall belowwhat may be socially acceptable. This can be a combination of effective minimum reservation wage levels and a functioning socialinsurance system.
39 On top of this, because of definitional reasons, large parts of the workforce that are involved in work as home-workers are not even recognised as “employed”. There has been much important work in the area of intra-household distributionin the last decade or so.
Although Figure 1 suffers from a lack of data and is over representative of high income countries, itis also definitely the case that there is limited amount of such employment in lower income countries. Giventhese qualifiers, Figure 1 indicates a few things. First, that on an ideal notion of formal employment, whichin many ways suggests one route to achieving the employment objective of the ILO agenda (i.e employmentin decent conditions), we can expect higher levels with the higher levels and growth of national income.Second, there are rather large percentages of populations that are not covered as we move down thenational income ladder. Third, since the fit in the regression is so good (the unexplained variation being lessthan 14 per cent), the possibility of policy intervention to increase this kind of employment directly on-scale,i.e. increasing formal and protected jobs by policy fiat, may be problematic. Although, this is also intuitivelyobvious, it is particularly important to explicitly recognise.
We have focussed on a particular type of employment, the figure however points to general problemsassociated with the measurement of employment in developing economies. If employment is consideredto mean the number of jobs in an economy it is in part a definitional matter, because societies always havesome level of resources, most societies do grow, and a majority of people who can work do work in allsocieties. But if we are concerned with both the quantity and quality of all employment then we areconcerned with not only those who enjoy decent employment but those who do not enjoy decentemployment, as well as those who work but may not count as employed and about whose conditions ofwork little is directly known. Those who do not enjoy decent employment are a significant percentage ofworkforces in developing countries, and by that token in the world. The link between social well being andemployment is at the core of this matter. The point is simple. Employment is supposed to generate incomein a commoditized economy, and income is a critical means of attaining well being. In many developingeconomies, that at best possess an incomplete social floor38, the observed “fragmented” labour market islinked to deprivations in the space of well being. So we get employment categories that reflect varyingshades of irregularity, insecurity, rightlessness and voicelessness39. By the same logic, it is also true that inmany developed countries where minimum social floors exist, even though labour markets do getsegmented a link to basic well being is maintained.
It would not be unreasonable to hold that since the growth experience of the last two decades,barring notable exceptions, has shown that the increases in this category of good employment have beenslow at best, we need to ask ourselves another type of employment question that focuses on more of thosewho work, or at least larger parts of the labour force, excluded from the illustration given in Figure 1.
Informal employment
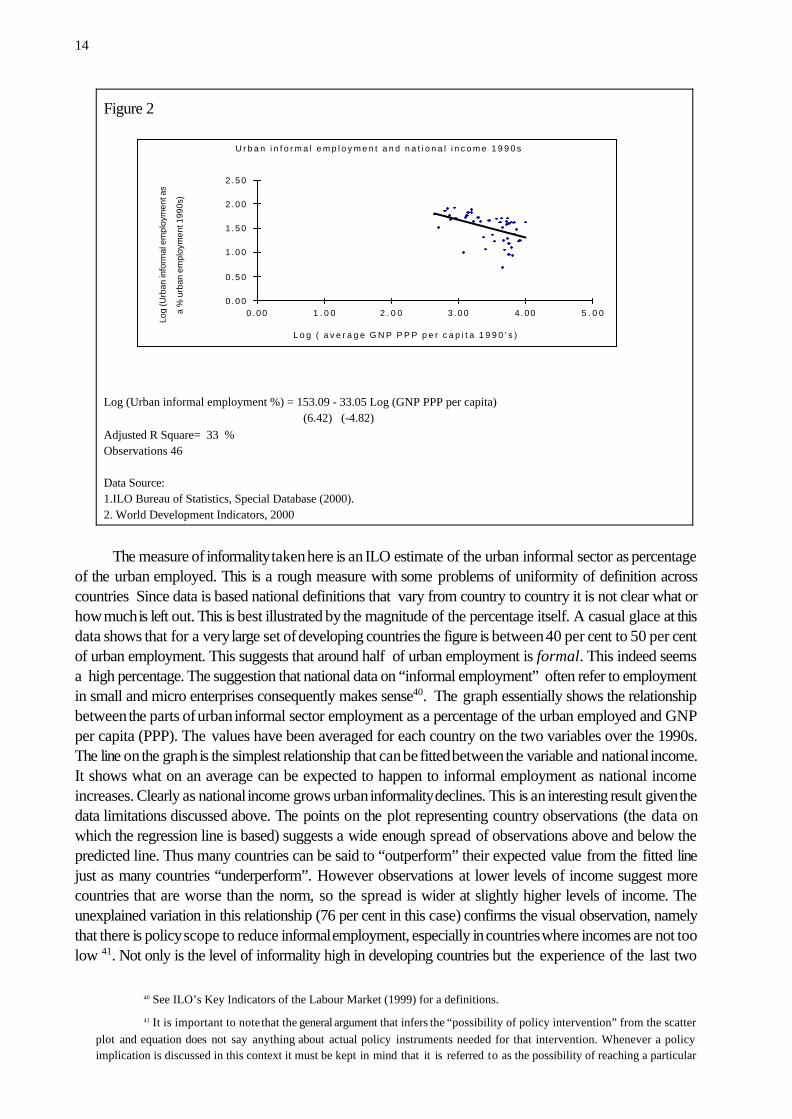
The category of the informal sector employment is amorphous and based on left-over or residualdefinitions. Moreover, the informal parts of a typical developing economy can also include relativelyprosperous people. Many self-employed are part of informal sectors and many of these are non-poor.However, in an overall sense informal activities do imply, at least in net terms, ill being of the averageperson inhabiting its labour market relative to the rest of society. Figure 2 shows a scatter plot of theregression between an estimate of some those who work in the urban informal sector as a percentage ofurban employment and national income.
14
40 See ILO’s Key Indicators of the Labour Market (1999) for a definitions.
41 It is important to note that the general argument that infers the “possibility of policy intervention” from the scatterplot and equation does not say anything about actual policy instruments needed for that intervention. Whenever a policyimplication is discussed in this context it must be kept in mind that it is referred to as the possibility of reaching a particular
U r b a n i n f o r m a l e m p l o y m e n t a n d n a t i o n a l i n c o m e 1 9 9 0 s
0 . 0 0
0 . 5 0
1 . 0 0
1 . 5 0
2 . 0 0
2 . 5 0
0 . 0 0 1 . 0 0 2 . 0 0 3 . 0 0 4 . 0 0 5 . 0 0
L o g ( a v e r a g e G N P P P P p e r c a p i t a 1 9 9 0 ' s )
Log
(Urb
an in
form
al e
mpl
oym
ent a
s
a %
urb
an e
mpl
oym
ent 1
990s
)
Figure 2
Log (Urban informal employment %) = 153.09 - 33.05 Log (GNP PPP per capita) (6.42) (-4.82)
Adjusted R Square= 33 %Observations 46 Data Source: 1.ILO Bureau of Statistics, Special Database (2000).2. World Development Indicators, 2000
The measure of informality taken here is an ILO estimate of the urban informal sector as percentageof the urban employed. This is a rough measure with some problems of uniformity of definition acrosscountries Since data is based national definitions that vary from country to country it is not clear what orhow much is left out. This is best illustrated by the magnitude of the percentage itself. A casual glace at thisdata shows that for a very large set of developing countries the figure is between 40 per cent to 50 per centof urban employment. This suggests that around half of urban employment is formal. This indeed seemsa high percentage. The suggestion that national data on “informal employment” often refer to employmentin small and micro enterprises consequently makes sense40. The graph essentially shows the relationshipbetween the parts of urban informal sector employment as a percentage of the urban employed and GNPper capita (PPP). The values have been averaged for each country on the two variables over the 1990s.The line on the graph is the simplest relationship that can be fitted between the variable and national income.It shows what on an average can be expected to happen to informal employment as national incomeincreases. Clearly as national income grows urban informality declines. This is an interesting result given thedata limitations discussed above. The points on the plot representing country observations (the data onwhich the regression line is based) suggests a wide enough spread of observations above and below thepredicted line. Thus many countries can be said to “outperform” their expected value from the fitted linejust as many countries “underperform”. However observations at lower levels of income suggest morecountries that are worse than the norm, so the spread is wider at slightly higher levels of income. Theunexplained variation in this relationship (76 per cent in this case) confirms the visual observation, namelythat there is policy scope to reduce informal employment, especially in countries where incomes are not toolow 41. Not only is the level of informality high in developing countries but the experience of the last two
15
policy goal and implies little about the instruments with which to reach that goal.
42The idea of the working poor was also raised by the ILO’s World Employment Programme in the 1970s as onecomponent of the “employment problem” , though there was no comprehensive attempt to quantify it (See L. Emmerij, R. Jollyand T.Weiss, 2001, Ahead of the Curve: UN ideas and Global Challenges). The present work on the working poor at the ILO,which is still in its preliminary stages takes a more quantitative approach. See N. Majid, The Size of the Working PoorPopulation in Developing Countries, Employment Working Paper 2001/16, May, 2001.
43 This oversight is illustrated by the possibility of a negative relationship between the unemployment rate and the poverty rate in a cross sectionof developing economies where typically the unemployment rates are lower than poverty The relationship between the poverty rate (Pr) and theunemployment rate (Ur) for the 1990s for a set of developing countries for which both unemployment and poverty rates wereavailable is:
P r = 17.63* - 0.85*Ur (R-squared=0.13; N=25; t-values in parenthesis) (3.94) (-1.91)
The relationship is of course driven by levels of national income, because unemployment rates are typically higher in middleincome developing countries and poverty rates typically higher in low income developing countries. The relationship appears to be counter-intuitive only if the two stylised facts are ignored. The equation is however only illustrative because actual data on the unemployedtypically not only include the long-run but also short run unemployed. Some of the latter can be in the poor. However theassumption made here, which is a reasonable one, is that long term unemployed are in the majority. In the country context ofIndia the problems thrown up by the gap between poverty incidences on the one hand and unemployment on the other have beencommented upon. (See A.K.Ghose (1999), Current Issues of Employment Policy in India, Economic and Political Weekly ,September, 4 -10, 1999)
decades has also shown, that the majority of countries, for which data on two points in time are available(16 out of 25 in the ILO sample), show increases in this category.
The working poor
Lastly, we examine the relationship between the working poor as a percentage of the employed andnational income42. In developing countries where effective social insurance systems do not exist the poorwork in order to support themselves and their families. In these countries it is also apparent that the longrun unemployed largely cover those who in fact are not the “poor” in society. Employment policy tends toignore the importance of these two stylised facts about poverty and long-run unemployment in developingcountries 43.
The advantage of using the working poor rate over the informal urban employment category is thatit focuses on the poor and is applicable to both urban and rural areas. Its advantage over the formalemployment indicator is that it has a greater coverage of countries and that it focuses on the employmentissue in terms of its deficiencies and deficits. Figure 3 below shows the scatter-plot for this relationship.Once again it is fairly clear that although increases in national income reduce the size of the working poor,like poverty itself, countries at the same level of national income can have a less than expected or more thanexpected incidence of the working poor.
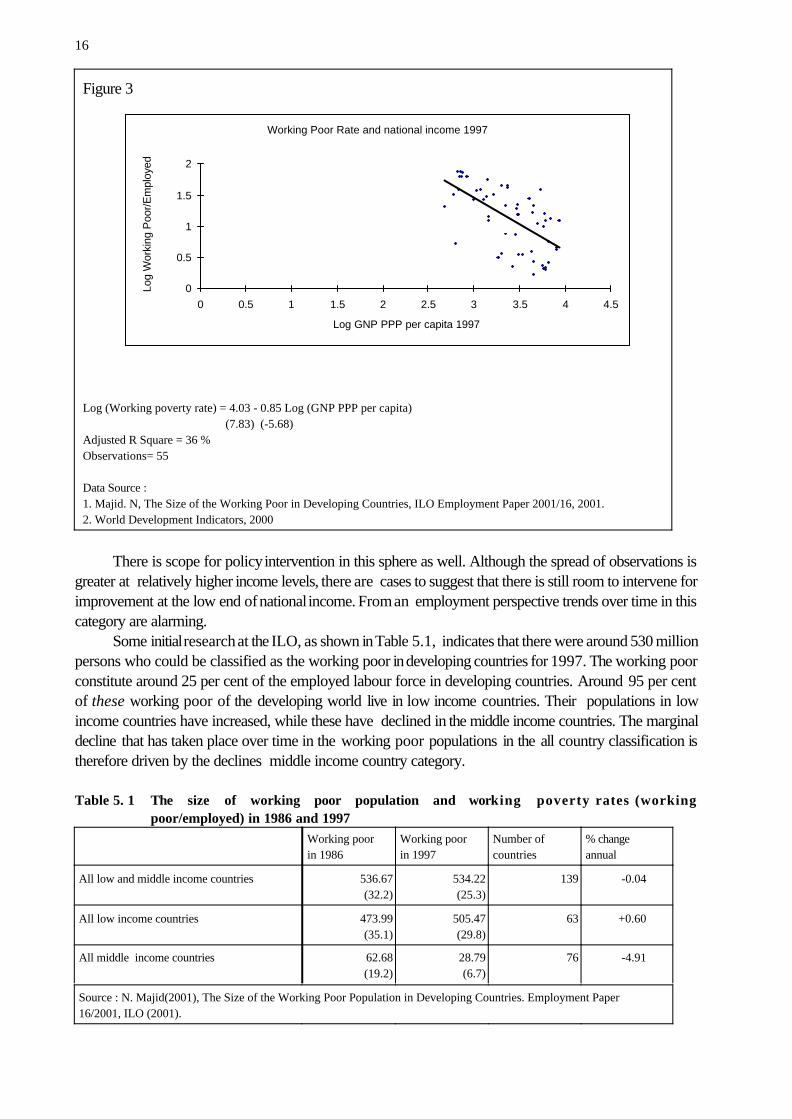
16
Working Poor Rate and national income 1997
0
0.5
1
1.5
2
0 0.5 1 1.5 2 2.5 3 3.5 4 4.5
Log GNP PPP per capita 1997
Log
Wor
king
Poo
r/Em
ploy
ed
Figure 3
Log (Working poverty rate) = 4.03 - 0.85 Log (GNP PPP per capita) (7.83) (-5.68)
Adjusted R Square = 36 %Observations= 55
Data Source :1. Majid. N, The Size of the Working Poor in Developing Countries, ILO Employment Paper 2001/16, 2001.2. World Development Indicators, 2000
There is scope for policy intervention in this sphere as well. Although the spread of observations isgreater at relatively higher income levels, there are cases to suggest that there is still room to intervene forimprovement at the low end of national income. From an employment perspective trends over time in thiscategory are alarming.
Some initial research at the ILO, as shown in Table 5.1, indicates that there were around 530 millionpersons who could be classified as the working poor in developing countries for 1997. The working poorconstitute around 25 per cent of the employed labour force in developing countries. Around 95 per centof these working poor of the developing world live in low income countries. Their populations in lowincome countries have increased, while these have declined in the middle income countries. The marginaldecline that has taken place over time in the working poor populations in the all country classification istherefore driven by the declines middle income country category.
Table 5. 1 The size of working poor population and working poverty rates (workingpoor/employed) in 1986 and 1997
Working poorin 1986
Working poorin 1997
Number ofcountries
% changeannual
All low and middle income countries 536.67(32.2)
534.22(25.3)
139 -0.04
All low income countries 473.99(35.1)
505.47(29.8)
63 +0.60
All middle income countries 62.68(19.2)
28.79(6.7)
76 -4.91
Source : N. Majid(2001), The Size of the Working Poor Population in Developing Countries. Employment Paper16/2001, ILO (2001).
17
44 It is true that much depends on how poverty estimates turn out for China and India, and the particular period chosen.In the case of China for example while poverty rates dramatically increased during the second half of the 1980s, they havedeclined from 1990 onwards.
45 At a macro level there are at least two ways in which this inclusion can be affected. First increasing the productivityof the poor has importantly meant the transfer of labour from agriculture to the modern sectors in developing countries and theabsorption of these persons in labour intensive but relatively more productive jobs. However productivity increases in modernsector jobs themselves have often come at the cost of a loss in employment. Therefore an expansionary demand context isnecessary to accompany the transfers.
46 Apart from this it is important to note that the elimination of the working poor, however ambitious in actuality, asan employment goal still constitutes a floor.
At the group level, both low and middle income country groups include countries that show increasesas well as declines in the working poor. However, while in middle income countries there is apreponderance of countries showing declines according to expectation; in the low income country categoryboth declining and increasing working poor countries are significant in number. This suggests that a possiblepolarisation process may be taking place within low income countries between those that are reducing theworking poor and those that are not44. This is a subject for further inquiry.
The issue is not so much about actual numbers but about proportions to target in an employmentpolicy focus. It can be therefore be suggested that while the transformation of all the employed in to formalprotected workers in the short term is bound by resource conditions, implying that the dominance of thebest forms of employment in the labour market is closely tied to national income, the worst forms ofemployment can indeed be improved upon without waiting for higher levels of national income. Whilegrowth will improve overall well being and thus employment quality at least in some sense of the term, theextent of this improvement would depend on the distribution of income and assets, institutions as well asthe effectiveness of policy itself, and it could entail advocacy, participatory human agency and struggle torealise this improvement. For this to happen economic growth policies would need to take an approachthat integrates economic policy with its social outcomes. Important as it may be, the point is not so muchabout waiting for some elusive inter-disciplinary integration of the social sciences but rather one of policytiming, in which when economic policies (whose aim is economic growth and its stability) are formulatedtheir postulated effects on at least all those who work and who belong to poor households in the economyare given priority attention. There are informational requirements for this as well that cannot beunderestimated. This is a challenge for the future.
Although the bulk of the efforts in addressing the problem of the working poor are likely to comeinitially from the expenditure side of the budget, an element in the desired policy framework must be somereal attempt at the inclusion of the working poor in the growth process itself as opposed to them just beingsecond round beneficiaries of growth multipliers. Thus on the growth side some attempt must also be madeto focus on improving the productivity of the working poor. Both redistributive credit with peer monitoringas well as direct enhancement of productivity are ways to do this at the micro and community level. Thechallenge here is to think through the issue of attacking the poverty of those who work both in terms oflarger macro policy framework that is consistent with it (including the demand conditions facing aneconomy in which it is contemplated45) on the one hand, and efficiency enhancing inequality reducinginterventions at the micro and institutional level on the other .
The employment challenge
The first employment challenge for growth in developing countries must be that income generatingwork, whatever form it takes, be at least equal to a standard set by society that is sufficient for earners andtheir families or households. The minimum of this standard of sufficiency can be seen as a nationally setpoverty line. The aim is to produce conditions in which all those who want to work can find work; andthose who do, live in households that are at least also non-poor 46. It would be more feasible, sustainable
18
47 See ILO World Labour Report, 2000, Table 11 for definitions.
as well as preferable if this goal is realised as a combination of enhancing security through expenditure andincreasing the productivity of the working poor.
5.2. The dimension of security
The dimension of security is closely tied to employment. In fact a considerable difference betweenformal employment on the one hand, and informal, casual and irregular employment on the other, liesprecisely in the dimension of security. Insecurity at work is an important part of the insecurity faced bythose who work. The sources of work place insecurity are two-fold. The first derives from physicalconditions of safety and hazard at work, and the second from the level and variability of income from work.The sources of insecurity for those who work, at a general societal level, pertain to social security andprotective security systems operating in society. Indicators for security at work are often based oninformation on those places of work that have some security to start with. Economy wide security isreflected in public expenditure indicators on social security or wider outcome indicators of insecurity likelife-expectancy gaps or basic illiteracy that disables learning.
Protection at work
One argument alluded to earlier, encountered in policy circles is that protective security is expensiveand ought to be expected after the fruits of economic growth have produced a wealthier society. If highgrowth is achieved, it is argued, security will follow in some measure. Although strong versions of suchviews are less widespread, it nevertheless holds sway in some form with many policy makers.
The effectiveness of protection systems varies widely in the world. We first look at social protectioncoverage of a standard indicator which is that of old age, invalidity and survivors protection i.e. personsprotected in this category as a percentage of the population47. This indicator of coverage in socialprotection does not have too many observations (35) although the observations for low (12), medium (12)and high (11) income countries are nearly equally divided. The results are however circumscribed by thelack of data. Given this, it is clear from the above that security coverage increases with national income butthere is also room to intervene for increased security for countries at lower levels of income. One can arguethat the pattern of socially protected populations tends to mirror that of employment illustrated in Figure1. In fact it is not just the possibility of intervention but the limited coverage that is at issue. As reported only6.5 per cent of the population in the low income countries sample can be said to have some standard formof protection. It also needs to be noted that more outliers at relatively higher levels of income performbetter than expected, while those at lower levels of income perform worse that expected on the crosssectional fit.
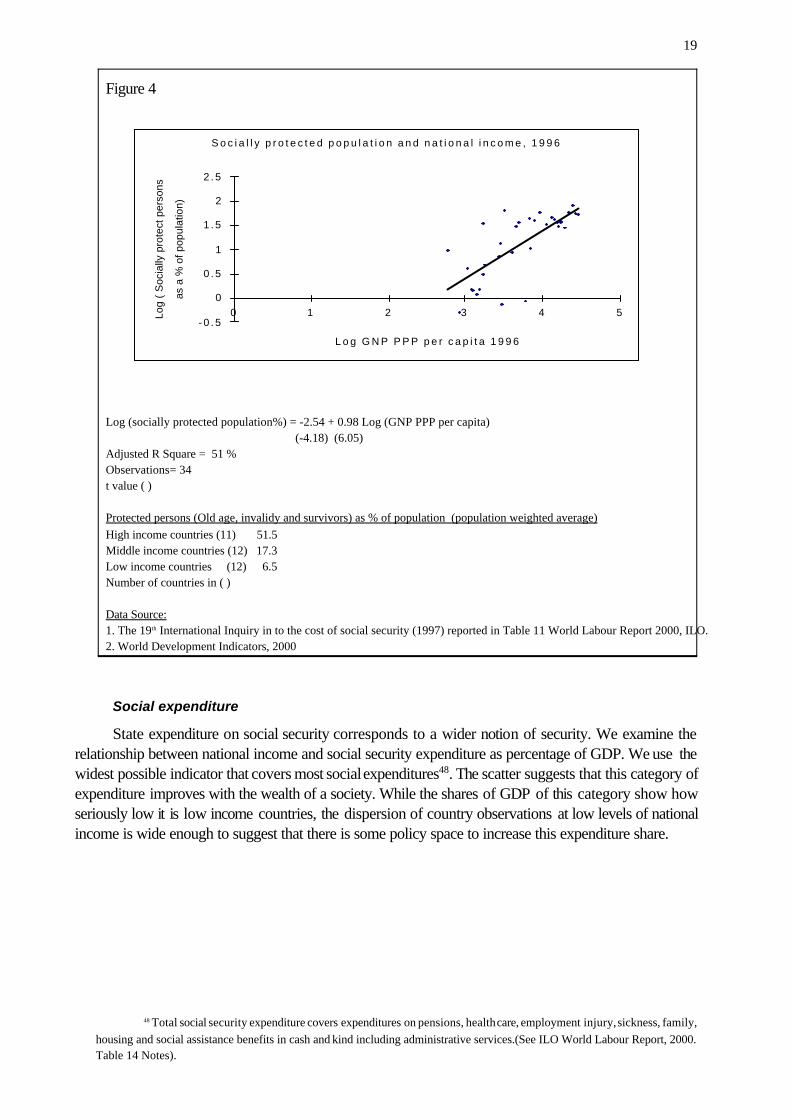
19
48 Total social security expenditure covers expenditures on pensions, health care, employment injury, sickness, family,housing and social assistance benefits in cash and kind including administrative services.(See ILO World Labour Report, 2000.Table 14 Notes).
S o c i a l l y p r o t e c t e d p o p u l a t i o n a n d n a t i o n a l i n c o m e , 1 9 9 6
- 0 . 5
0
0 . 5
1
1 . 5
2
2 . 5
0 1 2 3 4 5
L o g G N P P P P p e r c a p i t a 1 9 9 6
Log
( S
ocia
lly p
rote
ct p
erso
ns
as a
% o
f pop
ulat
ion)
Figure 4
Log (socially protected population%) = -2.54 + 0.98 Log (GNP PPP per capita) (-4.18) (6.05)
Adjusted R Square = 51 %Observations= 34t value ( )
Protected persons (Old age, invalidy and survivors) as % of population (population weighted average)High income countries (11) 51.5Middle income countries (12) 17.3Low income countries (12) 6.5Number of countries in ( )
Data Source:1. The 19th International Inquiry in to the cost of social security (1997) reported in Table 11 World Labour Report 2000, ILO.2. World Development Indicators, 2000
Social expenditure
State expenditure on social security corresponds to a wider notion of security. We examine therelationship between national income and social security expenditure as percentage of GDP. We use thewidest possible indicator that covers most social expenditures48. The scatter suggests that this category ofexpenditure improves with the wealth of a society. While the shares of GDP of this category show howseriously low it is low income countries, the dispersion of country observations at low levels of nationalincome is wide enough to suggest that there is some policy space to increase this expenditure share.
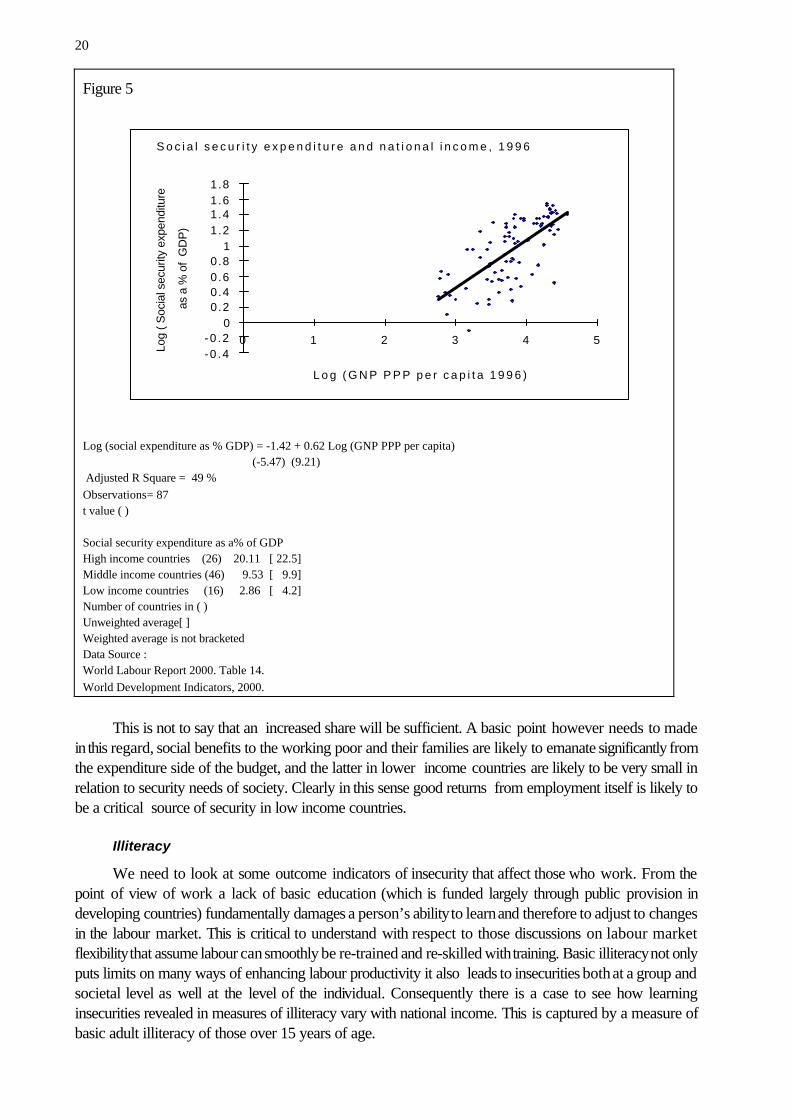
20
S o c i a l s e c u r i t y e x p e n d i t u r e a n d n a t i o n a l i n c o m e , 1 9 9 6
-0 .4-0 .2
00.20.40.60.8
11.21.41.61.8
0 1 2 3 4 5
L o g ( G N P P P P p e r c a p i t a 1 9 9 6 )
Log
( Soc
ial s
ecur
ity e
xpen
ditu
re
as a
% o
f G
DP
)
Figure 5
Log (social expenditure as % GDP) = -1.42 + 0.62 Log (GNP PPP per capita) (-5.47) (9.21)
Adjusted R Square = 49 %Observations= 87t value ( )
Social security expenditure as a% of GDPHigh income countries (26) 20.11 [ 22.5]Middle income countries (46) 9.53 [ 9.9]Low income countries (16) 2.86 [ 4.2]Number of countries in ( ) Unweighted average[ ]Weighted average is not bracketedData Source : World Labour Report 2000. Table 14.World Development Indicators, 2000.
This is not to say that an increased share will be sufficient. A basic point however needs to madein this regard, social benefits to the working poor and their families are likely to emanate significantly fromthe expenditure side of the budget, and the latter in lower income countries are likely to be very small inrelation to security needs of society. Clearly in this sense good returns from employment itself is likely tobe a critical source of security in low income countries.
Illiteracy
We need to look at some outcome indicators of insecurity that affect those who work. From thepoint of view of work a lack of basic education (which is funded largely through public provision indeveloping countries) fundamentally damages a person’s ability to learn and therefore to adjust to changesin the labour market. This is critical to understand with respect to those discussions on labour marketflexibility that assume labour can smoothly be re-trained and re-skilled with training. Basic illiteracy not onlyputs limits on many ways of enhancing labour productivity it also leads to insecurities both at a group andsocietal level as well at the level of the individual. Consequently there is a case to see how learninginsecurities revealed in measures of illiteracy vary with national income. This is captured by a measure ofbasic adult illiteracy of those over 15 years of age.
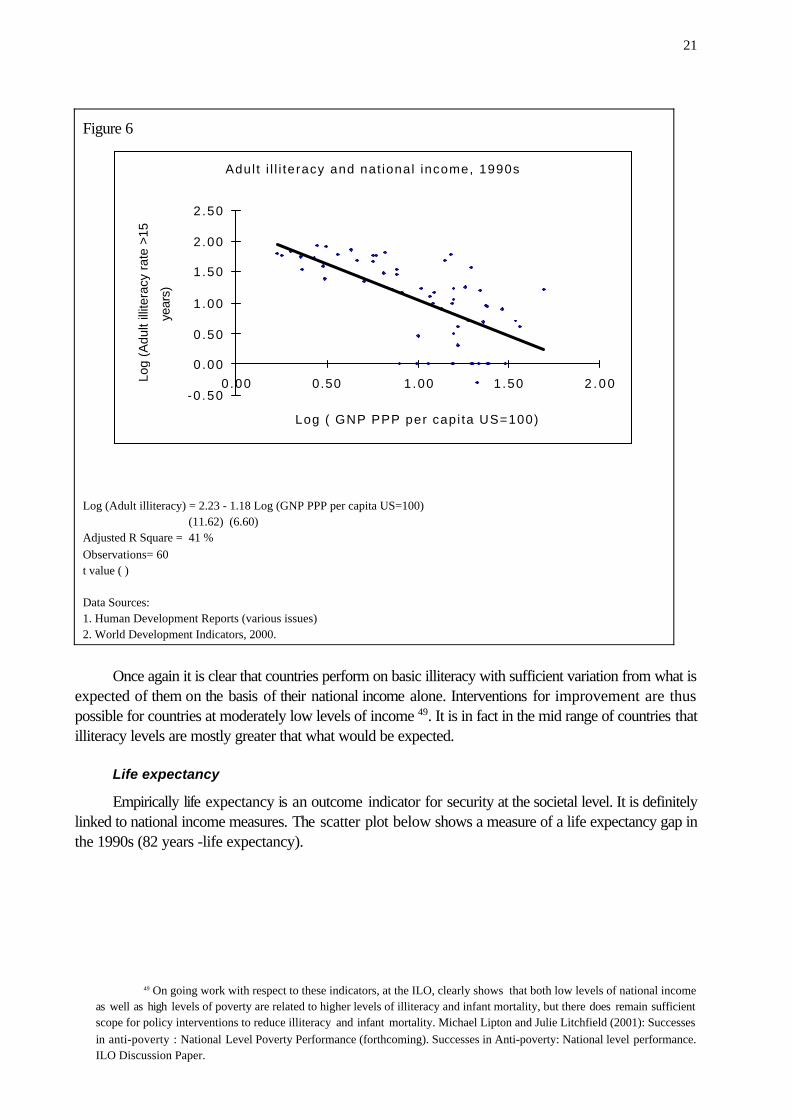
21
49 On going work with respect to these indicators, at the ILO, clearly shows that both low levels of national incomeas well as high levels of poverty are related to higher levels of illiteracy and infant mortality, but there does remain sufficientscope for policy interventions to reduce illiteracy and infant mortality. Michael Lipton and Julie Litchfield (2001): Successesin anti-poverty : National Level Poverty Performance (forthcoming). Successes in Anti-poverty: National level performance.ILO Discussion Paper.
Adul t i l l i teracy and nat ional income, 1990s
-0 .50
0.00
0.50
1.00
1.50
2.00
2.50
0.00 0.50 1.00 1.50 2 . 0 0
Log ( GNP PPP per capi ta US=100)
Log
(Adu
lt ill
itera
cy r
ate
>15
year
s)
Figure 6
Log (Adult illiteracy) = 2.23 - 1.18 Log (GNP PPP per capita US=100) (11.62) (6.60)
Adjusted R Square = 41 %Observations= 60t value ( )
Data Sources:1. Human Development Reports (various issues)2. World Development Indicators, 2000.
Once again it is clear that countries perform on basic illiteracy with sufficient variation from what isexpected of them on the basis of their national income alone. Interventions for improvement are thuspossible for countries at moderately low levels of income 49. It is in fact in the mid range of countries thatilliteracy levels are mostly greater that what would be expected.
Life expectancy
Empirically life expectancy is an outcome indicator for security at the societal level. It is definitelylinked to national income measures. The scatter plot below shows a measure of a life expectancy gap inthe 1990s (82 years -life expectancy).
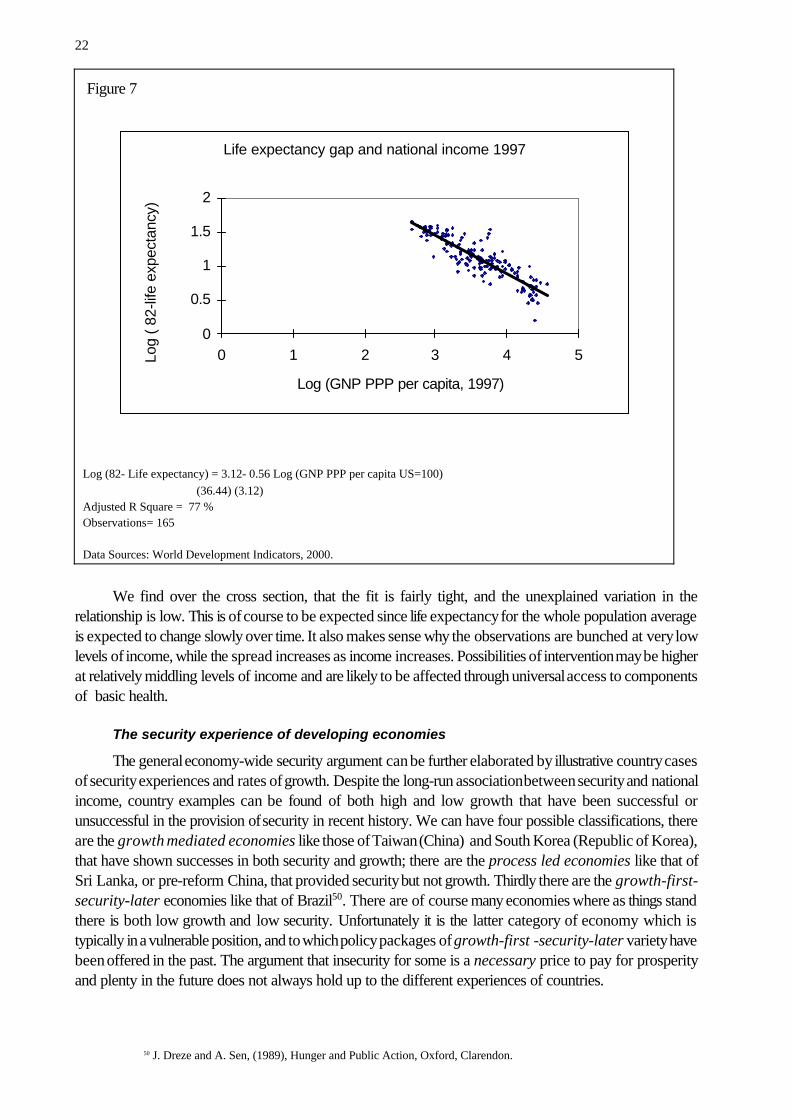
22
50 J. Dreze and A. Sen, (1989), Hunger and Public Action, Oxford, Clarendon.
Life expectancy gap and national income 1997
0
0.5
1
1.5
2
0 1 2 3 4 5
Log (GNP PPP per capita, 1997)
Log
( 82-
life
expe
ctan
cy)
Figure 7
Log (82- Life expectancy) = 3.12- 0.56 Log (GNP PPP per capita US=100) (36.44) (3.12)Adjusted R Square = 77 %Observations= 165
Data Sources: World Development Indicators, 2000.
We find over the cross section, that the fit is fairly tight, and the unexplained variation in therelationship is low. This is of course to be expected since life expectancy for the whole population averageis expected to change slowly over time. It also makes sense why the observations are bunched at very lowlevels of income, while the spread increases as income increases. Possibilities of intervention may be higherat relatively middling levels of income and are likely to be affected through universal access to componentsof basic health.
The security experience of developing economies
The general economy-wide security argument can be further elaborated by illustrative country casesof security experiences and rates of growth. Despite the long-run association between security and nationalincome, country examples can be found of both high and low growth that have been successful orunsuccessful in the provision of security in recent history. We can have four possible classifications, thereare the growth mediated economies like those of Taiwan (China) and South Korea (Republic of Korea),that have shown successes in both security and growth; there are the process led economies like that ofSri Lanka, or pre-reform China, that provided security but not growth. Thirdly there are the growth-first-security-later economies like that of Brazil50. There are of course many economies where as things standthere is both low growth and low security. Unfortunately it is the latter category of economy which istypically in a vulnerable position, and to which policy packages of growth-first -security-later variety havebeen offered in the past. The argument that insecurity for some is a necessary price to pay for prosperityand plenty in the future does not always hold up to the different experiences of countries.
23
51 S. Anand and M. Ravallion (1993), Human Development in Poor Countries: On the Role of Private Incomes andPublic Services, Journal of Economic Perspectives, Vol. 7.
52 The point is that while the level of national income and associated public revenue structures (and the allocationbetween expenditure heads by government) put limits on what can be afforded by an economy on security it is also true that the cost parameters of basic heath and educational activities are lower in countries at lower levels of national income. See Drezeand Sen (1989)
53 These can be because of economic slowdowns, natural disasters and health catastrophes affecting society.
Furthermore, the technical literature on the subject has a fairly robust finding, that the link betweenGNP per capita and life expectancy is largely driven by income distribution and public expenditure on heathand education51. Although direct improvements in distribution may be a more difficult policy variable tohandle, expenditure variables are economic policy variables. This brings us back to the resource question:how affordable can individual security be for a poor country? The issue to note in this regard is that bothbasic health and education are labour intensive activities and with low relative costs in typical developingcountry situations, so their costs may not be as high as imagined 52.
The security challenge
Decent work’s security objective in developing countries can be seen as an argument for theconstruction of a social floor for working people, chosen by society itself and appropriate to a society’sconditions. This can be affected from both the workplace and through the larger collective of society. Thebroad empirical finding is that there is a possibility of intervention to reduce insecurity in many countries andspecific cases highlight the growth-security paths that countries may take. Growth is definitely desirablewhen it is accompanied by the reduction of insecurity and this is the best way, but there are cases of highgrowth and low insecurity, and importantly of successes in insecurity reduction without high growth.Country experiences thus also suggest that we do not have to wait for security to come on-stream later.
From a point of view of policy the link between the employment goal and the security goal is critical.In the context of developing countries if basic security can be said to exist when the fall in work incomesbelow the national poverty line can be pre-empted then this requires three essential policy ingredients. First,provisions of basic security incomes must be in place. Second, institutional mechanisms- that can deliverbasic health and protect poverty line incomes- need to be developed. These could include linking securityto work through innovative insurance mechanisms. Third, a sufficient flow of information must be there suchthat where possible either warning systems for expected falls in poverty incomes can be developed53 or atleast the time lapse between livelihood disasters and response is minimised. Like the case for the indicatorsof employment, information on security indicators especially the direct ones related to work, need to beimproved.
5.3. The dimension of rights at work
The next dimension of decent work concerns basic rights at work. These have been expressed in theILO’s core labour standards namely as the freedom from discrimination, freedom from forced labour andfreedom from child labour. We examine the issue of freedom of association in the next section onrepresentation and voice.
What right is considered fundamental has varied historically. Some rights taken for granted today,would not have been universally acceptable say fifty to a hundred years ago. This is true for example ofwomen’s right to vote, and of both forced and child labour. Moreover global economic transactions withcolonies for some parts of the world were structured on principles of unequal treatment and exchange.However, the general acceptance of some of these rights over time has given them greater global scopetoday. We examine two sets of rights relevant to work in this section . The first concerns gender and thesecond child labour.
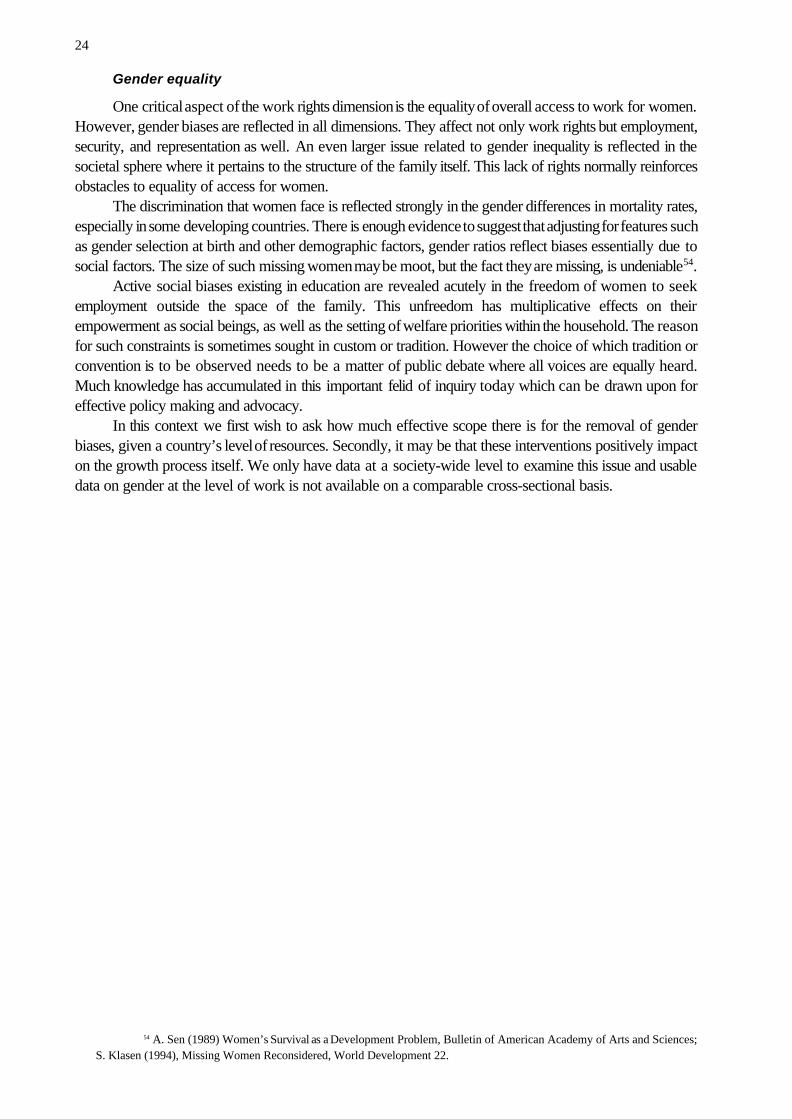
24
54 A. Sen (1989) Women’s Survival as a Development Problem, Bulletin of American Academy of Arts and Sciences;S. Klasen (1994), Missing Women Reconsidered, World Development 22.
Gender equality
One critical aspect of the work rights dimension is the equality of overall access to work for women.However, gender biases are reflected in all dimensions. They affect not only work rights but employment,security, and representation as well. An even larger issue related to gender inequality is reflected in thesocietal sphere where it pertains to the structure of the family itself. This lack of rights normally reinforcesobstacles to equality of access for women.
The discrimination that women face is reflected strongly in the gender differences in mortality rates,especially in some developing countries. There is enough evidence to suggest that adjusting for features suchas gender selection at birth and other demographic factors, gender ratios reflect biases essentially due tosocial factors. The size of such missing women may be moot, but the fact they are missing, is undeniable54.
Active social biases existing in education are revealed acutely in the freedom of women to seekemployment outside the space of the family. This unfreedom has multiplicative effects on theirempowerment as social beings, as well as the setting of welfare priorities within the household. The reasonfor such constraints is sometimes sought in custom or tradition. However the choice of which tradition orconvention is to be observed needs to be a matter of public debate where all voices are equally heard.Much knowledge has accumulated in this important felid of inquiry today which can be drawn upon foreffective policy making and advocacy.
In this context we first wish to ask how much effective scope there is for the removal of genderbiases, given a country’s level of resources. Secondly, it may be that these interventions positively impacton the growth process itself. We only have data at a society-wide level to examine this issue and usabledata on gender at the level of work is not available on a comparable cross-sectional basis.
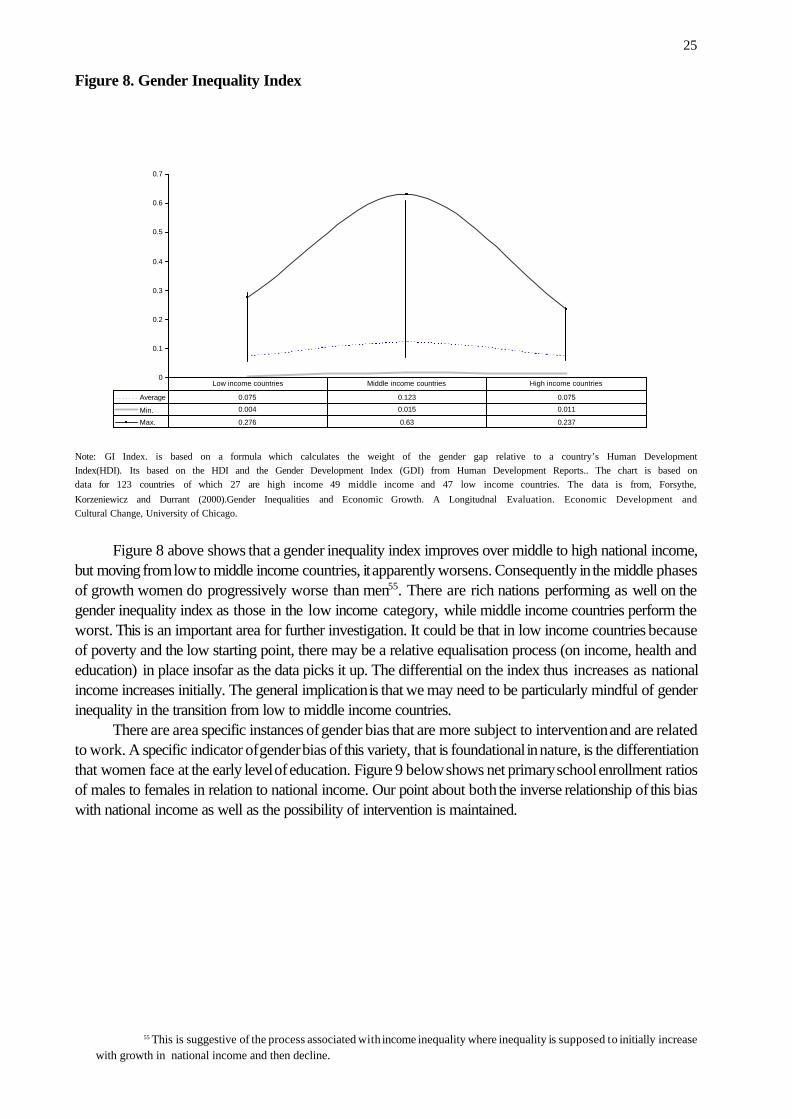
25
55 This is suggestive of the process associated with income inequality where inequality is supposed to initially increasewith growth in national income and then decline.
0
0.1
0.2
0.3
0.4
0.5
0.6
0.7
Average 0.075 0.123 0.075
Min. 0.004 0.015 0.011
Max. 0.276 0.63 0.237
Low income countries Middle income countries High income countries
Figure 8. Gender Inequality Index
Note: GI Index. is based on a formula which calculates the weight of the gender gap relative to a country’s Human DevelopmentIndex(HDI). Its based on the HDI and the Gender Development Index (GDI) from Human Development Reports.. The chart is based ondata for 123 countries of which 27 are high income 49 middle income and 47 low income countries. The data is from, Forsythe,Korzeniewicz and Durrant (2000).Gender Inequalities and Economic Growth. A Longitudnal Evaluation. Economic Development andCultural Change, University of Chicago.
Figure 8 above shows that a gender inequality index improves over middle to high national income,but moving from low to middle income countries, it apparently worsens. Consequently in the middle phasesof growth women do progressively worse than men55. There are rich nations performing as well on thegender inequality index as those in the low income category, while middle income countries perform theworst. This is an important area for further investigation. It could be that in low income countries becauseof poverty and the low starting point, there may be a relative equalisation process (on income, health andeducation) in place insofar as the data picks it up. The differential on the index thus increases as nationalincome increases initially. The general implication is that we may need to be particularly mindful of genderinequality in the transition from low to middle income countries.
There are area specific instances of gender bias that are more subject to intervention and are relatedto work. A specific indicator of gender bias of this variety, that is foundational in nature, is the differentiationthat women face at the early level of education. Figure 9 below shows net primary school enrollment ratiosof males to females in relation to national income. Our point about both the inverse relationship of this biaswith national income as well as the possibility of intervention is maintained.
26
56 See S. Klasen (2000), Does Gender Inequality Reduce Growth and Development? Working paper 7. DevelopmentResearch Group, Poverty Reduction and Economic Management Network, The World Bank. He estimates a 0.9 per cent peryear faster growth, if South Asia and Sub Saharan Africa had a balanced educational achievement in 1960 and had active policiesin place for gender balanced growth in education. The employment bias effect is less conclusive on measurement and causalitygrounds , but may have been responsible for another reduction of .3 per cent per annum for the above regions relative to EastAsia.
57 See for example, L. Summers (1994) Investing in All People, The World Bank, on both fertility and child mortalityeffects; and on fertility effects A. Hill and E. King (1995), Women’s Education in Developing Countries, Johns Hopkins Press..
58 The argument is an important one. The issue is the extent to which an all pervasive social bias involving gender isremovable withing existing norms of society. Although the issue can be starkly illustrated in some developing country contexts,where laws can be anti-women, the feminist critique is a general and deeper one of a liberal theory of justice. The argument isthat if choices not regulated by law are considered outside the purview of justice then biases will remain. For example in technicalterms in a Rawlsian world, the fact that the space of the family arguably falls outside the so called “basic structure” of societywhere say Rawls’ difference principle is applicable, means that gender biases remain and are perpetuated. (Gerry Cohen, 1996,Justice, Incentive and Selfishness, Gifford Lectures; No. 8 , University of Edinburgh, 1996 in If You’re an Egalitarian, HowCome You’re So Rich? Harvard, 2000)
-0.2
0
0.2
0.4
0.6
0 1 2 3 4 5
Log GNP PPP per capita 1995Log
( N
et p
rimar
y en
rollm
ent
ratio
, M:F
)
Gender differentials in primary education and national income 1995
Figure 9
Log (Net primary enrollment ratio) = 0.59 - 0.14 Log (GNP PPP per capita 1995) (10.06) (-9.24)Adjusted R Square = 42 %Observations= 120
Data Source : World Development Indicators, 2000.
Some empirical research on the topic also tends to confirm a negative causal relation of genderinequality in education with growth. The argument is that gender inequality in education impedes growth bydistorting incentives directly as well as indirectly via investment and population growth. There are possibleeffects suggested of gender-bias in employment on growth as well56. There is also research that shows thatgender inequality in education is linked to fertility and child mortality57. These results suggests possibleinstrumentalities between the security dimensions of decent work and the work rights dimension.
There is however a general link between gender-bias in education and employment that needs to berecognised explicitly. It has both long and short-run implications. Discrimination at work is not only directbut is also indirectly predicated on other underlying biases. For example in a world where inequality ineducation (or say nutrition) is not removed, a possible non-discriminatory labour market environment, evenif it were to be achieved, would still generate gender biases58.
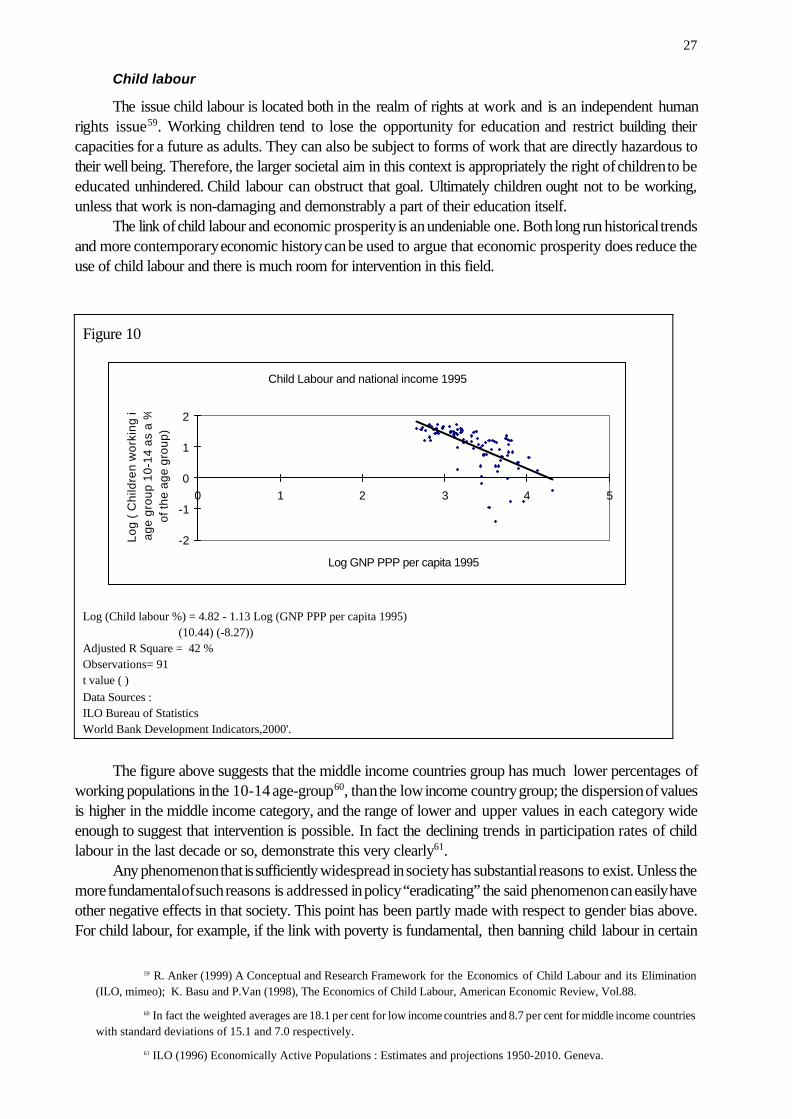
27
59 R. Anker (1999) A Conceptual and Research Framework for the Economics of Child Labour and its Elimination(ILO, mimeo); K. Basu and P.Van (1998), The Economics of Child Labour, American Economic Review, Vol.88.
60 In fact the weighted averages are 18.1 per cent for low income countries and 8.7 per cent for middle income countrieswith standard deviations of 15.1 and 7.0 respectively.
61 ILO (1996) Economically Active Populations : Estimates and projections 1950-2010. Geneva.
Child labour
The issue child labour is located both in the realm of rights at work and is an independent humanrights issue59. Working children tend to lose the opportunity for education and restrict building theircapacities for a future as adults. They can also be subject to forms of work that are directly hazardous totheir well being. Therefore, the larger societal aim in this context is appropriately the right of children to beeducated unhindered. Child labour can obstruct that goal. Ultimately children ought not to be working,unless that work is non-damaging and demonstrably a part of their education itself.
The link of child labour and economic prosperity is an undeniable one. Both long run historical trendsand more contemporary economic history can be used to argue that economic prosperity does reduce theuse of child labour and there is much room for intervention in this field.
Figure 10
Child Labour and national income 1995
-2
-1
0
1
2
0 1 2 3 4 5
Log GNP PPP per capita 1995
Log
( C
hild
ren
wor
king
in
age
grou
p 10
-14
as a
%
of th
e ag
e gr
oup)
Log (Child labour %) = 4.82 - 1.13 Log (GNP PPP per capita 1995) (10.44) (-8.27))Adjusted R Square = 42 %Observations= 91t value ( )Data Sources : ILO Bureau of StatisticsWorld Bank Development Indicators,2000'.
The figure above suggests that the middle income countries group has much lower percentages ofworking populations in the 10-14 age-group60, than the low income country group; the dispersion of valuesis higher in the middle income category, and the range of lower and upper values in each category wideenough to suggest that intervention is possible. In fact the declining trends in participation rates of childlabour in the last decade or so, demonstrate this very clearly61.
Any phenomenon that is sufficiently widespread in society has substantial reasons to exist. Unless themore fundamental of such reasons is addressed in policy “eradicating” the said phenomenon can easily haveother negative effects in that society. This point has been partly made with respect to gender bias above.For child labour, for example, if the link with poverty is fundamental, then banning child labour in certain
28
62Theoretical results on models of child labour should be examined carefully with respect to the applicability of theassumptions under which they are derived. For example the use of child labour as a mechanism of transfer of resources acrossgenerations (from children to parents) or overcoming capital market imperfections and transferring resources across time (fromfuture to present) have been shown; as well as the conditions under which banning child labour may be efficient (Paretoimproving) in general equilibrium. See J.M. Baland and J.A. Robinson, 2000, Is Child Labor Ineffcient? Mimeo Network on theEffects of Inequality on Economic Performance. Institute of International Studies; UC Berkeley
63 Modelling the empirical determinants of each dimension of decent work is important. Because of direct policyimplications, in the case of child labour, when determining the causes of its incidence, we need to be careful in drawingconclusions regarding the relative importance of its “causes” and the extent to which they are co-determined. For example, ifeducational/school attendance related variables and poverty are correlated themselves, as they often are in developing countries,simply ranking the importance of one explanatory variable over the other to determine policy priority would be misleading.
64 See for example C.Grootaert (1998) Child labour in Cote d’Ivoire: Incidence and Determinants in C. Grootaert andH. Patrinos eds. The Policy Analysis of Child Labour: A Comparative Study, The World Bank.
circumstances may not necessarily lead to the improvement of lives of children62. We need to be verycareful in taking policy positions here63.
The immediate policy realms of child labour are essentially two-fold. They can be divided in topolicies for legislative deterrence on the one hand and policies for education and family incomeenhancement on the other. For example, agreements and resolutions on elimination of certain forms childlabour or national legal acts that restrict its use by fiat, fall in to the legislative dimensions. Educationalpolicies, that are more inclusive of all young citizens, are examples of the other. There are possible policymixes with varying shades of emphasis that may be appropriate in different situations.
Clearly educational incentives may provide good grounds for withdrawal of children from the labourmarket, especially if the physical well being of children is also accounted for (by the provision of basichealth and nutrition). At the same time parents, even very poor parents, may decide that even at theeffective loss of some income at the margin (if their child was earning more than what he or she consumed)that they would still prefer sending their children to schools within such incentive structures. Coupled withthis if partial parental income enhancement is also feasible, the chances of withdrawal will be higher. Oneway to do this is to allow for controlled non-hazardous forms of work for children, that can be combinedwith education. There is some evidence to suggest that this may indeed be feasible64.
It needs recognition that grounds for the abolition of all child labour without the commensurateenhancement of family incomes and education facilities (other decent work concerns, relating to dimensionsof employment and security) may make policy less effective or even counter productive. The gradationbetween types of child labour for policy action is important for an ethical reason as well. Some forms ofchild labour are particularly pernicious in damaging a child’s right to develop as a full human being andusually such forms, that are often also wage-based, also tend to involve a binding for children in to suchwork. This is unacceptable on both grounds of hazard and lack of choice, and is ultimately ethicallyunacceptable today, whatever general historical practice may have been in early 19th century or howeverweak or robust the negative link between child labour and growth of national income. Consequently, theemphasis on the most hazardous forms of child labour, is a realistic focus of the ILO. Other forms of childlabour, often home based, are also more likely to be non-hazardous.
Policy work in this field has a very important advocacy role within societies, which is to encouragethe development of children as fuller human beings. This advocacy work is meant to help governmentsprogramme and prioritise their goals on child labour, make effective the legislation against its worst forms,and provide educational incentives for voluntary withdrawals. But critically it is also to encourage anatmosphere of social activism that sets the targets for the removal of child labour internally, from withinsociety itself.
Employment and security dimensions of decent work discussed above suggest that if the decent work“social floor” objectives in these dimensions are realised, then important gaps in work rights – e.g. ofdiscrimination in gender and loss of freedoms due to work in child labour in so far as they are related topoverty line based social floors – could be diminished too. But beyond this much more has to be done, and
29
65See Bolen and Paxton (2000), Subjective Measures of Liberal Democracy, Comparative Political Studies Vol. 33 No.1 Feburary, 2000, on judgement and specification errors. The ILO is presently involved in constructing its own index see D.Kucera (2000), Decent Work and Rights at Work: New Measures of Freedom of Association and Collective Bargaining, (ILOmimeo).
the point here is general one, which is namely that wider societal inequalities that are symptomatic of thestructure of society, may be relieved by but not necessarily eliminated by non-discriminatory and childlabour free work. There is a connectedness between deeper biases operating at the level of society thatreinforce loss of rights at and through work. Therefore these matters have to be tackled together.
5.4. The dimension of representation
The next dimension concerns representation and dialogue. This dimension is important in itself andit is often the mechanism through which consensus on the other three dimensions can be forged. It isimportant to recognise that the equivalents of the category of freedom of association at work pertain to civiland political liberties at a larger societal level. This issue was mentioned earlier where the work and societalspheres of each dimension were discussed.
Freedom of association
The broader notion of freedom of association entails the intuitive idea that individuals ought to be freeto form groups and associations in order to pursue their chosen ends as groups in society. The applicabilityof these freedoms need not be restricted in principle to specific forms related to industrial organisation, likecollective bargaining and unionisation, although at times this is in fact what is assumed. The latter are forms,albeit historically important ones, of freedom of association.
Empirically, the construction of an index of freedom of association is a mix of subjective andobjective classifications that are proxies for different indicators on the respect for rights of freedom ofassociation in a country. Countries are then often classified according to a judgement65.
The first indicator used here for illustration covers what its developers call freedom of organisation.The measure is a ranking based on the degree of harassment of trades unions and interest groups from thescale of 1 (least) to 4 (most) in 72 countries in 1985.
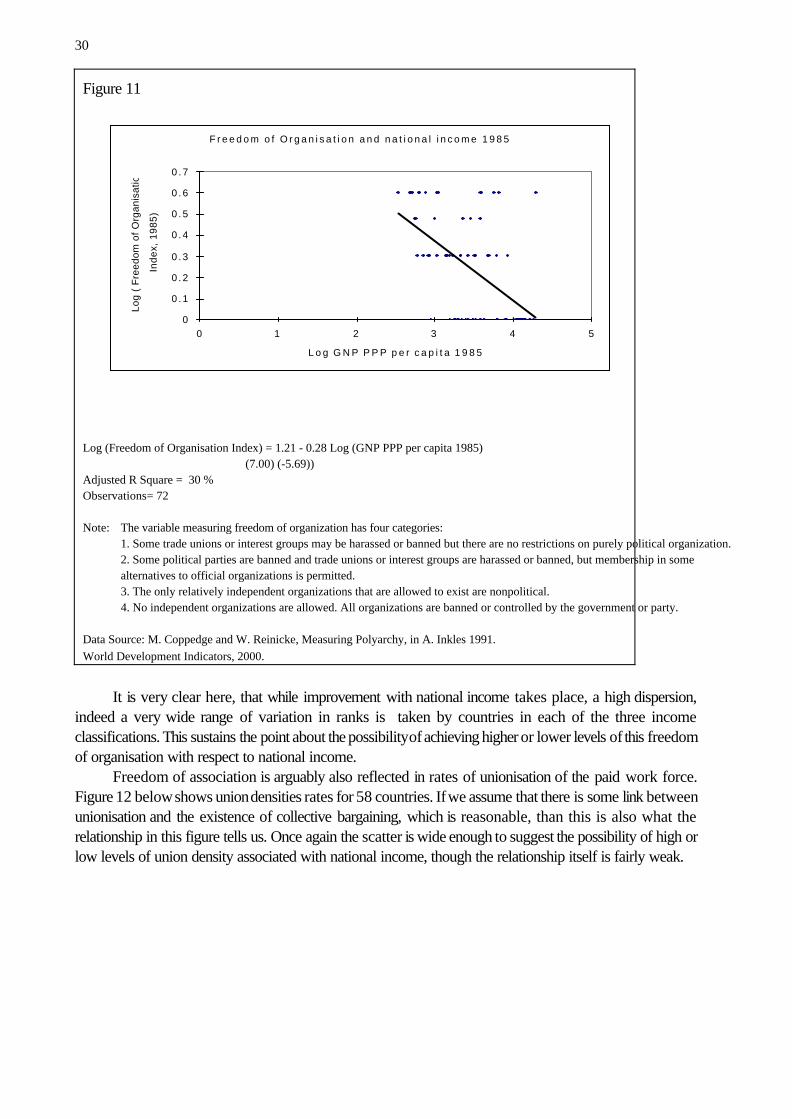
30
F r e e d o m o f O r g a n i s a t i o n a n d n a t i o n a l i n c o m e 1 9 8 5
0
0 . 1
0 . 2
0 . 3
0 . 4
0 . 5
0 . 6
0 . 7
0 1 2 3 4 5
L o g G N P P P P p e r c a p i t a 1 9 8 5
Log
( F
reed
om o
f Org
anis
atio
n
Inde
x, 1
985)
Figure 11
Log (Freedom of Organisation Index) = 1.21 - 0.28 Log (GNP PPP per capita 1985) (7.00) (-5.69))Adjusted R Square = 30 %Observations= 72
Note: The variable measuring freedom of organization has four categories:1. Some trade unions or interest groups may be harassed or banned but there are no restrictions on purely political organization. 2. Some political parties are banned and trade unions or interest groups are harassed or banned, but membership in somealternatives to official organizations is permitted. 3. The only relatively independent organizations that are allowed to exist are nonpolitical.4. No independent organizations are allowed. All organizations are banned or controlled by the government or party.
Data Source: M. Coppedge and W. Reinicke, Measuring Polyarchy, in A. Inkles 1991.World Development Indicators, 2000.
It is very clear here, that while improvement with national income takes place, a high dispersion,indeed a very wide range of variation in ranks is taken by countries in each of the three incomeclassifications. This sustains the point about the possibility of achieving higher or lower levels of this freedomof organisation with respect to national income.
Freedom of association is arguably also reflected in rates of unionisation of the paid work force.Figure 12 below shows union densities rates for 58 countries. If we assume that there is some link betweenunionisation and the existence of collective bargaining, which is reasonable, than this is also what therelationship in this figure tells us. Once again the scatter is wide enough to suggest the possibility of high orlow levels of union density associated with national income, though the relationship itself is fairly weak.
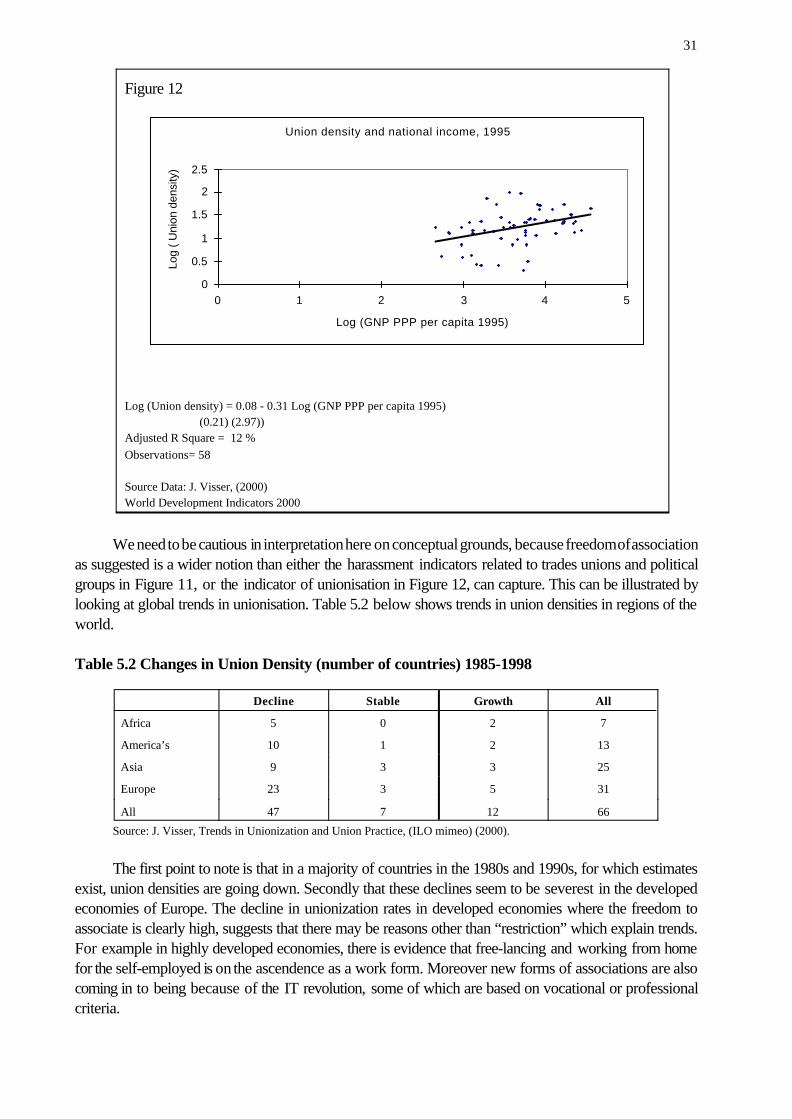
31
Union density and national income, 1995
0
0.5
1
1.5
2
2.5
0 1 2 3 4 5
Log (GNP PPP per capita 1995)
Log
( Uni
on d
ensi
ty)
Figure 12
Log (Union density) = 0.08 - 0.31 Log (GNP PPP per capita 1995) (0.21) (2.97))Adjusted R Square = 12 %Observations= 58
Source Data: J. Visser, (2000)World Development Indicators 2000
We need to be cautious in interpretation here on conceptual grounds, because freedom of associationas suggested is a wider notion than either the harassment indicators related to trades unions and politicalgroups in Figure 11, or the indicator of unionisation in Figure 12, can capture. This can be illustrated bylooking at global trends in unionisation. Table 5.2 below shows trends in union densities in regions of theworld.
Table 5.2 Changes in Union Density (number of countries) 1985-1998
Decline Stable Growth All
Africa 5 0 2 7
America’s 10 1 2 13
Asia 9 3 3 25
Europe 23 3 5 31
All 47 7 12 66
Source: J. Visser, Trends in Unionization and Union Practice, (ILO mimeo) (2000).
The first point to note is that in a majority of countries in the 1980s and 1990s, for which estimatesexist, union densities are going down. Secondly that these declines seem to be severest in the developedeconomies of Europe. The decline in unionization rates in developed economies where the freedom toassociate is clearly high, suggests that there may be reasons other than “restriction” which explain trends.For example in highly developed economies, there is evidence that free-lancing and working from homefor the self-employed is on the ascendence as a work form. Moreover new forms of associations are alsocoming in to being because of the IT revolution, some of which are based on vocational or professionalcriteria.
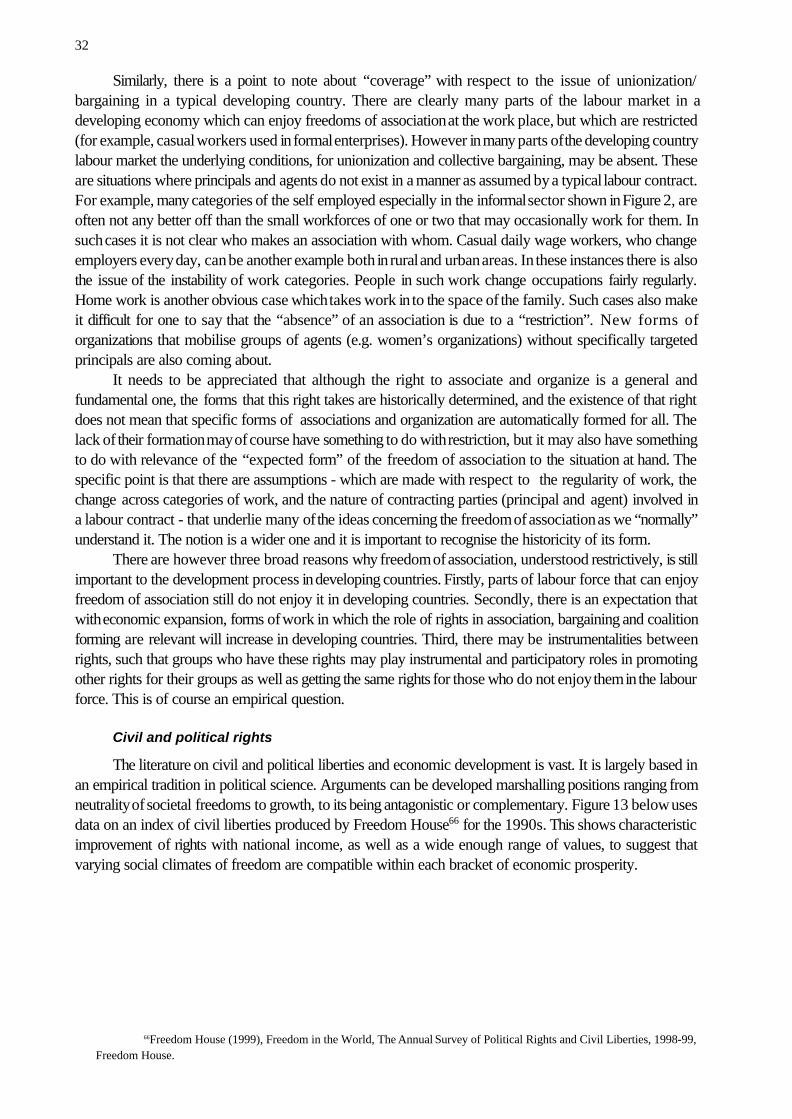
32
66Freedom House (1999), Freedom in the World, The Annual Survey of Political Rights and Civil Liberties, 1998-99,Freedom House.
Similarly, there is a point to note about “coverage” with respect to the issue of unionization/bargaining in a typical developing country. There are clearly many parts of the labour market in adeveloping economy which can enjoy freedoms of association at the work place, but which are restricted(for example, casual workers used in formal enterprises). However in many parts of the developing countrylabour market the underlying conditions, for unionization and collective bargaining, may be absent. Theseare situations where principals and agents do not exist in a manner as assumed by a typical labour contract.For example, many categories of the self employed especially in the informal sector shown in Figure 2, areoften not any better off than the small workforces of one or two that may occasionally work for them. Insuch cases it is not clear who makes an association with whom. Casual daily wage workers, who changeemployers every day, can be another example both in rural and urban areas. In these instances there is alsothe issue of the instability of work categories. People in such work change occupations fairly regularly.Home work is another obvious case which takes work in to the space of the family. Such cases also makeit difficult for one to say that the “absence” of an association is due to a “restriction”. New forms oforganizations that mobilise groups of agents (e.g. women’s organizations) without specifically targetedprincipals are also coming about.
It needs to be appreciated that although the right to associate and organize is a general andfundamental one, the forms that this right takes are historically determined, and the existence of that rightdoes not mean that specific forms of associations and organization are automatically formed for all. Thelack of their formation may of course have something to do with restriction, but it may also have somethingto do with relevance of the “expected form” of the freedom of association to the situation at hand. Thespecific point is that there are assumptions - which are made with respect to the regularity of work, thechange across categories of work, and the nature of contracting parties (principal and agent) involved ina labour contract - that underlie many of the ideas concerning the freedom of association as we “normally”understand it. The notion is a wider one and it is important to recognise the historicity of its form.
There are however three broad reasons why freedom of association, understood restrictively, is stillimportant to the development process in developing countries. Firstly, parts of labour force that can enjoyfreedom of association still do not enjoy it in developing countries. Secondly, there is an expectation thatwith economic expansion, forms of work in which the role of rights in association, bargaining and coalitionforming are relevant will increase in developing countries. Third, there may be instrumentalities betweenrights, such that groups who have these rights may play instrumental and participatory roles in promotingother rights for their groups as well as getting the same rights for those who do not enjoy them in the labourforce. This is of course an empirical question.
Civil and political rights
The literature on civil and political liberties and economic development is vast. It is largely based inan empirical tradition in political science. Arguments can be developed marshalling positions ranging fromneutrality of societal freedoms to growth, to its being antagonistic or complementary. Figure 13 below usesdata on an index of civil liberties produced by Freedom House66 for the 1990s. This shows characteristicimprovement of rights with national income, as well as a wide enough range of values, to suggest thatvarying social climates of freedom are compatible within each bracket of economic prosperity.
33
67 It may be important to formulate these ideas in such a way that they do not get tied to the idea of conditionalityor sanctions.
0
0.2
0.4
0.6
0.8
1
0 1 2 3 4 5
Log ( GNP PPP per capita 1997)
Log
( C
ivil
Libe
rtie
s In
dex)
Civil liberties index and national income 1997
Figure 13
Log (Civil Liberties Index) = 1.68 - 0.33 Log (GNP PPP per capita 1997) (14.60) (-10.4)) Adjusted R Square = 40 %Observations= 162Data Sources: Freedom House, 1999World Development Indicators 2000
The results with political rights and democracy indicators from the same data source are very similar.
The civil and political rights experience of developing economies
Research on the link between civil/political rights on the one hand and economic performance on theother has been used mostly to suggest either that more rights constrain economic performance or that theydo not affect it all. It is clear that while there is reason to expect more civil and political rights anddemocracy in higher income economies, there is little reason to think that it is not possible to intervene toget these at lower levels of income. The issue of rights constraining economic performance involves acounterfactual and is clearly deeper.
This argument should be considered carefully, because historical experience, especially in the moreadvanced economies of today, tells us that formal civil and political rights in many respects followed orwere “simultaneous with” economic growth, and at least that they did not precede it. Moreover groupsdrawn on the basis of ethnicity, race and gender were last to achieve these rights. The prescription for afully functioning democracy in the developing world is sometimes seen as a reversal of this historical logic.This may be true in a sequential sense with respect to the past, but to infer from this that there is little scopeand need for true democracy to exist in developing countries is not quite legitimate. There are three reasonsfor this. First since democracy at least tends to formally protect the basic rights of majorities in principleit is an independent goal that ought to be pursued on this count alone. Second, there is no conclusivecounterfactual to suggest that had formal rights come in earlier than they did, say in Western Europe, therewould have been a loss to growth. Thirdly, rights achieved in many of today’s older industrial economies,were in part the result of people’s struggles to achieve those rights. In today’s environment there are otheravenues like international consensus, that can arguably bring support to struggles for rights within developingcountries, such that they may come sooner then they would have without such consensus67.
34
68 See for example A.K.Sen and Jean Dreze, Hunger and Public Action, part 3. Clarendon, Oxford, 1989.Dani Rodrik,Democracy and Economic Performance (1997)(mimeo) for Conference on democratisation and economic reform in South Africa,Cape Town, 1998; John Helliwell, Empirical Linkages between Democracy and Economic Growth, British journal of PoliticalScience, No.24, 1994.
69See R.K. Sah, Feasibility, Human Organisations and Political Systems (1991), Journal of Economic Perspectives.Vol. 5/2, 1991.
70 D. Rodrik (1997).
71The debate however is much more interesting and meaningful if we go beyond simple definitions and deconstruct thenotion of democracy in terms of its attributes, for example, the credibility of pre-commitments by the State, the degree ofinsulation of the civil bureaucracy, or the legislative process and the enactment of laws in democracy (which can be subject tocapture). A good example of conflict of democracy with long run growth is the classic protected infant industry argument, wherereliance on State subsidy by permanent infants can become difficult to discontinue precisely because of democratic processes.See P. Bardhan, 2000, Democracy and Development : A Complex Relationship , in I. Shapiro and C.Hacker-Cordon (eds.),Democracy's Value , Cambridge University Press
Coming to the present day developing countries, the matter economic performance and politicalregime has been subject to a more through examination. For specific periods in recent economic historyjust as economies of South East Asia like Republic of Korea, Taiwan (China) and Singapore registeredphenomenally high growth rates under autocratic regimes, many other countries also under authoritarianregimes like Zaire, Uganda, Haiti, Mozambique or South Africa have not prospered. Similarly countrieswith open political regimes, as Botswana and Malta have done reasonably well on growth, just as Gambiaand Jamaica have not done so well. There are cases of modest performance under both types of regimesas well. There is no clear cut evidence at a county case level to show that non democratic environmentstend to help growth, just as there is little reason to believe that democracy invariably leads to lower longrun growth. Evidence suggests agnosticism about implications of democracy on economic growth, just asit does on the economic implications of autocracy. The assessment also implies that growth, andemployment, do not (in themselves) generate rights just as rights on their own do not generate growth andemployment. This is the case despite the fact that there are proportionately more democratic regimes in highincome economies68. There is however some evidence on the stability in economic performance withrespect to authoritarian and democratic regimes. For example it has been argued with respect to the degreeof de-centralisation in regimes, that short run volatility in economic performance is less in regimes wheredecision-making is dispersed69. More directly it has been argued that variation in long run income growthis definitely lower in democracies than it is in autocracies70.
These results suggest two broad points. First, the obvious point, that although growth and movingup the income ladder, increase the chances of a country enjoying greater civil, political and indeed socialrights, this link with income is not necessary for enjoying rights. The assumption here is of course that thereis some intrinsic value to having these rights to start with71. Second, that even though definitive claims aredifficult to sustain about the advantages of democratic political regimes for long-run growth, the autocraticcountry may be a riskier proposition for an ordinary citizen to live under on grounds of income stability.
Institutions and information
Economic development also produces market and civil institutions. The extent to which well beingis delivered to all in a given economy apart from its structural features and social policy also depends onthe both on quality of institutions it possesses and the accuracy of available information that it disseminates.
It is also important to note that the ability of a society to participate in decisions is fundamentallydependent upon both the quality of institutions and of information. Whatever the specific nature of theseinstitutions, it is absolutely clear that if they exist, a lack of participation in them benefits minorities. To makeinstitutions work for all, participation is necessary both at level of the work place as well as the level of theState. Institutional democracy is also central to making the knowledge about benefits of participationbecome known and acceptable as the norm in society. The make up of the State has therefore a role in
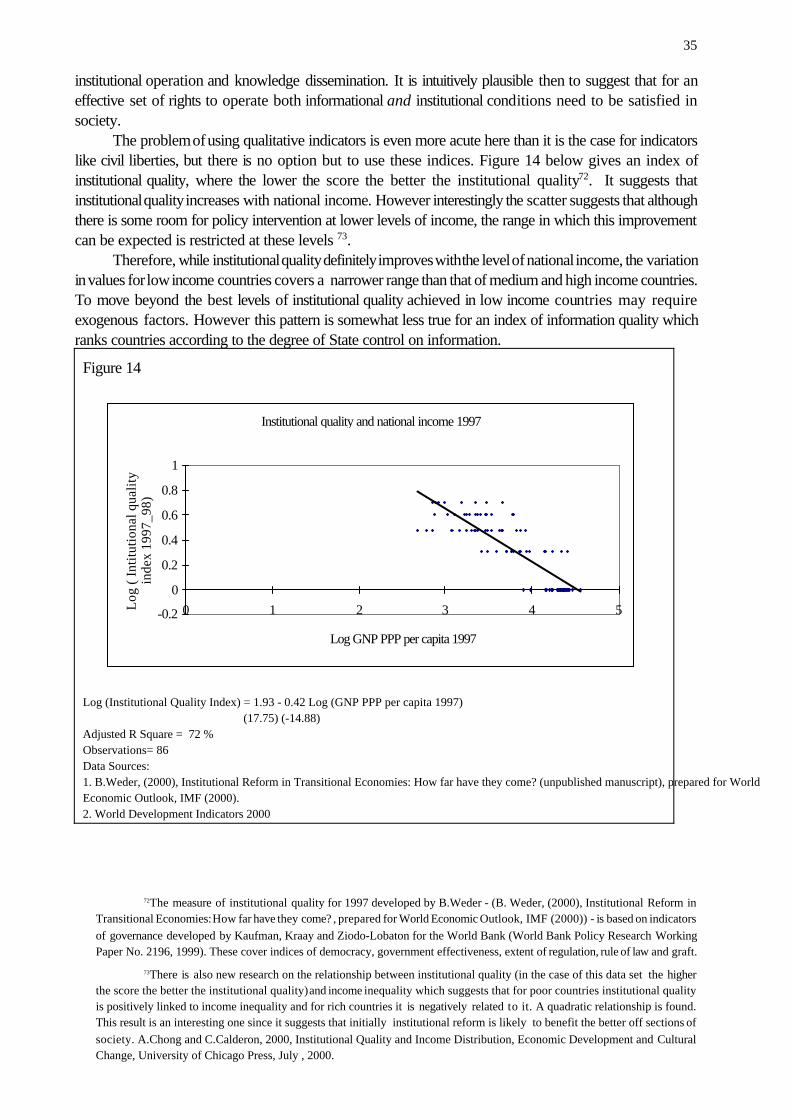
35
72The measure of institutional quality for 1997 developed by B.Weder - (B. Weder, (2000), Institutional Reform inTransitional Economies: How far have they come? , prepared for World Economic Outlook, IMF (2000)) - is based on indicatorsof governance developed by Kaufman, Kraay and Ziodo-Lobaton for the World Bank (World Bank Policy Research WorkingPaper No. 2196, 1999). These cover indices of democracy, government effectiveness, extent of regulation, rule of law and graft.
73There is also new research on the relationship between institutional quality (in the case of this data set the higherthe score the better the institutional quality) and income inequality which suggests that for poor countries institutional qualityis positively linked to income inequality and for rich countries it is negatively related to it. A quadratic relationship is found.This result is an interesting one since it suggests that initially institutional reform is likely to benefit the better off sections ofsociety. A.Chong and C.Calderon, 2000, Institutional Quality and Income Distribution, Economic Development and CulturalChange, University of Chicago Press, July , 2000.
institutional operation and knowledge dissemination. It is intuitively plausible then to suggest that for aneffective set of rights to operate both informational and institutional conditions need to be satisfied insociety.
The problem of using qualitative indicators is even more acute here than it is the case for indicatorslike civil liberties, but there is no option but to use these indices. Figure 14 below gives an index ofinstitutional quality, where the lower the score the better the institutional quality72. It suggests thatinstitutional quality increases with national income. However interestingly the scatter suggests that althoughthere is some room for policy intervention at lower levels of income, the range in which this improvementcan be expected is restricted at these levels 73.
Therefore, while institutional quality definitely improves with the level of national income, the variationin values for low income countries covers a narrower range than that of medium and high income countries.To move beyond the best levels of institutional quality achieved in low income countries may requireexogenous factors. However this pattern is somewhat less true for an index of information quality whichranks countries according to the degree of State control on information.
Figure 14
Institutional quality and national income 1997
-0.2
0
0.2
0.4
0.6
0.8
1
0 1 2 3 4 5
Log GNP PPP per capita 1997
Log
( In
titut
iona
l qua
lity
inde
x 19
97_9
8)
Log (Institutional Quality Index) = 1.93 - 0.42 Log (GNP PPP per capita 1997) (17.75) (-14.88)Adjusted R Square = 72 %Observations= 86Data Sources:1. B.Weder, (2000), Institutional Reform in Transitional Economies: How far have they come? (unpublished manuscript), prepared for WorldEconomic Outlook, IMF (2000).2. World Development Indicators 2000
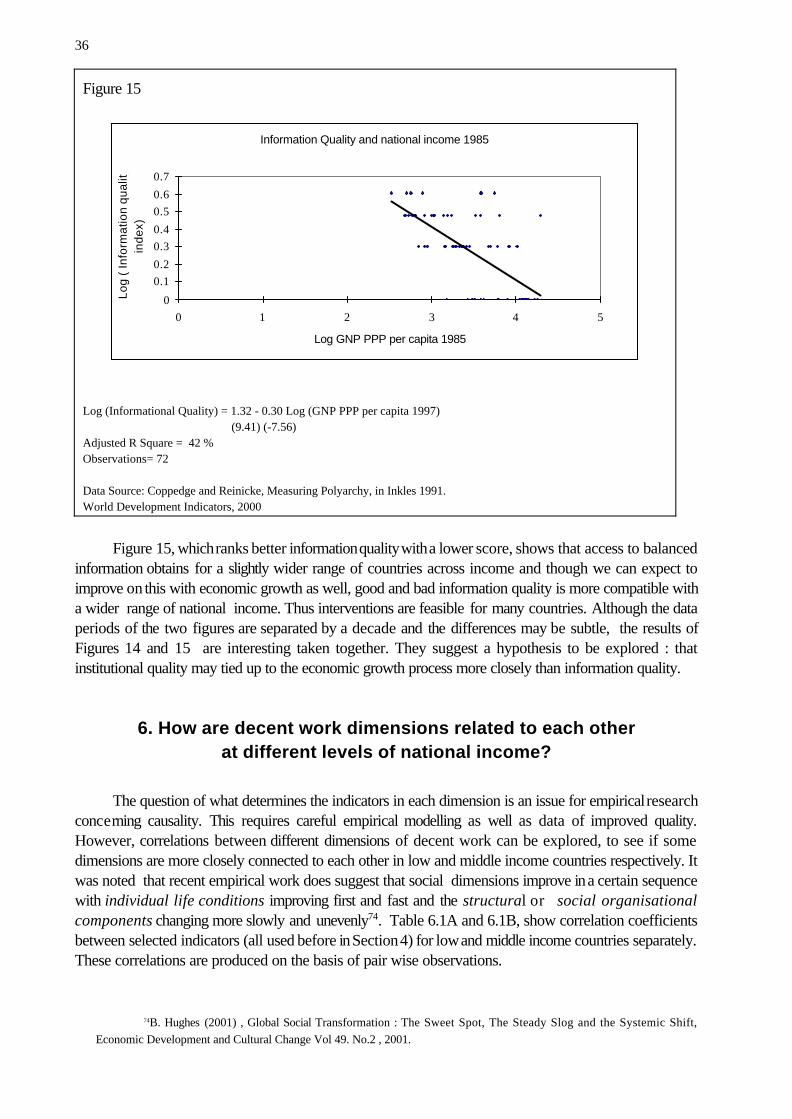
36
74B. Hughes (2001) , Global Social Transformation : The Sweet Spot, The Steady Slog and the Systemic Shift,Economic Development and Cultural Change Vol 49. No.2 , 2001.
Figure 15
Information Quality and national income 1985
0
0.10.2
0.30.4
0.50.6
0.7
0 1 2 3 4 5
Log GNP PPP per capita 1985
Log
( In
form
atio
n qu
ality
in
dex)
Log (Informational Quality) = 1.32 - 0.30 Log (GNP PPP per capita 1997) (9.41) (-7.56)Adjusted R Square = 42 %Observations= 72
Data Source: Coppedge and Reinicke, Measuring Polyarchy, in Inkles 1991.World Development Indicators, 2000
Figure 15, which ranks better information quality with a lower score, shows that access to balancedinformation obtains for a slightly wider range of countries across income and though we can expect toimprove on this with economic growth as well, good and bad information quality is more compatible witha wider range of national income. Thus interventions are feasible for many countries. Although the dataperiods of the two figures are separated by a decade and the differences may be subtle, the results ofFigures 14 and 15 are interesting taken together. They suggest a hypothesis to be explored : thatinstitutional quality may tied up to the economic growth process more closely than information quality.
6. How are decent work dimensions related to each otherat different levels of national income?
The question of what determines the indicators in each dimension is an issue for empirical researchconcerning causality. This requires careful empirical modelling as well as data of improved quality.However, correlations between different dimensions of decent work can be explored, to see if somedimensions are more closely connected to each other in low and middle income countries respectively. Itwas noted that recent empirical work does suggest that social dimensions improve in a certain sequencewith individual life conditions improving first and fast and the structural or social organisationalcomponents changing more slowly and unevenly74. Table 6.1A and 6.1B, show correlation coefficientsbetween selected indicators (all used before in Section 4) for low and middle income countries separately.These correlations are produced on the basis of pair wise observations.
37
75Child labour is of course also an indicator of employment.
For the choice of indicators in employment informal employment as well as the working poor ratehave been chosen. The data as well as the coverage as we know for formal employment is restricted forlow income developing countries . In this case then, while urban informality is likely to capture theemployment situation in both low and middle income countries, the working poor are likely to be a slightlymore relevant indicator for countries at lower incomes. On security, the social security expenditure variablechosen is the wider indicator covering all and is likely to be relevant in both low and middle incomecountries. The size of the socially protected population on the other hand, is likely to be more relevant inmiddle income countries. On representation, union densities are likely to be of relatively more importancein middle income countries, while civil liberties the index applicable to many more is likely to be relevantin both low and middle income countries. The gender primary enrollment bias and child labour are the twoindicators taken for rights at work75. They are expected to generally applicable. Links between thesevariables are likely to be co-determined by many factors that cannot be assessed at this level. We alreadyknow that many of these variables show relationships mediated by national income.
The results are interesting and show a discernible pattern. If we look at the statistically significantcorrelations what is clear is that they increase from 11 out of 64 in the low income countries group to 32out of 64 in the middle income countries group. Table 6.2 below gives a count of these statisticallysignificant correlations.
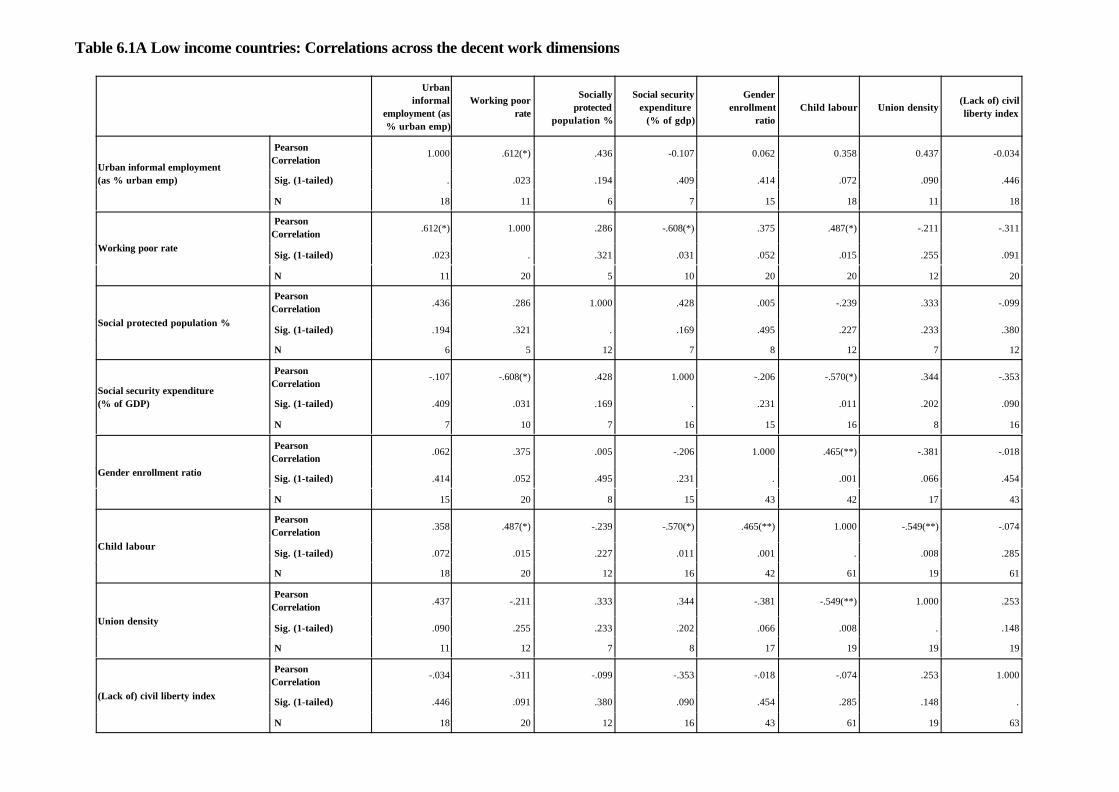
Table 6.1A Low income countries: Correlations across the decent work dimensions
Urbaninformal
employment (as% urban emp)
Working poorrate
Sociallyprotected
population %
Social securityexpenditure
(% of gdp)
Genderenrollment
ratio Child labour Union density
(Lack of) civilliberty index
Urban informal employment (as % urban emp)
PearsonCorrelation
1.000 .612(*) .436 -0.107 0.062 0.358 0.437 -0.034
Sig. (1-tailed) . .023 .194 .409 .414 .072 .090 .446
N 18 11 6 7 15 18 11 18
Working poor rate
PearsonCorrelation .612(*) 1.000 .286 -.608(*) .375 .487(*) -.211 -.311
Sig. (1-tailed) .023 . .321 .031 .052 .015 .255 .091
N 11 20 5 10 20 20 12 20
Social protected population %
PearsonCorrelation .436 .286 1.000 .428 .005 -.239 .333 -.099
Sig. (1-tailed) .194 .321 . .169 .495 .227 .233 .380
N 6 5 12 7 8 12 7 12
Social security expenditure (% of GDP)
PearsonCorrelation
-.107 -.608(*) .428 1.000 -.206 -.570(*) .344 -.353
Sig. (1-tailed) .409 .031 .169 . .231 .011 .202 .090
N 7 10 7 16 15 16 8 16
Gender enrollment ratio
PearsonCorrelation
.062 .375 .005 -.206 1.000 .465(**) -.381 -.018
Sig. (1-tailed) .414 .052 .495 .231 . .001 .066 .454
N 15 20 8 15 43 42 17 43
Child labour
PearsonCorrelation .358 .487(*) -.239 -.570(*) .465(**) 1.000 -.549(**) -.074
Sig. (1-tailed) .072 .015 .227 .011 .001 . .008 .285
N 18 20 12 16 42 61 19 61
Union density
PearsonCorrelation .437 -.211 .333 .344 -.381 -.549(**) 1.000 .253
Sig. (1-tailed) .090 .255 .233 .202 .066 .008 . .148
N 11 12 7 8 17 19 19 19
(Lack of) civil liberty index
PearsonCorrelation
-.034 -.311 -.099 -.353 -.018 -.074 .253 1.000
Sig. (1-tailed) .446 .091 .380 .090 .454 .285 .148 .
N 18 20 12 16 43 61 19 63

39
* Correlation is significant at the 0.05 level (1-tailed)** Correlation is significant at the 0.01 level (1-tailed)
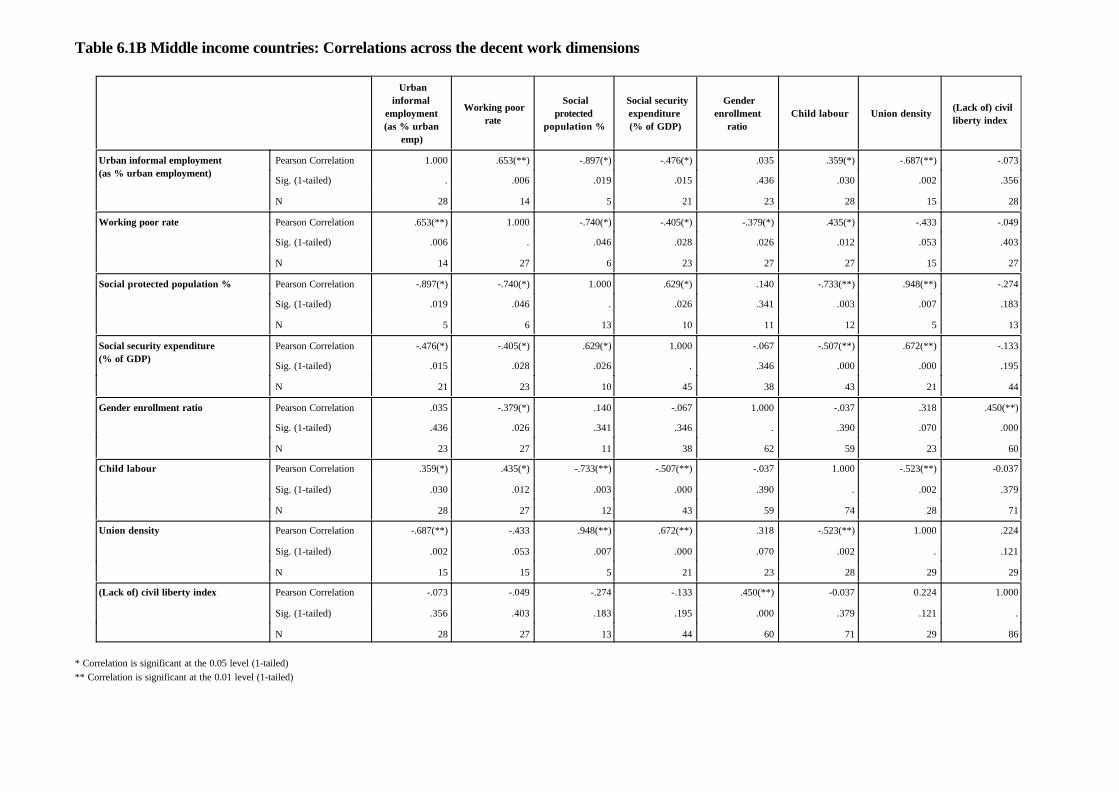
Table 6.1B Middle income countries: Correlations across the decent work dimensions
Urbaninformal
employment(as % urban
emp)
Working poorrate
Socialprotected
population %
Social securityexpenditure (% of GDP)
Genderenrollment
ratio Child labour Union density (Lack of) civil
liberty index
Urban informal employment (as % urban employment)
Pearson Correlation 1.000 .653(**) -.897(*) -.476(*) .035 .359(*) -.687(**) -.073
Sig. (1-tailed) . .006 .019 .015 .436 .030 .002 .356
N 28 14 5 21 23 28 15 28
Working poor rate Pearson Correlation .653(**) 1.000 -.740(*) -.405(*) -.379(*) .435(*) -.433 -.049
Sig. (1-tailed) .006 . .046 .028 .026 .012 .053 .403
N 14 27 6 23 27 27 15 27
Social protected population % Pearson Correlation -.897(*) -.740(*) 1.000 .629(*) .140 -.733(**) .948(**) -.274
Sig. (1-tailed) .019 .046 . .026 .341 .003 .007 .183
N 5 6 13 10 11 12 5 13
Social security expenditure (% of GDP)
Pearson Correlation -.476(*) -.405(*) .629(*) 1.000 -.067 -.507(**) .672(**) -.133
Sig. (1-tailed) .015 .028 .026 . .346 .000 .000 .195
N 21 23 10 45 38 43 21 44
Gender enrollment ratio Pearson Correlation .035 -.379(*) .140 -.067 1.000 -.037 .318 .450(**)
Sig. (1-tailed) .436 .026 .341 .346 . .390 .070 .000
N 23 27 11 38 62 59 23 60
Child labour Pearson Correlation .359(*) .435(*) -.733(**) -.507(**) -.037 1.000 -.523(**) -0.037
Sig. (1-tailed) .030 .012 .003 .000 .390 . .002 .379
N 28 27 12 43 59 74 28 71
Union density Pearson Correlation -.687(**) -.433 .948(**) .672(**) .318 -.523(**) 1.000 .224
Sig. (1-tailed) .002 .053 .007 .000 .070 .002 . .121
N 15 15 5 21 23 28 29 29
(Lack of) civil liberty index Pearson Correlation -.073 -.049 -.274 -.133 .450(**) -0.037 0.224 1.000
Sig. (1-tailed) .356 .403 .183 .195 .000 .379 .121 .
N 28 27 13 44 60 71 29 86
* Correlation is significant at the 0.05 level (1-tailed)** Correlation is significant at the 0.01 level (1-tailed)
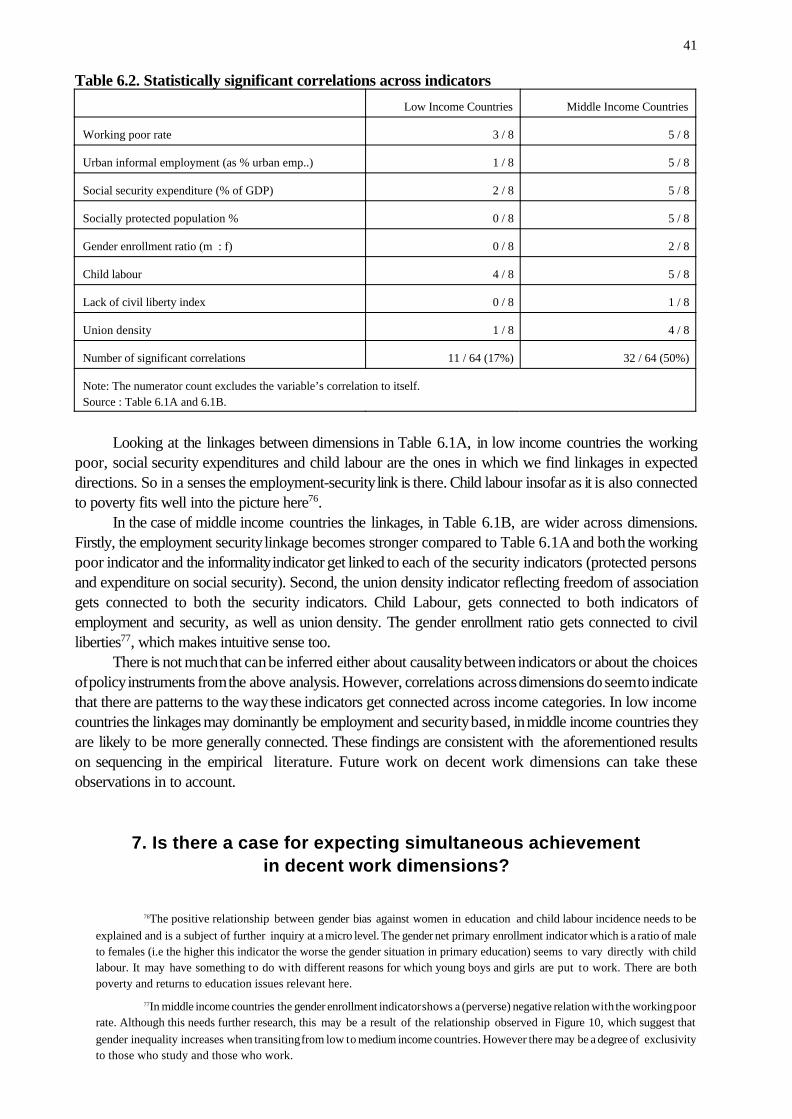
41
76The positive relationship between gender bias against women in education and child labour incidence needs to beexplained and is a subject of further inquiry at a micro level. The gender net primary enrollment indicator which is a ratio of maleto females (i.e the higher this indicator the worse the gender situation in primary education) seems to vary directly with childlabour. It may have something to do with different reasons for which young boys and girls are put to work. There are bothpoverty and returns to education issues relevant here.
77In middle income countries the gender enrollment indicator shows a (perverse) negative relation with the working poorrate. Although this needs further research, this may be a result of the relationship observed in Figure 10, which suggest thatgender inequality increases when transiting from low to medium income countries. However there may be a degree of exclusivityto those who study and those who work.
Table 6.2. Statistically significant correlations across indicators
Low Income Countries Middle Income Countries
Working poor rate 3 / 8 5 / 8
Urban informal employment (as % urban emp..) 1 / 8 5 / 8
Social security expenditure (% of GDP) 2 / 8 5 / 8
Socially protected population % 0 / 8 5 / 8
Gender enrollment ratio (m : f) 0 / 8 2 / 8
Child labour 4 / 8 5 / 8
Lack of civil liberty index 0 / 8 1 / 8
Union density 1 / 8 4 / 8
Number of significant correlations 11 / 64 (17%) 32 / 64 (50%)
Note: The numerator count excludes the variable’s correlation to itself.Source : Table 6.1A and 6.1B.
Looking at the linkages between dimensions in Table 6.1A, in low income countries the workingpoor, social security expenditures and child labour are the ones in which we find linkages in expecteddirections. So in a senses the employment-security link is there. Child labour insofar as it is also connectedto poverty fits well into the picture here76.
In the case of middle income countries the linkages, in Table 6.1B, are wider across dimensions.Firstly, the employment security linkage becomes stronger compared to Table 6.1A and both the workingpoor indicator and the informality indicator get linked to each of the security indicators (protected personsand expenditure on social security). Second, the union density indicator reflecting freedom of associationgets connected to both the security indicators. Child Labour, gets connected to both indicators ofemployment and security, as well as union density. The gender enrollment ratio gets connected to civilliberties77, which makes intuitive sense too.
There is not much that can be inferred either about causality between indicators or about the choicesof policy instruments from the above analysis. However, correlations across dimensions do seem to indicatethat there are patterns to the way these indicators get connected across income categories. In low incomecountries the linkages may dominantly be employment and security based, in middle income countries theyare likely to be more generally connected. These findings are consistent with the aforementioned resultson sequencing in the empirical literature. Future work on decent work dimensions can take theseobservations in to account.
7. Is there a case for expecting simultaneous achievementin decent work dimensions?
42
It was shown in Section 5 that there are grounds for intervening on the dimensions of decent workin developing countries, given the general positive expectation between economic prosperity and achievingmore decent work. This was found to be plausible both at a societal level as well as the level of work, thedistinction that we started with. In Section 6, there was an attempt to assess if there were any systematicinterrelationships between dimensions of decent work. We found that there may be grounds for expectingsome patterns here as well. The question that is asked in this section is whether achievements on some ofthese indicators may have simultaneity effects on achievement on other indicators.
Any assessment of simultaneity needs to control for the effect of national income, in other wordsisolating growth from indicator performance. This is because we know that national income and its growthare generally positively linked to improvements in decent work dimensions, therefore an indicator of country“performance” needs to be one of performance despite the national income effect. In other words, goodperformers are those countries that do better on an indicator than what would be expected simply on thebasis of national income. Similarly bad performers are those countries that do worse on a given indicatorthan what would be expected on the basis of national income. Having classified countries in this way weneed to examine if indicators move together in some sense.
Since the procedure we are using for examining simultaneity in country performance on indicatorsinvolves partitioning and analyzing converted residuals (converted in to binary values), we can call it aqualitative analysis of partitioned residuals. This test is described below.
7.1. Country and indicator selection
The first step is to select a few indicators of dimensions of decent work on which the information iscomplete for a large enough set of developing countries. Six indicators were chosen for forty-sevencountries. In each of these indicators the greater value is indicative of worse performance.
These were:
• Working Poor Rate (Employment)
• Adult Illiteracy (Security)
• Life Expectancy (Security)
• Child Labour (Rights at work)
• Net Enrollment Ratio Males :Female (Rights at work)
• Civil Liberties (Representation)
The indicators correspond in definition to those used in earlier sections of this paper. The two
indicators on security are damage indicators indicative of societal insecurity. One of the main determinantson the choice of indicators was that we needed our sample of countries to be of reasonable size andthe data set to be full.
43
78What is striking is that in the list of net good scores, many countries are recognisably ones with “socialist” periodsin their economic histories. This is an interesting area to explore in future research.
79 For example, net terms would mean if a country is a good performer on three indicators and bad performer on oneindicator, it would be deemed to be a net good performer with a degree of simultaneity of two.
7.2. A qualitative analysis of partitioned residuals
The second step is to run two-variable simple OLS regressions with respect to national income foreach of the indicators for the 47 countries. These are the same exercises as in section 5, except that theseare done now for our full data set on the six variables for the reduced set of 47 countries. The next step isto list residuals from each of the regression equations according to value and sign. The argument is thatnegative residuals (actual minus predicted values) mean that a country has performed better than whatwould be expected purely on the basis of its national income, and a positive residual that it has performedworse than what is expected on the basis of its national income. One can then proceed to partition theresiduals to assess degree of good and bad performance. The choice of partition is arbitrary though it needsto be consistently applied in each of the six variable series. Our partition of the residual data is done on thefollowing basis. There are 47 countries, so we take the top 15 negative residuals as best performers andgive them a value of -1, and the bottom 15 (positive) residuals as the worst performers and give them thevalue of + 1. The 17 countries in the middle are considered so close to the regression line that they aredeemed as performing according to expectation. These are neutral performers and are given the value of0. Table 7.1 gives the residual list transformed in to the -1, 0 and + 1 classification. Table 7.2 gives netscores on the six indicators for each country.
There are conflicts between indicators in countries as Table 7.1 shows, and doing well on oneindicator does not automatically mean doing well on others. Table 7.2 suggests that there is a largenumber of countries that show some simultaneous movement on the indicators, good or bad, in net terms78.
7.3 Country performance
The next step is to examine the performance of good and deficiently performing countries on the sixselected indicators according some criteria. We use the following definitions for grouping countries basedon Table 7.1 and Table 7.2.
• A net good or bad performer can be any country that is either performing well or badly on at least
one indicator in net terms. So for example if a country performs badly on three and well on threeindicators it shows neither good nor bad performance. However if it performs well on two and badlyon one indicator, it performs well in net terms. This is clearly a weak indicator of performance. Interms of Table 7.2, all non-zero positive score countries are bad performers and all negative scoresare good performers.
• The second classification is that of net simultaneity. One way of defining the degree of good
simultaneity would be to say that in the group of net good performers defined above, any country thatperforms better than expected on two or more indicators in net terms79 shows good net simultaneity.Similarly a way of defining the degree of net bad simultaneity would be to say that in the group ofdeficient performers, any country that in net terms, performs worse than expected on two or moreindicators, shows bad net simultaneity. In terms of Table 7.2 all countries with values of -2 to -5show net good simultaneity, and countries scoring +2 to +5 show net bad simultaneity.
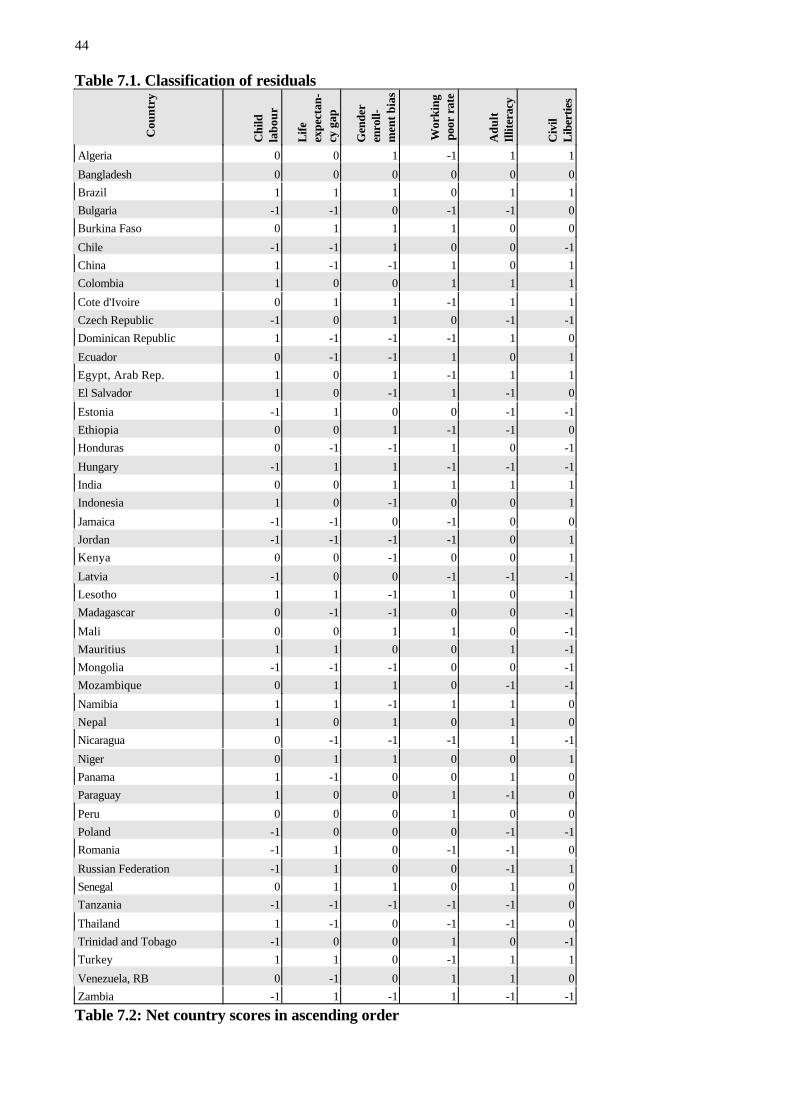
44
Table 7.1. Classification of residuals
Cou
ntry
Chi
ldla
bour
Life
expe
ctan
-cy
gap
Gen
der
enro
ll-m
ent b
ias
Wor
king
poor
rat
e
Adu
ltIl
liter
acy
Civ
ilL
iber
ties
Algeria 0 0 1 -1 1 1
Bangladesh 0 0 0 0 0 0Brazil 1 1 1 0 1 1Bulgaria -1 -1 0 -1 -1 0Burkina Faso 0 1 1 1 0 0
Chile -1 -1 1 0 0 -1China 1 -1 -1 1 0 1Colombia 1 0 0 1 1 1
Cote d'Ivoire 0 1 1 -1 1 1Czech Republic -1 0 1 0 -1 -1Dominican Republic 1 -1 -1 -1 1 0
Ecuador 0 -1 -1 1 0 1Egypt, Arab Rep. 1 0 1 -1 1 1El Salvador 1 0 -1 1 -1 0
Estonia -1 1 0 0 -1 -1Ethiopia 0 0 1 -1 -1 0Honduras 0 -1 -1 1 0 -1
Hungary -1 1 1 -1 -1 -1India 0 0 1 1 1 1Indonesia 1 0 -1 0 0 1
Jamaica -1 -1 0 -1 0 0Jordan -1 -1 -1 -1 0 1Kenya 0 0 -1 0 0 1
Latvia -1 0 0 -1 -1 -1Lesotho 1 1 -1 1 0 1Madagascar 0 -1 -1 0 0 -1
Mali 0 0 1 1 0 -1Mauritius 1 1 0 0 1 -1Mongolia -1 -1 -1 0 0 -1Mozambique 0 1 1 0 -1 -1
Namibia 1 1 -1 1 1 0Nepal 1 0 1 0 1 0Nicaragua 0 -1 -1 -1 1 -1
Niger 0 1 1 0 0 1Panama 1 -1 0 0 1 0Paraguay 1 0 0 1 -1 0
Peru 0 0 0 1 0 0Poland -1 0 0 0 -1 -1Romania -1 1 0 -1 -1 0
Russian Federation -1 1 0 0 -1 1Senegal 0 1 1 0 1 0Tanzania -1 -1 -1 -1 -1 0
Thailand 1 -1 0 -1 -1 0Trinidad and Tobago -1 0 0 1 0 -1Turkey 1 1 0 -1 1 1
Venezuela, RB 0 -1 0 1 1 0Zambia -1 1 -1 1 -1 -1
Table 7.2: Net country scores in ascending order
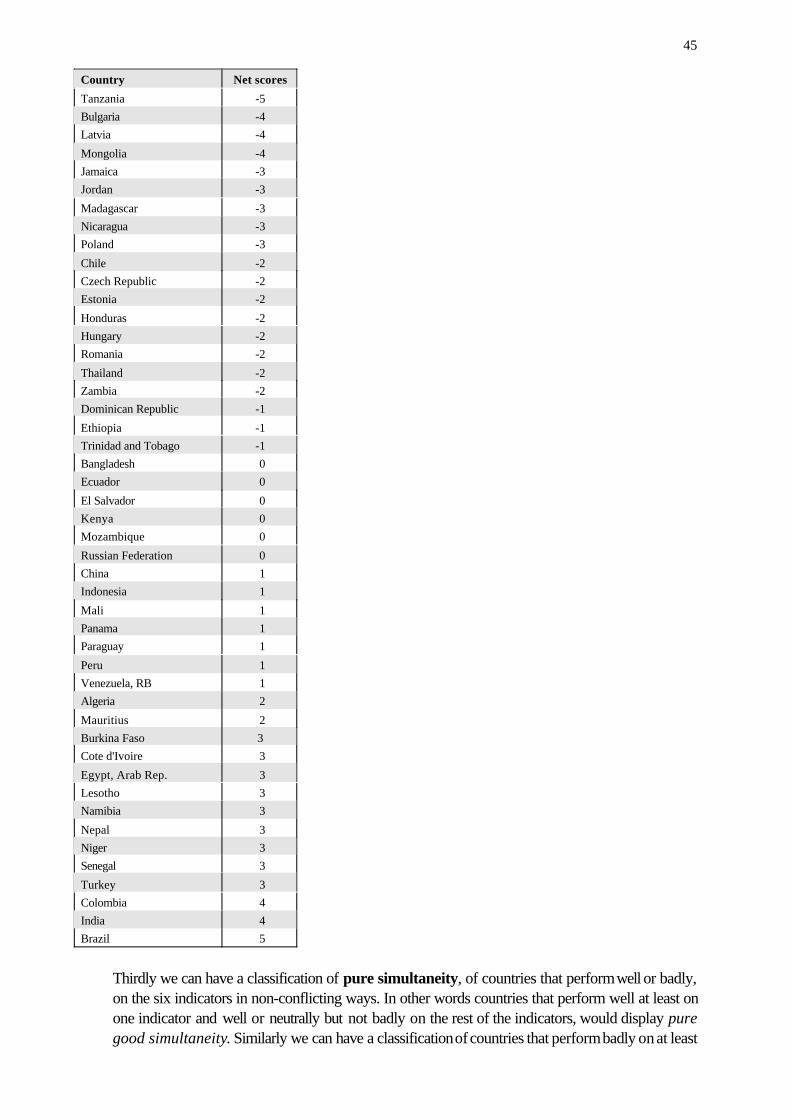
45
Country Net scores
Tanzania -5Bulgaria -4Latvia -4
Mongolia -4Jamaica -3Jordan -3
Madagascar -3Nicaragua -3Poland -3
Chile -2Czech Republic -2Estonia -2
Honduras -2Hungary -2Romania -2
Thailand -2Zambia -2Dominican Republic -1
Ethiopia -1Trinidad and Tobago -1Bangladesh 0Ecuador 0
El Salvador 0Kenya 0Mozambique 0
Russian Federation 0China 1Indonesia 1
Mali 1Panama 1Paraguay 1
Peru 1Venezuela, RB 1Algeria 2
Mauritius 2Burkina Faso 3 Cote d'Ivoire 3
Egypt, Arab Rep. 3Lesotho 3Namibia 3
Nepal 3Niger 3Senegal 3
Turkey 3Colombia 4India 4Brazil 5
Thirdly we can have a classification of pure simultaneity, of countries that perform well or badly,on the six indicators in non-conflicting ways. In other words countries that perform well at least onone indicator and well or neutrally but not badly on the rest of the indicators, would display puregood simultaneity. Similarly we can have a classification of countries that perform badly on at least
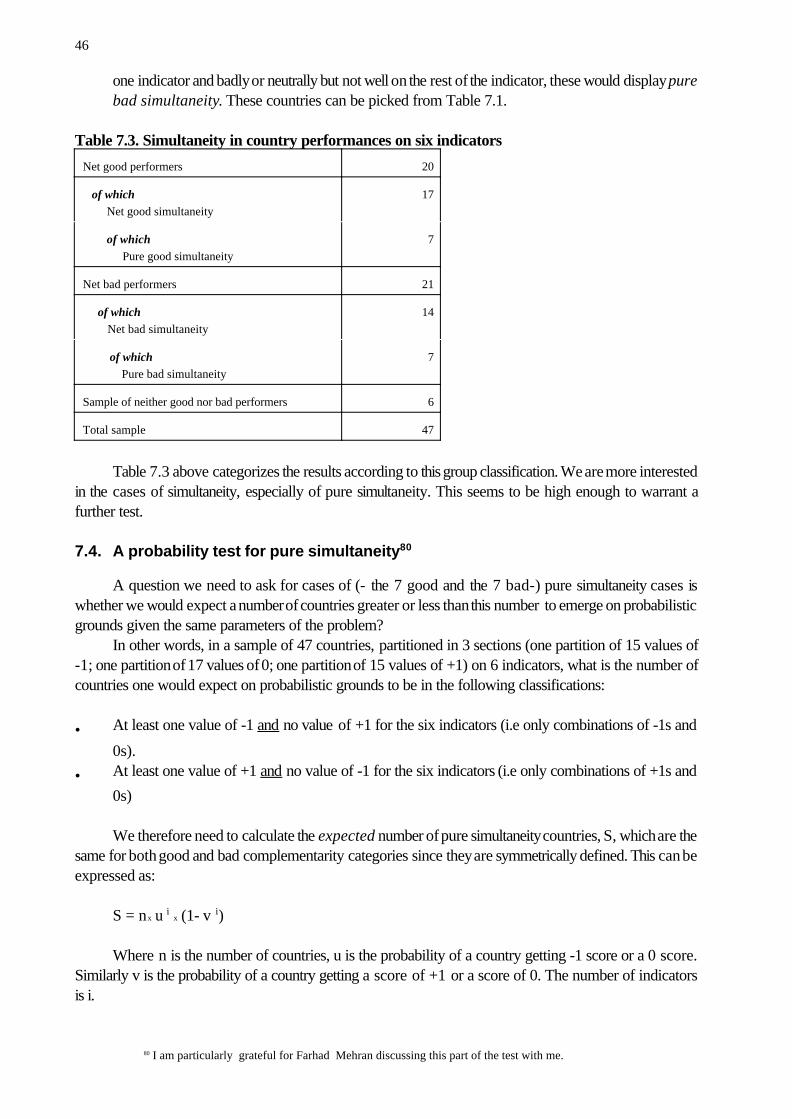
46
80 I am particularly grateful for Farhad Mehran discussing this part of the test with me.
one indicator and badly or neutrally but not well on the rest of the indicator, these would display purebad simultaneity. These countries can be picked from Table 7.1.
Table 7.3. Simultaneity in country performances on six indicators
Net good performers 20
of which Net good simultaneity
17
of which Pure good simultaneity
7
Net bad performers 21
of which Net bad simultaneity
14
of which Pure bad simultaneity
7
Sample of neither good nor bad performers 6
Total sample 47
Table 7.3 above categorizes the results according to this group classification. We are more interestedin the cases of simultaneity, especially of pure simultaneity. This seems to be high enough to warrant afurther test.
7.4. A probability test for pure simultaneity80
A question we need to ask for cases of (- the 7 good and the 7 bad-) pure simultaneity cases iswhether we would expect a number of countries greater or less than this number to emerge on probabilisticgrounds given the same parameters of the problem?
In other words, in a sample of 47 countries, partitioned in 3 sections (one partition of 15 values of-1; one partition of 17 values of 0; one partition of 15 values of +1) on 6 indicators, what is the number ofcountries one would expect on probabilistic grounds to be in the following classifications:
• At least one value of -1 and no value of +1 for the six indicators (i.e only combinations of -1s and
0s).
• At least one value of +1 and no value of -1 for the six indicators (i.e only combinations of +1s and
0s)
We therefore need to calculate the expected number of pure simultaneity countries, S, which are thesame for both good and bad complementarity categories since they are symmetrically defined. This can beexpressed as:
S = n x u i x (1- v i)
Where n is the number of countries, u is the probability of a country getting -1 score or a 0 score.Similarly v is the probability of a country getting a score of +1 or a score of 0. The number of indicatorsis i.
47
If S < 7, which the number of countries in which pure simultaneity is observed then a case forsimultaneity cannot be made. In our example,
n = Number of countries = 47i = the number of indicators = 6P 1 = probability of achieving -1 = 15/ 47P 2 = probability of achieving 0 = 17/ 47P 3 = probability of achieving +1 = 15/47P 1 + P 2 = uP 2 + P 3 = vv = u = 32/47 = 0.6808u 6 = v 6= 0.0996
So S = n x u i x (1- v i)S = 47 x 0.0996 x (1 - 0.0996) S = 47 x 0.0996 x 0.9003 S = 4.2
The number of pure simultaneity countries in our sample (good and bad respectively ) are 7, whichis significantly greater than 4.2 (say 5), the number of countries we would expect at random to bedisplaying pure simultaneity. There is consequently a case to be made for the existence of pure simultaneity.
7.5. The reasons for the existence of simultaneity
We have found that there is a basis to make a case for expecting simultaneity in social dimensionsof development related to decent work. The reason why simultaneity may obtain still needs to be explained.Although this is a subject of research in itself, it is quite likely that there are deeper features of societies thataffect enabling conditions for achievement of the social indicators we have chosen. These are likely to beof both structural and institutional varieties. It is therefore useful to see if on a selection of structural andinstitutional proxy variables (not included in the indicators) these groups systematically vary.
To proxy a structural variable we use a gini-coefficient of the distribution of income, for institutionalvariables it is the institutional quality index used in Figure 14. Tables 7.4 and 7.5 below give results of adifference of means test on selected results of Table 7.3.
It is interesting to see that the structural and institutional proxies vary systematically with respect tothe performance classifications. Generally speaking, the results are stronger in the pure tests in Table 7.5.While institutional quality makes a definite difference in performance
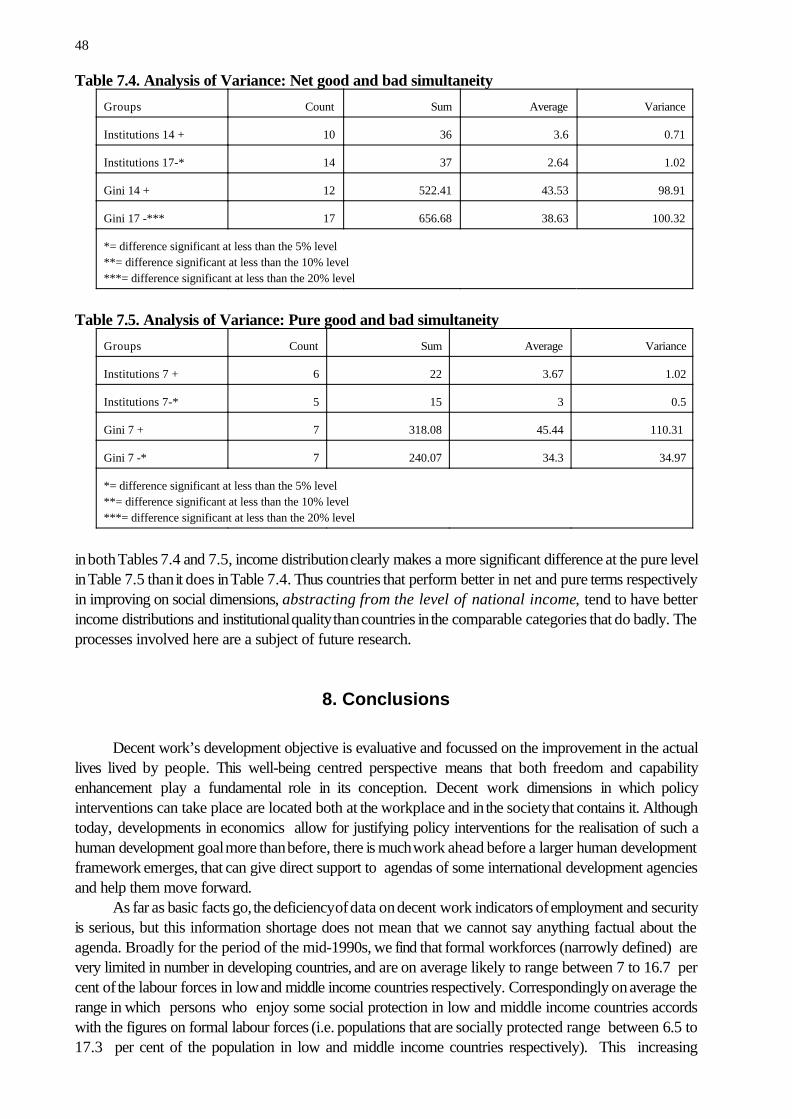
48
Table 7.4. Analysis of Variance: Net good and bad simultaneity
Groups Count Sum Average Variance
Institutions 14 + 10 36 3.6 0.71
Institutions 17-* 14 37 2.64 1.02
Gini 14 + 12 522.41 43.53 98.91
Gini 17 -*** 17 656.68 38.63 100.32
*= difference significant at less than the 5% level**= difference significant at less than the 10% level***= difference significant at less than the 20% level
Table 7.5. Analysis of Variance: Pure good and bad simultaneity
Groups Count Sum Average Variance
Institutions 7 + 6 22 3.67 1.02
Institutions 7-* 5 15 3 0.5
Gini 7 + 7 318.08 45.44 110.31
Gini 7 -* 7 240.07 34.3 34.97
*= difference significant at less than the 5% level**= difference significant at less than the 10% level***= difference significant at less than the 20% level
in both Tables 7.4 and 7.5, income distribution clearly makes a more significant difference at the pure levelin Table 7.5 than it does in Table 7.4. Thus countries that perform better in net and pure terms respectivelyin improving on social dimensions, abstracting from the level of national income, tend to have betterincome distributions and institutional quality than countries in the comparable categories that do badly. Theprocesses involved here are a subject of future research.
8. Conclusions
Decent work’s development objective is evaluative and focussed on the improvement in the actuallives lived by people. This well-being centred perspective means that both freedom and capabilityenhancement play a fundamental role in its conception. Decent work dimensions in which policyinterventions can take place are located both at the workplace and in the society that contains it. Althoughtoday, developments in economics allow for justifying policy interventions for the realisation of such ahuman development goal more than before, there is much work ahead before a larger human developmentframework emerges, that can give direct support to agendas of some international development agenciesand help them move forward.
As far as basic facts go, the deficiency of data on decent work indicators of employment and securityis serious, but this information shortage does not mean that we cannot say anything factual about theagenda. Broadly for the period of the mid-1990s, we find that formal workforces (narrowly defined) arevery limited in number in developing countries, and are on average likely to range between 7 to 16.7 percent of the labour forces in low and middle income countries respectively. Correspondingly on average therange in which persons who enjoy some social protection in low and middle income countries accordswith the figures on formal labour forces (i.e. populations that are socially protected range between 6.5 to17.3 per cent of the population in low and middle income countries respectively). This increasing
49
incompleteness of the social floor as we move down from middle to low income countries is directlyreflected in the expenditure by government on social security (defined broadly) as a percentage of nationalincome. This figure is very low in low income countries (less than 3 per cent of GDP) and reasonable(around 9.5 per cent) in middle income countries. It is this linked “employment” and “insecurity” situationin developing countries that explains in large part the phenomenon of the “working poor” . The workingpoor are likely to constitute around 30 per cent of employed persons in low income countries and around7 per cent in middle income countries. Working children in the age bracket of 10 to14 are also around 18.1per cent in low income countries and 8.7 per cent in middle income countries. Civil liberties and measuresof freedoms to organise are also better in middle income countries compared to low income countries butmost of these measures are qualitative.
That the four dimensions of the ILO agenda, by and large, improve with the economic growth ofsociety is an undeniable fact. However, this relationship between the expansion of aggregate income in asociety and decent work is not a deterministic one. Some of the preceding discussion was focussed onillustrating the point that there are grounds to doubt such determinism which still influences policy viewsamongst decision makers today. Essentially variations in the indicators with respect to national income,though suggesting a strong systematic relationship with it, also suggest that there are other factors thatexplain this variation. These other factors, it is argued, must include policy interventions that can directlyimprove (or indeed worsen) these indicators. There is consequently much that can be done to improve onthe dimensions of decent work in many countries of world. The targets for this improvement need to beset within societies through consensus.
What is also discernible is that there are some grounds for expecting distinct patterns betweendimensions of decent work for countries at low and middle income levels respectively. These showemployment and security to be closely tied to each other at lower levels of income, while a general patternof linkage is observable across all dimensions in middle income countries. This may be another useful areafor future policy research.
Thirdly it can also be argued that good performance in the same direction on several indicators,independently of the national income effect, can be significantly shown for some groups of countries. Thereis consequently a case that can be explored for possible complementarities between dimensions of decentwork. There may of course be deeper reasons why some indices of social well being, (in this case arguedto be decent work related), display a tendency to move together. These may have something to do withboth issues of distribution and governance, in other words with “equality” and “institutions”, and if this isso then it has important implications for the policy framework to promote decent work in country specificcontexts.
Conceptually the issue of causality, of what leads to what, at least at the level of ideas suggests thatrelationships are likely to be interactive. It is however clear that the proper establishment of directions ofrelationships discussed here would require the examination of country specific processes as well as ofstructure. This would entail looking more deeply and at details. There is much to be done in moving beyondassociative illustrations and going on to establishing causal links to inform policy. Fortunately there is workgoing on in the academic world in this direction although empirical research is still in its early stages. Thispaper tries to set up some basic facts related to the decent work agenda in order to facilitate the on-goingdebate among decision makers.
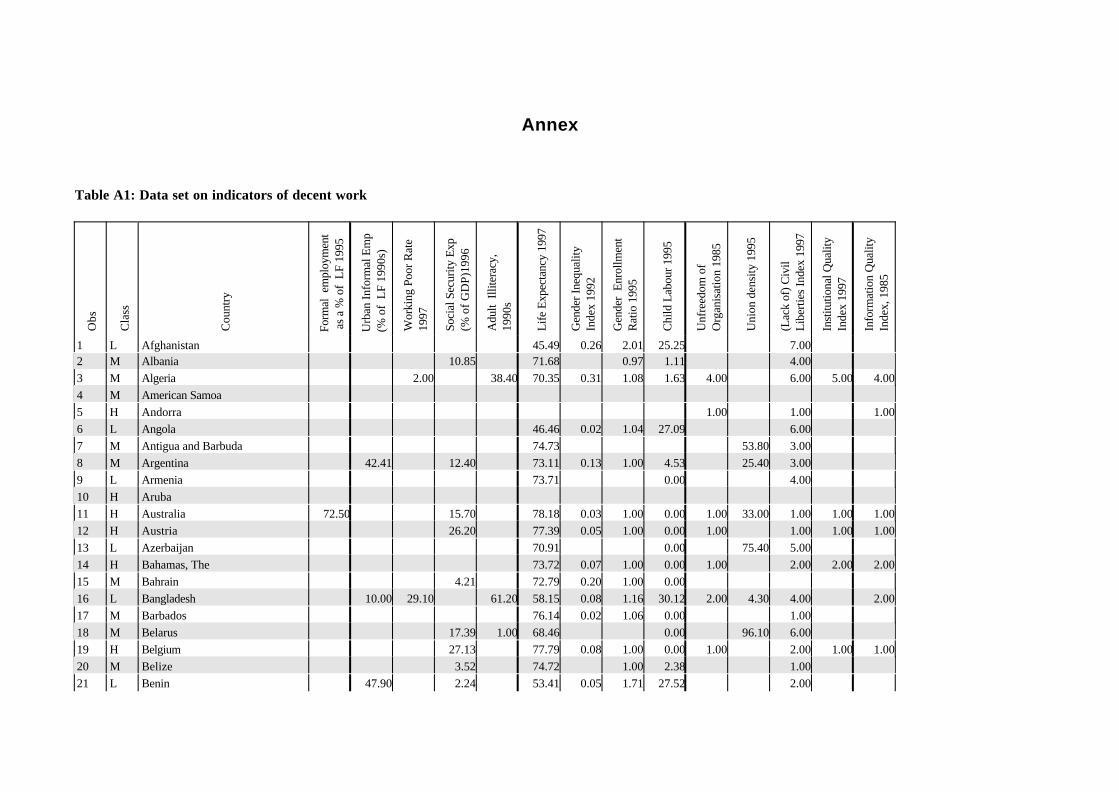
Annex
Table A1: Data set on indicators of decent work
Obs
Cla
ss
Cou
ntry
Form
al e
mpl
oym
ent
as
a %
of
LF
1995
Urb
an In
form
al E
mp
(% o
f L
F 19
90s)
Wor
king
Poo
r Rat
e19
97
Soci
al S
ecur
ity E
xp
(% o
f GD
P)19
96
Adu
lt Il
liter
acy,
1990
s
Life
Exp
ecta
ncy
1997
Gen
der I
nequ
ality
Inde
x 19
92
Gen
der
Enro
llmen
tR
atio
199
5
Chi
ld L
abou
r 199
5
Unf
reed
om o
fO
rgan
isat
ion
1985
Uni
on d
ensi
ty 1
995
(Lac
k of
) Civ
ilLi
berti
es In
dex
1997
Inst
itutio
nal Q
ualit
yIn
dex
1997
Info
rmat
ion
Qua
lity
Inde
x, 1
985
1 L Afghanistan 45.49 0.26 2.01 25.25 7.002 M Albania 10.85 71.68 0.97 1.11 4.003 M Algeria 2.00 38.40 70.35 0.31 1.08 1.63 4.00 6.00 5.00 4.004 M American Samoa5 H Andorra 1.00 1.00 1.006 L Angola 46.46 0.02 1.04 27.09 6.007 M Antigua and Barbuda 74.73 53.80 3.008 M Argentina 42.41 12.40 73.11 0.13 1.00 4.53 25.40 3.009 L Armenia 73.71 0.00 4.0010 H Aruba11 H Australia 72.50 15.70 78.18 0.03 1.00 0.00 1.00 33.00 1.00 1.00 1.0012 H Austria 26.20 77.39 0.05 1.00 0.00 1.00 1.00 1.00 1.0013 L Azerbaijan 70.91 0.00 75.40 5.0014 H Bahamas, The 73.72 0.07 1.00 0.00 1.00 2.00 2.00 2.0015 M Bahrain 4.21 72.79 0.20 1.00 0.0016 L Bangladesh 10.00 29.10 61.20 58.15 0.08 1.16 30.12 2.00 4.30 4.00 2.0017 M Barbados 76.14 0.02 1.06 0.00 1.0018 M Belarus 17.39 1.00 68.46 0.00 96.10 6.0019 H Belgium 27.13 77.79 0.08 1.00 0.00 1.00 2.00 1.00 1.0020 M Belize 3.52 74.72 1.00 2.38 1.0021 L Benin 47.90 2.24 53.41 0.05 1.71 27.52 2.00
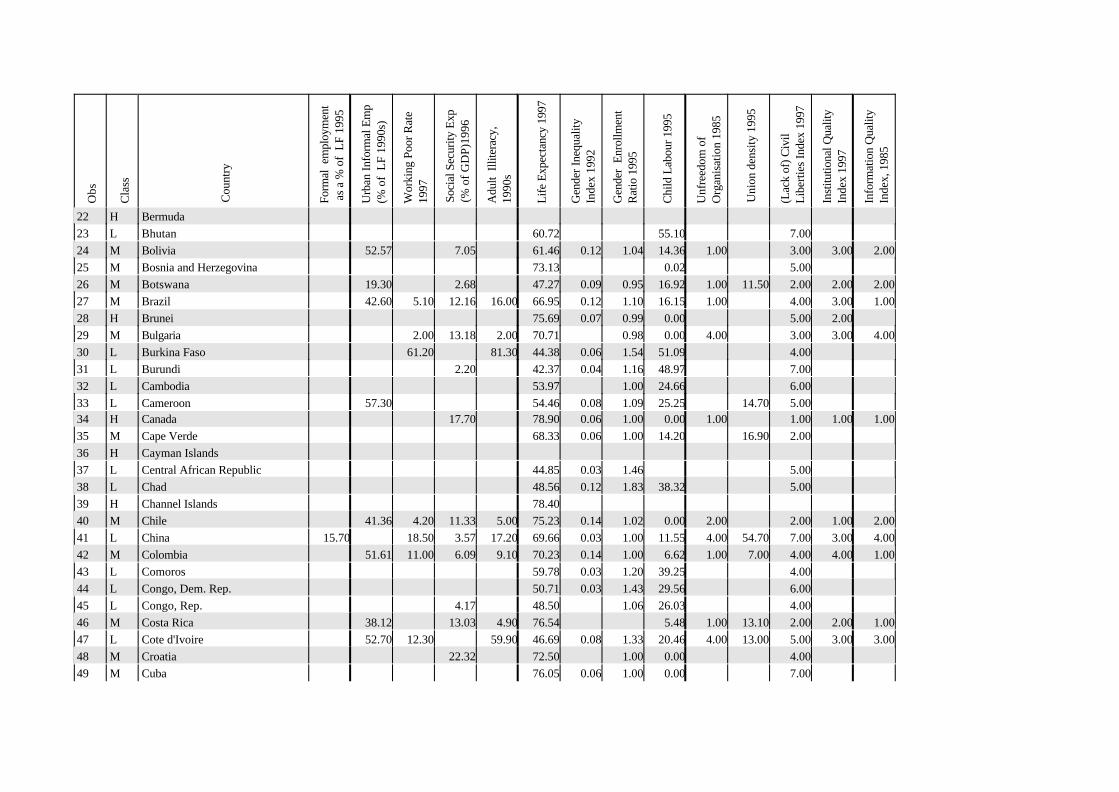
Obs
Cla
ss
Cou
ntry
Form
al e
mpl
oym
ent
as
a %
of
LF
1995
Urb
an In
form
al E
mp
(% o
f L
F 19
90s)
Wor
king
Poo
r Rat
e19
97
Soci
al S
ecur
ity E
xp
(% o
f GD
P)19
96
Adu
lt Il
liter
acy,
1990
s
Life
Exp
ecta
ncy
1997
Gen
der I
nequ
ality
Inde
x 19
92
Gen
der
Enro
llmen
tR
atio
199
5
Chi
ld L
abou
r 199
5
Unf
reed
om o
fO
rgan
isat
ion
1985
Uni
on d
ensi
ty 1
995
(Lac
k of
) Civ
ilLi
berti
es In
dex
1997
Inst
itutio
nal Q
ualit
yIn
dex
1997
Info
rmat
ion
Qua
lity
Inde
x, 1
985
22 H Bermuda23 L Bhutan 60.72 55.10 7.0024 M Bolivia 52.57 7.05 61.46 0.12 1.04 14.36 1.00 3.00 3.00 2.0025 M Bosnia and Herzegovina 73.13 0.02 5.0026 M Botswana 19.30 2.68 47.27 0.09 0.95 16.92 1.00 11.50 2.00 2.00 2.0027 M Brazil 42.60 5.10 12.16 16.00 66.95 0.12 1.10 16.15 1.00 4.00 3.00 1.0028 H Brunei 75.69 0.07 0.99 0.00 5.00 2.0029 M Bulgaria 2.00 13.18 2.00 70.71 0.98 0.00 4.00 3.00 3.00 4.0030 L Burkina Faso 61.20 81.30 44.38 0.06 1.54 51.09 4.0031 L Burundi 2.20 42.37 0.04 1.16 48.97 7.0032 L Cambodia 53.97 1.00 24.66 6.0033 L Cameroon 57.30 54.46 0.08 1.09 25.25 14.70 5.0034 H Canada 17.70 78.90 0.06 1.00 0.00 1.00 1.00 1.00 1.0035 M Cape Verde 68.33 0.06 1.00 14.20 16.90 2.0036 H Cayman Islands37 L Central African Republic 44.85 0.03 1.46 5.0038 L Chad 48.56 0.12 1.83 38.32 5.0039 H Channel Islands 78.4040 M Chile 41.36 4.20 11.33 5.00 75.23 0.14 1.02 0.00 2.00 2.00 1.00 2.0041 L China 15.70 18.50 3.57 17.20 69.66 0.03 1.00 11.55 4.00 54.70 7.00 3.00 4.0042 M Colombia 51.61 11.00 6.09 9.10 70.23 0.14 1.00 6.62 1.00 7.00 4.00 4.00 1.0043 L Comoros 59.78 0.03 1.20 39.25 4.0044 L Congo, Dem. Rep. 50.71 0.03 1.43 29.56 6.0045 L Congo, Rep. 4.17 48.50 1.06 26.03 4.0046 M Costa Rica 38.12 13.03 4.90 76.54 5.48 1.00 13.10 2.00 2.00 1.0047 L Cote d'Ivoire 52.70 12.30 59.90 46.69 0.08 1.33 20.46 4.00 13.00 5.00 3.00 3.0048 M Croatia 22.32 72.50 1.00 0.00 4.0049 M Cuba 76.05 0.06 1.00 0.00 7.00

52O
bs
Cla
ss
Cou
ntry
Form
al e
mpl
oym
ent
as
a %
of
LF
1995
Urb
an In
form
al E
mp
(% o
f L
F 19
90s)
Wor
king
Poo
r Rat
e19
97
Soci
al S
ecur
ity E
xp
(% o
f GD
P)19
96
Adu
lt Il
liter
acy,
1990
s
Life
Exp
ecta
ncy
1997
Gen
der I
nequ
ality
Inde
x 19
92
Gen
der
Enro
llmen
tR
atio
199
5
Chi
ld L
abou
r 199
5
Unf
reed
om o
fO
rgan
isat
ion
1985
Uni
on d
ensi
ty 1
995
(Lac
k of
) Civ
ilLi
berti
es In
dex
1997
Inst
itutio
nal Q
ualit
yIn
dex
1997
Info
rmat
ion
Qua
lity
Inde
x, 1
985
50 H Cyprus 10.26 77.59 0.00 53.70 1.00 1.0051 M Czech Republic 2.00 18.84 1.00 73.91 0.02 1.00 0.00 42.80 2.00
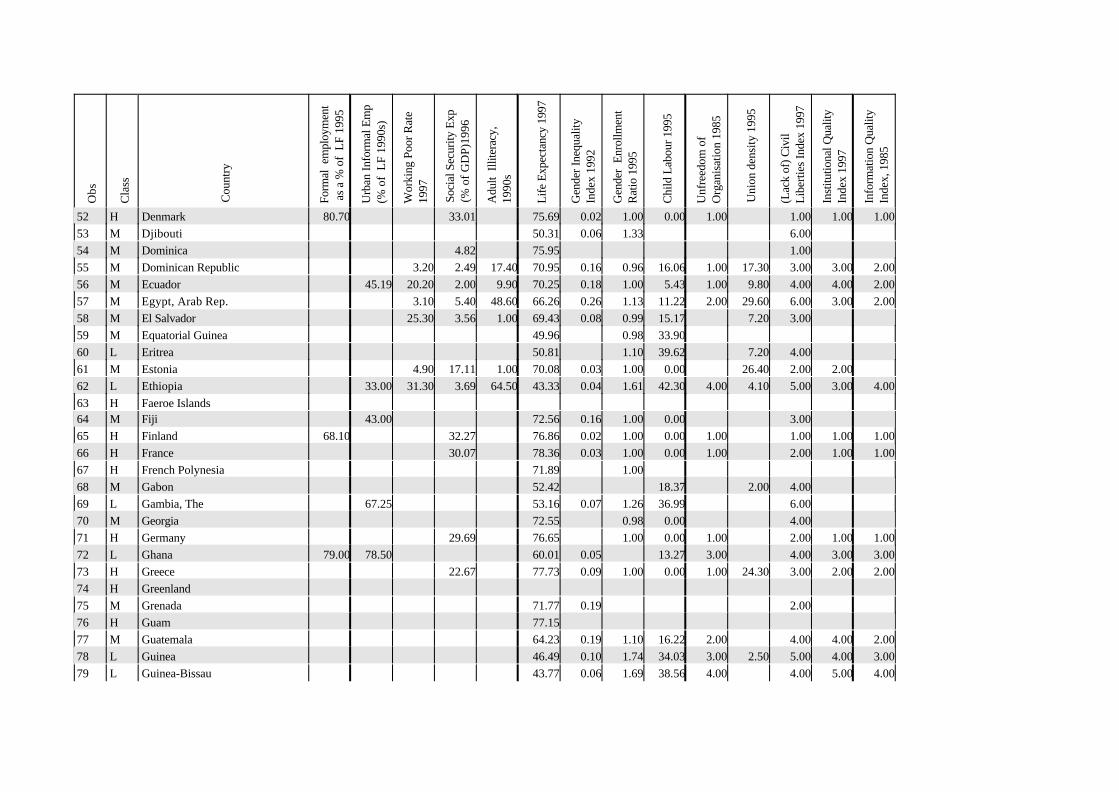
Obs
Cla
ss
Cou
ntry
Form
al e
mpl
oym
ent
as
a %
of
LF
1995
Urb
an In
form
al E
mp
(% o
f L
F 19
90s)
Wor
king
Poo
r Rat
e19
97
Soci
al S
ecur
ity E
xp
(% o
f GD
P)19
96
Adu
lt Il
liter
acy,
1990
s
Life
Exp
ecta
ncy
1997
Gen
der I
nequ
ality
Inde
x 19
92
Gen
der
Enro
llmen
tR
atio
199
5
Chi
ld L
abou
r 199
5
Unf
reed
om o
fO
rgan
isat
ion
1985
Uni
on d
ensi
ty 1
995
(Lac
k of
) Civ
ilLi
berti
es In
dex
1997
Inst
itutio
nal Q
ualit
yIn
dex
1997
Info
rmat
ion
Qua
lity
Inde
x, 1
985
52 H Denmark 80.70 33.01 75.69 0.02 1.00 0.00 1.00 1.00 1.00 1.0053 M Djibouti 50.31 0.06 1.33 6.0054 M Dominica 4.82 75.95 1.0055 M Dominican Republic 3.20 2.49 17.40 70.95 0.16 0.96 16.06 1.00 17.30 3.00 3.00 2.0056 M Ecuador 45.19 20.20 2.00 9.90 70.25 0.18 1.00 5.43 1.00 9.80 4.00 4.00 2.0057 M Egypt, Arab Rep. 3.10 5.40 48.60 66.26 0.26 1.13 11.22 2.00 29.60 6.00 3.00 2.0058 M El Salvador 25.30 3.56 1.00 69.43 0.08 0.99 15.17 7.20 3.0059 M Equatorial Guinea 49.96 0.98 33.9060 L Eritrea 50.81 1.10 39.62 7.20 4.0061 M Estonia 4.90 17.11 1.00 70.08 0.03 1.00 0.00 26.40 2.00 2.0062 L Ethiopia 33.00 31.30 3.69 64.50 43.33 0.04 1.61 42.30 4.00 4.10 5.00 3.00 4.0063 H Faeroe Islands64 M Fiji 43.00 72.56 0.16 1.00 0.00 3.0065 H Finland 68.10 32.27 76.86 0.02 1.00 0.00 1.00 1.00 1.00 1.0066 H France 30.07 78.36 0.03 1.00 0.00 1.00 2.00 1.00 1.0067 H French Polynesia 71.89 1.0068 M Gabon 52.42 18.37 2.00 4.0069 L Gambia, The 67.25 53.16 0.07 1.26 36.99 6.0070 M Georgia 72.55 0.98 0.00 4.0071 H Germany 29.69 76.65 1.00 0.00 1.00 2.00 1.00 1.0072 L Ghana 79.00 78.50 60.01 0.05 13.27 3.00 4.00 3.00 3.0073 H Greece 22.67 77.73 0.09 1.00 0.00 1.00 24.30 3.00 2.00 2.0074 H Greenland75 M Grenada 71.77 0.19 2.0076 H Guam 77.1577 M Guatemala 64.23 0.19 1.10 16.22 2.00 4.00 4.00 2.0078 L Guinea 46.49 0.10 1.74 34.03 3.00 2.50 5.00 4.00 3.0079 L Guinea-Bissau 43.77 0.06 1.69 38.56 4.00 4.00 5.00 4.00

54O
bs
Cla
ss
Cou
ntry
Form
al e
mpl
oym
ent
as
a %
of
LF
1995
Urb
an In
form
al E
mp
(% o
f L
F 19
90s)
Wor
king
Poo
r Rat
e19
97
Soci
al S
ecur
ity E
xp
(% o
f GD
P)19
96
Adu
lt Il
liter
acy,
1990
s
Life
Exp
ecta
ncy
1997
Gen
der I
nequ
ality
Inde
x 19
92
Gen
der
Enro
llmen
tR
atio
199
5
Chi
ld L
abou
r 199
5
Unf
reed
om o
fO
rgan
isat
ion
1985
Uni
on d
ensi
ty 1
995
(Lac
k of
) Civ
ilLi
berti
es In
dex
1997
Inst
itutio
nal Q
ualit
yIn
dex
1997
Info
rmat
ion
Qua
lity
Inde
x, 1
985
80 M Guyana 5.79 64.42 0.06 0.99 0.00 2.0081 L Haiti 53.74 0.02 25.30 5.00
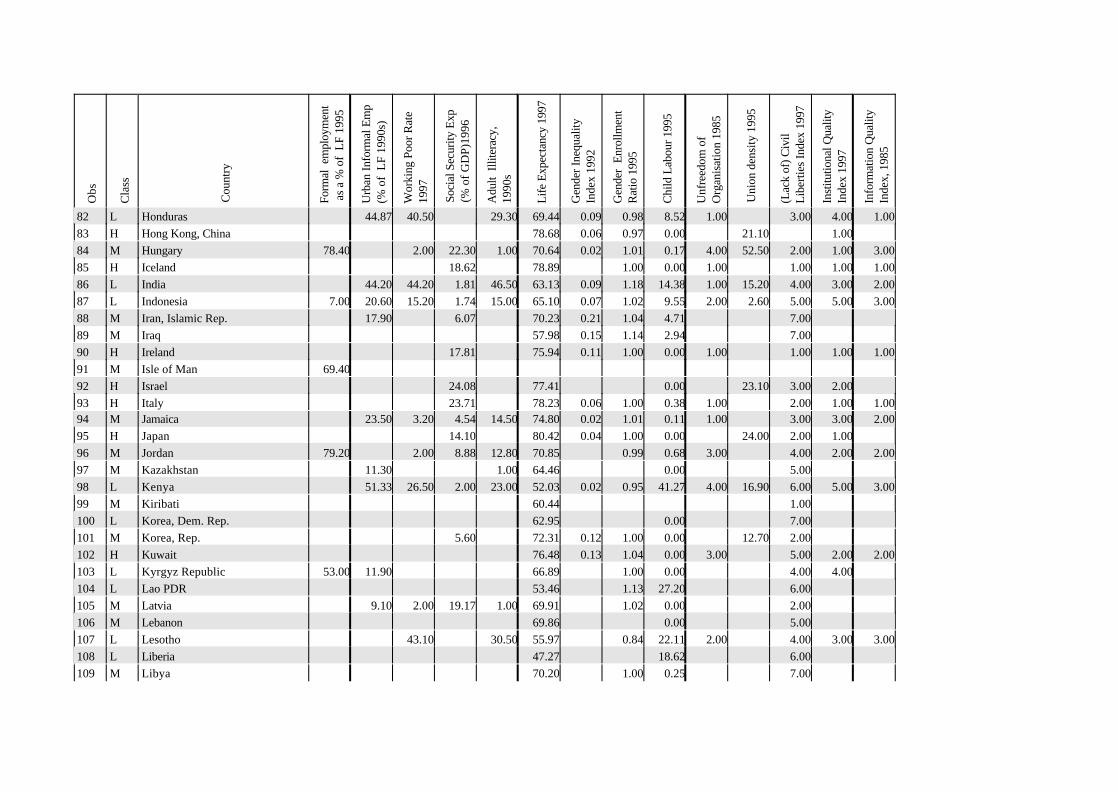
Obs
Cla
ss
Cou
ntry
Form
al e
mpl
oym
ent
as
a %
of
LF
1995
Urb
an In
form
al E
mp
(% o
f L
F 19
90s)
Wor
king
Poo
r Rat
e19
97
Soci
al S
ecur
ity E
xp
(% o
f GD
P)19
96
Adu
lt Il
liter
acy,
1990
s
Life
Exp
ecta
ncy
1997
Gen
der I
nequ
ality
Inde
x 19
92
Gen
der
Enro
llmen
tR
atio
199
5
Chi
ld L
abou
r 199
5
Unf
reed
om o
fO
rgan
isat
ion
1985
Uni
on d
ensi
ty 1
995
(Lac
k of
) Civ
ilLi
berti
es In
dex
1997
Inst
itutio
nal Q
ualit
yIn
dex
1997
Info
rmat
ion
Qua
lity
Inde
x, 1
985
82 L Honduras 44.87 40.50 29.30 69.44 0.09 0.98 8.52 1.00 3.00 4.00 1.0083 H Hong Kong, China 78.68 0.06 0.97 0.00 21.10 1.0084 M Hungary 78.40 2.00 22.30 1.00 70.64 0.02 1.01 0.17 4.00 52.50 2.00 1.00 3.0085 H Iceland 18.62 78.89 1.00 0.00 1.00 1.00 1.00 1.0086 L India 44.20 44.20 1.81 46.50 63.13 0.09 1.18 14.38 1.00 15.20 4.00 3.00 2.0087 L Indonesia 7.00 20.60 15.20 1.74 15.00 65.10 0.07 1.02 9.55 2.00 2.60 5.00 5.00 3.0088 M Iran, Islamic Rep. 17.90 6.07 70.23 0.21 1.04 4.71 7.0089 M Iraq 57.98 0.15 1.14 2.94 7.0090 H Ireland 17.81 75.94 0.11 1.00 0.00 1.00 1.00 1.00 1.0091 M Isle of Man 69.4092 H Israel 24.08 77.41 0.00 23.10 3.00 2.0093 H Italy 23.71 78.23 0.06 1.00 0.38 1.00 2.00 1.00 1.0094 M Jamaica 23.50 3.20 4.54 14.50 74.80 0.02 1.01 0.11 1.00 3.00 3.00 2.0095 H Japan 14.10 80.42 0.04 1.00 0.00 24.00 2.00 1.0096 M Jordan 79.20 2.00 8.88 12.80 70.85 0.99 0.68 3.00 4.00 2.00 2.0097 M Kazakhstan 11.30 1.00 64.46 0.00 5.0098 L Kenya 51.33 26.50 2.00 23.00 52.03 0.02 0.95 41.27 4.00 16.90 6.00 5.00 3.0099 M Kiribati 60.44 1.00100 L Korea, Dem. Rep. 62.95 0.00 7.00101 M Korea, Rep. 5.60 72.31 0.12 1.00 0.00 12.70 2.00102 H Kuwait 76.48 0.13 1.04 0.00 3.00 5.00 2.00 2.00103 L Kyrgyz Republic 53.00 11.90 66.89 1.00 0.00 4.00 4.00104 L Lao PDR 53.46 1.13 27.20 6.00105 M Latvia 9.10 2.00 19.17 1.00 69.91 1.02 0.00 2.00106 M Lebanon 69.86 0.00 5.00107 L Lesotho 43.10 30.50 55.97 0.84 22.11 2.00 4.00 3.00 3.00108 L Liberia 47.27 18.62 6.00109 M Libya 70.20 1.00 0.25 7.00

56O
bs
Cla
ss
Cou
ntry
Form
al e
mpl
oym
ent
as
a %
of
LF
1995
Urb
an In
form
al E
mp
(% o
f L
F 19
90s)
Wor
king
Poo
r Rat
e19
97
Soci
al S
ecur
ity E
xp
(% o
f GD
P)19
96
Adu
lt Il
liter
acy,
1990
s
Life
Exp
ecta
ncy
1997
Gen
der I
nequ
ality
Inde
x 19
92
Gen
der
Enro
llmen
tR
atio
199
5
Chi
ld L
abou
r 199
5
Unf
reed
om o
fO
rgan
isat
ion
1985
Uni
on d
ensi
ty 1
995
(Lac
k of
) Civ
ilLi
berti
es In
dex
1997
Inst
itutio
nal Q
ualit
yIn
dex
1997
Info
rmat
ion
Qua
lity
Inde
x, 1
985
110 H Liechtenstein 1.00 1.00 1.00111 M Lithuania 8.50 14.66 1.00 71.22 0.03 0.00 2.00
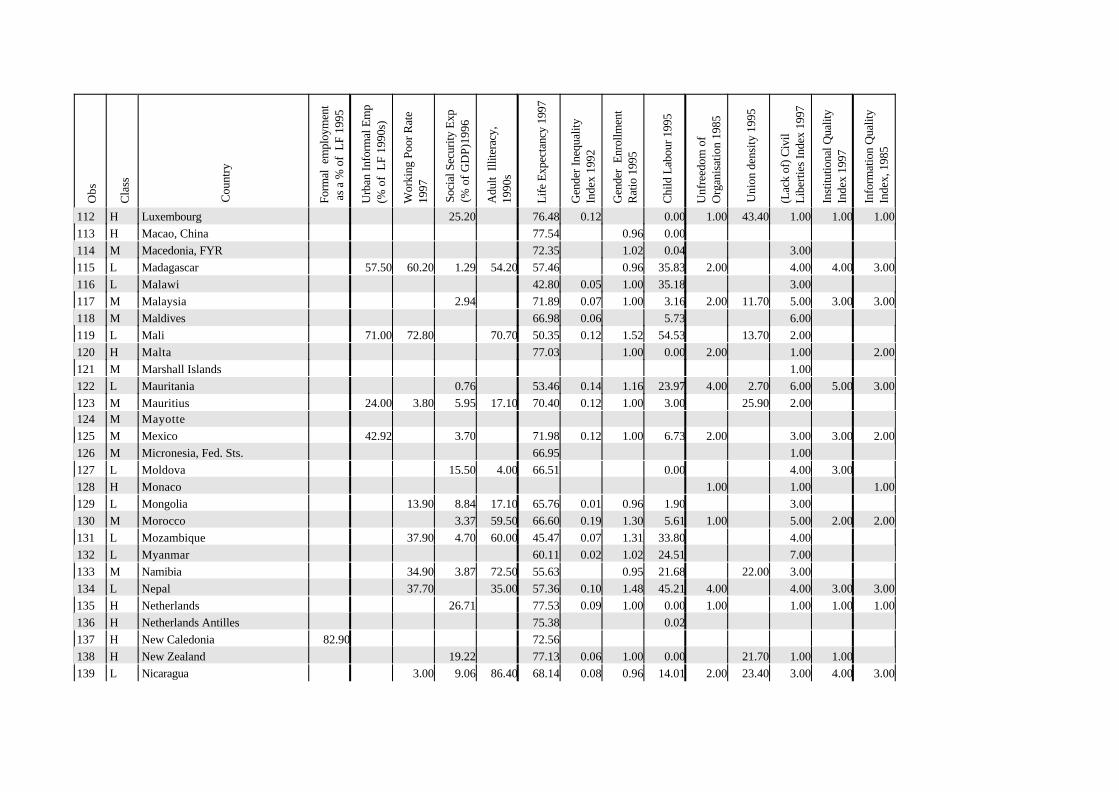
Obs
Cla
ss
Cou
ntry
Form
al e
mpl
oym
ent
as
a %
of
LF
1995
Urb
an In
form
al E
mp
(% o
f L
F 19
90s)
Wor
king
Poo
r Rat
e19
97
Soci
al S
ecur
ity E
xp
(% o
f GD
P)19
96
Adu
lt Il
liter
acy,
1990
s
Life
Exp
ecta
ncy
1997
Gen
der I
nequ
ality
Inde
x 19
92
Gen
der
Enro
llmen
tR
atio
199
5
Chi
ld L
abou
r 199
5
Unf
reed
om o
fO
rgan
isat
ion
1985
Uni
on d
ensi
ty 1
995
(Lac
k of
) Civ
ilLi
berti
es In
dex
1997
Inst
itutio
nal Q
ualit
yIn
dex
1997
Info
rmat
ion
Qua
lity
Inde
x, 1
985
112 H Luxembourg 25.20 76.48 0.12 0.00 1.00 43.40 1.00 1.00 1.00113 H Macao, China 77.54 0.96 0.00114 M Macedonia, FYR 72.35 1.02 0.04 3.00115 L Madagascar 57.50 60.20 1.29 54.20 57.46 0.96 35.83 2.00 4.00 4.00 3.00116 L Malawi 42.80 0.05 1.00 35.18 3.00117 M Malaysia 2.94 71.89 0.07 1.00 3.16 2.00 11.70 5.00 3.00 3.00118 M Maldives 66.98 0.06 5.73 6.00119 L Mali 71.00 72.80 70.70 50.35 0.12 1.52 54.53 13.70 2.00120 H Malta 77.03 1.00 0.00 2.00 1.00 2.00121 M Marshall Islands 1.00122 L Mauritania 0.76 53.46 0.14 1.16 23.97 4.00 2.70 6.00 5.00 3.00123 M Mauritius 24.00 3.80 5.95 17.10 70.40 0.12 1.00 3.00 25.90 2.00124 M Mayotte125 M Mexico 42.92 3.70 71.98 0.12 1.00 6.73 2.00 3.00 3.00 2.00126 M Micronesia, Fed. Sts. 66.95 1.00127 L Moldova 15.50 4.00 66.51 0.00 4.00 3.00128 H Monaco 1.00 1.00 1.00129 L Mongolia 13.90 8.84 17.10 65.76 0.01 0.96 1.90 3.00130 M Morocco 3.37 59.50 66.60 0.19 1.30 5.61 1.00 5.00 2.00 2.00131 L Mozambique 37.90 4.70 60.00 45.47 0.07 1.31 33.80 4.00132 L Myanmar 60.11 0.02 1.02 24.51 7.00133 M Namibia 34.90 3.87 72.50 55.63 0.95 21.68 22.00 3.00134 L Nepal 37.70 35.00 57.36 0.10 1.48 45.21 4.00 4.00 3.00 3.00135 H Netherlands 26.71 77.53 0.09 1.00 0.00 1.00 1.00 1.00 1.00136 H Netherlands Antilles 75.38 0.02137 H New Caledonia 82.90 72.56138 H New Zealand 19.22 77.13 0.06 1.00 0.00 21.70 1.00 1.00139 L Nicaragua 3.00 9.06 86.40 68.14 0.08 0.96 14.01 2.00 23.40 3.00 4.00 3.00
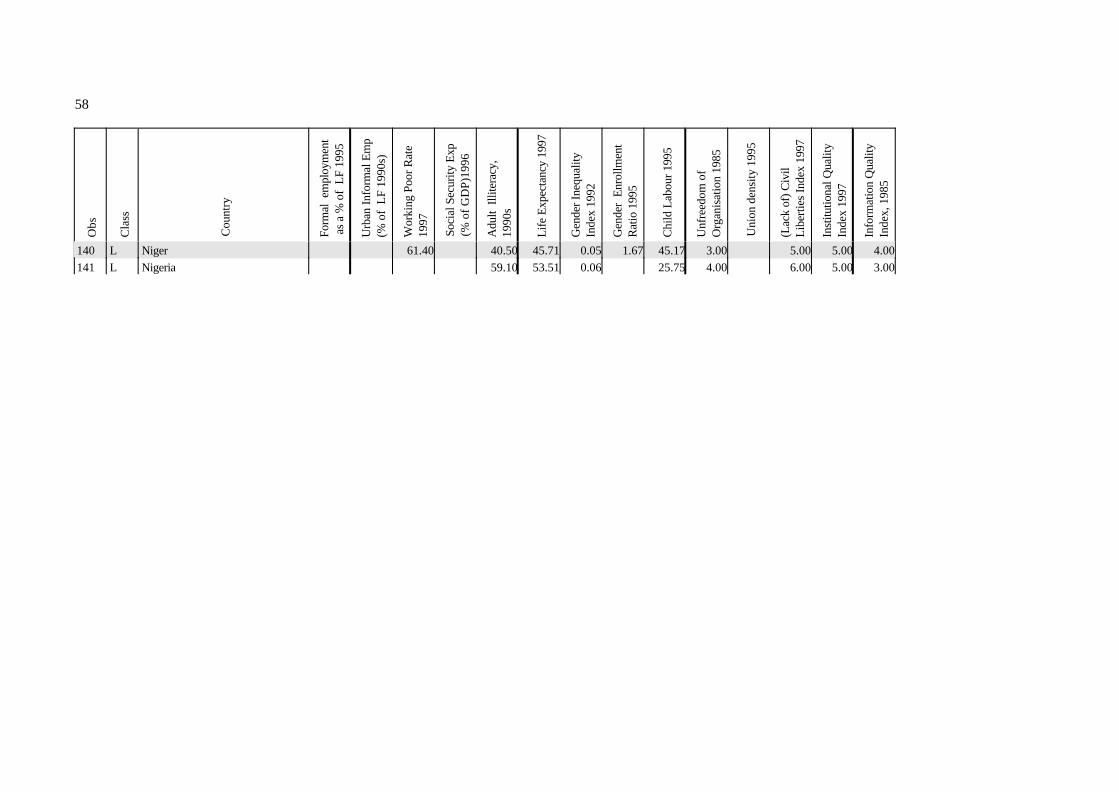
58O
bs
Cla
ss
Cou
ntry
Form
al e
mpl
oym
ent
as
a %
of
LF
1995
Urb
an In
form
al E
mp
(% o
f L
F 19
90s)
Wor
king
Poo
r Rat
e19
97
Soci
al S
ecur
ity E
xp
(% o
f GD
P)19
96
Adu
lt Il
liter
acy,
1990
s
Life
Exp
ecta
ncy
1997
Gen
der I
nequ
ality
Inde
x 19
92
Gen
der
Enro
llmen
tR
atio
199
5
Chi
ld L
abou
r 199
5
Unf
reed
om o
fO
rgan
isat
ion
1985
Uni
on d
ensi
ty 1
995
(Lac
k of
) Civ
ilLi
berti
es In
dex
1997
Inst
itutio
nal Q
ualit
yIn
dex
1997
Info
rmat
ion
Qua
lity
Inde
x, 1
985
140 L Niger 61.40 40.50 45.71 0.05 1.67 45.17 3.00 5.00 5.00 4.00141 L Nigeria 59.10 53.51 0.06 25.75 4.00 6.00 5.00 3.00
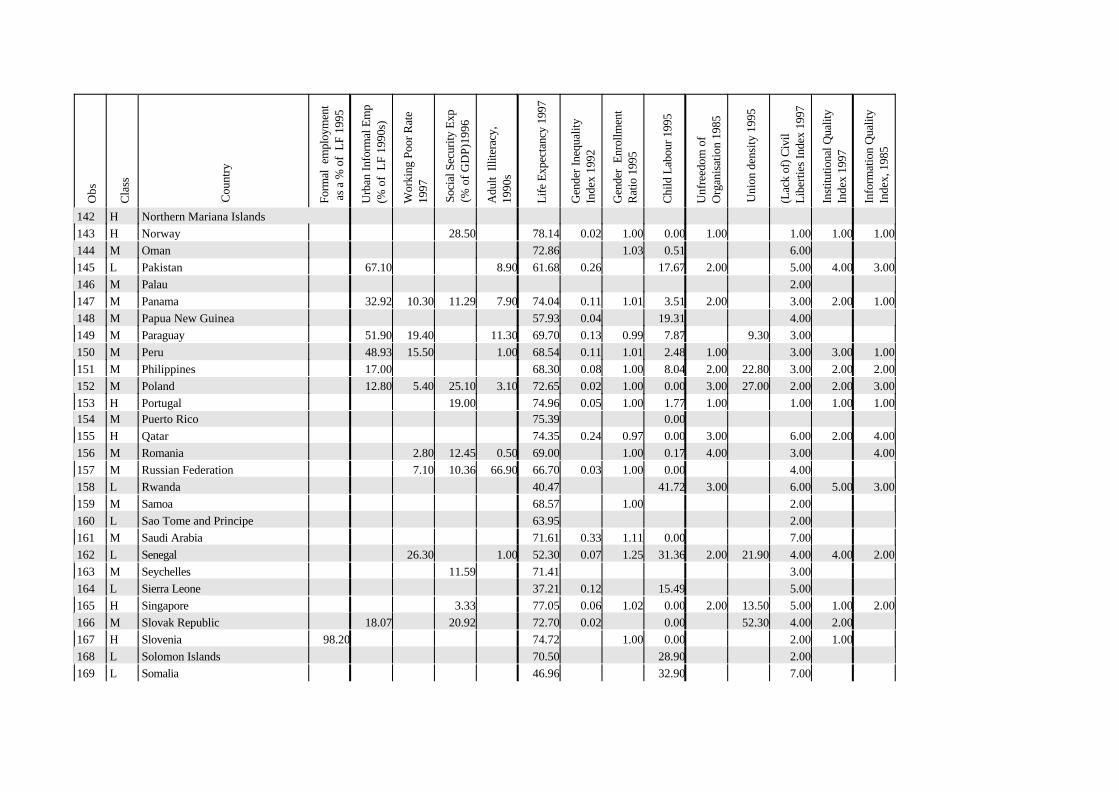
Obs
Cla
ss
Cou
ntry
Form
al e
mpl
oym
ent
as
a %
of
LF
1995
Urb
an In
form
al E
mp
(% o
f L
F 19
90s)
Wor
king
Poo
r Rat
e19
97
Soci
al S
ecur
ity E
xp
(% o
f GD
P)19
96
Adu
lt Il
liter
acy,
1990
s
Life
Exp
ecta
ncy
1997
Gen
der I
nequ
ality
Inde
x 19
92
Gen
der
Enro
llmen
tR
atio
199
5
Chi
ld L
abou
r 199
5
Unf
reed
om o
fO
rgan
isat
ion
1985
Uni
on d
ensi
ty 1
995
(Lac
k of
) Civ
ilLi
berti
es In
dex
1997
Inst
itutio
nal Q
ualit
yIn
dex
1997
Info
rmat
ion
Qua
lity
Inde
x, 1
985
142 H Northern Mariana Islands143 H Norway 28.50 78.14 0.02 1.00 0.00 1.00 1.00 1.00 1.00144 M Oman 72.86 1.03 0.51 6.00145 L Pakistan 67.10 8.90 61.68 0.26 17.67 2.00 5.00 4.00 3.00146 M Palau 2.00147 M Panama 32.92 10.30 11.29 7.90 74.04 0.11 1.01 3.51 2.00 3.00 2.00 1.00148 M Papua New Guinea 57.93 0.04 19.31 4.00149 M Paraguay 51.90 19.40 11.30 69.70 0.13 0.99 7.87 9.30 3.00150 M Peru 48.93 15.50 1.00 68.54 0.11 1.01 2.48 1.00 3.00 3.00 1.00151 M Philippines 17.00 68.30 0.08 1.00 8.04 2.00 22.80 3.00 2.00 2.00152 M Poland 12.80 5.40 25.10 3.10 72.65 0.02 1.00 0.00 3.00 27.00 2.00 2.00 3.00153 H Portugal 19.00 74.96 0.05 1.00 1.77 1.00 1.00 1.00 1.00154 M Puerto Rico 75.39 0.00155 H Qatar 74.35 0.24 0.97 0.00 3.00 6.00 2.00 4.00156 M Romania 2.80 12.45 0.50 69.00 1.00 0.17 4.00 3.00 4.00157 M Russian Federation 7.10 10.36 66.90 66.70 0.03 1.00 0.00 4.00158 L Rwanda 40.47 41.72 3.00 6.00 5.00 3.00159 M Samoa 68.57 1.00 2.00160 L Sao Tome and Principe 63.95 2.00161 M Saudi Arabia 71.61 0.33 1.11 0.00 7.00162 L Senegal 26.30 1.00 52.30 0.07 1.25 31.36 2.00 21.90 4.00 4.00 2.00163 M Seychelles 11.59 71.41 3.00164 L Sierra Leone 37.21 0.12 15.49 5.00165 H Singapore 3.33 77.05 0.06 1.02 0.00 2.00 13.50 5.00 1.00 2.00166 M Slovak Republic 18.07 20.92 72.70 0.02 0.00 52.30 4.00 2.00167 H Slovenia 98.20 74.72 1.00 0.00 2.00 1.00168 L Solomon Islands 70.50 28.90 2.00169 L Somalia 46.96 32.90 7.00
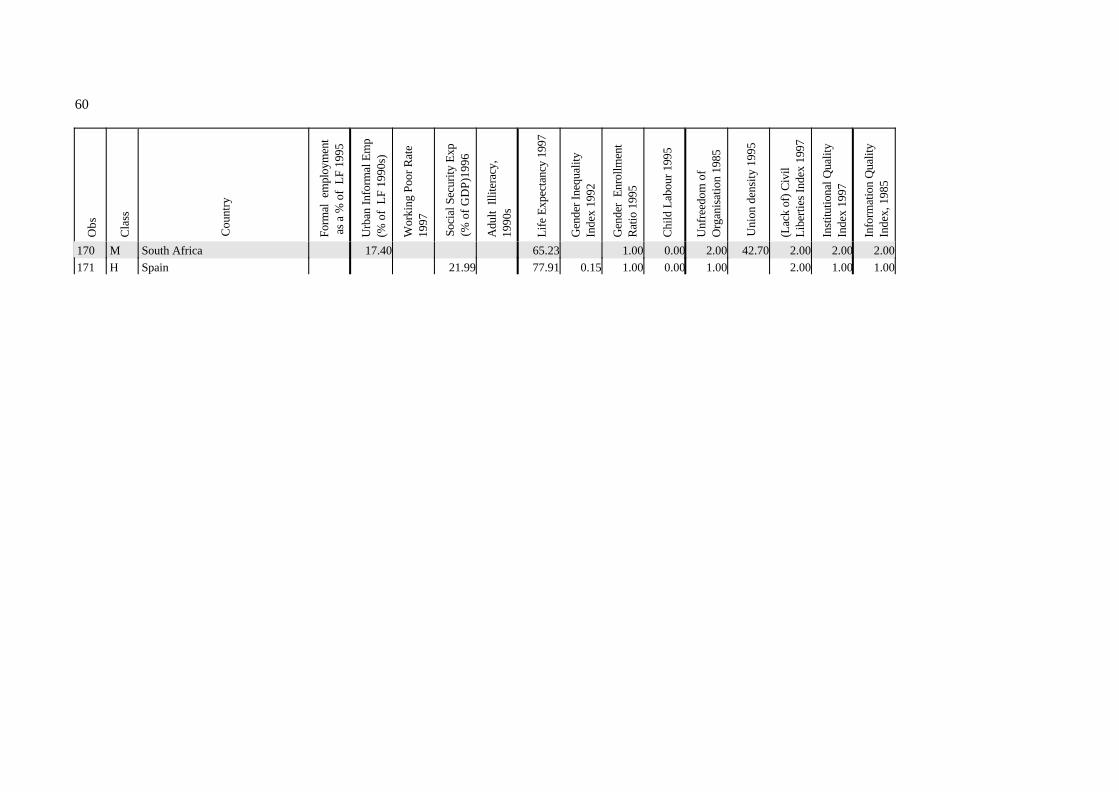
60O
bs
Cla
ss
Cou
ntry
Form
al e
mpl
oym
ent
as
a %
of
LF
1995
Urb
an In
form
al E
mp
(% o
f L
F 19
90s)
Wor
king
Poo
r Rat
e19
97
Soci
al S
ecur
ity E
xp
(% o
f GD
P)19
96
Adu
lt Il
liter
acy,
1990
s
Life
Exp
ecta
ncy
1997
Gen
der I
nequ
ality
Inde
x 19
92
Gen
der
Enro
llmen
tR
atio
199
5
Chi
ld L
abou
r 199
5
Unf
reed
om o
fO
rgan
isat
ion
1985
Uni
on d
ensi
ty 1
995
(Lac
k of
) Civ
ilLi
berti
es In
dex
1997
Inst
itutio
nal Q
ualit
yIn
dex
1997
Info
rmat
ion
Qua
lity
Inde
x, 1
985
170 M South Africa 17.40 65.23 1.00 0.00 2.00 42.70 2.00 2.00 2.00171 H Spain 21.99 77.91 0.15 1.00 0.00 1.00 2.00 1.00 1.00
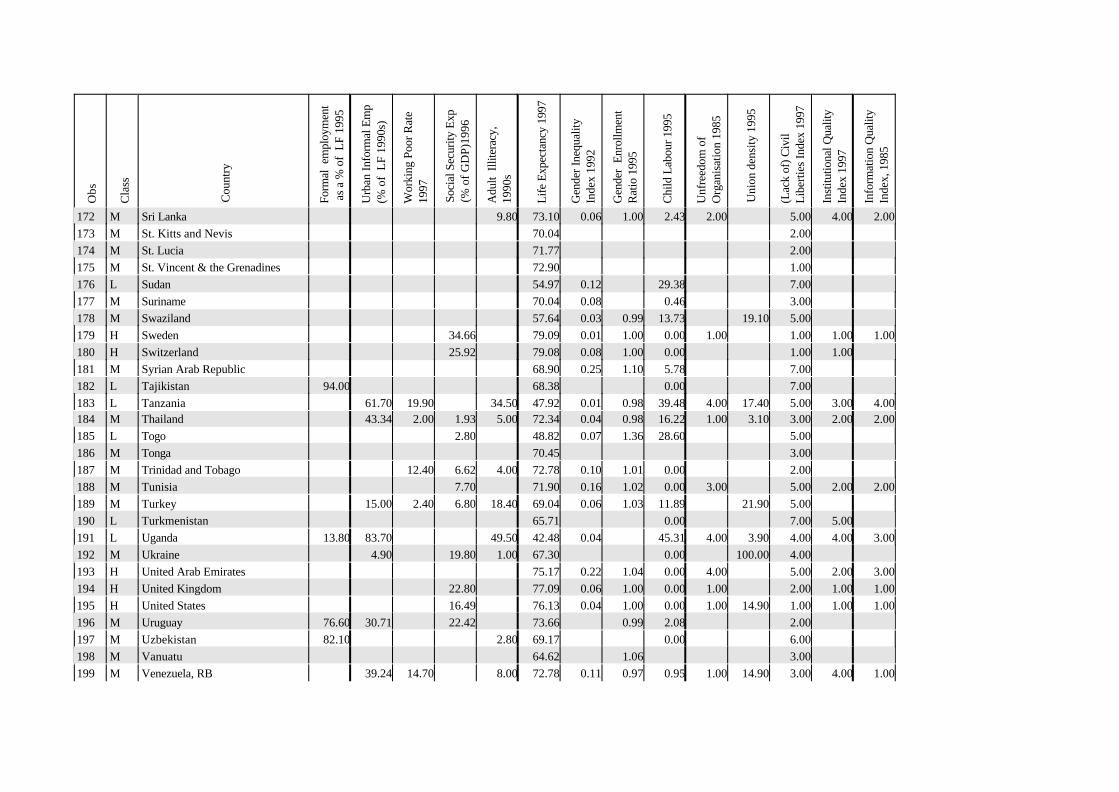
Obs
Cla
ss
Cou
ntry
Form
al e
mpl
oym
ent
as
a %
of
LF
1995
Urb
an In
form
al E
mp
(% o
f L
F 19
90s)
Wor
king
Poo
r Rat
e19
97
Soci
al S
ecur
ity E
xp
(% o
f GD
P)19
96
Adu
lt Il
liter
acy,
1990
s
Life
Exp
ecta
ncy
1997
Gen
der I
nequ
ality
Inde
x 19
92
Gen
der
Enro
llmen
tR
atio
199
5
Chi
ld L
abou
r 199
5
Unf
reed
om o
fO
rgan
isat
ion
1985
Uni
on d
ensi
ty 1
995
(Lac
k of
) Civ
ilLi
berti
es In
dex
1997
Inst
itutio
nal Q
ualit
yIn
dex
1997
Info
rmat
ion
Qua
lity
Inde
x, 1
985
172 M Sri Lanka 9.80 73.10 0.06 1.00 2.43 2.00 5.00 4.00 2.00173 M St. Kitts and Nevis 70.04 2.00174 M St. Lucia 71.77 2.00175 M St. Vincent & the Grenadines 72.90 1.00176 L Sudan 54.97 0.12 29.38 7.00177 M Suriname 70.04 0.08 0.46 3.00178 M Swaziland 57.64 0.03 0.99 13.73 19.10 5.00179 H Sweden 34.66 79.09 0.01 1.00 0.00 1.00 1.00 1.00 1.00180 H Switzerland 25.92 79.08 0.08 1.00 0.00 1.00 1.00181 M Syrian Arab Republic 68.90 0.25 1.10 5.78 7.00182 L Tajikistan 94.00 68.38 0.00 7.00183 L Tanzania 61.70 19.90 34.50 47.92 0.01 0.98 39.48 4.00 17.40 5.00 3.00 4.00184 M Thailand 43.34 2.00 1.93 5.00 72.34 0.04 0.98 16.22 1.00 3.10 3.00 2.00 2.00185 L Togo 2.80 48.82 0.07 1.36 28.60 5.00186 M Tonga 70.45 3.00187 M Trinidad and Tobago 12.40 6.62 4.00 72.78 0.10 1.01 0.00 2.00188 M Tunisia 7.70 71.90 0.16 1.02 0.00 3.00 5.00 2.00 2.00189 M Turkey 15.00 2.40 6.80 18.40 69.04 0.06 1.03 11.89 21.90 5.00190 L Turkmenistan 65.71 0.00 7.00 5.00191 L Uganda 13.80 83.70 49.50 42.48 0.04 45.31 4.00 3.90 4.00 4.00 3.00192 M Ukraine 4.90 19.80 1.00 67.30 0.00 100.00 4.00193 H United Arab Emirates 75.17 0.22 1.04 0.00 4.00 5.00 2.00 3.00194 H United Kingdom 22.80 77.09 0.06 1.00 0.00 1.00 2.00 1.00 1.00195 H United States 16.49 76.13 0.04 1.00 0.00 1.00 14.90 1.00 1.00 1.00196 M Uruguay 76.60 30.71 22.42 73.66 0.99 2.08 2.00197 M Uzbekistan 82.10 2.80 69.17 0.00 6.00198 M Vanuatu 64.62 1.06 3.00199 M Venezuela, RB 39.24 14.70 8.00 72.78 0.11 0.97 0.95 1.00 14.90 3.00 4.00 1.00
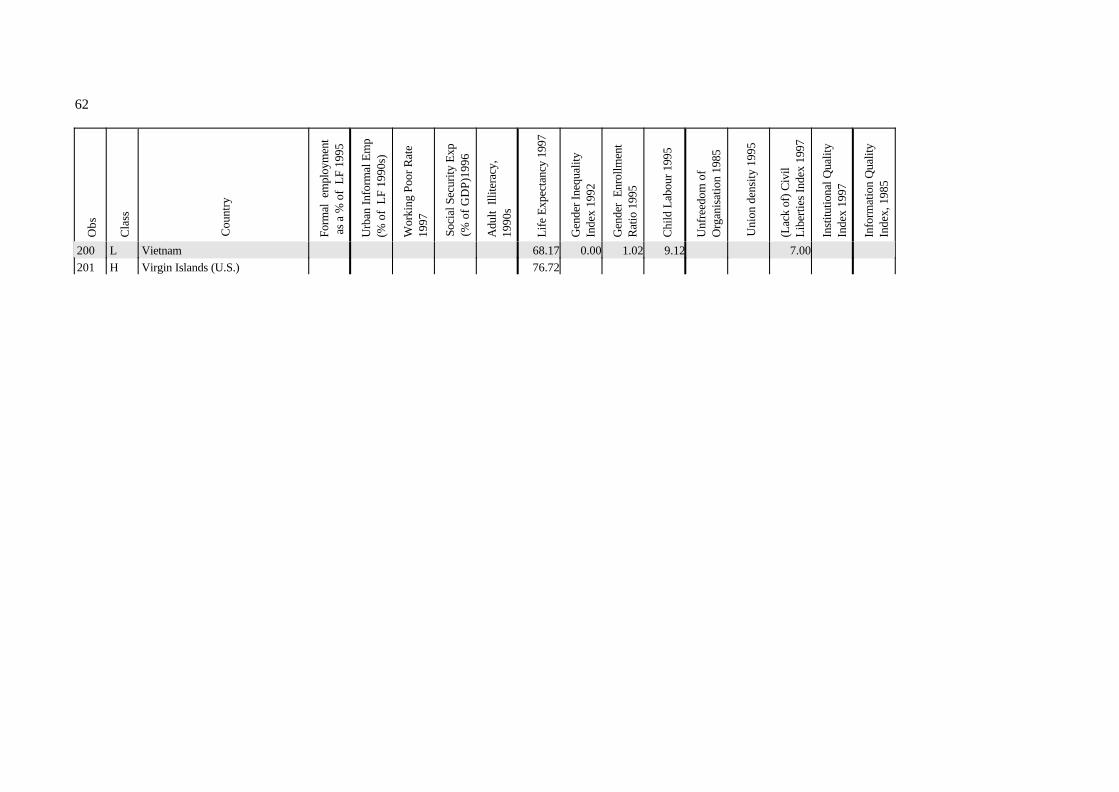
62O
bs
Cla
ss
Cou
ntry
Form
al e
mpl
oym
ent
as
a %
of
LF
1995
Urb
an In
form
al E
mp
(% o
f L
F 19
90s)
Wor
king
Poo
r Rat
e19
97
Soci
al S
ecur
ity E
xp
(% o
f GD
P)19
96
Adu
lt Il
liter
acy,
1990
s
Life
Exp
ecta
ncy
1997
Gen
der I
nequ
ality
Inde
x 19
92
Gen
der
Enro
llmen
tR
atio
199
5
Chi
ld L
abou
r 199
5
Unf
reed
om o
fO
rgan
isat
ion
1985
Uni
on d
ensi
ty 1
995
(Lac
k of
) Civ
ilLi
berti
es In
dex
1997
Inst
itutio
nal Q
ualit
yIn
dex
1997
Info
rmat
ion
Qua
lity
Inde
x, 1
985
200 L Vietnam 68.17 0.00 1.02 9.12 7.00201 H Virgin Islands (U.S.) 76.72
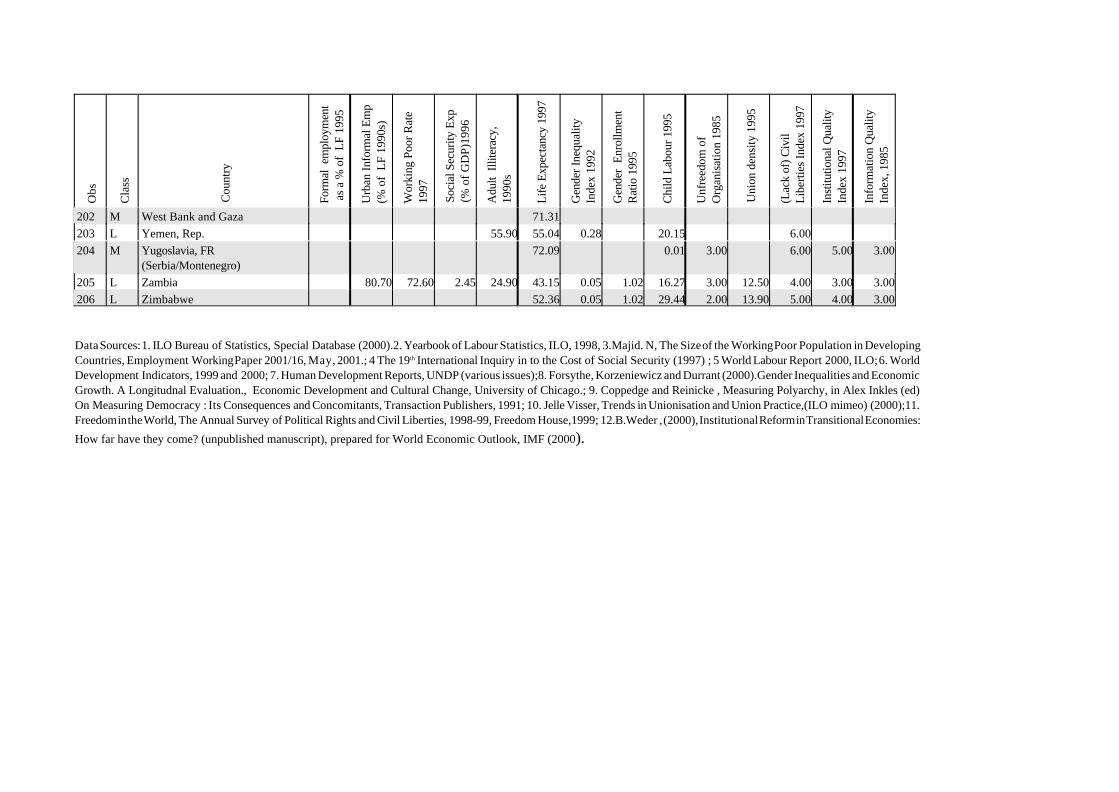
Obs
Cla
ss
Cou
ntry
Form
al e
mpl
oym
ent
as
a %
of
LF
1995
Urb
an In
form
al E
mp
(% o
f L
F 19
90s)
Wor
king
Poo
r Rat
e19
97
Soci
al S
ecur
ity E
xp
(% o
f GD
P)19
96
Adu
lt Il
liter
acy,
1990
s
Life
Exp
ecta
ncy
1997
Gen
der I
nequ
ality
Inde
x 19
92
Gen
der
Enro
llmen
tR
atio
199
5
Chi
ld L
abou
r 199
5
Unf
reed
om o
fO
rgan
isat
ion
1985
Uni
on d
ensi
ty 1
995
(Lac
k of
) Civ
ilLi
berti
es In
dex
1997
Inst
itutio
nal Q
ualit
yIn
dex
1997
Info
rmat
ion
Qua
lity
Inde
x, 1
985
202 M West Bank and Gaza 71.31203 L Yemen, Rep. 55.90 55.04 0.28 20.15 6.00204 M Yugoslavia, FR
(Serbia/Montenegro)72.09 0.01 3.00 6.00 5.00 3.00
205 L Zambia 80.70 72.60 2.45 24.90 43.15 0.05 1.02 16.27 3.00 12.50 4.00 3.00 3.00206 L Zimbabwe 52.36 0.05 1.02 29.44 2.00 13.90 5.00 4.00 3.00
Data Sources: 1. ILO Bureau of Statistics, Special Database (2000).2. Yearbook of Labour Statistics, ILO, 1998, 3.Majid. N, The Size of the Working Poor Population in DevelopingCountries, Employment Working Paper 2001/16, May, 2001.; 4 The 19th International Inquiry in to the Cost of Social Security (1997) ; 5 World Labour Report 2000, ILO; 6. WorldDevelopment Indicators, 1999 and 2000; 7. Human Development Reports, UNDP (various issues);8. Forsythe, Korzeniewicz and Durrant (2000).Gender Inequalities and EconomicGrowth. A Longitudnal Evaluation., Economic Development and Cultural Change, University of Chicago.; 9. Coppedge and Reinicke , Measuring Polyarchy, in Alex Inkles (ed)On Measuring Democracy : Its Consequences and Concomitants, Transaction Publishers, 1991; 10. Jelle Visser, Trends in Unionisation and Union Practice,(ILO mimeo) (2000);11.Freedom in the World, The Annual Survey of Political Rights and Civil Liberties, 1998-99, Freedom House,1999; 12.B.Weder , (2000), Institutional Reform in Transitional Economies:
How far have they come? (unpublished manuscript), prepared for World Economic Outlook, IMF (2000).
64
Selected bibliography
Anand, S. and Ravallion, M. (1993): “Human Development in Poor Countries: On the Role of Private Incomes and PublicServices”, Journal of Economic Perspectives, Vol. 7, Nashville, Tennessee.
Anderson, E and H. White (2000): Growth versus Distribution : Does the Pattern of Growth Matter (mimeo); Instituteof Development Studies, Sussex.
Anker, R. (1999): A Conceptual and Research Framework for the Economics of Child Labour and its Elimination(mimeo), ILO, Geneva.
Baland, J.M. and J.A. Robinson (2001): Is child labour inefficient? (mimeo); Network on the Effects of Inequality onEconomic Performance, Institute of International Studies; University of California, Berkeley.
Basu, K. (1984): The Less Developed Economy, Blackwell Publishers, Oxford.
Basu, K. and Van, P. (1998): “The Economics of Child Labour”, American Economic Review, Vol.88, Menasha,Wisconsin.
Bardhan, P. (2000): “Democracy and Development : A Complex Relationship”, in I. Shapiro and C.Hacker-Cordon (eds.),Democracy's Value, Cambridge University Press.
Bardhan, P. and Samuel Bowles (1998): The Effects of Inequality on Economic Performance: A Progress Report andProposal,1998 , Network on the Effects of Inequality on Economic Performance, Institute of International Studies,University of California, Berkeley.
Bardhan, P. (2000): “Wealth Inequality, Wealth Constraints, and Economic Performance” (with Sam Bowles and HerbGintis), in A. Atkinson and F. Bourguignon (eds.), Handbook of Income Distribution, North Holland, Amsterdam.
Bolen and Paxton (2000): “Subjective Measures of Liberal Democracy”, Comparative Political Studies, Vol. 33, No. 1,February 2000, Beverly Hills.
Chong, A and C. Calderon (2000): Institutional Quality and Income Distribution, Economic Development and CulturalChange, University of Chicago Press.
Cohen, Gerry (2000): If You’re an Egalitarian, How Come You’re So Rich?, Harvard University Press, Cambridge, MA.
Inkles, Alex (ed.) (1991): On Measuring Democracy: Its Consequences and Concomitants, Transaction Publishers,Pascataway, NJ.
Dollar, David and Art Kraay (2000): Growth is Good for the Poor (mimeo), World Bank, Washington DC.
Drèze, J. and A. Sen, (1989): Hunger and Public Action, Clarendon Press, Oxford.
Emmerij, L., R.. Jolly and T.Weiss, 2001, Ahead of the Curve: UN ideas and Global Challenges Indiana University Press.2001
Forsythe, N., Korzeniewicz, R. P. and Durrant, V. (2000): “Gender Inequalities and Economic Growth: A LongitudinalEvaluation” in Economic Development and Cultural Change, University of Chicago.
Freedom House (2000): Freedom in the World, The Annual Survey of Political Rights and Civil Liberties, 1998-99,Washington DC.
65
Ghose, A.K. (1999): Current Issues of Employment Policy in India, Economic and Political Weekly , September, 4 -10, 1999
Grootaert, C. (1998): “Child labour in Cote d’Ivoire: Incidence and Determinants”, in C. Grootaert and H. Patrinos (eds.)The Policy Analysis of Child Labour: A Comparative Study, The World Bank., Washington DC.
Helliwell, J. (1994): “Empirical Linkages between Democracy and Economic Growth”, British Journal of Political Science,No.24, Cambridge.
Hill, A. and King, E. (1995): Women’s education in developing countries, Johns Hopkins Press, Baltimore, MD.
Hoff, K. and Stiglitz, J.(1993): “Imperfect Information and Rural Credit Markets”, in K. Hoff, A. Braverman and J. Stiglitz(eds.), The Economics of Rural Organisation, World Bank, Oxford.
Hughes, B. (2001): “Global Social Transformation : The Sweet Spot, The Steady Slog and the Systemic Shift”, EconomicDevelopment and Cultural Change, Vol 49. No.2, Chicago.
International Labour Organisation (Bureau of Statistics): Special Database (2000), Geneva.
International Labour Organisation: World Labour Report 2000, Geneva.
International Labour Organisation (1999): Decent Work, International Labour conference 87th Session, 1999, Geneva.
International Labour Organisation (1999): Key Indicators of the Labour Market, 1999, Geneva.
International Labour Organisation (1998): Yearbook of Labour Statistics, 1998, Geneva.
International Labour Organisation (1997): The 19th International Inquiry into the Cost of Social Security (1997),Geneva.
International Labour Organisation (1996): Economically Active Populations: Estimates and projections 1950-2010,
Geneva.
International Monetary Fund (2000): World Economic Outlook, Washington DC.
Kanbur, R. and Lustig, N. (1999): Why is Inequality Back on the Agenda?, paper prepared for the Annual BankConference on Development Economics, World Bank, Washington DC, April 28-30, 1999.
Kanbur, R. (2000): “Income distribution and development”, in Handbook of Income Distribution, Vol. 1, North Holland.
Klasen, S. (1994): “Missing Women Reconsidered”, World Development No. 22, Oxford.
Klasen, S. (2000): Does Gender Inequality Reduce Growth and Development? Working paper #7. Development ResearchGroup, Poverty Reduction and Economic Management Network, The World Bank, Washington DC.
Kucera, D. (2000), Decent Work and Rights at Work: New Measures of Freedom of Association and CollectiveBargaining (ILO Geneva, mimeo)
Litchfield, J. and M. Lipton, (2001): Successes in Anti-Poverty: National Level Poverty Performance (ILO Geneva,mimeo).
Majid. N., (2001): The Size of the Working Poor Population in Developing Countries , Employment Paper 2001/16,International Labour Office, Geneva.
Nozick, R. (1974): Anarchy, State, and Utopia, Basic Books, New York.
66
Ravallion, M. (2001): Growth Inequality and Poverty: Looking beyond averages (mimeo), WIDER DevelopmentConference, WIDER, Helsinki.
Rawls, J. (1971): A Theory of Justice, Oxford University Press.
Rodrik, D. (1998): Democracy and Economic Performance (1997), mimeo for Conference on Democratisation andEconomic reform in South Africa, Cape Town, 1998.
Rodgers, Gerry (2000): Decent work as a development objective, Lecture to the 42nd Annual Meeting of the IndianSociety of Labour Economics, Madhya Pradesh, India.
Sah, R.K., (1991): “Feasibility, Human Organisations and Political Systems”, Journal of Economic Perspectives, Vol. 5/2,1991, Nashville, Tennessee.
Sen, A. (2000): “Work and Rights”, International Labour Review, 2000, Vol 139, No. 2, Geneva.
Sen, A. (1999): Development as Freedom, Knopf, New York.
Sen, A. (1997): On Economic Inequality, expanded edition, Oxford, Clarendon.
Sen, A. (1995): “The Concept of Development”, in Handbook of Development Economics , Vol.1, North Holland.
Sen, A.(1992): Inequality Re-examined, Oxford University Press.
Sen, A. (1989): “Women’s Survival as a Development Problem”, Bulletin of American Academy of Arts and Sciences.
Sen, A. (1987): Commodities and Capabilities, Oxford University Press.
Sen, A. (1981): “Rights and Agency”, Philosophy and Public Affairs, Vol 11 no 1.1981, Princeton.
Shapiro, I. and C. Hacker-Cordon (eds.) (2000): Democracy's Value, Cambridge University Press.
Stiglitz, J. (2000): Democratic Development as the Fruits of Labour, Keynote address, IRRA, Boston, 2000.
Stiglitz, J. (1998): Towards a New Paradigm for Development: Strategies, Policies and Processes, Raul Prebisch Lecture,UNCTAD, Geneva, 1998.
Summers, L. (1994): Investing in All People, The World Bank, Washington DC.
United Nations Development Programme: Human Development Reports (various years), New York, NY.
Visser, J. (2000): Trends in Unionisation and Union Practice (ILO Geneva, mimeo).
Weder, B. (2000): Institutional Reform in Transitional Economies: How far have they come? (unpublished manuscript),prepared for World Economic Outlook (2000), International Monetary Fund, Washington.
World Bank, World Development Indicators, 1999 and 2000, Washington DC.


