Download - Eastern Region Team Emami
Student Research This report is published for educational purposes only by
students competing in the CFA Institute Research
Challenge.
Important disclosures appear at the back of this report
Indian FMCG Industry
Ticker: ●HMN.IN Recommendation: ●BUY
Price: ● INR 413 Price Target: ●INR 515
N
i
c
Niche portfolio ensures a high growth trajectory
Ayurvedic and traditional portfolio with a strong brand loyalty and mass appeal: Emami is a
leading Indian FMCG company with a niche portfolio of herbal and traditional formulations.Key brands of Emami like Navratna Cooling Oil and Boroplus Antispectic Cream are identified as category leaders.Aurvedic nature of the products ensures higher gross margins(~60%) compared to peers.High advertising & promotional spending and endorsements by leading celebrities ensures
high brand loyalty.
Zandu acquisition strengthens market leadership: The acquition of Zandu by Emami in 2008 and the subsequent merger will lead to increased market share, higher revenues and enhanced
profitability.The product offering of Emami was richly complemented by Zandu portfolio of ayurvedic products like Zandu Balm, Zandu Kesari Jivan and Zandu Chyawanprash.Following the acquisition of Zandu, the revenues of Emami strengthend from INR 580 crores in FY 08 to INR 1038 crores in FY 10.The consolidated distribution network resulted in an increased domestic and global footprint.
Sustained revenue growth from key categories;Increasing contribution from exports and new
product launches: Net sales of Emami grew at a CAGR of 25.1% to increase from INR 521.68 crores in FY07 to INR 1277.78 crores in FY11.The company management expects revenues to grow at a CAGR 20-22% over the next 5-6 years. International markets b ring in 14% of the revenues and the company has its presence in 75 countries. Most of Emami‘s products find
consumer relevance even in the overseas markets like Middle East, Africa and SAARC, we expect increased revenue contribution from exports. The company continues to launch 2-3 new products/brand extensions every year in low-competition segments to drive revenues and profitability.
We initiate coverage of Emami with a BUY recommendation and a price target of INR 515:
We derive our price target from a combination of DCF-based and multiples methodology ,assuming a WACC of 12.1%.Our price target implies an upside of 24.62% and 22.2 x FY12E PE.
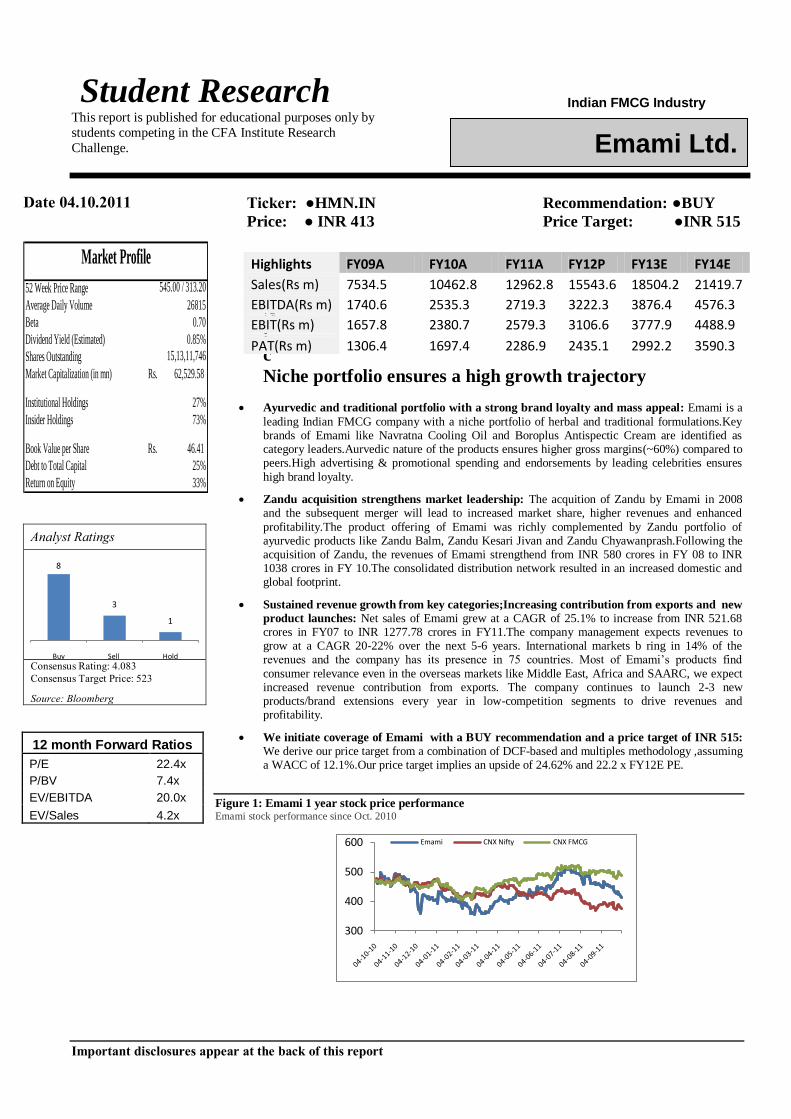
Figure 1: Emami 1 year stock price performance Emami stock performance since Oct. 2010
Highlights FY09A FY10A FY11A FY12P FY13E FY14E
Sales(Rs m) 7534.5 10462.8 12962.8 15543.6 18504.2 21419.7
EBITDA(Rs m) 1740.6 2535.3 2719.3 3222.3 3876.4 4576.3
EBIT(Rs m) 1657.8 2380.7 2579.3 3106.6 3777.9 4488.9
PAT(Rs m) 1306.4 1697.4 2286.9 2435.1 2992.2 3590.3
Emami Ltd.
Date 04.10.2011
52 Week Price Range 545.00 / 313.20
Average Daily Volume 26815
Beta 0.70
Dividend Yield (Estimated) 0.85%
Shares Outstanding 15,13,11,746
Market Capitalization (in mn) 62,529.58Rs.
Institutional Holdings 27%
Insider Holdings 73%
Book Value per Share 46.41Rs.
Debt to Total Capital 25%
Return on Equity 33%
Market Profile
Analyst Ratings
Consensus Rating: 4.083
Consensus Target Price: 523
Source: Bloomberg
12 month Forward Ratios
P/E 22.4x
P/BV 7.4x
EV/EBITDA 20.0x
EV/Sales 4.2x
8
3
1
Buy Sell Hold
300
400
500
600 Emami CNX Nifty CNX FMCG

CFA Institute Research Challenge 04.10.2011
2
Business Description
Emami Limited is the flagship company of Emami Group established by Mr. R.S. Agarwal and R.S. Goenka. The company had grown from humble beginnings to become one of the leading FMCG firms in India. It
operates mainly in the HPC-Health and Personal Care segment, manufacturing ayurvedic formulations using modern-day technologies. Emami has a product portfolio of more than 300 products across diverse categories like Hair Care, Skin Care, Rubificient and Health Supplements. Navratna Cooling Oil, Boroplus Antiseptic Cream and Emami-Fair & Handsome Cream are respective category leaders with a market share of more than 50%. With the strategic acquisition of Zandu in 2008, Emami added another category leader-Zandu Balm (Rubificient) and other products like Zandu Chyawanprash to its portfolio. The company continues to launch 2-3 innovative products every year. New
products like Vasocare (Petroleum Jelly) and brand extensions Navratna Extra Thanda Oil contribute to more than 10% of the top line. Net sales of Emami grew at a CAGR of 25.1% to increase from INR 521.68 crores in FY07 to INR 1277.78 crores in FY11.The company management expects revenues to grow at a CAGR 20-22% over the next 5-6 years. .
Management Strategy:
Brand loyalty due to significant A&P spending creates entry barriers: Emami is one of the first companies in India to effectively use celebrity endorsements as a key branding strategy. From Rajesh Khanna in the old days to the current superstar Shahrukh Khan, Emami has engaged many celebrities to endorse its products. Recent strategy to use regional-level marketing by engaging local celebrities has increased the mass market appeal and brand loyalty, creating an entry barrier for new competition. Though, A&P spending of Emami (18% of net sales) is above the industry average, spending on branding as a % of revenues has been falling over the years and is justified by increasing revenue growth.
Launch new products and brand extensions to drive revenues: The company plans to focus on product innovation in the areas of ayurvedic treatments, skin and hair care. It also plans to enter the under-penetrated ―Face Wash‖ and ―Hair Color‖ categories.Flagship brands-Navratna and Boroplus are very popular with the cusromers and have mass appeal.Emami has leveraged irs brand value by launching succesful extensions of these brands.A complelling example of the same would be Navratna Cool Talc which has grown over 100% in the last 2 years.
Significant inorganic growth possible due to potential strategic acquisition:
Emami has established a good track record at post-acquisition restructuring and integration with the merger of Zandu. The company maintains that it is on a look-out for an acquisition in the domestic health and personal care segment. Another strategic acquisition like Zandu could contribute to earnings growth through significant synergies.
Effective tax breaks, reducing the overall cost structure: More than 80% of the company‘s production now comes from tax-exempt zones. Two further units enjoying
fiscal benefits have started production, one at Guwahati and another at Pantnagar.The quantum of revenues
derived from tax-friendly zones increased from 48.4% in 2008-09 to 56.1% in 2009-10.Also, the goodwill amortization from Zandu acquisition helps reduce the overall average tax rate to ~15%.
Strategic distribution network: The Hub & Spoke distribution model adopted by the company enables it to react quickly to any sudden changes in demand due to seasonal nature of its products. It widened its direct reach channel to 4.5 lac retail outlets, up from 4 lac outlets in FY07.The number of distributors has increased by 35% from FY07 to FY11. The channel network of Emami currently includes a strong force of 3500 distributors and 2500 sub-distributors.
Revenue growth
Source:Company Data
Shareholding pattern
Source:Company Data
Emami spends more on A&P
Source:Company Data
0%
5%
10%
15%
20%
25%
30%
35%
40%
0
350
700
1050
1400
Sales y-o-y growth
Corporates FIIMF IndividualsOthers Promoter
0%
5%
10%
15%
20%
Emami GCPL Marico Dabur
A&P Spending( as a % of net sales)

CFA Institute Research Challenge 04.10.2011
3
Industry Overview and Competitive Positioning
The consumer industry in India in 2010 had a size of approximately US$ 30bn. This is expected to grow at 12% CAGR to reach a size of approximately US$ 74 bn by 2018. Consumer sector is generally categorized in the following categories:
- Food and Beverages
This includes beverages, staples/cereals, bakery and dairy, snack food, processed fruits, vegetables, bottled water and other packaged food products
- Health and Personal Care (HPC) including OTC products This includes toiletries, personal care items including soaps, shampoos, hair oils, skin creams and household care items including detergents and washing soaps.Also included are non-prescription healthcare products including balms, anti-septic creams and other medicines.
Emami operates in the Health and Personal care ( HPC ) segment focusing maimly on ayurvedic and traditional formulations.HPC segment accounts currently accounts for 45% of the sonsumer market in India.
Key Catalysts for the Industry
Large domestic market: With a billion plus population, India constitutes one the largest consumer markets in the world. There are approximately 11,000 consumer companies—multinational and local—that supply to this market.With 50 million middle class households and more households joining in from the low-income
segment, the tremendous growth story of Indian FMCG is bound to sustain over the coming years.
Rising per capita income: Indian economy is forecasted to grow at an average rate of ~7% for the next 10-15 years.With suatained GDP growth and stabilizing rate of population growth, Mackinsey & Co. has forecasted per capita income to grow at a ~14% CAGR in FY10-13 and at a CAGR of ~5% for FY10-25.The above growth of per capita income results in a rapid increase in purchasing power which fuels domestic consumption.
Increasing % of consumption in disposable income: India‘s GDP unlike that of other emerging developing countries has a bigger consumer spending percentage than investment.Consumption as a % of disposable Income (per capita) is on an upward trend.Mckinsey studies estimate consumption to grow an a CAGR of
7.3% vis-à-vis an 5.3% CAGR in income ffrom 2005 to 2025. As consumption increases FMCG
companies in India will reap rewards in terms of improved performance. Shift of sepending towards consumer discretionary(HPC) segments: With changes in lifestyles and higher aspirations of the young and upwardly mobile segment, we can observe a shift as shift in spending from necessary spending like Food & Beverage to Discreationary spending like Personal Care.The proportion of HPC segment to the Consumer Staples industry has increased from 34% in FY 08 to 45% in FY10 (Source: AC Neilsen)
Potential for increased penetration from rural markets: Per capita consumption of most home and personal care products in India is very less even when compared to similar countries in East and S.E. Asia.For instance, the per capita consumption of Skin Care products is at USD 0.3 compared to USD 3.2 in China.Hence, there lies a signification growth potential for HPC segment in India. Rural India contributes around 30% to total consumption in India.Also, the penetration of most Health and Personal Care products is low in rural areas compared to urban segment.The low contribution of rural segment (almost 70% of population) is indicative of tremendous growth potential. The demand is increasing
by 18% in the rural areas compared to 11% growth in urban demand (data from CIS, India).
Competitive positioning We now analyse the competitive positioning and key categories of Emami which differentiates its products as herbal or ayurvedic with traditional ingredients. There is a preference for traditional ayurvedic products as rhey are considered as mild and free from side effects.Morever, their belief in Ayurveda stems from age old
traditional and other social factors. Consumption of branded Ayurvedic products by urban consumers is now on a upward trend with change in perception about their effectiveness.
Proportion of HPC and
Packaged Foods in India
Source: AC Nielsen
Household Disposable Income
Growth with GDP
Source: McKinsey Report, The rise of
India’s consumer market
Rural vs Urban penetration
Source: AC Nielsen
Urban & Rural segment contribution in FMCG in India
Source: AC Nielsen
31% 32%41%
34% 34%
45%
0%
20%
40%
60%
80%
100%
FY08 FY09 FY10
HPC Food
5.70%
6.30%
7.30% 7.20%
5.70%
6.00%
6.40%
7.40%
GDP growthHousehold disposable income growth
42%37%
67%
18%
77%
57%
80%
32%
0%
25%
50%
75%
100% Rural Urban
33%
67%
Rural Urban
CFA Institute Research Challenge 04.10.2011
4
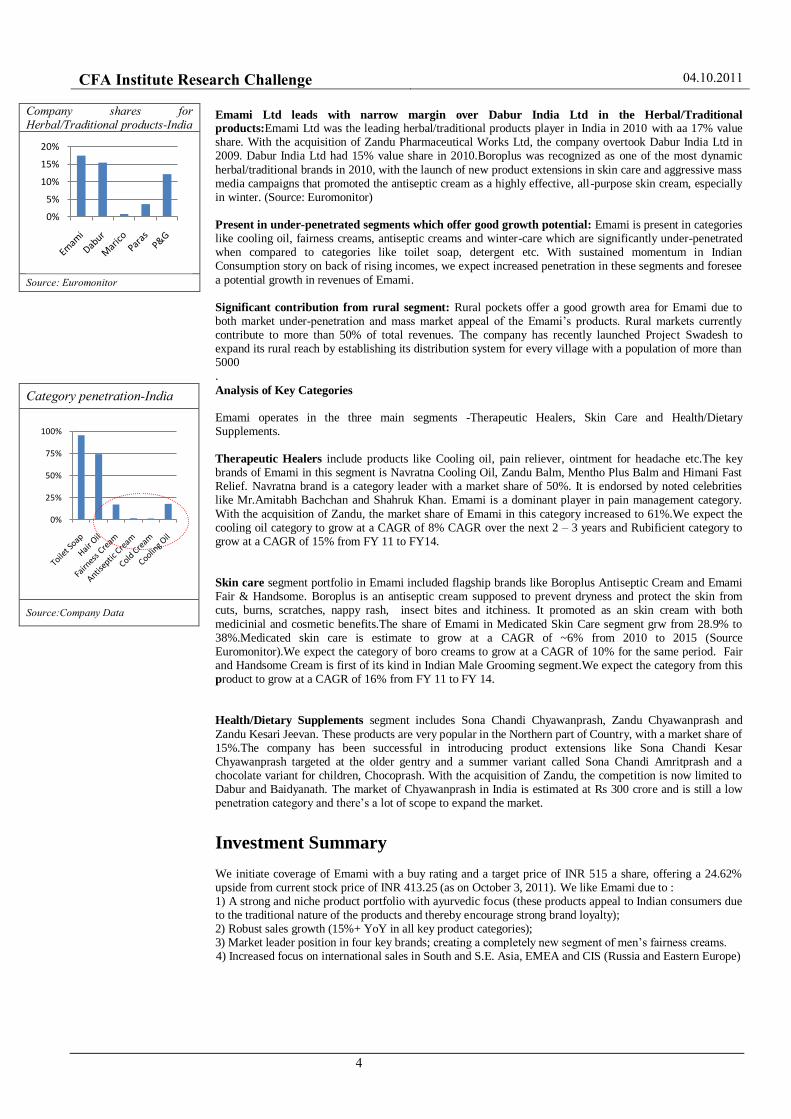
Emami Ltd leads with narrow margin over Dabur India Ltd in the Herbal/Traditional products:Emami Ltd was the leading herbal/traditional products player in India in 2010 with aa 17% value share. With the acquisition of Zandu Pharmaceutical Works Ltd, the company overtook Dabur India Ltd in 2009. Dabur India Ltd had 15% value share in 2010.Boroplus was recognized as one of the most dynamic
herbal/traditional brands in 2010, with the launch of new product extensions in skin care and aggressive mass media campaigns that promoted the antiseptic cream as a highly effective, all-purpose skin cream, especially in winter. (Source: Euromonitor)
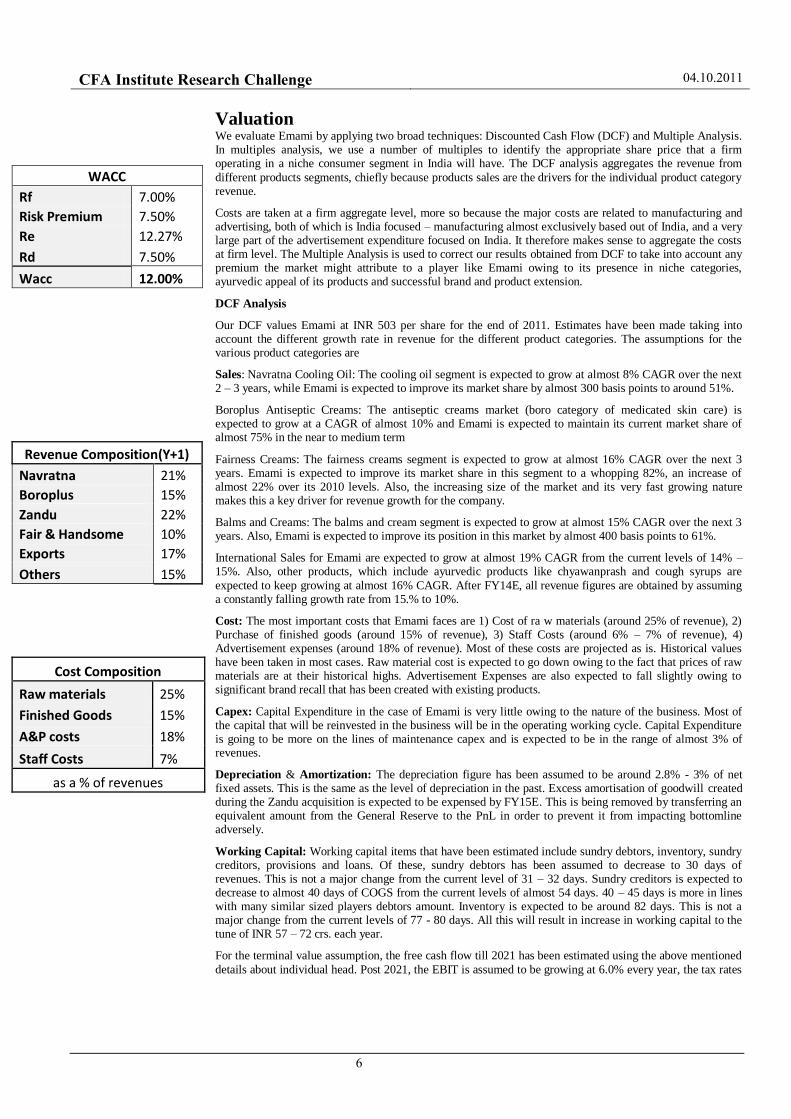
Present in under-penetrated segments which offer good growth potential: Emami is present in categories like cooling oil, fairness creams, antiseptic creams and winter-care which are significantly under-penetrated when compared to categories like toilet soap, detergent etc. With sustained momentum in Indian Consumption story on back of rising incomes, we expect increased penetration in these segments and foresee
a potential growth in revenues of Emami.
Significant contribution from rural segment: Rural pockets offer a good growth area for Emami due to both market under-penetration and mass market appeal of the Emami‘s products. Rural markets currently contribute to more than 50% of total revenues. The company has recently launched Project Swadesh to expand its rural reach by establishing its distribution system for every village with a population of more than 5000 .
Analysis of Key Categories
Emami operates in the three main segments -Therapeutic Healers, Skin Care and Health/Dietary Supplements. Therapeutic Healers include products like Cooling oil, pain reliever, ointment for headache etc.The key brands of Emami in this segment is Navratna Cooling Oil, Zandu Balm, Mentho Plus Balm and Himani Fast Relief. Navratna brand is a category leader with a market share of 50%. It is endorsed by noted celebrities like Mr.Amitabh Bachchan and Shahruk Khan. Emami is a dominant player in pain management category.
With the acquisition of Zandu, the market share of Emami in this category increased to 61%.We expect the cooling oil category to grow at a CAGR of 8% CAGR over the next 2 – 3 years and Rubificient category to grow at a CAGR of 15% from FY 11 to FY14.
Skin care segment portfolio in Emami included flagship brands like Boroplus Antiseptic Cream and Emami Fair & Handsome. Boroplus is an antiseptic cream supposed to prevent dryness and protect the skin from cuts, burns, scratches, nappy rash, insect bites and itchiness. It promoted as an skin cream with both
medicinial and cosmetic benefits.The share of Emami in Medicated Skin Care segment grw from 28.9% to 38%.Medicated skin care is estimate to grow at a CAGR of ~6% from 2010 to 2015 (Source Euromonitor).We expect the category of boro creams to grow at a CAGR of 10% for the same period. Fair and Handsome Cream is first of its kind in Indian Male Grooming segment.We expect the category from this product to grow at a CAGR of 16% from FY 11 to FY 14.
Health/Dietary Supplements segment includes Sona Chandi Chyawanprash, Zandu Chyawanprash and
Zandu Kesari Jeevan. These products are very popular in the Northern part of Country, with a market share of 15%.The company has been successful in introducing product extensions like Sona Chandi Kesar Chyawanprash targeted at the older gentry and a summer variant called Sona Chandi Amritprash and a chocolate variant for children, Chocoprash. With the acquisition of Zandu, the competition is now limited to Dabur and Baidyanath. The market of Chyawanprash in India is estimated at Rs 300 crore and is still a low penetration category and there‘s a lot of scope to expand the market.
Investment Summary
We initiate coverage of Emami with a buy rating and a target price of INR 515 a share, offering a 24.62% upside from current stock price of INR 413.25 (as on October 3, 2011). We like Emami due to : 1) A strong and niche product portfolio with ayurvedic focus (these products appeal to Indian consumers due to the traditional nature of the products and thereby encourage strong brand loyalty);
2) Robust sales growth (15%+ YoY in all key product categories); 3) Market leader position in four key brands; creating a completely new segment of men‘s fairness creams. 4) Increased focus on international sales in South and S.E. Asia, EMEA and CIS (Russia and Eastern Europe)
Company shares for Herbal/Traditional products-India
Source: Euromonitor
Category penetration-India
Source:Company Data
0%
5%
10%
15%
20%
0%
25%
50%
75%
100%

CFA Institute Research Challenge 04.10.2011
5
The Indian FMCG sector is generally defensive in nature. Hence,the economic downturn in 2008 has not affected busines of Emami, owing to the everyday usefulness of the products and the strong brand recall associated with eash product that is launched from the Emami stable. The stock outperformed NSE Nifty, and is up 37% from Oct 5, 2009.
We expect a sustained revenue growth based on 1) retaining market leader position in most of its key product categories 2) successful product and brand extensions, ability to leverage existing brand recall to help the new product to be received well by the consumers, 3) increased focus on rural segment 4)potential pass-through of
icreasing input costs. The ayurvedic nature of Emami‘s product results in higher gross margins compared to peer. Also, costs of raw material are expected to slacken up (raw material prices are at historical highs) will also bring in improvements in its EBITDA margins. EBITDA margins are expected to be in the range of 21.5% - 21.8%, an increase of 30 to 50 basis points over the current levels.
We forecast a 21.5% net income CAGR in FY12-14 which is expected to be supported by its sales growth in
key product segments and increased sales from its international division. Management strategy to use tax breaks to reduce the overall cost structure will result in higher net margins.In addition, we believe Emami will maintain working capital discipline and does not have much Capex requirement, which will further improve its cash flows. Also, the company is expected to become net cash FY12. A combination of these factors has led us to believe that Operating cash flow will rise to 14.15% in FY12 from its current levels of under 10%.
Emami is trading at 22.2x FY12E PE and 20.4x FY13E PE, a premium to its global peers and in line with most of its Indian peers. This valuation could be due to a stronger EPS outlook and gross margins, leadership in niche categories, and presence in under-penetrated fast-growing segments.Emami is trading at a 7.7% discount to Dabur‘s FY13E PE. This discount has narrowed from FY04 onwards as Emami gained market share and launched new products. Its PE discount is also partly lower because of higher net non-operating
income for Emami and lower tax rate (tax incentives). However, Emami is trading at a premium of 6.3% to Dabur on FY13E EV/EBITDA. Our end-of-the year target price of INR 515 (Range: INR 510 – INR 520) is based on a Discounted Cash Flow and Relative valuation using multiples of peer companies. For the DCF we have assumed independent growth of different product segments and have also taken into account the market share in each such segment that Emami is expected to achieve. The multiple analysis values Emami using only Indian peers as the consumer segment in India is substantially different from the other developed economies. Our target price is
the weighted average of the prices resulting from our DCF and our Multiple Analysis.
Figure 2: Emami Stock Price Performance Emami stock performance since Oct. 2008
100
200
300
400
500
600
700
800
900
03-Oct-08 03-Apr-09 03-Oct-09 03-Apr-10 03-Oct-10 03-Apr-11 03-Oct-11
Emami CNX Nifty CNX FMCG
Source: Bloomberg, BSE Website, NSE Website,
17 – Oct- 2008
Decision of Parikh
family to sell stake to
Emami
22 – Sep - 2009
Zandu shareholders
approve merger
19 – May - 2011 Dividend of Rs.
3.50 declared
28 –Jan - 2011
Acquisition of shares of
Egyptian company to make it
a subsidiary
19 –Jul - 2010
Stock Split; Dividend of Rs.
6.00 on face value of Rs. 2/-
4 –Dec - 2009
Dividend of Rs.4.50 declared 04 – Nov - 2008
Open Offer for Zandu
completed, owns 66% stake
in Zandu now
CFA Institute Research Challenge 04.10.2011
6
Valuation We evaluate Emami by applying two broad techniques: Discounted Cash Flow (DCF) and Multiple Analysis. In multiples analysis, we use a number of multiples to identify the appropriate share price that a firm operating in a niche consumer segment in India will have. The DCF analysis aggregates the revenue from
different products segments, chiefly because products sales are the drivers for the individual product category revenue.
Costs are taken at a firm aggregate level, more so because the major costs are related to manufacturing and advertising, both of which is India focused – manufacturing almost exclusively based out of India, and a very large part of the advertisement expenditure focused on India. It therefore makes sense to aggregate the costs at firm level. The Multiple Analysis is used to correct our results obtained from DCF to take into account any premium the market might attribute to a player like Emami owing to its presence in niche categories, ayurvedic appeal of its products and successful brand and product extension.
DCF Analysis
Our DCF values Emami at INR 503 per share for the end of 2011. Estimates have been made taking into account the different growth rate in revenue for the different product categories. The assumptions for the various product categories are
Sales: Navratna Cooling Oil: The cooling oil segment is expected to grow at almost 8% CAGR over the next 2 – 3 years, while Emami is expected to improve its market share by almost 300 basis points to around 51%.
Boroplus Antiseptic Creams: The antiseptic creams market (boro category of medicated skin care) is expected to grow at a CAGR of almost 10% and Emami is expected to maintain its current market share of almost 75% in the near to medium term
Fairness Creams: The fairness creams segment is expected to grow at almost 16% CAGR over the next 3 years. Emami is expected to improve its market share in this segment to a whopping 82%, an increase of almost 22% over its 2010 levels. Also, the increasing size of the market and its very fast growing nature makes this a key driver for revenue growth for the company.
Balms and Creams: The balms and cream segment is expected to grow at almost 15% CAGR over the next 3 years. Also, Emami is expected to improve its position in this market by almost 400 basis points to 61%.
International Sales for Emami are expected to grow at almost 19% CAGR from the current levels of 14% – 15%. Also, other products, which include ayurvedic products like chyawanprash and cough syrups are
expected to keep growing at almost 16% CAGR. After FY14E, all revenue figures are obtained by assuming a constantly falling growth rate from 15.% to 10%.
Cost: The most important costs that Emami faces are 1) Cost of ra w materials (around 25% of revenue), 2) Purchase of finished goods (around 15% of revenue), 3) Staff Costs (around 6% – 7% of revenue), 4) Advertisement expenses (around 18% of revenue). Most of these costs are projected as is. Historical values have been taken in most cases. Raw material cost is expected to go down owing to the fact that prices of raw materials are at their historical highs. Advertisement Expenses are also expected to fall slightly owing to significant brand recall that has been created with existing products.
Capex: Capital Expenditure in the case of Emami is very little owing to the nature of the business. Most of the capital that will be reinvested in the business will be in the operating working cycle. Capital Expenditure is going to be more on the lines of maintenance capex and is expected to be in the range of almost 3% of revenues.
Depreciation & Amortization: The depreciation figure has been assumed to be around 2.8% - 3% of net fixed assets. This is the same as the level of depreciation in the past. Excess amortisation of goodwill created during the Zandu acquisition is expected to be expensed by FY15E. This is being removed by transferring an equivalent amount from the General Reserve to the PnL in order to prevent it from impacting bottomline adversely.
Working Capital: Working capital items that have been estimated include sundry debtors, inventory, sundry creditors, provisions and loans. Of these, sundry debtors has been assumed to decrease to 30 days of revenues. This is not a major change from the current level of 31 – 32 days. Sundry creditors is expected to decrease to almost 40 days of COGS from the current levels of almost 54 days. 40 – 45 days is more in lines with many similar sized players debtors amount. Inventory is expected to be around 82 days. This is not a major change from the current levels of 77 - 80 days. All this will result in increase in working capital to the tune of INR 57 – 72 crs. each year.
For the terminal value assumption, the free cash flow till 2021 has been estimated using the above mentioned
details about individual head. Post 2021, the EBIT is assumed to be growing at 6.0% every year, the tax rates
WACC
Rf 7.00%
Risk Premium 7.50%
Re 12.27%
Rd 7.50%
Wacc 12.00%
Revenue Composition(Y+1)
Navratna 21%
Boroplus 15%
Zandu 22%
Fair & Handsome 10%
Exports 17%
Others 15%
Cost Composition
Raw materials 25%
Finished Goods 15%
A&P costs 18%
Staff Costs 7%
as a % of revenues
CFA Institute Research Challenge 04.10.2011
7
are expected to be constant and any capex will only be in the form of maintenance capex thereby removing the effect of depreciation in the FCF.
Also, no changes in net operating working capital are expected to happen once the terminal stage is reached. A terminal growth of 5% on the face of it looks large – however, this has been taken keeping in view the very
high potential of growth in consumption and penetration of consumer goods in the country. A study by McKinsey had concluded that consumer sector can be expected to grow at almost 7-8% CAGR over the next 20 years. Hence, a terminal value growth rate of 5% is completely in line with our views in the industry.
Wacc has been calculated keeping the debt/equity ratio constant in the company. Also, a risk free rate of 7% has been assumed in the Indian market, along with a market risk premium of 7.5%. Beta for the stock has been taken as 0.70 which is slightly less than its current beta but still more than other firms in the industry. Beta is expected to go down as the firm matures in the market. Country risk premium has already been
accounted for in the very high Rf that has been taken for the Indian market.
In order to test the robustness of our valuation, we perform a sensitivity analysis of the share price on its most critical assumptions – Wacc and terminal value growth rate
Multiple Analysis
In this section we calculate a market-based range and a target price by comparing valuation of companies in the consumer sector in India and globally. Also, we are looking at a few mid cap as well as a few large cap companies to get an idea of the approximate multiples the players are trading at. Also, there is a substantial difference in most multiple between Indian and global peers. This difference is chiefly owing to the very high premiums that the market associates with a firm operating in the Indian consumer scenario as opposed to the relatively less premium attached to the firms operating in other geographies and environments.
Emami is operating in a very niche market of ayurvedic products. To obtain an accurate market-based
valuation it is critical to identify a set of listed peers that are comparable. Among the currently listed companies, we define four different groups of comparable companies
(a) Indian companies that are direct competitors of Emami (Dabur, Marico, Godrej Consumer); These players are mostly mid cap players operating in the consumer segment in India
(b) Large Cap Indian FMCG majors (Hindustan Unilever, P&G India, Gillette, GlaxoSmithkline); These players are large players with significant diversification in the consumer segments they operate in. Also, they have their global counterparts and their ratios provide an estimate about the higher premiums that firms operating in India enjoy;
(c) Companies which are in a similar business but operate in other markets (including Brazil, China, US, Europe); It is very difficult to identify a player in the global market which is in a business like Emami‘s. Most players are in defined product categories and the FMCG category that comes closest to that of Emami is cosmetics
(d) Lastly, there are global FMCG majors whose multiples indicate the valuation obtained by a firm not restricted to a very fast growing market like that of India. These firms are not direct comparables for Emami. Our overall conclusion is that there are few, if any, comparables for Emami.
We have valued Emami using (1) P/E multiples, using 2 year forward multiple, (2) EV/EBITDA multiple, using 2 year forward multiples, (3) P/Book Value, using mean of 2 year forward multiple. Of these we
believe the EV/EBITDA is a more significant multiple as it is affected only by the core operations of Emami. Share price obtained from each of these techniques yields a price in the range of INR 476 (Upside: 15.2%) to INR 550 (Upside: 33.1%). This is more or less around the INR 503 (Upside: 21.7%) obtained from the DCF valuation model. A 2 year forward P/E yields a share price of around INR 505 which is closer to the value obtained from the DCF model.
P/E and other multiples were used beside the EV/EBITDA multiple as the latter does not capture some fundamental differences such as different tax rates or D&A/Sales ratios. In peer comparison we are only taking into account the Indian firms as global firms are trading at significant discounts to their Indian
counterparts, and do not represent the business of Emami.
Conclusions: Target Price INR 515/share, implying an upside of 24.6% over the current market price. Higher weights have been assigned to DCF based valuation and the P/E based value as opposed to more EV/EBITDA ratios because of the significant benefits that Emami enjoys in its taxation because it operates in tax exempt zones. In our opinion, Emami offers further upside potential in the medium term, as long as the growth strategy in emerging markets proves to be successful. In case the company can successfully acquire another company and realize synergy benefits like in the case of Zandu, the upside potential will be even higher. However, such inorganic growth also bring in a risk which cannot be ignored.
Valuation Summary
EV( INR lacs) 766488.1
Net Debt(INR lacs) 1887.6
Equity (INR lacs) 764600.4
Shares outstanding (lacs) 1513.0
Equity per share 505.4
P/E
Y+1 Y+2
Marico 27.2 21.7
Dabur 26.4 22.0 Godrej Consumer 32.3 25.3
Mean 28.6 23.0
Median 27.2 22.0

CFA Institute Research Challenge 04.10.2011
8
Risks to Your Price Target Key risks to the above price target are due to the changes in WACC and slower sales growth on account of changing macroeconomic factors in the world. Although relatively shielded from downturns, consumer sector
will see some amount of slowdown especially if the current macroenvironment worsens. Any slowdown will likely impact consumption and thereby impact top line. Also, in an uncertain environment, international sales might not pick up as much as expected.
Socio-political crisis like those faced in Egypt, Libya and the Middle-East is also likely to impact performance in those regions. Capital formation in such countries has been stalled, thereby implying that future growth will be affected. Major changes in the macroenvironment is also likely to impact the cost of capital which in turn will depress valuations.
Launch of new products which can potentially create new segments will also adversely affect the sales of my
existing product line. Hence constant addition and improvements in the existing business line is required. Also, to continue and further enhance brand recall, sufficient expenses need to be incurred on the advertisement front, more so if new products are being launched or brand extensions being done.
Price of chief raw materials like menthol and camphor are at very high levels. We are assuming some fall in these in the medium term. If that does not happen and increased costs are not passed on to the consumers, margins will suffer thereby impacting valuation.
Financial Analysis In this section we will discuss some of the issues related to sales, earnings, cash flows, margins and financing future investments of the company.
Sales: Growth driven by increasing market share, rapidly expanding product category segments
Emami‘s presence in niche segment like cooling oils, boro antiseptic creams (medicated skin care), men‘s fairness creams and its market dominating position in these categories are going to be the main drivers for revenues in the near to medium term. Increased penetration of these products and the gradual expansion of the consumer market will fuel the sales. New product introductions in niche markets and brand and product expansions in more mass market areas like cold cream will further boost sales especially because of the very large amount of brand goodwill that has been created through a sustained advertisement campaign.
Margins: Falling raw material prices and ability to push costs are expected to increase margins
Prices of raw materials like menthol and camphor are at very high levels and are expected to go down in the near future. Also, prices of metals like silver and gold used in some other products like chyawanprash are also expected to come down. Ability to push raw material cost to customer due to niche nature of the market also helps to sustain margins. Any fall in raw materials prices will therefore help improve margins. Introduction of new market niches will also help to price products at a substantial premium.
Cash Flow: Increases along with sales
Sales growth and margin maintenance or expansion will increase operating cash flow. According to our estimates, Emami will generate around INR 2670 mn operating cash flow per year on average for the next
three years. We forecast OCF to Sales ratio to reach 14.2% by 2013, moving from 9.90% in 2011. This is expected to go up to almost 15.4% by 2014. This cash flow will be used to finance an average of INR 583.5 mn in capital expenditures over the next 3 years and average increase in working capital of INR 648.5 mn over the next 3 years (2012 – 2014). We estimate a dividend payout ratio to be maintained around 21% of profit after tax thereby resulting in an increase in dividend from INR 3.50 in FY 2011 to INR 5.50 in FY 2014.
Balance Sheet & Financing: Strong balance sheet, net cash position expected to be reached in FY12
We believe that Emami will be a net cash company at the end of the current financial year. Its low Debt/Equity structure and the high CFO nature of the business further means that most investments can be
done using internal cah flows. Also, in case acquisition opportunities arise, the internal cash reserves can be used. The low Debt/Equity structure also means should opportunity to acquire arise, debt can be taken. Its strong balance sheet and working capital discipline have helped it to be suitably positioned to look for value enhancing acquisitions.
Highlights FY12P
Revenues (Rs m) 44006.9
EBITDA(Rs m) 10457.1
EBIT(Rs m) 10280.6
PAT(Rs m) 8191.6
Revenue and Revenue Growth
Source:Company Data, Model
Projections
EBITDA and EBITDA
margins
Source:Company Data,
Model Projections
0.0%
5.0%
10.0%
15.0%
20.0%
25.0%
0
50000
100000
150000
200000
250000
300000
FY1
2P
FY1
3E
FY1
4E
FY1
5E
FY1
6E
20.0%
21.0%
22.0%
23.0%
0
10000
20000
30000
40000
50000
60000
70000
FY1
2P
FY1
3E
FY1
4E
FY1
5E
FY1
6E

CFA Institute Research Challenge 04.10.2011
9
FDI in retail – Impact on FMCG
Given the recent buzz about FDI participation in Indian retail, we decided to analyse the impact of the same on Indian FMCG Manufacturers. Foreign direct investment (FDI) in the retail sector in India is restricted,allowing up to 51 per cent FDI
through the singlebrand retail route. Recent signals from the government however suggest that multi-brand retail might also open up for FDI, allowing global supermarket chain stores such as Wal-Mart to set shop in India.
Impact on domestic FMCG players On one hand, the modern retail offers the benefits of increased visibility of FMCG brands and higher throughput per store.However, increased contribution from modern retail increases the bargaining power of retailers and leads to a reduction in margins for the FMCG manufacturers.For instance, Big Bazaar demands
higher margins compared to a mom-and-pop store from the FMCG players. Most FMCG companies have developed regional distribution and re-distribution network.These distributors, as an industry body in the past have opposed FMCG companies selling directly to retailers.With the increase in modern trade, FMCG companies will have to deal with channel conflicts and re-invest in developing alternate distribution strategies.
However, most FMCG players believe that there will minimal impact of FDI in modern retail on domestic FMCG players.According to Mr.Adi Godrej, modern retail is not suited for India due to the challenges it will have to face from traditional retail mom-and-pop storesthat offer home delivery services and credit to loyal
customers, both of which have long been a part of the traditional Indian retail systems.(Source: Economic Times)
Investment Risks
Rising Input costs can reduce margins further:Emami‘s gross margins took a hit of 430bps in FY11 due to rising costs of raw materials. Key inputs for Emami include menthol, camphor, metals and packaging materials. Emami, one of the key consumers of Menthol in the FMCG industry was affected by rise in
Menthol prices in the last year. Cost of packaging materials rose because of rising crude oil costs. However, the company is taking initiatives to manage the raw material costs. It has started a trial project for contract manufacture of menthol. According to company, cost efficiencies were achieved introducing packaging modifications without compromising the quality. Also, we note that the gross margins of Emami are higher than its peers and a further reduction in margins can be avoided by a partial pass-through of costs to the consumer.
Seasonal Nature of Products- Sales partially dependent on weather:Flagship products of Emami like Navratna cooling oil and Boroplus cream are seasonal in nature. The extent of usage of these products is dependent on the severity of the weather. A less extreme hot or cold weather could reduce the potential sales of these products. Also, the company has to maintain inventory stock in anticipation on demand fluctuations creating excess inventories. New launches have less of a niche: New launches of Emami include Boroplus body lotion, Malai Kesar
Cold Cream and Vasocare Petroleum Jelly. The newer products of Emami have less of the niche when compared to mature products like Navratna Cooling Oil and Boroplus Antiseptic cream which have a market share of 50%. Given the existing competition in the categories of new launches, Emami might not be able to achieve a similar market leadership. This could impact the revenue growth in the coming years.
Aggressive acquisition strategy may not sit well with the investors: The steep fall in the stock price of Emami since the day its board approved the acquisition attempt of Paras Pharma is indicative of investor
displeasure with the aggressive acquisition strategy.Emami will have to weigh the tradeoffs between a stretched balance sheet and possible earnings dilution on one hand and expansion of market share on the other.
Menthol flakes price (INR/kg)
Source: Bloomberg
Menthol Oil Index
Source:Bloomberg
Paraffin Wax Index
Source:Bloomberg
Camphor Index
Source:Bloomberg
0
400
800
1200
1600
2000
0
400
800
1200
1600
2000
50
100
0
250
500

CFA Institute Research Challenge 04.10.2011
10
Appendix 1: Historical and Projected Income Statement from FY09 – FY14
FYE 31st March ; Rs in lacs FY09A FY10A FY11A FY12P FY13E FY14E
Revenues 74,609 1,03,798 1,27,777 1,53,441 1,82,847 2,11,867
% growth 39% 23% 20% 19% 16%
Other Income 736 830 1,851 1,995 2,194 2,331
Total Income 75,345 1,04,628 1,29,628 1,55,436 1,85,042 2,14,197
Stock in Trade -7,252 -819 -2,848 -2,302 -1,828 -2,119
Consumption of Raw Materials 19,188 25,189 34,524 40,662 47,540 54,026
Purchase of Finished Goods 12,818 13,624 20,642 24,244 28,341 32,839
Total input costs 24,754 37,994 52,318 62,604 74,053 84,747
Staff Cost 4,954 5,808 7,371 9,206 10,971 12,712
A&P spending 12,231 18,741 23,050 28,387 33,827 39,195
Other Expenditure 16,000 16,732 19,696 23,016 27,427 31,780
Total Expenditure 57,939 79,275 1,02,435 1,23,213 1,46,278 1,68,434
EBITDA 17,406 25,353 27,193 32,223 38,764 45,763
EBITDA margin 23.3% 24.4% 21.3% 21.0% 21.2% 21.6%
Depreciation and Amortization 828 1,546 1,400 1,156 985 874
Excess Amortization of Goodwill 965 10,210 10,209 10,209 10,209 10,209
Tranfer from General reserve -965 -10,210 -10,209 -10,209 -10,209 -10,209
EBIT 16,578 23,807 25,793 31,066 37,779 44,889
Interest 2,101 2,103 -1,117 1,935 2,159 2,384
Exceptional Items 0 1,213 19 0 0 0
Profit before tax 14,477 20,491 26,910 29,132 35,620 42,505
Provision for tax 1,412 3,517 4,041 4,781 5,698 6,602
% tax 10% 17% 15% 15% 15% 15%
Profit after tax 13,064 16,974 22,869 24,351 29,922 35,903

CFA Institute Research Challenge 04.10.2011
11
Appendix 2: Historical and Projected Balance Sheet from FY09 – FY14
FYE 31st March ; Rs in lacs FY09A FY10A FY11A FY12P FY13E FY14E
Current Assets:
Inventories 7,320 8,265 12,336 14,581 17,047 19,515
Sundry Debtors 5,075 7,546 10,891 13,032 15,029 17,414
Cash & Bank balances 1,077 16,143 21,050 33,030 48,830 67,913
Loans 7,688 10,651 15,698 16,893 18,711 19,039
Less
Net Current Liabilities 15,060 16,214 16,507 17,330 18,863 20,113
Sundry Creditors 9,857 9,268 9,173 8,891 9,355 9,519
Provisions 5,204 6,946 7,334 8,439 9,508 10,593
Net Current Assets 6,099 26,390 43,467 60,206 80,753 1,03,767
Fixed Assets
Gross Block 70,644 76,380 79,929 84,532 90,018 97,433
Less Depreciation& Amortization 9,387 21,143 32,752 44,117 55,311 66,395
Sales/Adjustments 875 1,277 886 471 189
Net Block 61,258 56,113 48,454 41,301 35,178 31,228
Capital WIP 3,670 621 648 648 648 648
Investments 3,989 6,162 661 661 661 661
Translation Gain/Loss 314 -141 -7 0 0 0
Net Fixed Assets 69,231 62,754 49,757 42,611 36,487 32,537
Goodwill 76 76 76 76
Misc 0 0 0 0 0 0
Total 75,330 89,144 93,300 1,02,893 1,17,316 1,36,380
Share Capital 1,313 1,513 1,513 1,513 1,513 1,513
General reserve(@ beginning) 22,500 22,900 24,999 29,999 38,331 48,819
Tranfer from PnL 3,953 12,309 15,210 18,541 20,697 24,365
Tranfer to PnL -965 -10,210 -10,209 -10,209 -10,209 -10,209
Others -2,589 0 0 0 0 0
Reserve & Surplus(@ end) 22,900 24,999 29,999 38,331 48,819 62,974
Balance Carried forward to PnL 2,462 1,816 3,300 1,642 2,531 4,255
Capital Reserve & Security Premium 3,241 34,041 34,041 34,041 34,041 34,041
Reserves & Surplus 28,599 61,030 67,479 74,216 85,588 1,01,477
Secured Loans 37,306 14,923 17,564 20,420 22,420 24,420
Unsecured Loans 7,516 10,982 5,374 5,374 6,366 7,371
Deferred Tax Liability 596 696 1,370 1,370 1,430 1,600
75,330 89,144 93,300 1,02,893 1,17,316 1,36,380
Debt/Equity 149.8% 41.4% 33.2% 34.1% 33.0% 30.9%
ASSETS
LIABILITIES & EQUITY
CFA Institute Research Challenge 04.10.2011
12
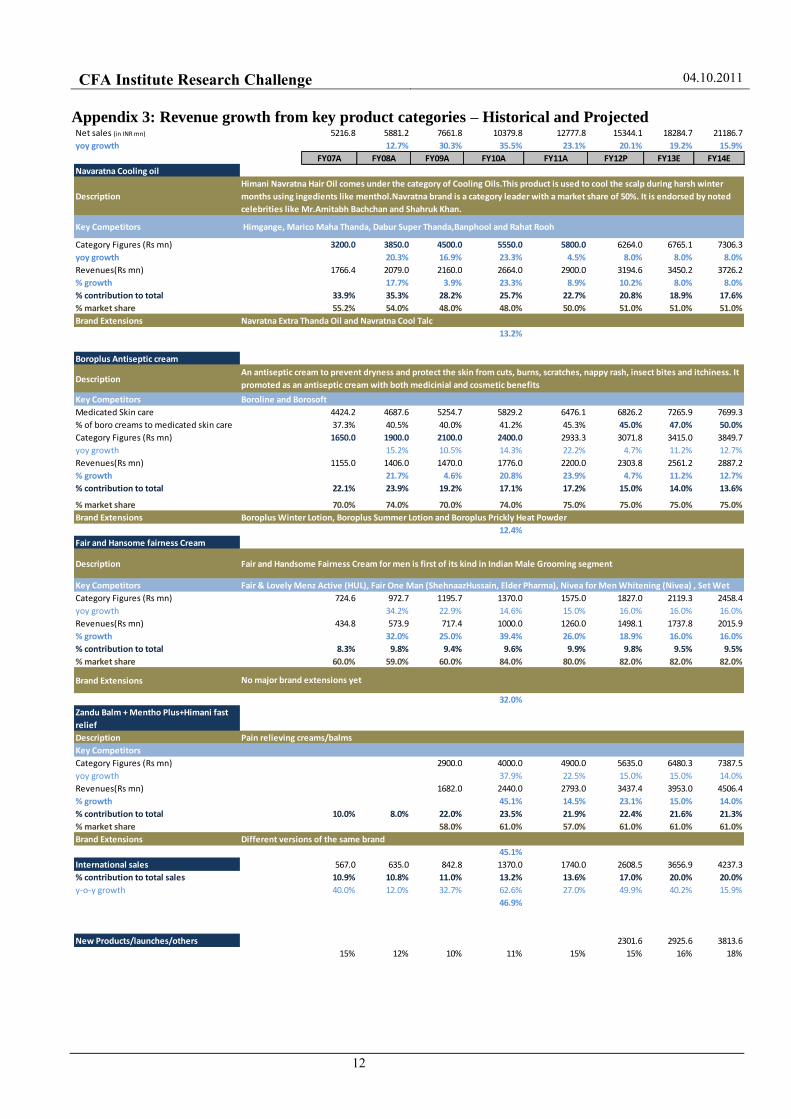
Appendix 3: Revenue growth from key product categories – Historical and Projected
Net sales (in INR mn) 5216.8 5881.2 7661.8 10379.8 12777.8 15344.1 18284.7 21186.7
yoy growth 12.7% 30.3% 35.5% 23.1% 20.1% 19.2% 15.9%
FY07A FY08A FY09A FY10A FY11A FY12P FY13E FY14E
Navaratna Cooling oil
Description
Key Competitors
Category Figures (Rs mn) 3200.0 3850.0 4500.0 5550.0 5800.0 6264.0 6765.1 7306.3
yoy growth 20.3% 16.9% 23.3% 4.5% 8.0% 8.0% 8.0%
Revenues(Rs mn) 1766.4 2079.0 2160.0 2664.0 2900.0 3194.6 3450.2 3726.2
% growth 17.7% 3.9% 23.3% 8.9% 10.2% 8.0% 8.0%
% contribution to total 33.9% 35.3% 28.2% 25.7% 22.7% 20.8% 18.9% 17.6%
% market share 55.2% 54.0% 48.0% 48.0% 50.0% 51.0% 51.0% 51.0%
Brand Extensions
13.2%
Boroplus Antiseptic cream
Description
Key Competitors
Medicated Skin care 4424.2 4687.6 5254.7 5829.2 6476.1 6826.2 7265.9 7699.3
% of boro creams to medicated skin care 37.3% 40.5% 40.0% 41.2% 45.3% 45.0% 47.0% 50.0%
Category Figures (Rs mn) 1650.0 1900.0 2100.0 2400.0 2933.3 3071.8 3415.0 3849.7
yoy growth 15.2% 10.5% 14.3% 22.2% 4.7% 11.2% 12.7%
Revenues(Rs mn) 1155.0 1406.0 1470.0 1776.0 2200.0 2303.8 2561.2 2887.2
% growth 21.7% 4.6% 20.8% 23.9% 4.7% 11.2% 12.7%
% contribution to total 22.1% 23.9% 19.2% 17.1% 17.2% 15.0% 14.0% 13.6%
% market share 70.0% 74.0% 70.0% 74.0% 75.0% 75.0% 75.0% 75.0%
Brand Extensions
12.4%
Fair and Hansome fairness Cream
Description
Key Competitors
Category Figures (Rs mn) 724.6 972.7 1195.7 1370.0 1575.0 1827.0 2119.3 2458.4
yoy growth 34.2% 22.9% 14.6% 15.0% 16.0% 16.0% 16.0%
Revenues(Rs mn) 434.8 573.9 717.4 1000.0 1260.0 1498.1 1737.8 2015.9
% growth 32.0% 25.0% 39.4% 26.0% 18.9% 16.0% 16.0%
% contribution to total 8.3% 9.8% 9.4% 9.6% 9.9% 9.8% 9.5% 9.5%
% market share 60.0% 59.0% 60.0% 84.0% 80.0% 82.0% 82.0% 82.0%
Brand Extensions
32.0%
Zandu Balm + Mentho Plus+Himani fast
relief
Description
Key Competitors
Category Figures (Rs mn) 2900.0 4000.0 4900.0 5635.0 6480.3 7387.5
yoy growth 37.9% 22.5% 15.0% 15.0% 14.0%
Revenues(Rs mn) 1682.0 2440.0 2793.0 3437.4 3953.0 4506.4
% growth 45.1% 14.5% 23.1% 15.0% 14.0%
% contribution to total 10.0% 8.0% 22.0% 23.5% 21.9% 22.4% 21.6% 21.3%
% market share 58.0% 61.0% 57.0% 61.0% 61.0% 61.0%
Brand Extensions
45.1%
International sales 567.0 635.0 842.8 1370.0 1740.0 2608.5 3656.9 4237.3
% contribution to total sales 10.9% 10.8% 11.0% 13.2% 13.6% 17.0% 20.0% 20.0%
y-o-y growth 40.0% 12.0% 32.7% 62.6% 27.0% 49.9% 40.2% 15.9%
46.9%
New Products/launches/others 2301.6 2925.6 3813.6
15% 12% 10% 11% 15% 15% 16% 18%
Himani Navratna Hair Oil comes under the category of Cooling Oils.This product is used to cool the scalp during harsh winter
months using ingedients like menthol.Navratna brand is a category leader with a market share of 50%. It is endorsed by noted
celebrities like Mr.Amitabh Bachchan and Shahruk Khan.
Himgange, Marico Maha Thanda, Dabur Super Thanda,Banphool and Rahat Rooh
Boroline and Borosoft
An antiseptic cream to prevent dryness and protect the skin from cuts, burns, scratches, nappy rash, insect bites and itchiness. It
promoted as an antiseptic cream with both medicinial and cosmetic benefits
Pain relieving creams/balms
Different versions of the same brand
Boroplus Winter Lotion, Boroplus Summer Lotion and Boroplus Prickly Heat Powder
Navratna Extra Thanda Oil and Navratna Cool Talc
Fair and Handsome Fairness Cream for men is first of its kind in Indian Male Grooming segment
Fair & Lovely Menz Active (HUL), Fair One Man (ShehnaazHussain, Elder Pharma), Nivea for Men Whitening (Nivea) , Set Wet
No major brand extensions yet

CFA Institute Research Challenge 04.10.2011
13
Appendix 4: Income statement and Capex assumptions (used to project values till FY21E)
Appendix 5: Quarterly revenue growth assumptions (used to project values till FY14E)
Appendix 6: Working Capital assumptions (used to project values till FY21E)
FY12P FY13E FY14E FY15E FY16E FY17E FY18E FY19E FY20E FY21E
Revenue Growth 20.1% 19.2% 15.9% 15.5% 14.5% 13.2% 12.0% 11.0% 10.5% 10.0%
Other Income (% of sales) 1.3% 1.2% 1.1% 1.1% 1.1% 1.0% 1.0% 1.0% 1.0% 1.0%
Stock in trade (% of sales) -1.5% -1.0% -1.0% -0.9% -0.9% -0.9% -0.8% -0.8% -0.8% -0.8%
Consumption of Raw Materials (%
of sales)26.5% 26.0% 25.5% 25.5% 25.5% 25.0% 25.0% 25.0% 25.0% 25.0%
Purchase of Finished Goods (% of
sales)15.8% 15.5% 15.5% 15.5% 15.3% 15.3% 15.3% 15.3% 15.3% 15.3%
Staff Cost (% of sales) 6.0% 6.0% 6.0% 6.0% 6.0% 6.0% 6.0% 6.0% 6.0% 6.0%
Advertisement Expenses (% of
sales)18.5% 18.5% 18.5% 18.1% 17.7% 17.3% 17.0% 16.8% 16.5% 16.0%
Other Expenses (% of sales) 15.0% 15.0% 15.0% 15.0% 15.0% 15.0% 15.0% 15.0% 15.0% 15.0%
Tax Rate 15.0% 15.0% 15.0% 15.0% 15.0% 15.0% 15.0% 15.0% 15.0% 15.0%
Capex (% of sales) 3.0% 3.0% 3.5% 2.5% 2.5% 2.3% 2.3% 2.1% 2.0% 2.0%
Depreciation + Amortization (as %
of net fixed assets)2.8% 2.8% 2.8% 3.0% 3.0% 3.0% 3.0% 3.0% 3.0% 3.0%
Amortisation of Goodwill 10209 10209 10209 10209 0 0 0 0 0 0
Q1 Q2 Q3 Q4
FY12E 18.4% 20.9% 33.7% 27.0%
FY13E 18.4% 20.9% 33.7% 27.0%
FY14E 18.4% 20.9% 33.7% 27.0%
FY12P FY13E FY14E FY15E FY16E FY17E FY18E FY19E FY20E FY21E
Account Receivable 31.0x 30.0x 30.0x 30.0x 30.0x 30.0x 30.0x 30.0x 30.0x 30.0x
Inventory 82.0x 82.0x 82.0x 82.0x 82.0x 82.0x 82.0x 82.0x 82.0x 82.0x
Loans (days of revenues) 95.0x 90.0x 80.0x 75.0x 75.0x 75.0x 75.0x 75.0x 75.0x 75.0x
Accounts Payable (days of COGS) 50.0x 45.0x 40.0x 40.0x 40.0x 40.0x 40.0x 40.0x 40.0x 40.0x
Provisions (% of revenues) 5.5% 5.2% 5.0% 5.0% 5.0% 5.0% 5.0% 5.0% 5.0% 5.0%

CFA Institute Research Challenge 04.10.2011
14
Appendix 7: DCF Valuation using FCF Valuation as on 31-12-2011 Year End 31-03-2012
FYE 31st March ; Rs in lacs FY12P FY13E FY14E FY15E FY16E FY17E FY18E FY19E FY20E FY21E
EBIT 31,066 37,779 44,889 52,806 62,076 72,751 82,125 91,895 1,02,806 1,15,432
Minus Other Income 1,995 2,194 2,331 2,692 3,082 3,172 3,552 3,943 4,357 4,793
Adjusted EBIT 29,071 35,585 42,558 50,114 58,994 69,579 78,573 87,952 98,449 1,10,639
Marginal tax rate 15% 15% 15% 15% 15% 15% 15% 15% 15% 15%
NOPLAT: EBIT*(1-t) 24,711 30,247 36,175 42,597 50,145 59,142 66,787 74,759 83,681 94,043
y-o-y growth 24% 22% 20% 18% 18% 18% 13% 12% 12% 12%
Non Cash charges 11,365 11,194 11,083 10,994 966 1,150 1,355 1,557 1,765 1,993
Depreciation 1,156 985 874 785 966 1,150 1,355 1,557 1,765 1,993
Amortization of Intangible Assets 10,209 10,209 10,209 10,209 - - - - - -
Change in Invested Capital (Capex + change in
working capital) 9,362 10,232 11,347 10,301 12,631 12,814 14,312 14,586 15,395 16,617
FCF for the firm 26,714 31,208 35,911 43,290 38,481 47,478 53,829 61,729 70,051 79,419
26,714 31,208 35,911 43,290 38,481 47,478 53,829 61,729 70,051 79,419
Discounting Period 0.25 1.25 2.25 3.25 4.25 5.25 6.25 7.25 8.25 9.25
Discounting Factor 0.97 0.87 0.77 0.69 0.62 0.55 0.49 0.44 0.39 0.35
Present value 25,968 27,087 27,830 29,955 23,775 26,192 26,515 27,150 27,509 27,848
Terminal Value 14,11,381
PV of terminal Value 4,94,890
Beta 0.70 Assumed Terminal Growth 5.0%
Rf 7.0% WACC 12.0%
Market Risk Premium 7.5% Terminal value 4,94,890
Re 12.3% EV 7,64,721
Rd 7.5%
Wacc 12.0%
Enterprise Value 7,65,382
Net Debt 1,888
Value of equity 7,63,495
Shares outstanding (in lakhs) 1513
Equity per share 505

CFA Institute Research Challenge 04.10.2011
15
Appendix 8: Sensitivity Analysis of share price with terminal value and wacc
505 3.6% 3.8% 4.0% 4.2% 4.4% 4.6% 4.8% 5.0% 5.2% 5.4% 5.6% 5.8% 6.0% 6.2% 6.4% 6.6%
10.0% 610 625 640 656 674 692 713 734 758 784 812 842 876 913 955 1,001
10.3% 584 597 611 626 641 658 676 696 717 739 764 791 820 853 888 928
10.5% 560 572 584 598 612 627 643 661 679 700 721 745 771 799 830 864
10.8% 538 548 560 572 585 599 613 629 646 664 683 704 727 752 779 808
11.0% 517 527 537 548 560 572 585 600 615 631 648 667 687 709 733 759
11.3% 497 506 516 526 537 548 560 573 586 601 617 633 651 671 692 715
11.5% 479 487 496 506 515 526 537 548 561 574 588 603 619 636 655 675
11.8% 462 470 478 486 495 505 515 525 537 549 561 575 589 605 622 640
12.0% 446 453 461 469 477 485 495 504 515 525 537 549 562 576 591 608
12.3% 431 438 445 452 459 467 476 485 494 504 515 526 538 550 564 578
12.5% 417 423 430 436 443 451 458 466 475 484 494 504 515 526 538 552
12.8% 404 410 415 422 428 435 442 449 457 466 474 484 494 504 515 527
13.0% 391 397 402 408 414 420 427 434 441 448 457 465 474 484 494 504
13.3% 379 384 389 395 400 406 412 419 425 432 440 448 456 465 474 484
13.5% 368 373 378 383 388 393 399 405 411 417 424 431 439 447 455 464
13.8% 358 362 366 371 376 381 386 391 397 403 410 416 423 430 438 446
14.0% 348 352 356 360 364 369 374 379 384 390 396 402 408 415 422 430
14.3% 338 342 346 350 354 358 363 367 372 378 383 389 395 401 407 414
14.5% 329 332 336 340 344 348 352 356 361 366 371 376 382 387 393 400
14.8% 320 323 327 330 334 338 342 346 350 355 359 364 369 375 380 386
CFA Institute Research Challenge 04.10.2011
16
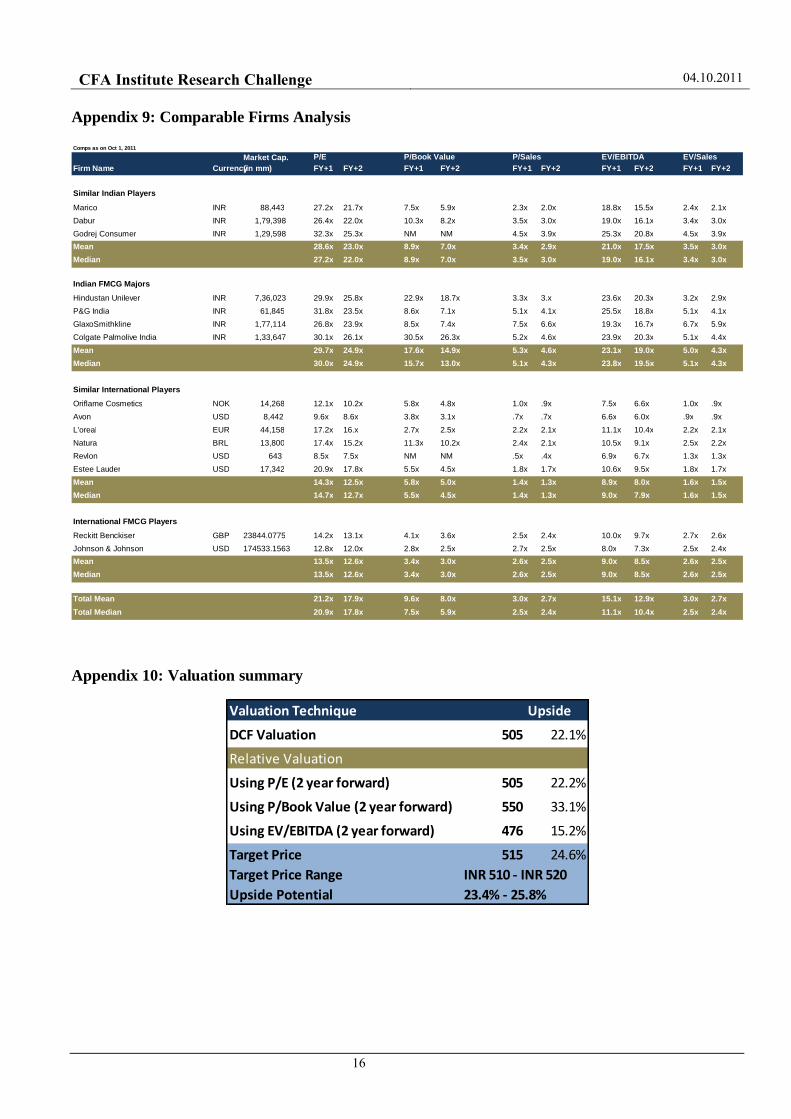
Appendix 9: Comparable Firms Analysis
Appendix 10: Valuation summary
Valuation Technique Upside
DCF Valuation 505 22.1%
Relative Valuation
Using P/E (2 year forward) 505 22.2%
Using P/Book Value (2 year forward) 550 33.1%
Using EV/EBITDA (2 year forward) 476 15.2%
Target Price 515 24.6%
Target Price Range INR 510 - INR 520
Upside Potential 23.4% - 25.8%
Comps as on Oct 1, 2011
Firm Name Currency FY+1 FY+2 FY+1 FY+2 FY+1 FY+2 FY+1 FY+2 FY+1 FY+2
Similar Indian Players Marico INR 88,443
27.2x 21.7x 7.5x 5.9x 2.3x 2.0x 18.8x 15.5x 2.4x 2.1x Dabur INR 1,79,398
26.4x 22.0x 10.3x 8.2x 3.5x 3.0x 19.0x 16.1x 3.4x 3.0x Godrej Consumer INR 1,29,598
32.3x 25.3x NM NM 4.5x 3.9x 25.3x 20.8x 4.5x 3.9x Mean 28.6x 23.0x 8.9x 7.0x 3.4x 2.9x 21.0x 17.5x 3.5x 3.0x Median 27.2x 22.0x 8.9x 7.0x 3.5x 3.0x 19.0x 16.1x 3.4x 3.0x
Indian FMCG Majors Hindustan Unilever INR 7,36,023
29.9x 25.8x 22.9x 18.7x 3.3x 3.x 23.6x 20.3x 3.2x 2.9x P&G India INR 61,845
31.8x 23.5x 8.6x 7.1x 5.1x 4.1x 25.5x 18.8x 5.1x 4.1x GlaxoSmithkline INR 1,77,114
26.8x 23.9x 8.5x 7.4x 7.5x 6.6x 19.3x 16.7x 6.7x 5.9x Colgate Palmolive India INR 1,33,647
30.1x 26.1x 30.5x 26.3x 5.2x 4.6x 23.9x 20.3x 5.1x 4.4x Mean 29.7x 24.9x 17.6x 14.9x 5.3x 4.6x 23.1x 19.0x 5.0x 4.3x Median 30.0x 24.9x 15.7x 13.0x 5.1x 4.3x 23.8x 19.5x 5.1x 4.3x
Similar International Players Oriflame Cosmetics NOK 14,268
12.1x 10.2x 5.8x 4.8x 1.0x .9x 7.5x 6.6x 1.0x .9x Avon USD 8,442
9.6x 8.6x 3.8x 3.1x .7x .7x 6.6x 6.0x .9x .9x L'oreal EUR 44,158
17.2x 16.x 2.7x 2.5x 2.2x 2.1x 11.1x 10.4x 2.2x 2.1x Natura BRL 13,800
17.4x 15.2x 11.3x 10.2x 2.4x 2.1x 10.5x 9.1x 2.5x 2.2x Revlon USD 643
8.5x 7.5x NM NM .5x .4x 6.9x 6.7x 1.3x 1.3x Estee Lauder USD 17,342
20.9x 17.8x 5.5x 4.5x 1.8x 1.7x 10.6x 9.5x 1.8x 1.7x Mean 14.3x 12.5x 5.8x 5.0x 1.4x 1.3x 8.9x 8.0x 1.6x 1.5x Median 14.7x 12.7x 5.5x 4.5x 1.4x 1.3x 9.0x 7.9x 1.6x 1.5x
International FMCG Players Reckitt Benckiser GBP 23844.0775 14.2x 13.1x 4.1x 3.6x 2.5x 2.4x 10.0x 9.7x 2.7x 2.6x Johnson & Johnson USD 174533.1563 12.8x 12.0x 2.8x 2.5x 2.7x 2.5x 8.0x 7.3x 2.5x 2.4x Mean 13.5x 12.6x 3.4x 3.0x 2.6x 2.5x 9.0x 8.5x 2.6x 2.5x Median 13.5x 12.6x 3.4x 3.0x 2.6x 2.5x 9.0x 8.5x 2.6x 2.5x
Total Mean 21.2x 17.9x 9.6x 8.0x 3.0x 2.7x 15.1x 12.9x 3.0x 2.7x Total Median 20.9x 17.8x 7.5x 5.9x 2.5x 2.4x 11.1x 10.4x 2.5x 2.4x
EV/EBITDA EV/Sales Market Cap. (in mm)
P/E P/Book Value P/Sales

CFA Institute Research Challenge 04.10.2011
17
Appendix 11: Emami’s presence in under-penetrated categories
Emami is engaged in the manufacturing and marketing of health, beauty and personal care products, which are based on
Ayurvedic formulations. Its product category can be broadly divided into the following categories:
Therapeutic Healers Personal Care Health
Sub Segments Cooling oil, pain reliever,
Ointment for headache
Fairness Cream,
Antiseptic Cream, Chyawanprash
Key Emami Brands Navratna Oil Fair & Handsome Sona-Chandi
Competitors Himgange Fair & Lovely Men’s
Active Dabur
This can also be interpreted in the following way:
Most of these segments, as is evident from the chart below are under-penetrated in India. This offers a huge potential to grow
in the relevant segments. Also, constant addition of new brands and products in its stable makes it a very attractive player in
the FMCG segment in India.
95.60%92.30%
88.60%
74.20%
64.30%
55.70%51.60%
17.10%
1.70% 1.30%
0%
25%
50%
75%
100%
Toilet Soap Washing powder
Detergent Bar Hair Oil Toothpaste Shampoo Talcum Powder
Fairness Cream
Antiseptic Cream
Cold Cream
Penetration in different FMCG segments in India
Emami has presence in these under
penetrated segments
Source: Company Data
Emami Ltd
Personal Care Health Care
Skin Care Oral Care Hair Care
OTC Products Ayurvedic Products
Therapeutic Healers
Reliever Oil
Balms

CFA Institute Research Challenge 04.10.2011
18
Appendix 12: Emami key brands
Source: Company Data
Market Size
(in INR mm) 2005 2010
Navratana Oil Cooling Oil 5,800 47 49
Boroplus Cream Antiseptic Cream 2,600 65 75
Zandu & Mentho Plus Balm Balm 4,900 13 57
Fair & Handsome Men’s Fairness Cream 2,100 - 60
Boroplus Powder Prickly Heat Powder 3,150 16 10
Navratana Cool Talc Cool Talc 3,150 - 13
Fast Relief Pain Reliever 4,000 7 9
Sona Chandi & Zandu Chyawanprash 2,100 10 15
Power Brand Segment
% Emami Share

CFA Institute Research Challenge 04.10.2011
19
Appendix 13: Zandu Acquisition
In 2008, Emami acquired Zandu Pharmaceutical Works Ltd, thereby getting access to Zandu‘s popular brands like Zandu Balm, Zandu Chawanprash, Zandu Kesari Jivan etc. Emami acquired a controlling stake of 70.34% (by investing Rs 713 cr) in Zandu Pharmaceutical Works Limited in November 2008; they also consolidated FMCG and realty businesses of Emami and Zandu in separate listed entities through de-merger under a court sanctioned scheme of arrangement.
Synergies
Strategic:
• Zandu as a brand was known for it ‗brand maintenance‘ modus operandi. In 2008, the ayurvedic segment in India was vast and growing
at a fast pace and Zandu enjoyed leadership position across western and southern India. However, its brand equity far outperformed revenues and earnings, leaving enough scope to scale up Zandu‘s operations without making significant investments. Hence, the acquisition made sense for Emami. Emami, with its brand building approach, was in a perfect position to leverage the position. • The net sales for Zandu was Rs 168.8 crs for FY08, growing at a CAGR of over 11% over the past four years. Emami, on the other hand, maintained a CAGR of 25% over the last 4 years. With its footprints in 60 countries across the globe spanning over Middle East, Europe, Africa, CIS and the SAARC, Emami had a far reaching network. Zandu‘s product portfolio consisted of more than 300 herbal and ayurvedic products, which complemented the portfolio of Emami.
Product portfolio and operational:
• With popular brands (Zandu Balm, Zandu Chyawanprash , Zandu Kesari Jivan) and a host of ethical and generic products (Zandu Pancharishta, Trishun, Sudarshan, Triphala, Satavarex and Zandopa, among others), Zandu was an attractive target for the FMCG firms. Emami, on the other hand, with powerful brands like Boroplus, Navratna, Fair & Handsome, Sona Chandi, Menthoplus and Fast Relief, was growing aggressively, thanks to strong brand equity, penetrative distribution network, innovative R&D, aggressive marketing and dynamic management. The combination of Zandu with Emami was tipped to help Emmai grow the trusted Zandu brands aggressively, extending synergic benefits to Emami as well.
• The business segments of the 2 firms were complementary in nature. Before acquiring Zandu, Emami‘s Boroplus cream, with 70%
market share, led the Rs 190 crore antiseptic creams market, and Navratna, with over 50% market share, headed the Rs 397 crore cooling oil category. With the Rs 120 crore Zandu Balm in its fold Emami led the ‗rubificient‘ (local pain ointment) category with a combined market share of more than 25% in 2008.
• Zandu‘s Special Sona Chandi and Kesari Jeevan Cyawanprash was tipped to give Emami a larger market share in the Rs 170 crore Cyawanprash category, which was (in 2008) currently dominated by Dabur having 61% of the market share.
• Emami, besides its FMCG business also had an exposure towards realty through its subsidiary, Emami Realty Ltd. Zandu also possessed real estate as a part of its non-core business in addition to its longstanding FMCG business. To unlock value and synergise operations, consolidation of FMCG and real estate businesses of both the companies, separately, was crucial.
Financial:
• Zandu was a zero debt firm in 2008. With the acquisition, Emami leveraged the strength of the Company‘s balance sheet without compromising its ability to service the ongoing or prospective interests of its shareholders. The acquisition was funded by a judicious mix of debt and internal resources. Thereafter, the mobilisation of QIP (Rs. 310 cr) neutralised a large part of debt. The enhanced earnings of 2009-10 were expected to pare net debt down to less than Rs. 100 cr in 2009- 10 and completely eliminate all debt by 2010-11. Even after the acquisition, it was felt that Emami was under-leveraged in 2008. Following the acquisition in November 2008, Emami‘s market capitalisation increased over 250% to Rs. 35 billion-plus.
Valuation
The multiples obtained for the acquisition were extremely high, as can be seen from the table. If we take the EV/Sales multiple in Consumer Retail Space, globally the multiple stands at around 1.25x to 1.5x. In Asia, the multiple does increase to an average of around 2.5x to 3x due to strong growth potential in untapped emerging economies. Taking into account the control premium, the above deal had a
multiple greater than 5.5x, which is gigantic. The firms saw huge synergies both operationally and strategically in the personal and health care segment. However, in India, we have seen high multiples in these segments. Even the Reckitt Benckiser and Paras Pharma had a valuation multiple of 8x. This underlines the strategic importance of the segment and hence reinforces Emami‘s belief of achieving the numero-uno position in the segment.
Deal Value (USD mm)
% stake Multiples
EV/Sales EV/EBITDA EV/EBIT P/E
29th May, 2008 56.7 23.62% 5.7x 33.1x 37.6x 58.1x
16th Oct, 2008 49.0 18.18% 6.4x 37.2x 42.2x 65.2x
30th Oct, 2010 56.3 20.00% 6.6x 38.9x 44.1x 68.2x

CFA Institute Research Challenge 04.10.2011
20
Appendix 14: Key segments of FMCG in India
Source: AC Nielsen
Source: AC Nielsen
2.8
2.12
1.7
1.51.4
1.1 1.1
0.90.8
0
0.5
1
1.5
2
2.5
3
Biscuits Refined Oil Toilet Soaps Washing Powder
Packaged Tea Non-refined oil
Skin Creams Salty Snacks Detergent Cakes/Bars
Toothpastes
2%
4%4%
22%
45%
12%
8%3%
Segment as a %age of ConsumerBaby Care
Household Products
Others
Personal Care
Food Products
Fabric Care
Hair Care
OTC Products
US$ in billions

CFA Institute Research Challenge 04.10.2011
21
Disclosures:
Ownership and material conflicts of interest:
The author(s), or a member of their household, of this report does not hold a financial interest in the securities of this company.
The author(s), or a member of their household, of this report does not know of the existence of any conflicts of interest that might bias the content or
publication of this report.
Receipt of compensation:
Compensation of the author(s) of this report is not based on investment banking revenue.
Position as a officer or director:
The author(s), or a member of their household, does [not] serves as an officer, director or advisory board member of the subject company.
Market making:
The author(s) does not act as a market maker in the subject company‘s securities.
Ratings guide:
Banks rate companies as either a BUY, HOLD or SELL.
Disclaimer:
The information set forth herein has been obtained or derived from sources generally available to the public and believed by the author(s) to be reliable, but
the author(s) does not make any representation or warranty, express or implied, as to its accuracy or completeness. The information is not intended to be used
as the basis of any investment decisions by any person or entity. This information does not constitute investment advice, nor is it an offer or a solicitation of
an offer to buy or sell any security. This report should not be considered to be a recommendation by any individual affiliated with CFA Institute or the CFA
Institute Research Challenge with regard to this company‘s stock.


![NCN[Eastern Region]](https://cdn.vdocuments.mx/doc/165x107/568c0e3e1a28ab955a8fc32e/ncneastern-region-56e5be9921da6.jpg)
