
1
Earnings Conference Call – Fourth Quarter 2016February 1, 2017
John Wiehoff, Chairman & CEOAndrew Clarke, CFO
Tim Gagnon, Director, Investor Relations

2
Safe Harbor Statement
Except for the historical information contained herein, the matters set forth in this presentation and the accompanying earnings release are forward-looking statements that represent our expectations, beliefs, intentions or strategies concerning future events. These forward-looking statements are subject to certain risks and uncertainties that could cause actual results to differ materially from our historical experience or our present expectations, including, but not limited to such factors as changes in economic conditions, including uncertain consumer demand; changes in market demand and pressures on the pricing for our services; competition and growth rates within the fourth party logistics industry; freight levels and increasing costs and availability of truck capacity or alternative means of transporting freight, and changes in relationships with existing truck, rail, ocean and air carriers; changes in our customer base due to possible consolidation among our customers; our ability to integrate the operations of acquired companies with our historic operations successfully; risks associated with litigation and insurance coverage; risks associated with operations outside of the U.S.; risks associated with the potential impacts of changes in government regulations; risks associated with the produce industry, including food safety and contamination issues; fuel prices and availability; changes to our share repurchase activity; the impact of war on the economy; and other risks and uncertainties detailed in our Annual and Quarterly Reports.
2
3
Results Q4 2016
Three months ended December 31
in thousands, except per share amounts and headcount
Twelve months ended December 31
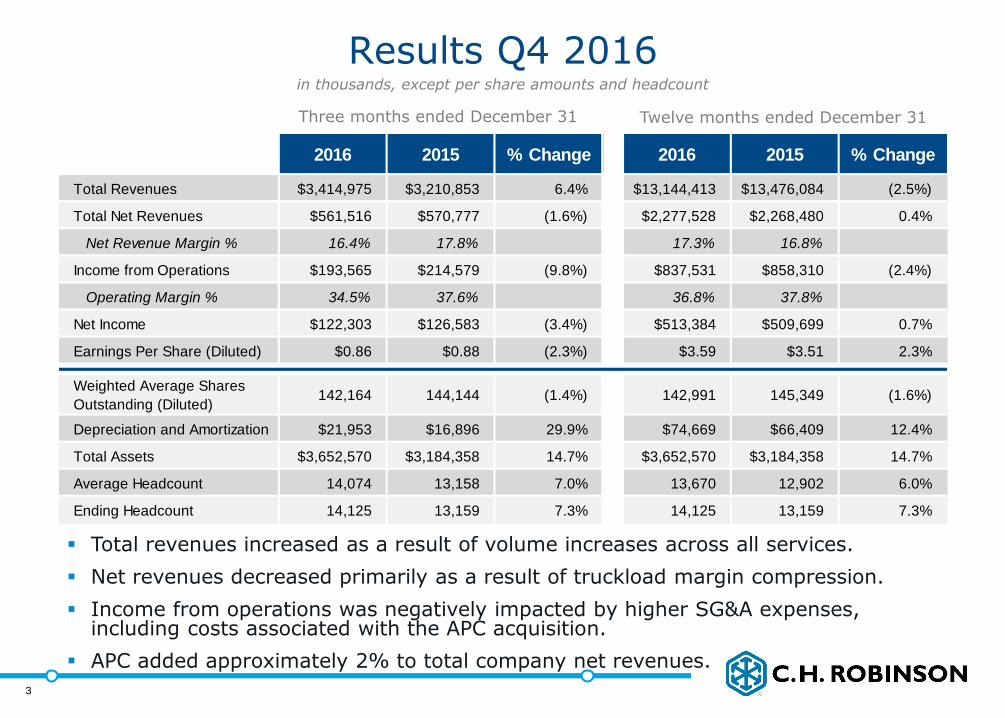
Total revenues increased as a result of volume increases across all services.
Net revenues decreased primarily as a result of truckload margin compression.
Income from operations was negatively impacted by higher SG&A expenses, including costs associated with the APC acquisition.
APC added approximately 2% to total company net revenues.
3
2016 2015 % Change 2016 2015 % Change
Total Revenues $3,414,975 $3,210,853 6.4% $13,144,413 $13,476,084 (2.5%)
Total Net Revenues $561,516 $570,777 (1.6%) $2,277,528 $2,268,480 0.4%
Net Revenue Margin % 16.4% 17.8% 17.3% 16.8%
Income from Operations $193,565 $214,579 (9.8%) $837,531 $858,310 (2.4%)
Operating Margin % 34.5% 37.6% 36.8% 37.8%
Net Income $122,303 $126,583 (3.4%) $513,384 $509,699 0.7%
Earnings Per Share (Diluted) $0.86 $0.88 (2.3%) $3.59 $3.51 2.3%
Weighted Average Shares
Outstanding (Diluted)142,164 144,144 (1.4%) 142,991 145,349 (1.6%)
Depreciation and Amortization $21,953 $16,896 29.9% $74,669 $66,409 12.4%
Total Assets $3,652,570 $3,184,358 14.7% $3,652,570 $3,184,358 14.7%
Average Headcount 14,074 13,158 7.0% 13,670 12,902 6.0%
Ending Headcount 14,125 13,159 7.3% 14,125 13,159 7.3%

4
Summarized Income Statement
Personnel expenses decrease was primarily driven by lower variable compensation incentives and partially offset by average headcount growth.
Selling, general, and administrative expenses increased due to higher claims, a higher provision for bad debt, and an increase in purchased services when compared to the fourth quarter of 2015.
The effective tax rate was 35.8% in the fourth quarter of 2016.
in thousands
Three months ended Dec. 31 Twelve months ended Dec. 31
4
2016 2015 % Change 2016 2015 % Change
Total Revenues $3,414,975 $3,210,853 6.4% $13,144,413 $13,476,084 (2.5%)
Total Net Revenues $561,516 $570,777 (1.6%) $2,277,528 $2,268,480 0.4%
Personnel Expenses $260,305 $268,190 (2.9%) $1,064,936 $1,051,410 1.3%
Selling, General, and Admin $107,646 $88,008 22.3% $375,061 $358,760 4.5%
Total Operating Expenses $367,951 $356,198 3.3% $1,439,997 $1,410,170 2.1%
Income from Operations $193,565 $214,579 (9.8%) $837,531 $858,310 (2.4%)
% of Net Revenue 34.5% 37.6% 36.8% 37.8%
Net Income $122,303 $126,583 (3.4%) $513,384 $509,699 0.7%

5
Other Financial Information
Total debt balance $1.24 billion
$500 million, 4.28% average coupon
$740 million drawn on revolver, 1.92% current rate as of December 31, 2016
in thousands
Three months ended Dec. 31 Twelve months ended Dec. 31
5
Cash Flow Data 2016 2015 % Change 2016 2015 % Change
Net Cash Provided by
Operating Activities$152,580 $253,893 (39.9%) $529,408 $718,336 (26.3%)
Capital Expenditures, Net $20,326 $11,831 71.8% $91,437 $44,642 104.8%
Balance Sheet Data December 31, 2016
Cash & Investments $247,666
Current Assets $1,972,914
Total Assets $3,652,570
Debt $1,240,000
Stockholders' Investment $1,257,847
6
Capital Distribution
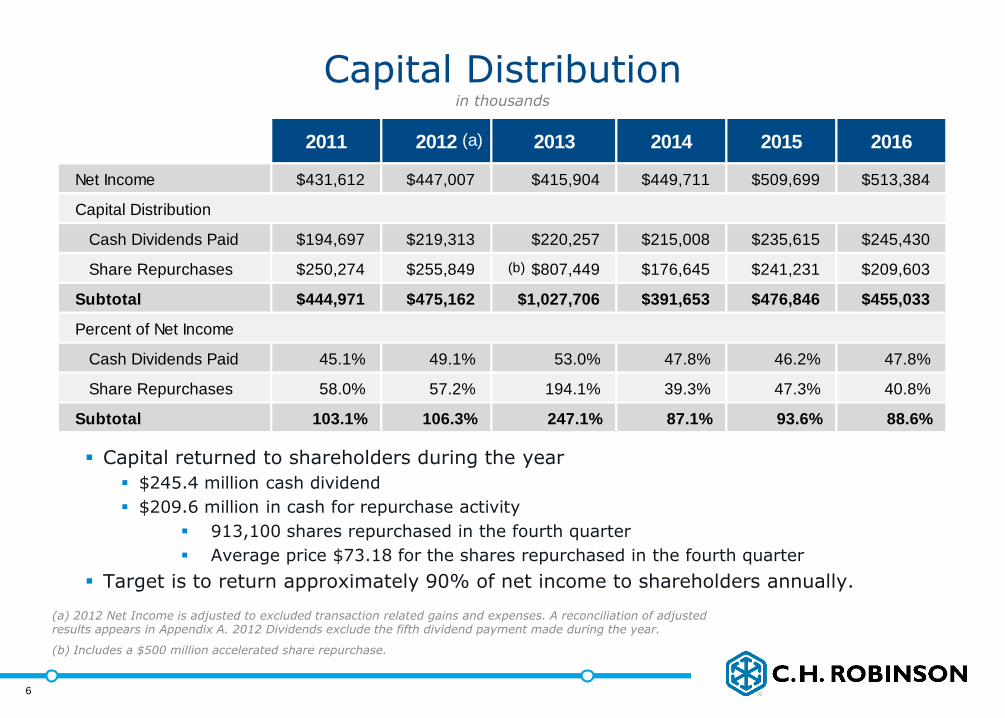
Capital returned to shareholders during the year
$245.4 million cash dividend
$209.6 million in cash for repurchase activity
913,100 shares repurchased in the fourth quarter
Average price $73.18 for the shares repurchased in the fourth quarter
Target is to return approximately 90% of net income to shareholders annually.
(a) 2012 Net Income is adjusted to excluded transaction related gains and expenses. A reconciliation of adjusted results appears in Appendix A. 2012 Dividends exclude the fifth dividend payment made during the year.
(b) Includes a $500 million accelerated share repurchase.
in thousands
6
2011 2012 2013 2014 2015 2016
Net Income $431,612 $447,007 $415,904 $449,711 $509,699 $513,384
Capital Distribution
Cash Dividends Paid $194,697 $219,313 $220,257 $215,008 $235,615 $245,430
Share Repurchases $250,274 $255,849 $807,449 $176,645 $241,231 $209,603
Subtotal $444,971 $475,162 $1,027,706 $391,653 $476,846 $455,033
Percent of Net Income
Cash Dividends Paid 45.1% 49.1% 53.0% 47.8% 46.2% 47.8%
Share Repurchases 58.0% 57.2% 194.1% 39.3% 47.3% 40.8%
Subtotal 103.1% 106.3% 247.1% 87.1% 93.6% 88.6%
(a)
(b)
7
Net Revenue by Service Line Q4 2016
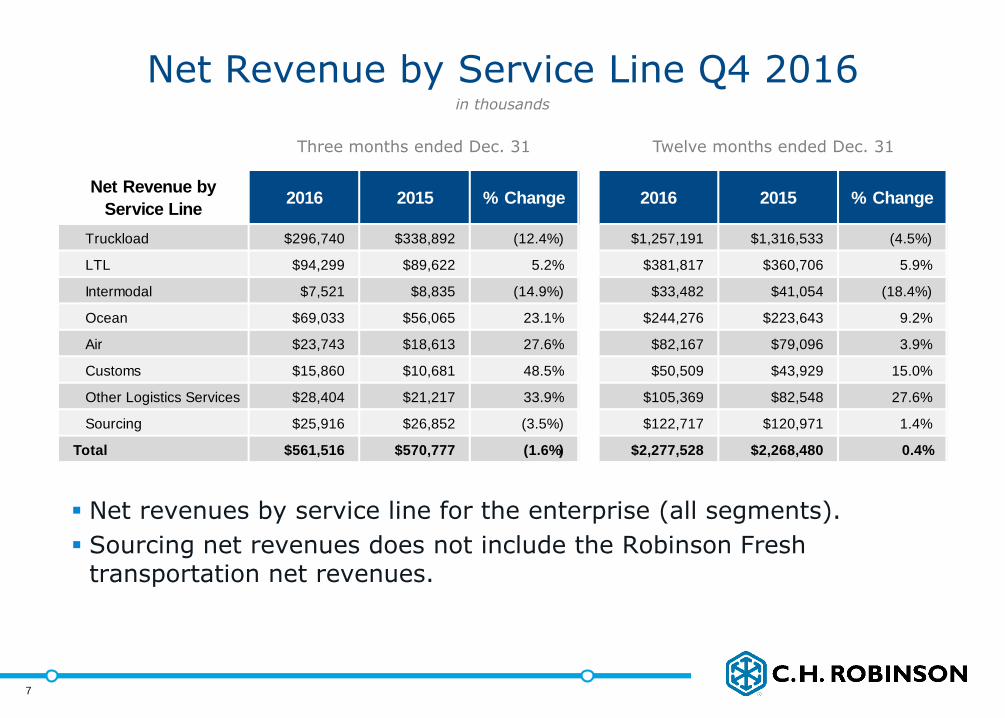
Net revenues by service line for the enterprise (all segments).
Sourcing net revenues does not include the Robinson Fresh transportation net revenues.
in thousands
Three months ended Dec. 31 Twelve months ended Dec. 31
7
Net Revenue by
Service Line2016 2015 % Change 2016 2015 % Change
Truckload $296,740 $338,892 (12.4%) $1,257,191 $1,316,533 (4.5%)
LTL $94,299 $89,622 5.2% $381,817 $360,706 5.9%
Intermodal $7,521 $8,835 (14.9%) $33,482 $41,054 (18.4%)
Ocean $69,033 $56,065 23.1% $244,276 $223,643 9.2%
Air $23,743 $18,613 27.6% $82,167 $79,096 3.9%
Customs $15,860 $10,681 48.5% $50,509 $43,929 15.0%
Other Logistics Services $28,404 $21,217 33.9% $105,369 $82,548 27.6%
Sourcing $25,916 $26,852 (3.5%) $122,717 $120,971 1.4%
Total $561,516 $570,777 (1.6%) $2,277,528 $2,268,480 0.4%
8
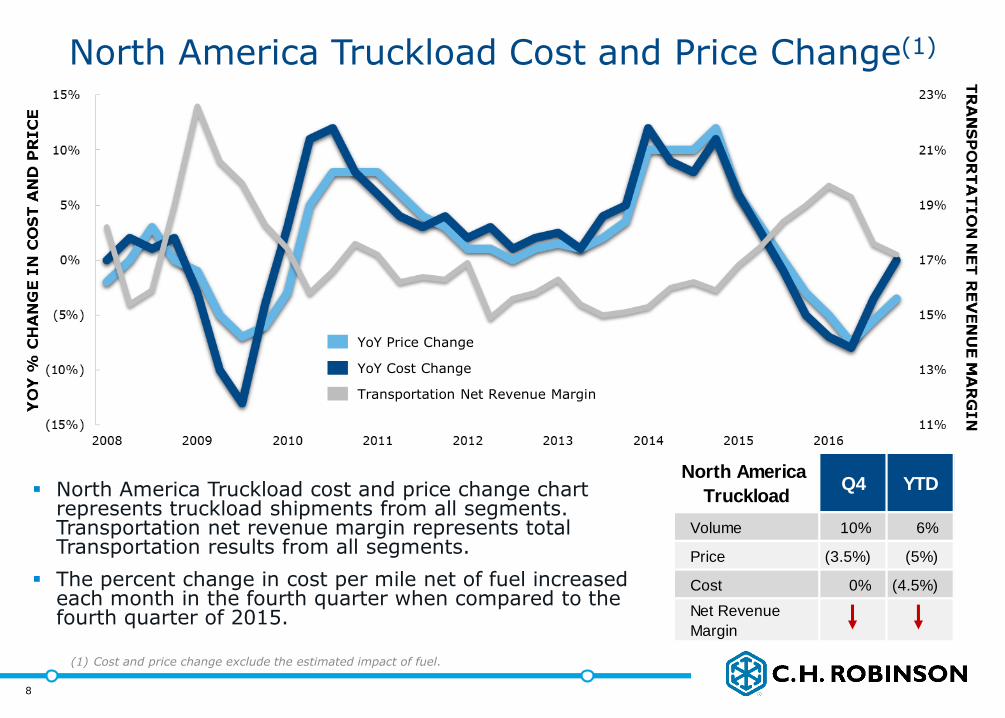
North America Truckload cost and price change chart represents truckload shipments from all segments. Transportation net revenue margin represents total Transportation results from all segments.
The percent change in cost per mile net of fuel increased each month in the fourth quarter when compared to the fourth quarter of 2015.
(1) Cost and price change exclude the estimated impact of fuel.
North America Truckload Cost and Price Change(1)
8
YoY Price Change
YoY Cost Change
Transportation Net Revenue Margin
North America
TruckloadQ4 YTD
Volume 10% 6%
Price (3.5%) (5%)
Cost 0% (4.5%)
Net Revenue
Margin
9
Transportation Results Q4 2016(1)
in thousands
Three months ended Dec. 31 Twelve months ended Dec. 31
(1) Includes results across all segments.
9
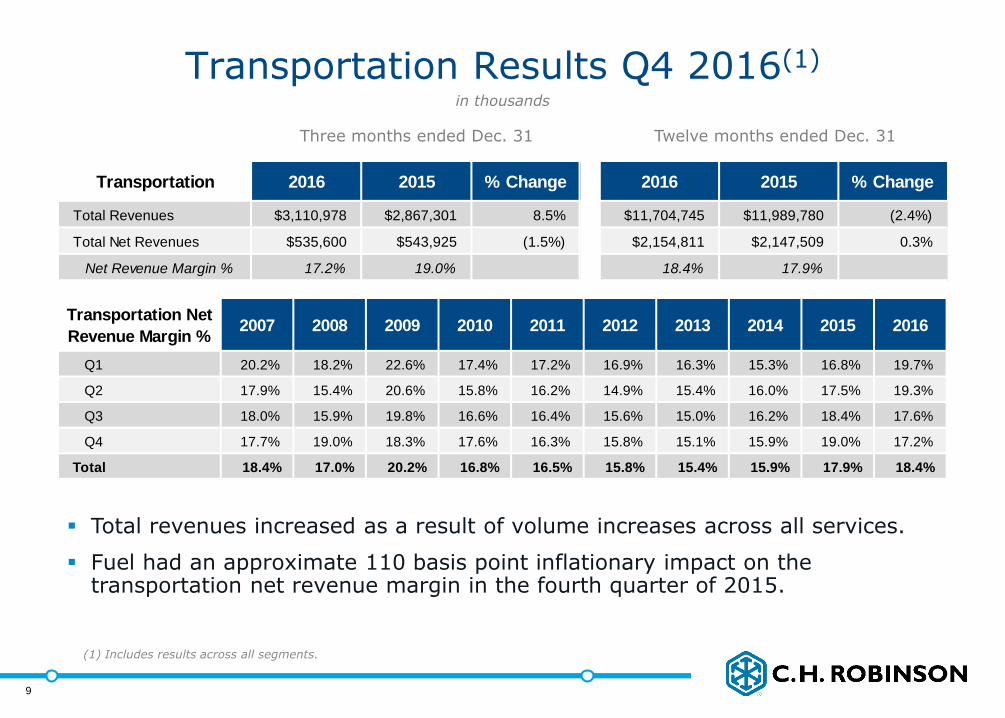
Total revenues increased as a result of volume increases across all services.
Fuel had an approximate 110 basis point inflationary impact on the transportation net revenue margin in the fourth quarter of 2015.
Transportation 2016 2015 % Change 2016 2015 % Change
Total Revenues $3,110,978 $2,867,301 8.5% $11,704,745 $11,989,780 (2.4%)
Total Net Revenues $535,600 $543,925 (1.5%) $2,154,811 $2,147,509 0.3%
Net Revenue Margin % 17.2% 19.0% 18.4% 17.9%
Transportation Net
Revenue Margin %2007 2008 2009 2010 2011 2012 2013 2014 2015 2016
Q1 20.2% 18.2% 22.6% 17.4% 17.2% 16.9% 16.3% 15.3% 16.8% 19.7%
Q2 17.9% 15.4% 20.6% 15.8% 16.2% 14.9% 15.4% 16.0% 17.5% 19.3%
Q3 18.0% 15.9% 19.8% 16.6% 16.4% 15.6% 15.0% 16.2% 18.4% 17.6%
Q4 17.7% 19.0% 18.3% 17.6% 16.3% 15.8% 15.1% 15.9% 19.0% 17.2%
Total 18.4% 17.0% 20.2% 16.8% 16.5% 15.8% 15.4% 15.9% 17.9% 18.4%

10
North American Surface Transportation (“NAST”) Results Q4 2016
Three months ended December 31 Twelve months ended December 31
Total revenue growth was driven by volume increases in all services.
Net revenues decreased primarily as a result of lower truckload pricing to customers on a year-over-year basis while purchased transportation costs were approximately flat.
Income from operations decreased as a result of the net revenue decrease.
in thousands, except headcount
10
(1) Does not include intercompany revenues.
2016 2015 % Change 2016 2015 % Change
Total Revenues(1) $2,281,435 $2,171,427 5.1% $8,737,716 $8,968,349 (2.6%)
Total Net Revenues $363,281 $398,279 (8.8%) $1,524,355 $1,564,917 (2.6%)
Net Revenue Margin % 15.9% 18.3% 17.4% 17.4%
Income from Operations $157,631 $183,964 (14.3%) $674,436 $718,329 (6.1%)
Operating Margin % 43.4% 46.2% 44.2% 45.9%
Depreciation and Amortization $5,575 $5,457 2.2% $22,126 $21,846 1.3%
Total Assets $2,088,611 $1,878,203 11.2% $2,088,611 $1,878,203 11.2%
Average Headcount 6,809 6,683 1.9% 6,773 6,575 3.0%

11
LTL(1) Quarter YTD
Pricing(2)
Volume 5% 7.5%
Net Revenue
Margin
Intermodal(1) Quarter YTD
Pricing(2)
Volume 13% (4.5%)
Net Revenue
Margin
Truckload(1) Quarter YTD
Pricing(2) (3.5%) (5%)
Cost(2) 0% (4.5%)
Volume 10% 5.5%
Net Revenue
Margin
NAST Results by Service Line Q4 2016Truckload, Less Than Truckload, and Intermodal
Net revenue decrease in the fourth quarter was a result of a lower price per mile net of fuel while purchased transportation cost net of fuel was approximately flat.
Volume growth in the fourth quarter was primarily the result of increased volume from both contractual and transactional customers.
Net revenue increase in the fourth quarter was primarily the result of 5% volume growth.
Net revenues decreased in the fourth quarter as a result of lower pricing on contractual business and less available transactional opportunities.
Volume increase in the fourth quarter driven by contractual volume growth, partially offset by a decrease in transactional business.
in thousands
Three months ended December 31 Twelve months ended December 31
TL
LTL
IMDL
11 (1) Represents price and cost YoY change for North America shipments across all segments.
(2) Pricing and cost measures exclude the estimated impact of the change in fuel prices.
Net Revenues 2016 2015 % Change 2016 2015 % Change
Truckload $261,065 $299,801 (12.9%) $1,108,287 $1,162,346 (4.7%)
LTL $90,629 $86,260 5.1% $366,137 $348,335 5.1%
Intermodal $7,138 $8,476 (15.8%) $31,308 $39,203 (20.1%)
Other $4,449 $3,742 18.9% $18,623 $15,033 23.9%
Total $363,281 $398,279 (8.8%) $1,524,355 $1,564,917 (2.6%)
12
Global Forwarding Results Q4 2016
Three months ended December 31 Twelve months ended December 31
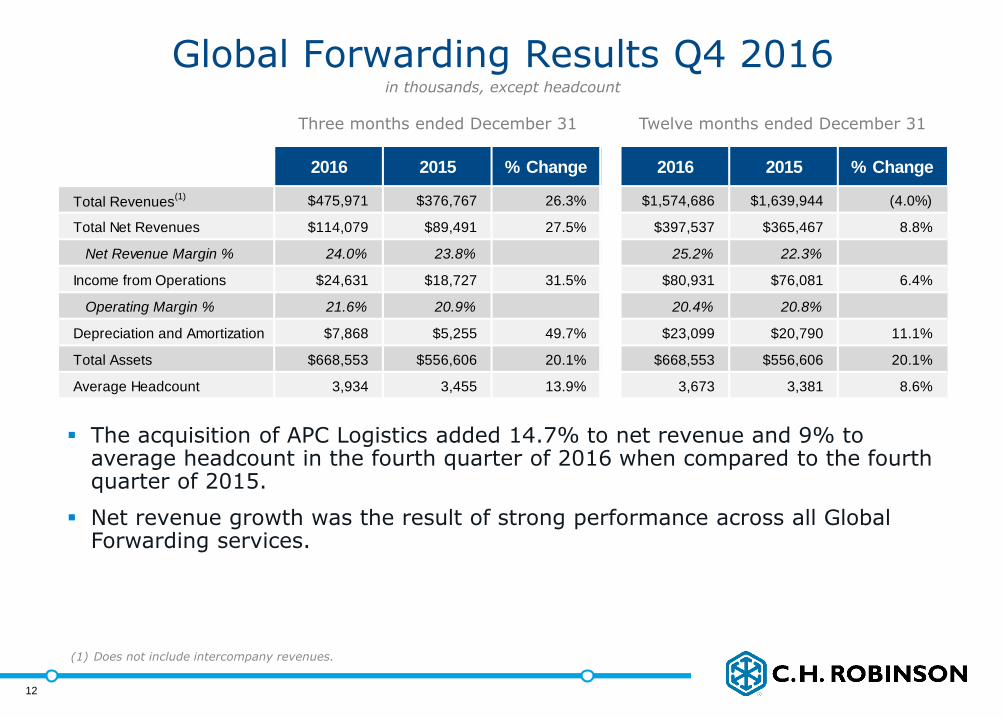
The acquisition of APC Logistics added 14.7% to net revenue and 9% to average headcount in the fourth quarter of 2016 when compared to the fourth quarter of 2015.
Net revenue growth was the result of strong performance across all Global Forwarding services.
in thousands, except headcount
12
(1) Does not include intercompany revenues.
2016 2015 % Change 2016 2015 % Change
Total Revenues(1) $475,971 $376,767 26.3% $1,574,686 $1,639,944 (4.0%)
Total Net Revenues $114,079 $89,491 27.5% $397,537 $365,467 8.8%
Net Revenue Margin % 24.0% 23.8% 25.2% 22.3%
Income from Operations $24,631 $18,727 31.5% $80,931 $76,081 6.4%
Operating Margin % 21.6% 20.9% 20.4% 20.8%
Depreciation and Amortization $7,868 $5,255 49.7% $23,099 $20,790 11.1%
Total Assets $668,553 $556,606 20.1% $668,553 $556,606 20.1%
Average Headcount 3,934 3,455 13.9% 3,673 3,381 8.6%
13
Air Quarter YTD
Volume
Pricing
Net Revenue
Margin
Ocean Quarter YTD
Volume
Pricing
Net Revenue
Margin
Global Forwarding Results by Service Line Q4 2016Ocean, Air, and Customs
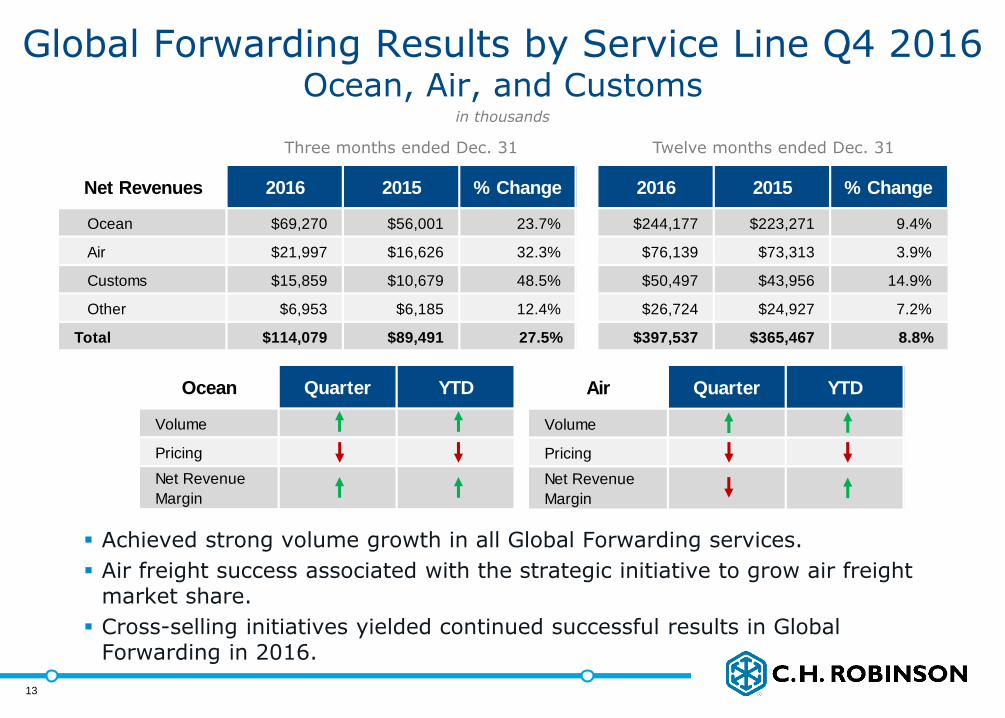
Achieved strong volume growth in all Global Forwarding services.
Air freight success associated with the strategic initiative to grow air freight market share.
Cross-selling initiatives yielded continued successful results in Global Forwarding in 2016.
in thousands
Three months ended Dec. 31 Twelve months ended Dec. 31
13
Net Revenues 2016 2015 % Change 2016 2015 % Change
Ocean $69,270 $56,001 23.7% $244,177 $223,271 9.4%
Air $21,997 $16,626 32.3% $76,139 $73,313 3.9%
Customs $15,859 $10,679 48.5% $50,497 $43,956 14.9%
Other $6,953 $6,185 12.4% $26,724 $24,927 7.2%
Total $114,079 $89,491 27.5% $397,537 $365,467 8.8%
14
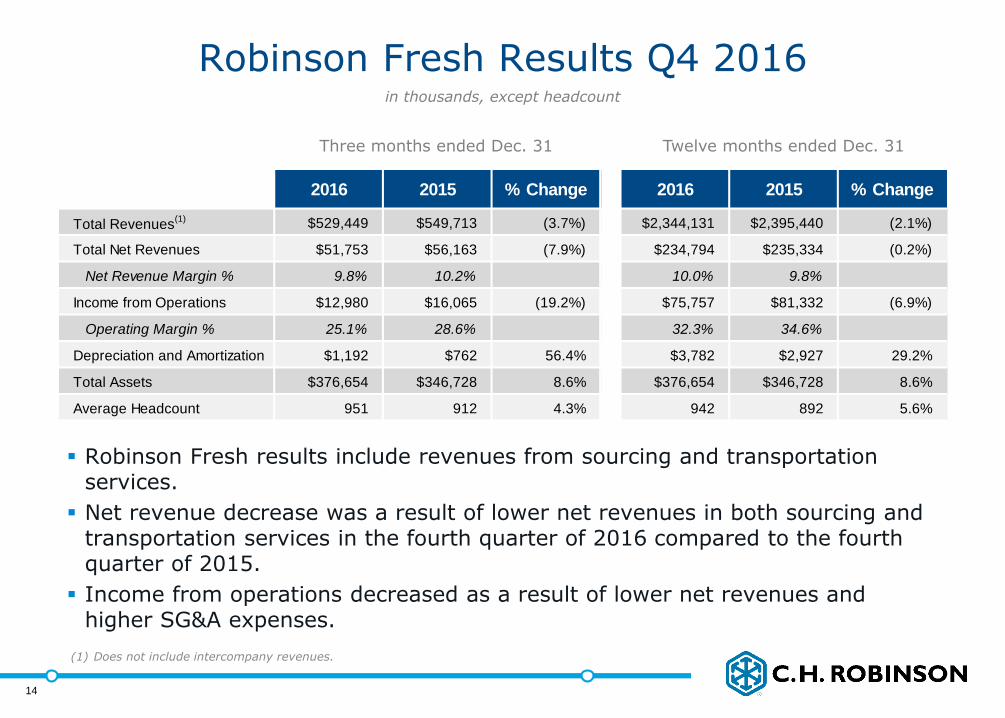
Robinson Fresh results include revenues from sourcing and transportation services.
Net revenue decrease was a result of lower net revenues in both sourcing and transportation services in the fourth quarter of 2016 compared to the fourth quarter of 2015.
Income from operations decreased as a result of lower net revenues and higher SG&A expenses.
in thousands, except headcount
Three months ended Dec. 31 Twelve months ended Dec. 31
Robinson Fresh Results Q4 2016
14
(1) Does not include intercompany revenues.
2016 2015 % Change 2016 2015 % Change
Total Revenues(1) $529,449 $549,713 (3.7%) $2,344,131 $2,395,440 (2.1%)
Total Net Revenues $51,753 $56,163 (7.9%) $234,794 $235,334 (0.2%)
Net Revenue Margin % 9.8% 10.2% 10.0% 9.8%
Income from Operations $12,980 $16,065 (19.2%) $75,757 $81,332 (6.9%)
Operating Margin % 25.1% 28.6% 32.3% 34.6%
Depreciation and Amortization $1,192 $762 56.4% $3,782 $2,927 29.2%
Total Assets $376,654 $346,728 8.6% $376,654 $346,728 8.6%
Average Headcount 951 912 4.3% 942 892 5.6%
15
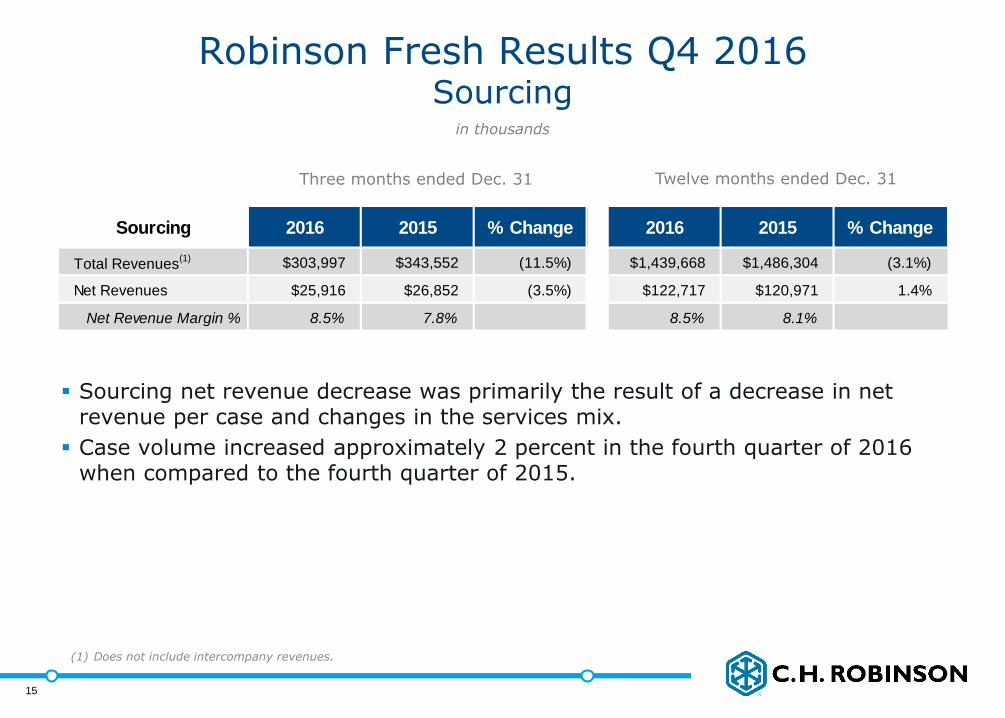
Robinson Fresh Results Q4 2016Sourcing
Sourcing net revenue decrease was primarily the result of a decrease in net revenue per case and changes in the services mix.
Case volume increased approximately 2 percent in the fourth quarter of 2016 when compared to the fourth quarter of 2015.
in thousands
Three months ended Dec. 31 Twelve months ended Dec. 31
15
(1) Does not include intercompany revenues.
Sourcing 2016 2015 % Change 2016 2015 % Change
Total Revenues(1) $303,997 $343,552 (11.5%) $1,439,668 $1,486,304 (3.1%)
Net Revenues $25,916 $26,852 (3.5%) $122,717 $120,971 1.4%
Net Revenue Margin % 8.5% 7.8% 8.5% 8.1%
16
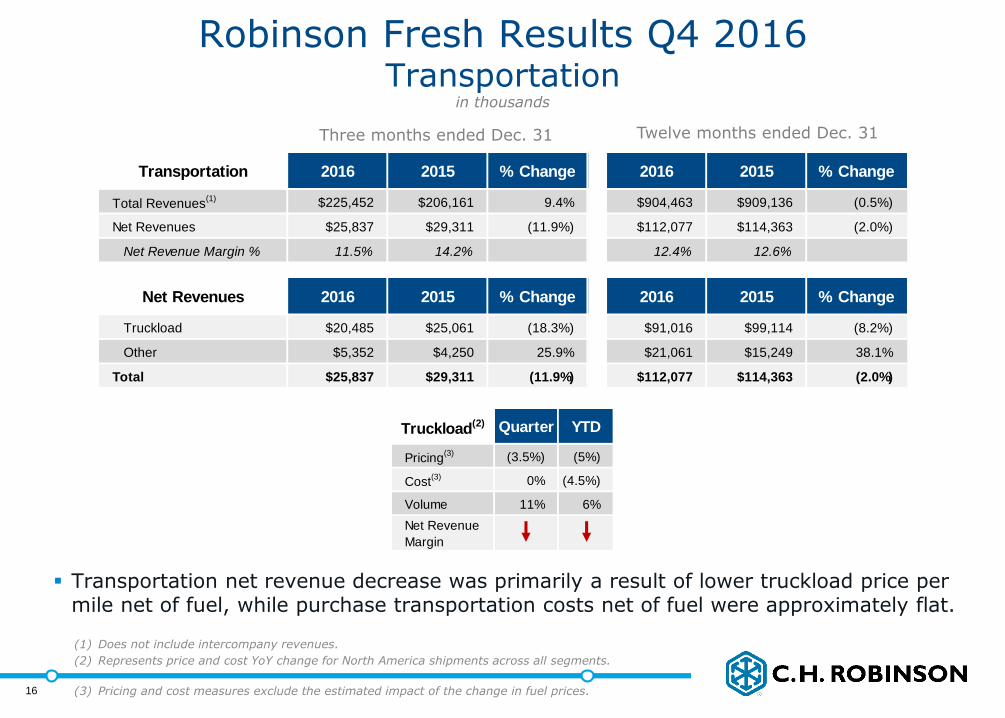
Robinson Fresh Results Q4 2016Transportation
Transportation net revenue decrease was primarily a result of lower truckload price per mile net of fuel, while purchase transportation costs net of fuel were approximately flat.
in thousands
Three months ended Dec. 31 Twelve months ended Dec. 31
16
Truckload(2) Quarter YTD
Pricing(3) (3.5%) (5%)
Cost(3) 0% (4.5%)
Volume 11% 6%
Net Revenue
Margin
(1) Does not include intercompany revenues.
(2) Represents price and cost YoY change for North America shipments across all segments.
(3) Pricing and cost measures exclude the estimated impact of the change in fuel prices.
Transportation 2016 2015 % Change 2016 2015 % Change
Total Revenues(1) $225,452 $206,161 9.4% $904,463 $909,136 (0.5%)
Net Revenues $25,837 $29,311 (11.9%) $112,077 $114,363 (2.0%)
Net Revenue Margin % 11.5% 14.2% 12.4% 12.6%
Net Revenues 2016 2015 % Change 2016 2015 % Change
Truckload $20,485 $25,061 (18.3%) $91,016 $99,114 (8.2%)
Other $5,352 $4,250 25.9% $21,061 $15,249 38.1%
Total $25,837 $29,311 (11.9%) $112,077 $114,363 (2.0%)
17
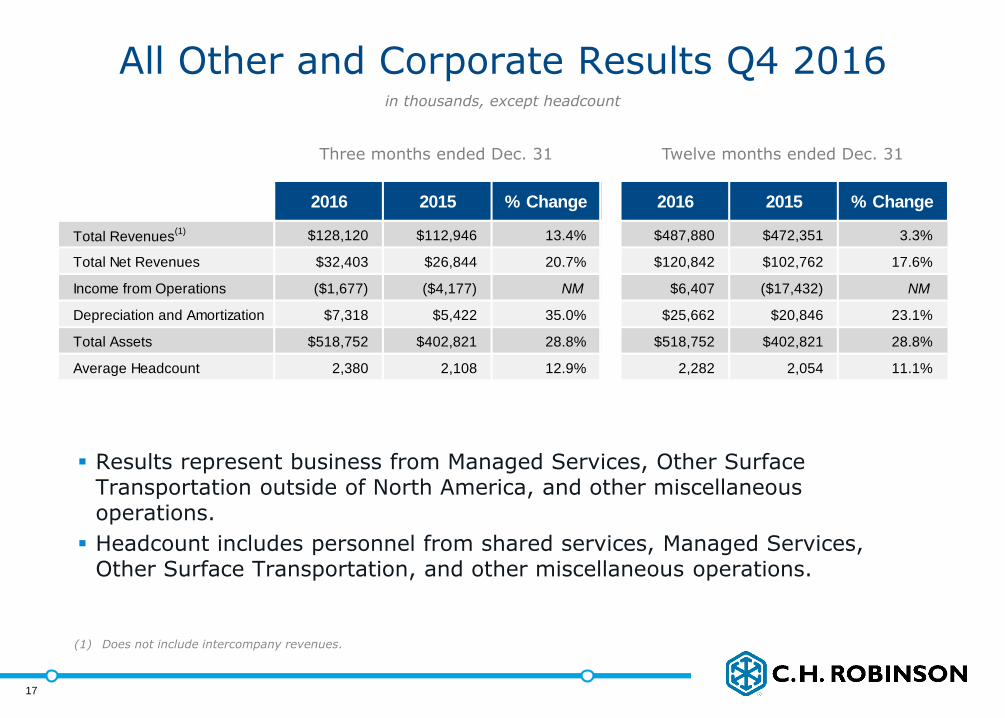
Results represent business from Managed Services, Other Surface Transportation outside of North America, and other miscellaneous operations.
Headcount includes personnel from shared services, Managed Services, Other Surface Transportation, and other miscellaneous operations.
All Other and Corporate Results Q4 2016in thousands, except headcount
Three months ended Dec. 31 Twelve months ended Dec. 31
17
(1) Does not include intercompany revenues.
2016 2015 % Change 2016 2015 % Change
Total Revenues(1) $128,120 $112,946 13.4% $487,880 $472,351 3.3%
Total Net Revenues $32,403 $26,844 20.7% $120,842 $102,762 17.6%
Income from Operations ($1,677) ($4,177) NM $6,407 ($17,432) NM
Depreciation and Amortization $7,318 $5,422 35.0% $25,662 $20,846 23.1%
Total Assets $518,752 $402,821 28.8% $518,752 $402,821 28.8%
Average Headcount 2,380 2,108 12.9% 2,282 2,054 11.1%
18
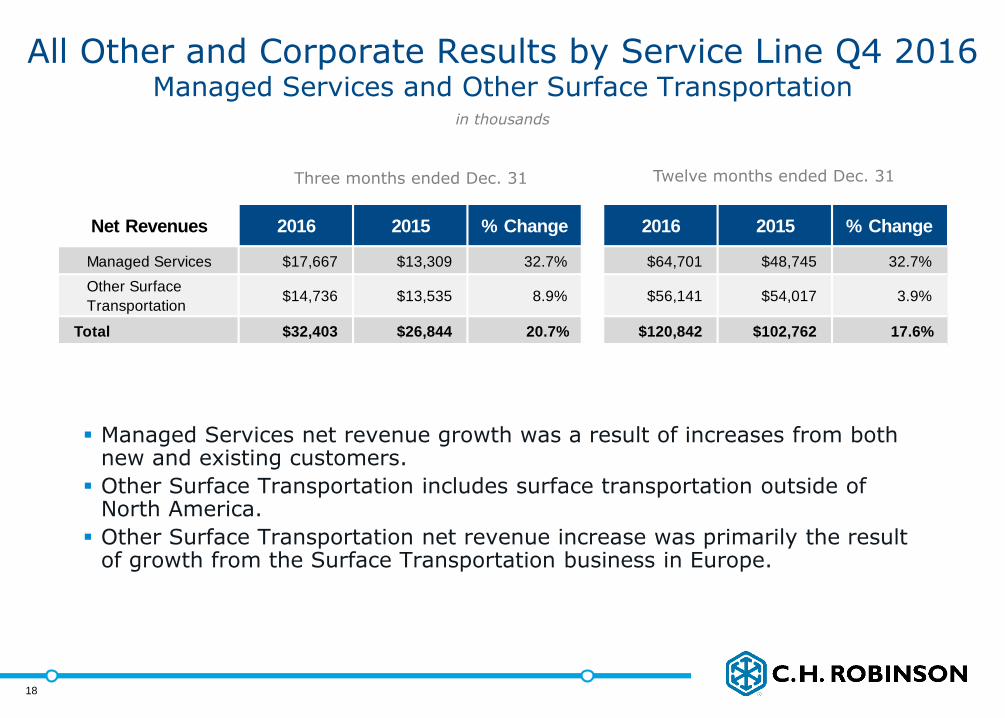
All Other and Corporate Results by Service Line Q4 2016Managed Services and Other Surface Transportation
Managed Services net revenue growth was a result of increases from both new and existing customers.
Other Surface Transportation includes surface transportation outside of North America.
Other Surface Transportation net revenue increase was primarily the result of growth from the Surface Transportation business in Europe.
in thousands
Three months ended Dec. 31 Twelve months ended Dec. 31
18
Net Revenues 2016 2015 % Change 2016 2015 % Change
Managed Services $17,667 $13,309 32.7% $64,701 $48,745 32.7%
Other Surface
Transportation$14,736 $13,535 8.9% $56,141 $54,017 3.9%
Total $32,403 $26,844 20.7% $120,842 $102,762 17.6%

19
Final Comments
January to date total company net revenue per day, including APC Logistics, has decreased approximately 1 percent when compared to January 2016.
We continue to execute through the challenging North America truckload cycle.
APC integration a top priority.
2017 Investment Priorities
Growing market share across all services
Technology
Digitization
Global expansion
19
20
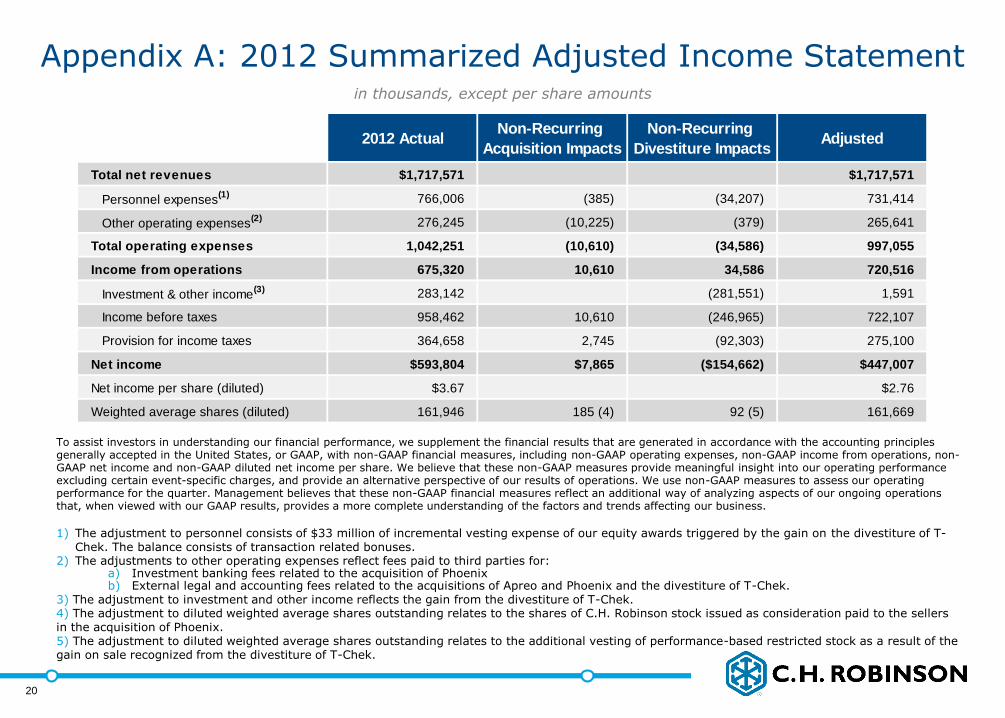
Appendix A: 2012 Summarized Adjusted Income Statement
To assist investors in understanding our financial performance, we supplement the financial results that are generated in accordance with the accounting principles generally accepted in the United States, or GAAP, with non-GAAP financial measures, including non-GAAP operating expenses, non-GAAP income from operations, non-GAAP net income and non-GAAP diluted net income per share. We believe that these non-GAAP measures provide meaningful insight into our operating performance excluding certain event-specific charges, and provide an alternative perspective of our results of operations. We use non-GAAP measures to assess our operating performance for the quarter. Management believes that these non-GAAP financial measures reflect an additional way of analyzing aspects of our ongoing operations that, when viewed with our GAAP results, provides a more complete understanding of the factors and trends affecting our business.
1) The adjustment to personnel consists of $33 million of incremental vesting expense of our equity awards triggered by the gain on the divestiture of T-Chek. The balance consists of transaction related bonuses.
2) The adjustments to other operating expenses reflect fees paid to third parties for:a) Investment banking fees related to the acquisition of Phoenixb) External legal and accounting fees related to the acquisitions of Apreo and Phoenix and the divestiture of T-Chek.
3) The adjustment to investment and other income reflects the gain from the divestiture of T-Chek.4) The adjustment to diluted weighted average shares outstanding relates to the shares of C.H. Robinson stock issued as consideration paid to the sellers in the acquisition of Phoenix.5) The adjustment to diluted weighted average shares outstanding relates to the additional vesting of performance-based restricted stock as a result of the gain on sale recognized from the divestiture of T-Chek.
in thousands, except per share amounts
2012 ActualNon-Recurring
Acquisition Impacts
Non-Recurring
Divestiture ImpactsAdjusted
Total net revenues $1,717,571 $1,717,571
Personnel expenses(1) 766,006 (385) (34,207) 731,414
Other operating expenses(2) 276,245 (10,225) (379) 265,641
Total operating expenses 1,042,251 (10,610) (34,586) 997,055
Income from operations 675,320 10,610 34,586 720,516
Investment & other income(3) 283,142 (281,551) 1,591
Income before taxes 958,462 10,610 (246,965) 722,107
Provision for income taxes 364,658 2,745 (92,303) 275,100
Net income $593,804 $7,865 ($154,662) $447,007
Net income per share (diluted) $3.67 $2.76
Weighted average shares (diluted) 161,946 185 (4) 92 (5) 161,669
20

21


