
1"
"
Downhole Seismic Velocity Logging Test Objective
In this experiment, Velocity Logging Test (Downhole method) is done to find the physical properties of the soil ground from site investigation. Velocity logging test includes the measurement of travel time, i.e., the time from generating the elastic wave which propagates through the ground till it is observed by the receiver and to predict the propagating velocities required by elastic waves generated; P-wave (primary wave) and S-wave (shear wave) to propagate through the soil ground concerned. Testing Method and Procedure
1. A wooden board or a metal plate which is fixed on the ground surface is hit to generate elastic waves (P-waves and S-waves). Observation of both waves is done by the receivers set up inside the borehole.
2. From the observed waveform data, readings for the initial point at which the waves were generated are made and then the time required by each of P-wave and S-wave to reach the position at which receivers are placed is determined. Travel time required by the waves for the different changed positions (depths) of receivers is measured.
3. Travel time data thus obtained is then arranged in the form of receiver’s position (depth) and travel time relationship. Measured travel time data is then corrected for the case where the generation of wave is done within the borehole itself. Plot a graph taking vertical axis for depth and horizontal axis for the corrected travel time.
4. Considering the measurement error, “travel~time curve” is plotted from the relationship of depth and travel time. From the slope (gradient) of the travel~time curve, P-wave and S-wave velocity profiles are predicted.
Report The report should contain the following items: 1. The objective, principle, method and procedure of the downhole seismic velocity logging test. 2. Analyze the test data following the procedure and obtain the velocity profiles for S-wave.
Note the followings: 1. Soil ground is assumed to be three horizontally stratified layers. For the depths of these soil
layer boundaries, refer to the data sheet/s distributed on the experimental day. 2. Consider the offset as 50 cm and ignore the effect of wave refraction.
3. Answer the following questions: a. Comment on the relationship between N-value, results of velocity profile and hardness of the
ground, etc., by referring to descriptions such as soil classification (rough classification of soil), report items (description of soil condition), N-value, etc. given on the data sheet provided.
b. Using the program uploaded at the site (http://wwwcatfish.dpri.kyoto4u.ac.jp/~goto/contents/), calculate the amplification of testing site. In addition, find a parameter setting so that amplification is larger than 5.0 times, and discuss difference of the ground at the experiment site.
4. Note your impressions about the test. ***Submit the reports of Standard Cone Penetration test, Centrifuge Modeling test, and Velocity Logging test, separately.

2"
"
�Record of horizontal movement (after Reverse Stacking)
Recording for 3m, 5m and 7m are done on the experimental day. Data of each group will be uploaded on the site given below.
http://wwwcatfish.dpri.kyoto4u.ac.jp/~goto/lecture.html"
"
"

3"
"
�Method of obtaining the amplification of testing site (Method of using the Program) URL:- http://wwwcatfish.dpri.kyoto-u.ac.jp/~goto/contents/ "
"
Execution steps: 1. Set up of the S-wave velocity structure. [2, 3 and 4]
S-waves measured for three soil layers from experimental data are set up. S-wave and thickness of the first layer i.e., the layer closet to ground surface are set us in Layer#1. Similarly thickness and S-waves of layer 2 and layer 3 are set up in Layer#2 and Layer#3, respectively.
2. Set up the frequency of the input wave. [5] Frequency of the waves reflected back from the bottom of the ground can be controlled. Although this frequency value can be set up as any arbitrary value, there is no problem to consider the initial value as 5.0Hz.
3. Press the Execution/Stop bottom. [1]
4. Note the amplification factor of the ground surface. [6]
"
S-wave
Depth
S-wave velocity for 3rd layer
Layer thickness
S-wave velocity for 1st layer
Layer thickness
S-wave velocity for 2nd layer

4"
"
Practice on Velocity Logging Test
Objective:
From the view point of velocity logging practices and problems, following items are learnt:
1. Method of knowing the internal condition of the ground. 2. One can understand meaning of “dynamic behavior of the ground”. 3. Importance of knowing the behavior of ground."
From the velocity logging test, following things are predicted:
1. Thickness of the ground layer. 2. P-wave and S-wave velocity of ground layer.
What is Velocity logging?
Assume the ground is made up following layers (stratification).
In this condition, it is difficult to know the thickness as well as behavior of the each ground layers.
Behavior ??
Behavior ??
Behavior ??
Behavior ??
Layer thickness ?
Layer thickness ?
Layer thickness ?

5"
"
By saying behavior of the ground, there are different things to consider. Here, consider the behavior of the ground as how fast the wave can propagate through that ground."
Let’s try to find the thickness, S-wave and P-wave of each layer.
Structure of Velocity Logging
How about using the borehole?
P-wave
S-wave
P-wave velocity?
P-wave velocity?
P-wave velocity?
P-wave velocity?
Layer thickness ?
Layer thickness ?
Layer thickness ?
S-wave velocity?
S-wave velocity?
S-wave velocity?
S-wave velocity?
Borehole

6"
"
Measure the time required for propagating the waves.
Measurement is made at different depths.
Stacking
Methods of selecting the signal structure by piling up the waveforms recorded.
Random summation
Noise
Noise
Diminish
Signal
Signal
Increment range
Changes every time
Random summation

7"
"
Records of vertical movement
Reverse Stacking
Records obtained by hitting from different directions are piled up
Method of selecting the components of S-wave
Records of horizontal moment
Originates similarly Reverses
Component of P-wave
Component of P-wave
Component of S-wave
Component of S-wave
Negates each other Diminish
Increment range
Hitting from side
Hitting from side

8"
"
Reading of arrival time of wave
Reading of arrival time of wave for each depth is read.
P-wave is obtained from the record of vertical movement S-wave is obtained from the record of horizontal movement
Way of finding velocity of ground layer
Relationship between the propagation of time and depth can be obtained.
Time
Depth
Records of vertical movement Records of horizontal movement

9"
"
If the arrival time calculated is for the case as shown below (the top of the borehole), then correction for the time is necessary to make.
An appropriate travel~time curve is plotted."
Depth
Corrected time
Travel~time curve
Corrected time
Depth
10"
"
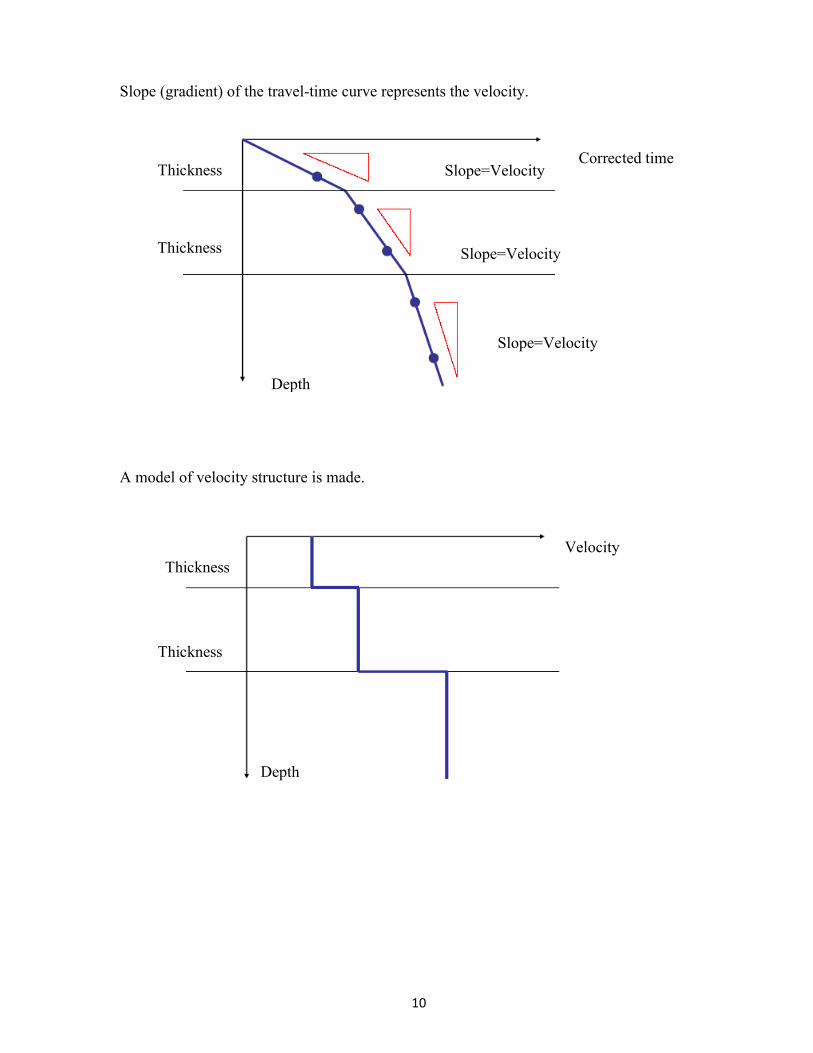
Slope (gradient) of the travel-time curve represents the velocity.
A model of velocity structure is made.""
"
Corrected time
Depth
Thickness
Thickness
Slope=Velocity
Slope=Velocity
Slope=Velocity
Thickness
Thickness
Velocity
Depth


