Download - DIVERSITY OF A NORTHERN ROCKY INTERTIDAL COMMUNITY: THE INFLUENCE OF BODY SIZE AND SUCCESSION

3462
Ecology, 82(12), 2001, pp. 3462–3478q 2001 by the Ecological Society of America
DIVERSITY OF A NORTHERN ROCKY INTERTIDAL COMMUNITY:THE INFLUENCE OF BODY SIZE AND SUCCESSION
CHRISTOPHER W. MCKINDSEY1 AND EDWIN BOURGET
Groupe Interuniversitaire de Recherches Oceanographiques du Quebec (GIROQ), Departement de Biologie,Universite Laval, Quebec, Canada G1K 7P4
Abstract. Hypotheses about diversity in succession in rocky intertidal communities inthe Saint Lawrence estuary, Canada, were tested to evaluate whether results from the studyof large organisms may be extrapolated to the entire community of macroinvertebrates.Varying the lower size limit of the organisms considered in the analyses (organisms .0.5,1, 2, 4, and 8 mm) altered the observed trends in taxonomic richness and diversity (thelatter calculated in terms of abundance, H , and biomass, H ). Diversity increased through9 9no wt
succession when only the largest organisms were considered, but H was maximal in9no
midsuccession for the .2 and .4 mm size groupings and in late succession for the .1and .0.5 mm size groupings, and H was greatest at the second stage of succession for9wt
all other size groupings. Richness increased through succession for all size groupings.Whole-crevice manipulations (mimic crevices, modified to leave only the dominant
structural taxa) were used to examine competing hypotheses about whether variation inrichness and diversity through succession was a function of the structural heterogeneityprovided by the dominant taxa (structural-heterogeneity hypothesis), or a function of theage of the communities per se (ecological-time hypothesis). The first is supported if thecommunities in mimic crevices resemble those in control crevices for each successionalstage; the second is supported if mimic crevices resemble each other more than they docontrol crevices at the same successional stage. Within three months, control and mimiccommunities largely resembled each other in terms of H , H , and richness, and the trends9 9no wt
mirrored those observed four months earlier, thus supporting the structural-heterogeneityhypothesis. Nonparametric multivariate analyses that removed the manipulated species fromthe analyses also supported this conclusion. Results from 12 mo after the initiation of theexperiment (following the winter, during which the communities within many of the creviceswere greatly altered) further supported the structural-heterogeneity hypothesis.
Key words: body size; community structure; diversity; ecological time; Mytilus edulis; Mytilustrossulus; richness; rocky intertidal; Saint Lawrence estuary; species engineering; structural hetero-geneity; succession.
INTRODUCTION
Animals display a wide range of body sizes, bothintra- and interspecifically, with smaller animals beingboth more speciose and abundant (Elton 1927, Hutch-inson 1959, Peters 1983). However recent studies onclosely related groups, such as orders of insects (Sie-mann et al. 1996), fishes (Hall and Greenstreet 1996),and mammals (Marquet et al. 1995), have found thatboth species richness and abundance are greatest forintermediately sized organisms. This was also the casewithin diverse assemblages of intertidal organisms incentral Chile (Marquet et al. 1995), but not in Panama(Navarrete and Menge 1997) where only species rich-ness was maximal for intermediate size classes of or-ganisms. Because of this, and because differently sizedorganisms perceive their environments at different spa-
Manuscript received 10 April 2000; revised 18 December2000; accepted 8 January 2001.
1 Present address: Environmental Sciences Division, Fish-eries and Oceans Canada, Maurice Lamontagne Institute, P.O.Box 1000, 850 Route de la Mer, Mont-Joli, Quebec, CanadaG5H 3Z4. E-mail: [email protected]
tial scales, occupy different ecological niches, and maybe sampled at different spatial scales (May 1978, Morseet al. 1985, Nee et al. 1991, Shorrocks et al. 1991),studies examining only the largest organisms may notaccurately reflect what occurs in the community as awhole.
Examples of such studies form the basis of the ‘‘key-stone predation’’ (Paine 1969, 1974), ‘‘diffuse preda-tion’’ (Connell 1978, Menge and Lubchenco 1981), and‘‘intermediate disturbance’’ (Connell 1978, Sousa1979, 1984) hypotheses, all of which suggest that somedisturbance agent keeps the abundance of the compet-itively dominant species in check, thereby increasinglocal diversity (Robles 1997). Different studies havevariously supported and refuted these hypotheses. Onepossible explanation for conflicting results is the in-consistency in the size of the organisms considered inthe different studies. For example, various size clas-sifications have been used to define the community ofmacroorganisms associated with mussel beds (Table 1).Thus, any general conclusions drawn from the sum ofthese studies may be compromised by the diversity ofmethods used.

December 2001 3463BODY SIZE AND INTERTIDAL DIVERSITY
TABLE 1. Variation in sampling techniques used in 58 stud-ies of the macrofauna associated with mussel communities.
Sampling method No. studies using method
Lab (sieve mesh size)0.25 mm0.5 mm1.0 mm2.0 mmNot given
213
41
23Field measurements
Percent coverField counts
1213
Notes: The methods are broken down into two large groups:samples processed in the lab and those where measurementswere taken in the field. The total count does not equal thenumber of published studies included, as some studies usemore than one method. Field studies commonly used twomethods to describe community structure.
For example, Paine’s classic studies on the effectsof the ‘‘keystone predator,’’ Pisaster ochraceus, con-sidered only macroscopic species competing for pri-mary space and did not consider smaller ones associ-ated with the mussel beds (Paine 1966, 1991, Paineand Levin 1981). Although primary space may be mo-nopolized by a dominant species, many or most dis-placed species may find refuge upon or within the struc-ture provided by the dominant species (Dayton 1971,Lee and Ambrose 1989, Lohse 1993). The increase inphysical substrate provided by these dominant species,variably known as ‘‘foundation species’’ (Dayton1972), ‘‘keystone modifiers’’ (Mills et al. 1993), orphysical ecosystem engineers (sensu Jones et al. 1997),over that of the actual substrate may be substantial. Forexample, the mussel Mytilus californianus provides;30 times more hard substrate than the underlying rocksubstrate (Suchanek 1994), and barnacles may triplethe surface area of the substrate they occupy (Osmanand Whitlatch 1995). Moreover, the diversity of habitattypes may also be increased by the presence of eco-system engineers. For example, the interstices betweendominant species such as mussels also provide habitatfor organisms that would otherwise be unable to sur-vive on a simple rock substrate (Suchanek 1985, Tsu-chiya and Nishihira 1985, 1986, Witman 1985). Indeed,.300 species and a diversity rivaling that of any tem-perate ecosystem have been reported to be associatedwith the mussel beds studied by Paine (Suchanek1994).
Similarly, in the same paper where Frontier (1985)suggests that succession ultimately decreases diversity,he later states for an algal community that ‘‘. . . Fucuscan develop almost exclusively in belts parallel to thecoast, and eliminates the rest of the community; allspecies can be seen, however, under the alga, but stunt-ed and scarce’’ (Frontier 1985:276). Looking at themacroalgae and sessile invertebrates occupying pri-mary space on boulders, Sousa (1979, 1984) found thatdiversity was maximal in communities maintained at
intermediate stages of succession and declined there-after. In contrast, the diversity of the small invertebratesassociated with these algal communities plateaus at in-termediate levels of succession (Dean and Connell1987a). These examples suggest that diversity may notnecessarily decrease with increasing dominance of acommunity by one or a small number of species. Theydo, however, indicate that the size of the organismsbeing considered may greatly influence the conclusionsdrawn from experiments.
The apparent structure of benthic communities isknown to change markedly with the size of the meshused to extract the fauna (Reish 1959, Schlater andWooldridge 1996) and numerous authors have stressedthe importance of using a range of size resolutions tostudy biodiversity (Peters 1983, Bell and Woodin 1984,Thompson et al. 1996, Hurlbert 1997). Despite this,little research has been directed at examining howstudying different size ranges of organisms can influ-ence patterns of diversity.
The goals of this study are therefore twofold: (1) Toexamine how the range of body sizes considered mayinfluence one of the fundamental paradigms in ecologyrelating diversity to ecological processes in the inter-tidal zone. Specifically, we tested the hypothesis thatthe trend in diversity of macrofaunal communitiesthrough succession is a function of the size of the or-ganisms considered. (2) To examine why diversity in-creases with succession, we tested two alternative hy-potheses. The first is the ecological time hypothesis(Pianka 1988), which states that communities that haveexisted for longer periods have had a greater time forcolonization to occur and thus more species have im-migrated into those communities, increasing diversity.The second, the structural heterogeneity hypothesis,states that older communities are more structurallycomplex habitats and may provide a greater number ofhabitat types, thereby increasing diversity. This is sim-ilar to Pianka’s (1988) spatial heterogeneity hypothesis,except that we explicitly include the element of time(age). These hypotheses were tested through a seriesof experiments done in a rocky intertidal communityon the eastern coast of Canada.
METHODS
Experimental system
Succession in the intertidal zone of the SaintLawrence Estuary and northeastern Gulf occurs alonga fairly slow but predictable path (Archambault andBourget 1983), with mussel communities limited most-ly to crevices and other irregularities in the substratedue to an intensive annual scouring by ice (Bergeronand Bourget 1986). Although algae (Ulothricale andUlvale) generally recruit quickly, only to be replacedby Fucoids (Fucus spp.) (Archambault and Bourget1983), Fucus vesiculosus (hereafter, Fucus) is typicallythe first and usually sole species of macroalgae that

3464 CHRISTOPHER W. MCKINDSEY AND EDWIN BOURGET Ecology, Vol. 82, No. 12
FIG. 1. General overview of the major processes influencing succession in intertidal crevice communities in the SaintLawrence Estuary (after Bergeron and Bourget [1986]). Numbers adjacent to crevices indicate the successional stage ofcrevices in years. Arrows represent the major pathways occurring in the development of communities and give the mainfactors contributing to changes in them. Stage IV shows all zones: rock, Fucus spp., barnacles (Semibalanus balanoides),and mussels (Mytilus edulis and M. trossulus).
recruits to crevices within the study area (C. W.McKindsey, personal observation). Within crevices,barnacles (Semibalanus balanoides) are the first animalspecies to arrive in any number in the first year. Theseare followed in subsequent years by mussels (Mytilusedulis and M. trossulus, hereafter referred to as simplymussels or Mytilus) that increase in size and contributeto an underlying matrix of pseudofeces, sand, etc.,which eventually destabilizes the community as mus-sels become less solidly attached to the rock substrate(Fig. 1).
Thus, the development of communities within crev-ices to their most advanced stage takes at least four tofive years, and Bergeron and Bourget (1986) state thatcrevices in the study site (Capucins, Quebec, on thesouth shore of the St. Lawrence estuary [498039 N,668519 W], described in Bergeron and Bourget [1986])may be classified as being at one of four distinct suc-cessional stages (Fig. 1). These four stages (I–IV, foryear classes 0, 1, 2, and 4–5, respectively) are (I) barecrevice; (II) crevices with Fucus and barnacles; (III)crevices with Fucus, barnacles, and small mussels; and(IV) crevices with Fucus, barnacles, large mussels, andan underlying matrix of sand, pseudofaeces, etc. Eachof these species (or closely related ones) has beenshown to play engineering roles in other systems (Bert-ness and Leonard 1997).
General concept of experiment
We tested the hypothesis that the pattern of diversityobserved through succession is a function of the size
of the organisms considered by comparing crevices atdifferent stages of succession for different size group-ings of organisms. Testing whether changes in diversityare a function of the age or structural heterogeneity ofthe communities is less straightforward as the two fac-tors are confounded. To overcome this obstacle, wecreated crevices containing only those engineering spe-cies that provide the primary structure found in crevicesat successional stages I–IV (Fig. 1, Table 2); that is,mussels, barnacles and Fucus (‘‘mimic crevices’’).Communities within these mimic crevices were thencompared to others within a series of natural, unma-nipulated (‘‘control’’) crevices at the same stage of suc-cession at subsequent sampling dates. If diversity issimilar among all manipulated crevices, then the eco-logical time hypothesis is supported. However, if thediversity in mimic crevices more closely resembles thatof the corresponding controls, then the structural het-erogeneity hypothesis is supported.
Crevice selection.—All study crevices were in themidintertidal zone. To ensure that all organisms withina quadrat could be sampled, only crevices with smoothwalls and formed from a single rocky outcrop wereconsidered. Variance among crevices was minimizedby considering only those 0.75–1.50 m in length, withwalls 0.20–0.50 m high and a total opening of 70–1108, such that each wall was 0–608 to the vertical andhad long axes #108 to the horizontal. Using these cri-teria, a total of 27, 25, 25, and 122 crevices at suc-cessional stages I–IV, respectively, were selected forstudy in May 1995.

December 2001 3465BODY SIZE AND INTERTIDAL DIVERSITY
TABLE 2. Criteria used for classifying crevices as being at one of four possible successionalstages.
Succes-sionalstage
Engineering species
Fucus S. balanoides Mytilus spp.
I If present, only germ-lings or holdfasts fol-lowing ice abrasion
Not present If present, few in number, notforming a continuous band
II Present Present If present, few in number, notforming a continuous band
III Present Present Present, small (,2 cm length),forming a continuous band
IV Present Present Present, large (.2 cm length),forming a continuous band,overlying a well-developedmatrix
Note: Crevices were classified as being at the stage where all criteria were met.
Creation of mimic crevices.—Potential differencesamong mimic crevices at different successional stages,due to their initial successional stage, were minimizedby using only stage-IV crevices to create mimics.Stage-I mimics were created by removing all speciespresent by scraping with a spatula and wire brush, fol-lowed by burning with a propane torch. This last stepwas to limit the recruitment of barnacles, which weresettling at the time the crevices were created and areknown to be attracted by adult barnacle extracts (e.g.,Miron et al. (1996) and references therein). Stage-IImimics were created by removing all mussels in thebottom of crevices by scraping and by removing allorganisms associated with both barnacles and Fucuswith fine tweezers followed by repeated rinsing withwater and a high-pressure spray from a hand-pumpedcompressed air sprayer. For stage-III and -IV mimics,crevices were treated as for stage-II mimics, but sup-plemented with live mussels. Mussels placed in stage-III mimics passed through a 6.3-mm screen, but wereretained on a 4.0-mm screen; those used for stage-IVmimics were retained by a 6.3-mm screen. We stan-dardized the quantity of mussels among mimics of thesame stage by multiplying crevice length by the meanmass of mussels observed in five replicate crevicestaken for each successional stage (7.5 and 12.5 g ofmussels/cm for stage-III and -IV mimics, respectively).Mussels were held in place with 0.5-cm weld wire se-cured by screws in anchors for a period of five to sevendays to allow them to attach to the crevice substrate.A cursory examination of the crevices one week afterremoval of the weld wire indicated that most musselsremained in the mimic crevices.
Experimental procedure
Six samples of each type of control crevice weretaken in May 1995, and then six of each type of controland mimic crevices in both September 1995 and May1996. Following the May 1995 sampling, all remainingcrevices at stages I, II, and III and 24 crevices at stageIV were selected as controls for sampling on subse-
quent sample dates. The remaining stage-IV creviceswere manipulated to create 22, 22, 24, and 24 type I,II, III, and IV mimics, respectively, in early June.
Sampling and sorting protocol.—A number of stud-ies (e.g., Schwinghamer 1981, Warwick 1984, Gee andWarwick 1994a) have identified breaks in size distri-butions of benthic organisms in the 0.5–1-mm range,separating meiofauna from macrofauna. We thus use0.5 mm as the lower cut-off for macrofauna in thisstudy.
Flexible sampling quadrats 15 3 35 cm were usedthroughout. This quadrat size was chosen since, whenplaced flat along both sides of the crevices, it includedthe upper limit of algae on both sides of the crevicesand ensured that a substantial amount of each substrate(i.e., mussels, barnacles, Fucus, and rock) was includedin the total sample. Each sample was taken from arandomly determined location in the middle third ofthe crevices. Sampling was done such that each sub-strate and its associated fauna were kept separate. Forexample, all those species on the alga itself or that weredirectly reliant on its structure for maintaining theirposition (e.g., mussels that had settled around the stipe)were collected separately from those associated withthe other substrates. This allowed for separate analysesof the organisms associated with the rock, Fucus, bar-nacle, and mussel zones as well as the ‘‘total’’ crevicecommunities (all zones combined). All samples werefixed in 4% formalin in seawater and stored in 70%ethanol until processed. Samples were passed thougha series of five sieves with mesh sizes of 0.5, 1, 2, 4and 8 mm and indices of community structure calcu-lated for five size groupings of organisms (for organ-isms .0.5 mm, .1 mm, .2 mm, .4 mm, and .8mm). Size ranges with successfully smaller minimaincluded all those organisms that would have beentrapped on that screen alone, had the larger screens nototherwise been in place. The organisms collected oneach screen were identified to the lowest specific levelpossible, counted, and blotted masses measured to thenearest 0.0001 g (Mettler AE200 balance; Mettler, Co-

3466 CHRISTOPHER W. MCKINDSEY AND EDWIN BOURGET Ecology, Vol. 82, No. 12
lumbus, Ohio). Although sieve size is not an absolutemeasure of body size, Edgar (1990) and Gee and War-wick (1994a) have shown the results obtained by suchmethods yield good approximations of actual body sizemeasurements.
The adequacy of the sampling method was evaluatedby constructing species accumulation curves (Colwelland Coddington 1994) using all of the samples takenon the three sampling periods for each successionalstage–size class–substrate combination. The curveswere based on 50 random permutations of the order bywhich samples were included in the calculations. Typ-ically, the number of samples at which the curvesreached asymptotes was greatest for the total crevicecommunities and least for the barnacle zone. For thetotal crevice community, the asymptote was typicallynear four to six samples (lower for the largest sizegroupings and to a maximum of seven samples for thetwo size groupings that included the smallest sizegroupings of organisms for stage-IV crevices). Similarcurves constructed to examine changes in Shannon–Weiner diversity found asymptotes typically near threeto four samples and never more than five. Thus, ouruse of six samples should be adequate to describe thecommunities examined in this study.
Statistical analysis
Two of the most commonly used indices of speciesdiversity (Lande 1996), species richness (S) and Shan-non-Weiner diversity (H9, calculated using natural logs;Magurran 1988), were calculated as indices of com-munity structure. Following the suggestions of Tokeshi(1993), Shannon-Weiner diversity was calculated bothin terms of abundance (H ) and biomass (H ). Al-9 9no wt
though Fucus contributes significantly to the physicalstructure of the crevices studied, the number of indi-vidual algae present in each sample could not be de-termined, thus making indices based on abundancesimpossible to calculate. For continuity among data sets,only the animal fraction of the sample was included inthe calculation of H , H , and S.9 9no wt
The effectiveness of mimic crevices at imitating thephysical structure provided by the engineering speciesin control crevices was evaluated by two-way MAN-OVA (Stage 3 Exco; hereafter, ‘‘Stage’’ refers to thesuccessional stage of crevices, with ‘‘Exco’’ as the var-iable indicating whether the crevices were control orexperimental) were performed using the manipulatedspecies and size groupings (i.e., Mytilus, S. balanoides,and Fucus $4 mm) as dependent variables. SeparateMANOVAs were performed for the abundance and bio-mass data, the former not including Fucus in the anal-ysis.
The experimental design necessitated the use of astatistical model that takes into account the covariancebetween the different size groupings for the analysisof H , H , and S. A series of repeated-measures AN-9 9no wt
OVA models were thus used to analyze the data, with
the different body size groupings being considered asthe repeated variable. Although unusual, this procedureis appropriate because the same sample was measuredrepeatedly under a number of different conditions(varying size resolution), much as in a typical repeated-measures design. As the assumption of sphericity wasrarely met, the significance of factors involving bodysize (Size) was evaluated using an Huynh-Feldt ad-justment (Girden 1992, Green 1993). A simple one-way model was used to examine the spring 1995 datawith Stage as the main factor, whereas a crossed modelwith Stage and Exco as main factors was used to ex-amine the fall 1995 and spring 1996 data. Althoughsize was usually significant, this effect was not inter-preted, as it is not of interest for this particular exper-iment; rather, only differences between successionalstages and how the patterns change with respect to thesieve mesh size used (i.e., interactions) are interpreted.If the within-subjects (Size) by between-subjects(Stage and Exco) main effects were significant, thesewere then examined further by computing all possiblecontrasts between mesh sizes by using the differencesbetween the mesh sizes as the data analyzed (Girden1992). Multiple comparisons for a given diversity in-dex and community or zone were controlled for bysequential Bonferroni corrections (Rice 1989). Ratherthan restating the ‘‘within-’’ and ‘‘between-subjects’’extensions for the different variables, the name of thevariables will be subsequently used.
Separate analyses were done for the total crevicecommunity and for each of the four zones sampled(mussel, barnacle, Fucus, and rock zones). This vio-lates the assumption of independence of the data sets.However, short of sampling five times as many crev-ices, an impossibility due to the limited number ofcrevices in the study site, there was no way around thisproblem. There were often cells of the experimentaldesign in which all the values were equivalent (e.g.,all data points were equal to zero). As this lack ofvariance leads to insurmountable problems in ANOVA,entire levels of one or two variables were dropped fromsome analyses to maintain balanced designs. The lackof variance within cells represents real biological phe-nomena (e.g., there were no large mussels in crevicesat stage I of succession in the spring of 1995 (C. W.McKindsey, personal observation), and we considercells containing only ‘‘0’’ values to differ significantlyfrom the others in the experimental design, althoughthis was not tested statistically. The criteria used todrop cells are based on logic and the ecology of thesystems and are detailed in the appropriate sectionsbelow. The data were commonly square-root or ln (x1 1) transformed (detailed in Results) to meet the as-sumptions of normality and homoscedasticity (con-firmed by examination of residual plots).
Pearson correlations between the values of H , H ,9 9no wt
and S for each of the four zones and those for the totalcrevice community were calculated for the spring 1995

December 2001 3467BODY SIZE AND INTERTIDAL DIVERSITY
data set. As these data are obviously not independent,we attach no significance to the correlations measuredand simply use the values as descriptors.
Detecting differences in community structure may attimes be problematic using parametric analyses (Clarke1993). For example, since quantitative indices such asS and H9 are based only on the number or proportionalmasses of species, communities with completely dif-ferent structures may be judged to not differ. Further-more, standard parametric multivariate analyses cannotbe used to compare communities, as the assumption ofmultivariate normality are rarely met due to the pre-dominance of zeros in data arrays. Thus artificial andcontrol crevices were compared using nonmetric mul-tidimensional scaling (MDS) based on Bray–Curtissimilarities calculated on fourth-root transformed data(Field et al. 1982). Statistical differences between or-dinal groupings were determined by two-way analysesof similarities (ANOSIM; Clarke 1993).
All parametric analyses were performed using theSAS system for Windows (SAS Institute 1996) and allnonparametric analyses were performed using PRIMER(Carr 1996). Species accumulation and diversity curveswere constructed using R. K. Colwell’s EstimateS (Ver-sion 5).2
RESULTS
The spring 1995 data set was used to test the hy-pothesis that the pattern of diversity of macrofaunaseen in succession is a function of the size of the or-ganisms considered, whereas the fall 1995 and spring1996 data sets were used primarily to determine wheth-er diversity is a function of the age or the structuralheterogeneity of a community.
Influence of body size on succession:spring 1995 data
In terms of abundance, the dominant species ob-served were, in order, Mytilus, Littorina saxatilis, L.obtusata, oligochaetes, and the isopod Jaera marina(data not shown). In terms of biomass, the dominantspecies were Fucus, Mytilus, S. balanoides, L. saxatilis,and L. obtusata. The lower size limit of the organismsexamined influenced the trend in diversity (by abun-dance H and species richness, S) of total crevice com-9no
munities through succession, but not always that of thefour component zones. Only trends observed within themussel zone and, to a lesser extent, the Fucus zone,consistently mirrored those of the total crevice com-munity. Because of the paucity of organisms .8 mm,these cells were dropped from all analyses, as werecells for Stage 5 I for all except the total crevice com-munity and rock zone. Similarly, Size . 4 mm wasalso dropped from all analyses for both the barnacleand rock zones. Stage 5 I was dropped from the anal-
2 URL: ^http://viceroy.eeb.uconn.edu/estimates&.
yses of H and H (diversity by biomass) for the rock9 9no wt
zone.Total crevice community.—The significant Size 3
Stage interaction for both H and S supports the hy-9no
pothesis of a reversal of trends in diversity as the small-er organisms are dropped from the calculation of theindices (Table 3). Few organisms except for L. saxatilisand L. obtusata were present in stage-I crevices andthese were rarely .4 mm. Thus, H , H , and S of9 9no wt
stage-I crevices were consistently lower than that ofcrevices at more advanced stages. For crevices at stagesII, III, and IV (Fig. 2a, c), H and S increased with9no
successional stage when all the sizes of organisms areincluded in the analyses. However, this trend reversesas the smaller organisms are dropped from the calcu-lation of H , whereas S stabilizes for organisms .29no
mm. Although not compared with the other size classesstatistically, the trend for Size . 8 mm was for allindices to increase with successional stage. This is sim-ilar to the trends observed for both H and S for Size9no
. 0.5 mm and Size . 1 mm, but differs from the trendsobserved for all size classes for H , which was greatest9wt
at stage-II succession and decreased thereafter (Fig.2b).
Mussel zone.—Overall, the patterns seen for themussel zone (Fig. 2) mirror those seen for the totalcrevice community. This is reflected by the usually highcorrelation between the mussel zone variables andthose calculated for the total community (Table 4).However, the Size 3 Stage interaction was significantonly for H (Table 3). Despite the decreasing and in-9no
creasing trends apparent visually for H and S, re-9wt
spectively, neither of these trends were statistically sig-nificant.
Barnacle zone.—As the community ages, more andlarger organisms become associated with and depen-dent upon the presence of barnacles. This is reflectedin the general trend for all indices calculated to increasewith increasing successional stage (Fig. 2g–i). How-ever, none of the diversity indices differed with respectto either the Stage 3 Size interaction or Stage (Table3). As such, all indices were weakly correlated to thoseof the total crevice community (Table 4).
Fucus zone.—As with the mussel zone, the visualtrends for H , H , and S mirror those seen for the total9 9no wt
crevice community for all size groupings (Fig. 2) andagree with the hypothesis of a change in the pattern ofdiversity through succession as the size of the organ-isms included in the analyses changes. However, Stage3 Size interactions and Stage effects are never signif-icant (Table 3), and correlations with the total crevicecommunity for each of the indices measured are rarelyas strong as those for the mussel zone (Table 4).
Rock zone.—Although the Stage 3 Size interactionwas significant for H (Table 3), no differences were9wt
apparent using contrasts (Fig. 2n). Likewise, differ-ences indicated by the significant Stage effect for S(Table 3) were not identified by post hoc tests. All
3468 CHRISTOPHER W. MCKINDSEY AND EDWIN BOURGET Ecology, Vol. 82, No. 12
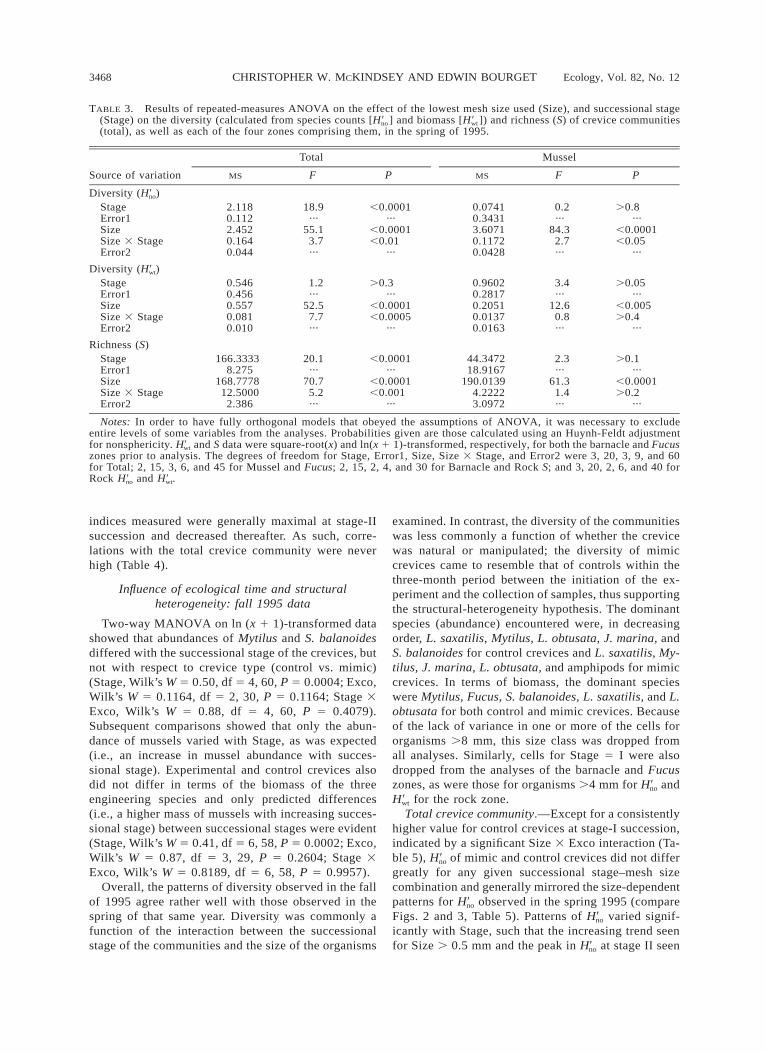
TABLE 3. Results of repeated-measures ANOVA on the effect of the lowest mesh size used (Size), and successional stage(Stage) on the diversity (calculated from species counts [H ] and biomass [H ]) and richness (S) of crevice communities9 9no wt
(total), as well as each of the four zones comprising them, in the spring of 1995.
Source of variation
Total
MS F P
Mussel
MS F P
Diversity (H )9no
StageError1SizeSize 3 StageError2
2.1180.1122.4520.1640.044
18.9···
55.13.7···
,0.0001···
,0.0001,0.01
···
0.07410.34313.60710.11720.0428
0.2···
84.32.7···
.0.8···
,0.0001,0.05
···
Diversity (H )9wt
StageError1SizeSize 3 StageError2
0.5460.4560.5570.0810.010
1.2···
52.57.7···
.0.3···
,0.0001,0.0005
···
0.96020.28170.20510.01370.0163
3.4···
12.60.8···
.0.05···
,0.005.0.4
···
Richness (S)StageError1SizeSize 3 StageError2
166.33338.275
168.777812.50002.386
20.1···
70.75.2···
,0.0001···
,0.0001,0.001
···
44.347218.9167
190.01394.22223.0972
2.3···
61.31.4···
.0.1···
,0.0001.0.2
···
Notes: In order to have fully orthogonal models that obeyed the assumptions of ANOVA, it was necessary to excludeentire levels of some variables from the analyses. Probabilities given are those calculated using an Huynh-Feldt adjustmentfor nonsphericity. H and S data were square-root(x) and ln(x 1 1)-transformed, respectively, for both the barnacle and Fucus9wt
zones prior to analysis. The degrees of freedom for Stage, Error1, Size, Size 3 Stage, and Error2 were 3, 20, 3, 9, and 60for Total; 2, 15, 3, 6, and 45 for Mussel and Fucus; 2, 15, 2, 4, and 30 for Barnacle and Rock S; and 3, 20, 2, 6, and 40 forRock H and H .9 9no wt
indices measured were generally maximal at stage-IIsuccession and decreased thereafter. As such, corre-lations with the total crevice community were neverhigh (Table 4).
Influence of ecological time and structuralheterogeneity: fall 1995 data
Two-way MANOVA on ln (x 1 1)-transformed datashowed that abundances of Mytilus and S. balanoidesdiffered with the successional stage of the crevices, butnot with respect to crevice type (control vs. mimic)(Stage, Wilk’s W 5 0.50, df 5 4, 60, P 5 0.0004; Exco,Wilk’s W 5 0.1164, df 5 2, 30, P 5 0.1164; Stage 3Exco, Wilk’s W 5 0.88, df 5 4, 60, P 5 0.4079).Subsequent comparisons showed that only the abun-dance of mussels varied with Stage, as was expected(i.e., an increase in mussel abundance with succes-sional stage). Experimental and control crevices alsodid not differ in terms of the biomass of the threeengineering species and only predicted differences(i.e., a higher mass of mussels with increasing succes-sional stage) between successional stages were evident(Stage, Wilk’s W 5 0.41, df 5 6, 58, P 5 0.0002; Exco,Wilk’s W 5 0.87, df 5 3, 29, P 5 0.2604; Stage 3Exco, Wilk’s W 5 0.8189, df 5 6, 58, P 5 0.9957).
Overall, the patterns of diversity observed in the fallof 1995 agree rather well with those observed in thespring of that same year. Diversity was commonly afunction of the interaction between the successionalstage of the communities and the size of the organisms
examined. In contrast, the diversity of the communitieswas less commonly a function of whether the crevicewas natural or manipulated; the diversity of mimiccrevices came to resemble that of controls within thethree-month period between the initiation of the ex-periment and the collection of samples, thus supportingthe structural-heterogeneity hypothesis. The dominantspecies (abundance) encountered were, in decreasingorder, L. saxatilis, Mytilus, L. obtusata, J. marina, andS. balanoides for control crevices and L. saxatilis, My-tilus, J. marina, L. obtusata, and amphipods for mimiccrevices. In terms of biomass, the dominant specieswere Mytilus, Fucus, S. balanoides, L. saxatilis, and L.obtusata for both control and mimic crevices. Becauseof the lack of variance in one or more of the cells fororganisms .8 mm, this size class was dropped fromall analyses. Similarly, cells for Stage 5 I were alsodropped from the analyses of the barnacle and Fucuszones, as were those for organisms .4 mm for H and9no
H for the rock zone.9wt
Total crevice community.—Except for a consistentlyhigher value for control crevices at stage-I succession,indicated by a significant Size 3 Exco interaction (Ta-ble 5), H of mimic and control crevices did not differ9no
greatly for any given successional stage–mesh sizecombination and generally mirrored the size-dependentpatterns for H observed in the spring 1995 (compare9no
Figs. 2 and 3, Table 5). Patterns of H varied signif-9no
icantly with Stage, such that the increasing trend seenfor Size . 0.5 mm and the peak in H at stage II seen9no

December 2001 3469BODY SIZE AND INTERTIDAL DIVERSITY
TABLE 3. Extended.
Barnacle
MS F P
Fucus
MS F P
Rock
MS F P
0.29940.25150.36380.01790.0341
1.2···
10.70.5···
.0.3···
,0.0005.0.7
···
0.12420.33181.14140.15380.0558
0.4···
20.52.8···
.0.6···
,0.0001.0.05
···
0.19510.07450.07740.02730.0206
2.6···
3.81.3···
.0.05···
,0.05.0.2
···
0.07790.08850.01760.00260.0021
0.9···
8.51.3···
.0.4···
,0.01.0.3
···
0.15370.54190.32240.06690.0327
0.3···
9.92.1···
.0.7···
,0.005.0.1
···
0.11880.08310.10380.05110.0216
1.4···
4.82.4···
.0.2···
,0.05.0.2
···
0.56490.24910.44460.00270.0165
2.3···
26.90.2···
.0.1···
,0.0001.0.9
···
2.76397.8694
44.64351.61571.1138
0.4···
40.11.5···
.0.7···
,0.0001.0.2
···
0.67140.16750.22110.12870.0522
4.0···
4.22.5···
,0.05···
,0.05.0.05
···
for Size . 4 mm differ from every other size class aswell as each other (Fig. 3a). Overall, H also follows9wt
the patterns seen in the spring 1995 data set and, exceptfor a consistently higher value for stage-II mimic crev-ices, experimental and control crevices did not differfor any successional stage–mesh size combination. Salso mirrors the pattern seen in the spring 1995 dataset and increases through succession when the smallestorganisms are included in the analyses, but levels outas the lower mesh size increases.
Mussel zone.—With the exception of consistentlyhigher values for stage-I crevices (H ) and aberrant9no
high values for stage-II mimic crevices (H ), the pat-9wt
terns for all indices measured were similar to thoseseen in the spring of 1995 (Fig. 3). H increased9no
through succession when all size classes of organismswere included in the analysis, but was stable when onlylarger organisms were considered, as shown by the sig-nificant contrast for Age between Size . 0.5 mm andSize . 4 mm (Fig. 3d). Although contrasts for Excobetween Size . 0.5 mm and all other mesh sizes weresignificant, it is not clear why visually. That H for9wt
mimic crevices at stage-II succession was always con-siderably higher than all other measures (Fig. 3e) isexplained by a consistently higher number and biomassof both L. obtusata and L. saxatilis .4 mm associatedwith mimic crevices (data not shown). S typically in-creased through succession for all size groupings andthe magnitude of the increase varied with Size (Fig.3f). Again, Exco varied with Size for S (Table 5), butthe source of this variation is not apparent.
Barnacle zone.—Although both H and S varied9no
with respect to Size 3 Stage, and that the contrastbetween Size . 0.5 mm and Size . 4.0 mm for thiseffect was significant for H (Table 5), the source of9no
these differences is not evident visually (Fig. 3g,i). Incontrast, H increased with successional stage for all9wt
size groupings, and the magnitude of this trend differedwith Size such that the Size . 4 mm pattern differedfrom that of all others (Fig. 3h).
Fucus zone.—No significant trends were detected forthis zone (Table 5) despite the fact that, except for thestage-I mimic crevices, the patterns observed agree rea-sonably well visually with those of the total crevicecommunity (data not shown), as was seen for the spring1995 data sets. The lack of recruitment of algae andthe organisms associated with it to the stage-I mimiccrevices is probably explained by the burning of thecrevice walls (see Methods) done in the creation ofmimic crevices.
Rock zone.—Again, no significant shifts in trendswere observed for any of the indices of diversity mea-sured for this zone (Table 5), although a decreasingtrend is apparent visually for the S data that becomesless pronounced as smaller organisms are included inthe data set. This is the same pattern that was observedfor the spring 1995 data set (Fig. 2). Also, H of control9no
crevices was, overall, significantly lower than that ofmimics (univariate P 5 0.01 for Exco).
The nonparametric multivariate analyses were doneincluding only those organisms or size classes of or-ganisms that were not manipulated. That is, all mussels.4 mm (the size added to the crevices) and barnacleswere excluded from the analyses. The multidimen-sional scaling (MDS) ordination plot represents the rawdata fairly well (stress 5 0.17) and is shown in Fig. 4.Although control and mimic crevices were significantlydifferent (R 5 0.109, P 5 0.04), the source of thisdifference was not apparent either statistically withinsuccessional stages or visually, as there is a complete

3470 CHRISTOPHER W. MCKINDSEY AND EDWIN BOURGET Ecology, Vol. 82, No. 12
FIG. 2. Mean (61 SE) Shannon-Weiner diversity (calculated using abundance [a, d, g, j, and m] and biomass [b, e, h, k,and n] data) and richness (number of taxa; c, f, i, l, and o) of total crevice communities and each of the four zones comprisingthem, in the spring of 1995, for size groupings of organisms .0.5, 1, 2, 4, and 8 mm. Circles, squares, triangles, and upside-down triangles represent crevices at stages I, II, III, and IV of succession, respectively. Data were analyzed using repeated-measures ANOVAs with size class as the repeated measure and using a Huynh-Feldt adjustment for significance testing.Horizontal brackets at the tops of panels indicate Size 3 Stage contrasts that differ significantly using sequential Bonferronicorrections. See text for details about which stages and size groupings were excluded from the analyses and Table 3 fortransformations used. Note that all data shown have been back-translated and that the ordinates have variable scales.

December 2001 3471BODY SIZE AND INTERTIDAL DIVERSITY
TABLE 4. Pearson correlations of total crevice communitydiversity (calculated in terms of abundance [H ], and bio-9no
mass [H ]) and richness (S) to the corresponding measure9wt
for each of the four zones for each of the five size groupingsstudied.
Zone 0.5–8 mm 1–8 mm 2–8 mm 4–8 mm 8 mm
Diversity (H )9no
MusselBarnacleAlgaeRock
0.850.560.46
20.22
0.880.320.0240.19
0.590.140.06
20.23
0.5220.11
0.55···
············
Diversity (H )9wt
MusselBarnacleAlgaeRock
0.4620.24
0.450.32
0.4620.22
0.450.26
0.4720.22
0.480.17
0.7620.15
0.55···
············
Richness (S)MusselBarnacleAlgaeRock
0.960.400.490.10
0.960.420.420.39
0.3320.10
0.4520.05
0.590.280.46
···
0.540.540.10
···
Note: In all cases, only crevices at stages greater than zeroyears are included in the analyses. Blanks in the table rep-resent blocks that contained only zeros for one or both vari-ables in the pair.
overlapping of the two crevice types for each of thesuccessional stages. Crevices at different stages of suc-cession differed significantly (R 5 0.195, P , 0.0005),such that crevices at stage-I succession cluster to theright of the figure and differ significantly from thoseat stages III and IV of succession (Fig. 4). Stage-IIcrevices were more or less evenly distributed over theplot and did not differ from any other cluster.
Influence of ecological time and structuralheterogeneity: spring 1996 data
During the winter of 1995–1996, many of the crev-ices, both mimic and control, and particularly those atthe most advanced stages, were reset at less advancedstages of succession (data not shown), presumably byice scour or heavy wave action. For example, only threeof the 18 unsampled stage-IV crevices remained at thatstage for both the mimic and control crevices. Othercrevices at differing stages advanced and regressed invarious ways. Nonetheless, sampling was done asplanned (six crevices for each stage crevice type, ex-cept for the advanced stages where only three could besampled). Analysis of the data using the classificationof the crevices to specific stages done in the spring of1995 showed no trends (univariate or multivariate) withrespect to crevice type or successional stage (data notshown).
A reanalysis of the data using a reclassification ofthe crevices made in the field in the spring of 1996showed the general patterns observed mirrored thoseof spring and fall 1995. The analyses of effects in-volving Exco and those evaluating how closely mimiccrevices resembled controls mirrored the results seen
in fall 1995. Nonparametric multivariate analysesshowed more clear-cut differences between succes-sional stages, but no differences with respect to Exco.Once more, both analyses support the structural-het-erogeneity and not the ecological-time hypothesis. Forthe sake of brevity, we do not present the results andrefer the interested reader to McKindsey (1999).
Summary
Overall, the results are consistent with the hypothesisthat the patterns of diversity observed through succes-sion are a function of the lower size limit of the or-ganisms included in the analyses. Diversity for the totalcommunity typically peaked or plateaued at interme-diate stages of succession when only the larger organ-isms were considered, but continued to increase withadvancing successional stage when the entire com-munity was considered. The patterns observed in themussel zone typically mirrored those observed for thetotal community but the other zones did so only to alesser degree. Thus, knowledge of what occurs in themussel zone provides a good idea of what happens inthe community as a whole. Differences between controland experimental crevices were typically minimal, sug-gesting that the structural heterogeneity rather than theage per se of the communities determines diversity.
DISCUSSION
Body size and diversity in succession
Many authors have stressed the importance of se-lecting the appropriate physical and temporal scales atwhich experiments on or observations of ecologicalcommunities are made (Palumbi 1985, Wiens 1989,Farnsworth and Ellison 1996). Our results suggest thatthe scale of the animals themselves, the communityconstituents, must also be considered when interpretingstudies. Studying communities at different resolutionsmay yield different results.
Trends in diversity through succession were a func-tion of the size of the organisms studied. Both diversityin terms of abundance (H ) and species richness (S)9no
typically increased through succession when all sizeclasses of macrofauna were included in the analyses,but were either stable or declined when only the largestorganisms were used. In contrast, as dominance interms of biomass changes little with the addition ofsmaller individuals or species, diversity by biomass(H ) varied little among size groupings but consider-9wt
ably among successional stages, often peaking at in-termediate stages. This peak is consistent with mostmodels of succession for rocky intertidal systems (seeDean and Connell [1987a] and references therein),many of which use percent cover to describe com-munity structure. If it is assumed that H is a better9wt
indicator of community diversity because it reflects thepartitioning of energy in a system (Harvey and Godfray1987), then the additional effort required to measure

3472 CHRISTOPHER W. MCKINDSEY AND EDWIN BOURGET Ecology, Vol. 82, No. 12
TABLE 5. Results of repeated-measures ANOVA on the effect of the lowest mesh size used (Size), successional stage (Stage),and crevice type (experimental or control, Exco) on the diversity (calculated from species counts [H ] and biomass9no
[H ]) and richness (S) of crevice communities (total) and each of the four zones comprising them, in the fall of 1995.9wt
Source of variation
Total
MS F P
Mussel
MS F P
Diversity (H )9no
StageExcoStage 3 ExcoError1SizeSize 3 StageSize 3 ExcoSize 3 Stage 3 ExcoError2
1.4750.0500.9810.2081.7890.1930.1480.0290.040
7.10.24.7
···44.74.83.70.7···
,0.001.0.6,0.01
···,0.0001,0.001,0.05.0.6
···
0.35350.02350.69120.20334.55800.12810.19790.05390.0378
1.70.13.4
···120.5
3.45.21.4
···
.0.1
.0.7,0.05
···,0.0001,0.01,0.01.0.2
···
Diversity (H )9wt
StageExcoStage 3 ExcoError1SizeSize 3 StageSize 3 ExcoSize 3 Stage 3 ExcoError2
0.4760.0220.6470.2800.3270.0160.0000.0030.002
1.70.12.3
···120.7
6.10.11.3
···
.0.1
.0.7
.0.5···
,0.0001,0.0005.0.8.0.2
···
1.51040.38910.88370.22600.22660.00710.00090.00070.0026
6.71.73.9
···86.4
2.70.30.3
···
,0.001.0.1,0.05
···,0.0001,0.05.0.6.0.9
···
Richness (S)StageExcoStage 3 ExcoError1SizeSize 3 StageSize 3 ExcoSize 3 Stage 3 ExcoError2
2.7510.0560.4020.1265.0760.0170.0620.0720.017
21.70.43.2
···287.5
1.03.54.1
···
,0.0001.0.5,0.05
···,0.0001.0.4,0.05,0.0001
···
71.36630.4188
21.560810.5823
196.68574.90804.54690.50061.2823
6.70.02.0
···153.4
3.83.60.4
···
,0.001.0.8.0.1
···,0.0001,0.005,0.05.0.9
···
Notes: In order to have fully orthogonal models that obeyed the assumptions of ANOVA, it was necessary to excludeentire levels of some variables from the analyses. Probabilities given for the repeated factor are those calculated using aHuynh-Feldt adjustment for nonsphericity. Data for S were ln(x 1 1)-transformed for both the total crevice community andthe rock zone prior to analysis. The degrees of freedom for Stage, Exco, Stage 3 Exco, Error1, Size, Size 3 Stage, Size 3Exco, Size 3 Stage 3 Exco, and Error2 were 3, 1, 3, 40, 3, 9, 3, 9, and 120 for Total and Mussel; 2, 1, 2, 30, 3, 6, 3, 6,and 90 for Barnacle, Fucus, and Rock S; and 2, 1, 2, 30, 2, 4, 2, 4, and 60 for Rock H and H .9 9no wt
biomass, which commonly precludes its use in studiesof species abundance patterns (Tokeshi 1993), may beunnecessary. However, models for interaction websbased on energy flow assume that importance may bemeasured by energy flux and ignore the competitivecross-links that are important in structuring commu-nities (Paine 1980). Such functional links between mac-roscopic and microscopic organisms (Peters 1983,Stone 1995, Thompson et al. 1996) have rarely beenincluded in studies of community regulation on rockyshores (Menge et al. 1995).
We believe our finding that the size of organismsexamined influences the outcome of studies may begeneral and not limited to species-poor systems with asmall size range of organisms, as is the one examinedin this study. Indeed, our results most likely underes-timated the magnitude of the true differences in trendsin succession between the different size groupings.While all of the largest species were identified to thespecies level, this was not true of the smaller organisms(oligochaetes, nematodes, etc.), which were also more
abundant in later stages of succession. The effect mayin fact be more pronounced in more speciose systems,or in those displaying a greater range of body sizes,and should be equally applicable to ecological pro-cesses other than succession as well as in terrestrialsystems. For example, within terrestrial grassland sys-tems, recent work has shown distinct peaks in richnessfor terrestrial arthropods of intermediate body sizes(Siemann et al. 1996, 1999), although such peaks haveusually been attributed to differences in sampling effortand a poorer knowledge of the taxonomy of smallerorganisms (May 1978). Siemann et al. (1999) suggestthis may not always be the case, as the patterns theyobserved remained constant for different orders of spe-cies with mean body sizes ranging over more than twoorders of magnitude. While such relationships mayhold true for the orders studied, they most probably donot for the sum of all the different species within theenvironment under observation. Mites, for example,may partially fill the overall decline in arthropod spe-cies richness for smaller body sizes and are often un-

December 2001 3473BODY SIZE AND INTERTIDAL DIVERSITY
TABLE 5. Extended.
Barnacle
MS F P
Fucus
MS F P
Rock
MS F P
0.0030.7120.0240.1983.8140.1660.1130.0650.035
0.03.60.1···
106.74.73.21.8···
.0.9
.0.5
.0.8···
,0.0001,0.005.0.05.0.1
···
0.59160.19690.51930.40041.79700.01500.01700.00760.0499
1.50.51.3
···36.0
0.30.30.2
···
.0.2
.0.2
.0.2···
,0.0001.0.9.0.7.0.9
···
0.05391.06890.05280.15480.00990.00820.03210.01520.0126
0.46.90.3···0.80.62.61.2···
.0.7,0.05.0.7
···.0.4.0.5.0.1.0.3
···
2.2500.7171.1370.1850.1470.0090.0000.0010.007
12.23.96.1···
86.15.30.40.6···
,0.0001.0.05,0.01
···,0.0001,0.005.0.6.0.6
···
0.97480.06840.35780.41210.40410.00560.00760.00830.0217
2.40.20.9
···18.6
0.30.350.38
···
.0.1
.0.6
.0.4···
,0.0001.0.8.0.6.0.7
···
0.77980.02440.22610.30910.04470.00180.00150.00270.0024
2.50.10.7···
19.00.80.71.2···
.0.05
.0.7
.0.4···
,0.0001.0.5.0.4.0.3
···
32.52783.361
20.861111.0194
170.55565.6383.1380.5831.334
3.00.31.9···
127.84.22.40.4···
.0.05
.0.5
.0.1···
,0.0001,0.005.0.05.0.8
···
0.78971.08211.04020.47202.28300.00320.01360.01960.0314
1.72.32.2
···72.6
0.10.40.6
···
.0.2
.0.1
.0.1···
,0.0001.0.9.0.6.0.6
···
5.048614.694415.2569
7.416745.2870
0.08560.54630.77550.6981
0.72.02.1···
64.90.10.81.1···
.0.5
.0.1
.0.1···
,0.0001.0.9.0.4.0.3
···
dersampled, even with directed sampling (Walter andBehan-Pelletier 1999). The idea that patterns of diver-sity may vary with the size of organisms studied isintuitive, and many researchers stress that their findingsshould not be extended beyond the system studied (e.g.,Paine 1966, 1991). However, this is commonly over-looked and many authors talk loosely about influencesof various processes on ‘‘community structure’’ andovergeneralize their findings with respect to the ma-crospecies studied to the community as a whole. Hurl-bert (1997) discusses this point at length in a recentcritique.
Ecological time vs. structural heterogeneity
The diversity of the communities examined in thisstudy was a function of their structural heterogeneity,rather than their age. Each index of diversity calculatedwas similar for mimic and control crevices at the samesuccessional stage, three months after manipulation.Further, when the manipulated organisms were re-moved from the nonparametric multivariate analyses,no differences between control and mimic creviceswere detected, but significant differences were ob-served among crevices at different successional stages.
That the structural heterogeneity of communities is
responsible for increasing diversity is not novel (Mac-Arthur and MacArthur 1961). For mussel communities,most studies (e.g., Dye 1992, Tokeshi and Romero1995, Gunther 1996) have shown their presence to in-crease the diversity of macrofauna over that of adjacentareas, and those that have not done so (Paine 1974,Lohse 1993) have considered only those species thatcould be observed in the field. Furthermore, field stud-ies comparing mussel communities with increasingstructural heterogeneity usually report concomitant in-creases in diversity (e.g., Suchanek 1979, Tsuchiya andNishihira 1985, 1986). This has also been shown ex-perimentally using plastic mimics of M. californianus(Suchanek 1979). A number of studies (e.g., Dean andConnell 1987b, c, Gee and Warwick 1994b) have alsofound positive correlations between the structural het-erogeneity of algae (and artificial algae) and the rich-ness of the associated invertebrates. Data regarding theinfluence of barnacles on diversity is rare. However,both real and fake barnacles have been shown to in-crease the recruitment of various species over that ofsurfaces without barnacles (e.g., Petraitis 1990, Mironet al. 1996).
Recent theoretical and applied papers have stressedthe importance of positive interactions in structuring

3474 CHRISTOPHER W. MCKINDSEY AND EDWIN BOURGET Ecology, Vol. 82, No. 12
FIG. 3. Mean (61 SE) Shannon-Weiner diversity (calculated using abundance [a, d, and g] and biomass [b, e, and h]data) and richness (number of taxa; c, f, and i) of total crevice communities and two of the four zones comprising them, inthe fall of 1995, for size groupings of organisms .0.5, 1, 2, 4, and 8 mm. Solid and hollow symbols represent control andexperimental crevices, respectively. Circles, squares, triangles, and upside-down triangles represent crevices at stages I, II,III, and IV of succession, respectively. Data were analyzed using two-way repeated-measures ANOVAs, with size class asthe repeated measure and using a Huynh-Feldt adjustment for significance testing. Horizontal solid, dashed, and dottedbrackets indicate Size 3 Stage, Size 3 Exco, and Size 3 Stage 3 Exco contrasts, respectively, that differ significantly usingsequential Bonferroni corrections. See text for details about which stages and size groupings were excluded from the analysesand Table 5 for transformations used. Note that all data shown have been back-translated and that the ordinates have variablescales.
communities (Witman 1987, Bertness and Callaway1994, Bertness and Leonard 1997, Hacker and Gaines1997, Jones et al. 1997). Mussels alter their local en-vironment and increase local diversity by filling eachof the engineering roles outlined in Jones et al. (1994).They act as a food source (Menge 1976, Davenport andMoore 1996), and their physical bodies create novelhabitat for organisms that could not otherwise exist,both directly (Ong Che and Morton 1992, Ricciardi etal. 1997) and indirectly (Tsuchiya 1982, Iwasaki 1995),as well as preventing erosion during storms (Bell andGosline 1997). They also modify temperature and des-iccation regimes (Helmuth 1998), along with nutrientfluxes (Tsuchiya 1980, Asmus and Asmus 1991). Thesame could also be said for both S. balanoides andFucus, the two other engineering species present increvice communities. Thus, each of these species mayalter the dynamics, structure, and diversity of crevicecommunities.
However, the three engineering species examinedwere not equal in promoting diversity within crevicecommunities. Richness and diversity were consistentlyhighest within the mussel fraction of the crevices, de-spite the fact that their biomass rivaled that of barnaclesand Fucus only in the last stage of succession (datanot shown). Furthermore, only the diversity associatedwith the mussel zone consistently mirrored that of thecrevice community as a whole, and an equivalent di-versity was also observed in crevices where musselswere the only engineering species present (C. W.McKindsey, unpublished data). If this holds true formussel communities in other systems, then an increaseto a final stage where mussels are the only engineeringspecies present may in fact increase diversity ratherthan decrease it, as most studies have suggested.
It is informative to contrast our observation that thepresence of engineering species other than Mytilus didnot increase community diversity over the amount due

December 2001 3475BODY SIZE AND INTERTIDAL DIVERSITY
FIG. 4. Two-dimensional multidimensional scaling(MDS) ordination plots for all macrofauna and mussels ,4mm from control (solid symbols) and experimental (opensymbols) crevices at four stages of succession in the fall of1995. Circles, stage I; squares, stage II; triangles, stage III;and upside-down triangles, stage IV.
directly to the addition of the engineering species inquestion (i.e., no novel species were observed) withother studies examining the interaction between mus-sels and co-occurring algae. Albrecht and Reise (1994)reported that canopies of F. vesiculosus have a positiveeffect on the diversity of organisms associated with M.edulis on soft sediments. They found most of the dif-ference between communities (with and without F. ves-iculosus cover) could be attributed to differences in theherbivores associated with the algae, thus highlightingthe importance of both species in structuring the com-munity. This increase in diversity, however, was dueto an increase in evenness; as compared to mussel com-munities without F. vesiculosus cover, only one novelspecies was found in those with F. vesiculosus cover,and richness and abundance actually decreased. In thesystem examined in this study, all the herbivores ob-served in the Fucus zone were also present in the mus-sel zone, possibly because of differences betweenwhere organisms are found during high and low tides(Peake and Quinn 1993). However, these species werealso found in crevices where mussels were the onlyengineering species present (C. W. McKindsey, un-published data) and an alternative explanation is thatthey also consume epiphytic algae that grow on themussels themselves. McCook and Chapman (1991) ma-nipulated both mussel densities and F. vesiculosus can-opies and found the latter to be much more importantin structuring the community. However, this study eval-uated the populations studied as percent cover and fieldcounts of abundance. It would have been interesting tocompare the results had the entire macrofaunal com-munity been considered.
The increase in diversity through succession in themussel zone and the constant levels observed for the
other two zones may be explained in part by differinggrowth rates. Barnacles and Fucus approximately attainmature size within one growing season, whereas mus-sels continue to grow and increasingly alter their en-vironment throughout their lives. Furthermore, exceptfor the addition of surface area, the habitat modifica-tions created by Barnacles and Fucus are not as pro-nounced as in mussel communities (i.e., Fucus hold-fasts, stipes, and thalli and barnacle walls vs. matrixof mussel shells, byssal threads, and accumulated sed-iment; see review in Seed and Suchanek [1992]). Thus,mussels may increase diversity directly at successivestages of succession by increasing the number of niches(Hutchinson and MacArthur 1959, Huston 1979) or in-directly through complex ecological interactions thatare only manifest with an increase in physical hetero-geneity (Downes et al. 1998).
There has recently been increasing interest in usinghigher taxonomic level surrogates for species richnessto identify locations of high biodiversity for conser-vation purposes (Oliver and Beatie 1993, Williams andGaston 1994, Gray 1997). In the same spirit, recentdiscussions have centered on the identification of ‘‘key-stone species’’ (sensu Mills et al. 1993) or the studyof interaction strengths and ‘‘community importance’’(sensu Power et al. 1996) to identify the conditionsunder which different species are most important instructuring communities (Mills et al. 1993, Power etal. 1996, Ruckelshaus and Hays 1998). While this ap-proach may often be appropriate, an organism’s ‘‘im-portance’’ may vary both spatially and temporally (Un-derwood and Denley 1984, Dethier and Duggins 1988,Elner and Vadas 1990), and an emphasis on ‘‘keystone-ness’’ creates an artificial dichotomy between rare andcommon (foundation) functionally important species(Hurlbert 1997), both of which may influence diversity.This study showed that while patterns in diversity oflarge structural species may not be indicative of thoseof the total assemblage of animals in communities, thepresence of one of these species, in this case, mussels,might be a useful indicator of locations with high di-versity. We suggest that rewards would follow effortsdirected toward understanding such relationships andthe conditions under which extrapolations of this sortprove valid.
ACKNOWLEDGMENTS
We are grateful for the enthusiastic assistance of P. A. Par-adis and M. Veret in the field, and P. A. Paradis, M. Veret,I. Corbet, and M. J. Abgrall in the laboratory portions of thisstudy. G. Daigle (Service Professionnel de Consultation Sta-tistique, Departement de Mathematiques et de Statistique,Universite Laval) provided advice for parametric statistics.We also thank L. E. Johnson, P. Petraitis, J. Witman, and ananonymous reviewer for inspired comments on an earlier draftof this manuscript. This project is part of the Coastal Het-erogeneity and Scaling Experiment (CHASE) and was sup-ported by a Natural Sciences and Engineering Research Coun-cil of Canada (NSERC) grant to E. Bourget. Funding to C.W. McKindsey was provided through grants from the GroupeInteruniversitaire de Recherches Oceanographic du Quebec

3476 CHRISTOPHER W. MCKINDSEY AND EDWIN BOURGET Ecology, Vol. 82, No. 12
(GIROQ), the Fondation de l’Universite Laval and the Fondsde soutien au doctorat from Universite Laval. Major revisionsof the paper were made while C. W. McKindsey was affiliatedwith the Centre for Research on Ecological Impacts of CoastalCities, University of Sydney, Australia.
LITERATURE CITED
Albrecht, A., and K. Reise. 1994. Effects of Fucus vesicu-losus covering intertidal mussel beds in the Wadden Sea.Helgolander Meeresuntersuchungen 48:243–256.
Archambault, D., and E. Bourget. 1983. Importance du re-gime de denudation sur la structure et la succession descommunautes intertidales de substrat rocheux en milieusubarctique. Canadian Journal of Fisheries and Aquatic Sci-ences 40:1278–1292.
Asmus, R. M., and H. Asmus. 1991. Mussel beds: limitingor promoting phytoplankton? Journal of Experimental Ma-rine Biology and Ecology 148:215–232.
Bell, E. C., and J. M. Gosline. 1997. Strategies for life inflow: tenacity, morphometry, and probability of dislodge-ment of two Mytilus species. Marine Ecology Progress Se-ries 159:197–208.
Bell, S. S., and S. A. Woodin. 1984. Community unity: ex-perimental evidence for meiofauna and macrofauna. Jour-nal of Marine Research 42:605–632.
Bergeron, P., and E. Bourget. 1986. Shore topography andspatial partitioning of crevice refuges by sessile epibenthosin an ice disturbed environment. Marine Ecology ProgressSeries 28:129–145.
Bertness, M. D., and R. Callaway. 1994. Positive interactionsin communities. Trends in Ecology and Evolution 9:191–193.
Bertness, M. D., and G. H. Leonard. 1997. The role of pos-itive interactions in communities: lessons from intertidalhabitats. Ecology 78:1976–1989.
Carr, M. R. 1996. PRIMER User Manual. Version 4.0. Plym-outh Marine Laboratory, Prospect Place, The Hoe, Plym-outh, UK.
Clarke, K. R. 1993. Non-parametric analyses of changes incommunity structure. Australian Journal of Ecology 18:117–143.
Colwell, R. K., and J. A. Coddington. 1994. Estimating ter-restrial biodiversity through extrapolation. PhilosophicalTransactions of the Royal Society of London B 343:101–118.
Connell, J. H. 1978. Diversity in tropical rain forests andcoral reefs. Science 199:1302–1310.
Davenport, J., and P. G. Moore. 1996. Observations on de-fensive interactions between predatory dogwhelks, Nucellalapillus (L.) and mussels, Mytilus edulis. Journal of Ex-perimental Marine Biology and Ecology 206:133–147.
Dayton, P. K. 1971. Competition, disturbance, and commu-nity organization: the provision and subsequent utilizationof space in a rocky intertidal community. Ecological Mono-graphs 41:352–389.
Dayton, P. K. 1972. Toward an understanding of communityresilience and the potential effects of enrichment to thebenthos at McMurdo Sound, Antarctica. Pages 81–95 in B.C. Barker, editor. Proceedings of the colloquium on con-servation problems in Antarctica. Allen Press, Lawrence,Kansas, USA.
Dean, R. L., and J. H. Connell. 1987a. Marine invertebratesin algal succession. I. Variations in abundance and diversitywith succession. Journal of Experimental Marine Biologyand Ecology 109:195–215.
Dean, R. L., and J. H. Connell. 1987b. Marine invertebratesin algal succession. II. Tests of hypotheses to explain di-versity with succession. Journal of Experimental MarineBiology and Ecology 109:217–247.
Dean, R. L., and J. H. Connell. 1987c. Marine invertebratesin algal succession. III. Mechanisms linking habitat com-
plexity with diversity. Journal of Experimental Marine Bi-ology and Ecology 107:249–273.
Dethier, M. N., and D. O. Duggins. 1988. Variation in stronginteractions in the intertidal zone along a geographical gra-dient: a Washington–Alaska comparison. Marine EcologyProgress Series 50:97–105.
Downes, B. J., P. S. Lake, E. S. G. Schreiber, and A. Glaister.1998. Habitat structure and regulation of local species di-versity in a stony, upland stream. Ecological Monographs68:237–257.
Dye, A. H. 1992. Experimental studies of succession andstability in rocky intertidal communities subject to artisanalshellfish gathering. Netherlands Journal of Sea Research30:209–217.
Edgar, G. J. 1990. The use of the size structure of benthicmacrofaunal communities to estimate faunal biomass andsecondary production. Journal of Experimental Marine Bi-ology and Ecology 137:195–214.
Elner, R. W., and R. L. Vadas. 1990. Inference in ecology:the sea urchin phenomenon in the northwest Atlantic.American Naturalist 136:108–125.
Elton, C. 1927. Animal ecology. Macmillan, New York, NewYork, USA.
Farnsworth, E. J., and A. M. Ellison. 1996. Scale-dependentspatial and temporal variability in biogeography of man-grove root epibiont communities. Ecological Monographs66:45–66.
Field, J. G., K. R. Clarke, and R. M. Warwick. 1982. Apractical strategy for analysing multispecies distributionpatterns. Marine Ecology Progress Series 8:37–52.
Frontier, S. 1985. Diversity and structure in aquatic ecosys-tems. Oceanography and Marine Biology, Annual Review23:253–312.
Gee, J. M., and R. M. Warwick. 1994a. Body-size distri-bution in a marine metazoan community and the fractaldimensions of macroalgae. Journal of Experimental MarineBiology and Ecology 178:247–259.
Gee, J. M., and R. M. Warwick. 1994b. Metazoan communitystructure in relation to the fractal dimensions of marinemacroalgae. Marine Ecology Progress Series 103:141–150.
Girden, E. R. 1992. ANOVA: repeated measures. Sage Uni-versity paper series on quantitative applications in the so-cial sciences, vol. 07–084. Sage Publications, NewburyPark, California, USA.
Gray, J. S. 1997. Marine biodiversity: patterns, threats andconservation needs. Biodiversity and Conservation 6:153–175.
Green, R. H. 1993. Application of repeated measures designsin environmental impact and monitoring studies. AustralianJournal of Ecology 18:81–98.
Gunther, C. P. 1996. Development of small Mytilus beds andits effects on resident intertidal macrofauna. Marine Ecol-ogy 17:117–130.
Hacker, S. D., and S. D. Gaines. 1997. Some implications ofdirect positive interactions for community species diver-sity. Ecology 78:1990–2003.
Hall, S. J., and S. P. Greenstreet. 1996. Global diversity andbody size. Nature 383:133.
Harvey, P. H., and H. C. J. Godfray. 1987. How species divideresources. American Naturalist 129:318–320.
Helmuth, B. S. T. 1998. Intertidal mussel microclimates: pre-dicting the body temperature of a sessile invertebrate. Eco-logical Monographs 68:51–74.
Hurlbert, S. H. 1997. Functional importance vs keystoneness:reformulating some questions in theoretical biocenology.Australian Journal of Ecology 22:369–382.
Huston, M. 1979. A general hypothesis of species diversity.American Naturalist 113:81–101.
Hutchinson, G. E. 1959. Homage to Santa Rosalia or why

December 2001 3477BODY SIZE AND INTERTIDAL DIVERSITY
are there so many kinds of animals? American Naturalist93:145–159.
Hutchinson, G. E., and R. H. MacArthur. 1959. A theoreticalecological model of size distributions among species ofanimals. American Naturalist 93:117–125.
Iwasaki, K. 1995. Comparison of mussel bed communitybetween two intertidal mytilids Septifer virgatus and Hor-momya mutabilis. Marine Biology 123:109–119.
Jones, C. G., J. H. Lawton, and M. Shachak. 1994. Organismsas ecosystem engineers. Oikos 69:373–386.
Jones, C. G., J. H. Lawton, and M. Shachak. 1997. Positiveand negative effects of organisms as physical ecosystemengineers. Ecology 78:1946–1957.
Lande, R. 1996. Statistics and partitioning of species diver-sity, and similarity among multiple communities. Oikos 76:5–13.
Lee, H. I., and W. G. Ambrose. 1989. Life after competitiveexclusion: an alternative strategy for a competitive inferior.Oikos 56:424–427.
Lohse, D. P. 1993. The importance of secondary substratumin a rocky intertidal community. Journal of ExperimentalMarine Biology and Ecology 166:1–17.
MacArthur, R. H., and J. W. MacArthur. 1961. On bird spe-cies diversity. Ecology 42:594–598.
Magurran, A. E. 1988. Ecological diversity and its measure-ment. Princeton University Press, Princeton, New Jersey,USA.
Marquet, P. A., S. A. Navarrete, and J. C. Castilla. 1995.Body size, population density, and the energetic equiva-lence rule. Journal of Animal Ecology 64:325–332.
May, R. M. 1978. The dynamics and diversity of insect fau-nas. Pages 188–204 in L. A. Mound and N. Waloffs, editors.Diversity of insect faunas. Volume 9. Blackwell Scientific,London, UK.
McCook, L. J., and A. R. O. Chapman. 1991. Communitysuccession following massive ice-scour on an exposedrocky shore: effects of Fucus canopy algae and of musselsduring late succession. Journal of Experimental Marine Bi-ology and Ecology 154:137–169.
McKindsey, C. W. 1999. La taille des organisms et son in-fluence sur la structure des communautes intertidales. Dis-sertation. Universite Laval, Quebec, Canada.
Menge, B. A. 1976. Organization of the New England rockyintertidal community: role of predation, competition, andenvironmental heterogeneity. Ecological Monographs 46:355–393.
Menge, B. A., B. Daley, and P. A. Wheeler. 1995. Controlof interaction strength in marine benthic communities. Pag-es 258–274 in G. A. Polis and K. O. Winemiller, editors.Food webs: integration of patterns and dynamics. Chapman& Hall, New York, New York, USA.
Menge, B. A., and J. Lubchenco. 1981. Community orga-nization in temperate and tropical intertidal habitats: var-iation in disturbance, competition, and predation in relationto consumer pressure gradients. Ecological Monographs51:429–450.
Mills, L. S., M. E. Soule, and D. F. Doak. 1993. The keystonespecies concept in ecology and conservation. Bioscience43:219–224.
Miron, G., E. Bourget, and P. Archambault. 1996. Scale ofobservation and dispersion of adult conspecifics: their in-fluence in assessing passive and active settlement mecha-nisms in the barnacle Balanus crenatus (Bruguiere). Journalof Experimental Marine Biology and Ecology 201:137–158.
Morse, D. R., J. H. Lawton, M. M. Dodson, and M. H. Wil-liamson. 1985. Fractal dimension of vegetation and thedistribution of arthropod body lengths. Nature 314:731–733.
Navarrete, S. A., and B. A. Menge. 1997. The body size–
population density relationship in tropical rocky intertidalcommunities. Journal of Animal Ecology 66:557–566.
Nee, S., A. F. Read, J. J. D. Greenwood, and P. H. Harvey.1991. The relationship between abundance and body sizein British birds. Nature 351:312–313.
Oliver, I., and A. J. Beatie. 1993. A possible method for therapid assessment of biodiversity. Conservation Biology 7:562–568.
Ong Che, R. G., and B. Morton. 1992. Structure and seasonalvariations in the abundance of the macro-invertebrate com-munity associated with Septifer virgatus (Bivalvia: Mytil-idae) at Cape D’Aguilar, Hong Kong. Asian Marine Bi-ology 9:217–233.
Osman, R. W., and R. B. Whitlatch. 1995. The influence ofresident adults on recruitment: a comparison to settlement.Journal of Experimental Marine Biology and Ecology 190:169–198.
Paine, R. T. 1966. Food web complexity and species diver-sity. American Naturalist 100:65–75.
Paine, R. T. 1969. A note on trophic complexity and com-munity stability. American Naturalist 103:91–93.
Paine, R. T. 1974. Intertidal community structure: experi-mental studies on the relationship between a dominant com-petitor and its principal predator. Oecologia 15:93–120.
Paine, R. T. 1980. Food webs: linkage, interaction strengthand community infrastructure. Journal of Animal Ecology49:667–685.
Paine, R. T. 1991. Between Scylla and Charybdis: do somekinds of criticism merit a response? Oikos 62:90–92.
Paine, R. T., and S. A. Levin. 1981. Intertidal landscapes:disturbance and the dynamics of pattern. Ecological Mono-graphs 51:145–178.
Palumbi, S. R. 1985. Spatial variation in an alga–spongecommensalism and the evolution of ecological interactions.American Naturalist 126:267–274.
Peake, A. J., and G. P. Quinn. 1993. Temporal variation inspecies-area curves for invertebrates in clumps of an in-tertidal mussel. Ecography 16:269–277.
Peters, R. H. 1983. The ecological implications of body size.Cambridge University Press, New York, New York, USA.
Petraitis, P. S. 1990. Direct and indirect effects of predation,herbivory and surface rugosity on mussel recruitment. Oec-ologia 83:405–413.
Pianka, E. R. 1988. Evolutionary ecology. Fourth edition.Harper & Row, New York, New York, USA.
Power, M. E., D. Tilman, J. A. Estes, B. A. Menge, W. J.Bond, L. S. Mills, G. Daily, J. C. Castilla, J. Lubchenco,and R. T. Paine. 1996. Challenges in the quest for key-stones. Bioscience 46:609–620.
Reish, D. J. 1959. A discussion of the importance of screensize in washing quantitative marine bottom samples. Ecol-ogy 40:307–309.
Ricciardi, A., F. G. Whoriskey, and J. B. Rasmussen. 1997.The role of the zebra mussel (Dreissena polymorpha) instructuring macroinvertebrate communities on hard sub-strata. Canadian Journal of Fisheries and Aquatic Sciences54:2596–2608.
Rice, W. R. 1989. Analyzing tables of statistical tests. Evo-lution 43:223–225.
Robles, C. D. 1997. Changing recruitment in constant speciesassemblages: implications for predation theory in intertidalcommunities. Ecology 78:1400–1414.
Ruckelshaus, M. H., and C. G. Hays. 1998. Conservationand management of species in the sea. Pages 112–156 inP. L. Fiedler and P. M. Kareivas, editors. Conservation bi-ology: for the coming decade. Second edition. Chapman &Hall, New York, New York, USA.
SAS Institute. 1996. The SAS system for Windows. Version6.12. SAS Institute, Cary, North Carolina, USA.
Schlater, T. A., and T. H. Wooldridge. 1996. How sieve mesh

3478 CHRISTOPHER W. MCKINDSEY AND EDWIN BOURGET Ecology, Vol. 82, No. 12
size affects sample estimates of estuarine benthic macro-fauna. Journal of Experimental Marine Biology and Ecol-ogy 201:159–171.
Schwinghamer, P. 1981. Characteristic size distributions ofintegral benthic communities. Canadian Journal of Fish-eries and Aquatic Sciences 38:1255–1263.
Seed, R., and T. H. Suchanek. 1992. Population and com-munity ecology of Mytilus. Pages 87–169 in E. Goslings,editor. The mussel Mytilus: ecology, physiology, geneticsand culture. Elsevier, Amsterdam, The Netherlands.
Shorrocks, B., J. Marsters, I. Ward, and P. J. Evennett. 1991.The fractal dimension of lichens and the distribution ofarthropod body lengths. Functional Ecology 5:457–460.
Siemann, E., D. Tilman, and J. Haarstad. 1996. Insect speciesdiversity, abundance and body size relationships. Nature380:704–706.
Siemann, E., D. Tilman, and J. Haarstad. 1999. Abundance,diversity and body size: patterns from a grassland arthropodcommunity. Journal of Animal Ecology 68:824–835.
Sousa, W. P. 1979. Disturbance in marine intertidal boulderfields: the nonequilibrium maintenance of species diversity.Ecology 60:1225–1239.
Sousa, W. P. 1984. Intertidal mosaics: patch size, propaguleavailability, and spatially variable patterns of succession.Ecology 65:1918–1935.
Stone, R. 1995. Taking a new look at life through a functionallens. Science 269:316–317.
Suchanek, T. H. 1979. The Mytilus californianus community:studies on the composition, structure, organization, and dy-namics of a mussel bed. Dissertation. University of Wash-ington, Seattle, Washington, USA.
Suchanek, T. H. 1985. Mussels and their role in structuringrocky shore communities. Pages 70–96 in P. G. Moore andR. Seed, editors. The ecology of Rocky coasts. Hodder andStroughton, London, UK.
Suchanek, T. H. 1994. Temperate coastal marine communi-ties: biodiversity and threats. American Zoologist 34:100–114.
Thompson, R. C., B. J. Wilson, M. L. Tobin, A. S. Hill, andS. J. Hawkins. 1996. Biologically generated habitat pro-vision and diversity of rocky shore organisms at a hierarchyof spatial scales. Journal of Experimental Marine Biologyand Ecology 202:73–84.
Tokeshi, M. 1993. Species abundance patterns and commu-nity structure. Advances in Ecological Research 24:111–186.
Tokeshi, M., and L. Romero. 1995. Filling a gap—dynamicsof space occupancy on a mussel-dominated subtropicalrocky shore. Marine Ecology Progress Series 119:167–176.
Tsuchiya, M. 1980. Biodeposit production by the mussel My-tilus edulis L. on rocky shores. Journal of ExperimentalMarine Biology and Ecology 47:203–222.
Tsuchiya, M. 1982. Catching of organic matter by the musselMytilus edulis L. on rocky shores. Bulletin of the MarineBiological Station, Asamushi, Tohoku University 17:99–107.
Tsuchiya, M., and M. Nishihira. 1985. Islands of Mytilusedulis as a habitat for small intertidal animals: effect ofisland size on community structure. Marine Ecology Pro-gress Series 25:71–81.
Tsuchiya, M., and M. Nishihira. 1986. Islands of Mytilusedulis as a habitat for small intertidal animals: effect ofMytilus age structure on the species composition of theassociated fauna and community organization. MarineEcology Progress Series 31:171–178.
Underwood, A. J., and E. J. Denley. 1984. Paradigms, ex-planations, and generalizations in models for the structureof intertidal communities on rocky shores. Pages 151–180in D. Simberloff and D. R. Strong, editors. Ecological com-munities: conceptual issues and the evidence. PrincetonUniversity Press, Princeton, New Jersey, USA.
Walter, D. E., and V. Behan-Pelletier. 1999. Mites in forestcanopies: filling the size distribution shortfall? Annual Re-view of Entomology 44:1–19.
Warwick, R. M. 1984. Species size distributions in marinebenthic communities. Oecologia 61:32–41.
Wiens, J. A. 1989. Spatial scaling in ecology. FunctionalEcology 3:385–397.
Williams, P. H., and K. J. Gaston. 1994. Measuring more ofbiodiversity: can higher–taxon richness predict wholesalespecies richness? Biological Conservation 67:211–217.
Witman, J. D. 1985. Refuges, biological disturbance, androcky subtidal community structure in New England. Eco-logical Monographs 55:421–445.
Witman, J. D. 1987. Subtidal coexistence: storms, grazing,mutualism, and the zonation of kelps and mussels. Eco-logical Monographs 57:167–187.


