African Journal of Business Management Vol. 4(9), pp. 1654-1667, 4 August, 2010 Available online at http://www.academicjournals.org/AJBM ISSN 1993-8233 ©2010 Academic Journals Full Length Research Paper
Discriminant analysis: An illustrated example
T. Ramayah1*, Noor Hazlina Ahmad1, Hasliza Abdul Halim1, Siti Rohaida Mohamed Zainal1 and May-Chiun Lo2
1School of Management, Universiti Sains Malaysia, Minden, 11800 Penang, Malaysia.
2Faculty of Economics and Business, Universiti Malaysia Sarawak, 94300 Kota, Samarahan, Sarawak, Malaysia.
Accepted 12 July, 2010
One of the challenging tasks facing a researcher is the data analysis section where the researcher needs to identify the correct analysis technique and interpret the output that he gets. The analysis wise is very simple, just by the click of a mouse the analysis can be done. The more demanding part is the interpretation of the output that the researcher gets. Many researchers are very familiar and well exposed to the regression analysis technique whereby the dependent variable is a continuous variable. But what happens if the dependent variable is a nominal variable? Then the researcher has 2 choices: either to use a discriminant analysis or a logistic regression. Discriminant analysis is used when the data are normally distributed whereas the logistic regression is used when the data are not normally distributed. This paper demonstrates an illustrated approach in presenting how the discriminant analysis can be carried out and how the output can be interpreted using knowledge sharing in an organizational context. The paper will also present the 3 criteria that can be used to test whether the model developed has good predictive accuracy. The purpose of this paper is to help novice researchers as well as seasoned researchers on how best the output from the SPSS can be interpreted and presented in standard table forms. Key words: Data analysis, discriminant analysis, predictive validity, nominal variable, knowledge sharing.
INTRODUCTION Many a time a researcher is riddled with the issue of what analysis to use in a particular situation. Most of the time, the use of regression analysis is considered as one of the most powerful analyses when we are interested in establishing relationships. One of the requirements of the regression analysis is that the dependent variable (Y) must be a continuous variable. If this assumption is violated, then the use of a regression analysis is no longer appropriate. Let us say for example, we would like to predict a user of Internet banking from a non-user of Internet banking. In this case, the dependent variable is a nominal variable with 2 levels or categories with say 1 = User and 2 = Non-user. In this case, regression analysis is no longer appropriate. Next, we have a choice of using a discrimi-nant analysis which is a parametric analysis or a logistic regression analysis which is a non-parametric analysis. The basic assumption for a discriminant analysis is that the sample comes from a normally distributed population *Corresponding author. E-mail: [email protected].
whereas logistic regression is called a distribution free test where the normality requirement is not needed. This paper will only delve into the use of discriminant analysis as parametric tests that are much more powerful than its non-parametric alternative (Ramayah et al., 2004; Ramayah et al., 2006).
Next, we will discuss what a discriminant analysis is after which a case will be put forward for testing and the results interpreted as well as presented in tables useful in academic writing. OVERVIEW OF DISCRIMINANT ANALYSIS Discriminant or discriminant function analysis is a parametric technique to determine which weightings of quantitative variables or predictors best discriminate between 2 or more than 2 groups of cases and do so better than chance (Cramer, 2003). The analysis creates a discriminant function which is a linear combination of the weightings and scores on these variables. The maximum number of functions is either the number of predictors or the number of groups minus one, whichever
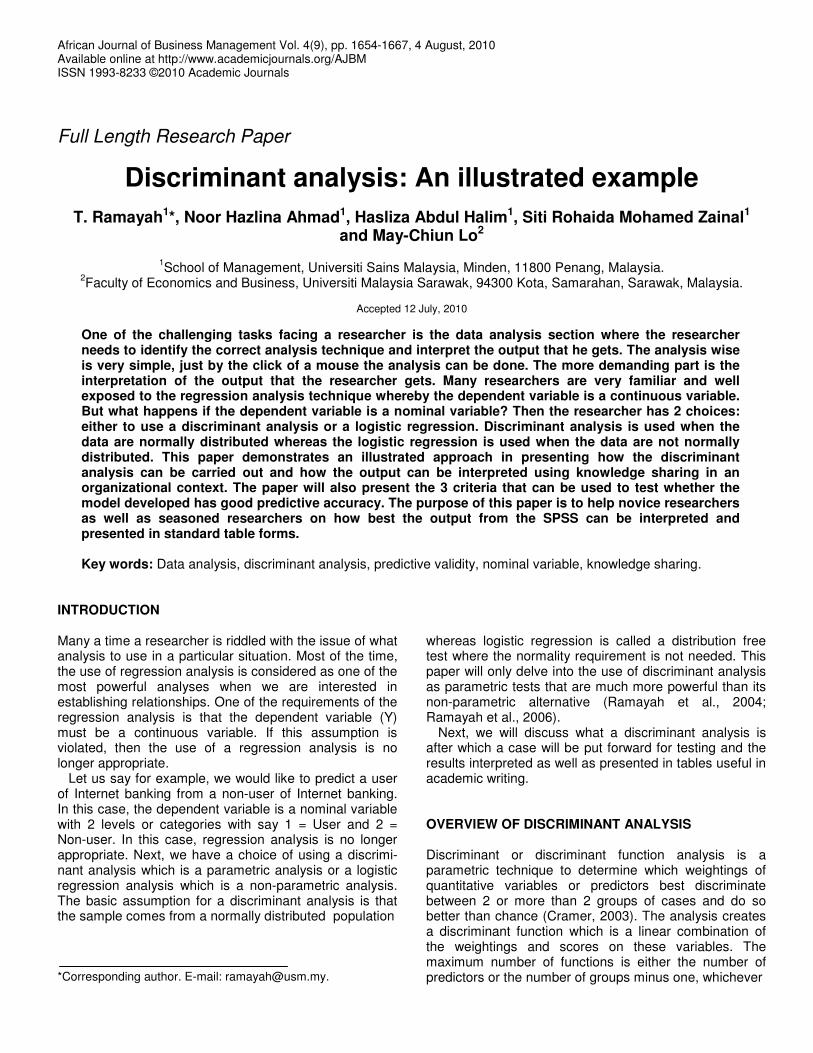
of these two values is the smaller. Zjk = a + W1X1k + W2X2k + ... + WnXnk Where: Zjk = Discriminant Z score of discriminant function j for object k. a = Intercept. Wi = Discriminant coefficient for the Independent variable i. Xj = Independent variable i for object k. Again, caution must be taken to be clear that sometimes the focus of the analysis is not to predict but to explain the relationship, as such, equations are not normally written when the measures used are not objective measurements. Cutting score In a 2 group discriminant function, the cutting score will be used to classify the 2 groups uniquely. The cutting score is the score used for constructing the classification matrix. Optimal cutting score depends on sizes of groups. If equal, it is halfway between the two groups centroid. The formula is shown below:
Low High Cutting score • Centroid 1 Centroid 2
Equal group:
NNZNZN
BA
ABBA
++
=CSZ
Where: ZCS = Optimal cutting score between group A and B. NA = Number of observations in group A. NB = Number of observations in group B. ZA = Centroid for Group A. ZB = Centroid for Group B. Unequal group
2Z CE
ZZ BA+
=
Ramayah et al. 1655 Where: ZCE = Optimal cutting score for equal group size. ZA = Centroid for Group A. ZB = Centroid for Group B. THE CASE The company of interest is a multinational company operating in the Bayan Lepas Free Trade Zone area in Penang. The population of interest is defined as all employees of this company. The management of the company has been observing a phenomenon whereby there are some employees who share information at a much higher level as compared to some others who only share at a very low level. RESEARCH PROBLEM In a growing organization, knowledge sharing is very important where it will lead to reduced mistakes, allow quick resolution, permit quick problem solving, quicken the learning process and importantly, all this will lead towards cost saving. Individuals do not share knowledge without personal benefits. Personal belief can change individual’s thought of benefit and having self satisfaction will encourage knowledge sharing. Knowledge sharing does not only save employer’s and employee’s time (Gibbert and Krause, 2002) but doing so in an organizational setting results in the classic public good dilemma (Barry and Hardin, 1982; Marwell and Oliver, 1983).
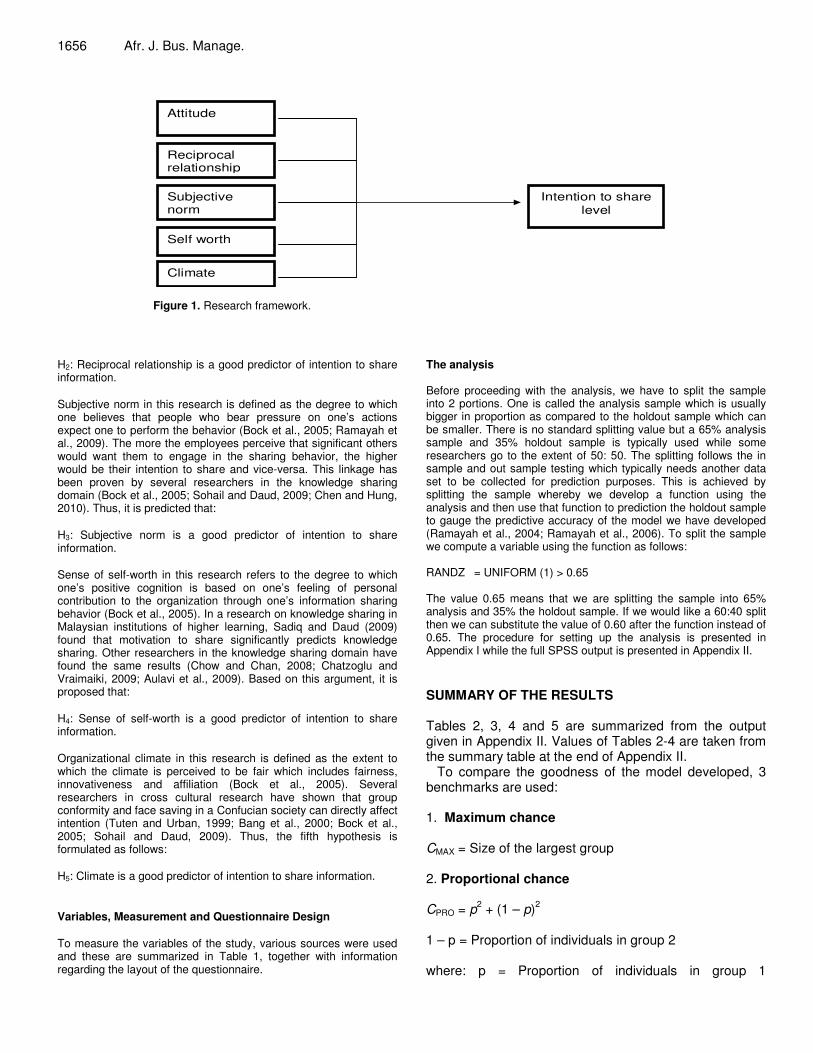
The management would like to observe the factors that discriminate those who have high intention of sharing from those with low intention of information sharing. The reason being, once this can be identified, some intervention measures can be put in place to enhance the information sharing. A review of the literature unearthed 5 variables that can be identified as possible discrimi-nators-these include attitude towards information sharing, self worth of the employee, the climate of the organization, the subjective norm related to information sharing and reciprocal relationship. Following this, the study endeavors to test the effects of the above mentioned factors on knowledge sharing in an organization. As depicted in Figure 1, a research model is advanced for further investigation.
Based on the research framework 5 hypotheses were derived as shown below: Ajzen and Fishbein (1980) proposed that intention to engage in a behavior is determined by an individual’s attitude towards the behavior. In this research, attitude is defined as the degree of one’s positive feelings about sharing one’s knowledge (Bock et al., 2005; Ramayah et al., 2009). This relationship has been confirmed by other researchers in the area of knowledge sharing (Bock et al., 2005; Chow and Chan, 2008). Thus, the first hypothesis conjectured that: H1: Attitude is a good predictor of intention to share information. Reciprocal relationship in this research refers to the degree to which one believes that one can improve mutual relationships with others through one’s information sharing (Bock et al., 2005). The more an employee perceives that his/her sharing of knowledge will be mutually beneficial, the higher likelihood that the sharing will occur (Sohail and Daud, 2009; Chatzoglu and Vraimaiki, 2009; Aulavi et al., 2009). As such, it is proposed that:
1656 Afr. J. Bus. Manage.
Intention to share level
Attitude
Reciprocal relationship
Subjective norm
Self worth
Climate
Figure 1. Research framework.
H2: Reciprocal relationship is a good predictor of intention to share information. Subjective norm in this research is defined as the degree to which one believes that people who bear pressure on one’s actions expect one to perform the behavior (Bock et al., 2005; Ramayah et al., 2009). The more the employees perceive that significant others would want them to engage in the sharing behavior, the higher would be their intention to share and vice-versa. This linkage has been proven by several researchers in the knowledge sharing domain (Bock et al., 2005; Sohail and Daud, 2009; Chen and Hung, 2010). Thus, it is predicted that: H3: Subjective norm is a good predictor of intention to share information. Sense of self-worth in this research refers to the degree to which one’s positive cognition is based on one’s feeling of personal contribution to the organization through one’s information sharing behavior (Bock et al., 2005). In a research on knowledge sharing in Malaysian institutions of higher learning, Sadiq and Daud (2009) found that motivation to share significantly predicts knowledge sharing. Other researchers in the knowledge sharing domain have found the same results (Chow and Chan, 2008; Chatzoglu and Vraimaiki, 2009; Aulavi et al., 2009). Based on this argument, it is proposed that: H4: Sense of self-worth is a good predictor of intention to share information. Organizational climate in this research is defined as the extent to which the climate is perceived to be fair which includes fairness, innovativeness and affiliation (Bock et al., 2005). Several researchers in cross cultural research have shown that group conformity and face saving in a Confucian society can directly affect intention (Tuten and Urban, 1999; Bang et al., 2000; Bock et al., 2005; Sohail and Daud, 2009). Thus, the fifth hypothesis is formulated as follows: H5: Climate is a good predictor of intention to share information. Variables, Measurement and Questionnaire Design To measure the variables of the study, various sources were used and these are summarized in Table 1, together with information regarding the layout of the questionnaire.
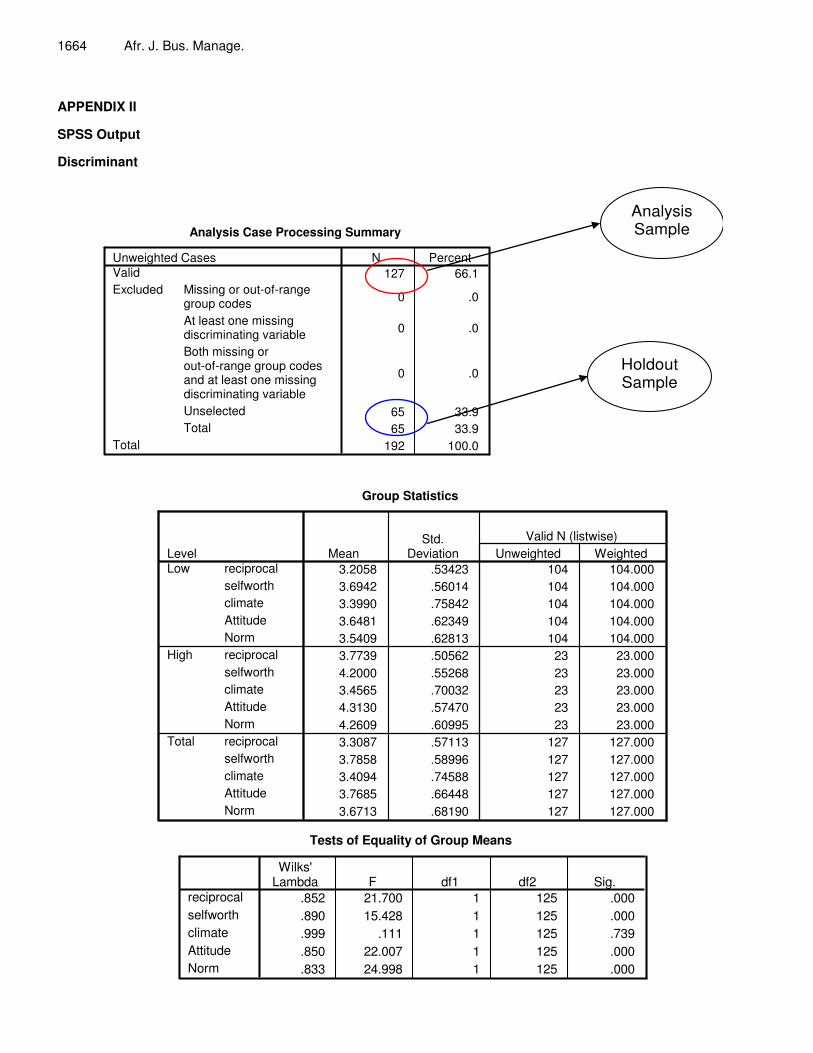
The analysis Before proceeding with the analysis, we have to split the sample into 2 portions. One is called the analysis sample which is usually bigger in proportion as compared to the holdout sample which can be smaller. There is no standard splitting value but a 65% analysis sample and 35% holdout sample is typically used while some researchers go to the extent of 50: 50. The splitting follows the in sample and out sample testing which typically needs another data set to be collected for prediction purposes. This is achieved by splitting the sample whereby we develop a function using the analysis and then use that function to prediction the holdout sample to gauge the predictive accuracy of the model we have developed (Ramayah et al., 2004; Ramayah et al., 2006). To split the sample we compute a variable using the function as follows: RANDZ = UNIFORM (1) > 0.65 The value 0.65 means that we are splitting the sample into 65% analysis and 35% the holdout sample. If we would like a 60:40 split then we can substitute the value of 0.60 after the function instead of 0.65. The procedure for setting up the analysis is presented in Appendix I while the full SPSS output is presented in Appendix II. SUMMARY OF THE RESULTS Tables 2, 3, 4 and 5 are summarized from the output given in Appendix II. Values of Tables 2-4 are taken from the summary table at the end of Appendix II. To compare the goodness of the model developed, 3 benchmarks are used: 1. Maximum chance CMAX = Size of the largest group 2. Proportional chance CPRO = p2 + (1 – p)2 1 – p = Proportion of individuals in group 2 where: p = Proportion of individuals in group 1
Ramayah et al. 1657
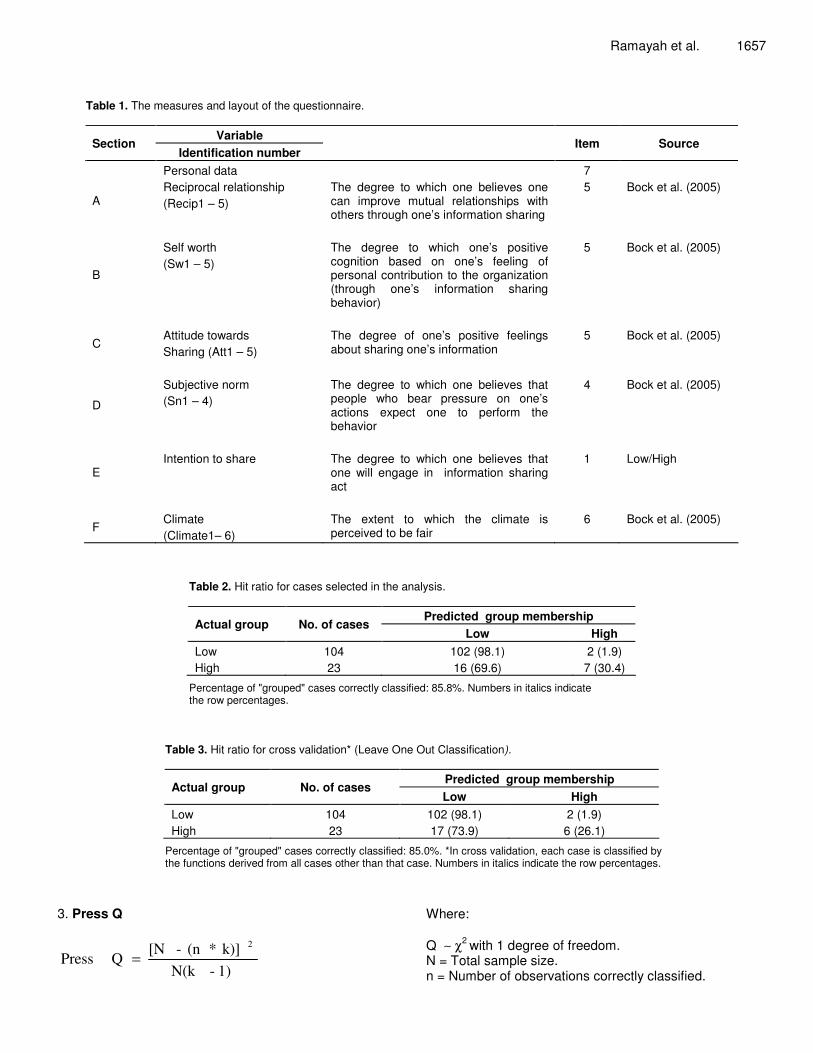
Table 1. The measures and layout of the questionnaire.
Variable Section
Identification number
Item Source
Personal data 7
A Reciprocal relationship (Recip1 – 5)
The degree to which one believes one can improve mutual relationships with others through one’s information sharing
5 Bock et al. (2005)
B
Self worth (Sw1 – 5)
The degree to which one’s positive cognition based on one’s feeling of personal contribution to the organization (through one’s information sharing behavior)
5 Bock et al. (2005)
C Attitude towards Sharing (Att1 – 5)
The degree of one’s positive feelings about sharing one’s information
5 Bock et al. (2005)
D
Subjective norm (Sn1 – 4)
The degree to which one believes that people who bear pressure on one’s actions expect one to perform the behavior
4 Bock et al. (2005)
E Intention to share
The degree to which one believes that one will engage in information sharing act
1 Low/High
F Climate (Climate1– 6)
The extent to which the climate is perceived to be fair
6 Bock et al. (2005)
Table 2. Hit ratio for cases selected in the analysis.
Predicted group membership Actual group No. of cases
Low High Low 104 102 (98.1) 2 (1.9) High 23 16 (69.6) 7 (30.4)
Percentage of "grouped" cases correctly classified: 85.8%. Numbers in italics indicate the row percentages.
Table 3. Hit ratio for cross validation* (Leave One Out Classification).
Predicted group membership Actual group No. of cases
Low High Low 104 102 (98.1) 2 (1.9) High 23 17 (73.9) 6 (26.1)
Percentage of "grouped" cases correctly classified: 85.0%. *In cross validation, each case is classified by the functions derived from all cases other than that case. Numbers in italics indicate the row percentages.
3. Press Q
1)-N(kk)]*(n - [N
Q Press2
=
Where: Q ∼ χ2 with 1 degree of freedom. N = Total sample size. n = Number of observations correctly classified.

1658 Afr. J. Bus. Manage.
Table 4. Hit ratio for cases in the holdout sample.
Predicted group membership Actual group No. of cases
Low High Low 52 52 (100) 0 (0) High 13 6 (46.2) 7 (53.8)
Percentage of "grouped" cases correctly classified: 90.8%.
Table 5. Comparison of goodness of results.
Measure Value Hit ratio for holdout sample Maximum chance 0.80 90.8 Proportional chance 0.68 90.8 Comparison with Hair et al. (2010) 1.25 times higher than chance 0.85 Press Q table value 6.635 Press Q calculated value 43.22**
** p< 0.01. k = Number of groups. Press Q Calculation:
43.22 1)-65(2
2)]*(59 - [65 Q Press
2
==
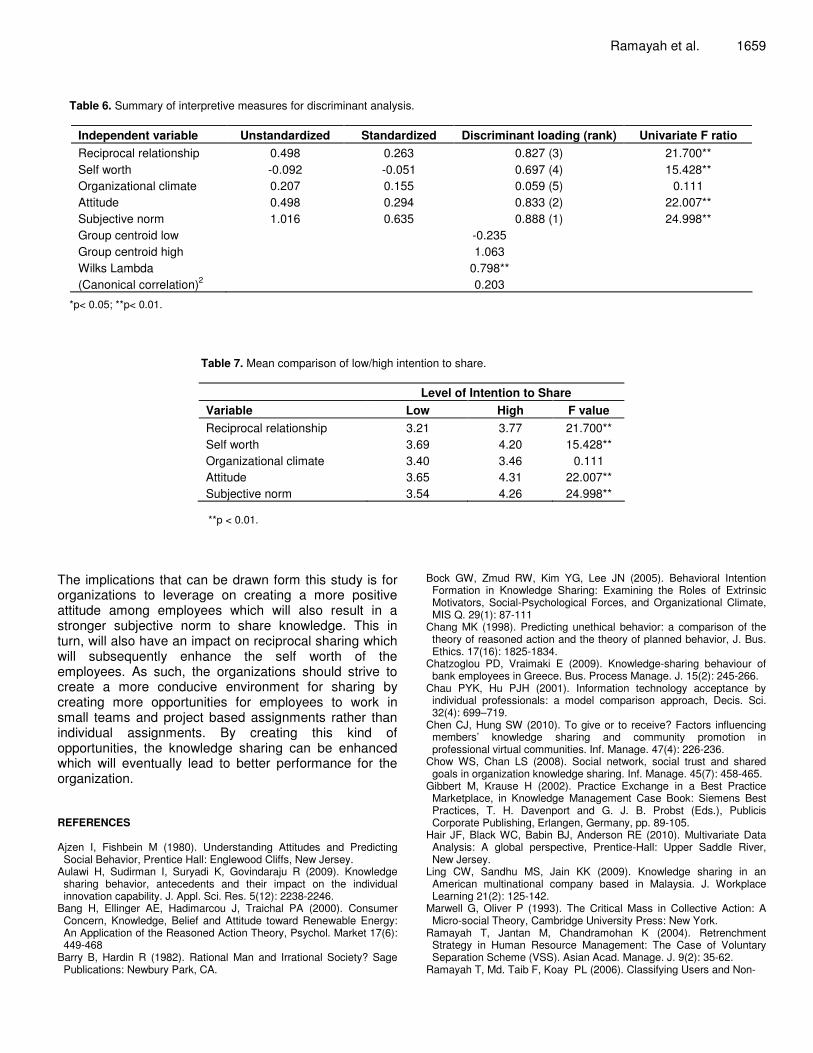
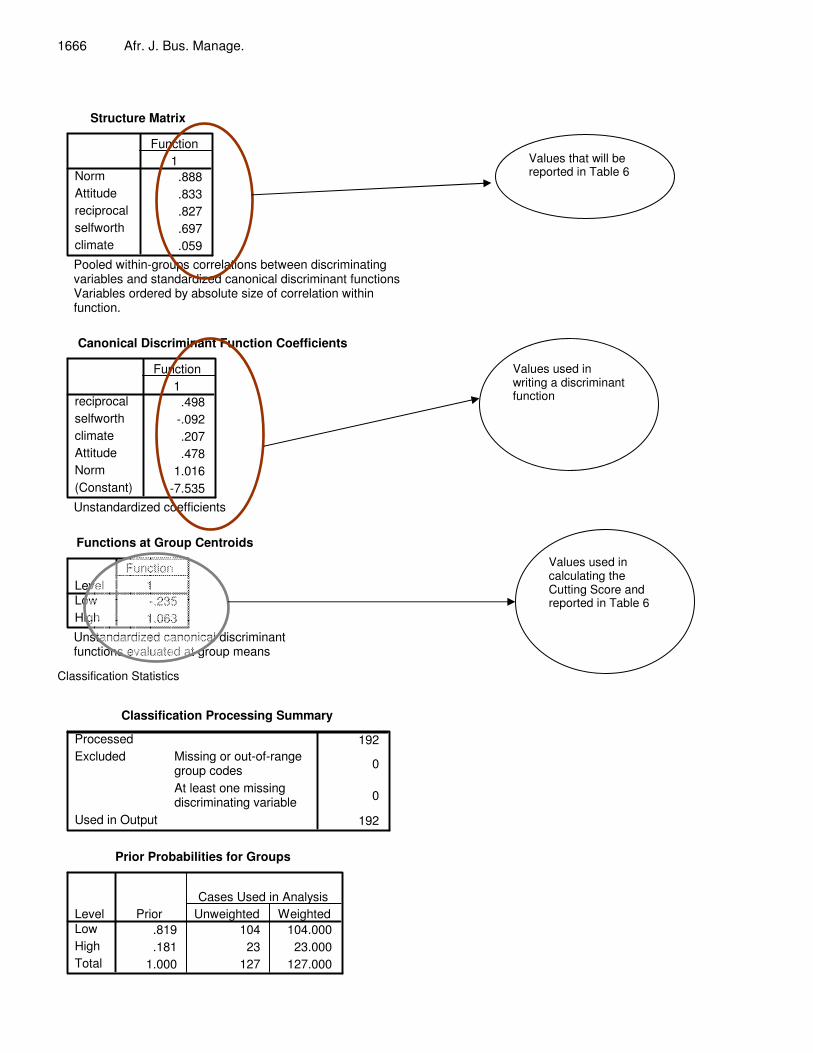
As shown above, the predictive accuracy of the model for the analysis sample was 85.8%, the cross validation sample was 85.0% and the holdout sample was 90.8% respectively (see Tables 2, 3 and 4). The values in Table 5 indicate that the hit ratio of 90.8% for the holdout sample exceeded both the maximum and proportional chance values. The Press Q statistics of 43.22 was significant. Hence, the model investigated has good predictive power. With a canonical correlation of 0.45, it can be concluded that 20.3% (square of the canonical correlation) of the variance in the dependent variable was accounted for by this model. A summary of the univariate analysis indicating the influential variables to the low/high intention to share is presented in Table 6.
Calculation of the cutting score:
NNZNZN
BA
ABBA
++
=CUZ
8236.023104
)235.0(23)063.1(104Z CU =
+−+=
The graphical depiction of the cutting score.
Low 0.8034 High Cutting score • Centroid 1 Centroid 2 -0.235 1.063
From the analysis we can see that the 3 significant variables carry a positive sign which means it helps to discriminate the employees with high intention to share whereas self worth carries a negative sign which helps to predict the low intention to share by employees. Employees who have a more positive attitude and perceive there is a strong reciprocal relationship and sub-jective norm will have high intention to share. Employees who have a lower self worth will have low intention to share. Table 7 is used to support the arguments given above. Conclusion This paper has presented an illustrated guide to how discriminant analysis can be conducted and how the results can be reported and interpreted in a manner that is easily understood. The following conclusions can be drawn based on the analysis:
• The higher the reciprocal relationship perceived by the employees, the higher will be the knowledge shared.
• The higher the self worth (the degree to which one’s positive cognition based on one’s feeling of personal contribution to the organization through one’s information sharing behavior), the higher will be the knowledge shared.
• The more positive the attitude towards knowledge sharing, the higher will be the knowledge shared.
• The higher the degree to which one believes that people who bear pressure on their actions expect them to share knowledge, the higher will be the knowledge shared.
• Climate did not play a role in discriminating knowledge sharing levels.
Ramayah et al. 1659
Table 6. Summary of interpretive measures for discriminant analysis.
Independent variable Unstandardized Standardized Discriminant loading (rank) Univariate F ratio Reciprocal relationship 0.498 0.263 0.827 (3) 21.700** Self worth -0.092 -0.051 0.697 (4) 15.428** Organizational climate 0.207 0.155 0.059 (5) 0.111 Attitude 0.498 0.294 0.833 (2) 22.007** Subjective norm 1.016 0.635 0.888 (1) 24.998** Group centroid low -0.235 Group centroid high 1.063 Wilks Lambda 0.798** (Canonical correlation)2 0.203
*p< 0.05; **p< 0.01.
Table 7. Mean comparison of low/high intention to share. Level of Intention to Share Variable Low High F value Reciprocal relationship Self worth Organizational climate Attitude Subjective norm
3.21 3.69 3.40 3.65 3.54
3.77 4.20 3.46 4.31 4.26
21.700** 15.428**
0.111 22.007** 24.998**
**p < 0.01.
The implications that can be drawn form this study is for organizations to leverage on creating a more positive attitude among employees which will also result in a stronger subjective norm to share knowledge. This in turn, will also have an impact on reciprocal sharing which will subsequently enhance the self worth of the employees. As such, the organizations should strive to create a more conducive environment for sharing by creating more opportunities for employees to work in small teams and project based assignments rather than individual assignments. By creating this kind of opportunities, the knowledge sharing can be enhanced which will eventually lead to better performance for the organization. REFERENCES Ajzen I, Fishbein M (1980). Understanding Attitudes and Predicting
Social Behavior, Prentice Hall: Englewood Cliffs, New Jersey. Aulawi H, Sudirman I, Suryadi K, Govindaraju R (2009). Knowledge
sharing behavior, antecedents and their impact on the individual innovation capability. J. Appl. Sci. Res. 5(12): 2238-2246.
Bang H, Ellinger AE, Hadimarcou J, Traichal PA (2000). Consumer Concern, Knowledge, Belief and Attitude toward Renewable Energy: An Application of the Reasoned Action Theory, Psychol. Market 17(6): 449-468
Barry B, Hardin R (1982). Rational Man and Irrational Society? Sage Publications: Newbury Park, CA.
Bock GW, Zmud RW, Kim YG, Lee JN (2005). Behavioral Intention Formation in Knowledge Sharing: Examining the Roles of Extrinsic Motivators, Social-Psychological Forces, and Organizational Climate, MIS Q. 29(1): 87-111
Chang MK (1998). Predicting unethical behavior: a comparison of the theory of reasoned action and the theory of planned behavior, J. Bus. Ethics. 17(16): 1825-1834.
Chatzoglou PD, Vraimaki E (2009). Knowledge-sharing behaviour of bank employees in Greece. Bus. Process Manage. J. 15(2): 245-266.
Chau PYK, Hu PJH (2001). Information technology acceptance by individual professionals: a model comparison approach, Decis. Sci. 32(4): 699–719.
Chen CJ, Hung SW (2010). To give or to receive? Factors influencing members’ knowledge sharing and community promotion in professional virtual communities. Inf. Manage. 47(4): 226-236.
Chow WS, Chan LS (2008). Social network, social trust and shared goals in organization knowledge sharing. Inf. Manage. 45(7): 458-465.
Gibbert M, Krause H (2002). Practice Exchange in a Best Practice Marketplace, in Knowledge Management Case Book: Siemens Best Practices, T. H. Davenport and G. J. B. Probst (Eds.), Publicis Corporate Publishing, Erlangen, Germany, pp. 89-105.
Hair JF, Black WC, Babin BJ, Anderson RE (2010). Multivariate Data Analysis: A global perspective, Prentice-Hall: Upper Saddle River, New Jersey.
Ling CW, Sandhu MS, Jain KK (2009). Knowledge sharing in an American multinational company based in Malaysia. J. Workplace Learning 21(2): 125-142.
Marwell G, Oliver P (1993). The Critical Mass in Collective Action: A Micro-social Theory, Cambridge University Press: New York.
Ramayah T, Jantan M, Chandramohan K (2004). Retrenchment Strategy in Human Resource Management: The Case of Voluntary Separation Scheme (VSS). Asian Acad. Manage. J. 9(2): 35-62.
Ramayah T, Md. Taib F, Koay PL (2006). Classifying Users and Non-
1660 Afr. J. Bus. Manage. Users of Internet Banking in Northern Malaysia. J. Internet Bank.
Commerce, August 2006, 11(2), [Online] Available: http://www.arraydev.com/commerce/JIBC/2006-08/Thurasamy.asp.htm
Ramayah T, Rouibah K, Gopi M, Rangel GJ (2009). A decomposed theory of reasoned action to explain Intention to use Internet stock trading among Malaysian investors. Comput. Hum. Behav. 25(2): 1222-1230.
Sohail MS, Daud S (2009). Knowledge sharing in higher education institutions: Perspectives from Malaysia. VINE: J. Inf. Knowl. Manage. Syst. 39(2): 125-142.
Tuten TL, Urban DJ (1999). Specific Responses to Unmet Expectations:
The Value of Linking Fishbein’s Theory of Reasoned Action and Rusbult’s Investment Model, Int. J. Manage. 16(4): 484-489.
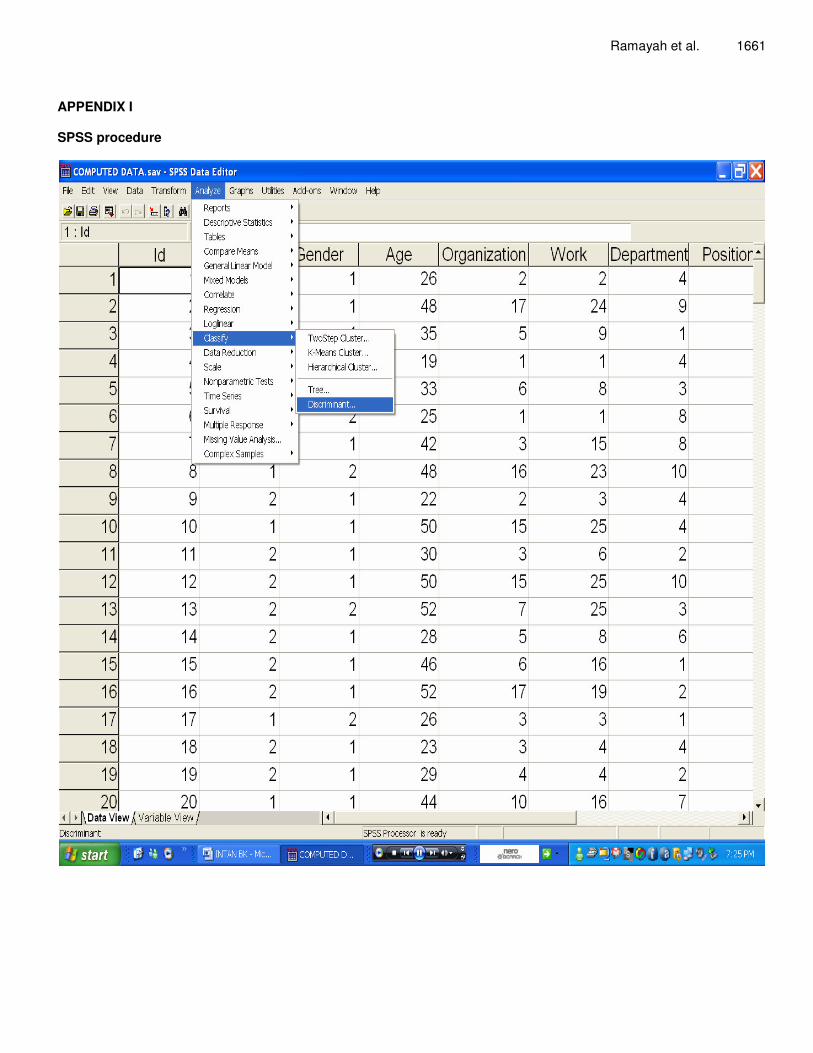
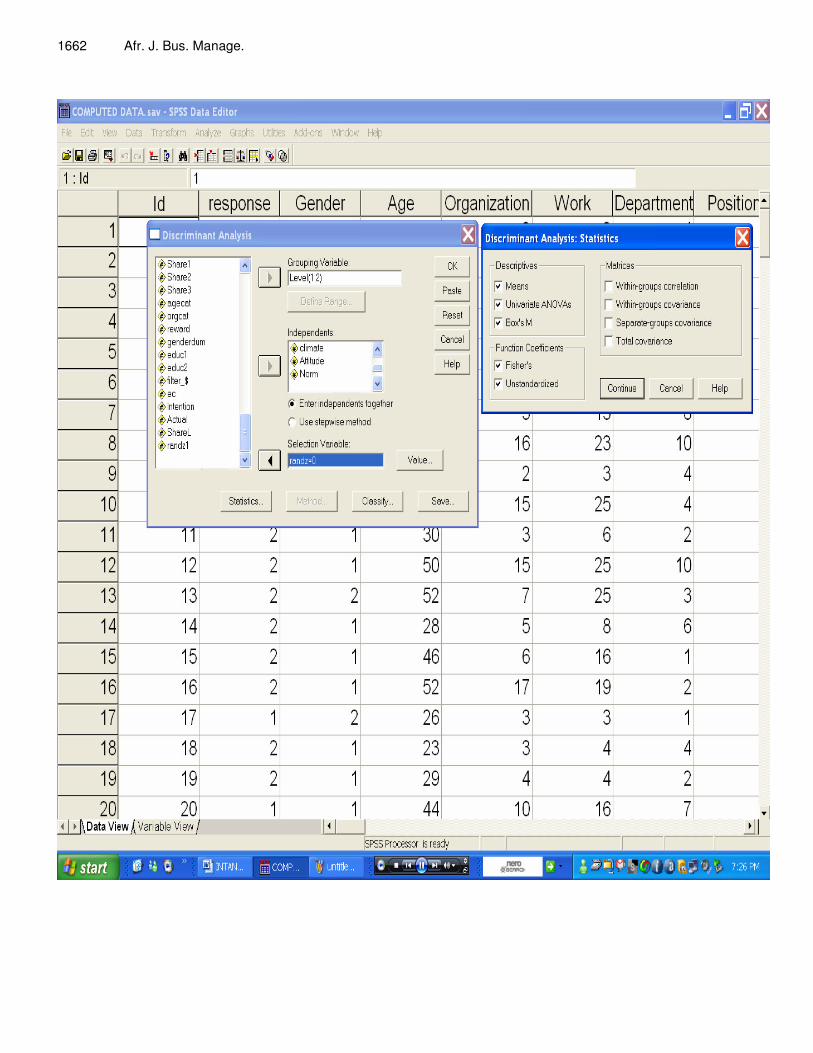
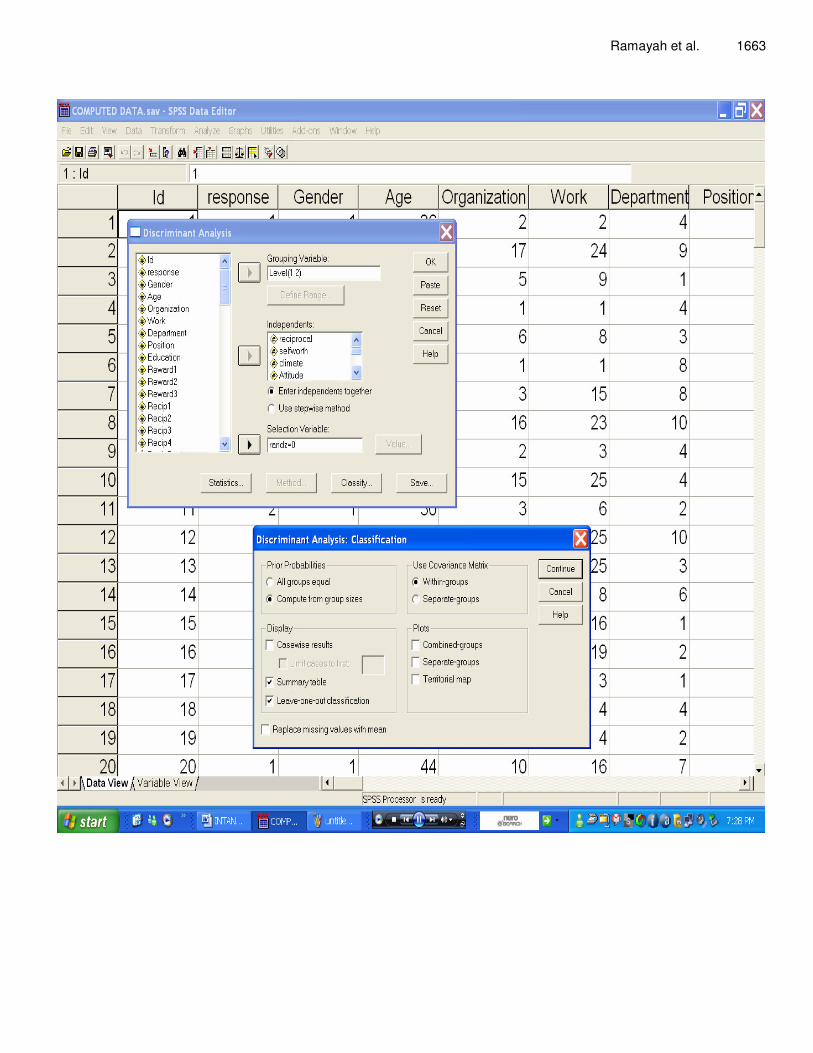
Ramayah et al. 1661 APPENDIX I SPSS procedure
1662 Afr. J. Bus. Manage.
Ramayah et al. 1663
1664 Afr. J. Bus. Manage. APPENDIX II SPSS Output Discriminant
Analysis Case Processing Summary
127 66.1
0 .0
0 .0
0 .0
65 33.965 33.9
192 100.0
Unweighted CasesValid
Missing or out-of-rangegroup codesAt least one missingdiscriminating variableBoth missing orout-of-range group codesand at least one missingdiscriminating variableUnselectedTotal
Excluded
Total
N Percent
Analysis Sample
Holdout Sample
Group Statistics
3.2058 .53423 104 104.0003.6942 .56014 104 104.0003.3990 .75842 104 104.0003.6481 .62349 104 104.0003.5409 .62813 104 104.0003.7739 .50562 23 23.0004.2000 .55268 23 23.0003.4565 .70032 23 23.0004.3130 .57470 23 23.0004.2609 .60995 23 23.0003.3087 .57113 127 127.0003.7858 .58996 127 127.0003.4094 .74588 127 127.0003.7685 .66448 127 127.0003.6713 .68190 127 127.000
reciprocalselfworthclimateAttitudeNormreciprocalselfworthclimateAttitudeNormreciprocalselfworthclimateAttitudeNorm
LevelLow
High
Total
MeanStd.
Deviation Unweighted WeightedValid N (listwise)
Tests of Equality of Group Means
.852 21.700 1 125 .000
.890 15.428 1 125 .000
.999 .111 1 125 .739
.850 22.007 1 125 .000
.833 24.998 1 125 .000
reciprocalselfworthclimateAttitudeNorm
Wilks'Lambda F df1 df2 Sig.
Ramayah et al. 1665
Analysis 1 Box's test of equality of covariance matrices.
Log Determinants
5 -7.6325 -9.5815 -7.569
LevelLowHighPooled within-groups
RankLog
Determinant
The ranks and natural logarithms of determinantsprinted are those of the group covariance matrices.
Test Results
50.8013.095
156175.171
.000
Box's MApprox.df1df2Sig.
F
Tests null hypothesis of equal population covariance matrices.
Summary of Canonical Discriminant Functions
Eigenvalues
.254a 100.0 100.0 .450Function1
Eigenvalue% of
Variance Cumulative %CanonicalCorrelation
First 1 canonical discriminant functions were used in theanalysis.
a.
Wilks' Lambda
.798 27.700 5 .000Test of Function(s)1
Wilks'Lambda Chi-square df Sig.
Standardized CanonicalDiscriminant Function Coefficients
.263-.051.155.294.635
reciprocalselfworthclimateAttitudeNorm
1Function
Test of equality of variance
Measures the strength of relationship
Values that will be reported in Table 6
Value that will be reported in Table 6
1666 Afr. J. Bus. Manage.
Structure Matrix
.888
.833
.827
.697
.059
NormAttitudereciprocalselfworthclimate
1Function
Pooled within-groups correlations between discriminatingvariables and standardized canonical discriminant functions Variables ordered by absolute size of correlation withinfunction.
Canonical Discriminant Function Coefficients
.498-.092.207.478
1.016-7.535
reciprocalselfworthclimateAttitudeNorm(Constant)
1Function
Unstandardized coefficients
Functions at Group Centroids
-.2351.063
LevelLowHigh
1Function
Unstandardized canonical discriminantfunctions evaluated at group means
Classification Statistics
Classification Processing Summary
192
0
0
192
ProcessedMissing or out-of-rangegroup codesAt least one missingdiscriminating variable
Excluded
Used in Output
Prior Probabilities for Groups
.819 104 104.000
.181 23 23.0001.000 127 127.000
LevelLowHighTotal
Prior Unweighted WeightedCases Used in Analysis
Values used in writing a discriminant function
Values that will be reported in Table 6
Values used in calculating the Cutting Score and reported in Table 6
Ramayah et al. 1667
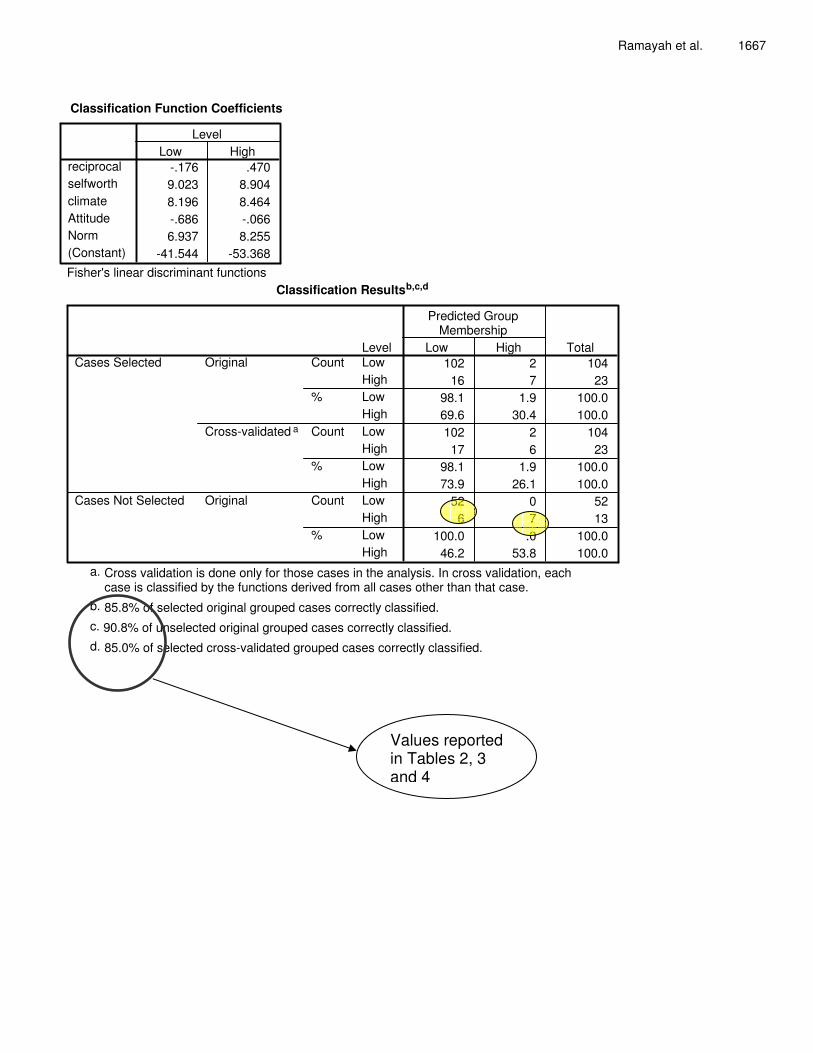
Classification Function Coefficients
-.176 .4709.023 8.9048.196 8.464-.686 -.0666.937 8.255
-41.544 -53.368
reciprocalselfworthclimateAttitudeNorm(Constant)
Low HighLevel
Fisher's linear discriminant functions Classification Resultsb,c,d
102 2 10416 7 23
98.1 1.9 100.069.6 30.4 100.0102 2 10417 6 23
98.1 1.9 100.073.9 26.1 100.0
52 0 526 7 13
100.0 .0 100.046.2 53.8 100.0
LevelLowHighLowHighLowHighLowHighLowHighLowHigh
Count
%
Count
%
Count
%
Original
Cross-validated a
Original
Cases Selected
Cases Not Selected
Low High
Predicted GroupMembership
Total
Cross validation is done only for those cases in the analysis. In cross validation, eachcase is classified by the functions derived from all cases other than that case.
a.
85.8% of selected original grouped cases correctly classified.b.
90.8% of unselected original grouped cases correctly classified.c.
85.0% of selected cross-validated grouped cases correctly classified.d.
Values reported in Tables 2, 3 and 4


