Download - Diabetic kidney disease
Diabetic Kidney DiseaseWhat have you done for me lately
Conflicts of interest• ZS Pharma honorarium
• Relypsa bought me breakfast
• Astute speaker bureau
• Alexis honorarium
• Astellas travel honorarium
• Davita partner in multiple dialysis units and a vascular access center
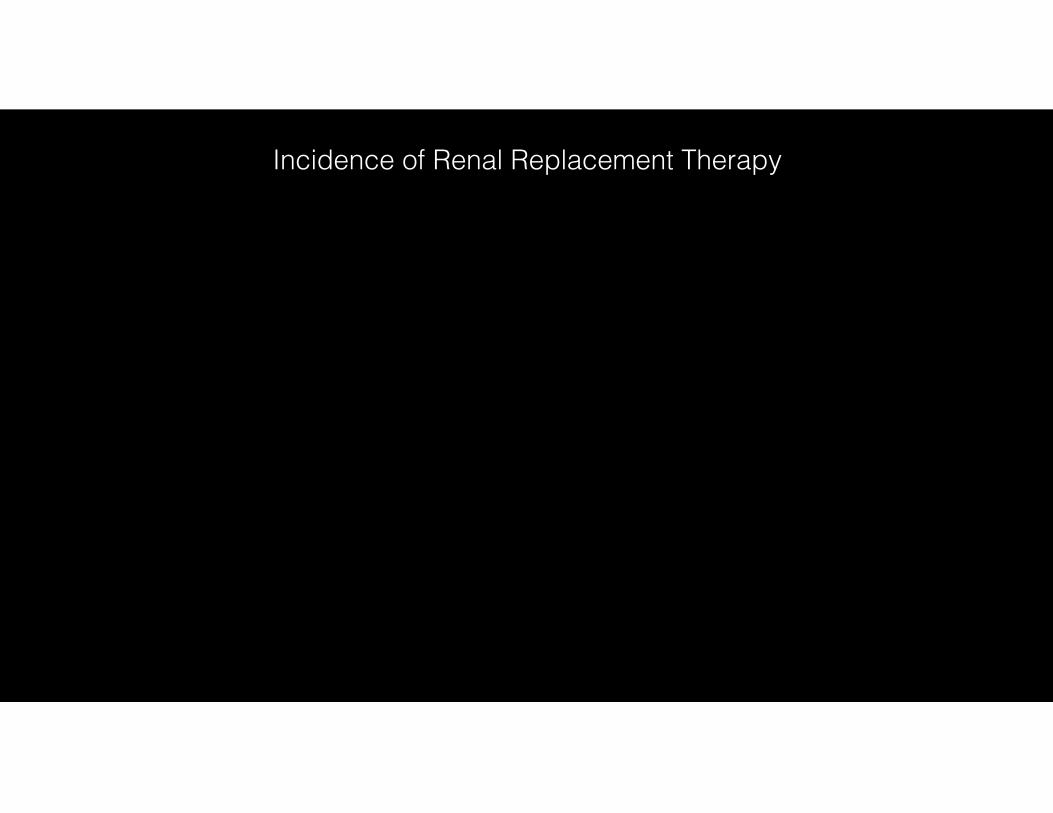
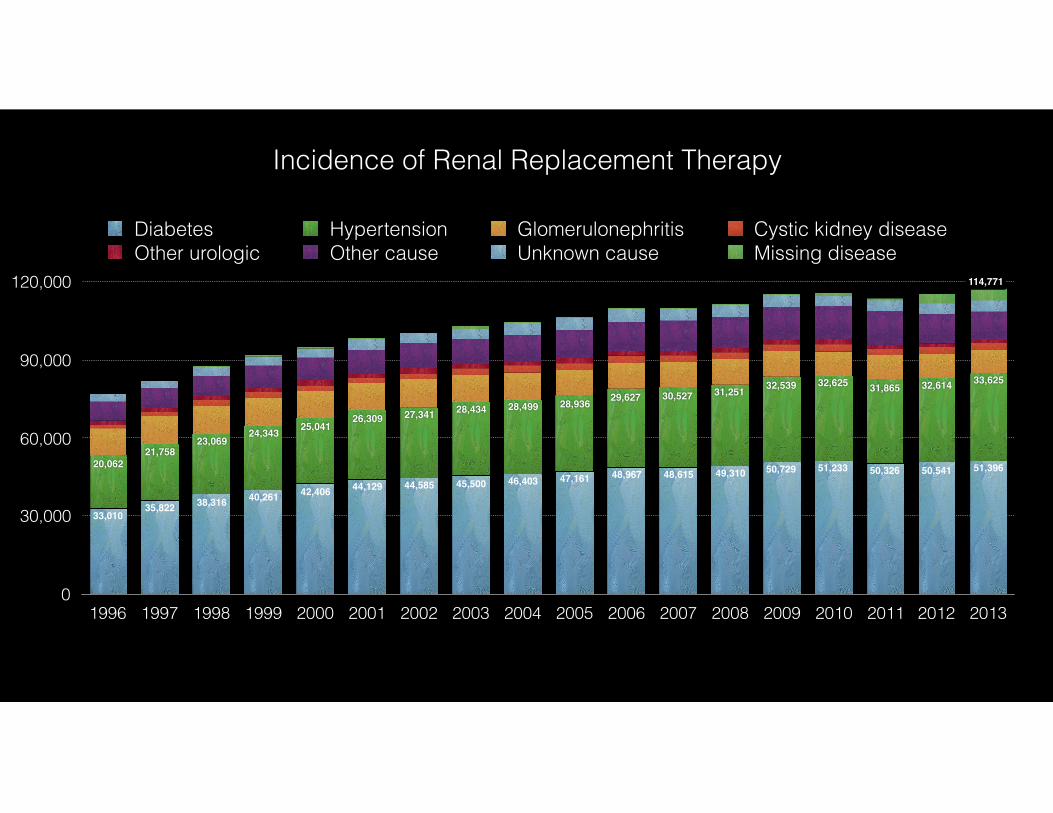
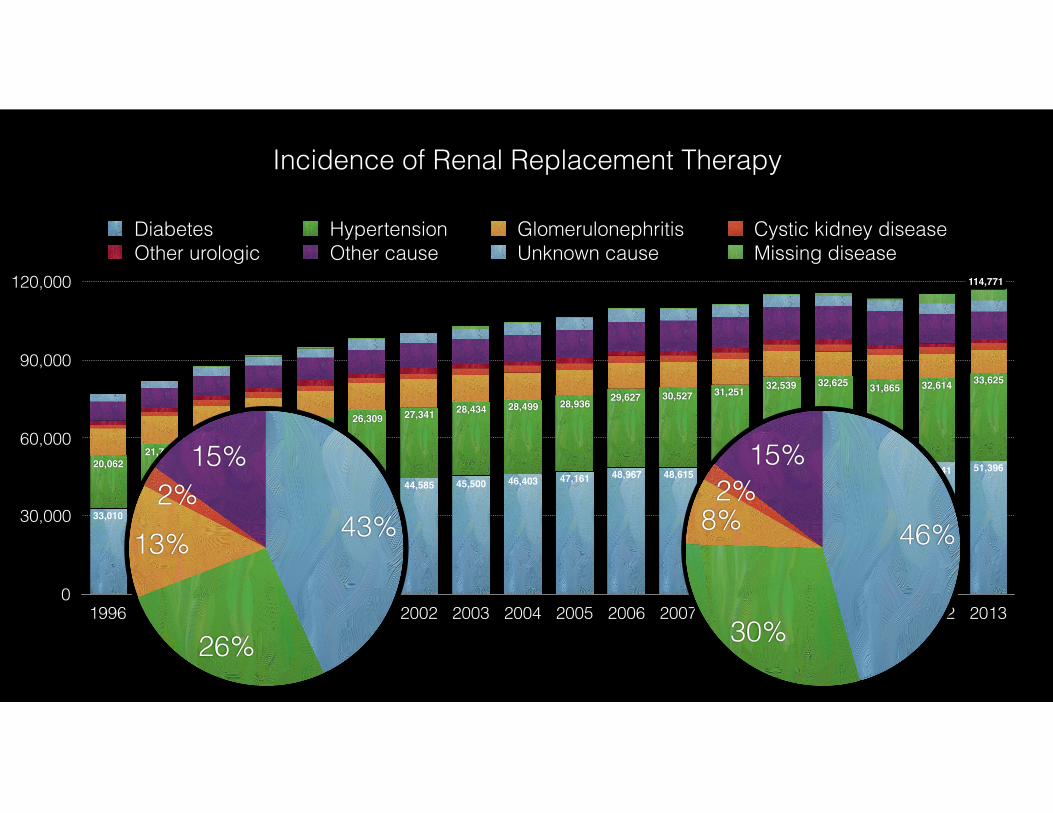
Incidence of Renal Replacement Therapy
0
30,000
60,000
90,000
120,000
1996 1997 1998 1999 2000 2001 2002 2003 2004 2005 2006 2007 2008 2009 2010 2011 2012 2013
33,62532,61431,86532,62532,53931,25130,52729,62728,93628,49928,43427,34126,30925,04124,343
23,06921,758
20,062 51,39650,54150,32651,23350,72949,31048,61548,96747,16146,40345,50044,58544,12942,40640,26138,31635,82233,010
Diabetes Hypertension Glomerulonephritis Cystic kidney diseaseOther urologic Other cause Unknown cause Missing disease
114,771
15%2%
8%
30%
46%
15%2%
13%
26%
43%
Incidence of Renal Replacement Therapy

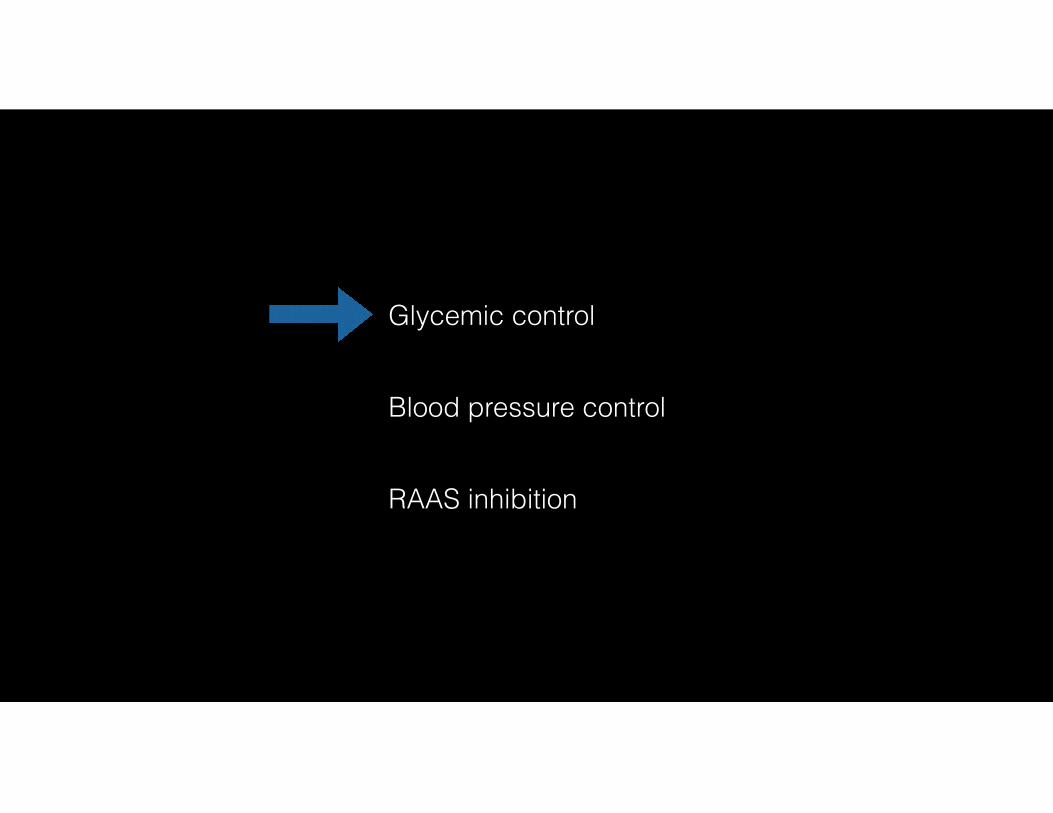
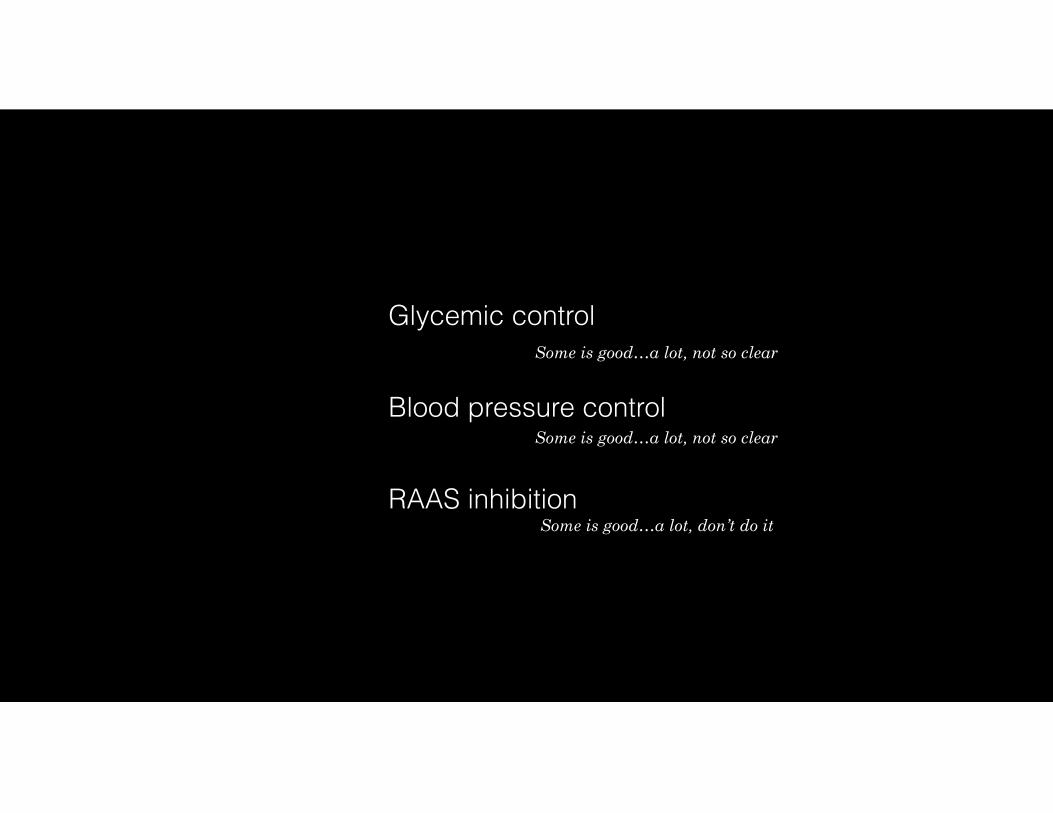
Glycemic control
RAAS inhibition
Blood pressure control
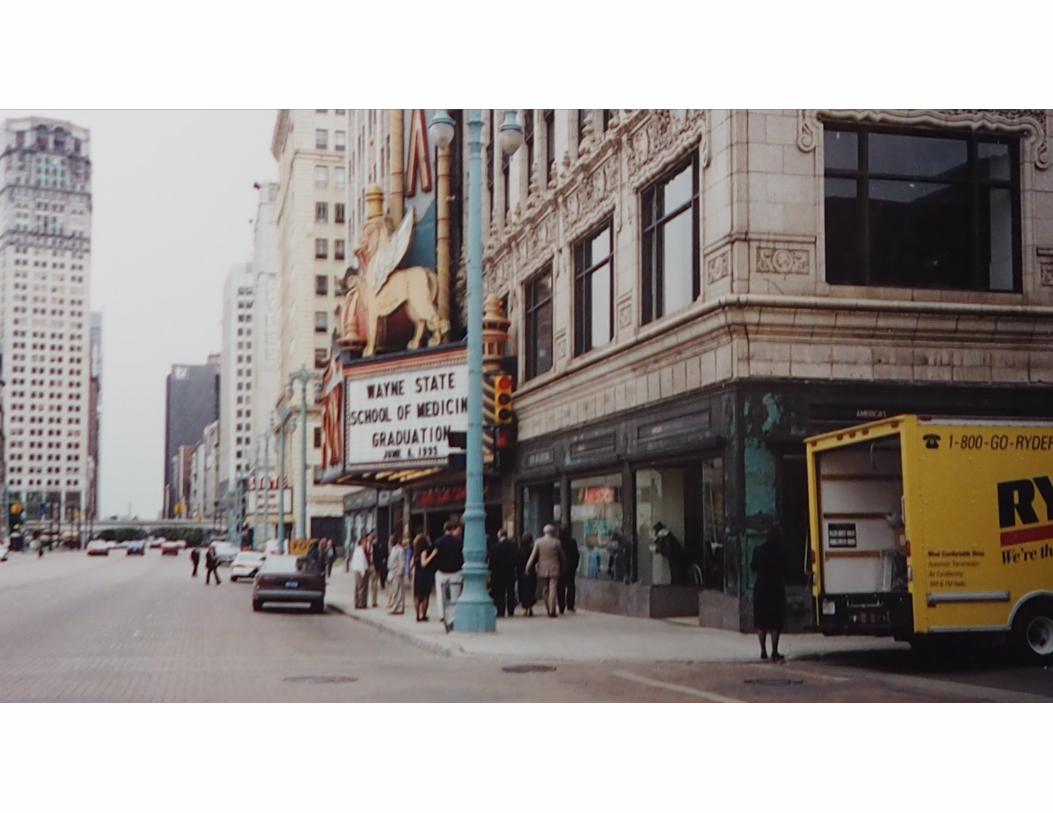

WSU Graduation, 1995


Glycemic control
RAAS inhibition
Blood pressure control
Glycemic control
RAAS inhibition
Blood pressure control
The New England Journal of Medicine Downloaded from nejm.org by JOEL TOPF on June 5, 2016. For personal use only. No other uses without permission.
Copyright © 1993 Massachusetts Medical Society. All rights reserved.
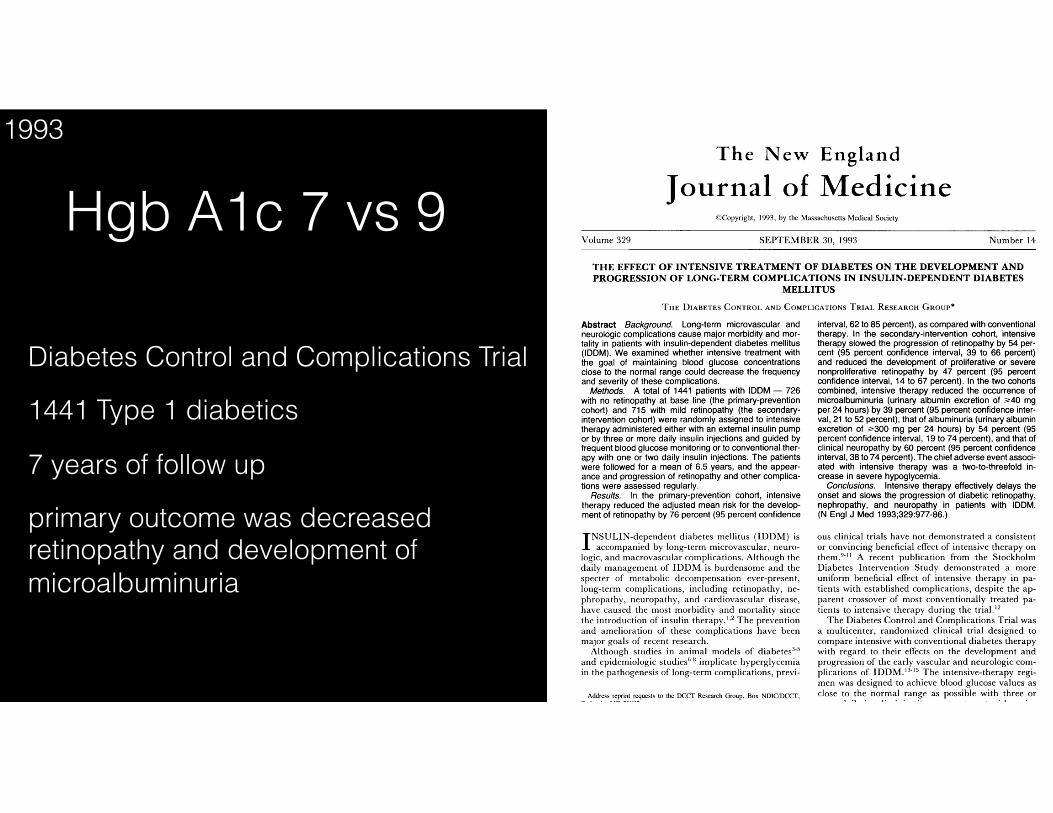
Diabetes Control and Complications Trial
1441 Type 1 diabetics
7 years of follow up
primary outcome was decreased retinopathy and development of microalbuminuria
Hgb A1c 7 vs 91993
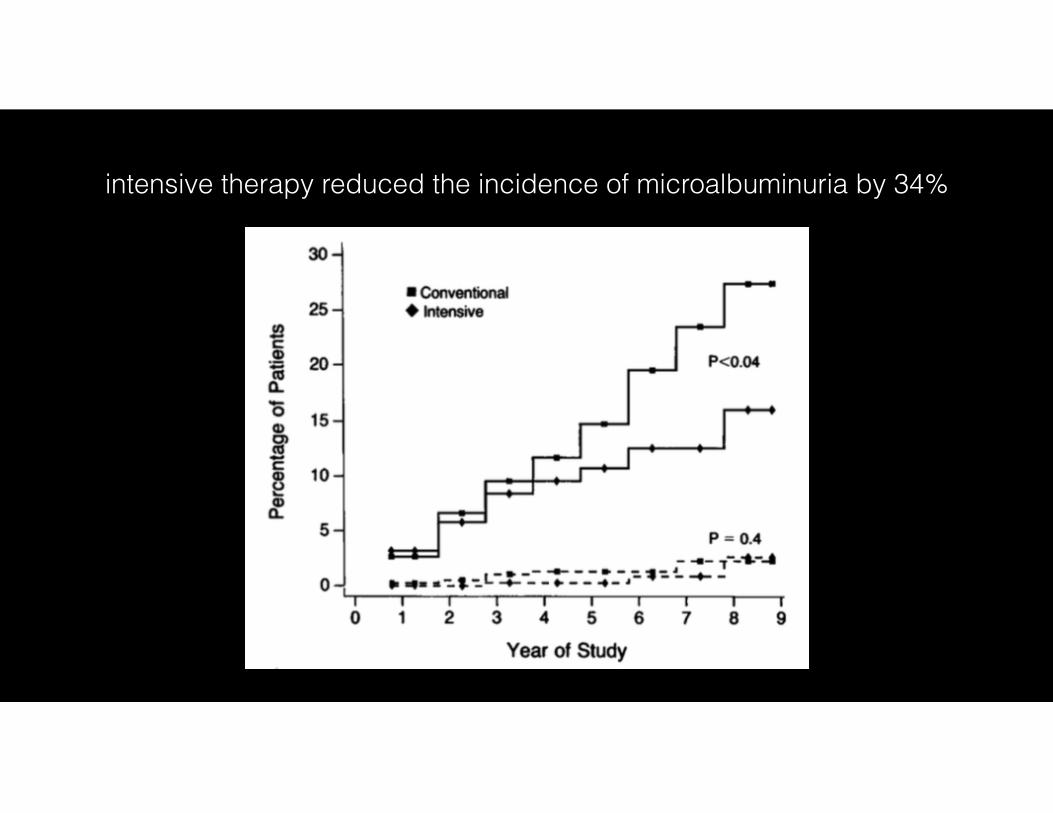
intensive therapy reduced the incidence of microalbuminuria by 34%
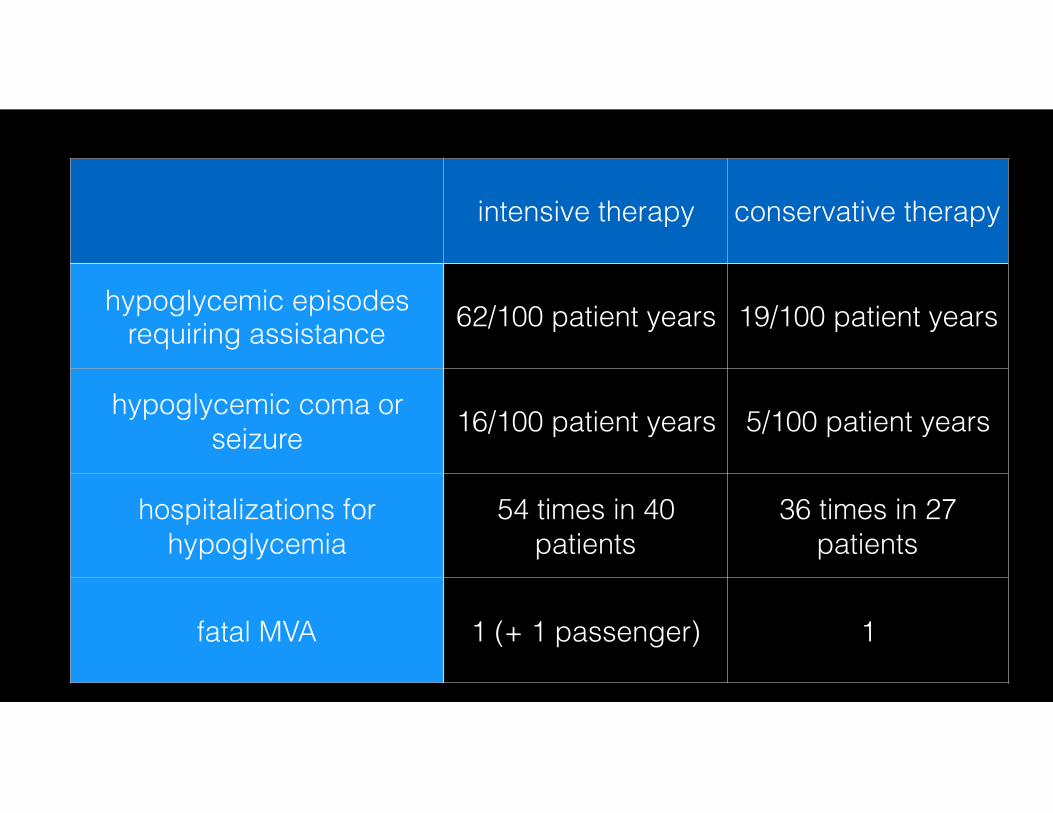
intensive therapy conservative therapy
hypoglycemic episodes requiring assistance 62/100 patient years 19/100 patient years
hypoglycemic coma or seizure 16/100 patient years 5/100 patient years
hospitalizations for hypoglycemia
54 times in 40 patients
36 times in 27 patients
fatal MVA 1 (+ 1 passenger) 1
Copyright 2015 American Medical Association. All rights reserved.
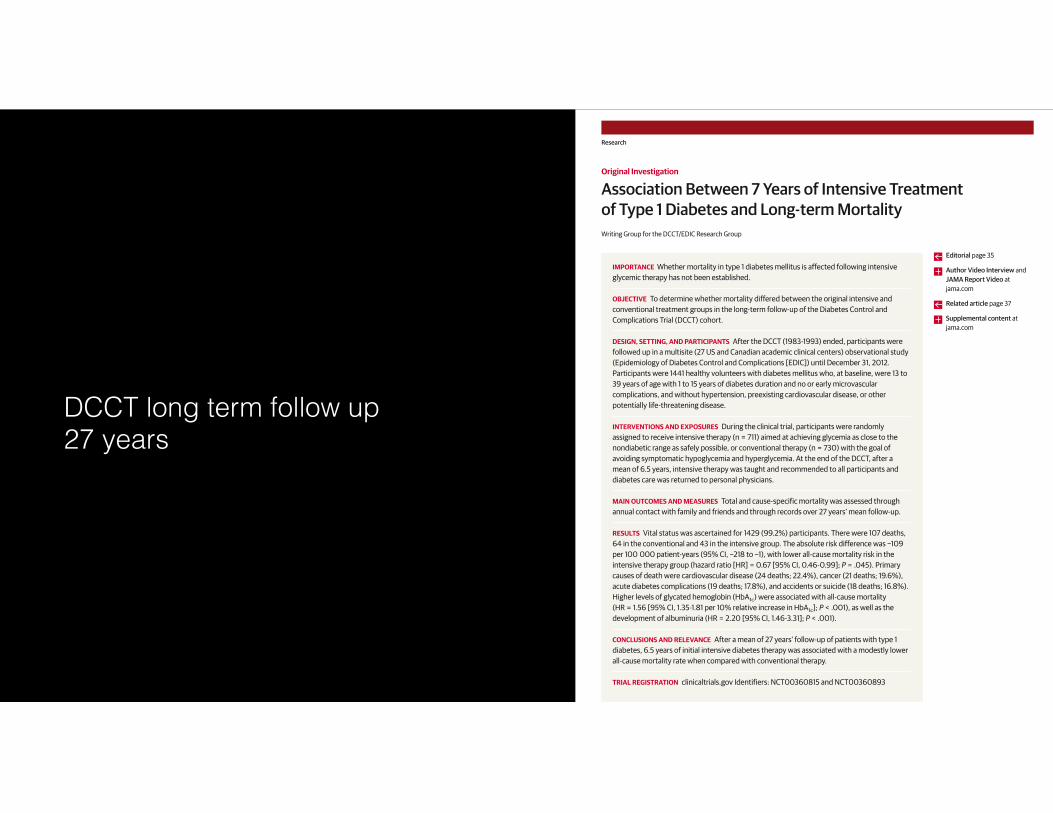
Association Between 7 Years of Intensive Treatmentof Type 1 Diabetes and Long-term MortalityWriting Group for the DCCT/EDIC Research Group
IMPORTANCE Whether mortality in type 1 diabetes mellitus is affected following intensiveglycemic therapy has not been established.
OBJECTIVE To determine whether mortality differed between the original intensive andconventional treatment groups in the long-term follow-up of the Diabetes Control andComplications Trial (DCCT) cohort.
DESIGN, SETTING, AND PARTICIPANTS After the DCCT (1983-1993) ended, participants werefollowed up in a multisite (27 US and Canadian academic clinical centers) observational study(Epidemiology of Diabetes Control and Complications [EDIC]) until December 31, 2012.Participants were 1441 healthy volunteers with diabetes mellitus who, at baseline, were 13 to39 years of age with 1 to 15 years of diabetes duration and no or early microvascularcomplications, and without hypertension, preexisting cardiovascular disease, or otherpotentially life-threatening disease.
INTERVENTIONS AND EXPOSURES During the clinical trial, participants were randomlyassigned to receive intensive therapy (n = 711) aimed at achieving glycemia as close to thenondiabetic range as safely possible, or conventional therapy (n = 730) with the goal ofavoiding symptomatic hypoglycemia and hyperglycemia. At the end of the DCCT, after amean of 6.5 years, intensive therapy was taught and recommended to all participants anddiabetes care was returned to personal physicians.
MAIN OUTCOMES AND MEASURES Total and cause-specific mortality was assessed throughannual contact with family and friends and through records over 27 years’ mean follow-up.
RESULTS Vital status was ascertained for 1429 (99.2%) participants. There were 107 deaths,64 in the conventional and 43 in the intensive group. The absolute risk difference was −109per 100 000 patient-years (95% CI, −218 to −1), with lower all-cause mortality risk in theintensive therapy group (hazard ratio [HR] = 0.67 [95% CI, 0.46-0.99]; P = .045). Primarycauses of death were cardiovascular disease (24 deaths; 22.4%), cancer (21 deaths; 19.6%),acute diabetes complications (19 deaths; 17.8%), and accidents or suicide (18 deaths; 16.8%).Higher levels of glycated hemoglobin (HbA1c) were associated with all-cause mortality(HR = 1.56 [95% CI, 1.35-1.81 per 10% relative increase in HbA1c]; P < .001), as well as thedevelopment of albuminuria (HR = 2.20 [95% CI, 1.46-3.31]; P < .001).
CONCLUSIONS AND RELEVANCE After a mean of 27 years’ follow-up of patients with type 1diabetes, 6.5 years of initial intensive diabetes therapy was associated with a modestly lowerall-cause mortality rate when compared with conventional therapy.
TRIAL REGISTRATION clinicaltrials.gov Identifiers: NCT00360815 and NCT00360893
JAMA. 2015;313(1):45-53. doi:10.1001/jama.2014.16107
Editorial page 35
Author Video Interview andJAMA Report Video atjama.com
Related article page 37
Supplemental content atjama.com
The Authors/Writing Group for theDCCT/EDIC Research Group arelisted at the end of this article.
Corresponding Author: Trevor J.Orchard, MD, University ofPittsburgh, 3512 Fifth Ave, Room 207,Pittsburgh, PA 15213 ([email protected]).
Research
Original Investigation
45
Copyright 2015 American Medical Association. All rights reserved.
Downloaded From: http://jama.jamanetwork.com/ by Joel Topf on 06/06/2016
DCCT long term follow up 27 years
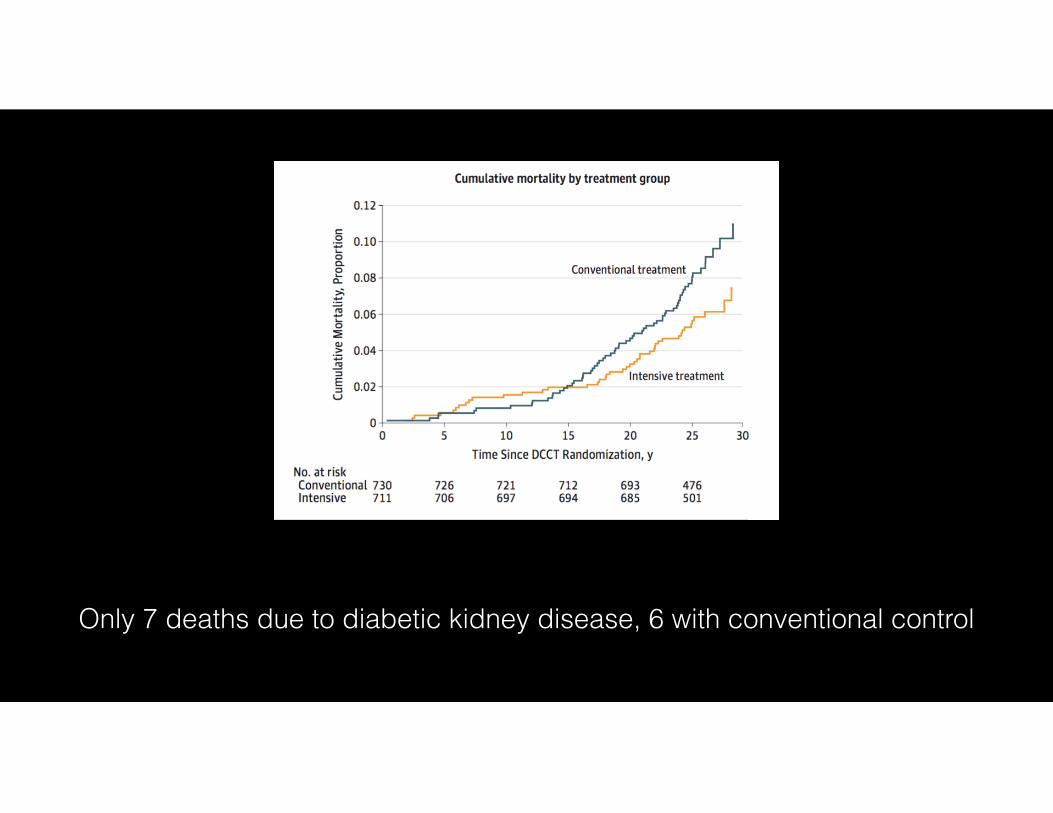
Only 7 deaths due to diabetic kidney disease, 6 with conventional control
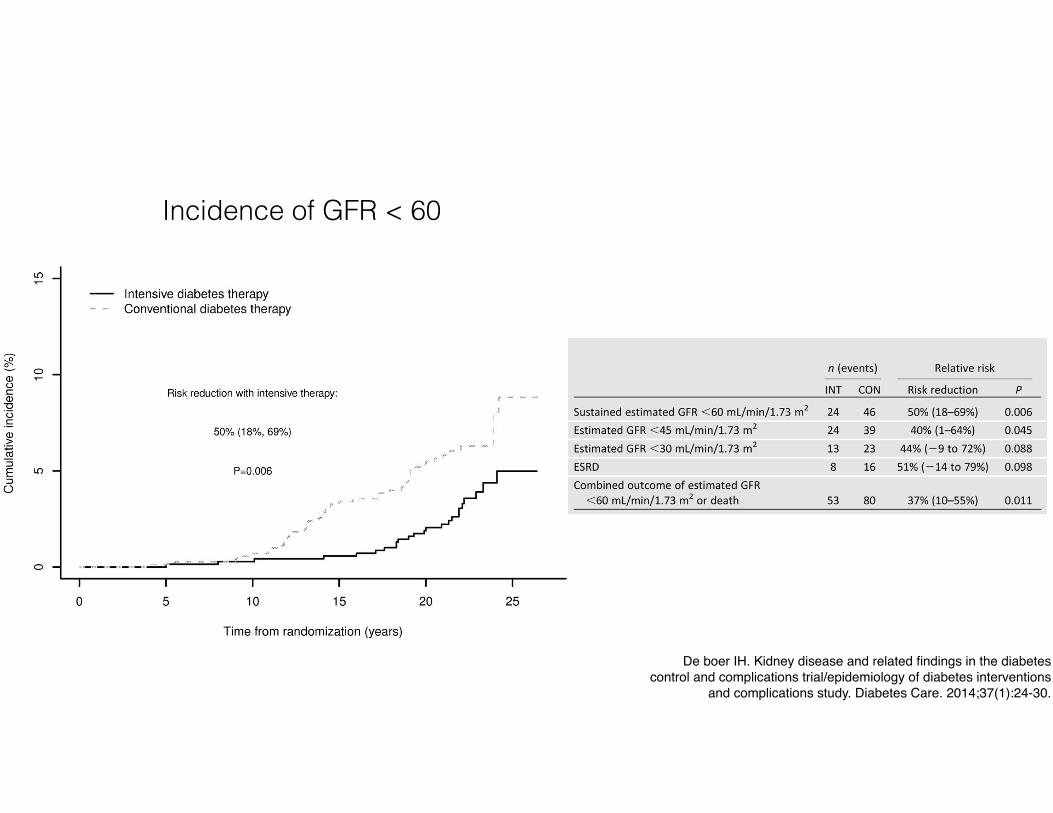
Incidence of GFR < 60
De boer IH. Kidney disease and related findings in the diabetes control and complications trial/epidemiology of diabetes interventions
and complications study. Diabetes Care. 2014;37(1):24-30.
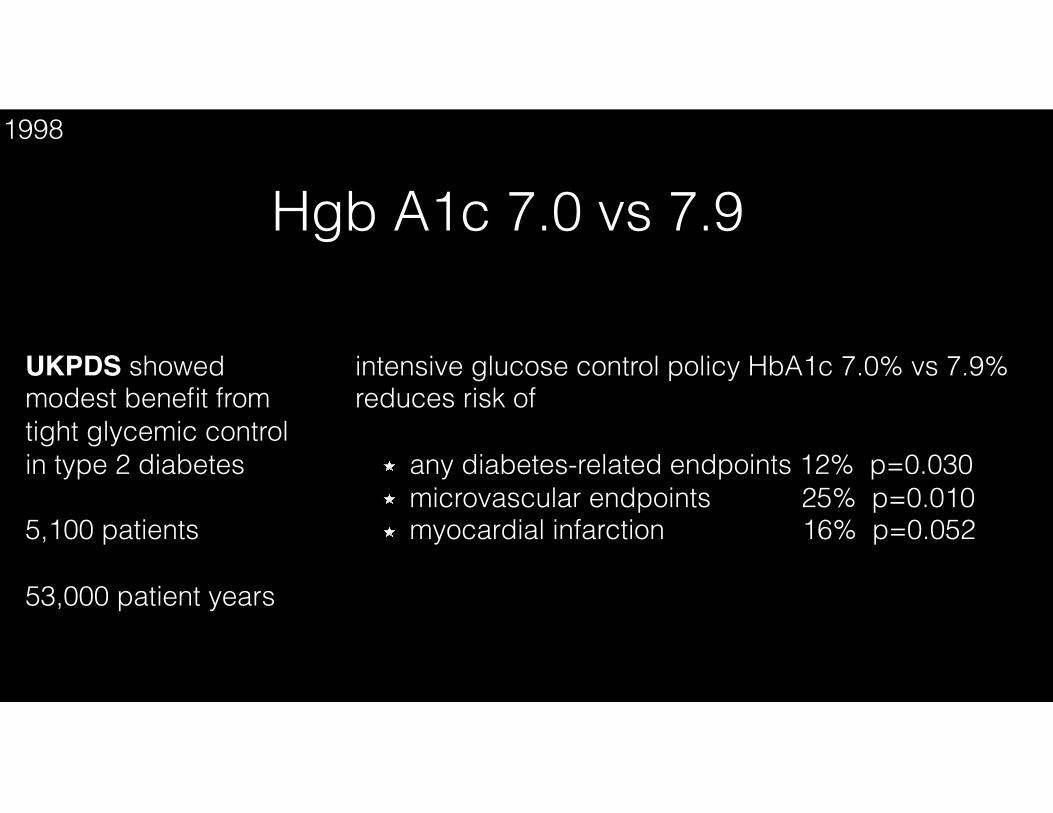
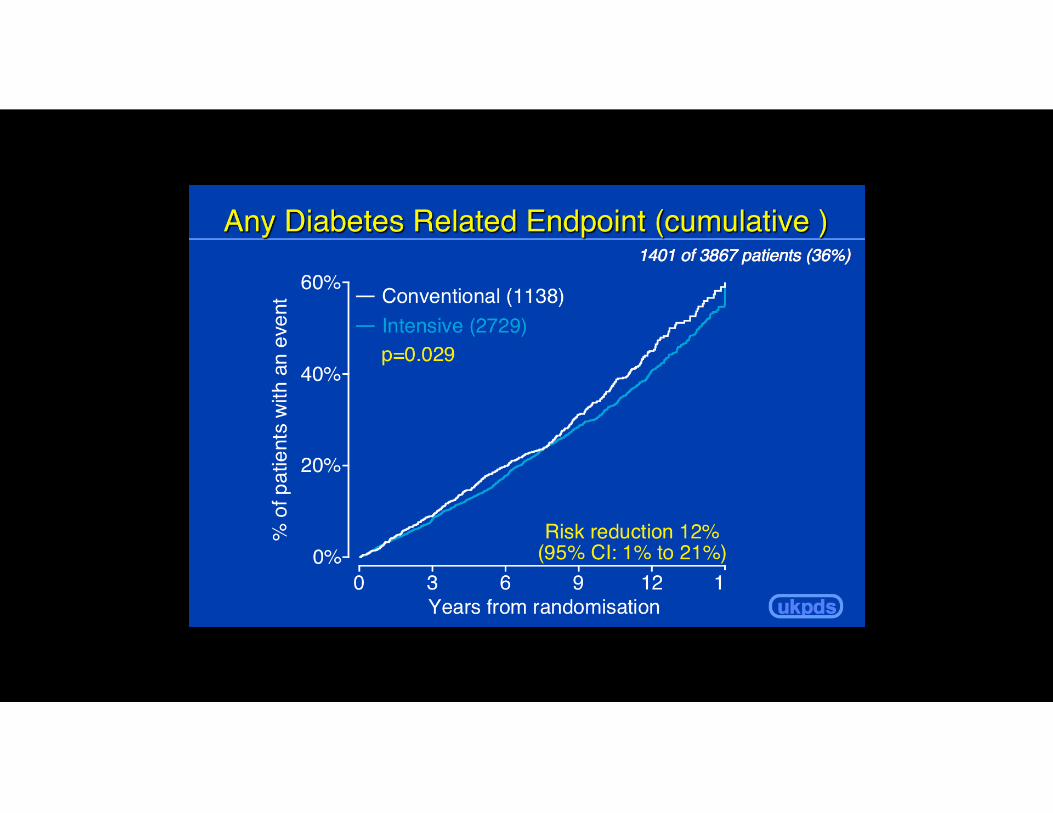
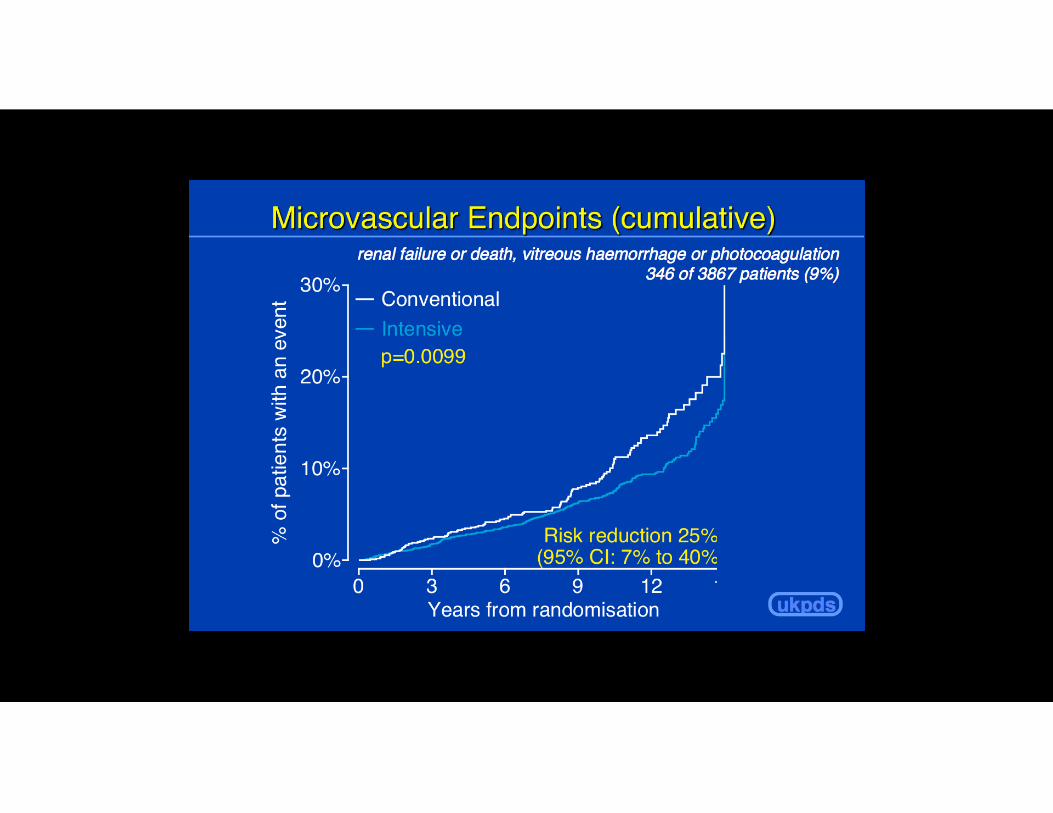
UKPDS showed modest benefit from tight glycemic control in type 2 diabetes
5,100 patients
53,000 patient years
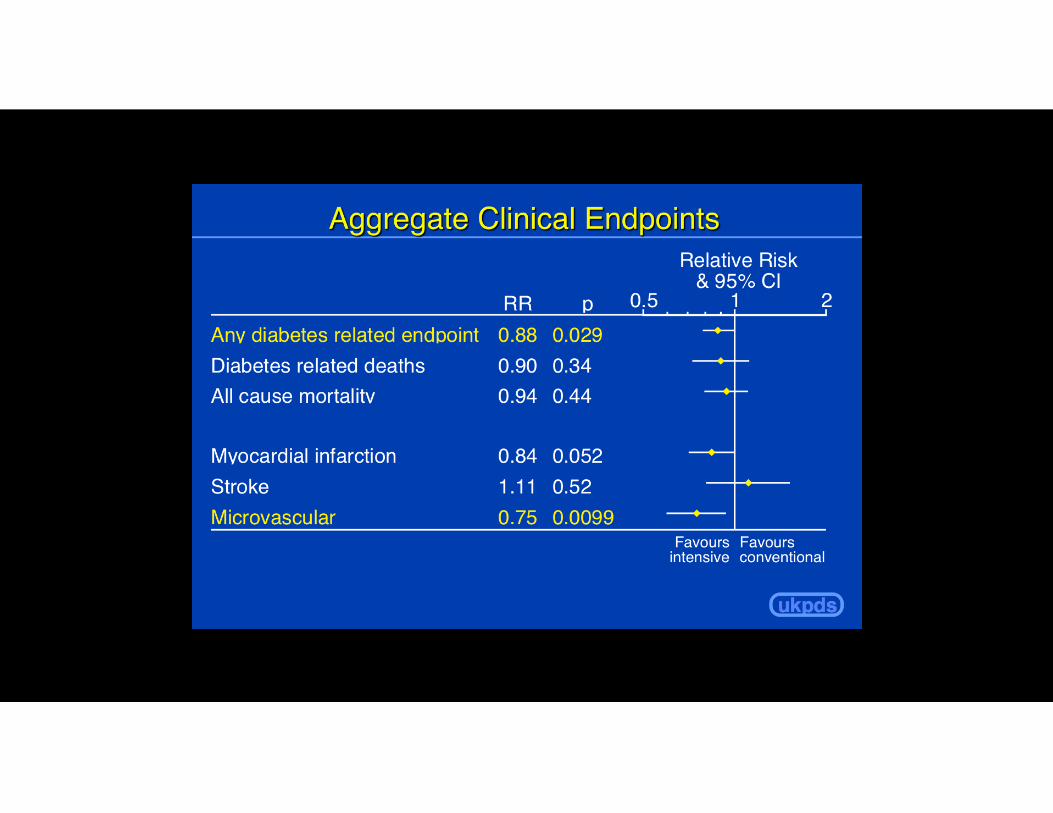
intensive glucose control policy HbA1c 7.0% vs 7.9% reduces risk of
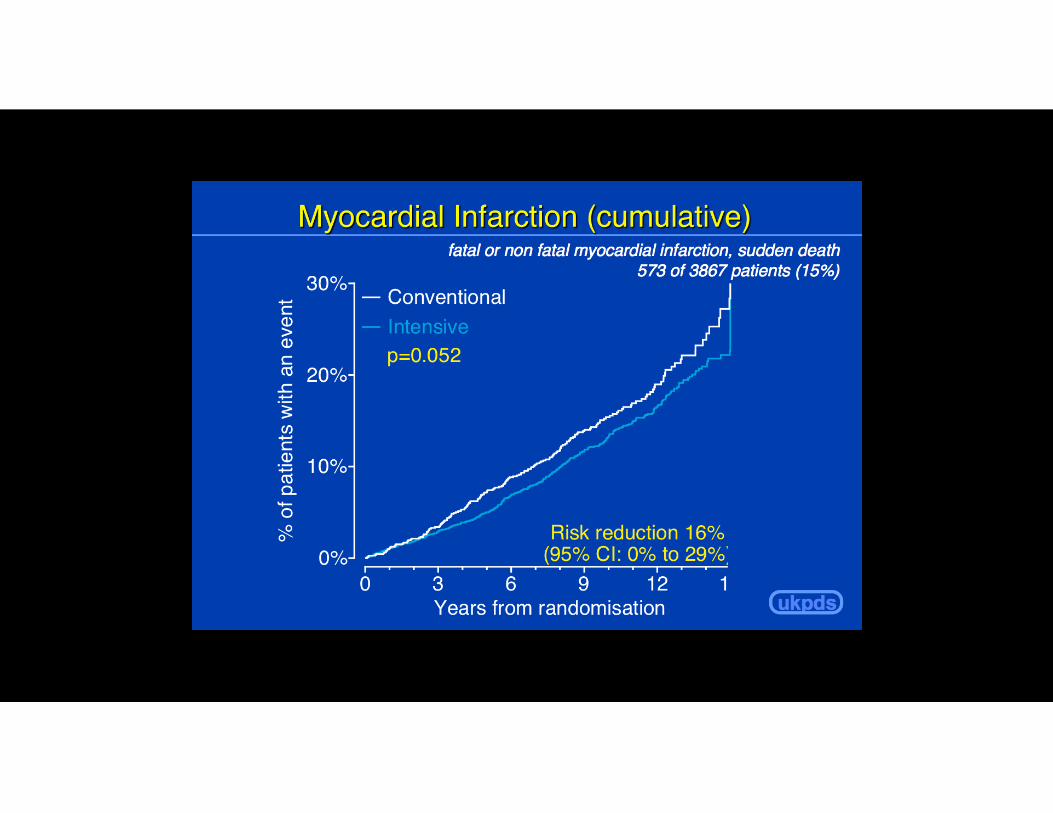
any diabetes-related endpoints 12% p=0.030 microvascular endpoints 25% p=0.010 myocardial infarction 16% p=0.052
Hgb A1c 7.0 vs 7.91998
If 7.0 is good 6.5 or 6.0 must be better
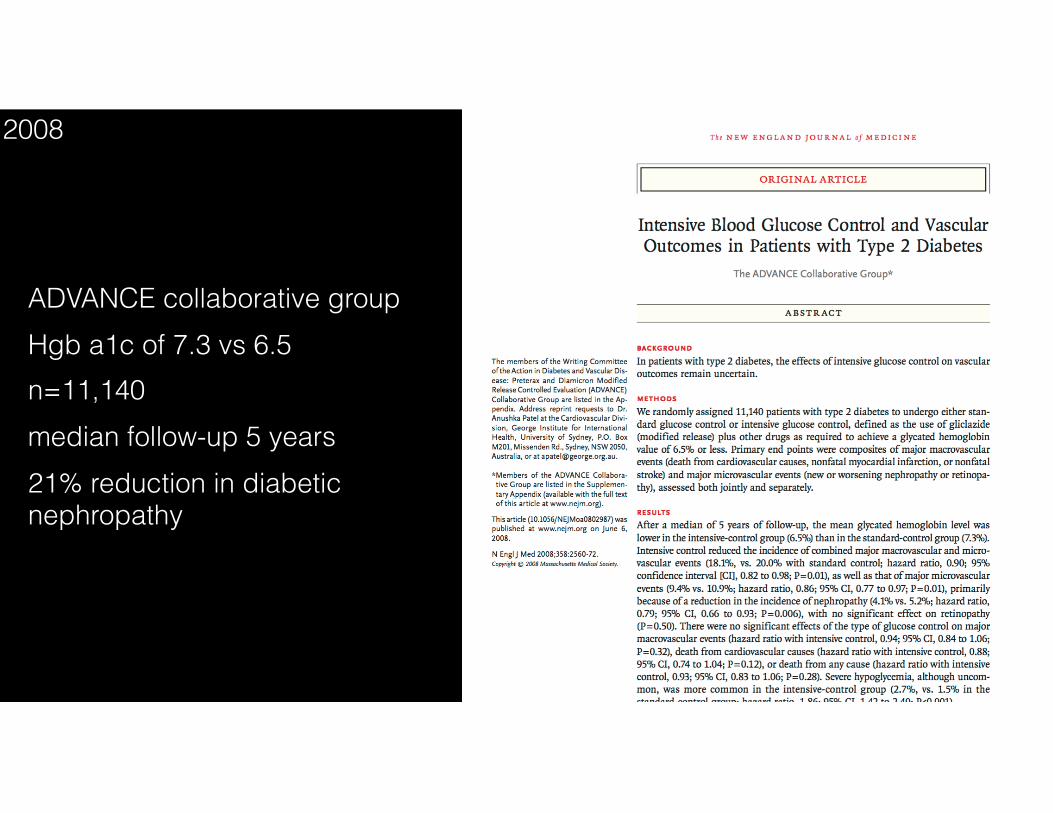
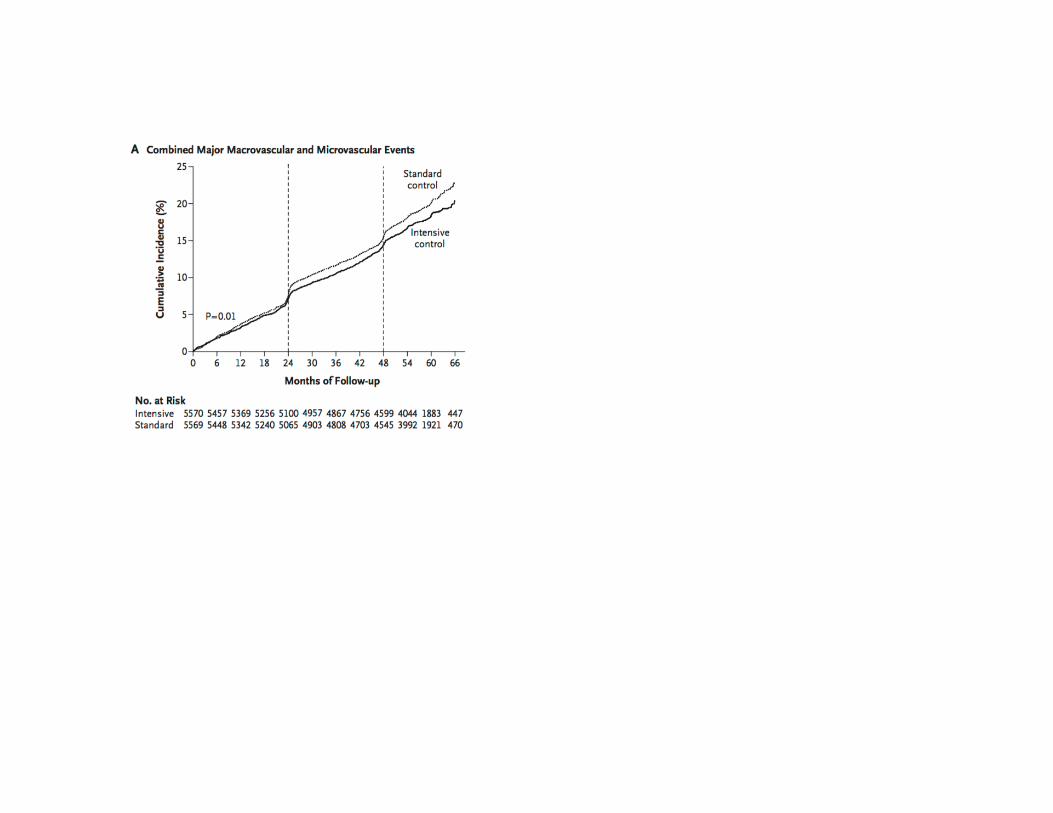
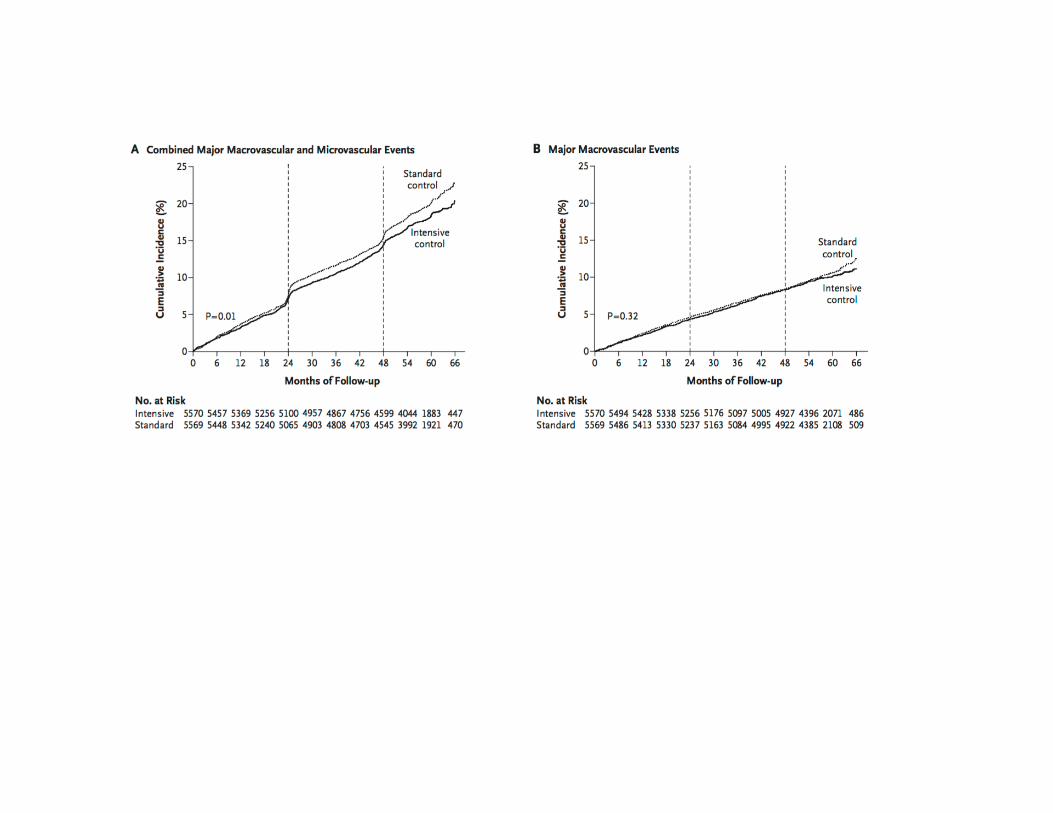
ADVANCE collaborative group Hgb a1c of 7.3 vs 6.5 n=11,140 median follow-up 5 years 21% reduction in diabetic nephropathy
2008

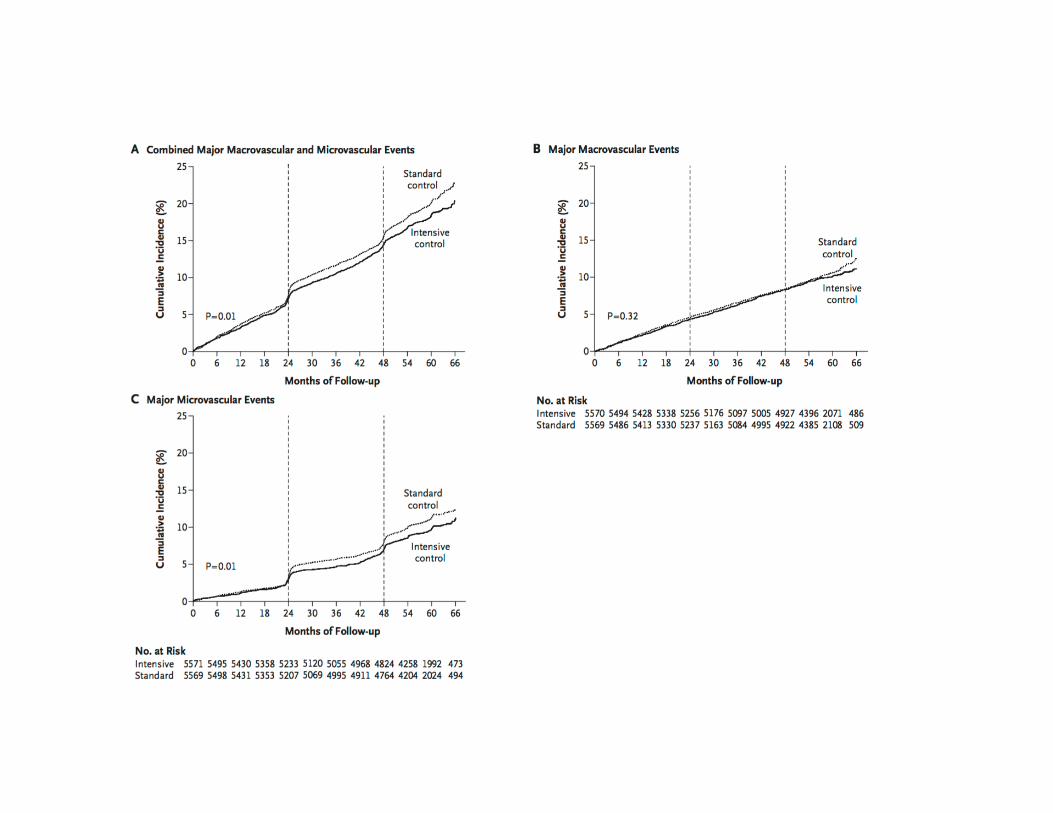
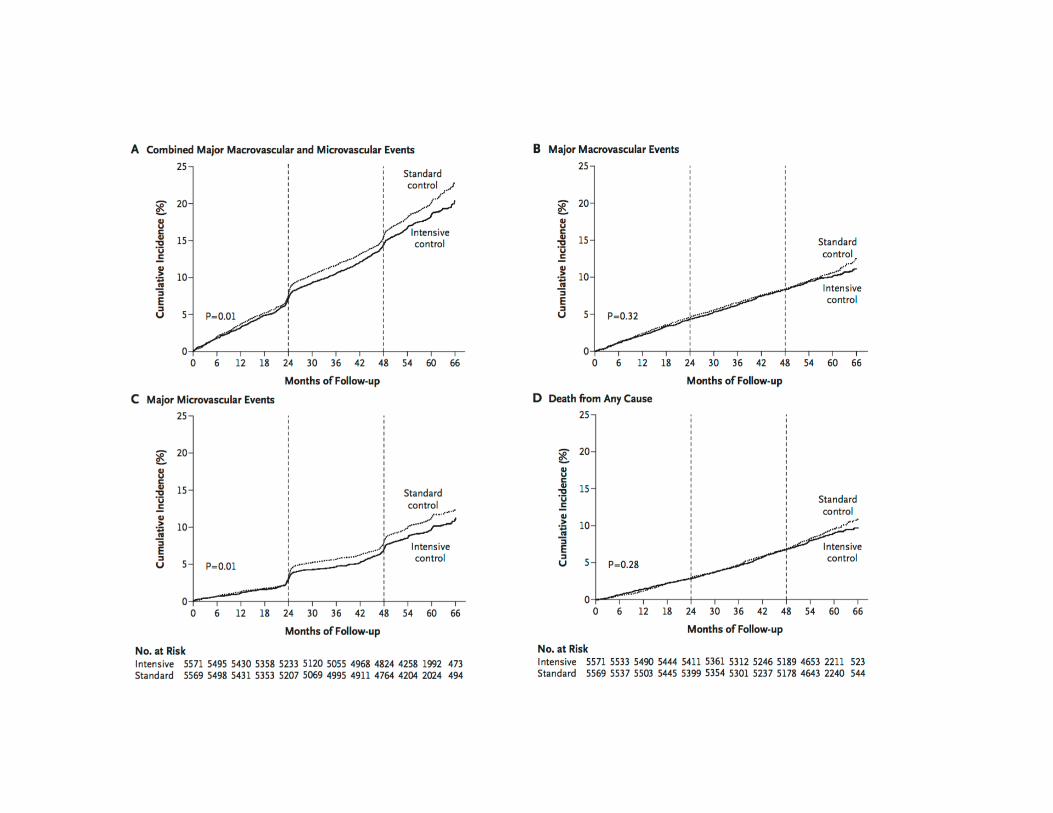
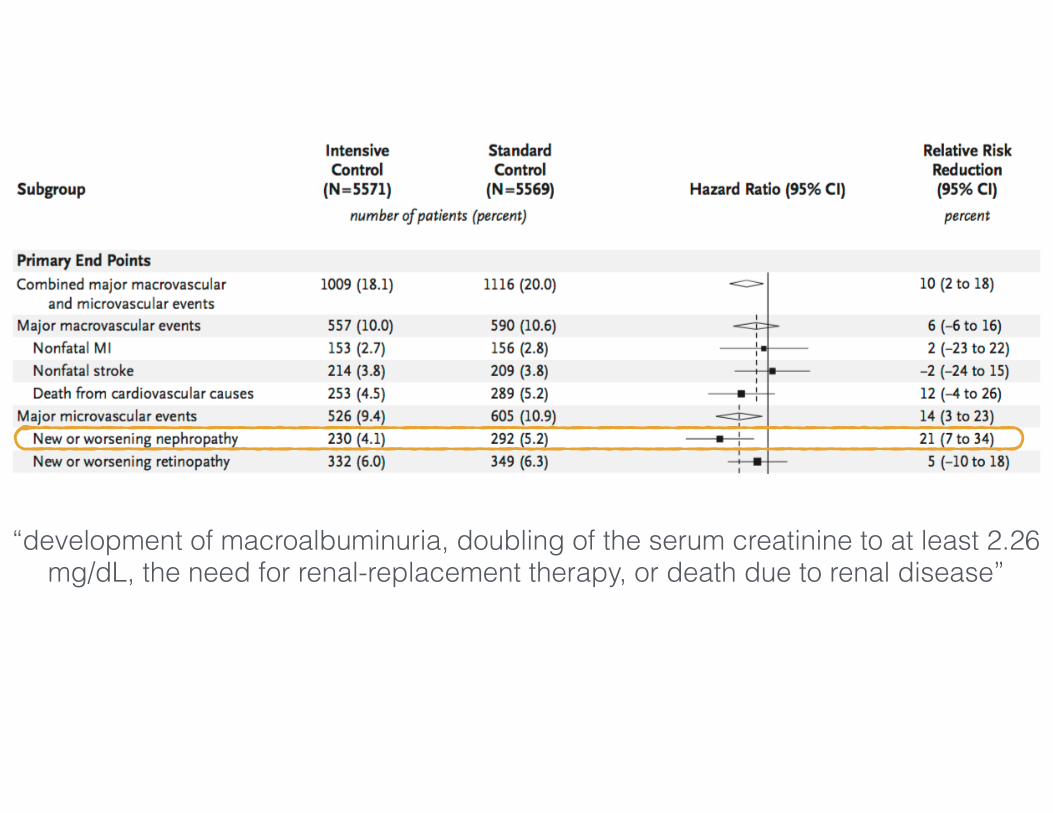
“development of macroalbuminuria, doubling of the serum creatinine to at least 2.26 mg/dL, the need for renal-replacement therapy, or death due to renal disease”
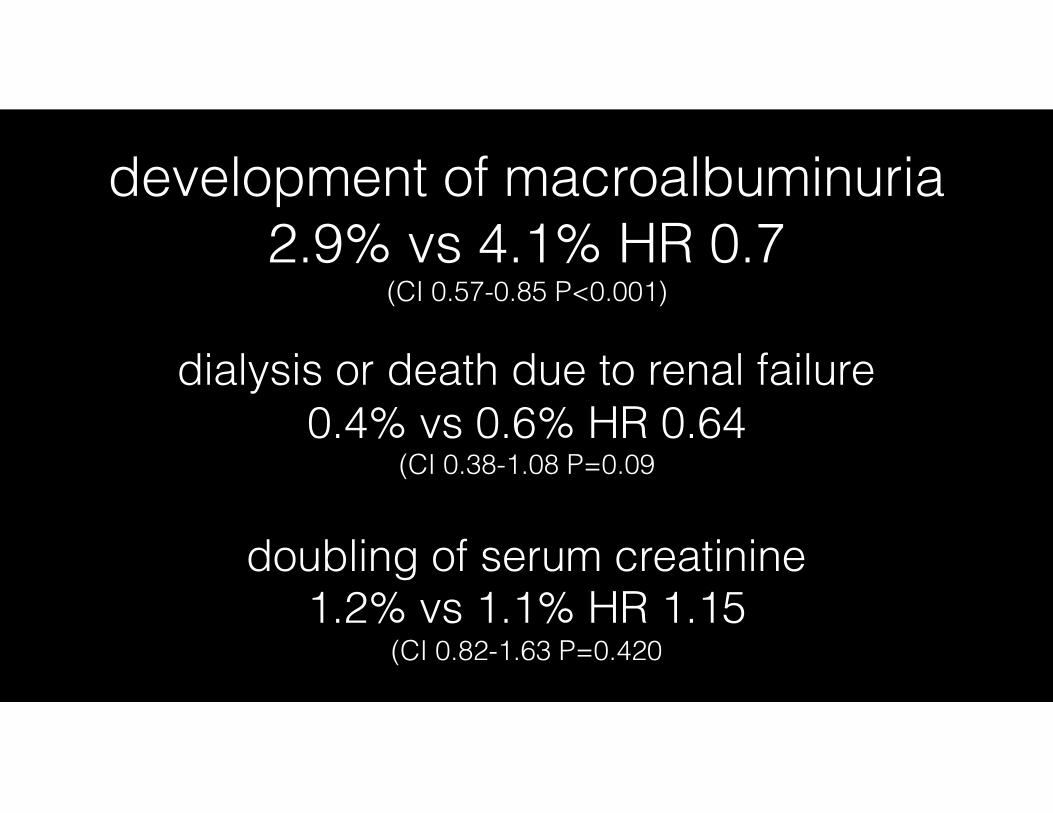
development of macroalbuminuria
2.9% vs 4.1% HR 0.7 (CI 0.57-0.85 P<0.001)
doubling of serum creatinine 1.2% vs 1.1% HR 1.15
(CI 0.82-1.63 P=0.420
dialysis or death due to renal failure 0.4% vs 0.6% HR 0.64
(CI 0.38-1.08 P=0.09
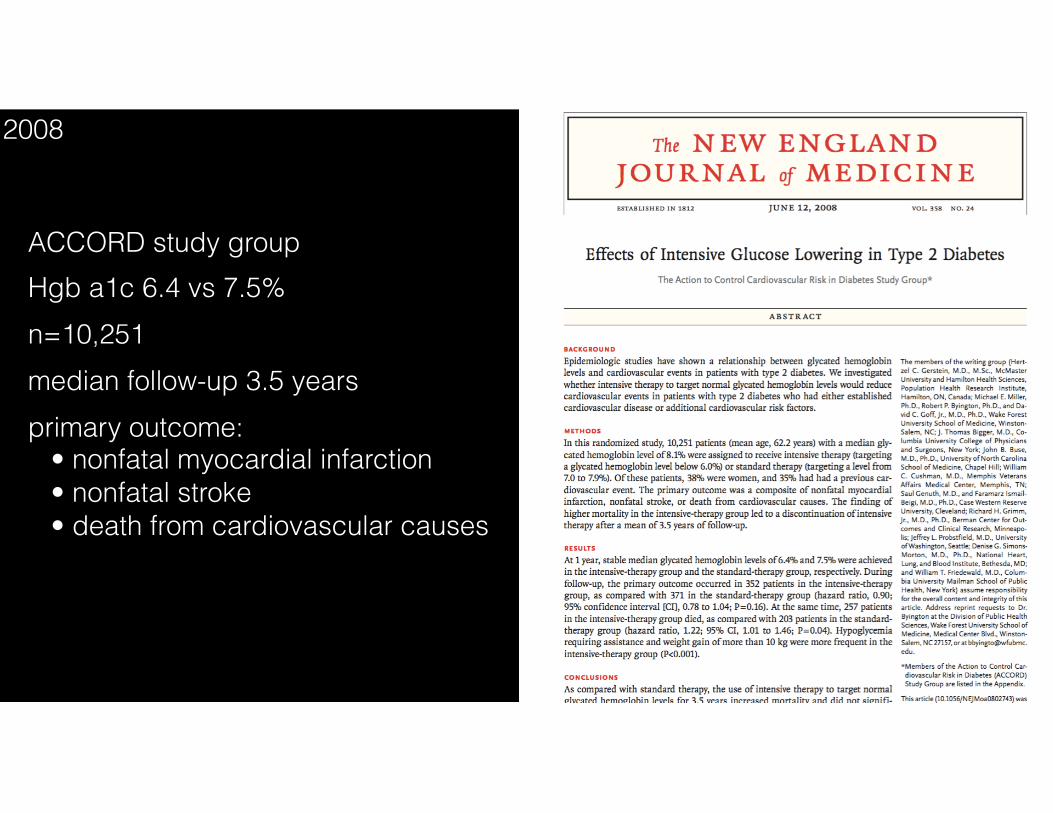
ACCORD study group Hgb a1c 6.4 vs 7.5% n=10,251 median follow-up 3.5 years primary outcome: • nonfatal myocardial infarction • nonfatal stroke • death from cardiovascular causes
2008
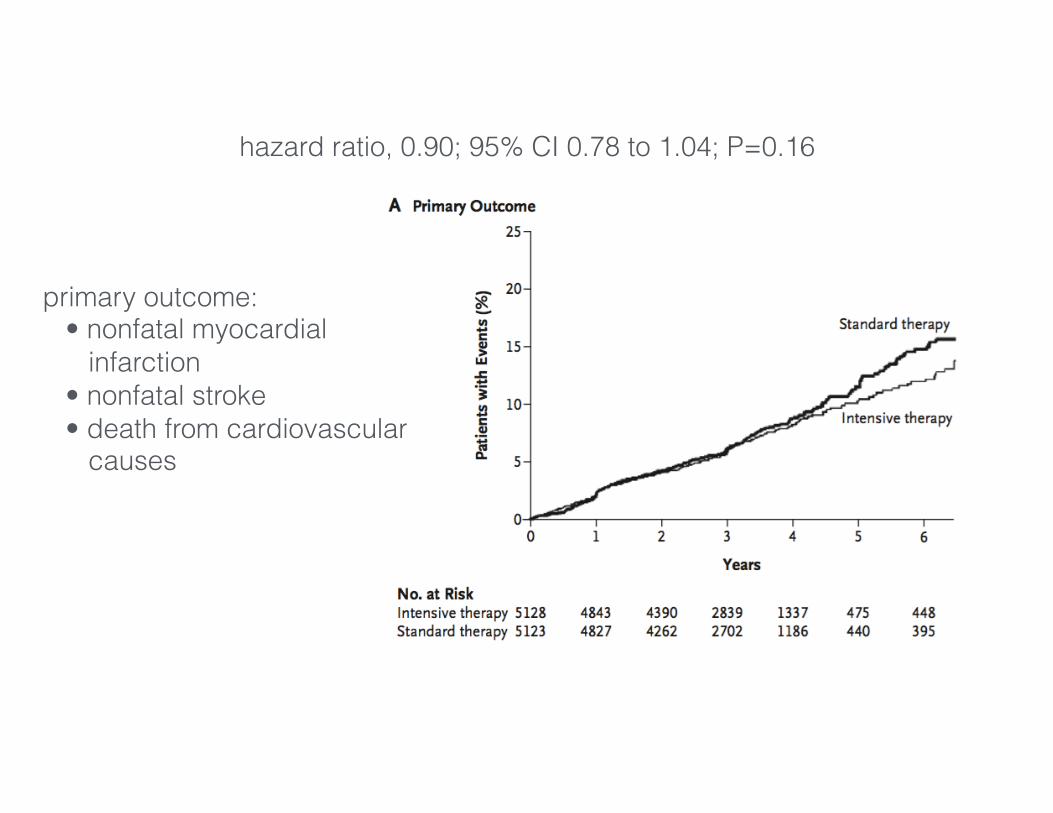
hazard ratio, 0.90; 95% CI 0.78 to 1.04; P=0.16
primary outcome: • nonfatal myocardial infarction • nonfatal stroke • death from cardiovascular causes
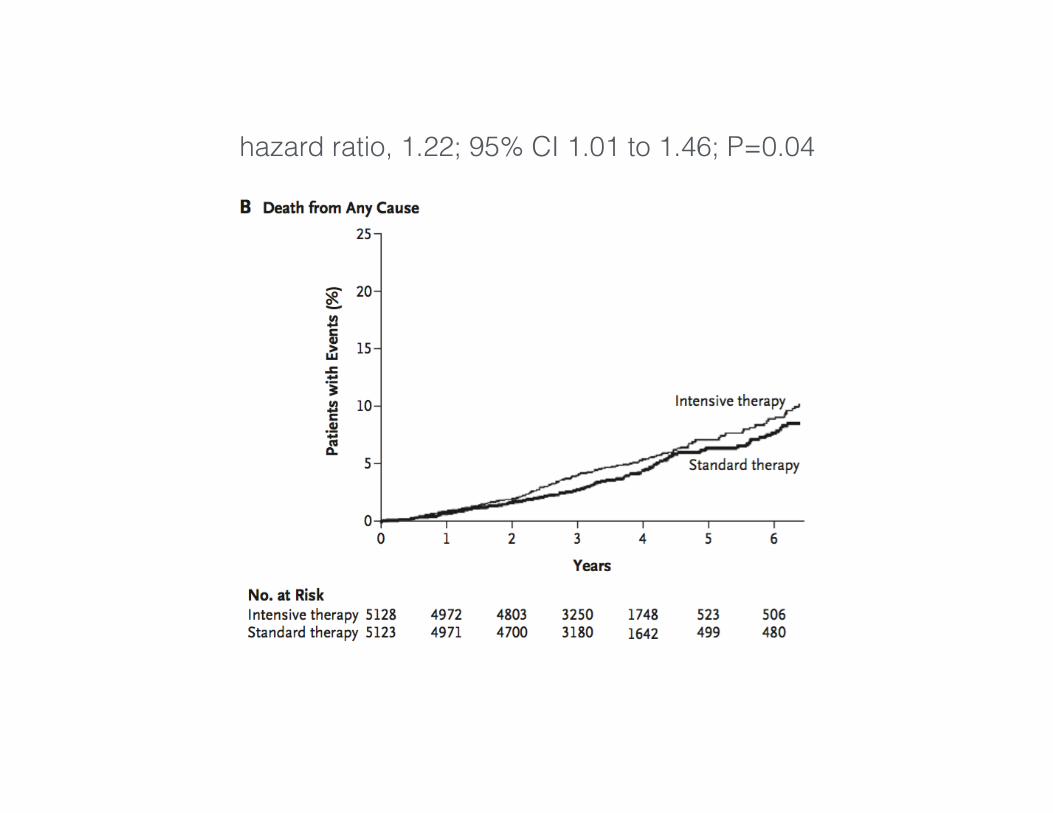
hazard ratio, 1.22; 95% CI 1.01 to 1.46; P=0.04
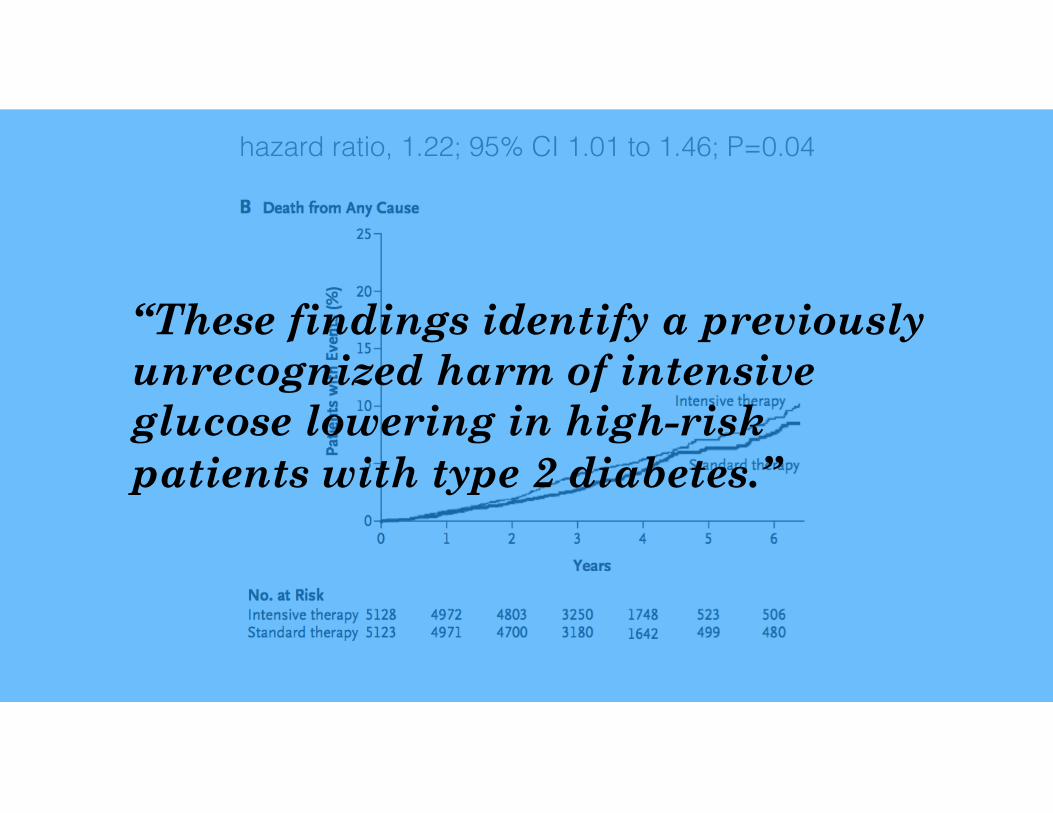
hazard ratio, 1.22; 95% CI 1.01 to 1.46; P=0.04
“These findings identify a previously unrecognized harm of intensive glucose lowering in high-risk patients with type 2 diabetes.”
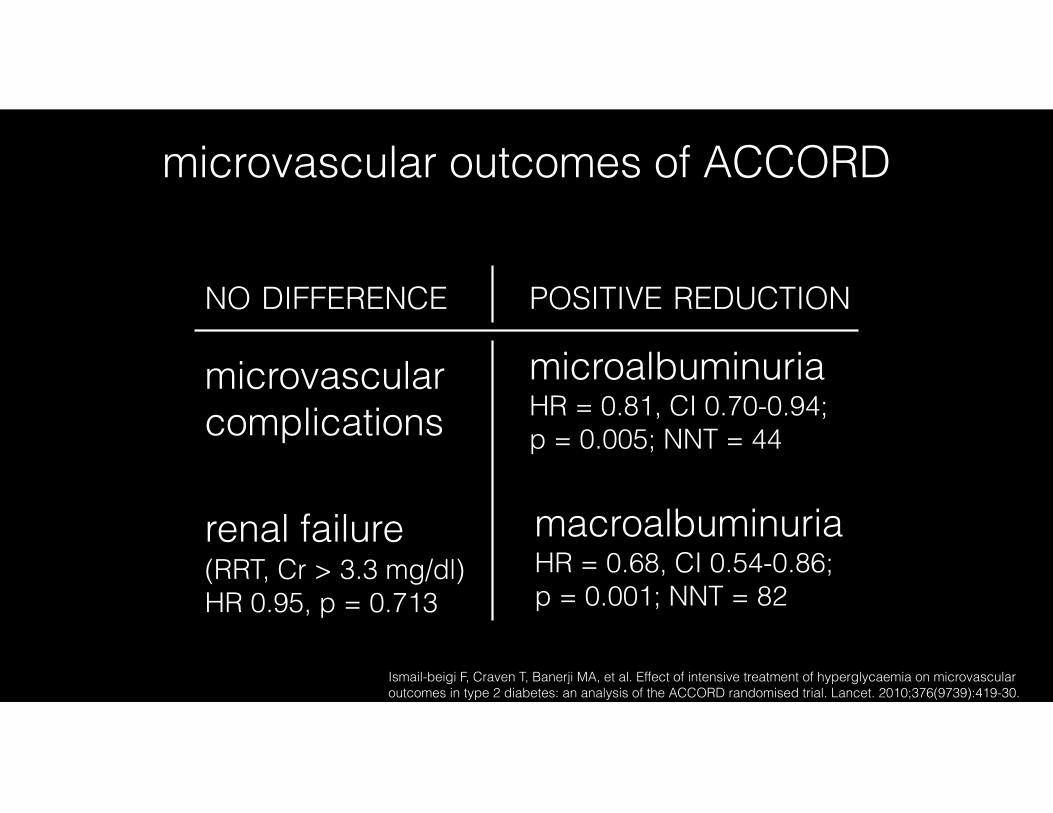
Ismail-beigi F, Craven T, Banerji MA, et al. Effect of intensive treatment of hyperglycaemia on microvascular outcomes in type 2 diabetes: an analysis of the ACCORD randomised trial. Lancet. 2010;376(9739):419-30.
microvascular outcomes of ACCORD
NO DIFFERENCE POSITIVE REDUCTION
macroalbuminuriaHR = 0.68, CI 0.54-0.86; p = 0.001; NNT = 82
renal failure (RRT, Cr > 3.3 mg/dl) HR 0.95, p = 0.713
microvascular complications
microalbuminuriaHR = 0.81, CI 0.70-0.94; p = 0.005; NNT = 44
T h e n e w e ngl a nd j o u r na l o f m e dic i n e
n engl j med 360;2 nejm.org january 8, 2009 129
original article
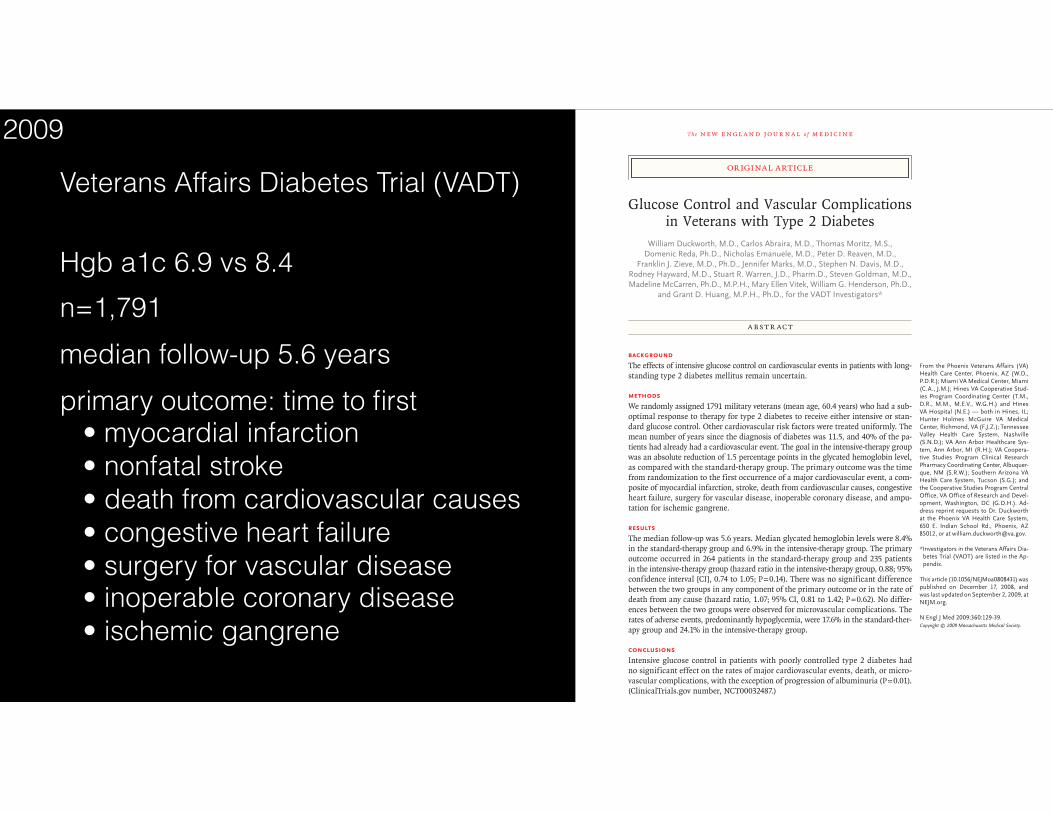
Glucose Control and Vascular Complications in Veterans with Type 2 Diabetes
William Duckworth, M.D., Carlos Abraira, M.D., Thomas Moritz, M.S., Domenic Reda, Ph.D., Nicholas Emanuele, M.D., Peter D. Reaven, M.D.,
Franklin J. Zieve, M.D., Ph.D., Jennifer Marks, M.D., Stephen N. Davis, M.D., Rodney Hayward, M.D., Stuart R. Warren, J.D., Pharm.D., Steven Goldman, M.D., Madeline McCarren, Ph.D., M.P.H., Mary Ellen Vitek, William G. Henderson, Ph.D.,
and Grant D. Huang, M.P.H., Ph.D., for the VADT Investigators*
From the Phoenix Veterans Affairs (VA) Health Care Center, Phoenix, AZ (W.D., P.D.R.); Miami VA Medical Center, Miami (C.A., J.M.); Hines VA Cooperative Stud-ies Program Coordinating Center (T.M., D.R., M.M., M.E.V., W.G.H.) and Hines VA Hospital (N.E.) — both in Hines, IL; Hunter Holmes McGuire VA Medical Center, Richmond, VA (F.J.Z.); Tennessee Valley Health Care System, Nashville (S.N.D.); VA Ann Arbor Healthcare Sys-tem, Ann Arbor, MI (R.H.); VA Coopera-tive Studies Program Clinical Research Pharmacy Coordinating Center, Albuquer-que, NM (S.R.W.); Southern Arizona VA Health Care System, Tucson (S.G.); and the Cooperative Studies Program Central Office, VA Office of Research and Devel-opment, Washington, DC (G.D.H.). Ad-dress reprint requests to Dr. Duckworth at the Phoenix VA Health Care System, 650 E. Indian School Rd., Phoenix, AZ 85012, or at [email protected].
*Investigators in the Veterans Affairs Dia-betes Trial (VADT) are listed in the Ap-pendix.
This article (10.1056/NEJMoa0808431) was published on December 17, 2008, and was last updated on September 2, 2009, at NEJM.org.
N Engl J Med 2009;360:129-39.Copyright © 2009 Massachusetts Medical Society.
A bs tr ac t
BackgroundThe effects of intensive glucose control on cardiovascular events in patients with long-standing type 2 diabetes mellitus remain uncertain.
MethodsWe randomly assigned 1791 military veterans (mean age, 60.4 years) who had a sub-optimal response to therapy for type 2 diabetes to receive either intensive or stan-dard glucose control. Other cardiovascular risk factors were treated uniformly. The mean number of years since the diagnosis of diabetes was 11.5, and 40% of the pa-tients had already had a cardiovascular event. The goal in the intensive-therapy group was an absolute reduction of 1.5 percentage points in the glycated hemoglobin level, as compared with the standard-therapy group. The primary outcome was the time from randomization to the first occurrence of a major cardiovascular event, a com-posite of myocardial infarction, stroke, death from cardiovascular causes, congestive heart failure, surgery for vascular disease, inoperable coronary disease, and ampu-tation for ischemic gangrene.
ResultsThe median follow-up was 5.6 years. Median glycated hemoglobin levels were 8.4% in the standard-therapy group and 6.9% in the intensive-therapy group. The primary outcome occurred in 264 patients in the standard-therapy group and 235 patients in the intensive-therapy group (hazard ratio in the intensive-therapy group, 0.88; 95% confidence interval [CI], 0.74 to 1.05; P = 0.14). There was no significant difference between the two groups in any component of the primary outcome or in the rate of death from any cause (hazard ratio, 1.07; 95% CI, 0.81 to 1.42; P = 0.62). No differ-ences between the two groups were observed for microvascular complications. The rates of adverse events, predominantly hypoglycemia, were 17.6% in the standard-ther-apy group and 24.1% in the intensive-therapy group.
ConclusionsIntensive glucose control in patients with poorly controlled type 2 diabetes had no significant effect on the rates of major cardiovascular events, death, or micro-vascular complications, with the exception of progression of albuminuria (P = 0.01). (ClinicalTrials.gov number, NCT00032487.)
The New England Journal of Medicine Downloaded from nejm.org by JOEL TOPF on June 6, 2016. For personal use only. No other uses without permission.
Copyright © 2009 Massachusetts Medical Society. All rights reserved.
Veterans Affairs Diabetes Trial (VADT)
Hgb a1c 6.9 vs 8.4 n=1,791 median follow-up 5.6 years primary outcome: time to first • myocardial infarction • nonfatal stroke • death from cardiovascular causes • congestive heart failure • surgery for vascular disease • inoperable coronary disease • ischemic gangrene
2009
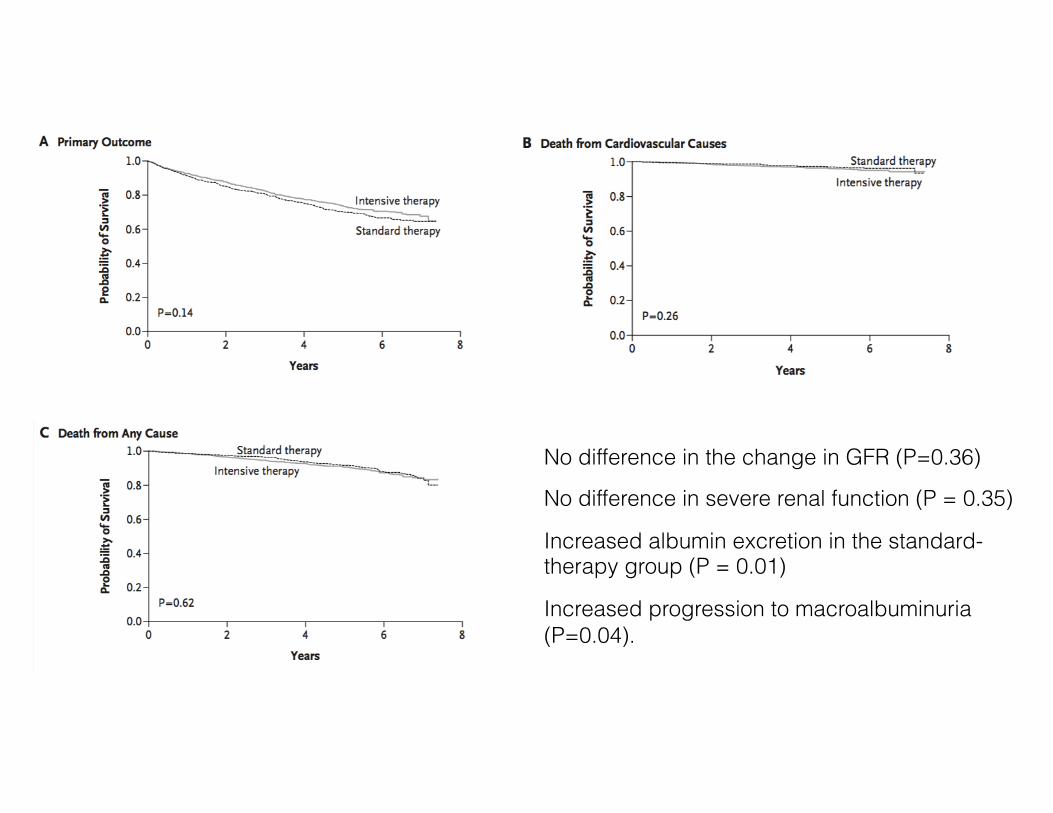
No difference in the change in GFR (P=0.36)
No difference in severe renal function (P = 0.35)
Increased albumin excretion in the standard- therapy group (P = 0.01)
Increased progression to macroalbuminuria (P=0.04).
Agrawal L, Azad N, Emanuele NV, et al. Observation on renal outcomes in the Veterans Affairs Diabetes Trial. Diabetes Care. 2011;34(9):2090-4.
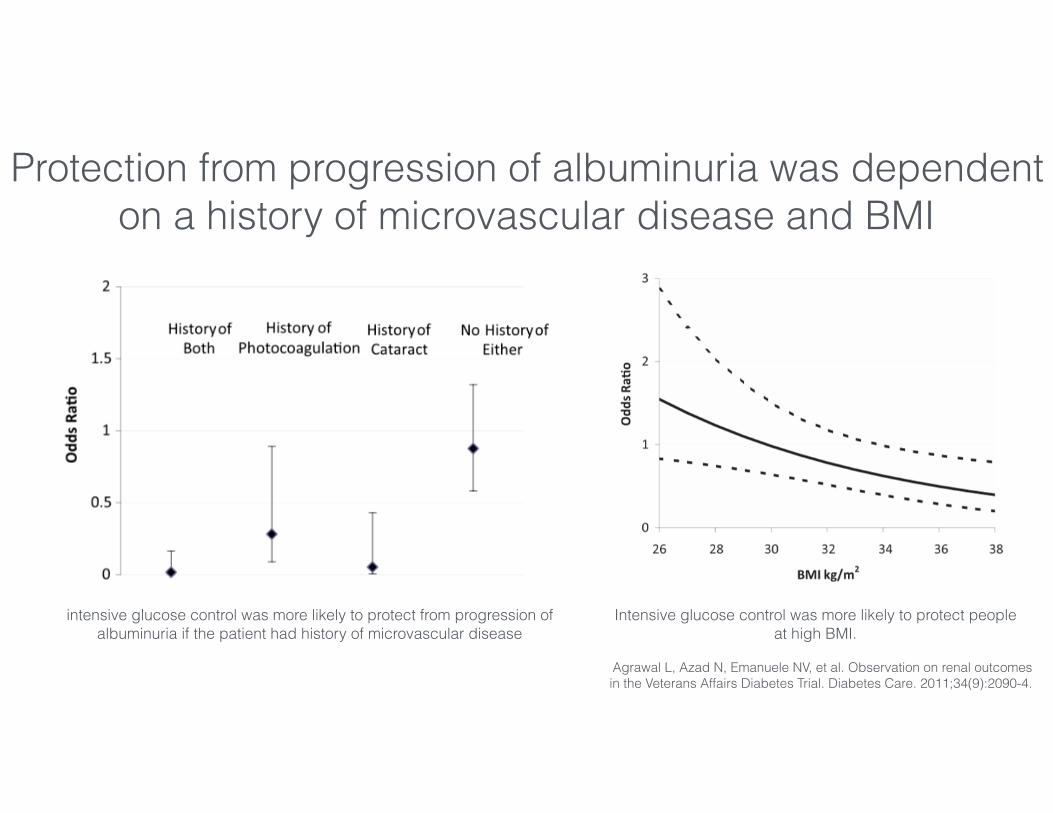
Protection from progression of albuminuria was dependent on a history of microvascular disease and BMI
intensive glucose control was more likely to protect from progression of albuminuria if the patient had history of microvascular disease
Intensive glucose control was more likely to protect people at high BMI.
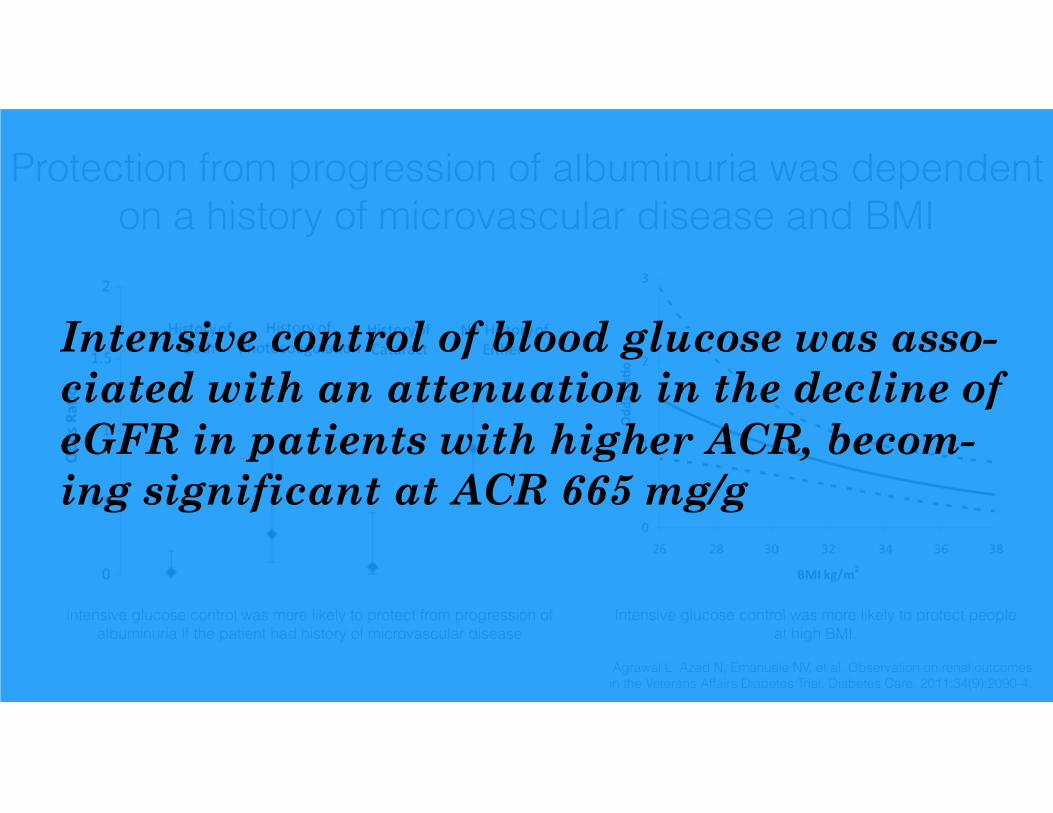
Agrawal L, Azad N, Emanuele NV, et al. Observation on renal outcomes in the Veterans Affairs Diabetes Trial. Diabetes Care. 2011;34(9):2090-4.
Protection from progression of albuminuria was dependent on a history of microvascular disease and BMI
intensive glucose control was more likely to protect from progression of albuminuria if the patient had history of microvascular disease
Intensive glucose control was more likely to protect people at high BMI.
Intensive control of blood glucose was asso-ciated with an attenuation in the decline of eGFR in patients with higher ACR, becom-ing significant at ACR 665 mg/g
Glycemic control
RAAS inhibition
Blood pressure control
Glycemic control
RAAS inhibition
Blood pressure control
Some is good…a lot, not so clear
Glycemic control
RAAS inhibition
Blood pressure control
Some is good…a lot, not so clear
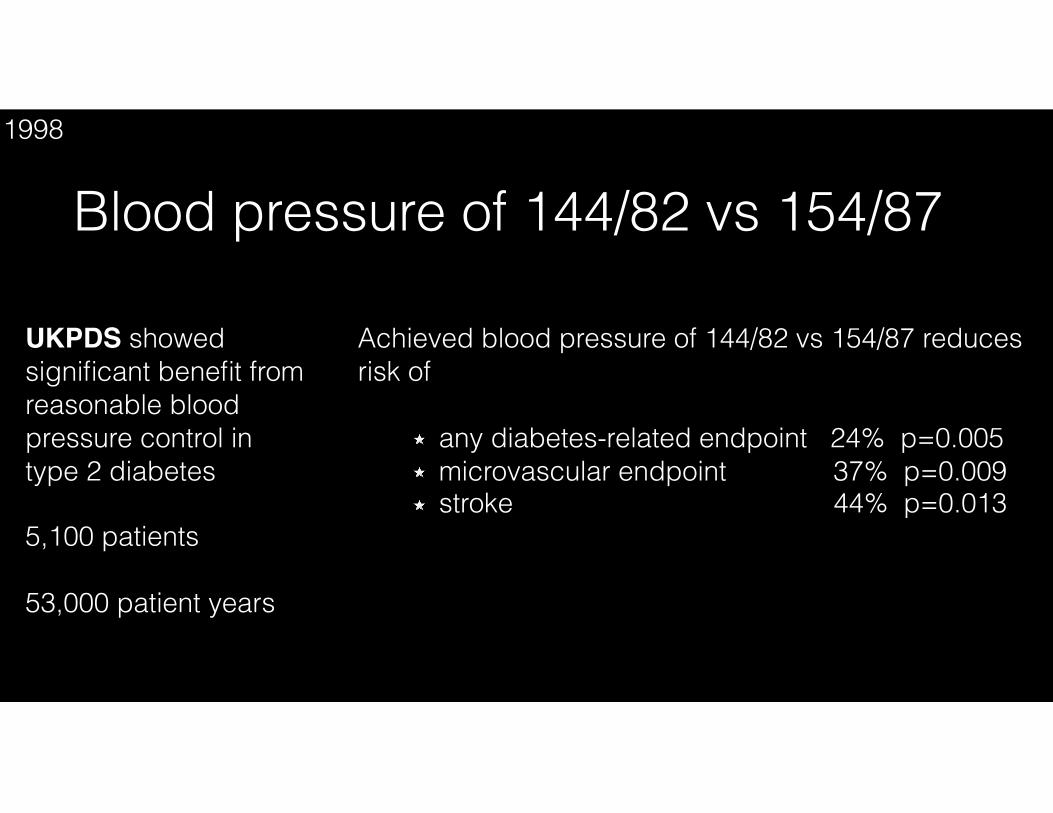
UKPDS showed significant benefit from reasonable blood pressure control in type 2 diabetes
5,100 patients
53,000 patient years
Blood pressure of 144/82 vs 154/871998
Achieved blood pressure of 144/82 vs 154/87 reduces risk of
any diabetes-related endpoint 24% p=0.005 microvascular endpoint 37% p=0.009 stroke 44% p=0.013
Intensive glucose control policy HbA1c 7.0 % vs 7.9 % reduces risk of
any diabetes-related endpoints 12% p=0.030 microvascular endpoints 25% p=0.010 myocardial infarction 16% p=0.052
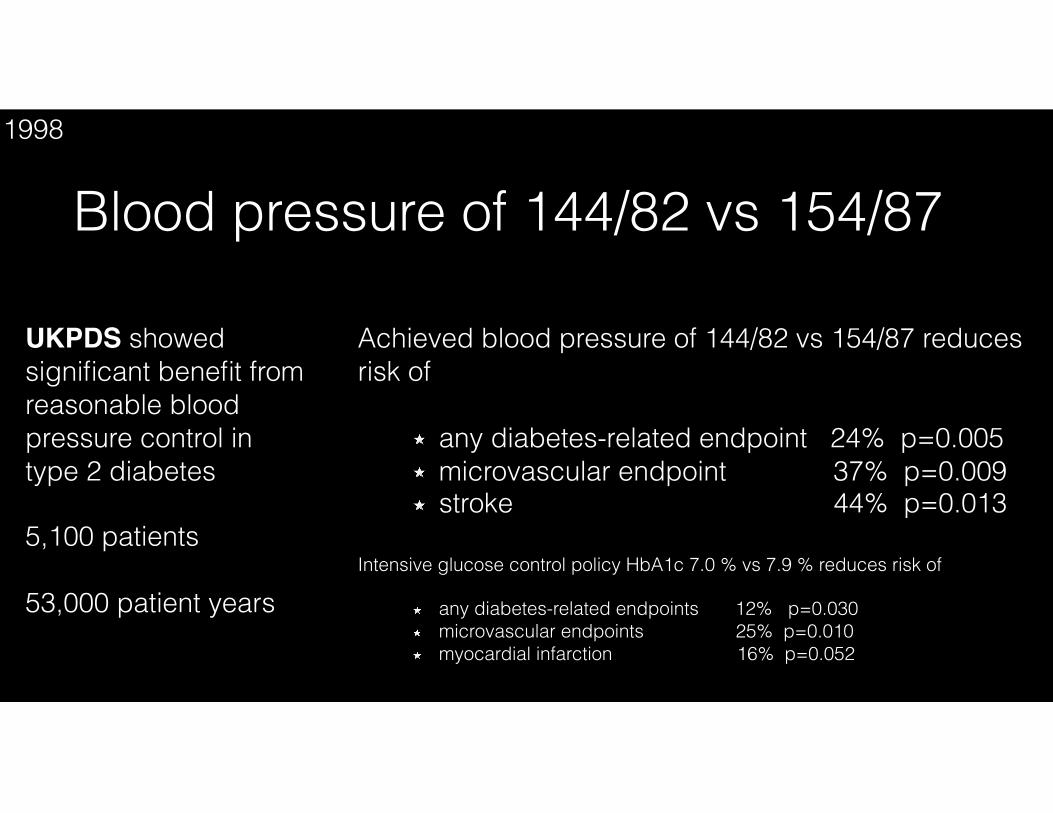
60
80
100
140
160
180
0 2 4 6 8
mm
Hg
Years from randomisation
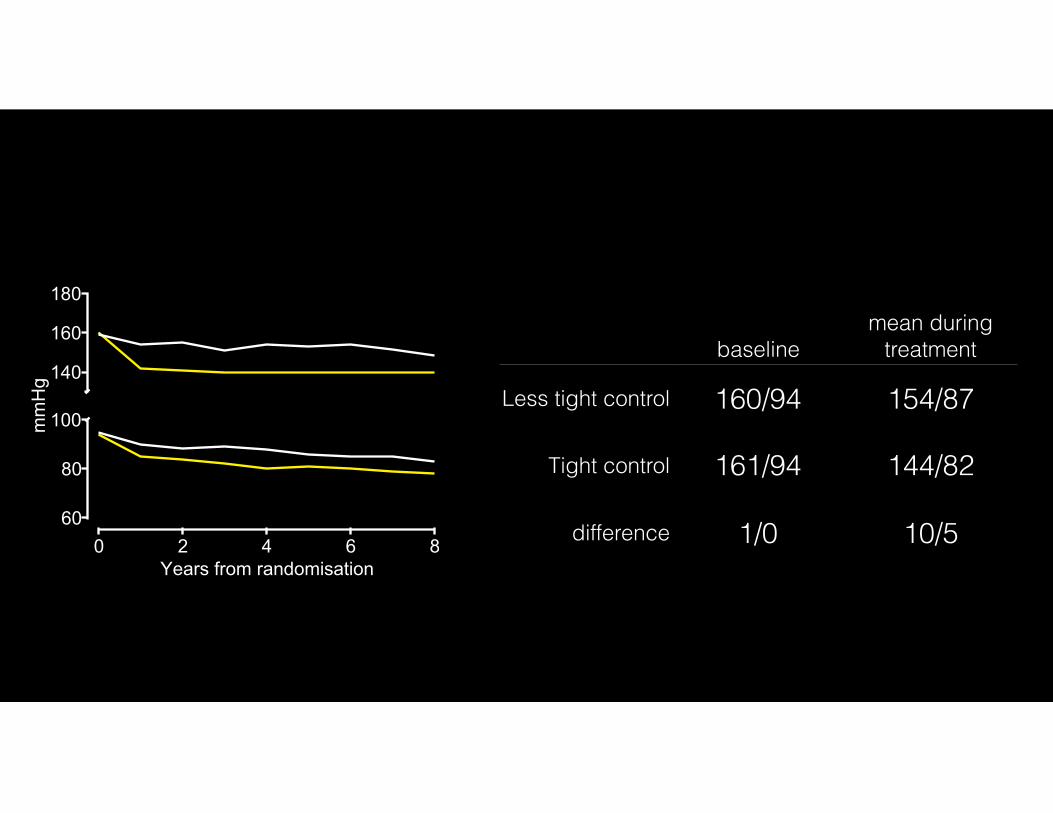
baselinemean during
treatment
Less tight control 160/94 154/87
Tight control 161/94 144/82
difference 1/0 10/5

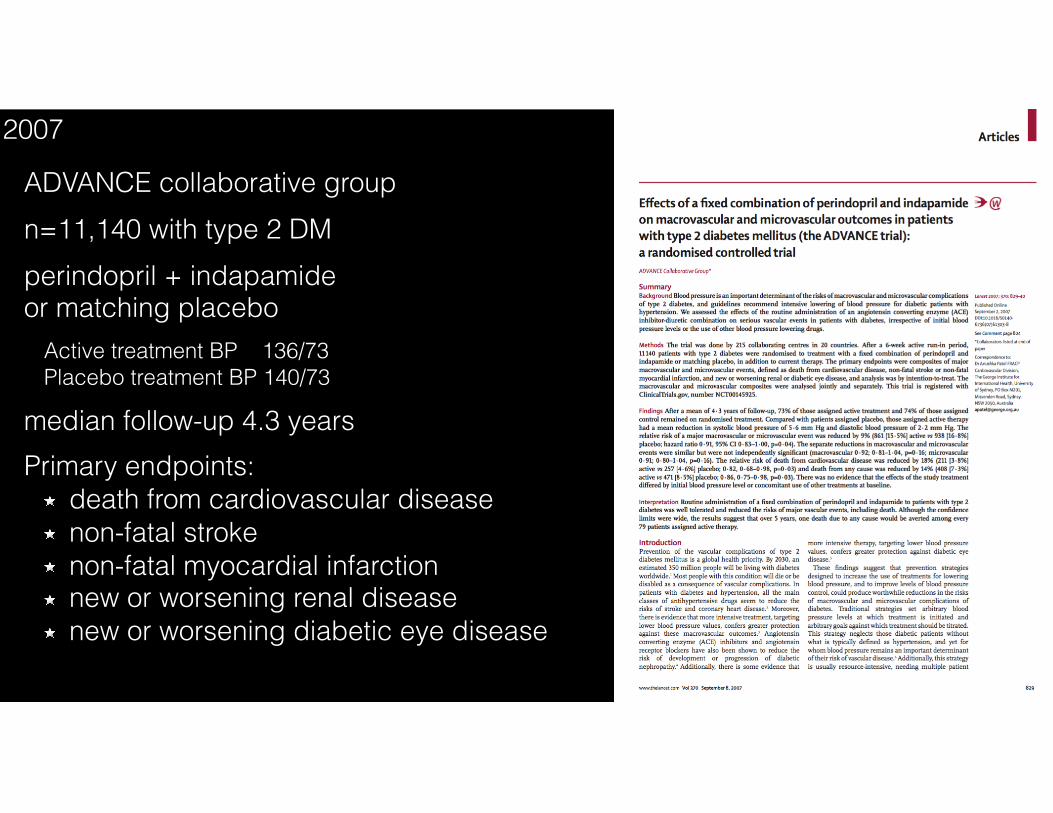
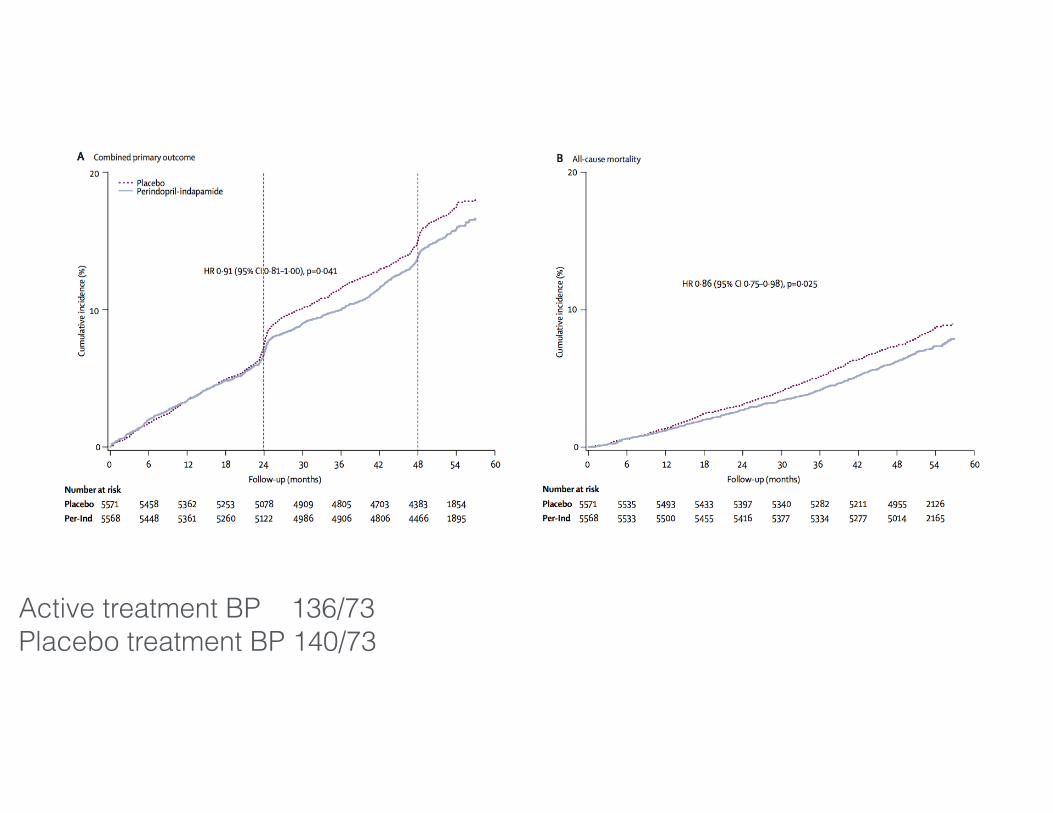
ADVANCE collaborative group n=11,140 with type 2 DM perindopril + indapamide or matching placebo
Active treatment BP 136/73 Placebo treatment BP 140/73
median follow-up 4.3 years Primary endpoints:
death from cardiovascular disease non-fatal stroke non-fatal myocardial infarction new or worsening renal disease new or worsening diabetic eye disease
2007
Active treatment BP 136/73 Placebo treatment BP 140/73

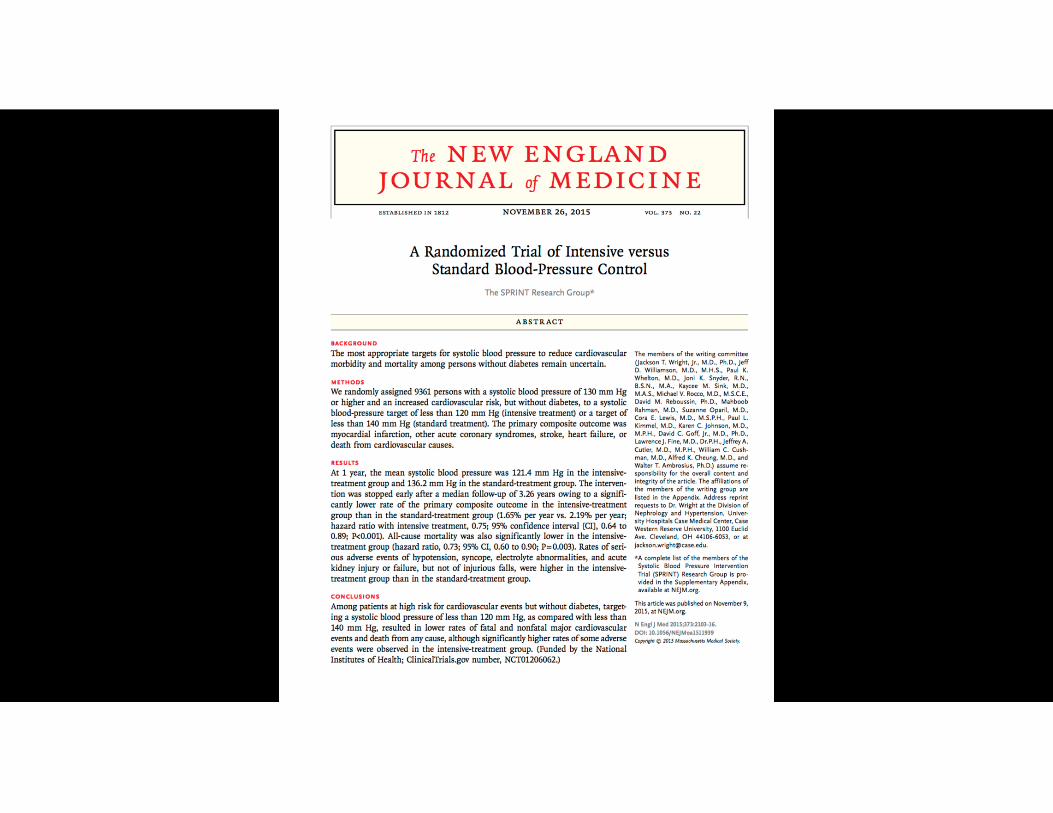
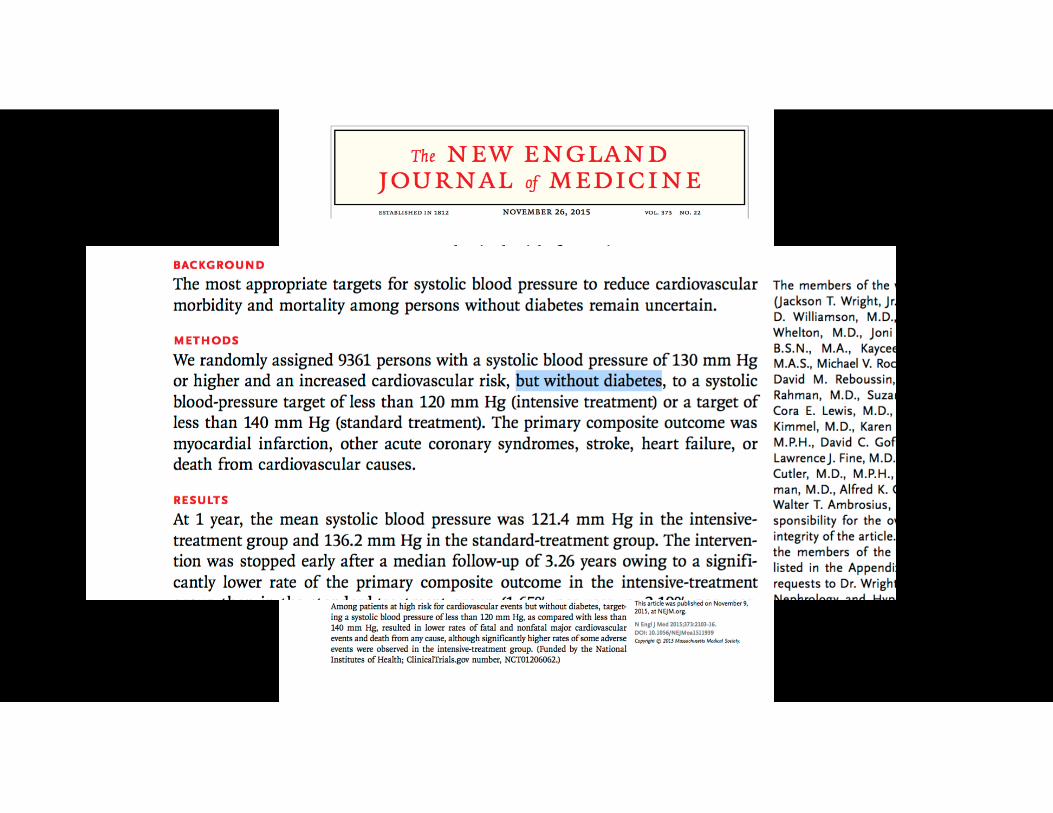
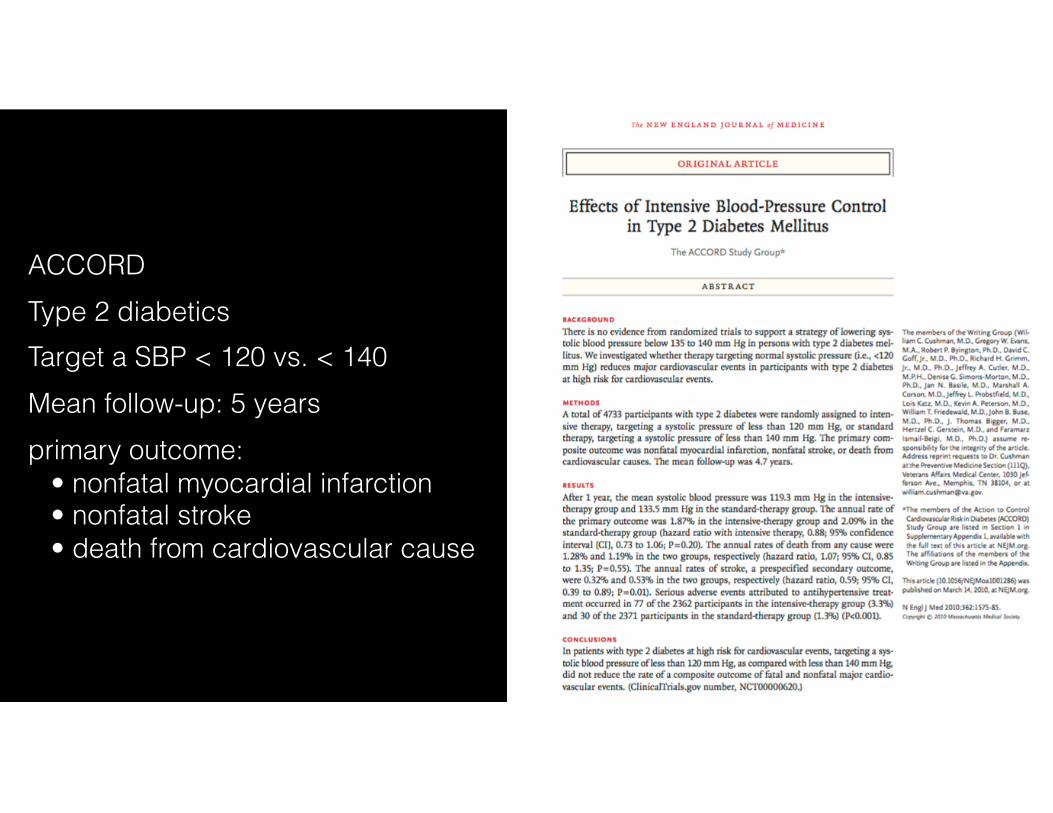
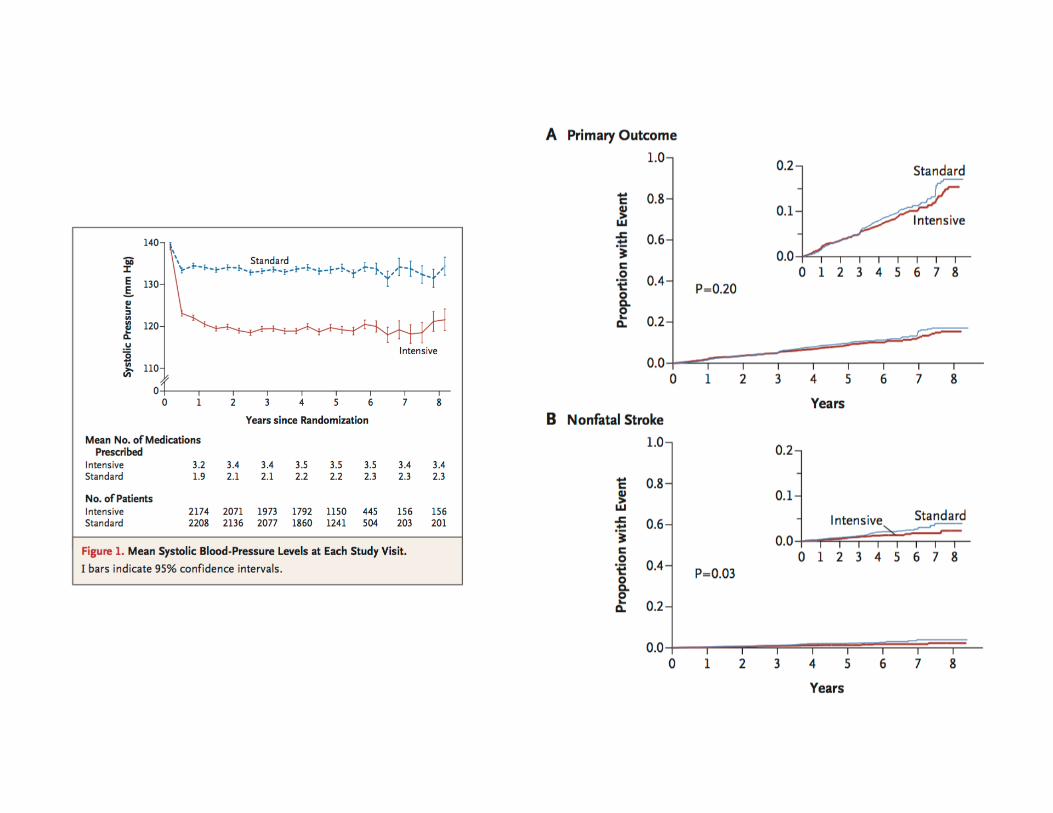
ACCORD Type 2 diabetics Target a SBP < 120 vs. < 140 Mean follow-up: 5 years primary outcome: • nonfatal myocardial infarction • nonfatal stroke • death from cardiovascular cause
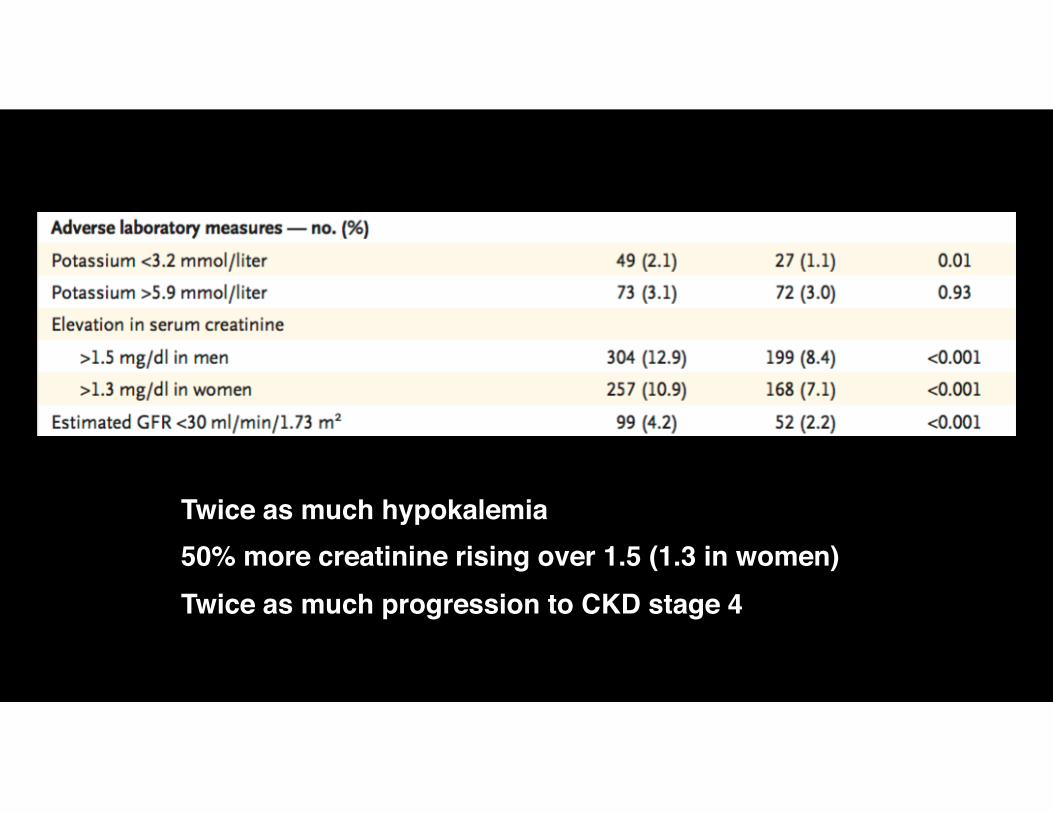
Twice as much hypokalemia50% more creatinine rising over 1.5 (1.3 in women)Twice as much progression to CKD stage 4

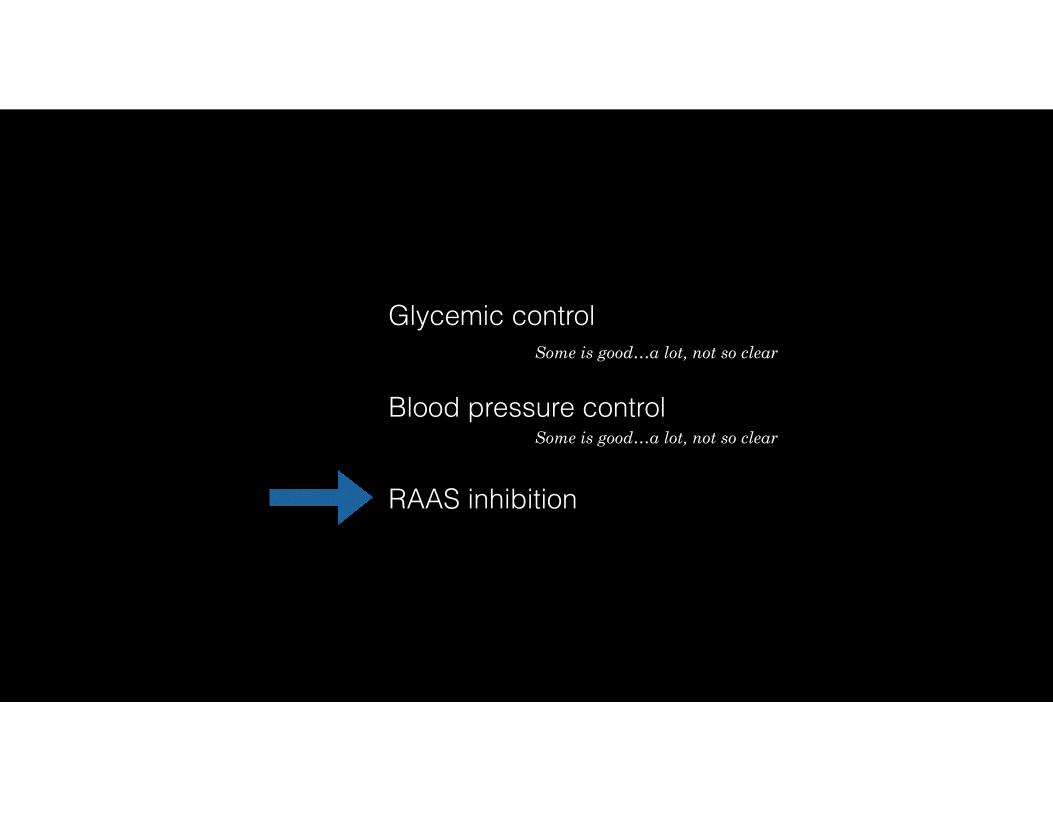
Glycemic control
RAAS inhibition
Blood pressure control

Glycemic control
RAAS inhibition
Blood pressure control
Some is good…a lot, not so clear
Some is good…a lot, not so clear
Glycemic control
RAAS inhibition
Blood pressure control
Some is good…a lot, not so clear
Some is good…a lot, not so clear
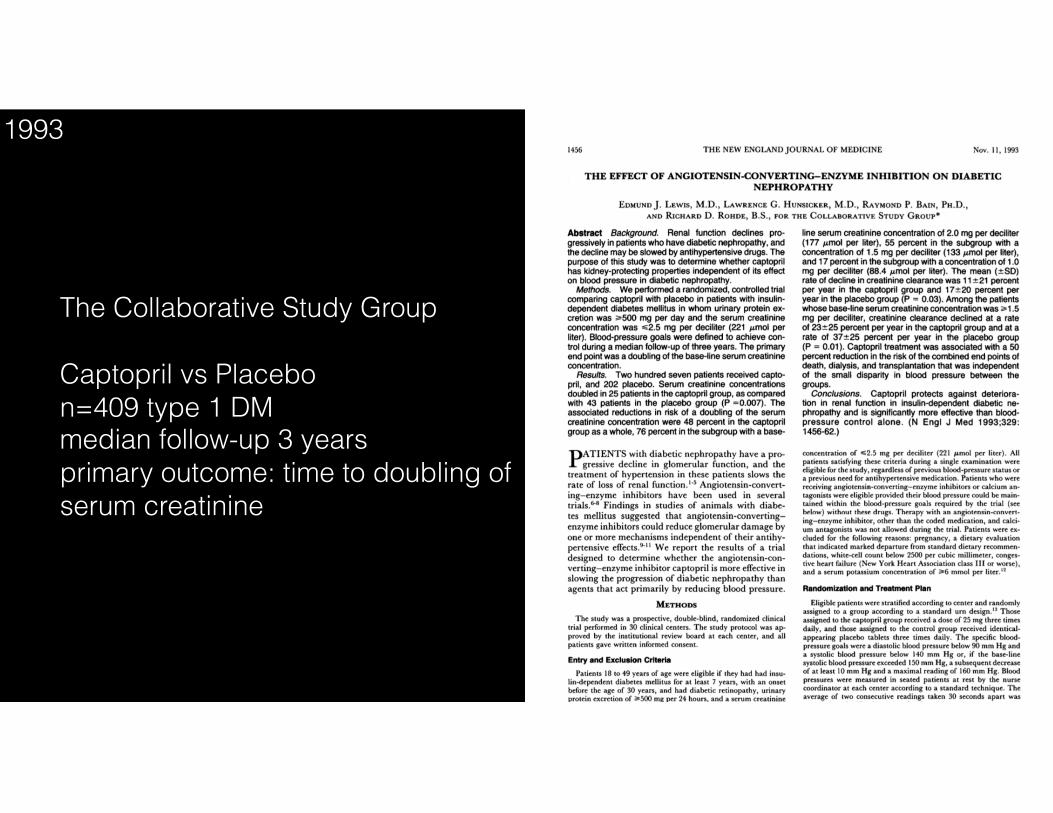
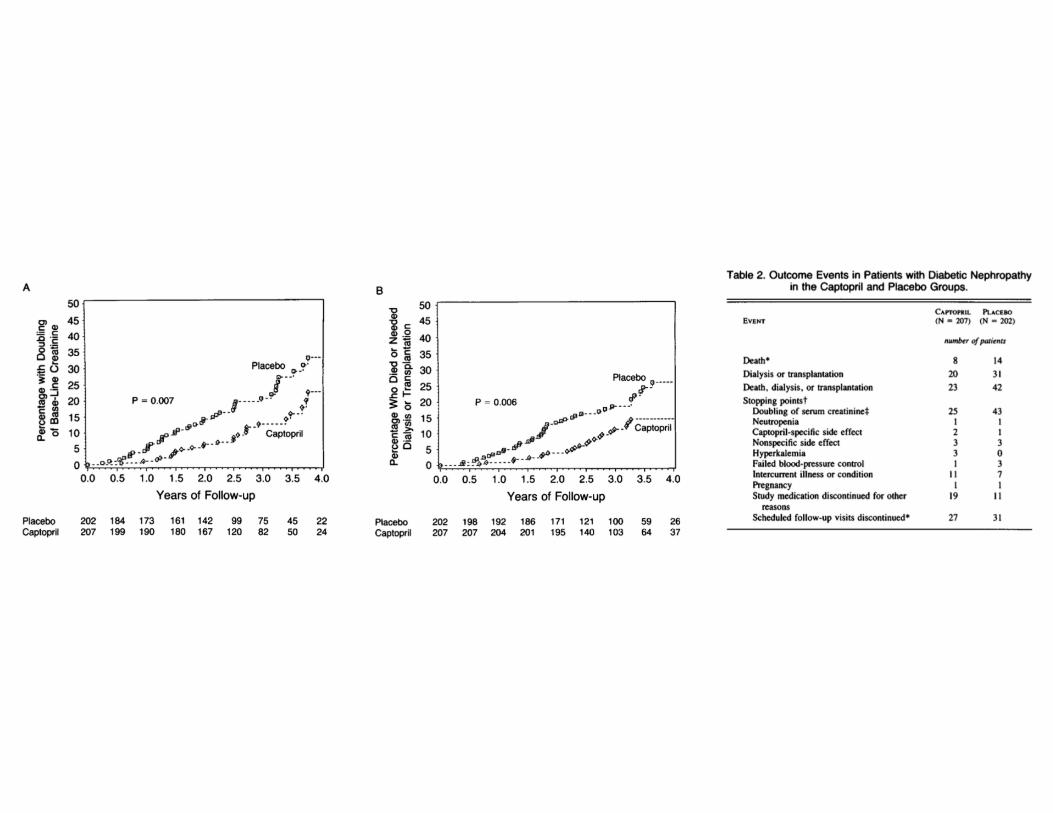
The Collaborative Study Group
Captopril vs Placebo n=409 type 1 DM median follow-up 3 years primary outcome: time to doubling of serum creatinine
1993
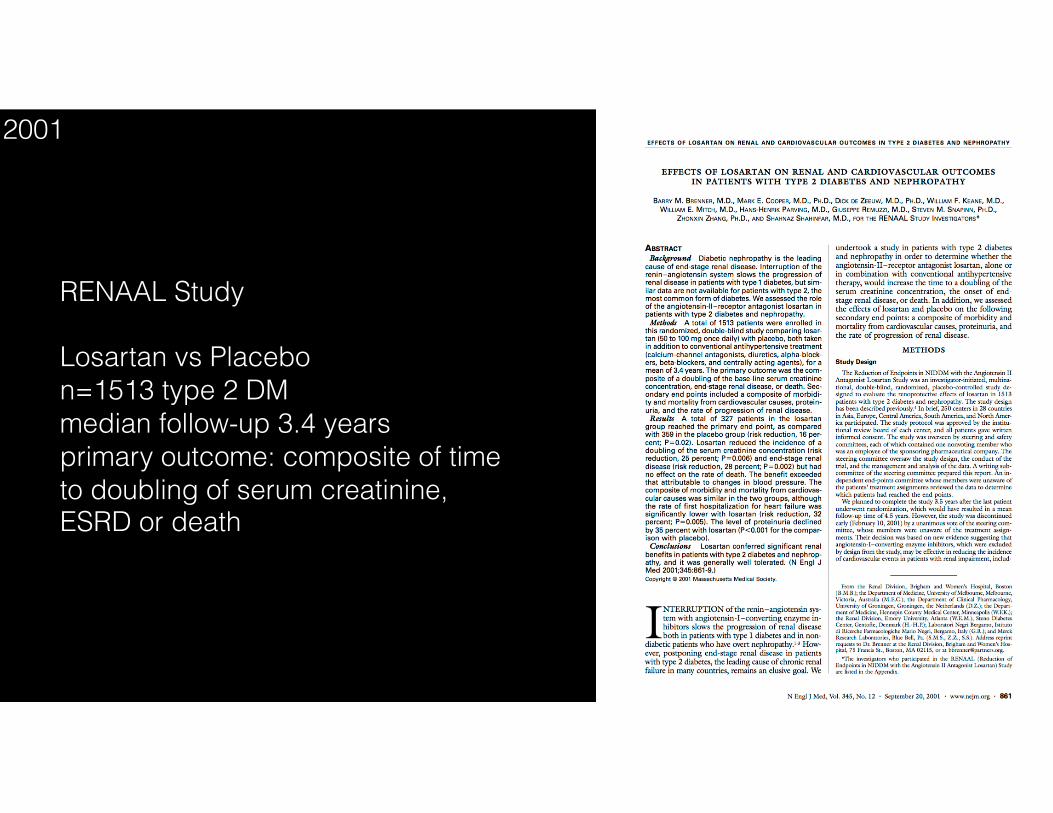
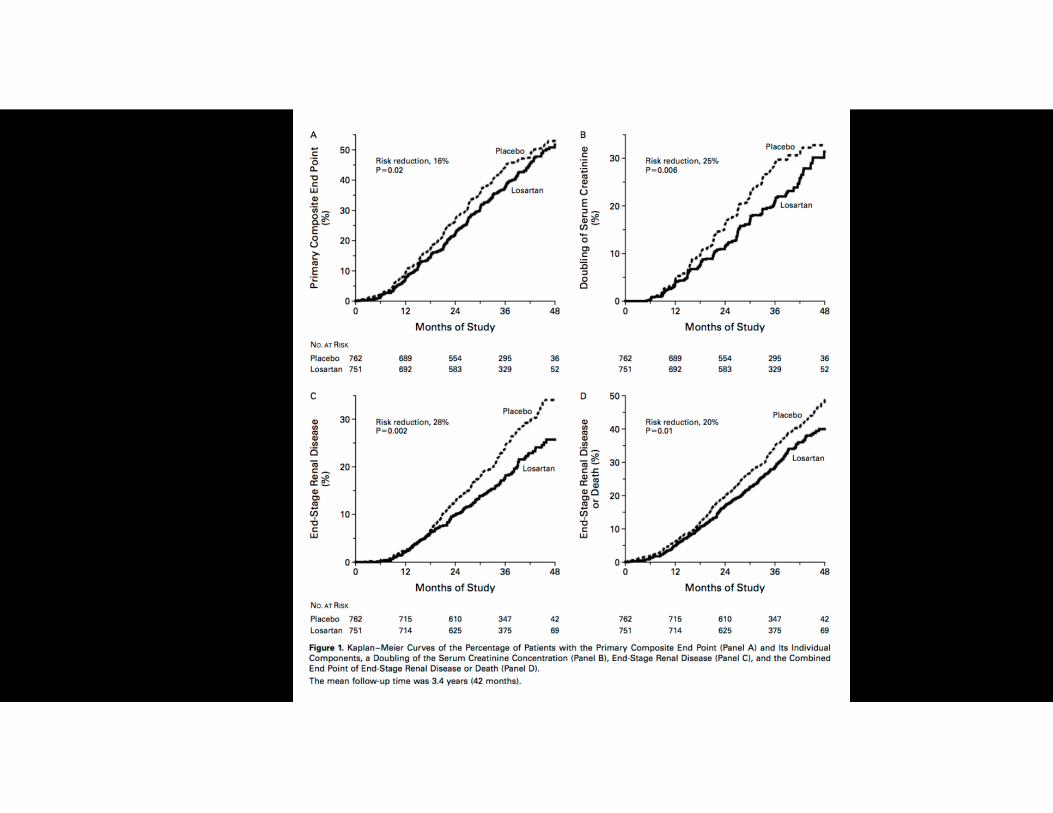
RENAAL Study
Losartan vs Placebo n=1513 type 2 DM median follow-up 3.4 years primary outcome: composite of time to doubling of serum creatinine, ESRD or death
2001
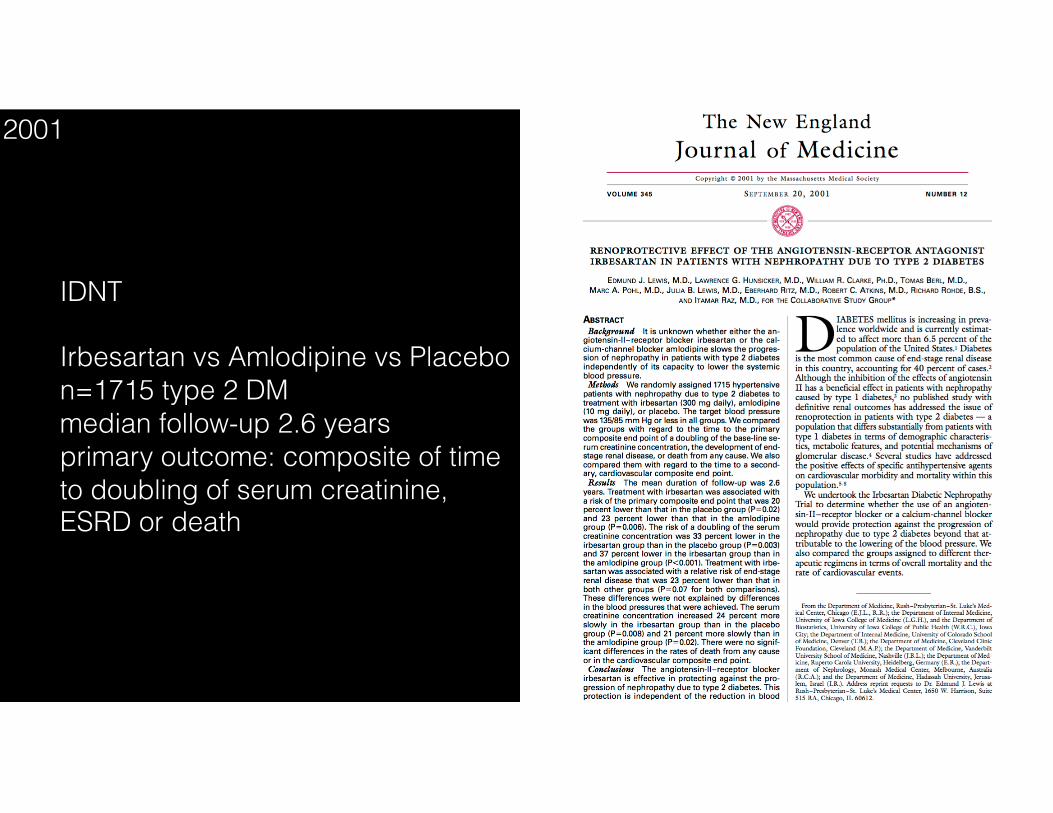
IDNT
Irbesartan vs Amlodipine vs Placebo n=1715 type 2 DM median follow-up 2.6 years primary outcome: composite of time to doubling of serum creatinine, ESRD or death
2001
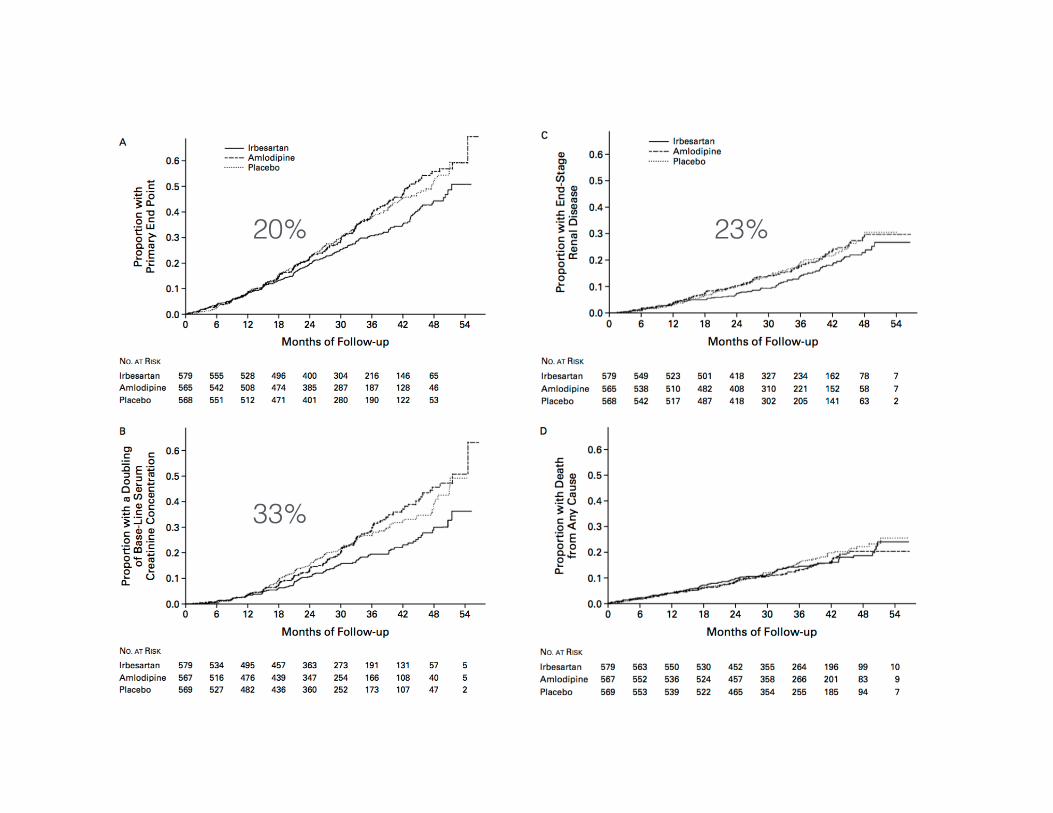
33%
20% 23%
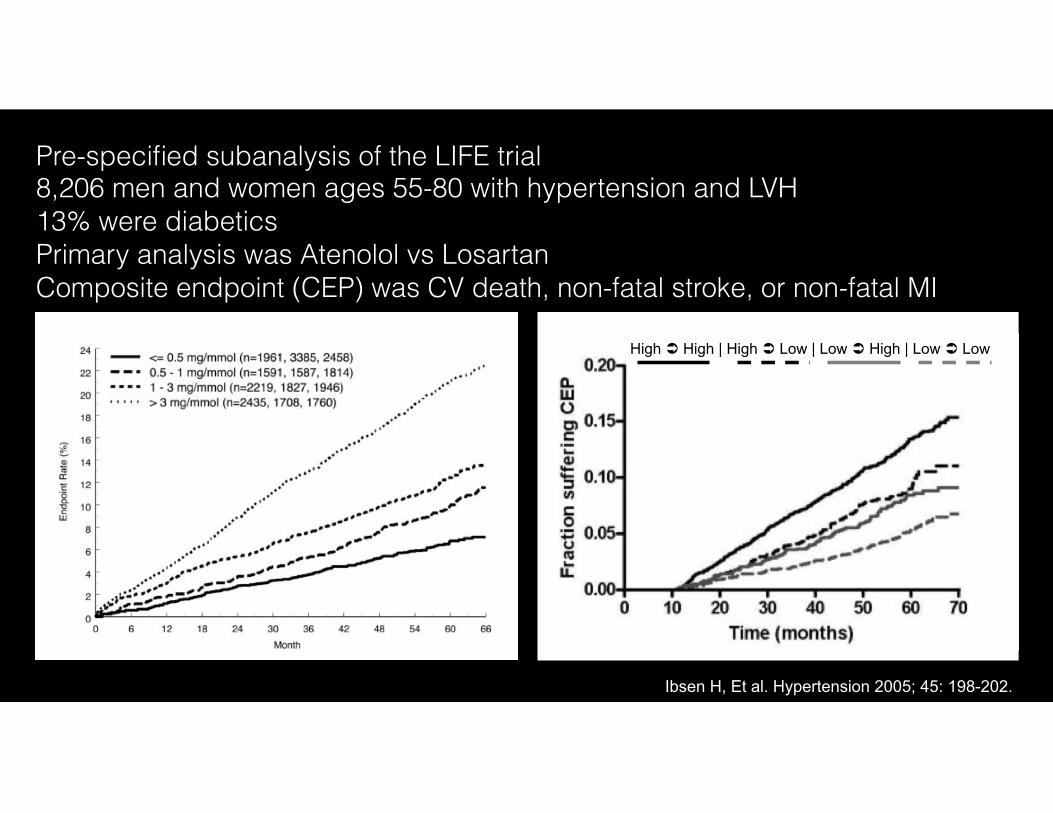
High ! High | High ! Low | Low ! High | Low ! Low
Ibsen H, Et al. Hypertension 2005; 45: 198-202.
Pre-specified subanalysis of the LIFE trial 8,206 men and women ages 55-80 with hypertension and LVH 13% were diabetics Primary analysis was Atenolol vs Losartan Composite endpoint (CEP) was CV death, non-fatal stroke, or non-fatal MI
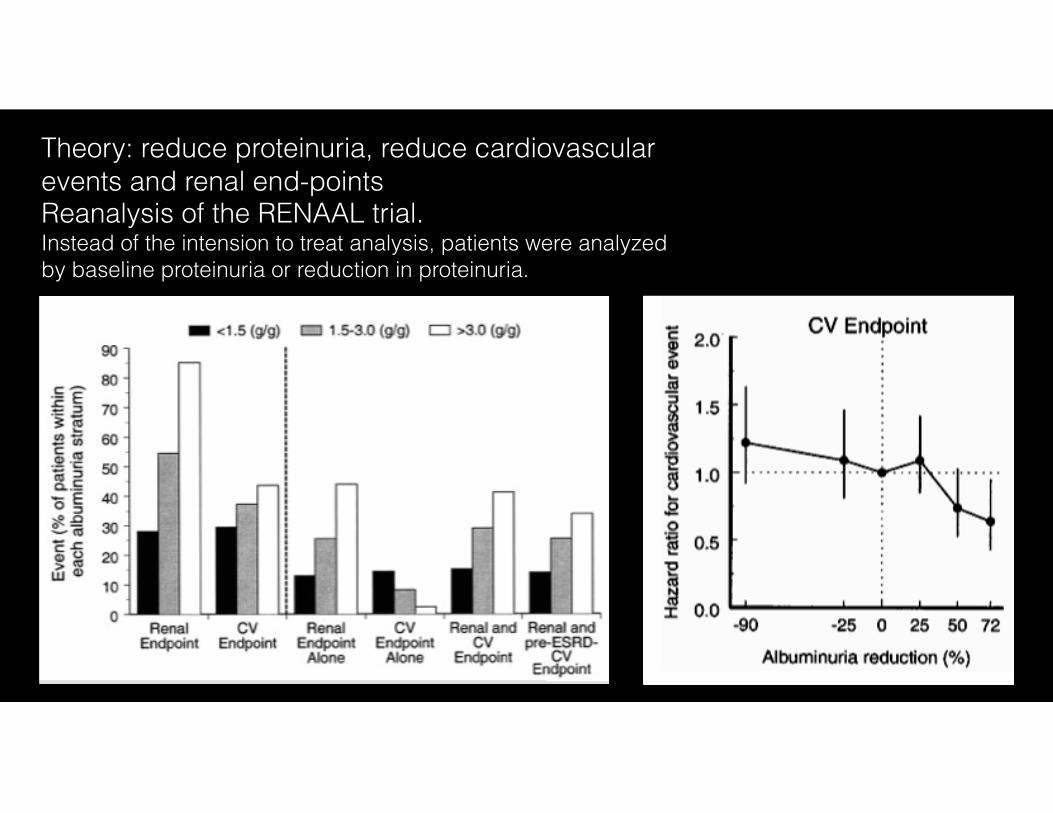
Theory: reduce proteinuria, reduce cardiovascular events and renal end-points Reanalysis of the RENAAL trial. Instead of the intension to treat analysis, patients were analyzed by baseline proteinuria or reduction in proteinuria.
Could we get better outcomes by focusing on reducing proteinuria?
ACEi and ARB together
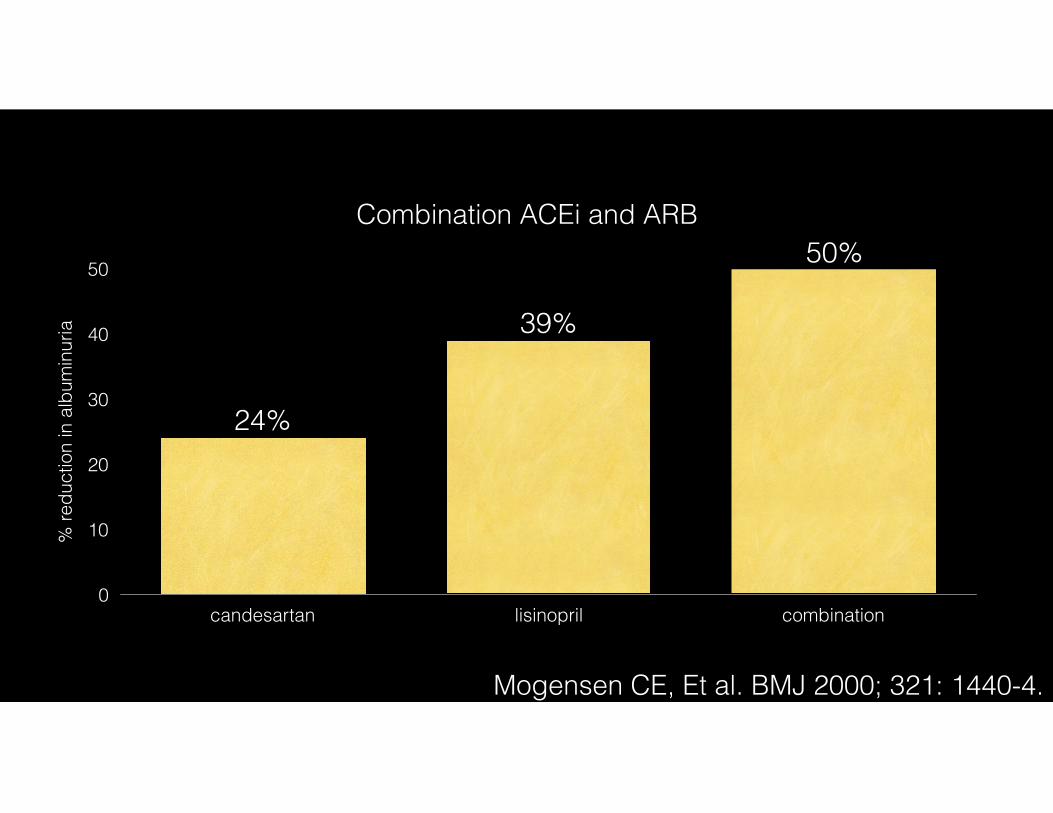
Combination ACEi and ARB
% re
duct
ion
in a
lbum
inur
ia
0
10
20
30
40
50
candesartan lisinopril combination
50%
39%
24%
Mogensen CE, Et al. BMJ 2000; 321: 1440-4.
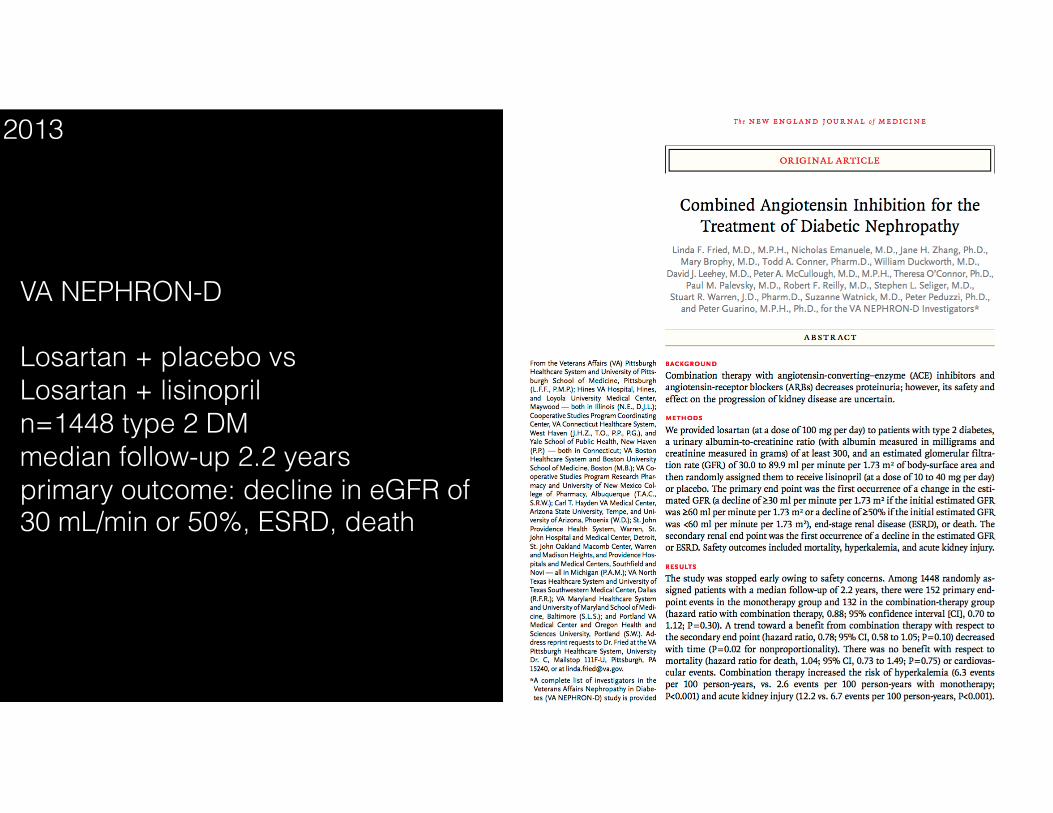
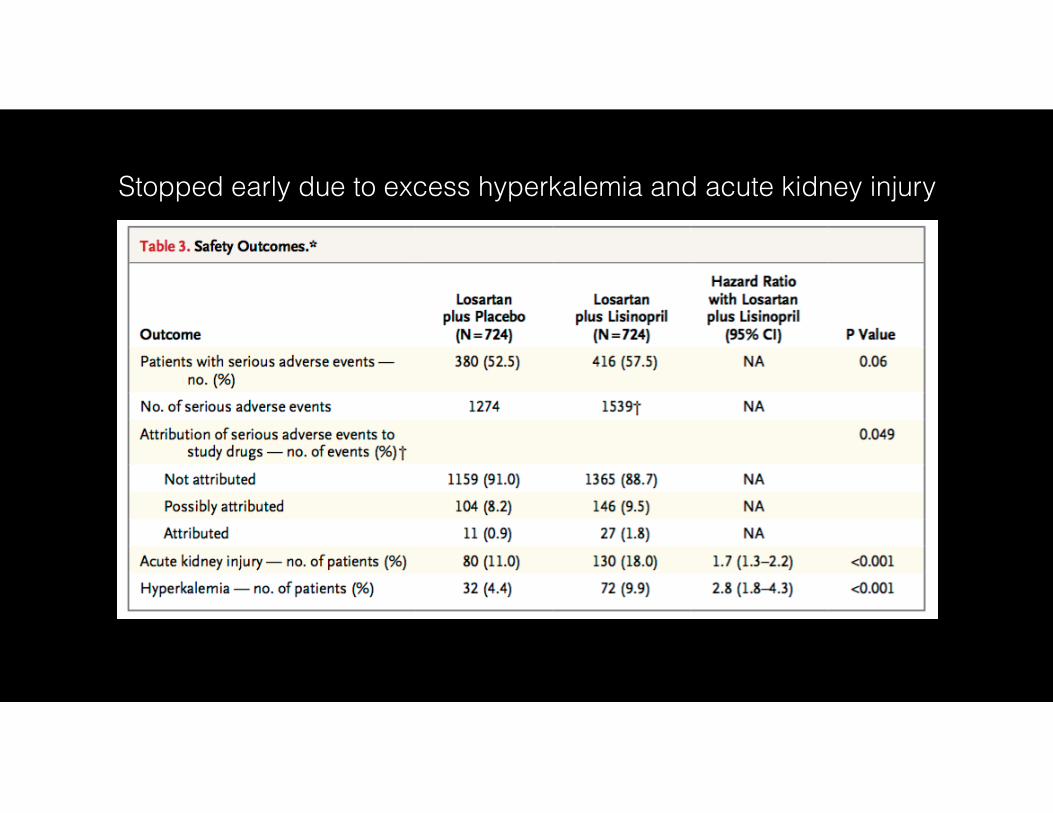
VA NEPHRON-D
Losartan + placebo vs Losartan + lisinopril n=1448 type 2 DM median follow-up 2.2 years primary outcome: decline in eGFR of 30 mL/min or 50%, ESRD, death
2013
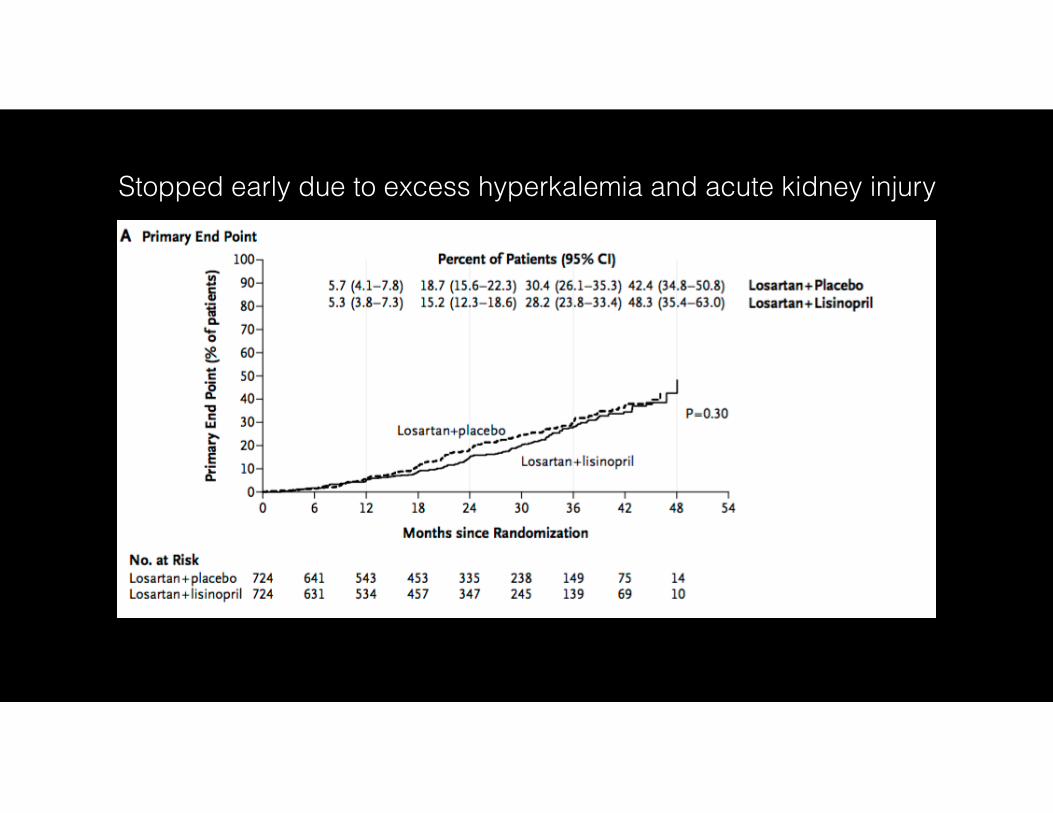
Stopped early due to excess hyperkalemia and acute kidney injury
Stopped early due to excess hyperkalemia and acute kidney injury

Glycemic control
RAAS inhibition
Blood pressure control
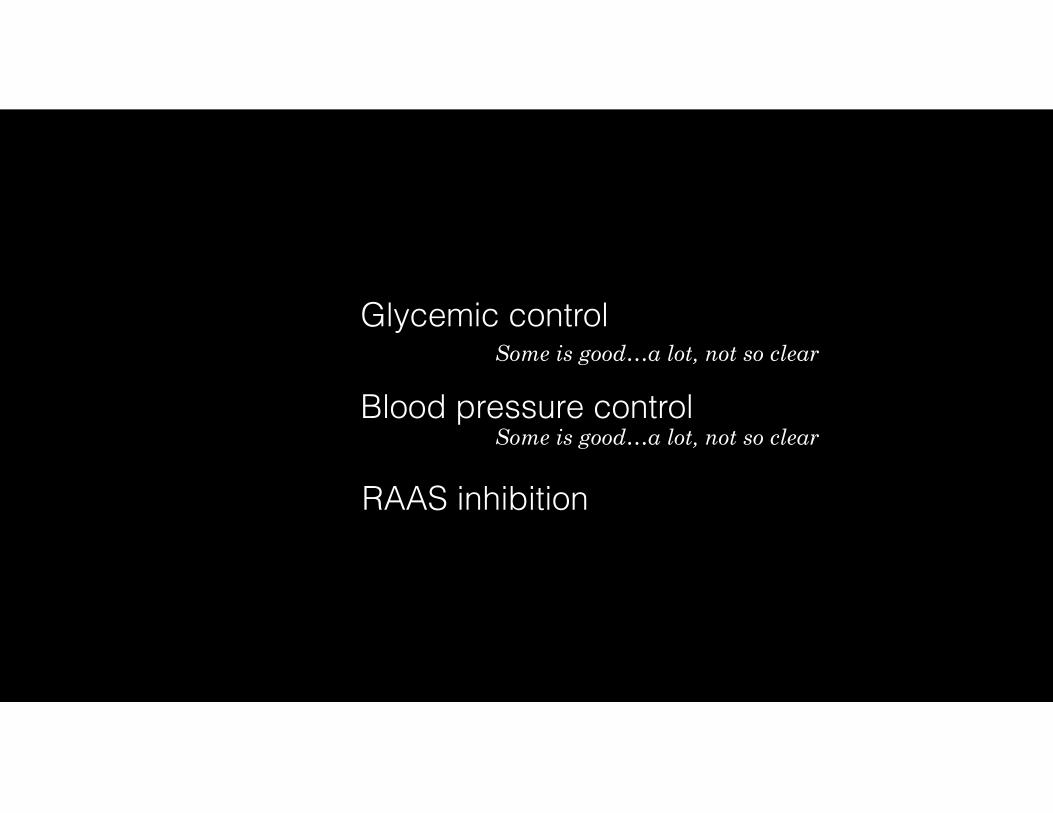
Glycemic control
RAAS inhibition
Blood pressure controlSome is good…a lot, not so clear
Some is good…a lot, not so clear
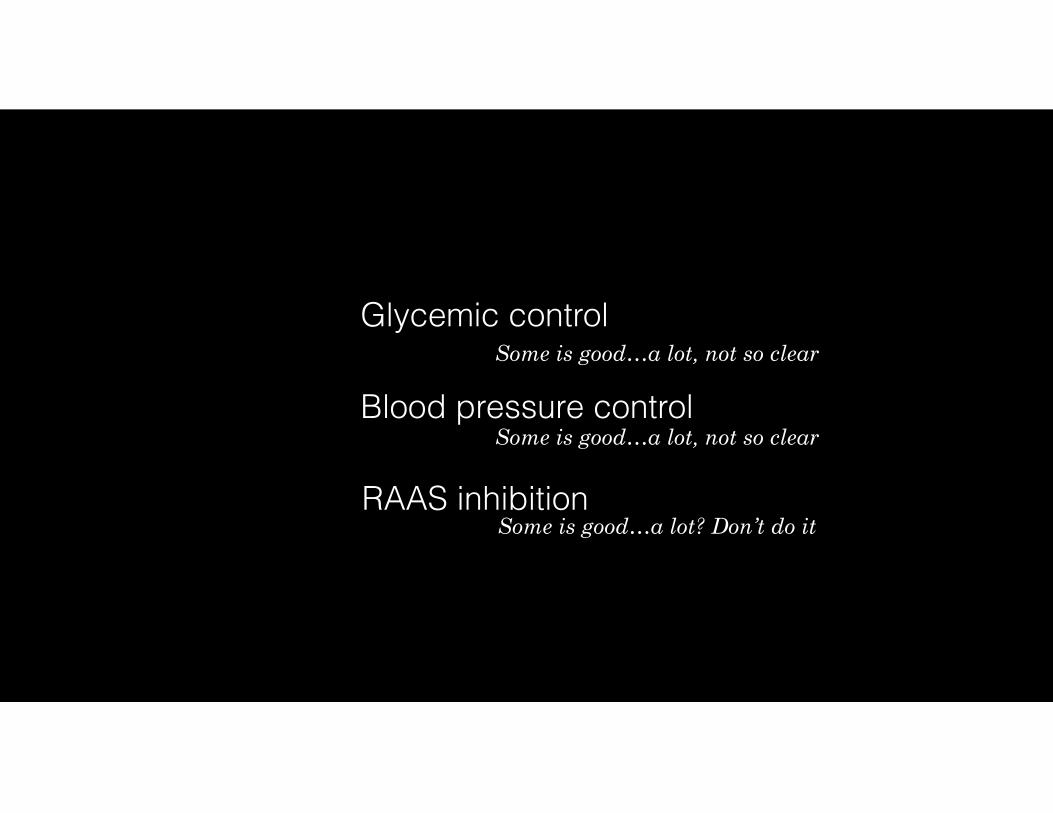
Glycemic control
RAAS inhibition
Blood pressure controlSome is good…a lot, not so clear
Some is good…a lot, not so clear
Some is good…a lot? Don’t do it
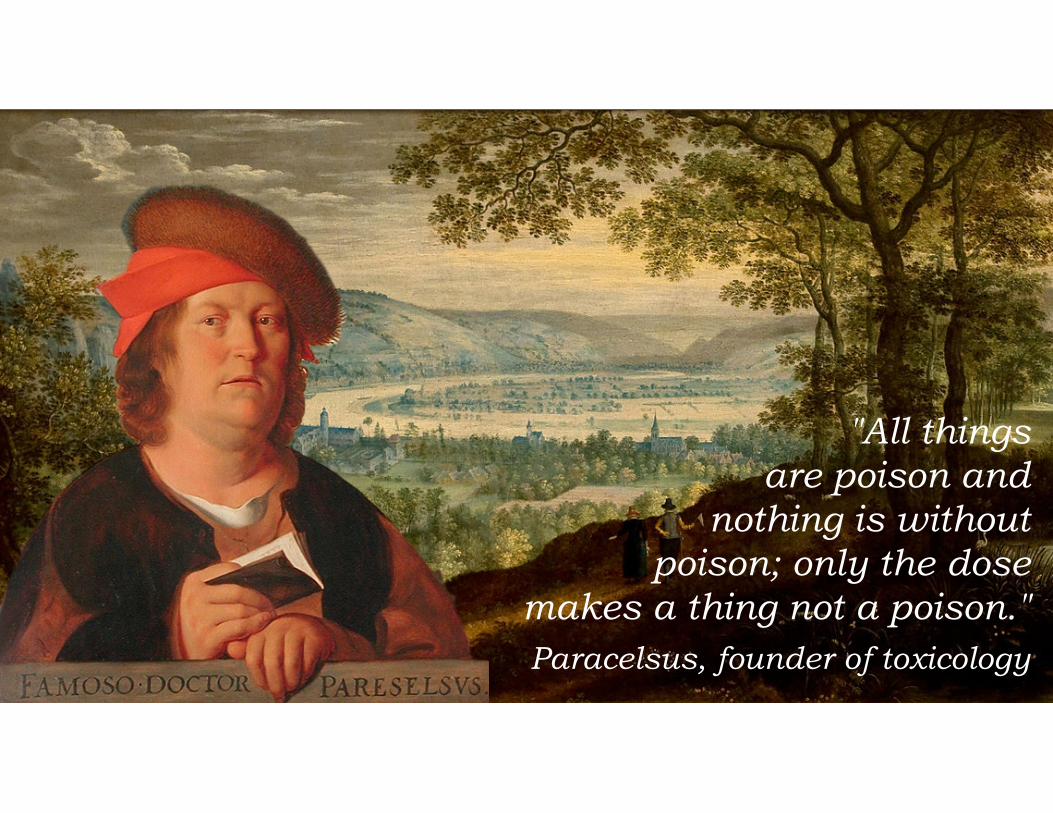
"All things are poison and
nothing is without poison; only the dose
makes a thing not a poison." Paracelsus, founder of toxicology
Glycemic control
RAAS inhibition
Blood pressure control
Some is good…a lot, not so clear
Some is good…a lot, not so clear
Some is good…a lot, don’t do it
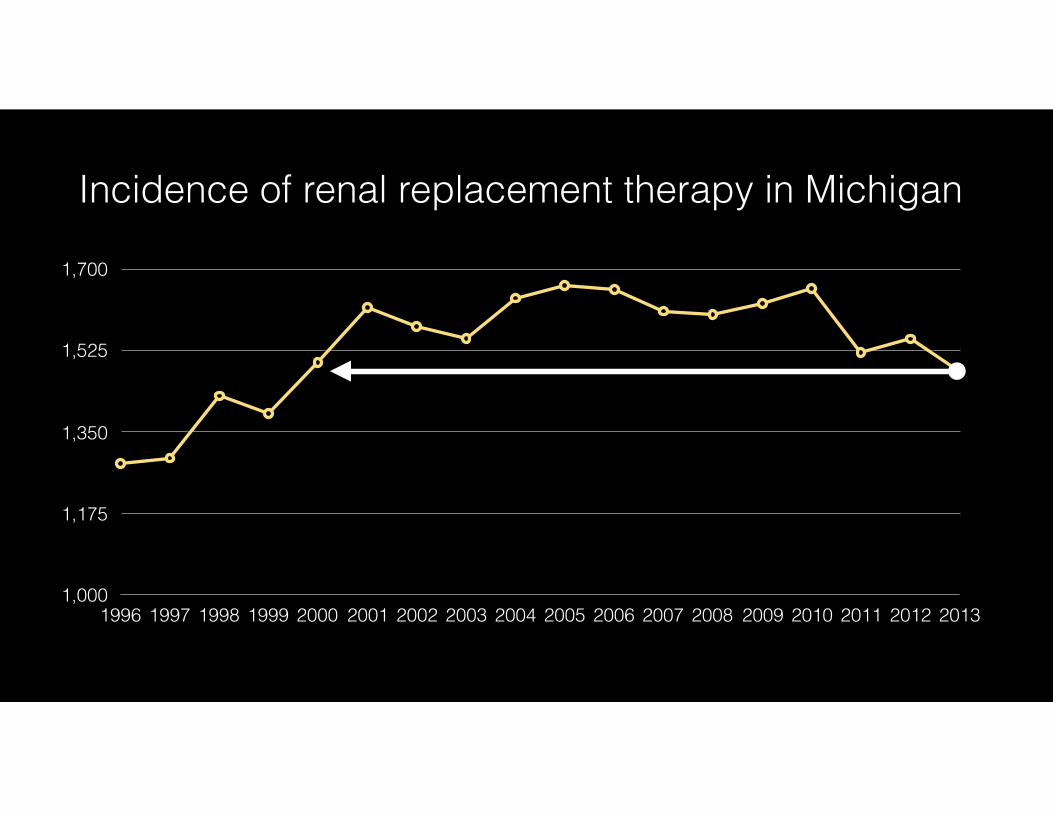
1,000
1,175
1,350
1,525
1,700
1996 1997 1998 1999 2000 2001 2002 2003 2004 2005 2006 2007 2008 2009 2010 2011 2012 2013
Incidence of renal replacement therapy in Michigan
inci
denc
e of
ESR
D p
er 1
,000
,000
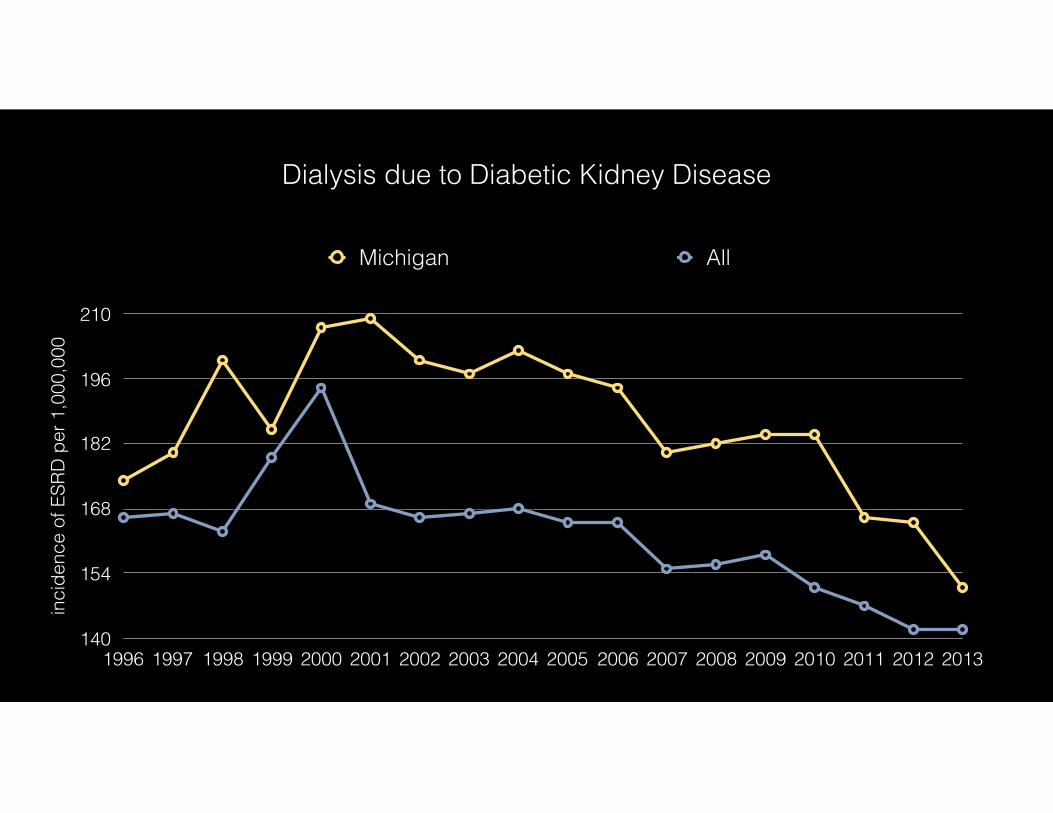
140
154
168
182
196
210
1996 1997 1998 1999 2000 2001 2002 2003 2004 2005 2006 2007 2008 2009 2010 2011 2012 2013
Michigan All
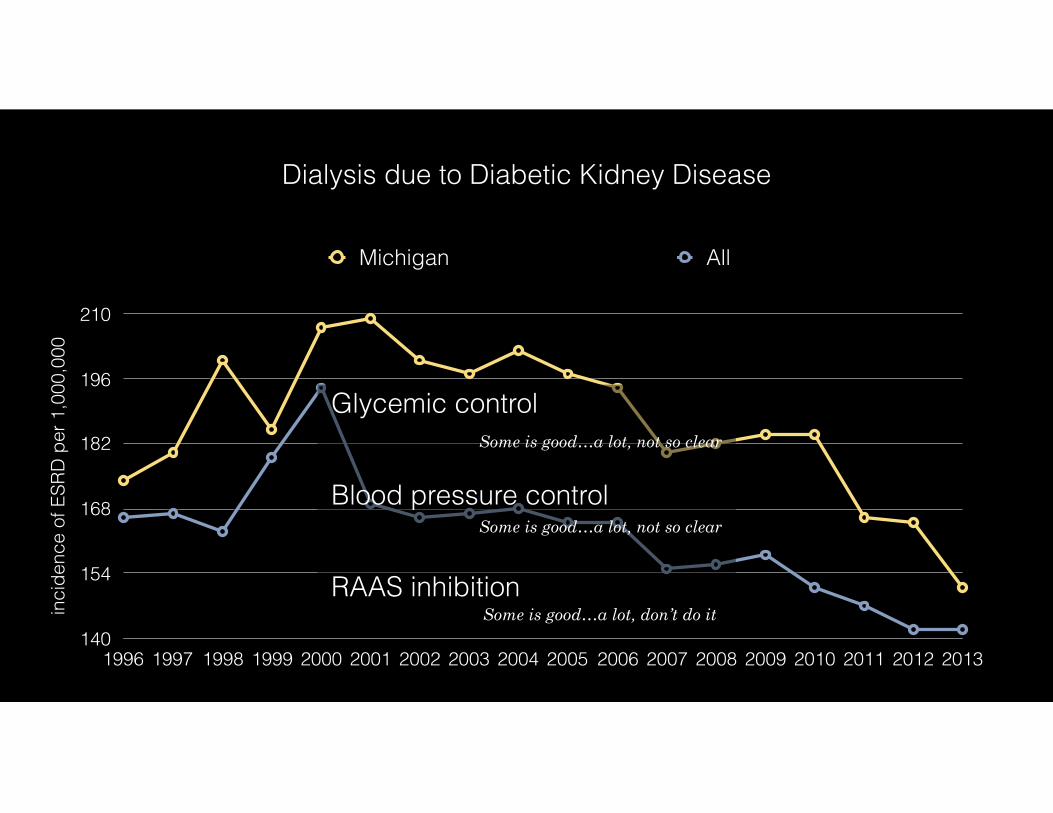
Dialysis due to Diabetic Kidney Disease
inci
denc
e of
ESR
D p
er 1
,000
,000
140
154
168
182
196
210
1996 1997 1998 1999 2000 2001 2002 2003 2004 2005 2006 2007 2008 2009 2010 2011 2012 2013
Michigan All
Dialysis due to Diabetic Kidney Disease
Glycemic control
RAAS inhibition
Blood pressure control
Some is good…a lot, not so clear
Some is good…a lot, not so clear
Some is good…a lot, don’t do it
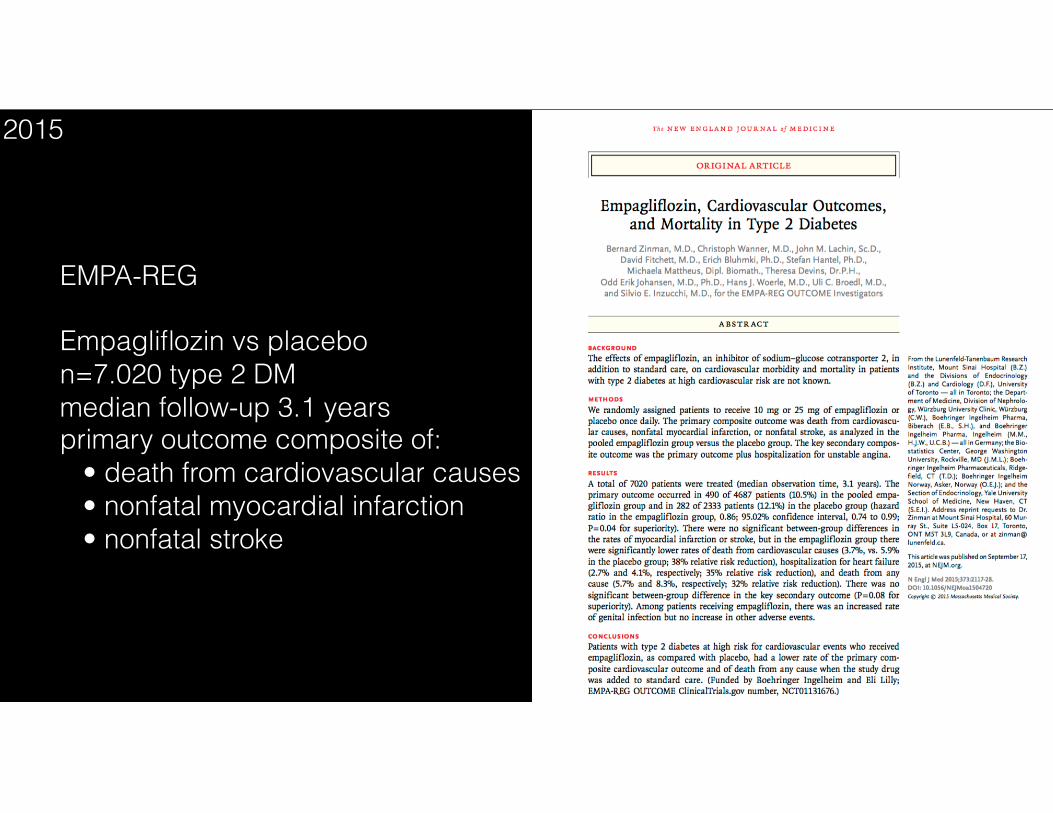
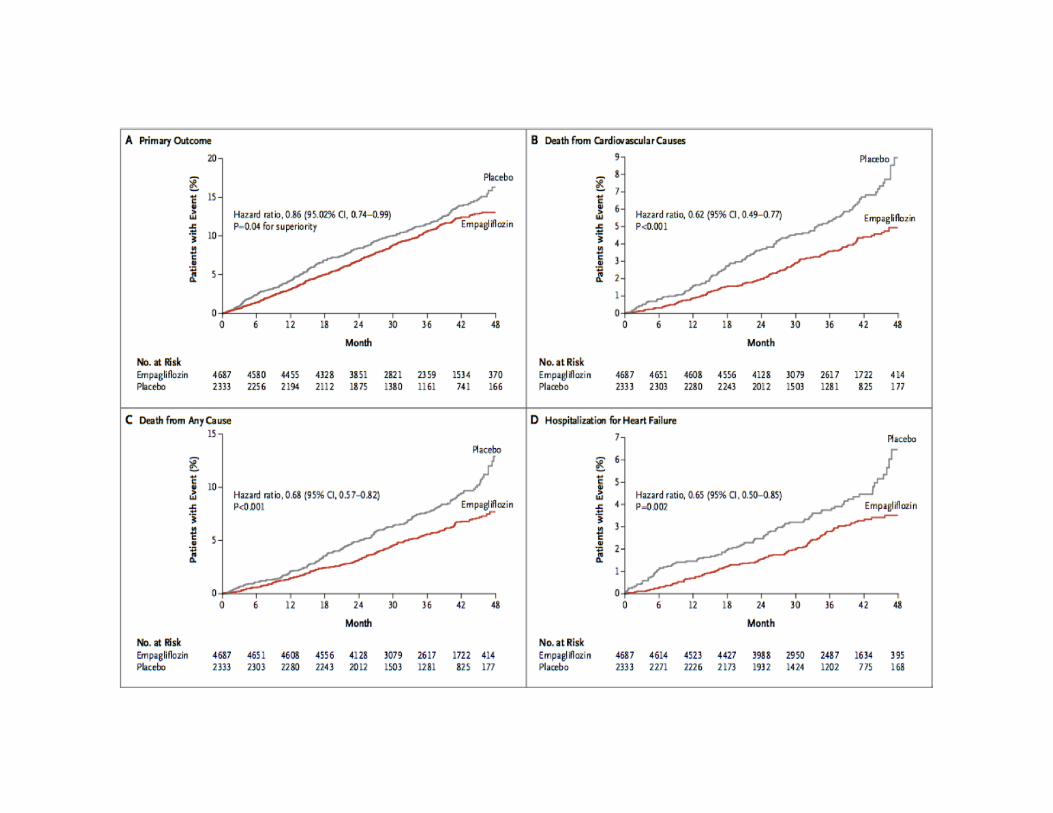
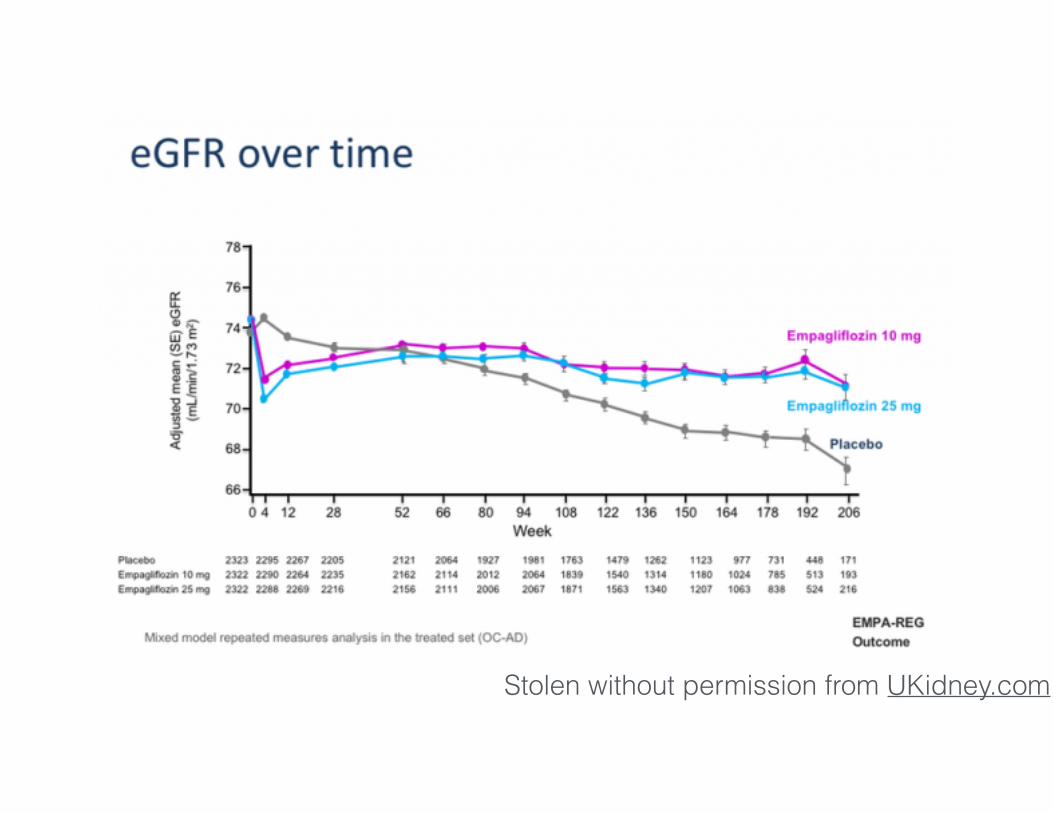
EMPA-REG
Empagliflozin vs placebo n=7.020 type 2 DM median follow-up 3.1 years primary outcome composite of: • death from cardiovascular causes • nonfatal myocardial infarction • nonfatal stroke
2015
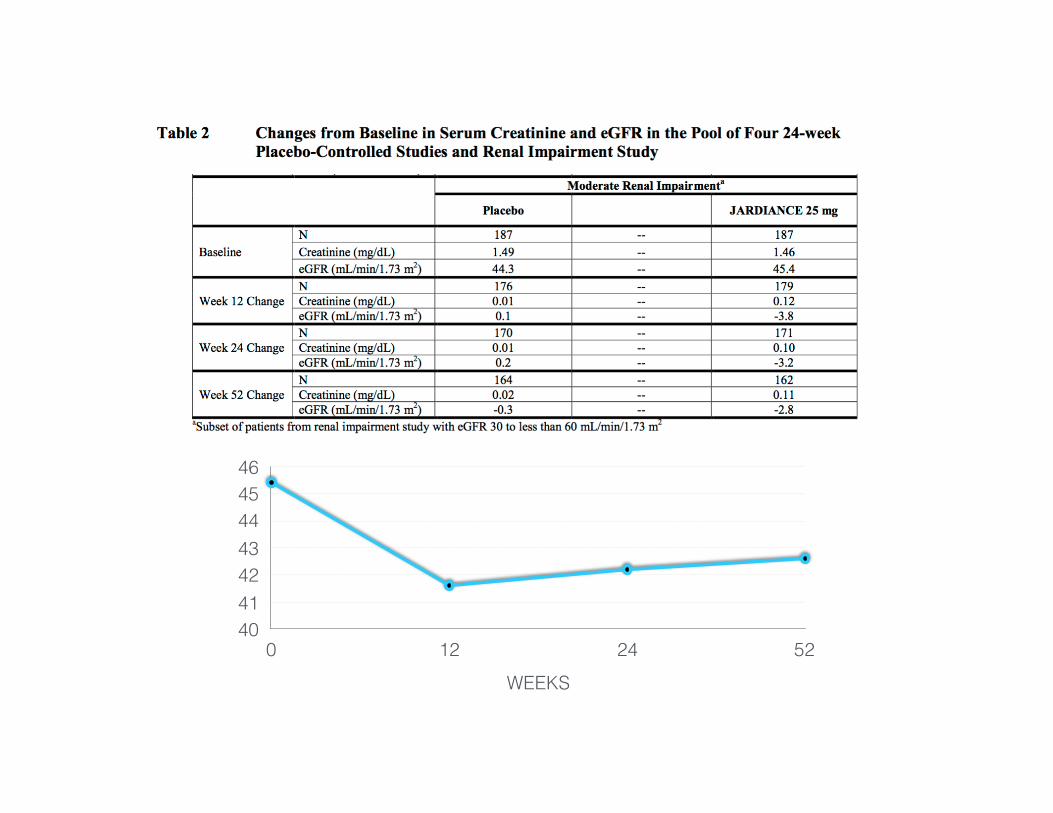
40414243444546
WEEKS0 12 24 52
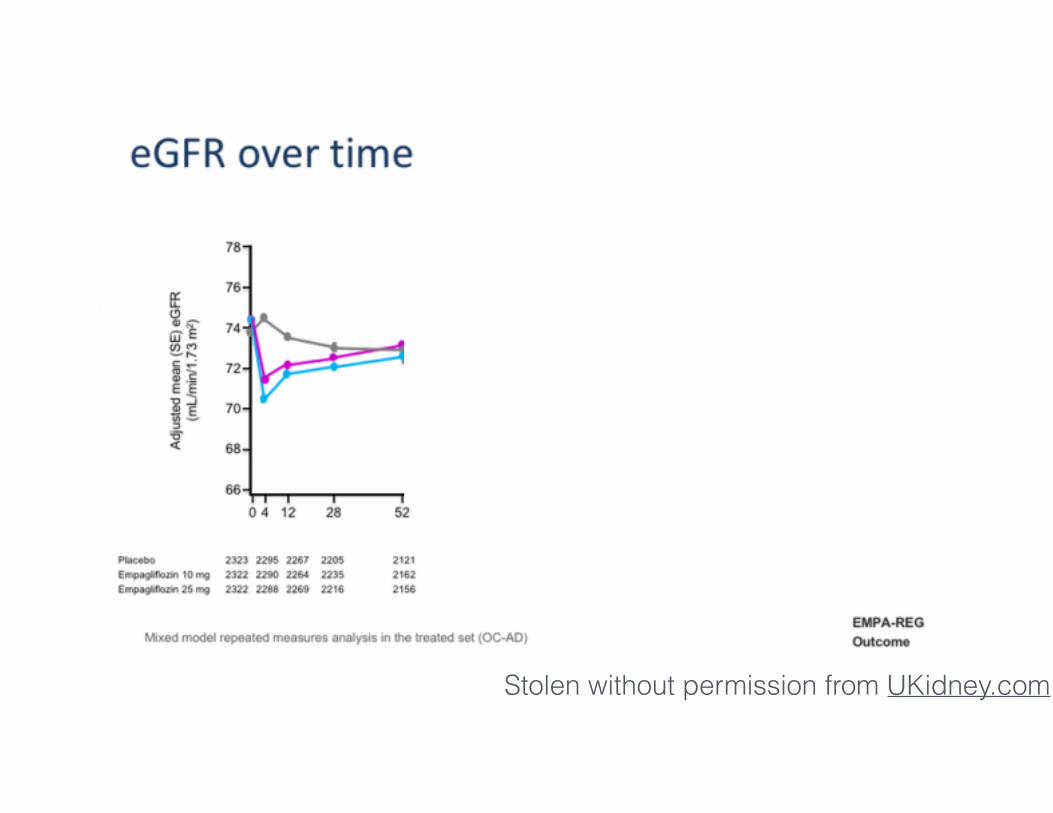
Stolen without permission from UKidney.com
Stolen without permission from UKidney.com
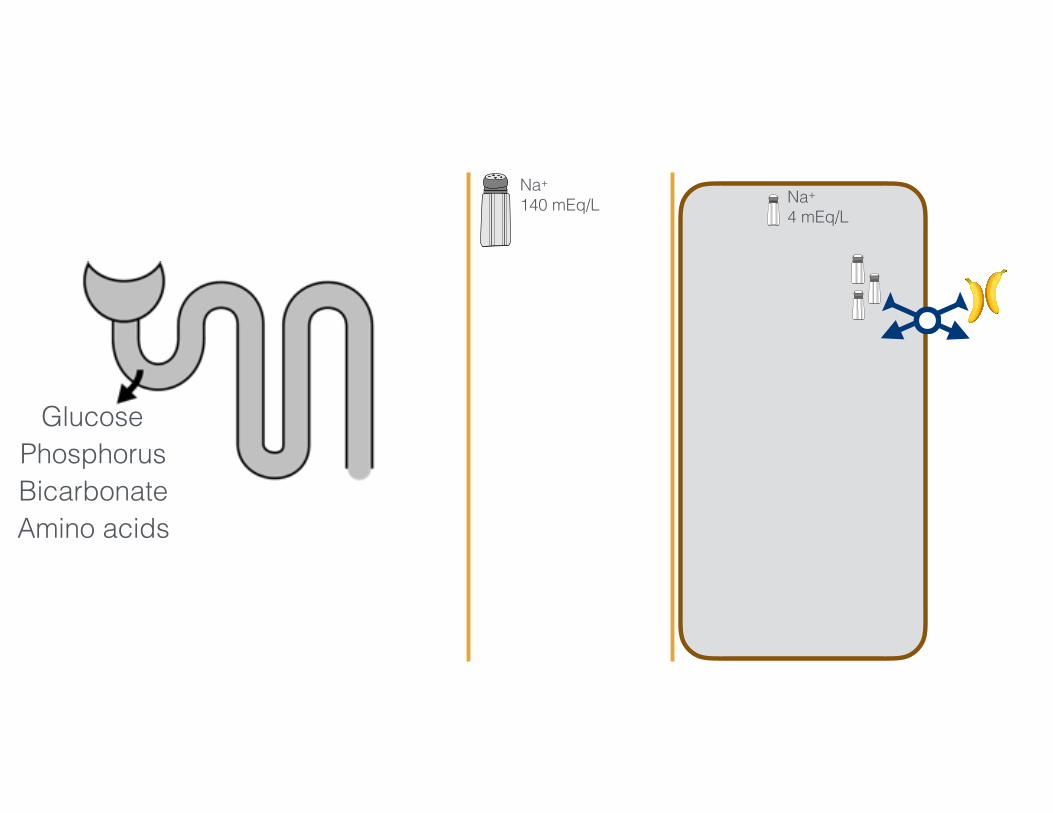
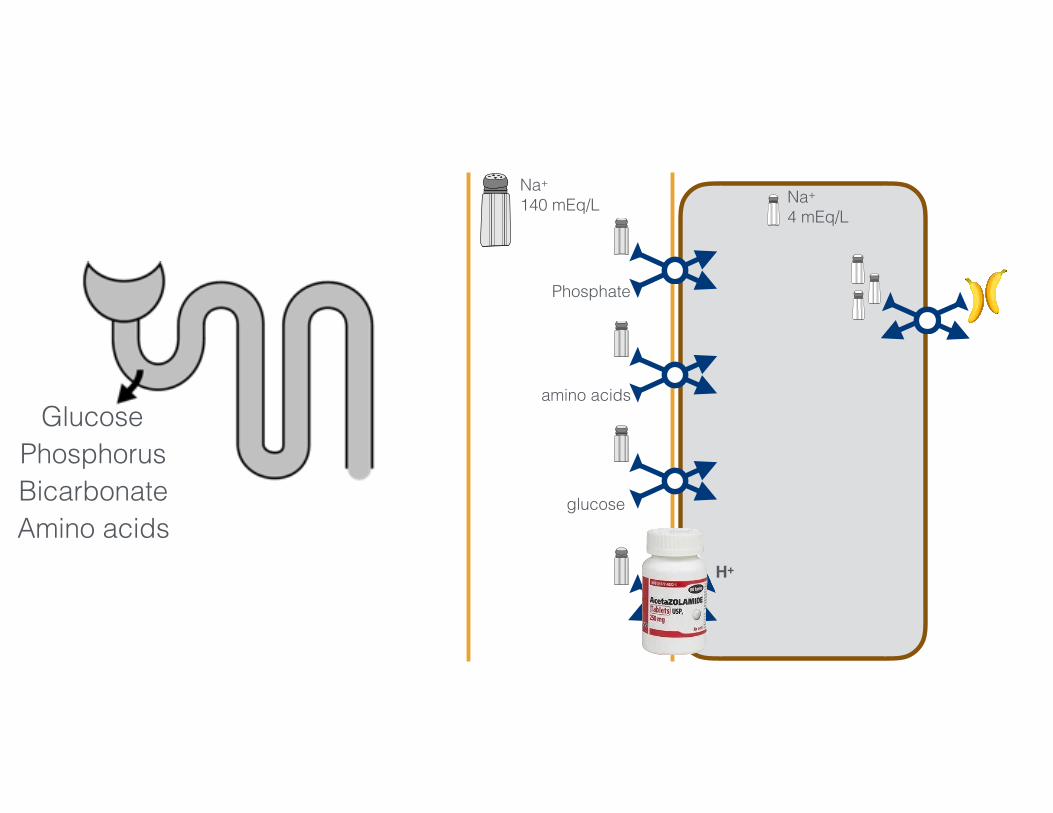
Na+
140 mEq/L Na+
4 mEq/L
3456 mmol/day 50-100 mmol/day
GlucosePhosphorusBicarbonateAmino acids
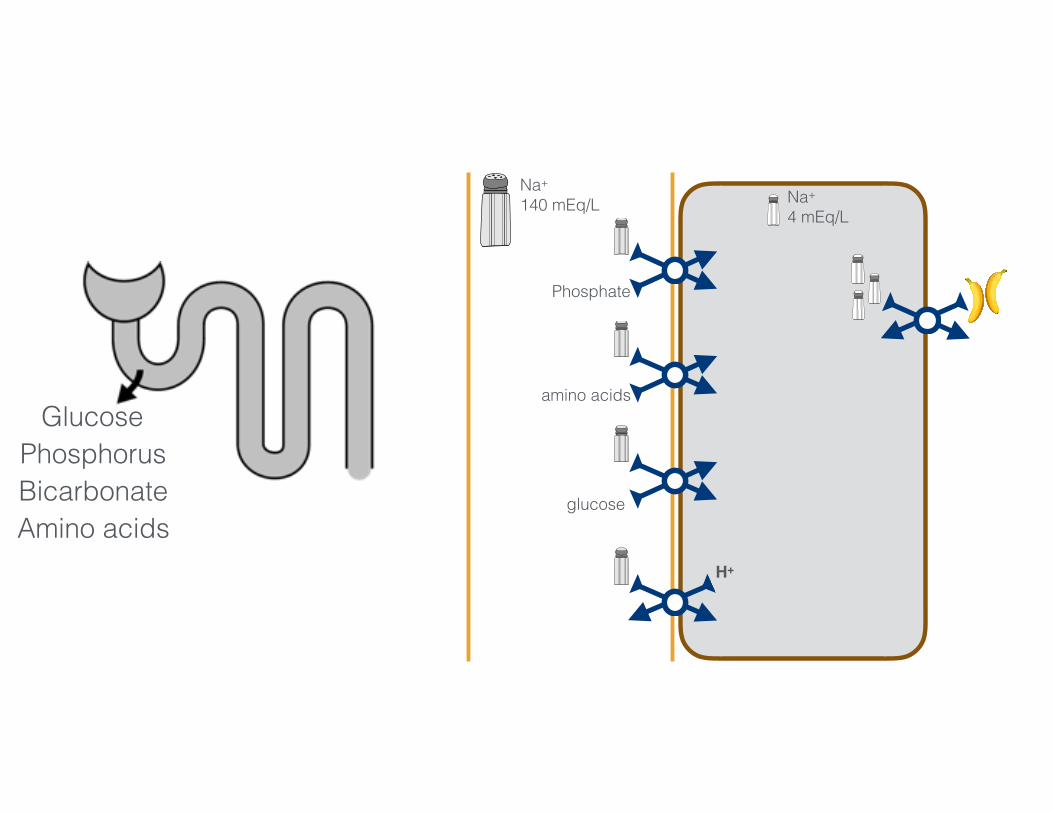
Na+
140 mEq/L Na+
4 mEq/L
Phosphate
amino acids
glucose
H+3456 mmol/day 50-100 mmol/day
GlucosePhosphorusBicarbonateAmino acids
Na+
140 mEq/L Na+
4 mEq/L
Phosphate
amino acids
glucose
H+3456 mmol/day 50-100 mmol/day
GlucosePhosphorusBicarbonateAmino acids

Na+
140 mEq/L Na+
4 mEq/L
Phosphate
amino acids
glucose
H+3456 mmol/day 50-100 mmol/day
GlucosePhosphorus
BicarbonateAmino acids
Na+
140 mEq/L Na+
4 mEq/L
Phosphate
amino acids
glucose
H+3456 mmol/day 50-100 mmol/day
GlucosePhosphorusBicarbonateAmino acids
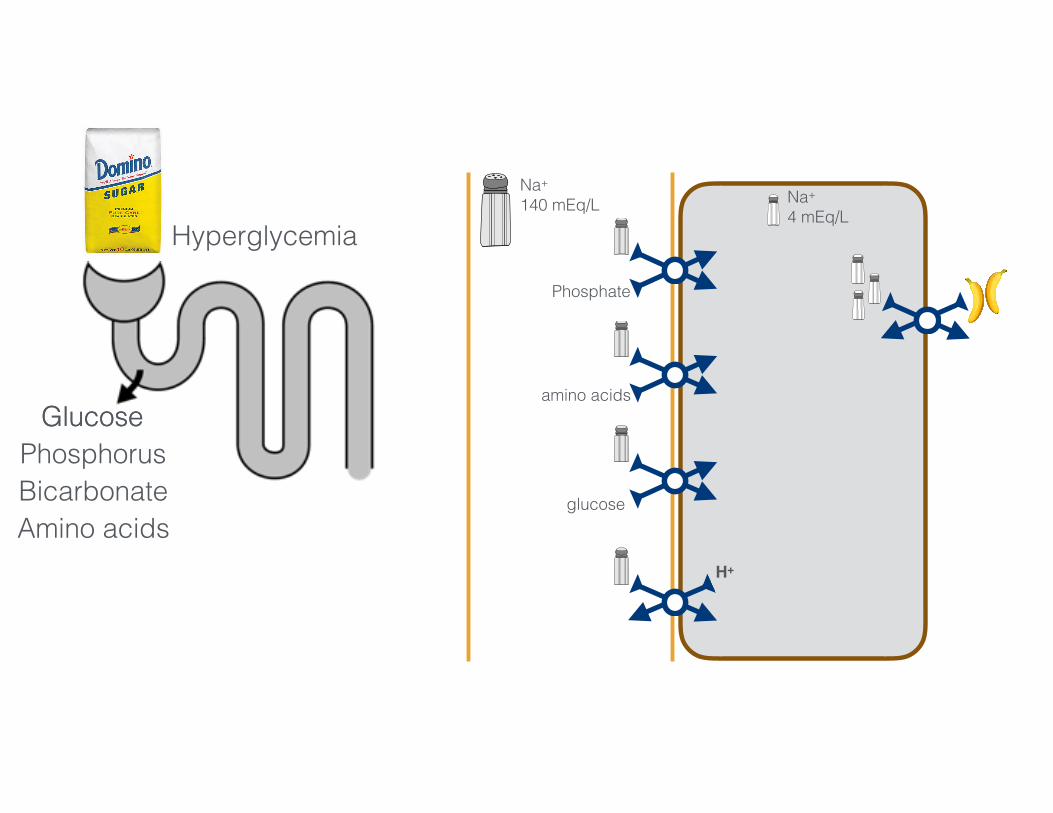
Hyperglycemia
Glucose
Na+
140 mEq/L Na+
4 mEq/L
Phosphate
amino acids
glucose
H+3456 mmol/day 50-100 mmol/day
GlucosePhosphorusBicarbonateAmino acids
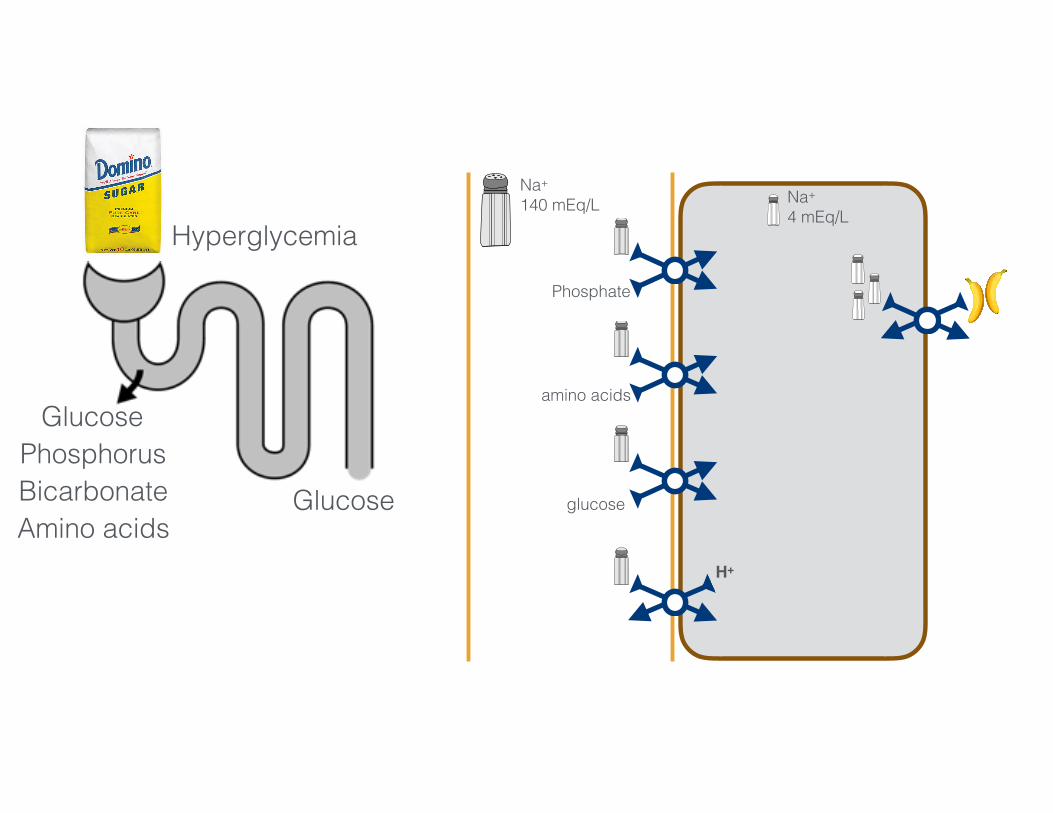
Hyperglycemia
Glucose
glucose
Na+
140 mEq/L Na+
4 mEq/L
Phosphate
amino acids
glucose
H+3456 mmol/day 50-100 mmol/day
GlucosePhosphorusBicarbonateAmino acids
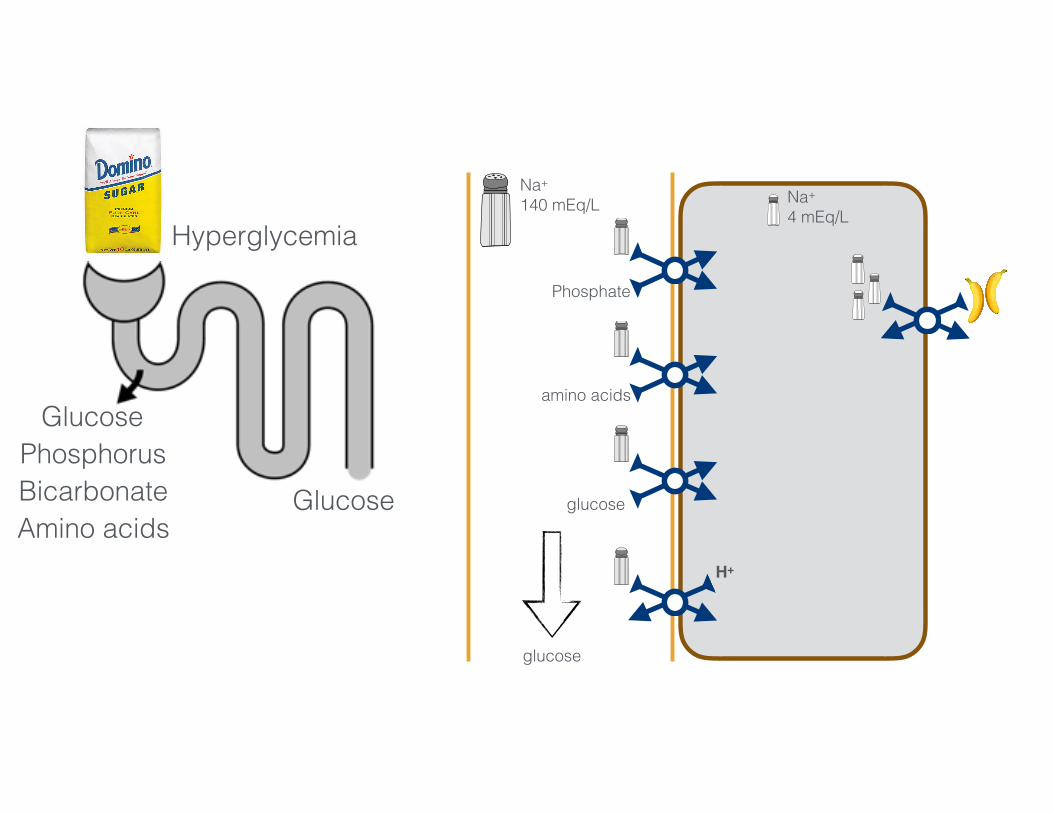
Hyperglycemia
Glucose
Na+
140 mEq/L Na+
4 mEq/L
Phosphate
amino acids
glucose
H+3456 mmol/day 50-100 mmol/day
GlucosePhosphorusBicarbonateAmino acids
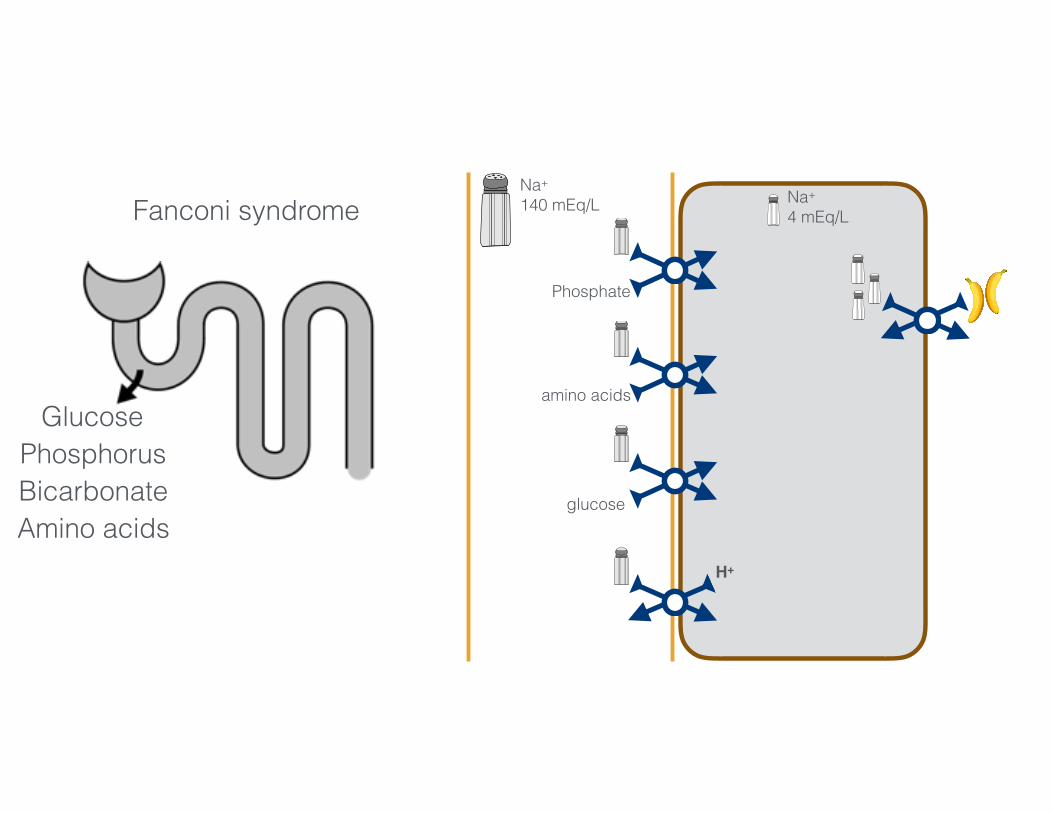
Fanconi syndrome
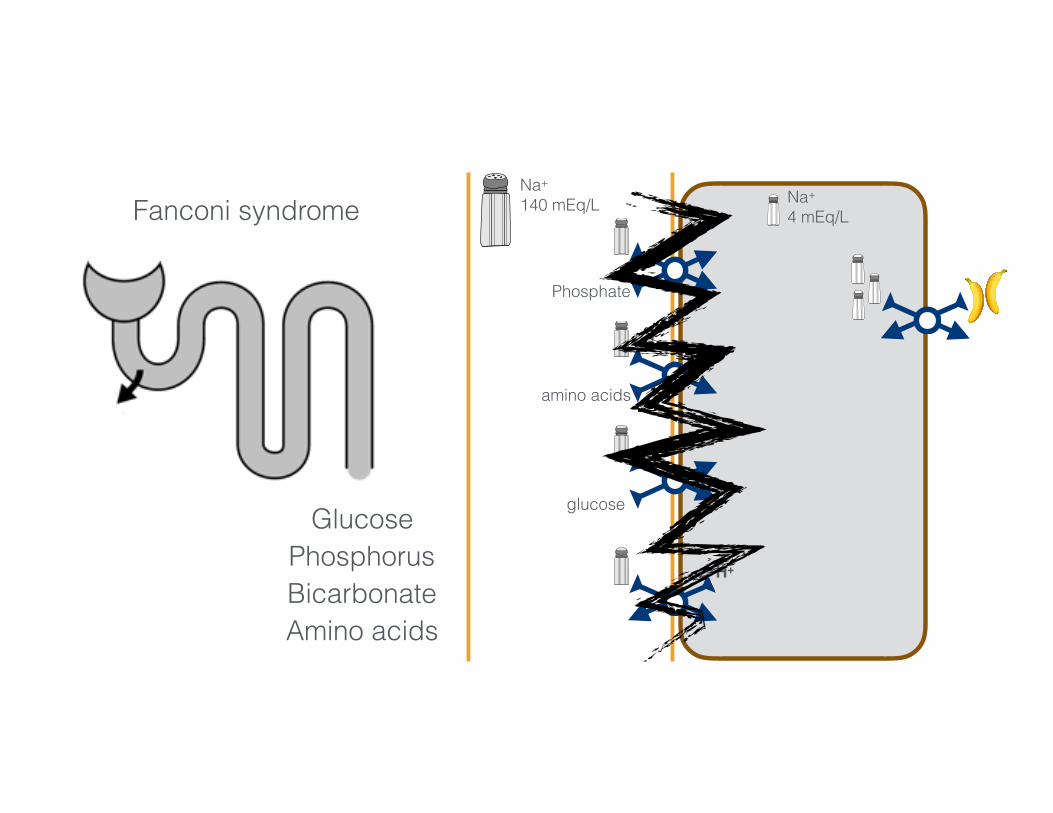
Na+
140 mEq/L Na+
4 mEq/L
Phosphate
amino acids
glucose
H+3456 mmol/day 50-100 mmol/dayGlucose
PhosphorusBicarbonateAmino acids
Fanconi syndrome

Na+
140 mEq/L Na+
4 mEq/L
Phosphate
amino acids
glucose
H+3456 mmol/day 50-100 mmol/day
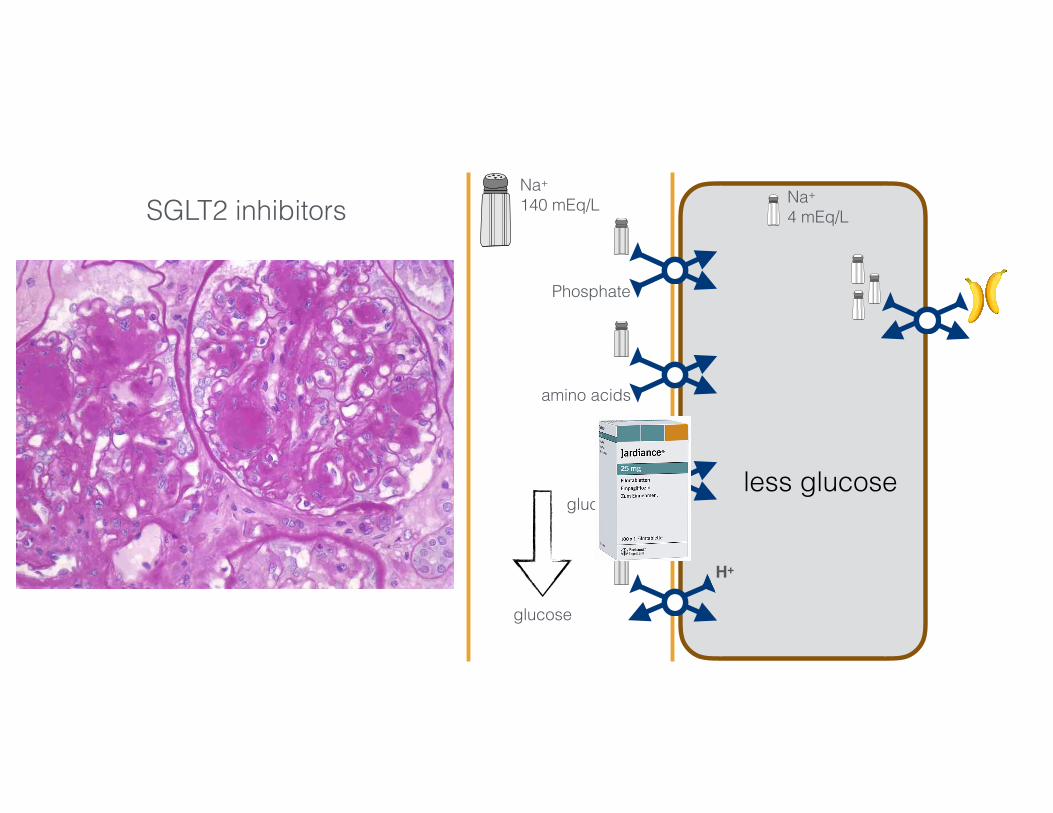
SGLT2 inhibitors
GlucosePhosphorusBicarbonateAmino acids
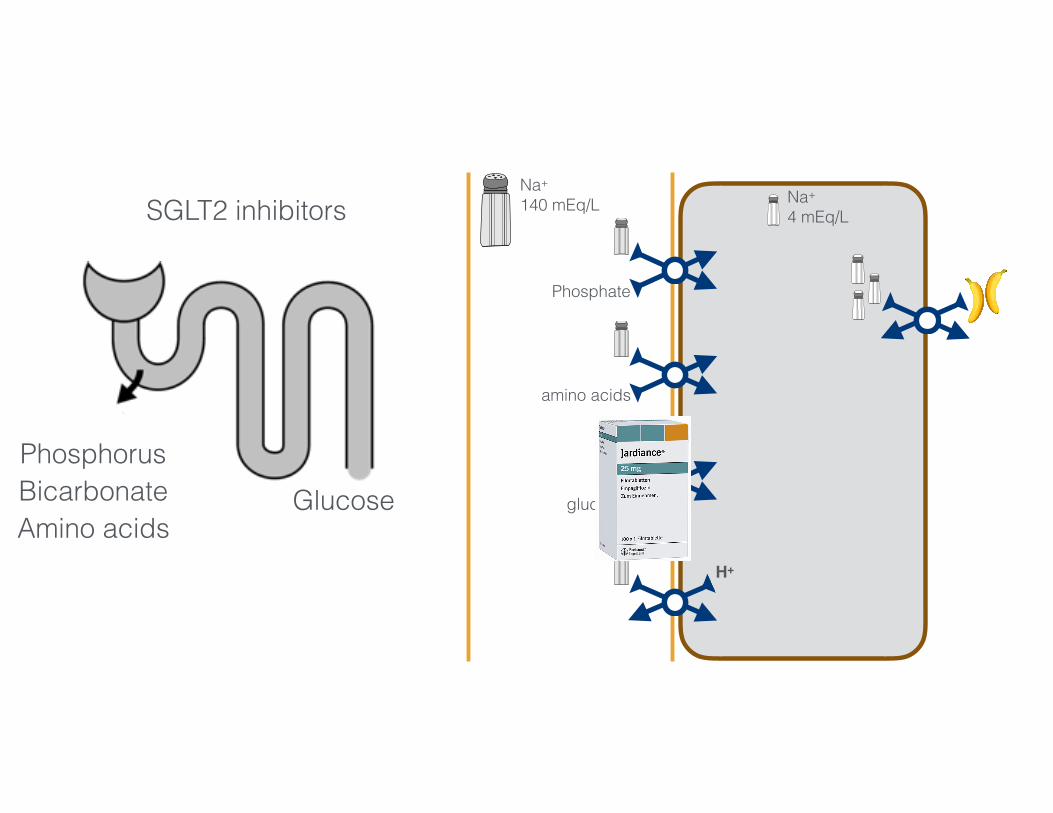
Na+
140 mEq/L Na+
4 mEq/L
Phosphate
amino acids
glucose
H+3456 mmol/day 50-100 mmol/day
SGLT2 inhibitors
GlucosePhosphorusBicarbonateAmino acids

Na+
140 mEq/L Na+
4 mEq/L
Phosphate
amino acids
glucose
H+3456 mmol/day 50-100 mmol/day
SGLT2 inhibitors
GlucosePhosphorusBicarbonateAmino acids
glucose
Na+
140 mEq/L Na+
4 mEq/L
Phosphate
amino acids
glucose
H+3456 mmol/day 50-100 mmol/day
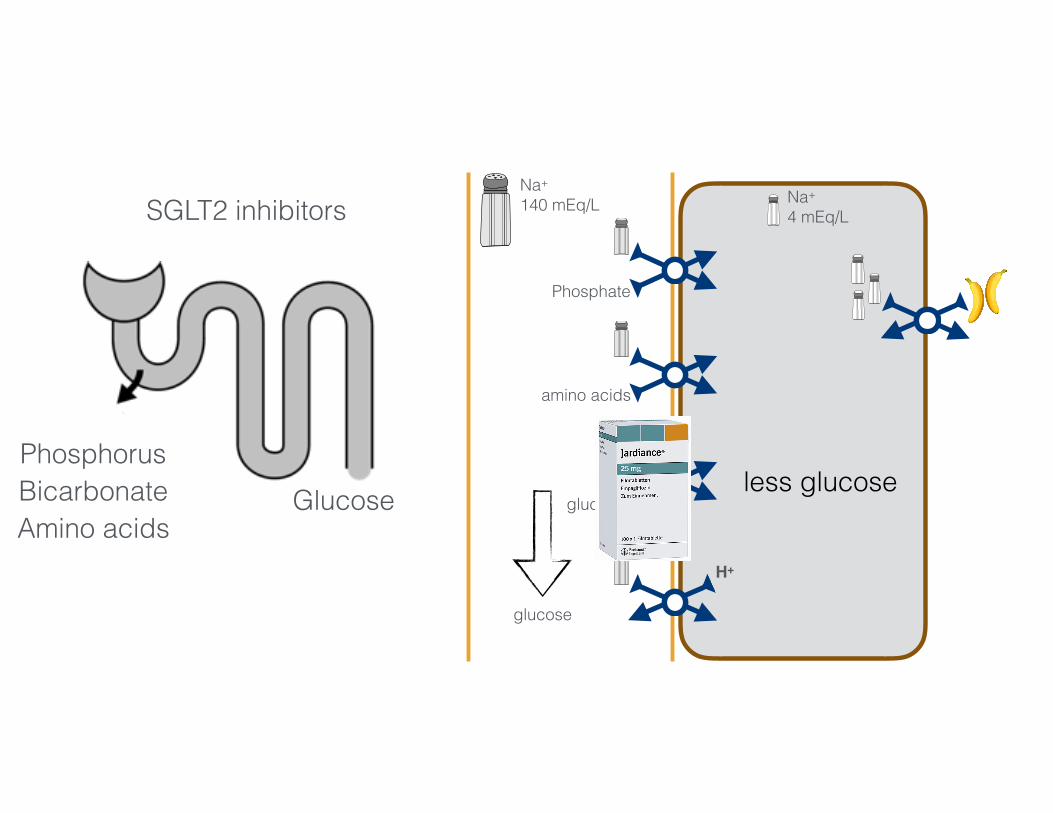
SGLT2 inhibitors
Glucose less glucosePhosphorusBicarbonateAmino acids
glucose
Na+
140 mEq/L Na+
4 mEq/L
Phosphate
amino acids
glucose
H+3456 mmol/day 50-100 mmol/day
SGLT2 inhibitors
Glucose less glucosePhosphorusBicarbonateAmino acids
glucose
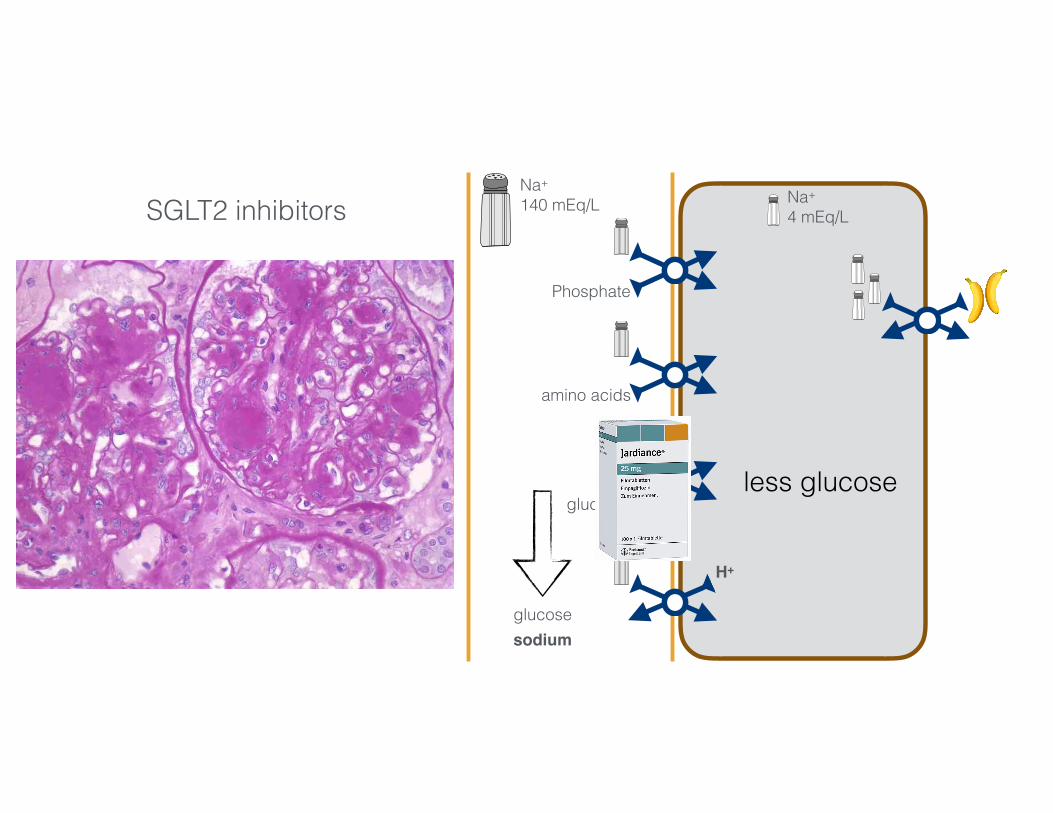
Na+
140 mEq/L Na+
4 mEq/L
Phosphate
amino acids
glucose
H+3456 mmol/day 50-100 mmol/day
SGLT2 inhibitors
Glucose less glucosePhosphorusBicarbonateAmino acids
glucosesodium

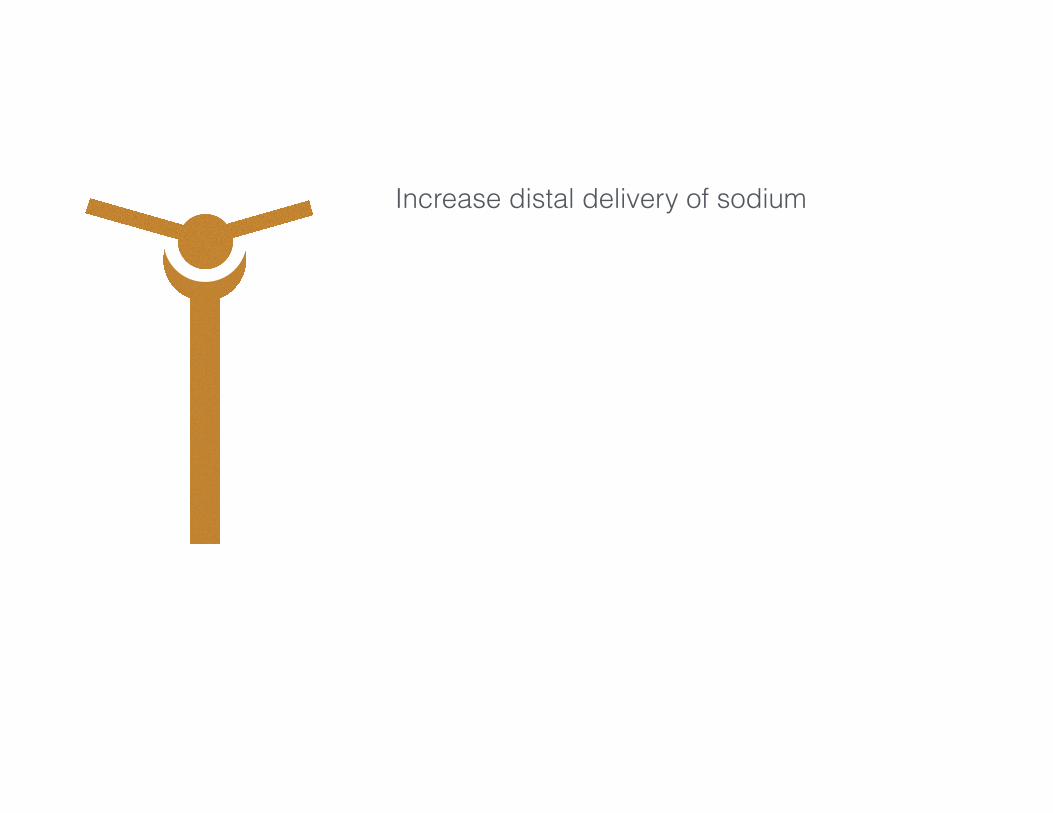
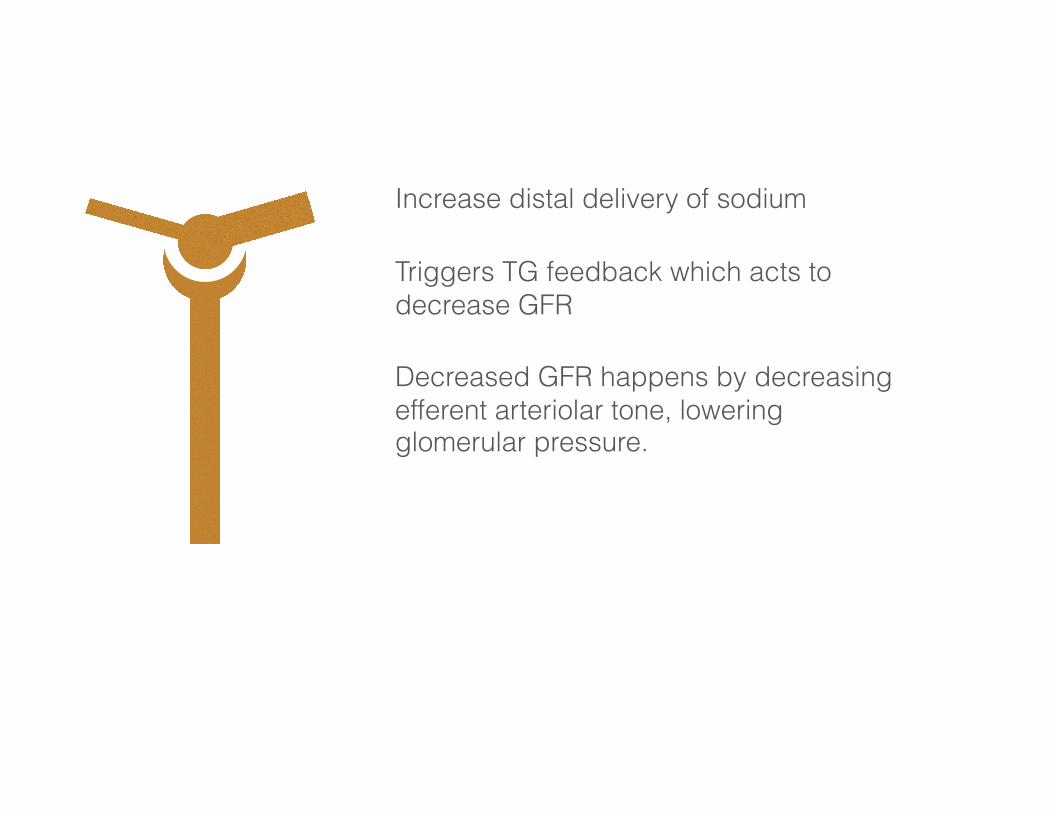
Increase distal delivery of sodium
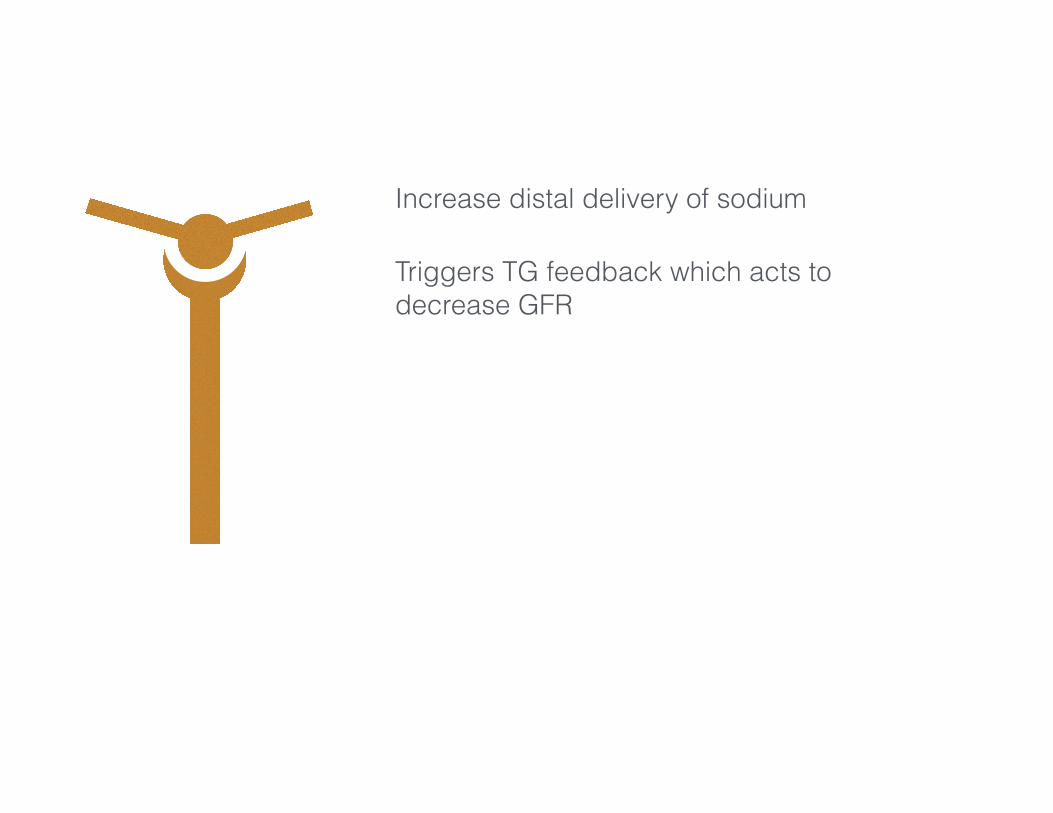
Increase distal delivery of sodium
Triggers TG feedback which acts todecrease GFR
Increase distal delivery of sodium
Triggers TG feedback which acts todecrease GFR
Decreased GFR happens by decreasingefferent arteriolar tone, loweringglomerular pressure.
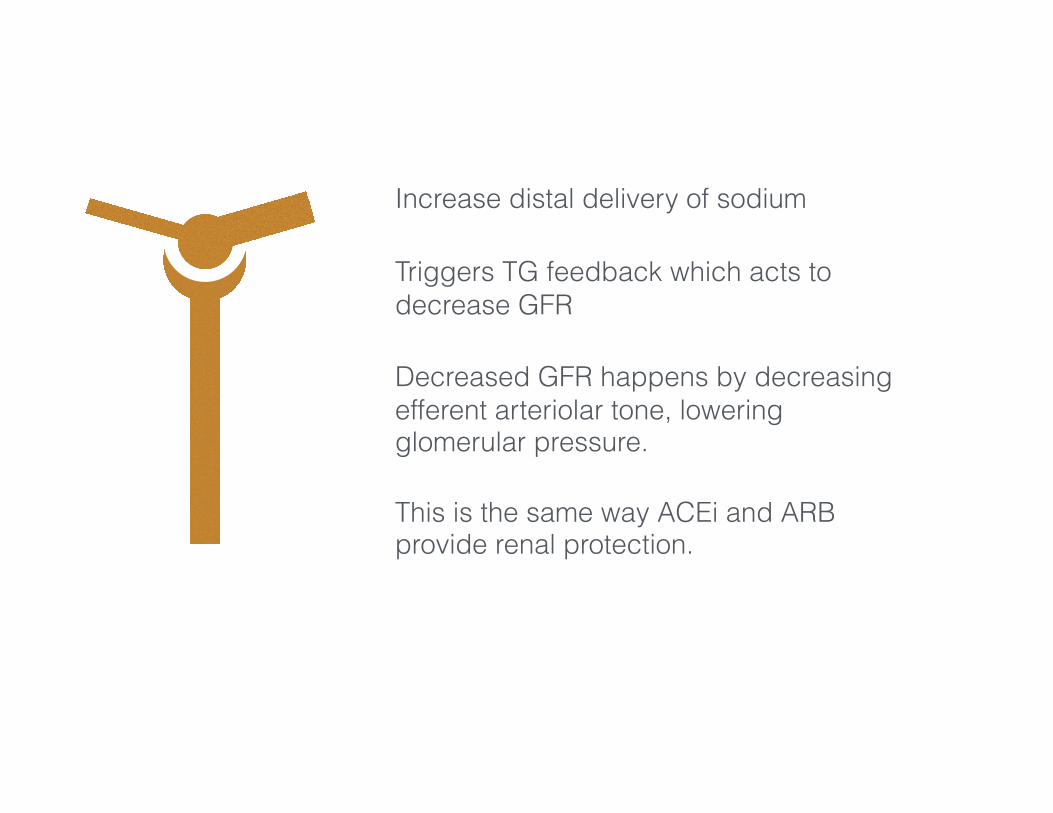
Increase distal delivery of sodium
Triggers TG feedback which acts todecrease GFR
Decreased GFR happens by decreasingefferent arteriolar tone, loweringglomerular pressure.
This is the same way ACEi and ARBprovide renal protection.
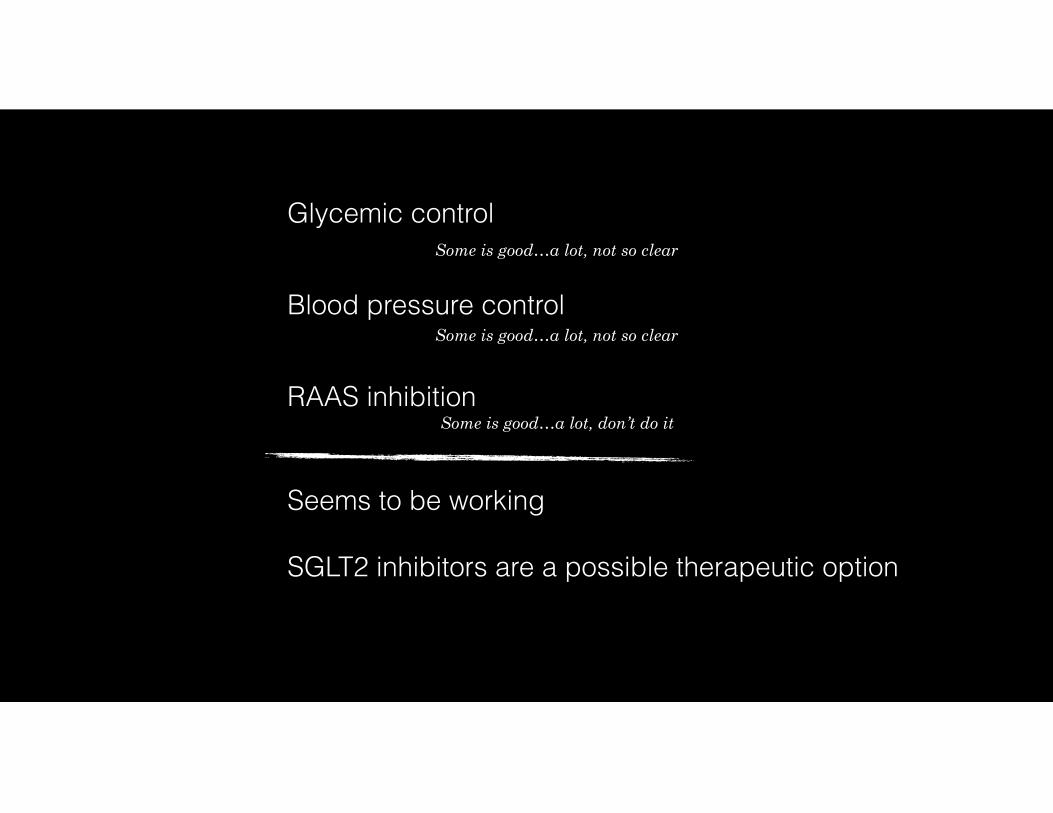
Glycemic control
RAAS inhibition
Blood pressure control
Some is good…a lot, not so clear
Some is good…a lot, not so clear
Some is good…a lot, don’t do it
Seems to be working
SGLT2 inhibitors are a possible therapeutic option


