Developing introductory training in R
Ria Sanderson, Duncan Elliott, ONS
Outline
• Introduction to R• R at ONS• Motivation• Project to develop R training• Pilot courses• Course review• Lessons learned• Project summary• Next steps
Introduction to R
• Open source software package for:- Statistical analysis
- Programming
- Graphics
• Many functions provided by add-on “packages” written by users
• In use by other National Statistical Institutes (NSIs)
R at ONS
• Group of methodologists and IT specialists established in 2011 to explore use of R
• Carried out a series of pilot projects considering the use of R:- for methodology- in other National Statistics Institutes- as a disclosure tool- for processing administrative data- producing standard graphics
R at ONS
• Concluded that R is a useful tool for research purposes
• Used as a research tool for research in: • spatial analysis• small area estimation• time series analysis• sample design & estimation
Motivation
• Previously carried out a series of internal training courses
• Training very informal, evolved rather than developed
• Information from GSS HoPs indicated R is in use for research and statistics• Self-taught or learnt through web resources
Motivation
• Identified an opportunity to develop training:• For those departments interested in using R• For those departments already using R
• In 2013, sought Quality Improvement Fund (QIF) funding to develop training in R for the GSS
Project Objectives
• The project had two main objectives:• to provide the GSS with basic skills in R, building
a platform from which GSS departments could individually assess whether R meets their statistical needs
• to address the current gap in the provision of training in R that is tailored to GSS requirements
• Focus of the training was on using R for analysis and graphics
Project Objectives
• Expected benefits included: • wider use of open source software• greater collaboration across GSS• use of new methods & analysis tools
The Project
• The project sought to develop two training courses:
• Introduction to R• for those who have little or no experience in using R who
want to learn how to use R for statistical analysis
• Introduction to graphics using R• for those who have a basic knowledge of R and who want to
learn how to produce graphs in R
Project Outcomes
• The desired project outcomes were:• To develop the course material • To pilot each course by offering them to the GSS• To review the course material based on participant
feedback
• The project was carried out during the financial year 2013/14
• Pilot courses were held at ONS, Newport
Pilot courses
• Expressions of interest were gathered via GSS HoPs and GSS website
• Asked for additional information on:• Programming experience• Experience of using statistical software• Types of data and analysis routinely used
• 34 expressions of interest received• Covered 14 departments, executive agencies and
devolved administrations
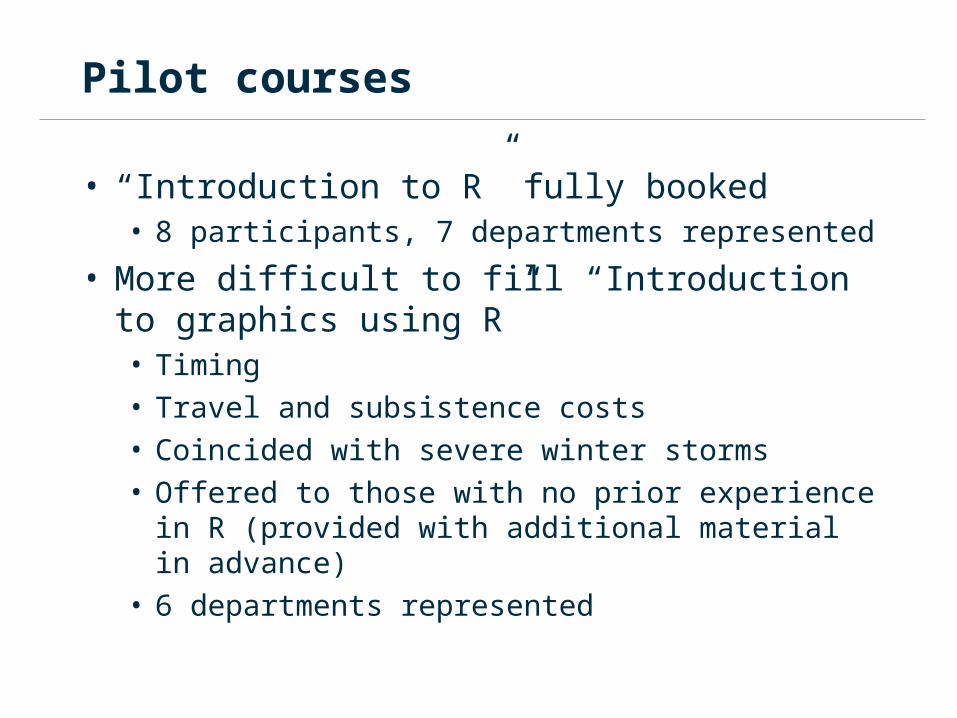
Pilot courses
• “Introduction to R” fully booked • 8 participants, 7 departments represented
• More difficult to fill “Introduction to graphics using R”• Timing• Travel and subsistence costs• Coincided with severe winter storms• Offered to those with no prior experience in R
(provided with additional material in advance)• 6 departments represented
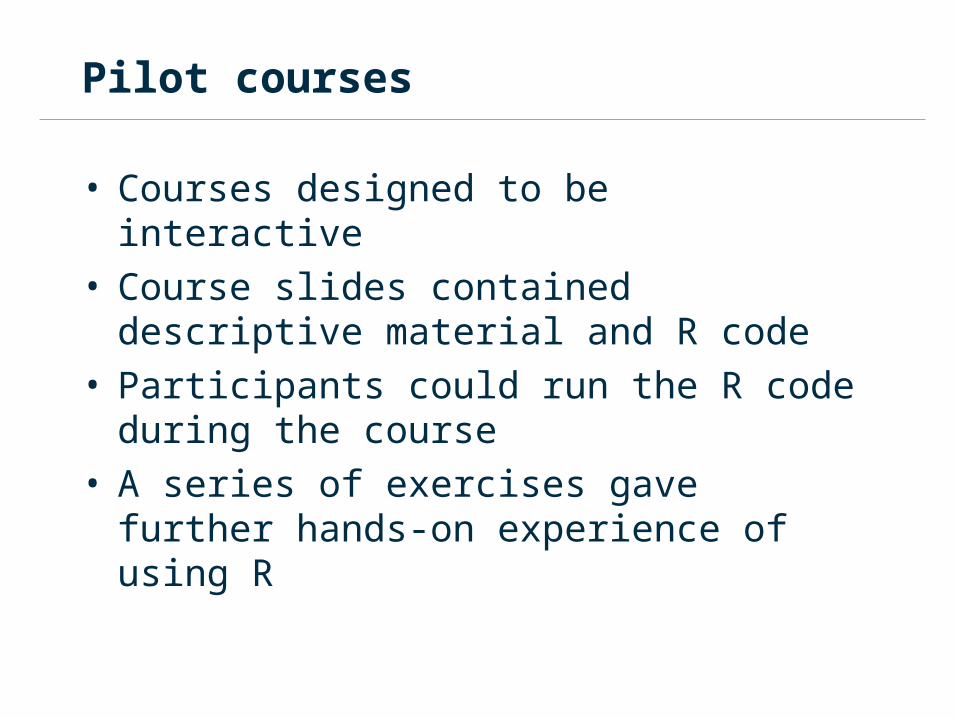
Pilot courses
• Courses designed to be interactive• Course slides contained descriptive material
and R code• Participants could run the R code during the
course• A series of exercises gave further hands-on
experience of using R
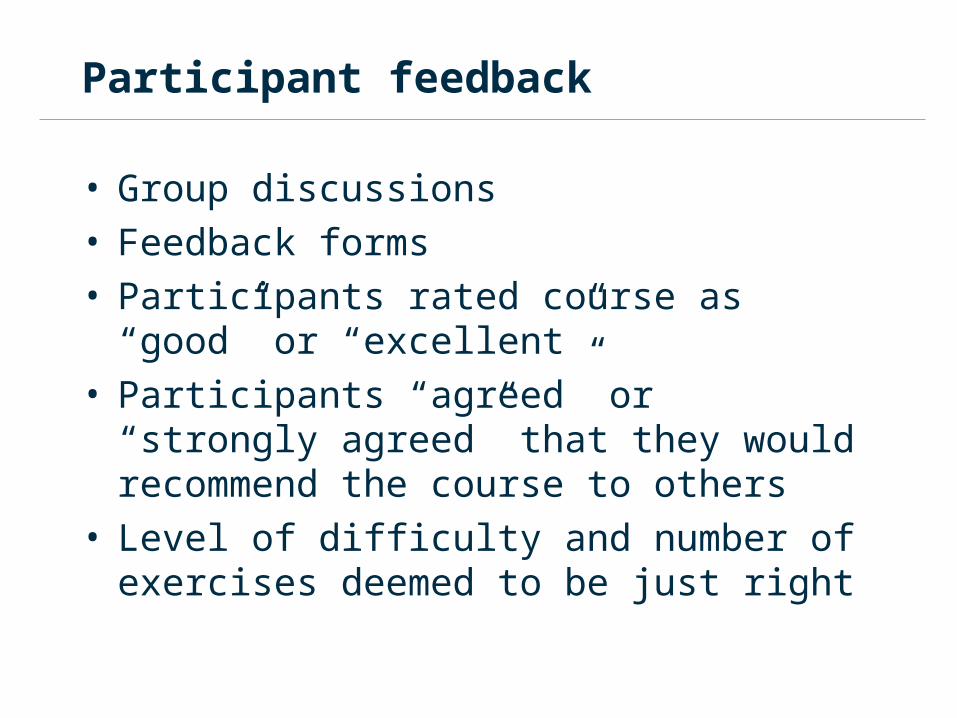
Participant feedback
• Group discussions• Feedback forms• Participants rated course as “good” or
“excellent”• Participants “agreed” or “strongly agreed” that
they would recommend the course to others• Level of difficulty and number of exercises
deemed to be just right
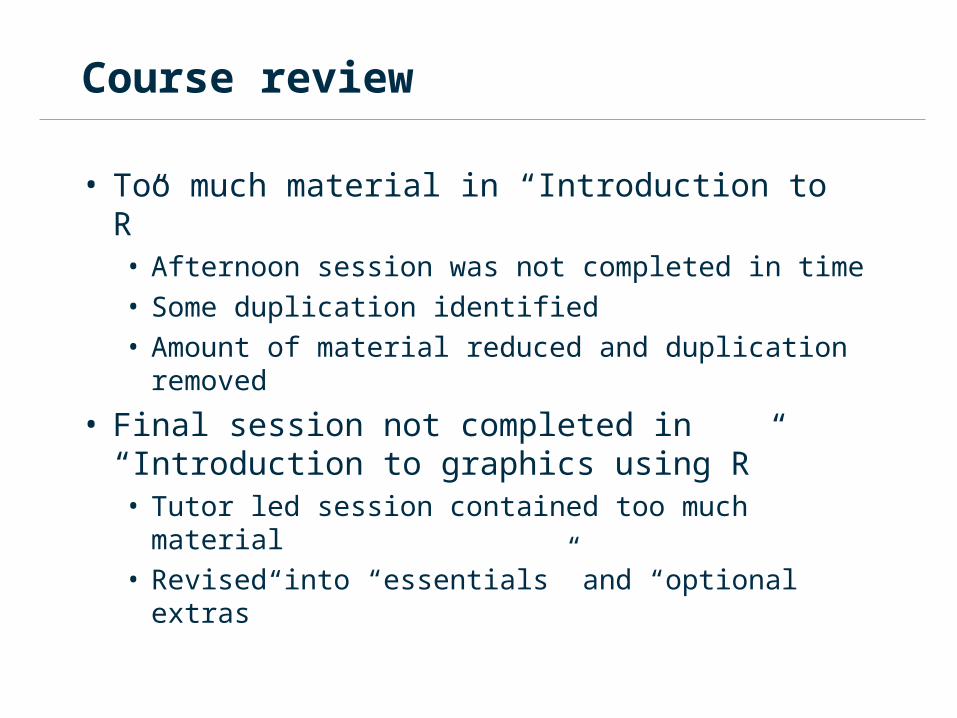
Course review
• Too much material in “Introduction to R”• Afternoon session was not completed in time• Some duplication identified• Amount of material reduced and duplication
removed
• Final session not completed in “Introduction to graphics using R”• Tutor led session contained too much material• Revised into “essentials” and “optional extras”
Lessons learned
• Courses held in Newport due to availability of computer training facilities with R installed• Requirement to fund travel deterred some• Start times affected by travel disruption
• In future, will re-consider location and start time based on participants
• “Introduction to graphics” required some previous knowledge of R
• In future, offer courses on consecutive days
Project summary
• Project ran to time and on budget• Level of expressions of interest very
encouraging• Two courses successfully developed and
piloted• Courses will be offered to GSS• Unexpected benefits – sharing experiences of
installing and managing the use of R
Next steps
• Courses will be offered through Statistical Training Unit
• Courses will run again in 2014 on consecutive days
• Courses will be offered regularly from 2015
Quality Improvement Fund 14/15
• Round 2 is now open for bids• Closing date is midnight on 18th July• Any funds allocated must be spent in this
financial year• For more detail and for bid templates, see the
GSS website
Contacts
• For more information on R training:
• For more information on the use of R at ONS:
• For more information on R:
www.r-project.org


