Download - Dallas homelessness report

2012 Point-In-Time Homeless Count and Census
Dallas County
Sponsored by:
MDHA 2012 Annual "Point-in-Time" Homeless Count & Census - Page 2
Table Of Contents
Point-In-Time Homeless Count & Census Report Introduction
o Executive Summary (pg. 4)
o Introduction to and Methodology of the Report (pg. 5)
o 2012 Data Highlights (pg. 6)
o Brief Analysis (pg. 7)
Point-In-Time Count – Data Referring to Whole Homeless Population
o Total Homeless Population (pg. 8)
o Chronic Homeless Population
Ending Chronic Homelessness in Dallas by 2015 (pg. 9)
o Homeless Families (pg. 10)
o Unsheltered vs. Sheltered Veteran Populations (pg. 10)
o Subpopulation Data (pg. 11)
The Point-in-Time Homeless Count and Census Report – Survey Data
o Total Homeless Population/General Information
Total Surveyed Homeless Population (pg. 12)
Survey/Sample Size Information (pg. 12)
General Adult Population Information (pg. 12)
Gendered Data
Racial Data
o Adult Racial/Age Demographics
Racial Demographics (pg. 13)
Age Demographics (pg. 14)
Age Demographics of Homeless Population by Year (pg. 14)
Marital Status Data (pg. 14)
o Statistics Regarding Homeless Veterans
Percentage of Veterans in Homeless Population by Year (pg. 15)
Veteran Demographics vs. Overall Homeless Demographics (pg. 15)

MDHA 2012 Annual "Point-in-Time" Homeless Count & Census - Page 3
o Children/Youth
General Information (pg. 16)
Racial Demographics (pgs. 17-18)
By Year (pg. 17)
Compared with Adult Demographics (pg. 18)
Age Demographics (pgs. 18-19)
Total Youth of Known Ages (pg. 18)
By Year (pg. 19)
Information from D.I.S.D. (pgs. 20-21)
o Causes of Homelessness for those Surveyed (pg. 22)
o Frequency/Duration of Homelessness for those Surveyed (pg. 23-24)
o Survey Data
Number of Individuals Surveyed by City (pg. 25)
Number of Individuals Surveyed by Police District (pg. 25)
o Last Reported Sleep Location
Last Sleep Location Data by Year (pg. 26)
o Chronic Homelessness
Demographic Comparison with Total Homeless Population (pg. 27)
o Locations of Homelessness by Housing Type
Location by Housing Type Comparison (pg. 28)
Comparison of those in Emergency Shelter by Year (pg. 28)
Comparison of those in Transitional Housing by Year (pg. 29)
o Population Characteristics (pg. 30)
o Benefits/Services
Needed (pg. 31)
Received / Expired (pg. 32)
o Glossary (pgs. 33-34)
o Acknowledgements (pgs. 34-38)
o MDHA Contact Info (pg. 39)

MDHA 2012 Annual "Point-in-Time" Homeless Count & Census - Page 4
MDHA 2012 Point-in-Time Homeless Count and Census Report Dallas County
Executive Summary
The Metro Dallas Homeless Alliance (MDHA) and Solutions to Homelessness
MDHA is the Dallas area’s public-private alliance and membership organization with the mission to prevent and end homelessness. The Alliance engages nonprofit and public service organizations, policy makers, people experiencing homelessness and the general public to make continuous progress toward its mission. Our efforts to develop housing and services have helped thousands of formerly homeless children and families and individuals recover from homelessness over the last decade.
The Alliance has been central to the development of more than 2,000 units of permanent supportive housing for homeless children and families and single adults with disabling conditions and more than 1,800 units of transitional supportive housing in the Dallas area. MDHA provided implementation planning and private sector fundraising for The Bridge, Dallas’ homeless assistance center. MDHA opened The Bridge in May 2008 and operated the center until it became a separate entity in October 2011.
MDHA is the lead nonprofit agency designated by the U.S. Department of Housing and Urban Development (HUD) to coordinate and plan local homeless services. The Alliance provides stewardship and management of approximately $15 million in federal funds annually through the HUD-MDHA Continuum of Care for Dallas and Collin counties. The annual Point-In-Time Homeless Count is one of our responsibilities. The data-based, objective role that MDHA plays in this initiative is largely funded by local philanthropy and not taxpayer dollars.
The Alliance is committed to using data to drive continuous improvement of the Dallas area’s efforts to overtake and end homelessness. The Point-In-Time Homeless Count & Census is a building block for effectively leveraging federal funds, local government resources and philanthropy.

MDHA 2012 Annual "Point-in-Time" Homeless Count & Census - Page 5
Introduction and Methodology
The annual Point-In-Time Count and Census is a community initiative to gather and analyze data on homelessness in Dallas County. The information is used by healthcare providers, nonprofit organizations, faith-based groups and local, state and federal governmental agencies.
Each year, the Alliance works with local service providers to get a head count at each shelter, transitional housing site and permanent supporting housing development. Dozens of volunteers also visit outdoor encampments where homeless people live. The volunteers gather additional information from homeless people who agree to be surveyed. The information provides a snapshot of homelessness in our community on a given night. However, it does not represent everyone experiencing homelessness because many cannot be located.
MDHA appreciates the valuable support of the City of Dallas in conducting the Count. The City’s Department of Housing and Community Services, the Dallas Police Department including the outreach and Crisis Intervention Team make the Annual Count possible. Heartfelt thanks to the 255 volunteers who served in a variety of roles on the night of the Count, to the staff members of the 46 participating agencies, and to the 56 data entry volunteers who finished entering more than 3,200 surveys in record time this year.
Special thanks this year to The Real Estate Council Foundation, TREC, for its volunteer and financial support of the count.
MDHA 2012 Annual "Point-in-Time" Homeless Count & Census - Page 6
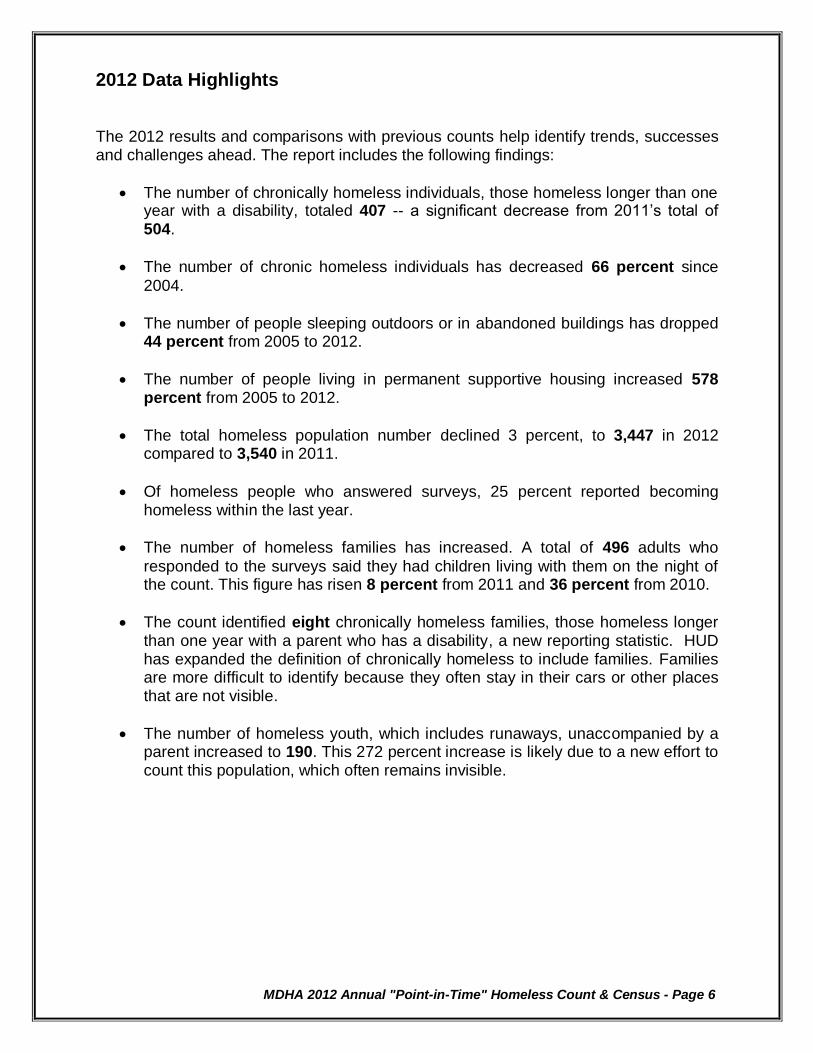
2012 Data Highlights The 2012 results and comparisons with previous counts help identify trends, successes and challenges ahead. The report includes the following findings:
The number of chronically homeless individuals, those homeless longer than one year with a disability, totaled 407 -- a significant decrease from 2011’s total of 504.
The number of chronic homeless individuals has decreased 66 percent since
2004.
The number of people sleeping outdoors or in abandoned buildings has dropped 44 percent from 2005 to 2012.
The number of people living in permanent supportive housing increased 578 percent from 2005 to 2012.
The total homeless population number declined 3 percent, to 3,447 in 2012 compared to 3,540 in 2011.
Of homeless people who answered surveys, 25 percent reported becoming homeless within the last year.
The number of homeless families has increased. A total of 496 adults who
responded to the surveys said they had children living with them on the night of the count. This figure has risen 8 percent from 2011 and 36 percent from 2010.
The count identified eight chronically homeless families, those homeless longer than one year with a parent who has a disability, a new reporting statistic. HUD has expanded the definition of chronically homeless to include families. Families are more difficult to identify because they often stay in their cars or other places that are not visible.
The number of homeless youth, which includes runaways, unaccompanied by a parent increased to 190. This 272 percent increase is likely due to a new effort to count this population, which often remains invisible.

MDHA 2012 Annual "Point-in-Time" Homeless Count & Census - Page 7
Brief Analysis
The community has made substantial progress in reducing the number of chronically homeless individuals through coordinated services and permanent supportive housing. These efforts should remain strong while more attention is focused on families with children and veterans.
The Dallas community has made substantial progress in moving chronically
homeless single adults into permanent supportive housing. Permanent supportive
housing (PSH) includes a mental health professional to help residents succeed in
housing. Success in housing means fewer homeless individuals on the streets and
in emergency shelters, reduced jail and criminal justice costs and reduced
psychiatric and other hospitalizations.
The decrease in chronic homelessness since 2004 can be attributed to the
increased number of permanent supportive housing units for chronically homeless
individuals. Chronically homeless individuals have long histories of homelessness
and disabilities.
The Dallas area developed 298 additional units of permanent supportive housing
during 2011 that helped reduce chronic homelessness. These homes were funded
primarily through the Continuum of Care, a partnership of local homeless services
providers that receive U.S. Department of Housing and Urban Development
funding, in collaboration with the Dallas Housing Authority and NorthStar, the local
behavioral healthcare system.
The Bridge, Dallas’ multi-service campus for people experiencing homelessness, helped 238 people transition to housing.
MDHA has a plan to add 1,800 units of permanent supportive housing for
individuals and families by 2015. Permanent supportive housing provides services,
such as a mental health professional to help residents, remain successful in
housing. MDHA is working with its Homeless Policy Alliance of elected officials to
gain support for the plan from local governmental entities.
Permanent supportive housing programs are needed for families experiencing
homelessness that include a parent diagnosed with a disability.
The most difficult to count and an almost invisible homeless population are the
families with children and youth 17 years of age and younger living on their own.
Our efforts to track the unmet needs of families who are homeless and to articulate
clearer solutions need to be redoubled.
The need for more short-term transitional housing is apparent for youth and young
adults who do not qualify for permanent supportive housing. Many of them have the
capacity to become gainfully employed and fully self-sufficient, once short-term
problems are addressed and resolved.

MDHA 2012 Annual "Point-in-Time" Homeless Count & Census - Page 8
MDHA 2012 Point-in-Time Homeless Count for Dallas County
Part I
Total Homeless Population
Each year the Metro Dallas Homeless Alliance conducts a Point-In-Time (PIT) Homeless Count under the direction of the US Department of Housing and Urban Development (HUD). It is an exhaustive community endeavor which draws on the resources of local volunteers, assets of local government agencies and contributions of private associations.
MDHA has historically utilized the opportunity of this effort to expand the scope and detail of information drawn out of the survey. The survey instrument used in Dallas is designed to comply with HUD’s limited data requirement, and at the same time garner other useful information for our local planning and delivery system. One byproduct of this dual utility is a complex assortment of data.
MDHA counted a total of 3,447 homeless individuals in Dallas County on Jan. 26, 2012. In addition, MDHA counted 2,171 formerly homeless people living in permanent supportive housing. MDHA’s full count, including individuals settled in permanent supportive housing, now totals 5,618. HUD’s reporting requirement is succinct and limited in scope, with a primary focus on people who have not attained housing stability. HUD does not include those who are in Permanent Supportive Housing as homeless. People who are counted as homeless under HUD’s definition are those who are:
on the street
in abandoned buildings
in emergency shelter
in transitional housing
0
500
1000
1500
2000
2500
3000
3500
4000
2009 2010 2011 2012
2032 1827 1567
1840
1493 1639
1692 1377
176 201 243 205
Unsheltered
Safe Haven
Transitional
Emergency
3,701 3,710 3,450 3,447 Total Homeless

MDHA 2012 Annual "Point-in-Time" Homeless Count & Census - Page 9
Chronic Homeless Population
In 2012, there were 415 chronically homeless individuals (407 single adults and 8 in families) in Dallas County. The total number of persons experiencing chronic homelessness has decreased nineteen percent (19%) since the last count in 2011.
Compared to those counted in 2004, the number of chronically homeless individuals has decreased 66%. The blue line in the chart below illustrates the progress we have
made in Dallas under our goal of eliminating chronic homelessness. The red line illustrates the challenge we must meet in doing so.
528
396 352
263
73 118
152 144
601
514 504
407
0
100
200
300
400
500
600
700
2009 2010 2011 2012
Sheltered Unsheltered Total Chronically Homeless
2004 2005 2006 2007 2008 2009 2010 2011 2012 2013 2014 2015
Chronic Homeless 1,181 997 733 568 611 601 514 504 407
MDHA's Goal 1181 1074 967 860 753 646 539 432 325 218 109 0
0
200
400
600
800
1,000
1,200
1,400
Tota
l nu
mb
er
Ending Chronic Homelessness in Dallas
MDHA 2012 Annual "Point-in-Time" Homeless Count & Census - Page 10
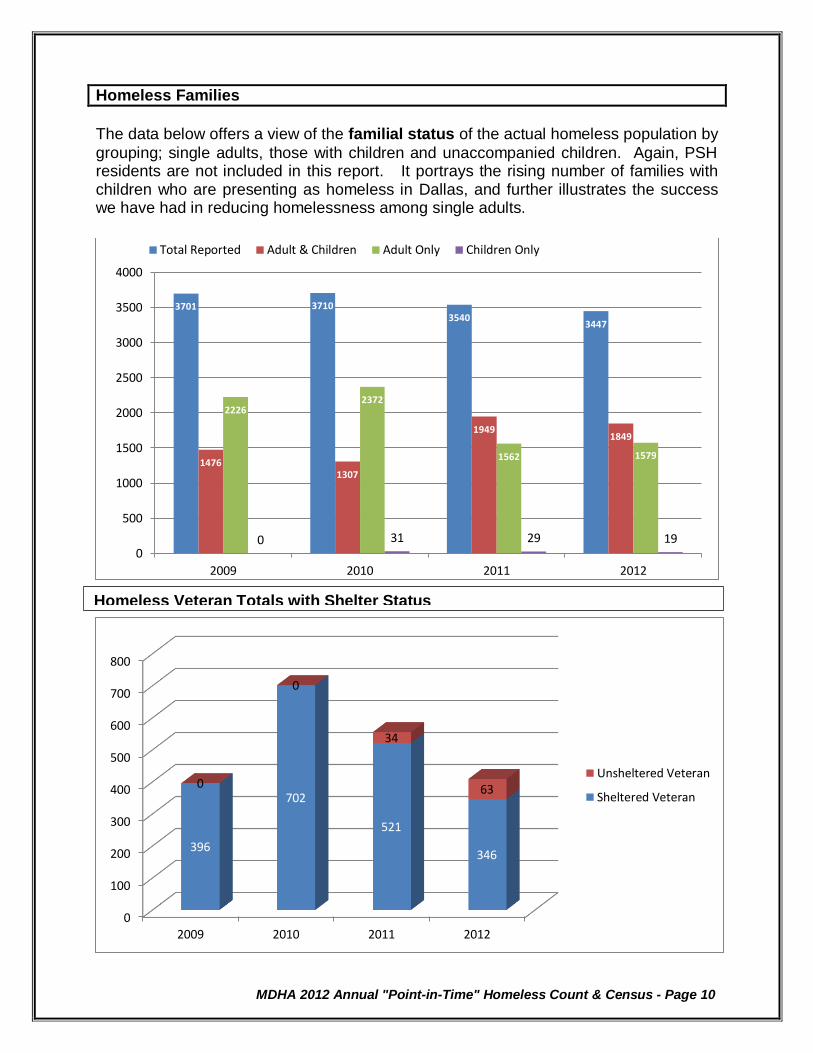
Homeless Families
The data below offers a view of the familial status of the actual homeless population by
grouping; single adults, those with children and unaccompanied children. Again, PSH residents are not included in this report. It portrays the rising number of families with children who are presenting as homeless in Dallas, and further illustrates the success we have had in reducing homelessness among single adults.
3701 3710 3540
3447
1476 1307
1949 1849
2226 2372
1562 1579
0 31 29 19 0
500
1000
1500
2000
2500
3000
3500
4000
2009 2010 2011 2012
Total Reported Adult & Children Adult Only Children Only
0
100
200
300
400
500
600
700
800
2009 2010 2011 2012
396
702
521
346
0
0
34
63 Unsheltered Veteran
Sheltered Veteran
Homeless Veteran Totals with Shelter Status

MDHA 2012 Annual "Point-in-Time" Homeless Count & Census - Page 11
The chart above illustrates the prevalence of circumstances that lead to homelessness. One notable trend has been the rise in numbers of persons presenting with behavioral health conditions (mental illness and chronic substance abuse) HUD’s interest is in the total incidence of these factors. Consequently, people presenting with more than one factor are counted multiple times.
0
200
400
600
800
1000
1200
1400
1600
2009 2010 2011 2012
Severely Mentally Ill
Chr Substance
Person w/I HIV/AIDS
Domestic Violence
Unaccompanied Child
Sub-Population Data within the Total Homeless Population in Dallas

MDHA 2012 Annual "Point-in-Time" Homeless Count & Census - Page 12
MDHA 2012 Point-in-Time Homeless Count and Census Report – Dallas County
Part II
The second part of the Point-in-Time count includes information from 2,958 surveys of
people experiencing homelessness conducted by MDHA volunteers during the Jan. 26, 2012 count. The surveys represent 4,068 individuals because some of the surveys
included families with children. The surveys were answered on a voluntary basis and are not intended to provide a statistically valid sample. However, they represent a majority of the homeless population counted on Jan. 26 and provide useful information to identify demographic information, trends and progress related to homelessness in Dallas County. All of the information in Part II is based on people experiencing homelessness that took the survey and does not represent the county’s homeless population as a whole.
Survey / Sample Size
In 2012, 2,958 surveys were completed, representing a 5.4% decrease when compared with the number of surveys completed last year. In 2012, 4,068 total people were represented on surveys, representing less than 1% increase when compared with the number of people represented last year.
Adult Population
3,050 Adults were represented on the surveys.
Adults made up 78% of the total homeless population.
7% reported having formerly been in foster care.
2012 - Total Adults of Known Gender
Number / % Adult Males Adult Females Total Known Gender
Number 1,562 1,089 2,651
% of Known Gender 59% 41% 100%
2012 - Total Adults of Known Race
Number / %
African American
American Indian
Caucasian (White)
Hispanic (Latino)
Other
Total Known Race
Number 1,560 21 796 184 64 2,625
% of Known Race
59% 1% 30% 7% 3% 100%

MDHA 2012 Annual "Point-in-Time" Homeless Count & Census - Page 13
The 2012 survey results demonstrate that African-Americans continue to represent the largest percentage of the total adult homeless population. .
African-American Caucasian Hispanic Other
2005 55% 31% 10% 4%
2006 52% 36% 8% 4%
2007 58% 30% 8% 4%
2008 57% 31% 9% 3%
2009 59% 30% 7% 3%
2010 57% 31% 8% 4%
2011 56% 31% 8% 5%
2012 59% 30% 7% 4%
0%
10%
20%
30%
40%
50%
60%
Homeless Adult Racial Demographics
MDHA 2012 Annual "Point-in-Time" Homeless Count & Census - Page 14
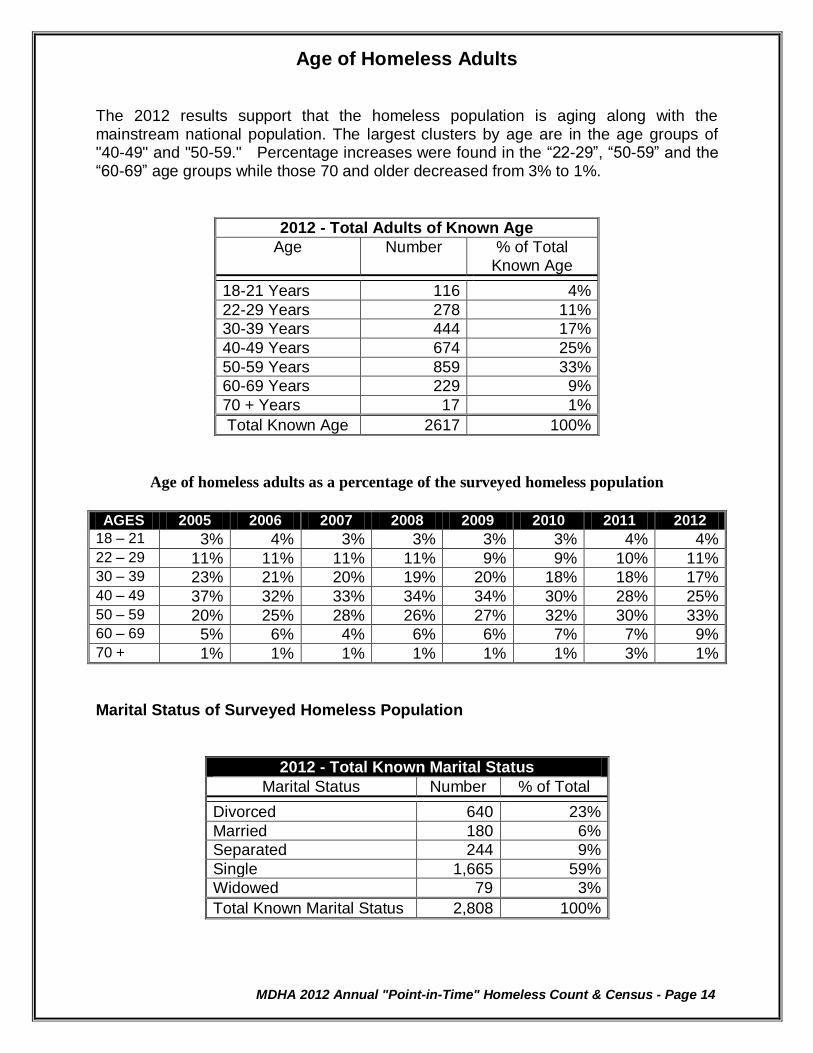
Age of Homeless Adults
The 2012 results support that the homeless population is aging along with the mainstream national population. The largest clusters by age are in the age groups of "40-49" and "50-59." Percentage increases were found in the “22-29”, “50-59” and the “60-69” age groups while those 70 and older decreased from 3% to 1%.
Age of homeless adults as a percentage of the surveyed homeless population
AGES 2005 2006 2007 2008 2009 2010 2011 2012
18 – 21 3% 4% 3% 3% 3% 3% 4% 4% 22 – 29 11% 11% 11% 11% 9% 9% 10% 11% 30 – 39 23% 21% 20% 19% 20% 18% 18% 17% 40 – 49 37% 32% 33% 34% 34% 30% 28% 25% 50 – 59 20% 25% 28% 26% 27% 32% 30% 33% 60 – 69 5% 6% 4% 6% 6% 7% 7% 9% 70 + 1% 1% 1% 1% 1% 1% 3% 1%
Marital Status of Surveyed Homeless Population
2012 - Total Known Marital Status
Marital Status Number % of Total
Divorced 640 23%
Married 180 6%
Separated 244 9%
Single 1,665 59%
Widowed 79 3%
Total Known Marital Status 2,808 100%
2012 - Total Adults of Known Age
Age Number % of Total Known Age
18-21 Years 116 4%
22-29 Years 278 11%
30-39 Years 444 17%
40-49 Years 674 25%
50-59 Years 859 33%
60-69 Years 229 9%
70 + Years 17 1%
Total Known Age 2617 100%

MDHA 2012 Annual "Point-in-Time" Homeless Count & Census - Page 15
Veterans
The percentage of adults surveyed who reported U.S. Veteran status decreased this year from 17% to 15%.
In 2012, 554 survey respondents reported being veterans. Of those, 55% were determined to be chronically homeless individuals. As the community becomes more aware of the needs of veterans, it is important to understand the Veterans population in comparison to the total homeless adult population.
Comparison of Veteran Demographics to the Overall Homeless Population
Veterans
Veteran Sub-Population as a % of the Total Homeless
Adult Population
Year 2011 2012
% of Total: 17% 15%
Male: 23% 16%
Female: 3% 3%
African American: 10% 9%
Caucasian: 7% 6%
Hispanic: 3% 1%
Other Race / Ethnicity:
6% <1%
Substance Abuse: 18% 23%
Mental Illness: 12% 22%
Physical Disability: 12% 22%
2005 2006 2007 2008 2009 2010 2011 2012
Veterans 12% 11% 14% 14% 15% 20% 17% 15%
0%
5%
10%
15%
20%
25%
Per
cen
tage
of
Ad
ult
s
Veterans

MDHA 2012 Annual "Point-in-Time" Homeless Count & Census - Page 16
Child / Youth Population
496 respondents indicated that they had children living with them on the night of
the count which was an increase of 8% from 2011 and a 36% increase since 2010.
190 Unaccompanied Children were discovered representing a 272% increase from 2011.
16 of the Unaccompanied Children were represented on surveys. 135 of the Unaccompanied Children were identified by the Dallas ISD. 39 of the Unaccompanied Children were identified by the Mesquite ISD
which represented a 200% increase in the Mesquite ISD from 2011.
In 2012, children and youth made up 22% of the total homeless population, up 2% from 2011.
2012 - Total Children / Youth of Known Gender
Number / % Minor Males Minor Females Total Known Gender
Number 493 519 1,012
% of Known Gender 49% 51% 100%
2012 - Total Children / Youth of Known Race
Number / %
African American
Caucasian (White)
Hispanic (Latino)
American Indian
Other
Total Known Race
Number 665 113 162 6 52 998
% of Known Race
66% 12% 16% <1% 6% 100%

MDHA 2012 Annual "Point-in-Time" Homeless Count & Census - Page 17
African-Am. Caucasian Hispanic Other
2005 56% 16% 23% 5%
2006 53% 22% 17% 8%
2007 63% 14% 17% 6%
2008 58% 14% 22% 6%
2009 57% 14% 20% 9%
2010 62% 11% 17% 10%
2011 61% 21% 13% 5%
2012 66% 12% 16% 6%
0%
10%
20%
30%
40%
50%
60%
Homeless Children & Youth Racial Demographics

MDHA 2012 Annual "Point-in-Time" Homeless Count & Census - Page 18
The following table illustrates that, for the seventh year, there appears to be an over-representation of homeless Hispanic children and youth as compared to the adult homeless Hispanic population.
The largest representation of children was in the age group of 1 – 3 years (23%), with the second largest age group being 4 – 6 (22%). The Census shows that 51% of children experiencing homelessness are six or younger.
2012 - Total Children / Youth of Known Ages
Age Number % of Total Known Age
< 1 Year 56 6%
1-3 Years 228 23%
4-6 Years 224 22%
7-9 Years 163 16%
10-12 Years 152 15%
13-15 Years 129 13%
16-17 Years 49 5%
Total Known Age: 1,001 100%
African - Am. Hispanic Caucasian Other
Adults 59% 7% 30% 3%
Children 66% 16% 12% 6%
0%
10%
20%
30%
40%
50%
60%
2012 Comparison of Racial Demographics between Adults and Children / Youth
MDHA 2012 Annual "Point-in-Time" Homeless Count & Census - Page 19
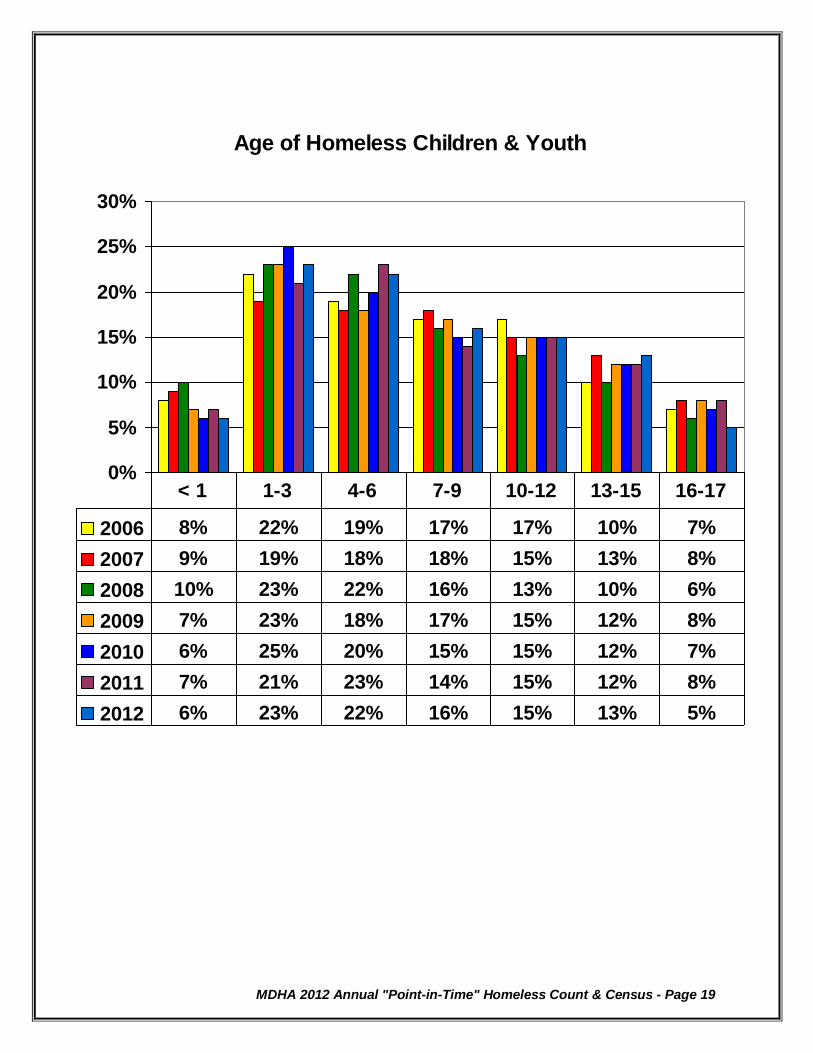
Age of Homeless Children & Youth
0%
5%
10%
15%
20%
25%
30%
2006 8% 22% 19% 17% 17% 10% 7%
2007 9% 19% 18% 18% 15% 13% 8%
2008 10% 23% 22% 16% 13% 10% 6%
2009 7% 23% 18% 17% 15% 12% 8%
2010 6% 25% 20% 15% 15% 12% 7%
2011 7% 21% 23% 14% 15% 12% 8%
2012 6% 23% 22% 16% 15% 13% 5%
< 1 1-3 4-6 7-9 10-12 13-15 16-17
MDHA 2012 Annual "Point-in-Time" Homeless Count & Census - Page 20
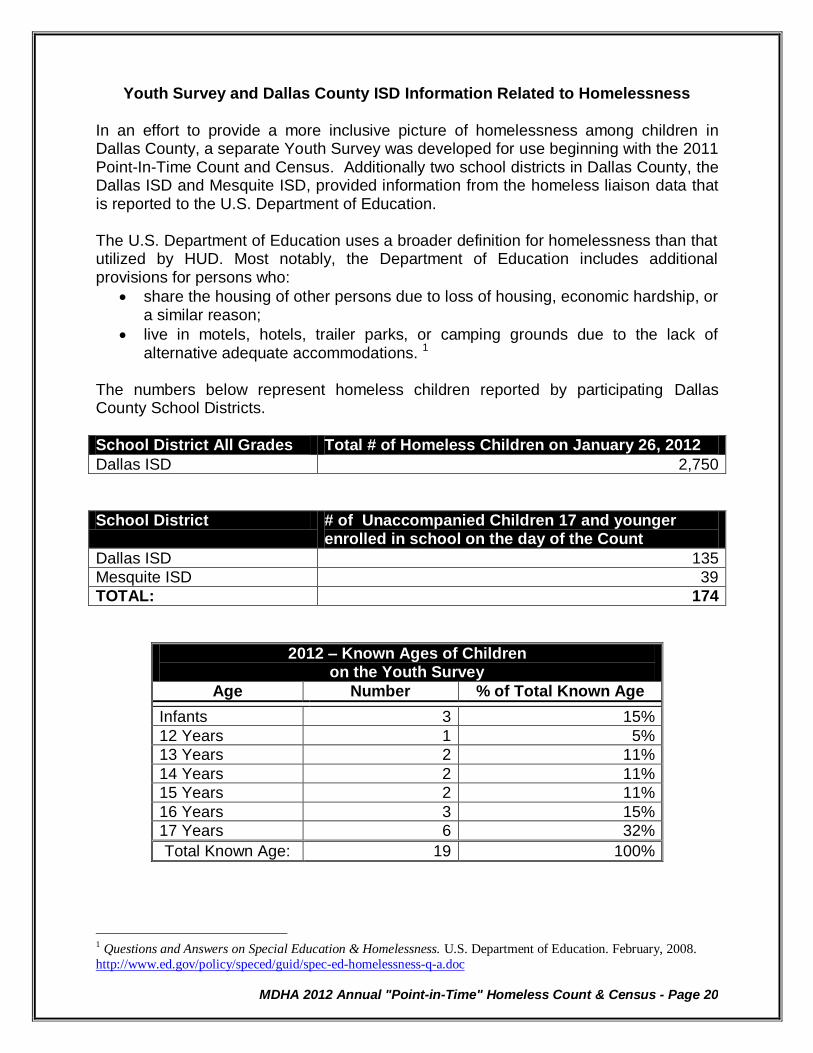
Youth Survey and Dallas County ISD Information Related to Homelessness
In an effort to provide a more inclusive picture of homelessness among children in Dallas County, a separate Youth Survey was developed for use beginning with the 2011 Point-In-Time Count and Census. Additionally two school districts in Dallas County, the Dallas ISD and Mesquite ISD, provided information from the homeless liaison data that is reported to the U.S. Department of Education. The U.S. Department of Education uses a broader definition for homelessness than that utilized by HUD. Most notably, the Department of Education includes additional provisions for persons who:
share the housing of other persons due to loss of housing, economic hardship, or a similar reason;
live in motels, hotels, trailer parks, or camping grounds due to the lack of alternative adequate accommodations. 1
The numbers below represent homeless children reported by participating Dallas County School Districts. School District All Grades Total # of Homeless Children on January 26, 2012
Dallas ISD 2,750
School District # of Unaccompanied Children 17 and younger
enrolled in school on the day of the Count
Dallas ISD 135
Mesquite ISD 39
TOTAL: 174
2012 – Known Ages of Children on the Youth Survey
Age Number % of Total Known Age
Infants 3 15%
12 Years 1 5%
13 Years 2 11%
14 Years 2 11%
15 Years 2 11%
16 Years 3 15%
17 Years 6 32%
Total Known Age: 19 100%
1 Questions and Answers on Special Education & Homelessness. U.S. Department of Education. February, 2008.
http://www.ed.gov/policy/speced/guid/spec-ed-homelessness-q-a.doc
MDHA 2012 Annual "Point-in-Time" Homeless Count & Census - Page 21
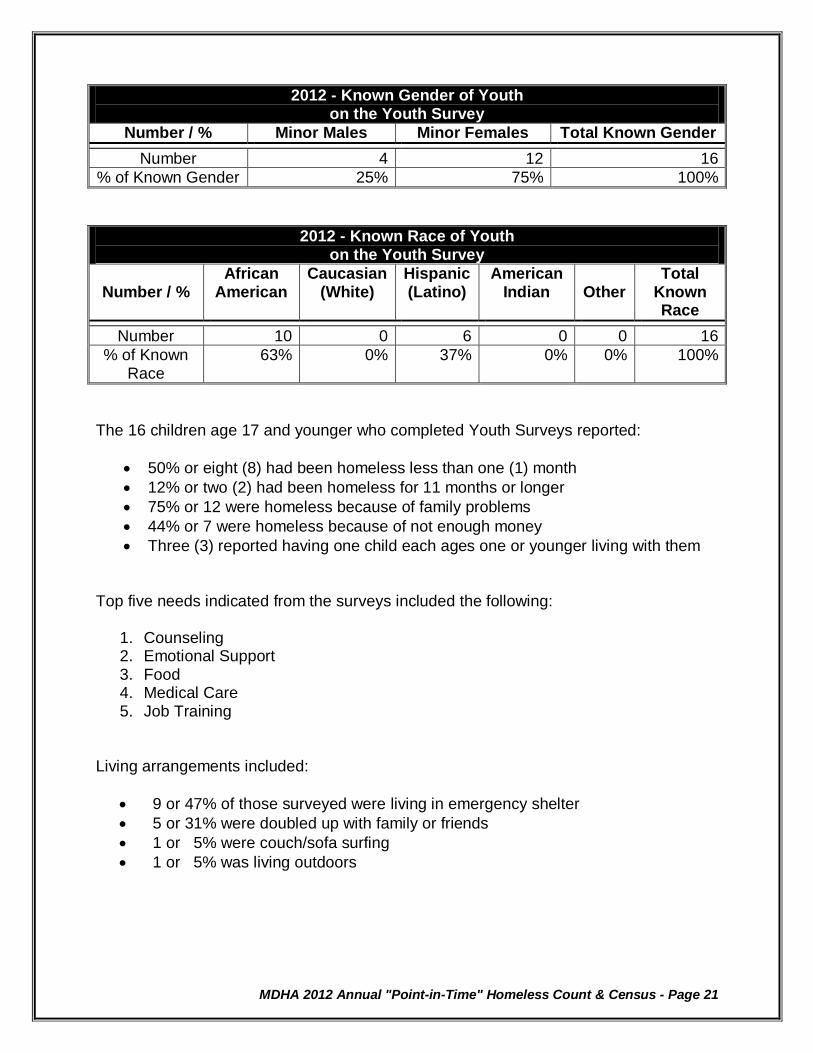
2012 - Known Gender of Youth on the Youth Survey
Number / % Minor Males Minor Females Total Known Gender
Number 4 12 16
% of Known Gender 25% 75% 100%
2012 - Known Race of Youth on the Youth Survey
Number / %
African American
Caucasian (White)
Hispanic (Latino)
American Indian
Other
Total Known Race
Number 10 0 6 0 0 16
% of Known Race
63% 0% 37% 0% 0% 100%
The 16 children age 17 and younger who completed Youth Surveys reported:
50% or eight (8) had been homeless less than one (1) month
12% or two (2) had been homeless for 11 months or longer
75% or 12 were homeless because of family problems
44% or 7 were homeless because of not enough money
Three (3) reported having one child each ages one or younger living with them Top five needs indicated from the surveys included the following:
1. Counseling 2. Emotional Support 3. Food 4. Medical Care 5. Job Training
Living arrangements included:
9 or 47% of those surveyed were living in emergency shelter
5 or 31% were doubled up with family or friends
1 or 5% were couch/sofa surfing
1 or 5% was living outdoors

MDHA 2012 Annual "Point-in-Time" Homeless Count & Census - Page 22
Causes of Homelessness based on the Point-In-Time Count and Census Surveys
When asked to provide between one (1) and three (3) reasons why they were homeless, respondents provided the following information. Not everyone who completed a survey provided responses to this question. Percentages are based on the number of surveys completed, not the number of respondents who answered the question. The main cause remains "Unemployed, Lost Job." In 2012, this category declined to 50% from 54% in 2011. The percentage decrease in unemployment reported is likely due to fewer overall responses in this self-reported category. The percentage of respondents who indicated that they were homeless due to Mental Illness rose to 32% in 2012 from 30% in 2011 and is up from 27% in 2010. The percentage of respondents who indicated they were homeless due to Substance Abuse / Dependence increased another percentage point to 31% from the previous year.
Self-Reported Cause of Homelessness
Reason Homeless
Number
% of Total
Reason Homeless
Number
% of Total
Unemployed, Lost Job 1,488 50% Medical Disability 631 21%
Substance Abuse/ Dependence
914
31%
Eviction
318
11%
Not Enough Money 898 30% Legal Problems 320 11%
Family Problems 675 23% Other 295 10%
Mental Illness 959 32% Natural Disaster 23 <1%
Domestic Abuse 291 10% Sex Offender 9 <1%

MDHA 2012 Annual "Point-in-Time" Homeless Count & Census - Page 23
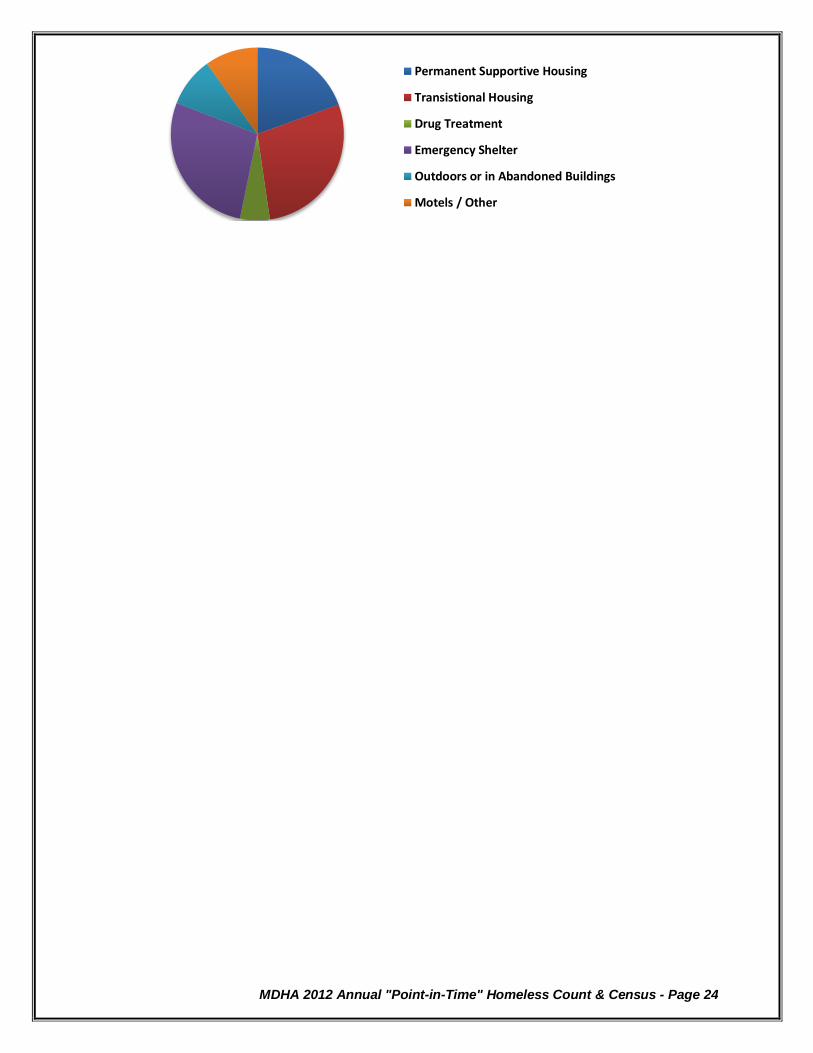
Frequency / Duration of Homelessness
Homeless For At Least One Year
1,819 respondents (61%) indicated that they had been homeless for at least one year, an 18% decrease from 2011. Of the respondents who provided sufficient information to determine where they were living:
839 (46%) were living in Permanent Supportive Housing (up from 31% in 2011) 354 (20%) were living in Transitional Housing (level with 2011) 33 (2%) were living in Drug Treatment (down from 4% in 2011) 356 (20%) were living in Emergency Shelter (down from 30% in 2011) 137 (8%) were living Outdoors or in Abandoned Buildings (level with 2011) 71 (4%) were living in Motels or Other Locations (level with 2011)
Homeless Four Or More Times Within The Past Three Years
328 respondents (11%) indicated that they had been homeless 4 or more times in the past 3 years, a 3% increase from 2011.
Of the respondents who provided sufficient information to determine where they were living:
63 (19%) were living in Permanent Supportive Housing (up from 16% in 2011) 91 (28%) were living in Transitional Housing (up from 22% in 2011) 18 (5%) were living in Drug / Alcohol Treatment (up from 3% in 2011) 89 (27%) were living in Emergency Shelter (down from 31% in 2011) 30 (9%) were living Outdoors or in Abandoned Buildings (up from 2% in
2011) 32 (9%) were living in Motels or Other Locations (down from 10% in 2011)
Permanent Supportive Housing
Transistional Housing
Drug Treatment
Emergency Shelter
Outdoors or in Abandoned Buildings
Motels / Other
MDHA 2012 Annual "Point-in-Time" Homeless Count & Census - Page 24
Permanent Supportive Housing
Transistional Housing
Drug Treatment
Emergency Shelter
Outdoors or in Abandoned Buildings
Motels / Other

MDHA 2012 Annual "Point-in-Time" Homeless Count & Census - Page 25
Homeless For The First Time
744 respondents (25%) indicated that they had become homeless for the first time in the past 12 months, down from 31% in 2011. Of the respondents who provided sufficient information to determine where they were living:
86 (12%) were living in Permanent Supportive Housing (down from 15% in
2011) 247 (33%) were living in Transitional Housing (up from 26% in 2011) 24 (3%) were living in Drug / Alcohol Treatment (up from 2% in 2011) 303 (41%) were living in Emergency Shelter (down from 44% in 2011) 29 (4%) were living Outdoors or in Abandoned Buildings (up from 3% in
2011) 45 (6%) were living in Motels or Other Locations (down from 8% in 2011)
Of those reporting that they were homeless for the first time, 686 indicated how long they had been homeless:
2012 - Known Results for How long Homeless (Less than 1 year)
Number / %
< 1 month to 2 months
3 to 5 months
6 to 8 months
9 to 11 months
Total Known Time Period
Number 224 196 168 98 686
% of Total 33% 29% 24% 14% 100%
Permanent Supportive Housing
Transistional Housing
Drug Treatment
Emergency Shelter
Outdoors or in Abandoned Buildings
Motels / Other

MDHA 2012 Annual "Point-in-Time" Homeless Count & Census - Page 26
Survey Location
2012 – Known Results for City where survey was completed
City
Carrollton Cedar Hill
DeSoto Mesquite
Coppell
Dallas Garland
Grand Prairie Irving Sachse
Total
Number 1 each 2 2,829 60 10 51 2 2,958
% of Total <1% each <1% 96% 2% <1% 2% <1%% 100%
As housing opportunities are created for homeless and formerly homeless populations across the city, the number of homeless individuals in the City of Dallas Central Police District has declined. PLEASE NOTE: As demonstrated in the chart below, boundaries for police districts were changed in 2008, and a South Central Division was added.
2005 2006 2007 2008 2009 2010 2011 2012
Central 1,063 979 866 866 718 694 986 797
North Central 110 111 247 91 150 145 94 113
Northeast 82 131 249 291 193 400 360 460
Northwest 282 193 282 523 386 502 437 259
South Central 0 0 0 203 217 387 326 217
Southeast 261 432 348 196 201 227 242 389
Southwest 171 82 171 133 147 134 248 321
0
200
400
600
800
1,000
1,200
Nu
mb
er
of
Surv
eys
Police District Where Survey Was Conducted
MDHA 2012 Annual "Point-in-Time" Homeless Count & Census - Page 27
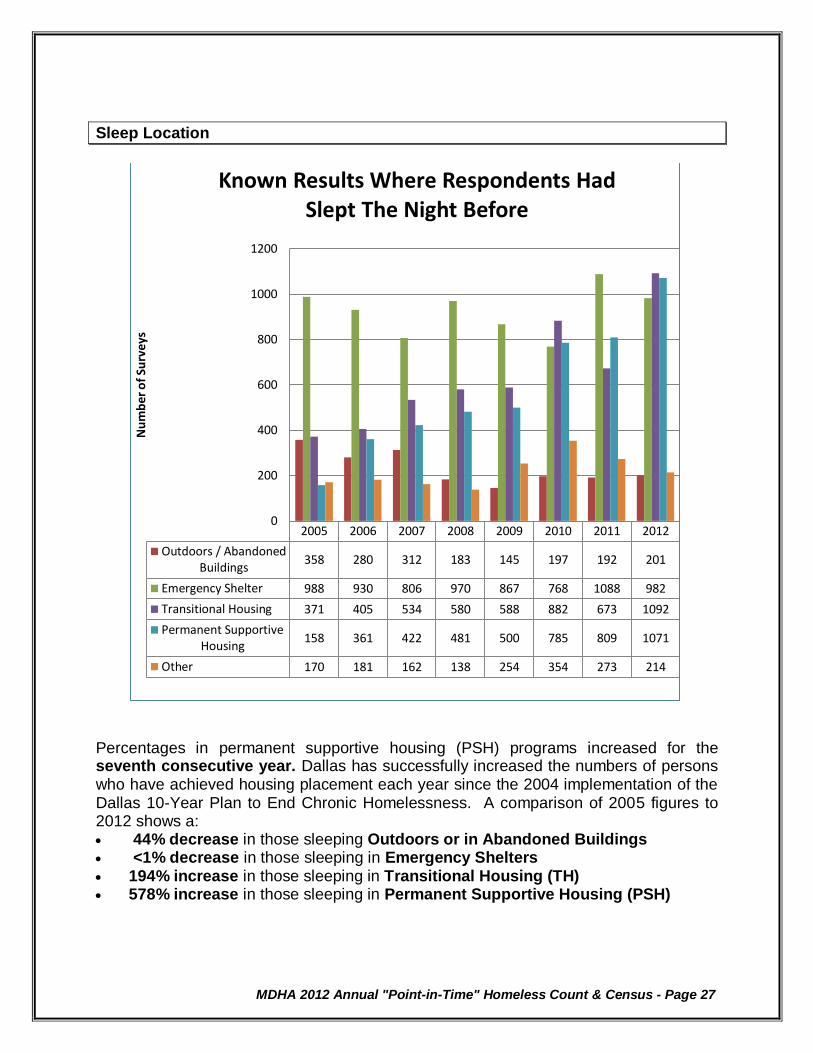
Sleep Location
Percentages in permanent supportive housing (PSH) programs increased for the seventh consecutive year. Dallas has successfully increased the numbers of persons who have achieved housing placement each year since the 2004 implementation of the Dallas 10-Year Plan to End Chronic Homelessness. A comparison of 2005 figures to 2012 shows a: 44% decrease in those sleeping Outdoors or in Abandoned Buildings <1% decrease in those sleeping in Emergency Shelters 194% increase in those sleeping in Transitional Housing (TH) 578% increase in those sleeping in Permanent Supportive Housing (PSH)
2005 2006 2007 2008 2009 2010 2011 2012
Outdoors / AbandonedBuildings
358 280 312 183 145 197 192 201
Emergency Shelter 988 930 806 970 867 768 1088 982
Transitional Housing 371 405 534 580 588 882 673 1092
Permanent SupportiveHousing
158 361 422 481 500 785 809 1071
Other 170 181 162 138 254 354 273 214
0
200
400
600
800
1000
1200
Nu
mb
er o
f Su
rvey
s
Known Results Where Respondents Had Slept The Night Before

MDHA 2012 Annual "Point-in-Time" Homeless Count & Census - Page 28
Chronic Homeless Population
As stated previously in this report, the number of chronically homeless individuals in Dallas County has decreased 19% from 2011.
Comparison of Chronic Homeless to the Overall Homeless Population
Below is a comparison of selected demographics in the total homeless population and the chronic homeless population:
Characteristic
Total Homeless Population Chronic Homeless Population
2009 2010 2011 2012 2009 2010 2011 2012
Male: 61% 66% 64% 59% 81% 85% 82% 78%
Female: 39% 34% 36% 41% 19% 15% 18% 22%
African American: 59% 57% 56% 59% 65% 58% 53% 61%
Caucasian: 30% 31% 31% 30% 27% 32% 34% 33%
Hispanic: 7% 8% 8% 7% 4% 5% 7% 3%
Other Race/Ethnicity: 4% 4% 5% 4% 4% 5% 6% 3%
Substance Abuse: 37% 41% 38% 42% 56% 55% 57% 61%
Mental Illness: 33% 38% 38% 42% 44% 40% 49% 62%
Physical Disability: 26% 24% 30% 30% 44% 37% 40% 49%

MDHA 2012 Annual "Point-in-Time" Homeless Count & Census - Page 29
2012 Location by Housing Type
Comparison of Emergency Shelter
IndividualsFamilyUnits
Persons inFamilies
Total
Shelter 641 113 341 982
TH 471 196 621 1,092
Unsheltered 188 6 13 201
Total 1,300 315 975 2,275
0
1,000
2,000
3,000
4,000
0
500
1,000
1,500
2,000
Shelter 2005 1,642 202 606
Shelter 2006 1,519 155 494
Shelter 2007 1,174 202 612
Shelter 2008 1,632 190 512
Shelter 2009 1,394 178 531
Shelter 2010 1,297 167 490
Shelter 2011 957 131 389
Individuals Family UnitsPersons in
Families
MDHA 2012 Annual "Point-in-Time" Homeless Count & Census - Page 30
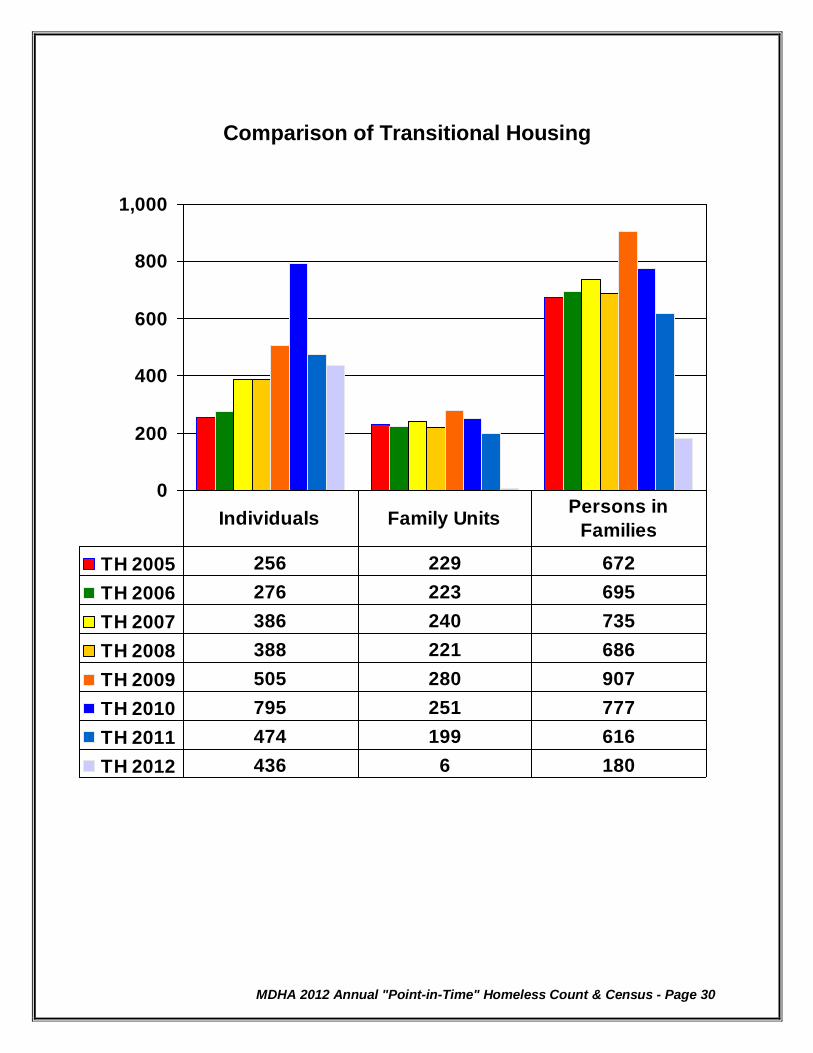
Comparison of Transitional Housing
0
200
400
600
800
1,000
TH 2005 256 229 672
TH 2006 276 223 695
TH 2007 386 240 735
TH 2008 388 221 686
TH 2009 505 280 907
TH 2010 795 251 777
TH 2011 474 199 616
TH 2012 436 6 180
Individuals Family UnitsPersons in
Families

MDHA 2012 Annual "Point-in-Time" Homeless Count & Census - Page 31
Population Characteristics
Respondents completed a personal profile that applied to them and/or their spouses. Below are the responses representing adults and unaccompanied children.
Population Characteristics
Category
Number
% of Total*
Category
Number
% of Total*
Employed (Working right now)
323
11%
Substance Abuse History
1,270
42%
Unemployed (No job at all)
2,007
66%
Mental Illness
1,275
42%
Underemployed (Part Time/Low Pay)
291
10%
Been Tested for HIV/AIDS
1,113
36%
Veteran
554
18% Diagnosed with HIV/AIDS
148
5%
Disabled 923 30% Domestic Abuse Victim 407 13%
Ex-Offender
609
20% High School Diploma or GED
979
32%
On Parole 130 4% Some College 787 26%
On Probation
192
6%
College Graduate / Diploma
235
8%
Medical Problems 1,158 38% Ever in Foster Care 220 7%
*These percentages were gathered based on the total number of adults and unaccompanied youth represented on
the surveys. However, not everyone who completed a survey provided answers to the questions in this section.
The percentage of respondents indicating Unemployed, (No job at all) increased in 2012 from 62% to 66%. However, It should be noted that 20% of the population reported are ex-offenders, which presents a significant barrier to both employment and sustainable housing. The percentage of adults who are reporting Veteran status increased 1% this year.
MDHA 2012 Annual "Point-in-Time" Homeless Count & Census - Page 32
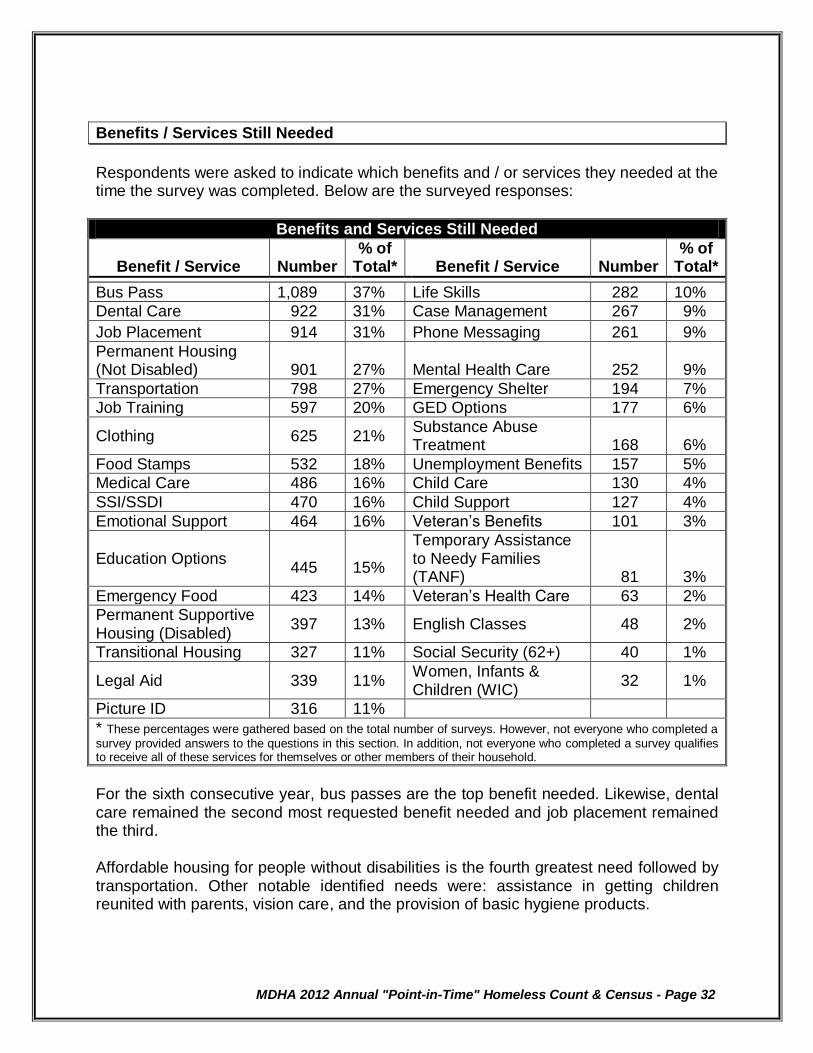
Benefits / Services Still Needed
Respondents were asked to indicate which benefits and / or services they needed at the time the survey was completed. Below are the surveyed responses:
Benefits and Services Still Needed
Benefit / Service
Number
% of Total*
Benefit / Service
Number
% of Total*
Bus Pass 1,089 37% Life Skills 282 10%
Dental Care 922 31% Case Management 267 9%
Job Placement 914 31% Phone Messaging 261 9%
Permanent Housing (Not Disabled)
901
27% Mental Health Care 252 9%
Transportation 798 27% Emergency Shelter 194 7%
Job Training 597 20% GED Options 177 6%
Clothing 625 21% Substance Abuse Treatment
168
6%
Food Stamps 532 18% Unemployment Benefits 157 5%
Medical Care 486 16% Child Care 130 4%
SSI/SSDI 470 16% Child Support 127 4%
Emotional Support 464 16% Veteran’s Benefits 101 3%
Education Options 445
15%
Temporary Assistance to Needy Families (TANF) 81 3%
Emergency Food 423 14% Veteran’s Health Care 63 2%
Permanent Supportive Housing (Disabled)
397 13% English Classes 48 2%
Transitional Housing 327 11% Social Security (62+) 40 1%
Legal Aid 339 11% Women, Infants & Children (WIC)
32 1%
Picture ID 316 11%
* These percentages were gathered based on the total number of surveys. However, not everyone who completed a
survey provided answers to the questions in this section. In addition, not everyone who completed a survey qualifies to receive all of these services for themselves or other members of their household.
For the sixth consecutive year, bus passes are the top benefit needed. Likewise, dental care remained the second most requested benefit needed and job placement remained the third. Affordable housing for people without disabilities is the fourth greatest need followed by transportation. Other notable identified needs were: assistance in getting children reunited with parents, vision care, and the provision of basic hygiene products.

MDHA 2012 Annual "Point-in-Time" Homeless Count & Census - Page 33
Benefits Being Received
Respondents were asked to indicate which benefits they were currently receiving at the time of the survey. Below are the responses, based on the number of surveys received.
Benefits Being Received
Benefit Number % of Total*
Food Stamps 1,588 54%
SSI (Supplemental Security Income) 368 12%
SSDI (Social Security Disability Insurance) 340 11%
WIC (Women, Infants & Children) 103 3%
Veteran's Benefits 103 3%
TANF (Temporary Assistance to Needy Families) 89 3%
Child Support 85 3%
Social Security (62+) 80 3%
Unemployment 53 2%
DARS 33 1%
* These percentages were gathered based on the total number of surveys. However, not everyone who
completed a survey provided answers to the questions in this section. In addition, not everyone who completed a survey qualifies to receive all of these services for themselves or other members of their household.
Benefits That Have Expired
Respondents were asked to indicate which benefits they had been receiving at one point, but which had expired at the time the survey was completed. Below are the responses, based on the number of surveys received. Those receiving TANF increased 32% from 2011.
Benefits That Have Expired
Benefit Number % of Total*
Food Stamps 611 21%
Unemployment 238 8%
TANF (Temporary Assistance for Needy Families) 102 3%
WIC (Women, Infants & Children) 93 3%
SSI (Supplemental Security Income) 92 3%
SSDI (Social Security Disability Insurance) 81 3%
* These percentages were gathered based on the total number of surveys. However, not everyone who
completed a survey provided answers to the questions in this section. In addition, not everyone who completed a survey qualifies to receive all of these services for themselves or other members of their household.

MDHA 2012 Annual "Point-in-Time" Homeless Count & Census - Page 34
Glossary of Terms
Chronic Substance Abuse – This category on the PIT includes persons with a substance abuse problem (alcohol abuse, drug abuse, or both) that is expected to be of long-continued and indefinite duration and substantially impairs the person’s ability to live independently. Chronically Homeless Individual - An unaccompanied homeless adult individual
(persons 18 years or older) with a disabling condition (see definition below) who has either been continuously homeless for a year or more OR has had at least four (4) episodes of homelessness in the past three (3) years. To be considered chronically homeless, persons must have been sleeping in a place not meant for human habitation (e.g., living on the streets) and/or in an emergency shelter/Safe Haven during that time. Persons under the age of 18 are not counted as chronically homeless. For purposes of the PIT, persons living in transitional housing at the time of the PIT count should not be included in this subpopulation category. Chronically Homeless Family – A household with at least one adult member (persons
18 or older) who has a disabling condition (see definition below) and who has either been continuously homeless for a year or more OR has had at least four (4) episodes of homelessness in the past three (3) years. To be considered chronically homeless, persons must have been sleeping in a place not meant for human habitation (e.g., living on the streets) and/or in an emergency shelter/Safe Haven during that time. For purposes of the PIT, persons living in transitional housing at the time of the PIT count should not be included in this subpopulation category; the subpopulation count should include all members of the household. Disabling Condition – Any one of (1) a disability as defined in Section 223 of the
Social Security Act; (2) a physical, mental, or emotional impairment which is (a) expected to be of long continued and indefinite duration, (b) substantially impedes an individual’s ability to live independently, and (c) of such a nature that such ability could be improved by more suitable housing conditions; (3) a developmental disability as defined in Section 102 of the Developmental Disabilities Assistance and Bill of Rights Act; (4) the disease of acquired immunodeficiency syndrome or any conditions arising from the etiological agency for acquired immunodeficiency syndrome; or (5) a diagnosable substance abuse disorder. Persons with HIV/AIDS – This subpopulation category of the PIT includes persons who have been diagnosed with AIDS and/or have tested positive for HIV. Severely Mentally Ill (SMI) – This subpopulation category of the PIT includes persons
with mental health problems that are expected to be of long-continued and indefinite duration and substantially impairs the person’s ability to live independently. Unaccompanied Child (under 18) – This subpopulation category of the PIT includes
persons under the age of 18 with a household size of one.
MDHA 2012 Annual "Point-in-Time" Homeless Count & Census - Page 35
Veteran – This subpopulation category of the PIT includes persons who have served on
active duty in the Armed Forces of the United States. This does not include inactive military reserves or the National Guard unless the person was called up to active duty. Victims of Domestic Violence – This subpopulation category of the PIT includes
persons who have been victims of domestic violence at any point in the past.
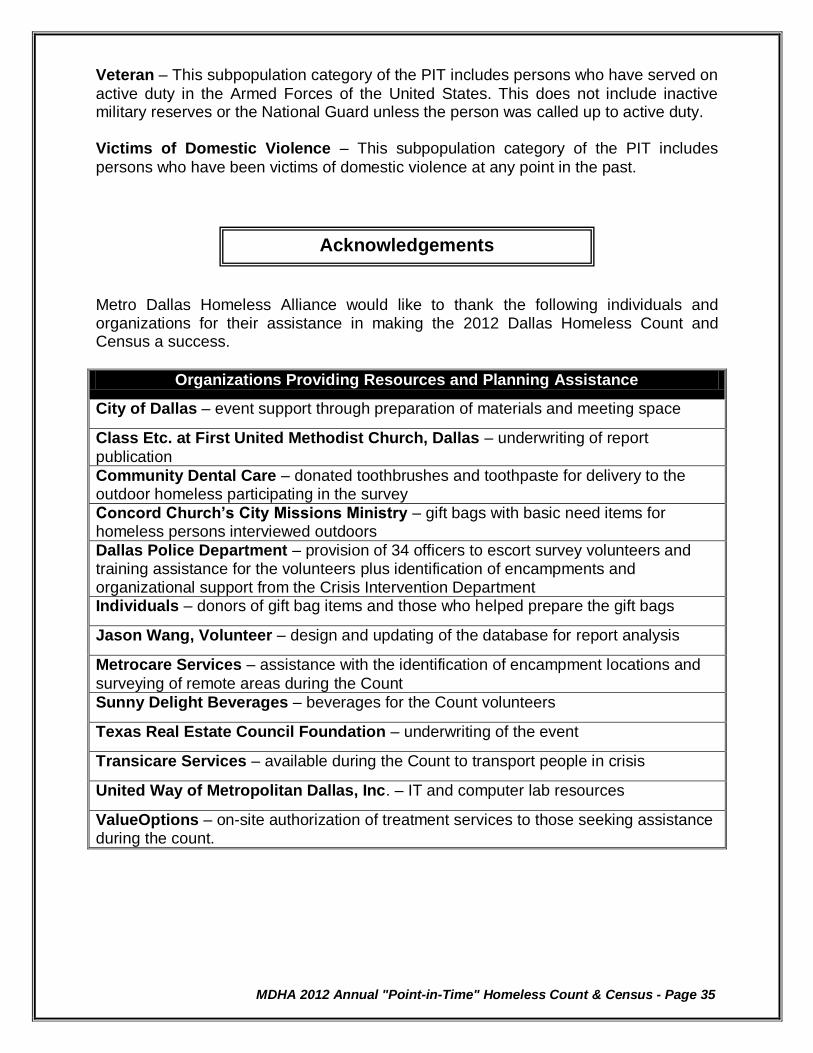
Acknowledgements
Metro Dallas Homeless Alliance would like to thank the following individuals and organizations for their assistance in making the 2012 Dallas Homeless Count and Census a success.
Organizations Providing Resources and Planning Assistance
City of Dallas – event support through preparation of materials and meeting space
Class Etc. at First United Methodist Church, Dallas – underwriting of report
publication
Community Dental Care – donated toothbrushes and toothpaste for delivery to the outdoor homeless participating in the survey
Concord Church’s City Missions Ministry – gift bags with basic need items for homeless persons interviewed outdoors
Dallas Police Department – provision of 34 officers to escort survey volunteers and training assistance for the volunteers plus identification of encampments and organizational support from the Crisis Intervention Department Individuals – donors of gift bag items and those who helped prepare the gift bags
Jason Wang, Volunteer – design and updating of the database for report analysis
Metrocare Services – assistance with the identification of encampment locations and
surveying of remote areas during the Count
Sunny Delight Beverages – beverages for the Count volunteers
Texas Real Estate Council Foundation – underwriting of the event
Transicare Services – available during the Count to transport people in crisis
United Way of Metropolitan Dallas, Inc. – IT and computer lab resources
ValueOptions – on-site authorization of treatment services to those seeking assistance during the count.
MDHA 2012 Annual "Point-in-Time" Homeless Count & Census - Page 36
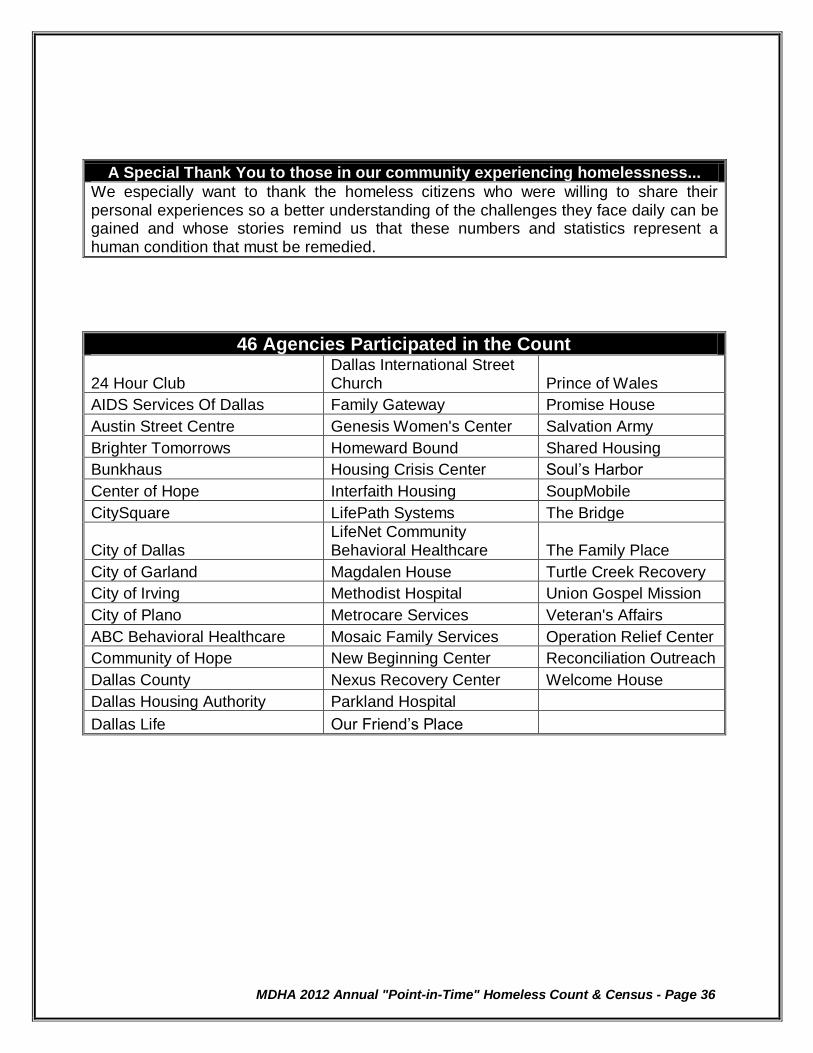
A Special Thank You to those in our community experiencing homelessness...
We especially want to thank the homeless citizens who were willing to share their personal experiences so a better understanding of the challenges they face daily can be gained and whose stories remind us that these numbers and statistics represent a human condition that must be remedied.
46 Agencies Participated in the Count
24 Hour Club Dallas International Street Church Prince of Wales
AIDS Services Of Dallas Family Gateway Promise House
Austin Street Centre Genesis Women's Center Salvation Army
Brighter Tomorrows Homeward Bound Shared Housing
Bunkhaus Housing Crisis Center Soul’s Harbor
Center of Hope Interfaith Housing SoupMobile
CitySquare LifePath Systems The Bridge
City of Dallas LifeNet Community Behavioral Healthcare The Family Place
City of Garland Magdalen House Turtle Creek Recovery
City of Irving Methodist Hospital Union Gospel Mission
City of Plano Metrocare Services Veteran's Affairs
ABC Behavioral Healthcare Mosaic Family Services Operation Relief Center
Community of Hope New Beginning Center Reconciliation Outreach
Dallas County Nexus Recovery Center Welcome House
Dallas Housing Authority Parkland Hospital
Dallas Life Our Friend’s Place

MDHA 2012 Annual "Point-in-Time" Homeless Count & Census - Page 37
248 Community Volunteers Conducted the Census Survey Abra Parker Cosette Ratliff Janet Smith
Adalade M. Foster Crystal Wolverton Janie Alverez
Adrian Greer Dale Campbell Janie Epperson
Alex Williams Dan Ware Jarrod Lemmons
Alexis Sanchez Dane Butters Jasmaine Dowe
Alison Beck Danielle Tooker Jay Staples
Amanda Billings Danny Edwards Jean Jones
Amanda Elliot Darlene Williams Jeffrey McKown
Amanda Febbraro Darvin Hooey Jennifer McSpadden
Amber Fisher David Cole Jessica Brown
Amit Patel David Jones Jessica Galleshaw
Amy Dennis David Motley Jessica Wilkerson
Amy Ngo David Peach Jim March
Andy Van Noord Dedra Medford Jimmie Harp
Angela Johnson Dennis Zweigle JoAnn DuVall
Ann Smith Diana Cuellar JoAnn Rodriguez
Anthony Hickman Don Kahn Joanne Burlou
Ashlee McQuiston Donnelle Love John Monroe
Ashley Postell Dorothy Cox John Pavey
Barb Keefer Dot LaSalle Johathan Grace
Becky Motley Dr. David Haymes Jonathan Wood
Beth Geis Dustin Perkins Jordan Bethea
Bonnie O'Day Edward St. John Joycelyn Caesar
Brandi Billings Elbert Smith Julie Kaplan
Brandon Kilgore Elia Bustillo June Weirich
Brennan McMahon Emily Tramuto June Werry
Brian Tsui Erica Craycraft Justin Wood
Bridget Guiriceo Erica Hinkle Justus Bolo
Britton Banowsky Ev’Marie Peach Kathy Denny
Bruce Gadd Evan Beattie Katy Pitock
C. Donald Babers Farrah Bakhshi Kayo Mullins
Caitlin Krauss Geri Strong Kelley Price
Carol Blackwood Gilbert Ramirez Kelly Wierzbinski
Carole Wilcher Gregory Byrne Ken Mogbo
Cassandra Gipson Gregory Williams Kenyada Osbourne
Cassey Amburn Gussie Lewis Kim Haynie
Catherine Weir Heather Emrick Kirk Davis
Cathy Song Helena Davidson LaDondra Wilson
Charissa Nosenzo Henrietta Martin Lauran Goldberg
Cherry Haymes Holland Morris Lauren Whitthorne
Chris Oliver Homer Rodriguez Lawrence Norman
Christal George Hope Stedman Layne Court
Christy Herrscher Jackie Holland Linda Jones

MDHA 2012 Annual "Point-in-Time" Homeless Count & Census - Page 38
Claudia Lemmon James Coleman Linda McMahon
Clifton Gillespie Jan Mosebrook Linda White
Linda Wooley Patricia Scali (Patti) Steven Bradley
Lisa Brinser Patricia Villareal Steven Bush
Lisa Ciminelli Patricia Washington Susan Cox
Lisa Irwin Patrick Parker Sylvia Weaver
Lisa Zale Paul Stauffer Tabatha Sullivent
Lori Davidson Penny Goff Tabetha Little
Louis Adams Phillip Worley Tamara Royal
Lurendia Harden Phyllis Goode Taylor Ashley
Lynn Sutton Pittman Haymore Ted Hamilton
Mack Haisten Rajesh Thakkar Terrance Williams
Margaret Mhasvi Ramon Phillips Thomas Chema
Maria Brown Rebecca Bird Tierney Roberson
Marie Krebs Regina Brant Tim Thetford
Marilu Thorn Rhonda Jones Tom Dobson
Mark Brezina Ricardo Gonzales Toni Bell
Mark Hall Rich Franzen Tonia Adams
Mark Lea Richard Tran Traswell Livingston
Marlene Amado Rollins Robert Torres Tyler Pruessner
Marquette Stevenson Robin Minick Valencia Hooper
Marquita Johnson Roderick Sample Vanessa Duckett
Martha Wach Rosalinda Trevino-Ortega Vicki Bearrow
Mary Myers Ross Taylor Vicki West
Mary Reed Ryndi Johnson William Davis
Matthew Martin Sally Baldwin Winford Cross
McKay Heim Sally Crawford Zarin Gracey
Melvina Leflore Sally Rosenberg
Meredith Godbold Salome Acosta
Michael Katz Sam Peck
Mike Correll Samuel Curn
Mike Itashiki Scott Hudman
Mitzi Court Sgen Hurdon
Morgan Williams Shadale Myers
Myrl Humphrey Sheila Figueroa
Nadeen Roberts Shelley Goad
Nancy Hull Shelly Nixon
Natalie Butters Sheri Crandall
Nathan Hill Sherland Ross
Neff Conner Shernetta Veasey
Nick Bowen Sherry Randall
Nick La Rocca Sheryll Ellis-Harris
Nicole Tsui Harrell Sondra Cox
Olivia Sewell Stacey Rogers
Pamela Dixon Stephanie Davis
Pamela Robison Stephanie Venza
MDHA 2012 Annual "Point-in-Time" Homeless Count & Census - Page 39
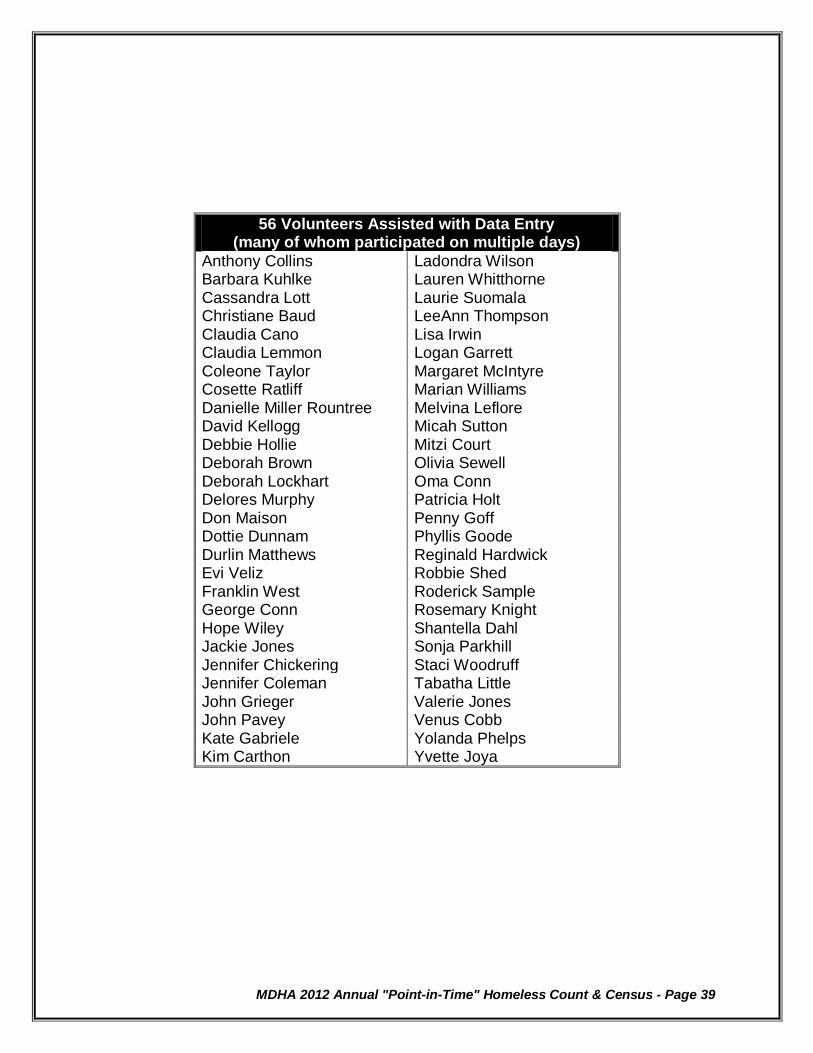
56 Volunteers Assisted with Data Entry (many of whom participated on multiple days)
Anthony Collins Ladondra Wilson Barbara Kuhlke Lauren Whitthorne Cassandra Lott Laurie Suomala Christiane Baud LeeAnn Thompson Claudia Cano Lisa Irwin Claudia Lemmon Logan Garrett Coleone Taylor Margaret McIntyre Cosette Ratliff Marian Williams Danielle Miller Rountree Melvina Leflore David Kellogg Micah Sutton Debbie Hollie Mitzi Court Deborah Brown Olivia Sewell Deborah Lockhart Oma Conn Delores Murphy Patricia Holt Don Maison Penny Goff Dottie Dunnam Phyllis Goode Durlin Matthews Reginald Hardwick Evi Veliz Robbie Shed Franklin West Roderick Sample George Conn Rosemary Knight Hope Wiley Shantella Dahl Jackie Jones Sonja Parkhill Jennifer Chickering Staci Woodruff Jennifer Coleman Tabatha Little John Grieger Valerie Jones John Pavey Venus Cobb Kate Gabriele Yolanda Phelps Kim Carthon Yvette Joya
MDHA 2012 Annual "Point-in-Time" Homeless Count & Census - Page 40
For more information about this report, or to discuss participation in the 2013 Homeless Count and Census, please contact Metro Dallas Homeless Alliance:
Michael M. Faenza President and CEO [email protected] Charles Gulley
Vice President of Programs [email protected]


