
CTSI Module 8 Workshop Biomedical Informatics, Data Standards & Practical
Tools
Introduction to Biomedical Informatics, Part II
Coordinators: William Hsu, PhD & Corey Arnold, PhD Medical Imaging Informatics Group Dept of Radiological Sciences UCLA School of Medicine
1

Module Objectives Objective: Provide basic and clinical translational scientists with a working understanding of biomedical informatics principles and their applications in biomedical data collection, standardization, representation, and analysis.
Intro to Biomedical Informatics Data Standards & Terminologies Practical Tools in Informatics
Familiarize participants with the basic principles of biomedical informatics demonstrated by ongoing projects and services across the CTSI sites.
Describe the use of data standards for representation and exchange of clinical information in the context of electronic health records and clinical decision support.
Provide a demonstration of CTSI-specific applications and resources that facilitate the management and analysis of clinical and experimental data.
• Introduce the foundational concepts of biomedical informatics and its subfields
• Understand the role of informatics in evidence-based medicine
• Distinguish the different types of health information
• Learn about UCLA CTSI efforts related to this area and whom to contact for expert consultation
• Describe the use of standards for data coding, knowledge representation and exchange of clinical information
• Discuss the importance of controlled terminologies as a specific class of standards
• Learn about health information system architecture
• Demonstrate data collection using REDCap
• Discuss software tools and resources for data collection, extraction and representation, and analysis
• Showcase resources available through the CTSI, member campuses, and the UC system
2

Lecture Outline • 5/7 Part I: Informatics in healthcare and translational research (D. Bell, 1.5 hrs)
– Introduce the fundamental concepts of biomedical informatics and its subfields – Learn about UCLA CTSI efforts related to this area and whom to contact for expert consultation
• 5/9 Part II: Community-based informatics research (O. Ogunyemi, 1.5 hrs) – Summarize the role of informatics in public health and addressing health disparity issues – Define disease registries, their implementation and applications, and considerations – Discuss development towards a national learning health care system
• 5/14 Part III: Electronic health record systems (R. Jenders, 1.5 hrs) – Introduce principles of health information system architecture and design – Describe the use of standards for data coding, knowledge representation and exchange of
clinical information • 5/16 Part IV: Clinical decision support (R. Jenders, 1.5 hrs)
– Enumerate techniques for clinical decision support (e.g., alerts, infobuttons) – Present standards for clinical decision support
• 5/23 Part V: Practical tools in biomedical informatics (W. Hsu/C. Arnold, 3 hrs) – Demonstrate data collection using REDCap (Martin Lai, UCLA CTSI) – Services provided by the biostatistics core (David Elashoff, UCLA Biostatistics) – Discussion of advanced tools and services available (William Hsu/Corey Arnold, UCLA Medical
Imaging Informatics)
3

Recap from Part I • Biomedical Informatics
– Interdisciplinary field that studies and pursues the effective uses of biomedical data, information, and knowledge for scientific inquiry, problem solving, and decision making, motivated by efforts to improve human health -- AMIA
• In healthcare – Adoption of EHRs at hospitals is at ~44% as of 2012 – EHRs have had a positive impact on various outcome measures
(efficiency/effectiveness of care) (Buntin et al, 2011) – BUT, EHRs have also been implicated in complications (Han, 2005)
challenges in functionality/workflow integration • In translational research
– Providing informatics tools to support translation from basic science to clinical practice
– CTSI offers a variety of services for investigators • Cohort discovery (UC ReX, LADR) • Data management (REDCap) • Clinical trial data management, statistical consultation 4

Module Resources • Recorded webcast & materials
– http://www.ctsi.ucla.edu/education/training/webcastmodules • CTSI virtual home
– http://www.ctsi.ucla.edu – Biomedical Informatics Program
http://www.ctsi.ucla.edu/about/pages/bip2 • Other resources
– Agency for Healthcare Research and Quality http://www.ahrq.gov/
– CDC Public Health Informatics Fellowship Program http://www.cdc.gov/PHIFP/
– Health People 2020 http://www.healthypeople.gov
– National Institute on Minority and Health Disparities http://www.nimhd.nih.gov/
5

CTSI Module 8 Workshop Introduction to Biomedical Informatics,
Part II
Informatics in community-based research
Omolola Ogunyemi, PhD Director, Center for Biomedical Informatics Charles Drew University of Medicine & Science
6

Introduction
• Overview of public health informatics • Health disparities • Electronic chronic disease registry
– CEDRIC
• Infrastructure for screening in urban clinics – Teleretinal Screening
7

Public Health Informatics
Goal: To use methods from computer and information sciences, networking and information technology to improve the public’s health
8

Public Health Informatics
O’Carroll et al: • Focus on preventive intervention when
disease or injury causes are found – Vaccinations and vaccination registries
• Mostly reflects a governmental context rather than a private one
9

Public Health Informatics
Key Public Health Information Systems: • The National Vital Statistics System
– Collection of births, deaths, marriages and other events on a national level
• Morbidity data – National Health Care Survey – National Health Interview Survey – State and Local Area Integrated Telephone Survey
10

Public Health Informatics
Key Public Health Information Systems: • Informatics of Toxicology and Environmental
Public Health – National Library of Medicine provides services for
chemical identification • Chemical Abstracts • Hazardous Substances Databank • Bibliographic databases
11

Public Health Informatics
Key Public Health Information Systems: • Knowledge-based Information and Systems
• MEDLINE (NLM) • EMBASE • PsycInfo • National Technology Information Service • MedlinePLUS
12

Public Health Informatics
Resources Books:
– O’Carroll, P., Yasnoff, W., et al. Public Health Informatics and Information Systems. Springer, 2010.
– Lombardo, J., Buckeridge, D. Disease Surveillance: A Public Health Informatics Approach. Wiley-Interscience, 2007.
13

National Health Information Infrastructure
• Definition: Set of technologies, standards, applications, systems, values, and laws that support all facets of individual health, health care, and public health with the goal of delivering information to individual stakeholders when and where they need it to make informed decisions – First proposed under Bush administration, 2003 – Evolved to become the Nationwide Health
Information Network (HITECH Act 2010)
14

Key Characteristics of the NHIN • Use electronic medical records to capture all health information regardless
of the setting • Send and receive messages across health care settings and communities
about a patient's health status whenever and wherever • Enable automatic electronic reporting to public health for early detection
and response to unusual health patterns (e.g., bioterrorism) • Provide real-time clinical decision support to health care professionals
allowing more rapid widespread application of research findings in routine patient care
• Aggregate of non-identified patient care information to provide evidence regarding the outcomes and efficacy of health interventions
• Monitor quality of health care services in an accurate and prompt manner • Reduce the administrative burden on health care practitioners associated
with filling out forms
15

Health Disparity • Definition: Preventable differences in the
indicators of health of different population groups, often defined by race, ethnicity, sex, education, socioeconomic status, and geographical location
• Several reports have examined this issue – Understanding the impact of health IT in
underserved communities http://www.healthit.gov/sites/default/files/pdf/hit-underserved-communities-health-disparities.pdf
– National Healthcare Disparities Report 2011 http://www.ahrq.gov/research/findings/nhqrdr/nhdr11/nhdr11.pdf
– Institute of Medicine Report 2012 http://www.iom.edu/Reports/2012/How-Far-Have-We-Come-in-Reducing-Health-Disparities.aspx 16

Active Funding Area Closing the Gap in Healthcare Disparities through Dissemination and Implementation of Patient Centered Outcomes Research (U18) • Agency for Healthcare Research and Quality • Posted May 1, 2013 (RFA-HS-13-010) • Due July 31, 2013 (Letter of Intent June 14) • Intent to fund 1-3 awards for up to $3 million for 3 years, budget not to exceed
$500k annually Purpose • Identify strategies to engage stakeholders through shared decision making to
effectively implement interventions specific to the reduction of racial/ethnic healthcare disparities
• Incorporate patient-centered outcomes research (PCOR) findings for racial/ethnic minority populations
• Demonstrate an ability to leverage the capacities of relevant and diverse stakeholders in their strategies to reduce healthcare disparities in under-resourced settings
17

Impact of Health IT Current Disparities Impact of Health IT
Quality of care Disparities exist for underserved populations for measures of quality that include effectiveness, patient safety, and timeliness
• Support the needs of special populations using clinical decision support tools
• Facilitate quality improvement reporting • Increase access to a broader range of services
Access to care Disparities exist in health insurance coverage, patient perceptions of need, and avoidable hospital admissions
• Improve access through telemedicine to provide free or low-cost preventive health services
Health outcomes Underserved populations are more likely to experience health outcome disparities, which vary from differences in morbidity and mortality rates for cancer and other illnesses to other measures of health
• Improve health care delivery, safety, and patient engagement
Patient engagement Lack of patient involvement in their own care can impact health, resulting in less preventive care and poorer understanding of their conditions and care, among other impacts
• Educate users about their condition and their treatment options
• Improve health literacy • Provide more targeted care that addresses
cultural and language needs Chronic disease management
Data has shown that underserved populations are more likely to exhibit signs of poor management of chronic disease, such as higher rates of hospital admissions for short-term complications associated with chronic diseases
• Facilitate improved coordination of care for individuals with chronic diseases
• Promote active patient involvement through patient portals
Source: Understanding the impact of health IT in underserved communities and those with health disparities. ONC for HIT, 2010. 18

Disease Registries
19

Chronic Disease Management
• Introduction – Wagner’s chronic care model – Electronic chronic disease registries
• CEDRIC System Overview • Current Work
20

Introduction
Urban, medically underserved areas in the US have:
– a predominance of chronic diseases (diabetes, cardiovascular disease, etc.)
– a shortage of primary care providers and specialists
– a need for informatics solutions appropriate for settings with
• high physician turnover • large uninsured/underinsured patient population
21

Introduction • Majority of healthcare research happens at large academic
medical centers
• Academic medical centers treat less than 1% of US patients (Green, Fryer, et al. NEJM 2001)
• Research partnerships with primary care clinics & providers that provide bulk of patient care could help improve health outcomes generally
22

Wagner’s Chronic Care Model
The Chronic Care Model identifies the essential elements of a health care system that encourage high-quality chronic disease care (Bodenheimer et al, JAMA 2002)
23

Wagner’s Chronic Care Model
Community
Resources and policies
Patient self-management support
Health System Healthcare organization
Design of delivery system
Decision support
Clinical information systems
Improved Outcomes
Informed patient Prepared, proactive practice team
24

Wagner’s Chronic Care Model Decision Support Goal: Promote clinical care that is consistent
with scientific evidence and patient preferences. Clinical Information Systems Goal: Organize patient and
population data to facilitate efficient and effective care Actions:
– Provide timely alerts & reminders for providers – Identify relevant sub-populations for proactive care – Facilitate individual patient care planning – Monitor performance of practice team and care system
25

Electronic Disease Registries • Help collect and manage data on chronic diseases • Help assess effectiveness of a clinic’s quality improvement
efforts • Feasible for use in safety net clinics (Hanratty et al, J Health
Care Poor Underserved. 2008.) • Implementation more successful in clinics that already have
some health information systems (Keyser DJ et al, Jt Comm J Qual Patient Saf. 2009)
26

Electronic Disease Registries
• Actual usage varies among clinics – 96% of California safety net clinics have a diabetes registry – Only 31% of physicians use registries at these clinics
(California Healthcare Foundation; 2008) • Existing solutions often don’t meet clinics’ unique needs • Few safety net clinics have staff with the IT expertise to
customize existing electronic registries
27

CDU Electronic Disease Registry to Improve Chronic Care
• CEDRIC initial project partners – CDU Center for Biomedical Informatics – Hubert H. Humphrey Comprehensive Healthcare Center
• Hubert Humphrey – L.A. County Department of Health Services ambulatory
care center serving South L.A. – Caters to the uninsured/medically underserved
• >70% of clinic population lacks public or private insurance • Has 12,749 annual patient visits • Patients: 55% Latino, 37% African American
28

CDU Electronic Disease Registry to Improve Chronic Care
Goal: Develop and evaluate a clinical information system for diabetes management that provides
– Physicians & nurses • summary of patient labs and preventive services, • self management goals and status, co-morbidities, & medications, • methods for assessing care continuity (broken appointments) • clinical practice guidelines (American Diabetes Assn plus locally
tailored modifications) to produce alerts and reminders – Administrators
• tools for assessing clinic-wide care measures & care continuity • physician-specific care measures
29

CDU Electronic Disease Registry to Improve Chronic Care
Achieving goal requires – involvement of clinical champions (e.g., MDs at Hubert
Humphrey)
– socio-technical assessment of barriers & facilitators to system implementation and use
– integrating electronic data from disparate systems
• patient scheduling & labs • referral • medication
30

CDU Electronic Disease Registry to Improve Chronic Care
31
CEDRIC System
32

33

34

35

36

37

38

39

40

41

Current Work
• Collaboration with Southside Coalition of community clinics to utilize CEDRIC methods for an electronic heart disease registry
• Patient’s ability to adhere to self management goals on diet & exercise is affected by local factors – Access to parks, recreation, fitness clubs – Neighborhood safety – Access to healthy nutritional outlets and grocery
stores
42

Current Work • Providing clinicians with information on patients’
local geographies can lead to – better understanding of potential barriers to patients
achieving self-management goals – tailoring patient recommendations appropriately based on
barriers identified through geographical information science
– GeoCEDRIC plugin developed (Robinson PL, Mukherjee S, Ogunyemi O, George S. GEO-CEDRIC: Spatially Enabling a Chronic Disease Management System for Urban Safety Net Populations. AMIA Fall meeting, 2012)
43

Addressing Geography
44

Addressing Geography
45

Addressing Geography
46

Addressing Geography
47

Collaborators • Chizobam Ani, MD • Sukrit Mukherjee, MS • David Hindman, PhD • Sheba George, PhD • Mary Verma, MD • Melvin Dayrit, MD • Paul Robinson, PhD Reference • Ogunyemi O, Mukherjee S, Ani C, Hindman D, George S, Ilapakurthi
R, Verma M, Dayrit M. CEDRIC: A Computerized Chronic Disease Management System for Urban, Safety Net Clinics. Stud Health Technol Inform. 2010; 160:208-12. PMID: 20841679.
48

Teleretinal Screening in Urban Safety Net Clinics
49

Overview • Background
– Diabetic retinopathy – Pre-telemedicine screening process for diabetic
retinopathy in inner city Los Angeles • Teleretinal screening study goals • Methods • Results • Discussion • Recently Completed Work • Future Work
50

Background Diabetic retinopathy:
– Damage to blood vessels of the retina caused by diabetes
– Left untreated can lead to blindness – Leading cause of blindness in US adults aged 20 to 74
years – Risk factors include
• poor blood glucose control • high blood pressure • high cholesterol • smoking • length of time a patient has had diabetes
51

Background
• General US screening rates for diabetic retinopathy: ~60%
• US Inner city safety net clinic screening rates: < 25%
• Factors impacting disparity in inner-city vs. national screening rates – Shortage of specialists for retinopathy screening – Large number of uninsured/underinsured patients – Patient misconceptions about utility of regular eye
exams
52

Background Fe
dera
lly Q
ualif
ied
Heal
th C
ente
r
Diabetic patient seen at primary care clinic LA
Cou
nty
DHS
Hosp
ital
Patient referred to county health facility for routine retinopathy screening
4 –
8 m
onth
s afte
r ref
erra
l
Patient screened at county health facility, returns if treatment necessary
Process for retinopathy screening in South LA safety net setting in the absence of telemedicine
53

Background Teleretinal screening as a solution:
• Digital nonmydriatic camera images have been effectively used for retinopathy screening
• With retinal image uploads & secure, web-based image viewing software, off-site specialists can assess risk asynchronously
54

Background
55

Background
56

Background
57

Study Goals • Assess barriers to and facilitators of using teleretinal screening
to detect diabetic retinopathy in 6 South Los Angeles safety net clinics (FQHCs) 1. Image quality: what proportion of images are readable? 2. How acceptable is teleretinal screening to patients and clinic staff?
• Determine proportion of diabetic patients at risk for retinopathy who – receive retinal screening in accordance with evidence based guidelines – require and receive ophthalmologic treatment
58

Methods • MOU signed between clinics and CDU Center for Biomedical
Informatics – CDU
• Purchased 3 digital nonmydriatic cameras for use in screening • Retained 3 board-certified ophthalmologists as readers • Arranged photographer training/retraining and certification • Weekly monitoring of clinic sites and troubleshooting • Arranged with county and clinics to expedite treatment for potential cases
of moderate or worse retinopathy – Clinics
• Identified staff (medical assistants) to be trained on camera use • Photographers took and uploaded patient retinal images into software
(EyePACS) • Made referrals to county health facilities • Provided access to medical records for abstraction
59

Methods
Patients screened for – Mild non-proliferative diabetic retinopathy (NPDR) – Moderate NPDR – Severe NPDR – Proliferative diabetic retinopathy (PDR) – Clinically significant macular edema – Other conditions (glaucoma, cataracts, non-
diabetic maculopathy, etc.)
60

Methods
Photographer training – Photographers were medical assistants already
working at the clinics – Received training on how to use cameras from
collaborator, Dr. Jorge Cuadros (optometrist & informatician at UC Berkeley; creator of EyePACS software)
– Had to be certified before taking pictures of actual patients
• 10 sets of retinal images of non-patients uploaded • Images graded satisfactory by EyePACS staff
61

Methods
Readers (3 board-certified ophthalmologists) Assessed retinal images through EyePACS web-based viewing system (6 – 8 images for both eyes)
• Checked boxes indicating presence or absence of microaneurysms, retinal hemorrhages, cotton wool spots, venous beading, new blood vessels, hard exudates, etc.
• Overall severity of retinopathy (or absence of retinopathy) computed by an algorithm based on boxes checked/left unchecked by reader
• Readers could override computer assessment and manually enter a different assessment
62

Methods
Readers (3 board-certified ophthalmologists) Graded the quality of the images taken by medical assistants/photographers by choosing from the following options
• Insufficient for Any Interpretation • Insufficient for Full Interpretation • Adequate • Good • Excellent • Other (Specify in Comments) • N/A
63

Methods
• Image taking (2010 – 2011) • Retrospective data collection
– Patient demographics – Medical visit history
• Specialist referrals • Co-morbid conditions
– Clinical values (at multiple time points) • Hemoglobin A1C • Blood pressure • Weight
64

Canon digital nonmydriatic camera
65

Canon digital nonmydriatic camera in clinic office
66

Study staff with camera
67

Study staff with camera
68

Methods: Clinic Characteristics (2010)
Clinics
Clinic A Clinic B Clinic C Clinic D Clinic E Clinic F
Number of unique patients served
9,510 26,211 3,868 36,149 14,605 9,231 Total = 99,574
% of patient population that’s Hispanic
53.6% 88.3% 59% 85.4% 85.2% 27.9%
% of patient population that’s non-Hispanic black
4.7% 7.5% 26.1% 12.7% 4.4% 58.9%
% of patient population that’s Asian
0.7% 1.1% 2.8% 0.6% 0% 10.7%
Number of patients with type 2 diabetes
823 1,494 589 2,800 2,233 1,493 Total= 9,432
69

Results
Total number of diabetic patients at 6 clinics 9432*
Total number of retinal image screenings 9/2010 – 9/2011 2876
Total number of unique patients screened 9/2010 – 9/2011 2732 100%
Percentage of diabetic patients screened across 6 clinics 29%*
Total number of patients recommended for referral to a specialist 1035 37.9%
Patients with proliferative diabetic retinopathy (PDR) 48 1.8%
Patients with severe NPDR 115 4.2%
Patients with moderate NPDR 247 9%
Patients with mild NPDR 246 9%
Patients with clinically significant macular edema & no retinopathy 97 3.6%
Patients with other conditions recommended for referral 282 10.3%
Screenings and referrals (as of 9/25/2011)
70

Results
Image Quality Clinic A Clinic B Clinic C/F* Clinic D Clinic E
Insufficient for any Interpretation
8% 4% 5% 13% 11%
Insufficient for full Interpretation
20% 11% 25% 36% 21%
Adequate 39% 49% 36% 35% 30%
Good 14% 17% 14% 6% 20%
Excellent 9% 12% 7% 1% 7%
Not rated 10% 7% 13% 9% 11%
Image quality ratings (as of 9/6/2011)
*Clinics C and F share a camera Insufficient for full interpretation – a diagnostic recommendation can Image rating of adequate or better desirable
71

Discussion • Screening rate above the norm for inner-city
clinics • Teleretinal screening barriers
– Clinics currently lack resources to integrate image taking for teleretinal screening into primary care visit
– Patients sometimes didn’t understand the reason for their screening visit
– Need for image quality rating cut off for photographers – (cut-off for future clinic use developed by ophthalmologist LPD)
– Need to designate clinic staff responsible for coordinating camera refresher training and image quality control
72

Discussion • Teleretinal screening facilitators
– Proactive medical assistants (photographers) – Clinic environment that rewards photographer
creativity for troubleshooting – Acknowledgment of importance of screening by
staff not involved in study – Incentives for photographers to maintain/improve
upon their skills • Observations on image quality
– In general, image quality improved over time – Clinics that screened patients several times a
week saw greater improvements in image quality
73

Recently Completed Work • Qualitative Assessment of Teleretinal Screening (Sheba
George, Allison Fish, Erin Moran – Impact on workflow – Patient perceptions (focus groups) – Clinic staff & medical director perceptions (in-depth interviews) – Ophthalmologist perceptions (in-depth interviews)
• Conducted in-depth interviews with – 6 chief medical officers – 4 mid-level clinic staff – 5 medical assistants – 3 ophthalmologists
• Held focus groups with 42 patients from 6 clinics who received teleretinal screening
74

Future Work • Assess promotora impact on screening rate
• Improve patient outreach
• Predictive model for patients at risk for retinopathy (machine learning) – Improve patient outreach – Identify and assist most vulnerable patients
• Identify biomarkers associated with diabetic retinopathy in different populations – Collaboration with basic scientists – Kuo JZ, Guo X, Klein R, Klein BE, Cui J, Rotter JI, Ipp E, Chen
YD. Systemic Soluble Tumor Necrosis Factor Receptors 1 and 2 are Associated with Severity of Diabetic Retinopathy in Hispanics. Ophthalmology. 2012 May;119(5):1041-6. Epub 2012 Feb 11.
75
Teleretinal Screening Publications
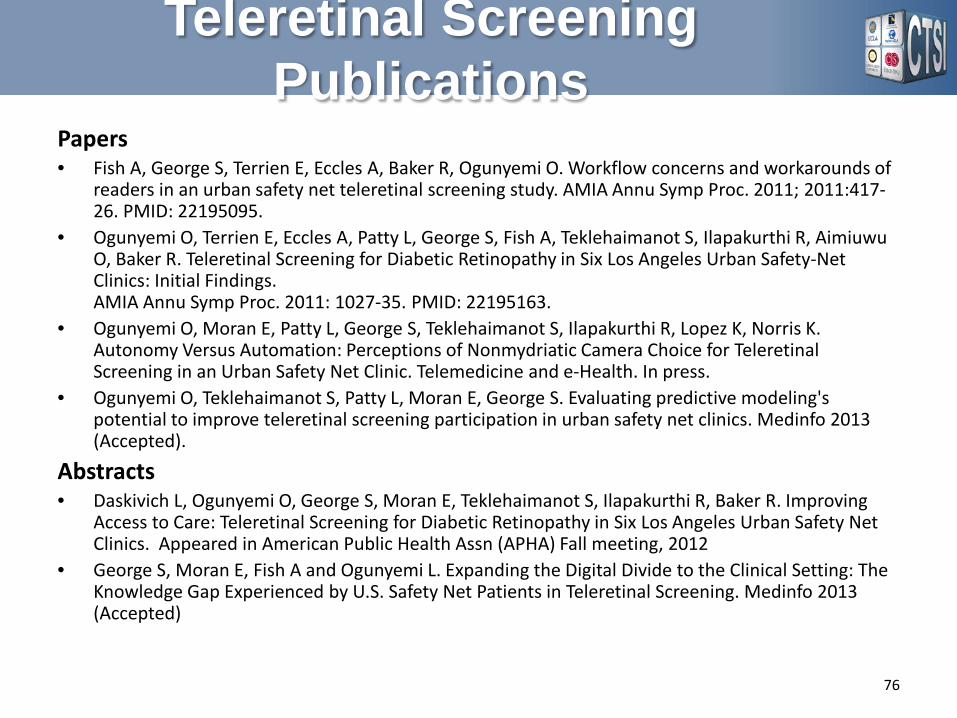
Papers • Fish A, George S, Terrien E, Eccles A, Baker R, Ogunyemi O. Workflow concerns and workarounds of
readers in an urban safety net teleretinal screening study. AMIA Annu Symp Proc. 2011; 2011:417-26. PMID: 22195095.
• Ogunyemi O, Terrien E, Eccles A, Patty L, George S, Fish A, Teklehaimanot S, Ilapakurthi R, Aimiuwu O, Baker R. Teleretinal Screening for Diabetic Retinopathy in Six Los Angeles Urban Safety-Net Clinics: Initial Findings. AMIA Annu Symp Proc. 2011: 1027-35. PMID: 22195163.
• Ogunyemi O, Moran E, Patty L, George S, Teklehaimanot S, Ilapakurthi R, Lopez K, Norris K. Autonomy Versus Automation: Perceptions of Nonmydriatic Camera Choice for Teleretinal Screening in an Urban Safety Net Clinic. Telemedicine and e-Health. In press.
• Ogunyemi O, Teklehaimanot S, Patty L, Moran E, George S. Evaluating predictive modeling's potential to improve teleretinal screening participation in urban safety net clinics. Medinfo 2013 (Accepted).
Abstracts • Daskivich L, Ogunyemi O, George S, Moran E, Teklehaimanot S, Ilapakurthi R, Baker R. Improving
Access to Care: Teleretinal Screening for Diabetic Retinopathy in Six Los Angeles Urban Safety Net Clinics. Appeared in American Public Health Assn (APHA) Fall meeting, 2012
• George S, Moran E, Fish A and Ogunyemi L. Expanding the Digital Divide to the Clinical Setting: The Knowledge Gap Experienced by U.S. Safety Net Patients in Teleretinal Screening. Medinfo 2013 (Accepted)
76

Acknowledgments • 6 South LA FQHCs • Lauren Patty Daskivich, MD • Miguel Unzueta, MD • Michelle Banks, MD • Sheba George, PhD • Allison Fish, JD, PhD • James Smith, MD • Alicia Eccles, MPH • Erin Moran, MS • Senait Teklehaimanot, MPH • Rao Ilapakurthi, MS • Elizabeth Terrien, MA • Otaren Aimiuwu, MPH,
• Kevin Lopez • Richard Baker, MD • David Martins, MD • Keith Norris, MD • Angela Nossett, MD (MLK MACC,
Los Angeles County DHS) • Jorge Cuadros, OD, PhD (UC
Berkeley/EyePACS)
77

Summary • Public health informatics
– Opportunities: Capturing data in an accessible manner (rather than in silos), improving interoperability, advancing the speed and quality of health reporting
• Health disparity – Utilization of HIT to facilitate health care access and improve patient
outcomes in historically underserved populations
• Electronic disease registry – Case study: CDU Electronic Disease Registry to Improve Chronic Care
• Impact of screening clinics in urban communities – Case study: Teleretinal screening
78
Acknowledgments
This work was supported in part by the US National Institutes of Health under grant U54 MD007598-01S2 (formerly U54 RR026138-01S2): Accelerating Excellence in
Translational Science (AXIS).
AXIS webpage: http://axis.cdrewu.edu
CDU Center for Biomedical Informatics webpage: http://www.cdrewu.edu/research/cbi
Contact email: [email protected]
79


