Download - csx 2005_Deutsche_BK_FINAL-REF21832
Deutsche Bank Global Transportation Conference
Oscar MunozExecutive Vice President
Chief Financial Officer
Deutsche Bank Global Transportation Conference
Oscar MunozExecutive Vice President
Chief Financial Officer
ForwardForward--looking Disclosure Statementlooking Disclosure Statement
This presentation and other statements by the Company contain foThis presentation and other statements by the Company contain forwardrward--looking statements within the looking statements within the meaning of the Private Securities Litigation Reform Act with resmeaning of the Private Securities Litigation Reform Act with respect to, among other items: projections and pect to, among other items: projections and estimates of earnings, revenues, costestimates of earnings, revenues, cost--savings, expenses, or other financial items; statements of savings, expenses, or other financial items; statements of management’s plans, strategies and objectives for future operatimanagement’s plans, strategies and objectives for future operation, and management’s expectations as to on, and management’s expectations as to future performance and operations and the time by which objectivfuture performance and operations and the time by which objectives will be achieved; statements concerning es will be achieved; statements concerning proposed new products and services; and statements regarding futproposed new products and services; and statements regarding future economic, industry or market ure economic, industry or market conditions or performance. Forwardconditions or performance. Forward--looking statements are typically identified by words or phrases looking statements are typically identified by words or phrases such as such as “believe,” “expect,” “anticipate,” “project,” and similar expres“believe,” “expect,” “anticipate,” “project,” and similar expressions. Forwardsions. Forward--looking statements speak only looking statements speak only as of the date they are made, and the Company undertakes no oblias of the date they are made, and the Company undertakes no obligation to update or revise any forwardgation to update or revise any forward--looking statement. If the Company does update any forwardlooking statement. If the Company does update any forward--looking statement, no inference should be drawn looking statement, no inference should be drawn that the Company will make additional updates with respect to ththat the Company will make additional updates with respect to that statement or any other forwardat statement or any other forward--looking looking statements.statements.
ForwardForward--looking statements are subject to a number of risks and uncertailooking statements are subject to a number of risks and uncertainties, and actual performance or nties, and actual performance or results could differ materially from that anticipated by these fresults could differ materially from that anticipated by these forwardorward--looking statements. Factors that may looking statements. Factors that may cause actual results to differ materially from those contemplatecause actual results to differ materially from those contemplated by these forwardd by these forward--looking statements include, looking statements include, among others: (i)among others: (i) the Company’s success in implementing its financial and operatiothe Company’s success in implementing its financial and operational initiatives, (ii)nal initiatives, (ii) changes changes in domestic or international economic or business conditions, inin domestic or international economic or business conditions, including those affecting the rail industry (such cluding those affecting the rail industry (such as the impact of industry competition, conditions, performance aas the impact of industry competition, conditions, performance and consolidation); (iii) legislative or nd consolidation); (iii) legislative or regulatory changes; (iv) the inherent business risks associated regulatory changes; (iv) the inherent business risks associated with safety and security; and (v) the outcome with safety and security; and (v) the outcome of claims and litigation involving or affecting the Company. Othof claims and litigation involving or affecting the Company. Other important assumptions and factors that er important assumptions and factors that could cause actual results to differ materially from those in thcould cause actual results to differ materially from those in the forwarde forward--looking statements are specified in the looking statements are specified in the Company’s SEC reports, accessible on the SEC’s website at Company’s SEC reports, accessible on the SEC’s website at www.sec.govwww.sec.gov and the Company’s website at and the Company’s website at www.csx.comwww.csx.com..
33
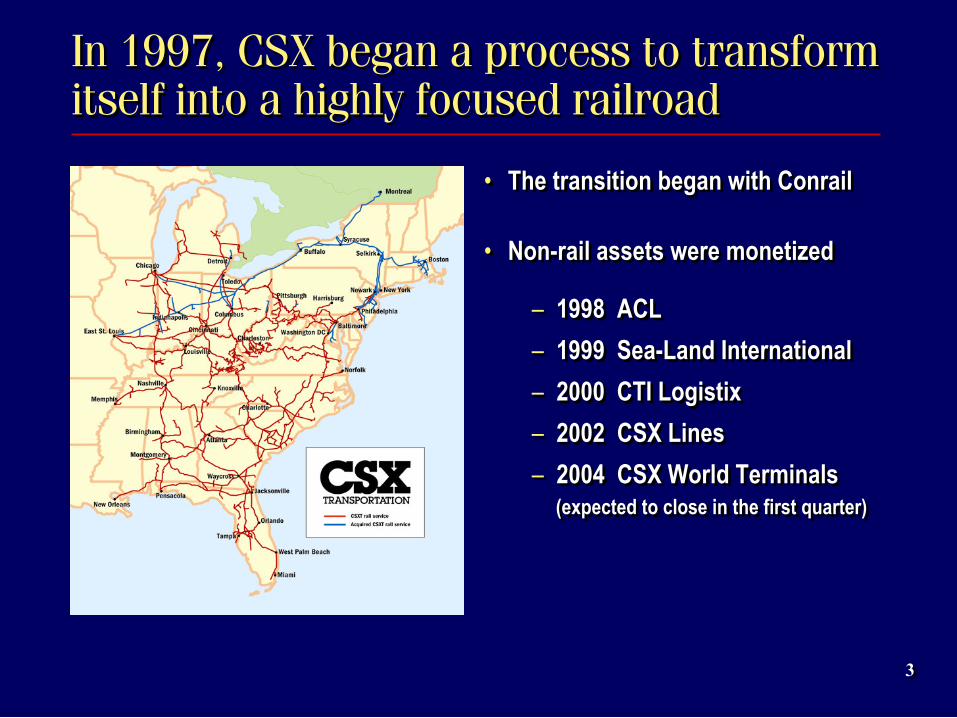
In 1997, CSX began a process to transform itself into a highly focused railroadIn 1997, CSX began a process to transform itself into a highly focused railroad
• The transition began with Conrail
• Non-rail assets were monetized
– 1998 ACL
– 1999 Sea-Land International
– 2000 CTI Logistix
– 2002 CSX Lines
– 2004 CSX World Terminals(expected to close in the first quarter)
• The transition began with Conrail
• Non-rail assets were monetized
– 1998 ACL
– 1999 Sea-Land International
– 2000 CTI Logistix
– 2002 CSX Lines
– 2004 CSX World Terminals(expected to close in the first quarter)
44
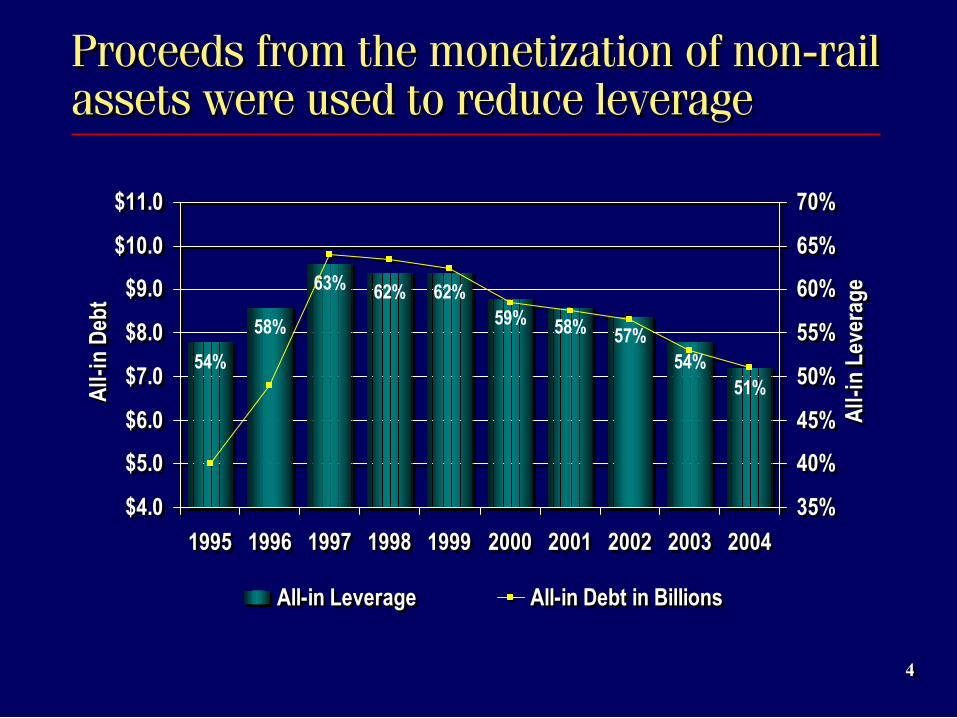
Proceeds from the monetization of non-rail assets were used to reduce leverageProceeds from the monetization of non-rail assets were used to reduce leverage
54%
58%
63% 62% 62%59% 58% 57%
54%51%
$4.0
$5.0
$6.0
$7.0
$8.0
$9.0
$10.0
$11.0
1995 1996 1997 1998 1999 2000 2001 2002 2003 2004
All-
in D
ebt
35%
40%
45%
50%
55%
60%
65%
70%
All-
in L
ever
age
All-in Leverage All-in Debt in Billions
54%
58%
63% 62% 62%59% 58% 57%
54%51%
$4.0
$5.0
$6.0
$7.0
$8.0
$9.0
$10.0
$11.0
1995 1996 1997 1998 1999 2000 2001 2002 2003 2004
All-
in D
ebt
35%
40%
45%
50%
55%
60%
65%
70%
All-
in L
ever
age
All-in Leverage All-in Debt in Billions
55
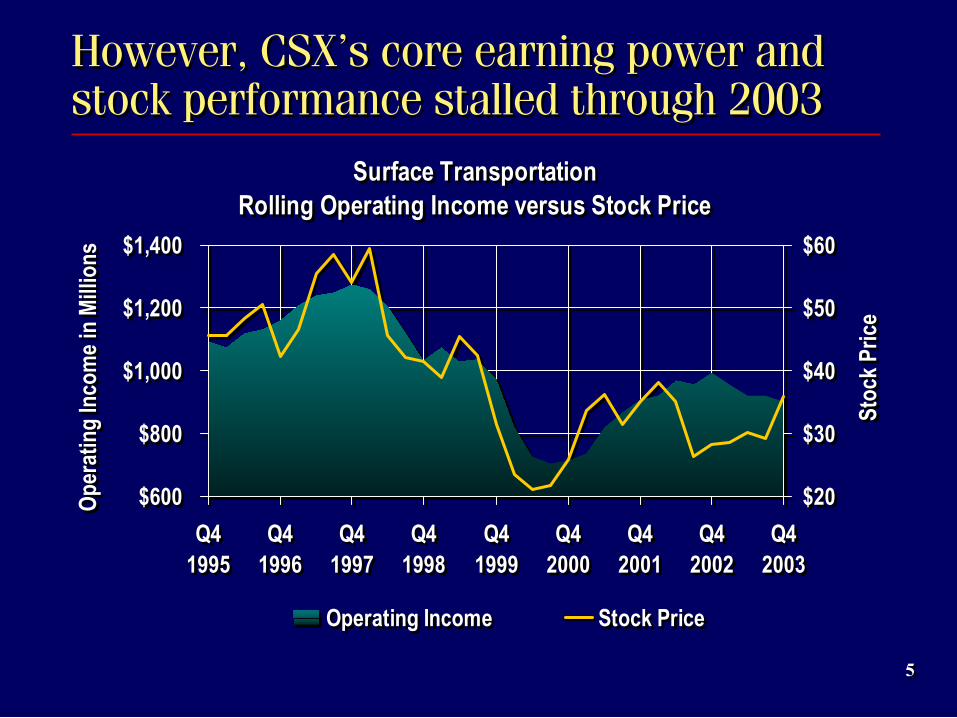
However, CSX’s core earning power and stock performance stalled through 2003However, CSX’s core earning power and stock performance stalled through 2003
Ope
ratin
g In
com
e in
Mill
ions
Ope
ratin
g In
com
e in
Mill
ions
Stoc
k Pr
ice
Stoc
k Pr
ice
Surface TransportationRolling Operating Income versus Stock Price
$600
$800
$1,000
$1,200
$1,400
Q41995
Q41996
Q41997
Q41998
Q41999
Q42000
Q42001
Q42002
Q42003
$20
$30
$40
$50
$60
Operating Income Stock Price
Surface TransportationRolling Operating Income versus Stock Price
$600
$800
$1,000
$1,200
$1,400
Q41995
Q41996
Q41997
Q41998
Q41999
Q42000
Q42001
Q42002
Q42003
$20
$30
$40
$50
$60
Operating Income Stock Price
66
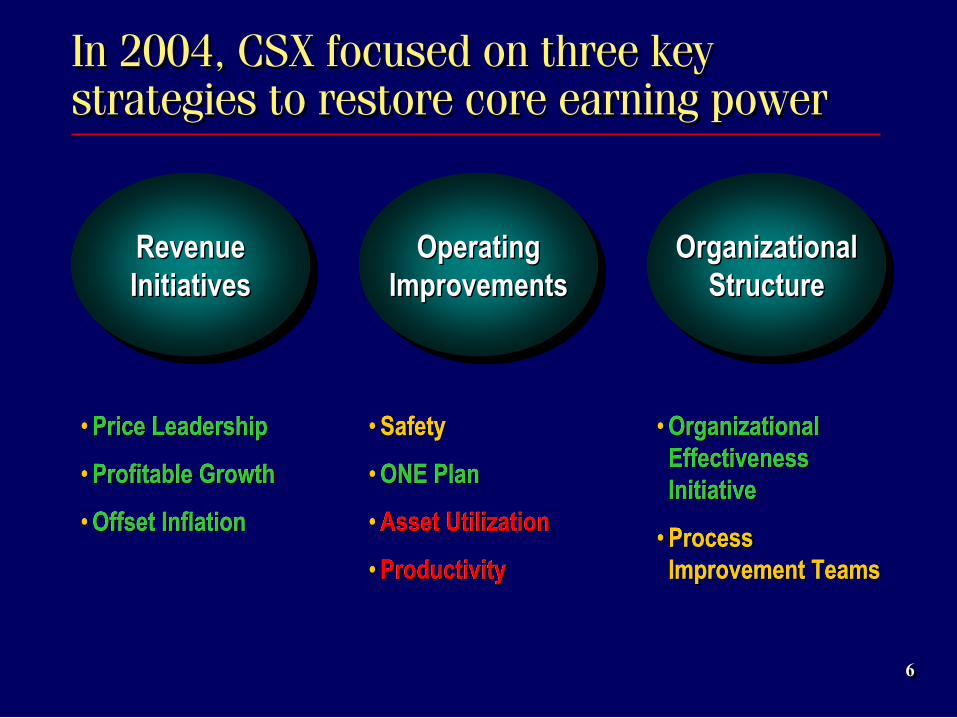
In 2004, CSX focused on three key strategies to restore core earning powerIn 2004, CSX focused on three key strategies to restore core earning power
Revenue Revenue InitiativesInitiatives
•• Price LeadershipPrice Leadership
•• Profitable GrowthProfitable Growth
•• Offset InflationOffset Inflation
•• SafetySafety
•• ONE PlanONE Plan
•• Asset UtilizationAsset Utilization
•• ProductivityProductivity
Operating Operating ImprovementsImprovements
•• Organizational Organizational EffectivenessEffectivenessInitiativeInitiative
•• Process Process Improvement TeamsImprovement Teams
Organizational Organizational StructureStructure
•• Price LeadershipPrice Leadership
•• Profitable GrowthProfitable Growth
•• Offset InflationOffset Inflation
•• SafetySafety
•• ONE PlanONE Plan
•• Asset UtilizationAsset Utilization
•• ProductivityProductivity
•• Organizational Organizational EffectivenessEffectivenessInitiativeInitiative
•• Process Process Improvement TeamsImprovement Teams
77
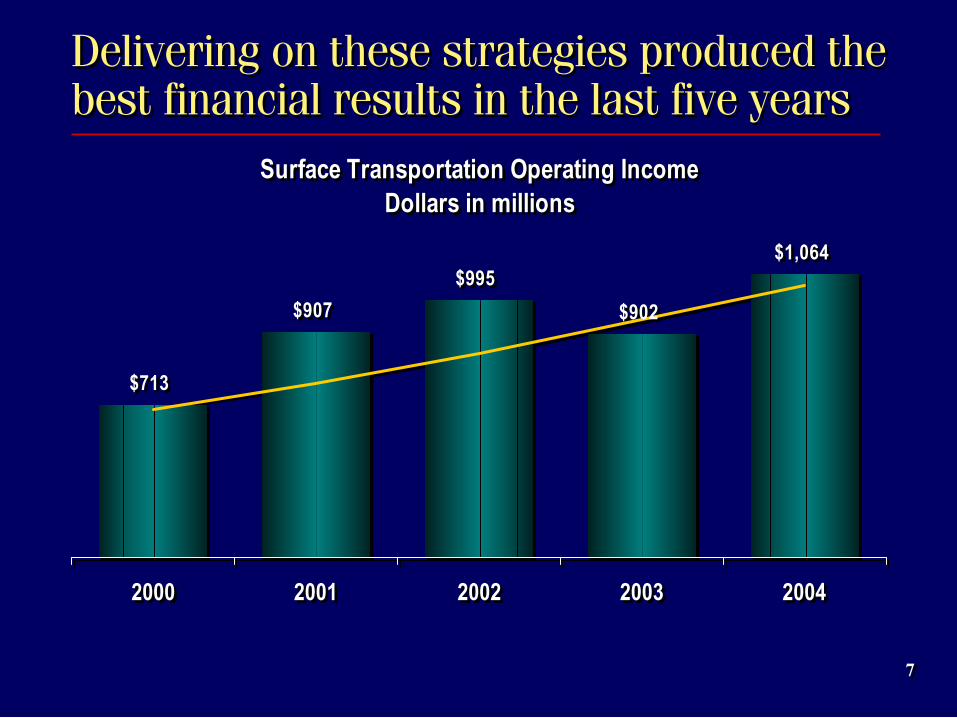
Delivering on these strategies produced the best financial results in the last five yearsDelivering on these strategies produced the best financial results in the last five years
Surface Transportation Operating IncomeDollars in millions
$713
$907
$995
$902
$1,064
2000 2001 2002 2003 2004
Surface Transportation Operating IncomeDollars in millions
$713
$907
$995
$902
$1,064
2000 2001 2002 2003 2004
88
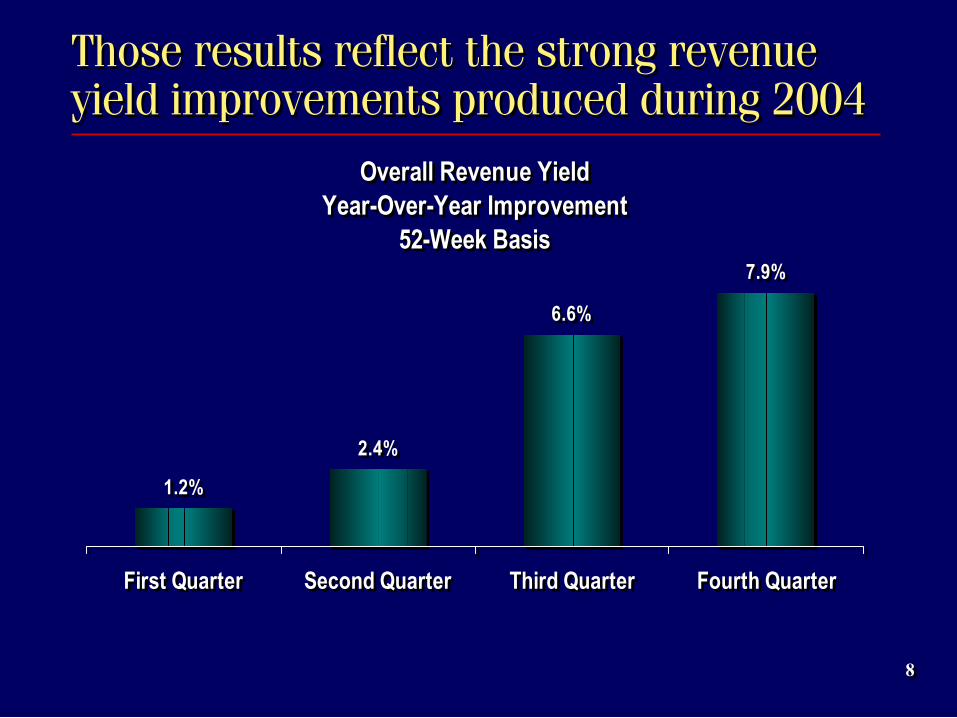
Those results reflect the strong revenue yield improvements produced during 2004Those results reflect the strong revenue yield improvements produced during 2004
Overall Revenue YieldYear-Over-Year Improvement
52-Week Basis
1.2%
2.4%
6.6%
7.9%
First Quarter Second Quarter Third Quarter Fourth Quarter
Overall Revenue YieldYear-Over-Year Improvement
52-Week Basis
1.2%
2.4%
6.6%
7.9%
First Quarter Second Quarter Third Quarter Fourth Quarter
99
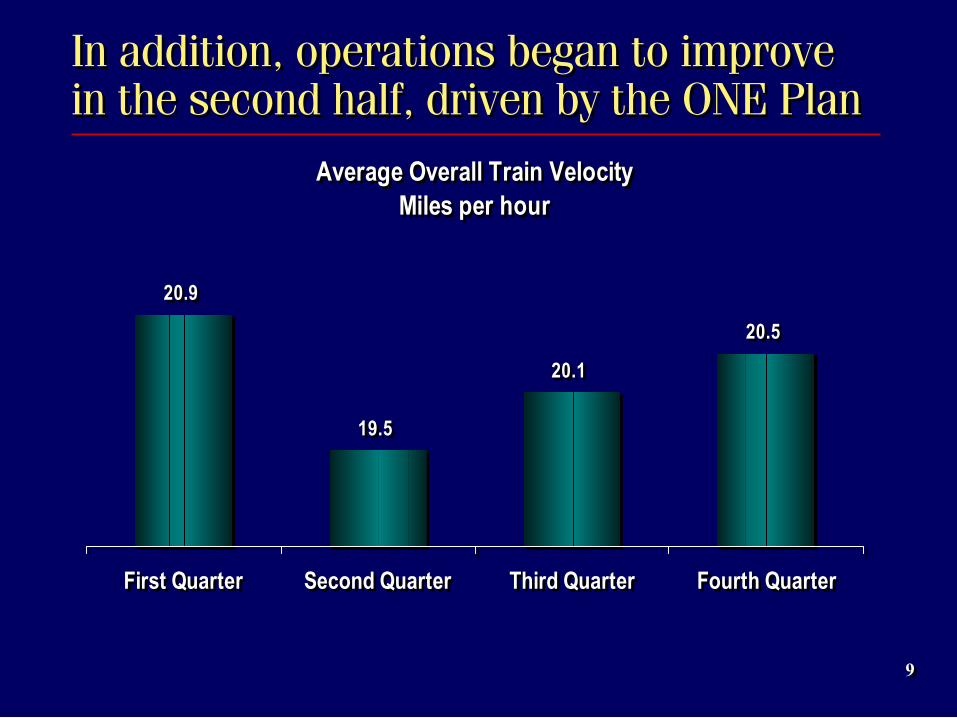
In addition, operations began to improve in the second half, driven by the ONE PlanIn addition, operations began to improve in the second half, driven by the ONE Plan
Average Overall Train VelocityMiles per hour
20.9
19.5
20.1
20.5
First Quarter Second Quarter Third Quarter Fourth Quarter
Average Overall Train VelocityMiles per hour
20.9
19.5
20.1
20.5
First Quarter Second Quarter Third Quarter Fourth Quarter
1010
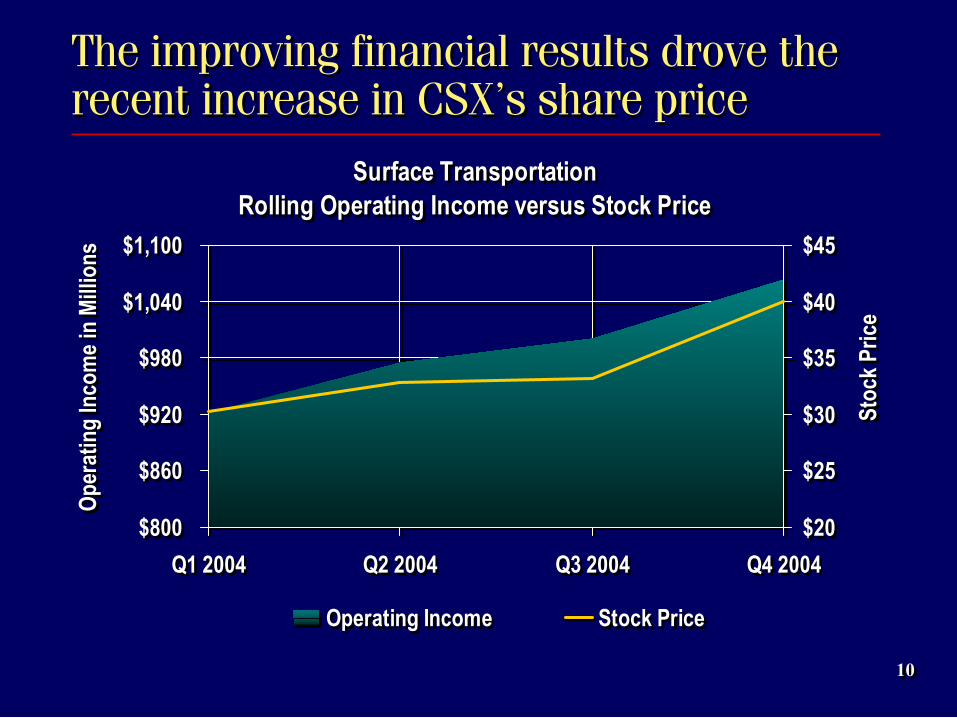
The improving financial results drove the recent increase in CSX’s share priceThe improving financial results drove the recent increase in CSX’s share price
Surface TransportationRolling Operating Income versus Stock Price
$800
$860
$920
$980
$1,040
$1,100
Q1 2004 Q2 2004 Q3 2004 Q4 2004
$20
$25
$30
$35
$40
$45
Operating Income Stock Price
Surface TransportationRolling Operating Income versus Stock Price
$800
$860
$920
$980
$1,040
$1,100
Q1 2004 Q2 2004 Q3 2004 Q4 2004
$20
$25
$30
$35
$40
$45
Operating Income Stock Price
Ope
ratin
g In
com
e in
Mill
ions
Ope
ratin
g In
com
e in
Mill
ions
Stoc
k Pr
ice
Stoc
k Pr
ice
1111
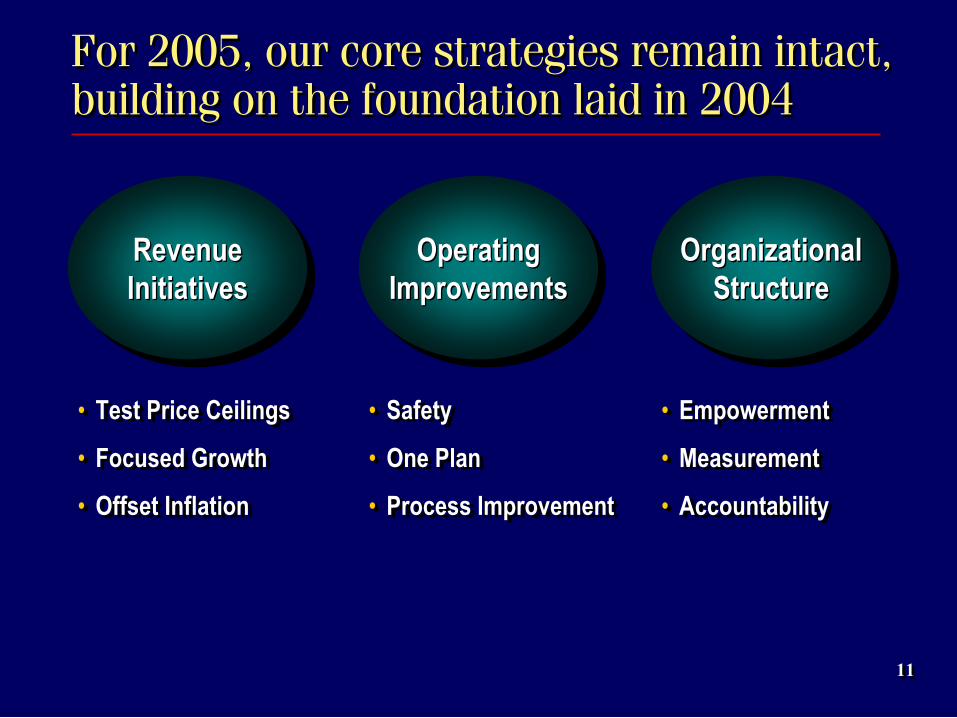
For 2005, our core strategies remain intact, building on the foundation laid in 2004For 2005, our core strategies remain intact, building on the foundation laid in 2004
• Test Price Ceilings
• Focused Growth
• Offset Inflation
• Test Price Ceilings
• Focused Growth
• Offset Inflation
• Safety
• One Plan
• Process Improvement
• Safety
• One Plan
• Process Improvement
• Empowerment
• Measurement
• Accountability
• Empowerment
• Measurement
• Accountability
Revenue Revenue InitiativesInitiatives
Operating Operating ImprovementsImprovements
Organizational Organizational StructureStructure
1212
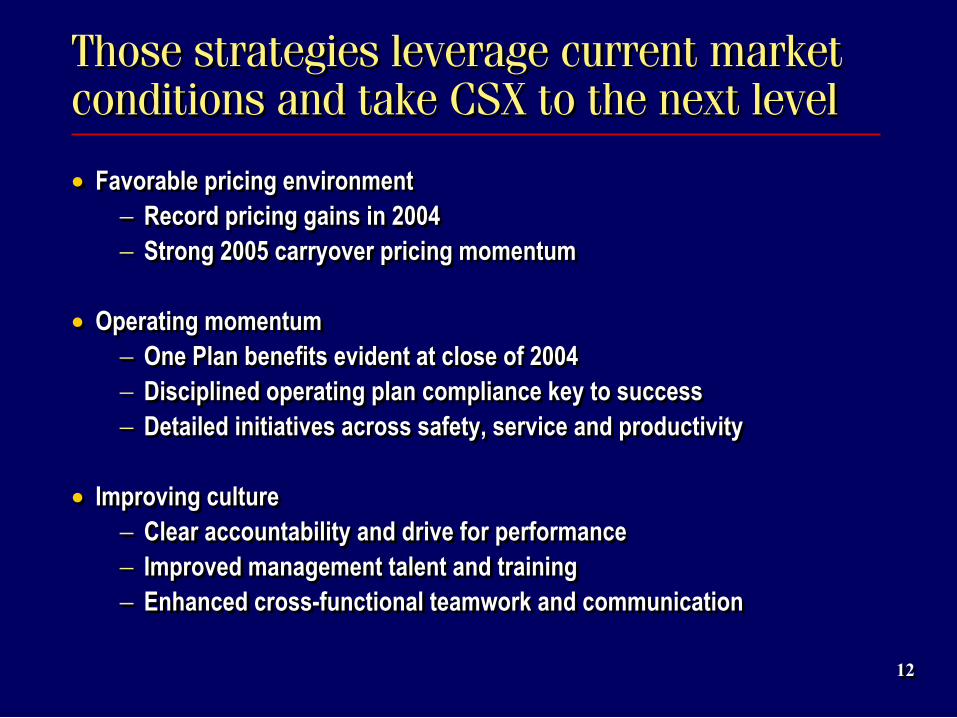
Those strategies leverage current market conditions and take CSX to the next levelThose strategies leverage current market conditions and take CSX to the next level
• Favorable pricing environment− Record pricing gains in 2004− Strong 2005 carryover pricing momentum
• Operating momentum− One Plan benefits evident at close of 2004− Disciplined operating plan compliance key to success− Detailed initiatives across safety, service and productivity
• Improving culture− Clear accountability and drive for performance− Improved management talent and training− Enhanced cross-functional teamwork and communication
1313
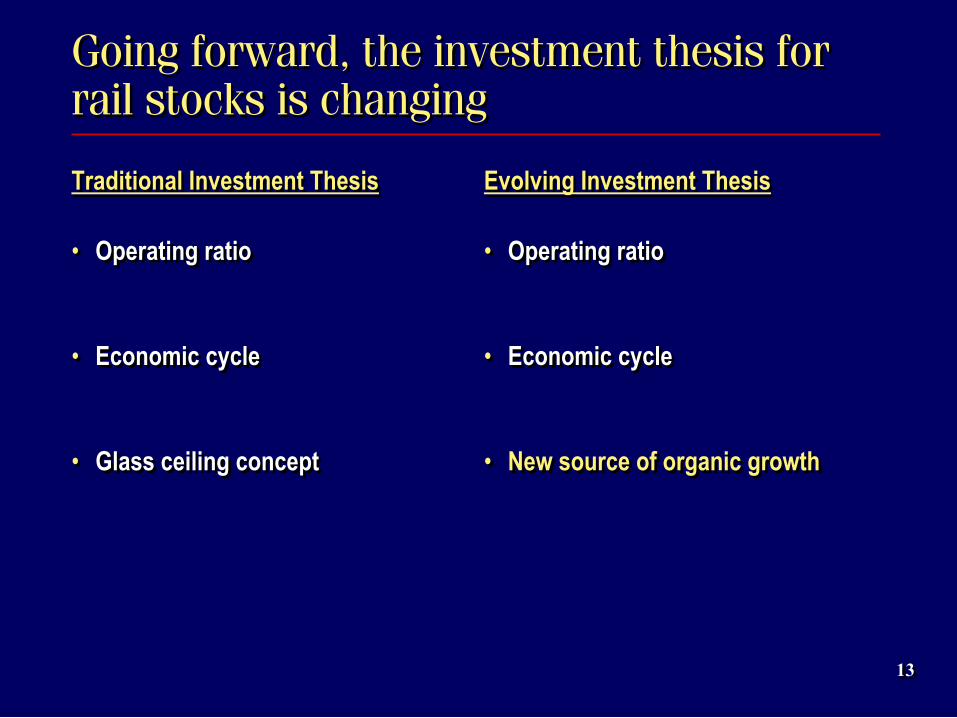
Going forward, the investment thesis for rail stocks is changingGoing forward, the investment thesis for rail stocks is changing
Traditional Investment Thesis
• Operating ratio
• Economic cycle
• Glass ceiling concept
Traditional Investment Thesis
• Operating ratio
• Economic cycle
• Glass ceiling concept
Evolving Investment Thesis
• Operating ratio
• Economic cycle
• New source of organic growth
Evolving Investment Thesis
• Operating ratio
• Economic cycle
• New source of organic growth
1414
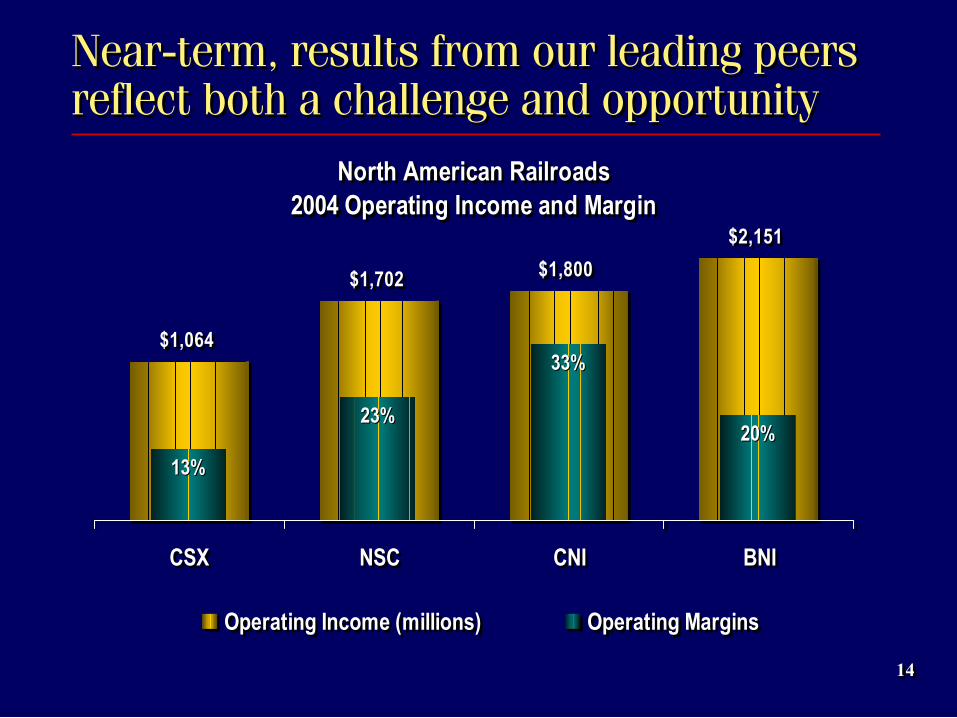
Near-term, results from our leading peers reflect both a challenge and opportunityNear-term, results from our leading peers reflect both a challenge and opportunity
North American Railroads2004 Operating Income and Margin
$1,064
$1,702 $1,800
$2,151
CSX NSC CNI BNI
Operating Income (millions) Operating Margins
North American Railroads2004 Operating Income and Margin
$1,064
$1,702 $1,800
$2,151
CSX NSC CNI BNI
Operating Income (millions) Operating Margins
13%13%
23%23%
33%33%
20%20%
1515
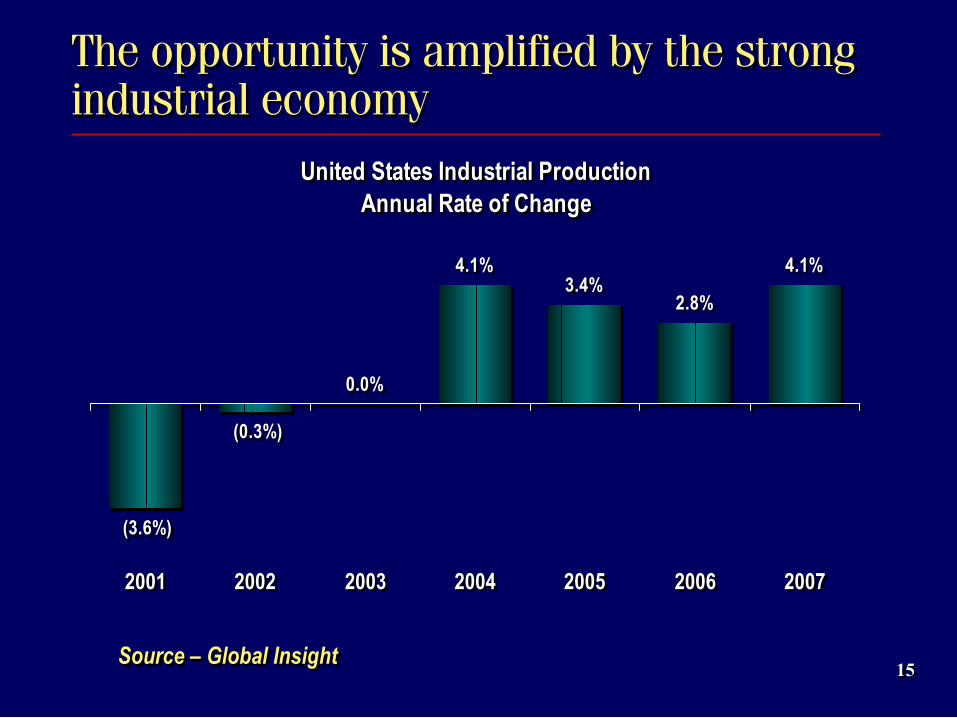
The opportunity is amplified by the strong industrial economyThe opportunity is amplified by the strong industrial economy
United States Industrial ProductionAnnual Rate of Change
0.0%
4.1%3.4%
2.8%
4.1%
(3.6%)
(0.3%)
2001 2002 2003 2004 2005 2006 2007
United States Industrial ProductionAnnual Rate of Change
0.0%
4.1%3.4%
2.8%
4.1%
(3.6%)
(0.3%)
2001 2002 2003 2004 2005 2006 2007
Source – Global InsightSource – Global Insight
1616
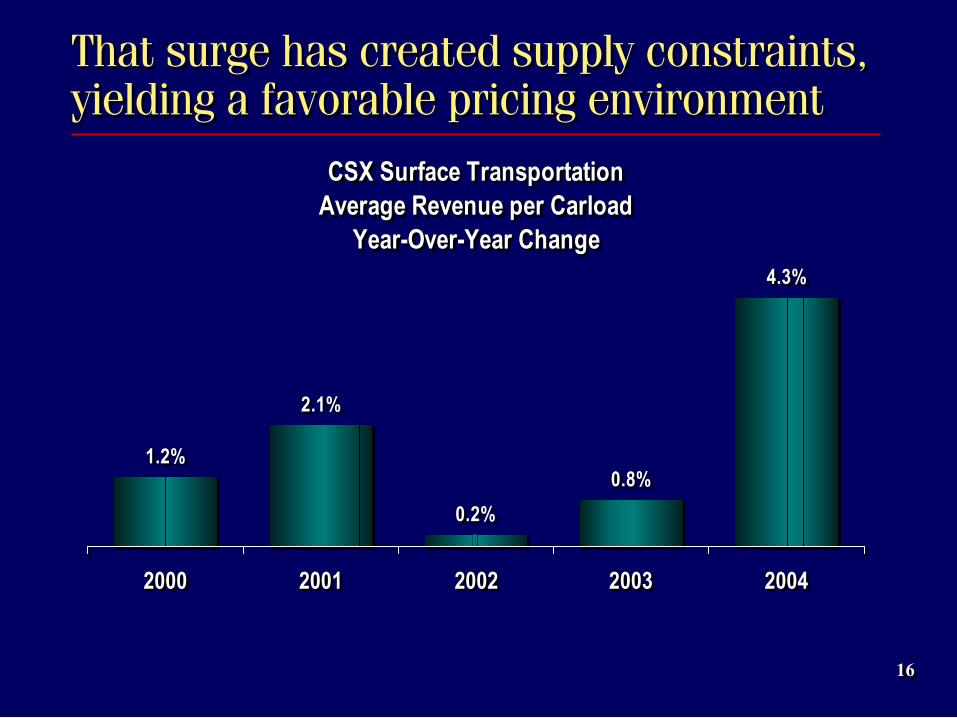
That surge has created supply constraints, yielding a favorable pricing environmentThat surge has created supply constraints, yielding a favorable pricing environment
CSX Surface Transportation Average Revenue per Carload
Year-Over-Year Change
1.2%
2.1%
0.2%
0.8%
4.3%
2000 2001 2002 2003 2004
CSX Surface Transportation Average Revenue per Carload
Year-Over-Year Change
1.2%
2.1%
0.2%
0.8%
4.3%
2000 2001 2002 2003 2004
1717
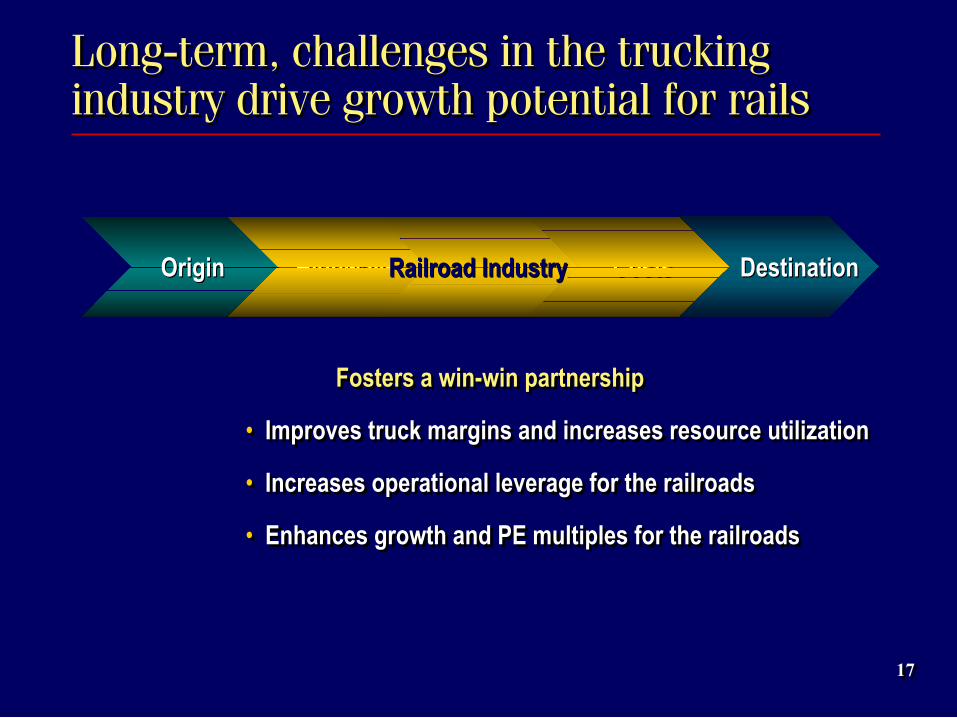
Long-term, challenges in the trucking industry drive growth potential for railsLong-term, challenges in the trucking industry drive growth potential for rails
OriginOrigin DestinationDestination
• Congested highways in need of repair
• Congested highways in need of repair
HighwaysHighways LaborLabor
• Driver shortages and new hours of service laws
• Driver shortages and new hours of service laws
CostsCosts
• Increasing fuel and insurance costs
• Increasing fuel and insurance costs
Railroad IndustryRailroad Industry
Fosters a win-win partnershipFosters a win-win partnership
• Increases operational leverage for the railroads• Increases operational leverage for the railroads
• Improves truck margins and increases resource utilization• Improves truck margins and increases resource utilization
• Enhances growth and PE multiples for the railroads• Enhances growth and PE multiples for the railroads
1818
$9
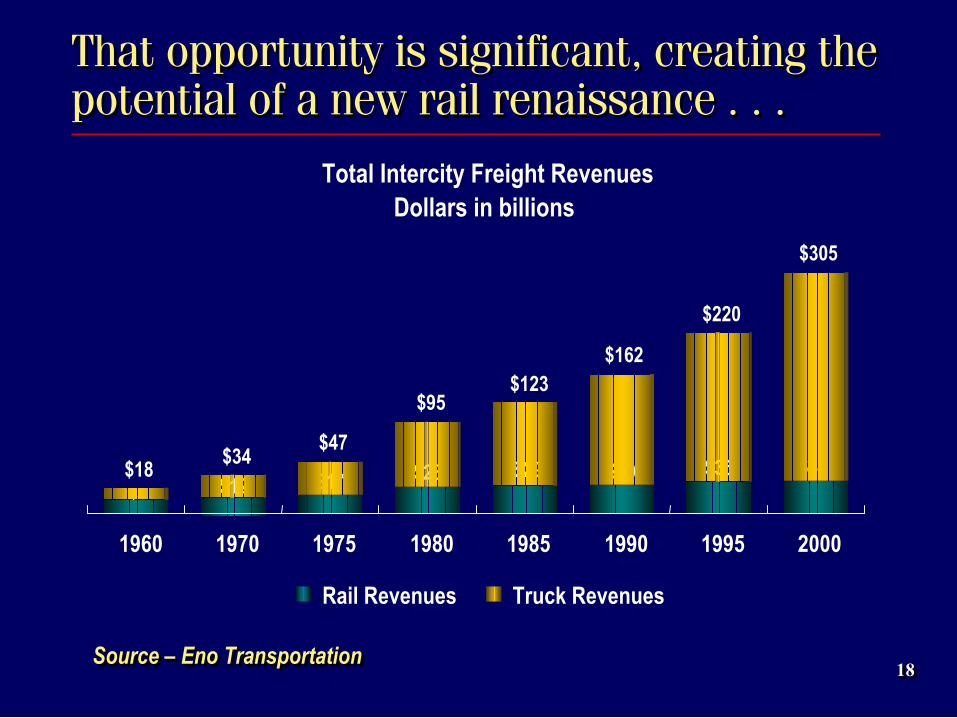
That opportunity is significant, creating the potential of a new rail renaissance . . . That opportunity is significant, creating the potential of a new rail renaissance . . .
Total Intercity Freight RevenuesDollars in billions
$12 $17 $28 $29 $30 $35 $36
$305
$220
$18$34
$47
$95$123
$162
1960 1970 1975 1980 1985 1990 1995 2000
Rail Revenues Truck Revenues
Source – Eno TransportationSource – Eno Transportation
1919
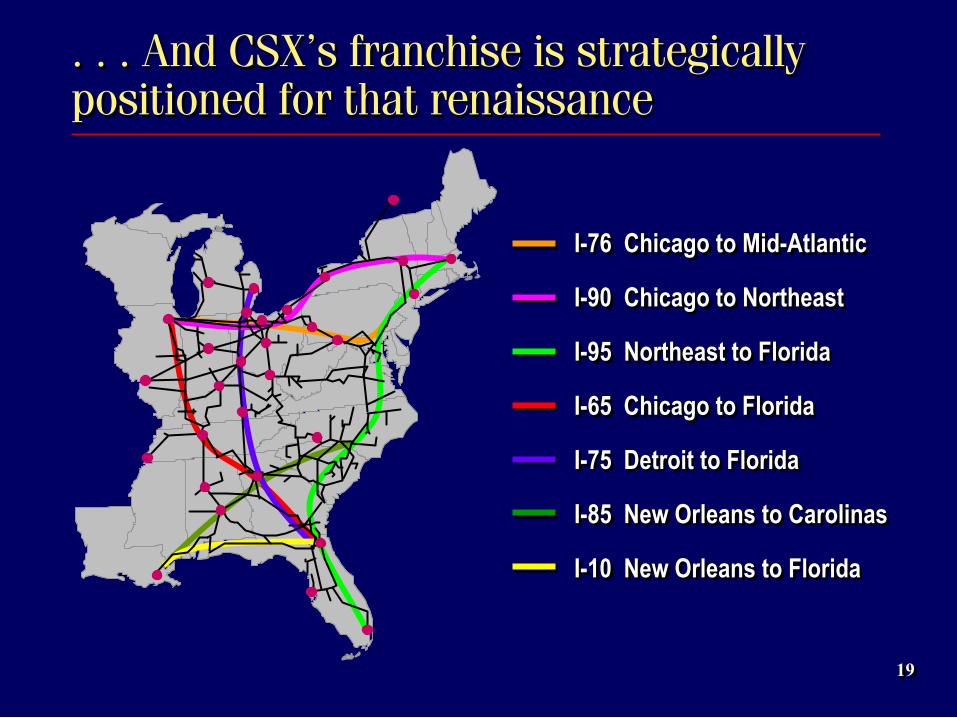
. . . And CSX’s franchise is strategically positioned for that renaissance. . . And CSX’s franchise is strategically positioned for that renaissance
I-76 Chicago to Mid-Atlantic
I-90 Chicago to Northeast
I-95 Northeast to Florida
I-65 Chicago to Florida
I-75 Detroit to Florida
I-85 New Orleans to Carolinas
I-10 New Orleans to Florida
I-76 Chicago to Mid-Atlantic
I-90 Chicago to Northeast
I-95 Northeast to Florida
I-65 Chicago to Florida
I-75 Detroit to Florida
I-85 New Orleans to Carolinas
I-10 New Orleans to Florida
2020
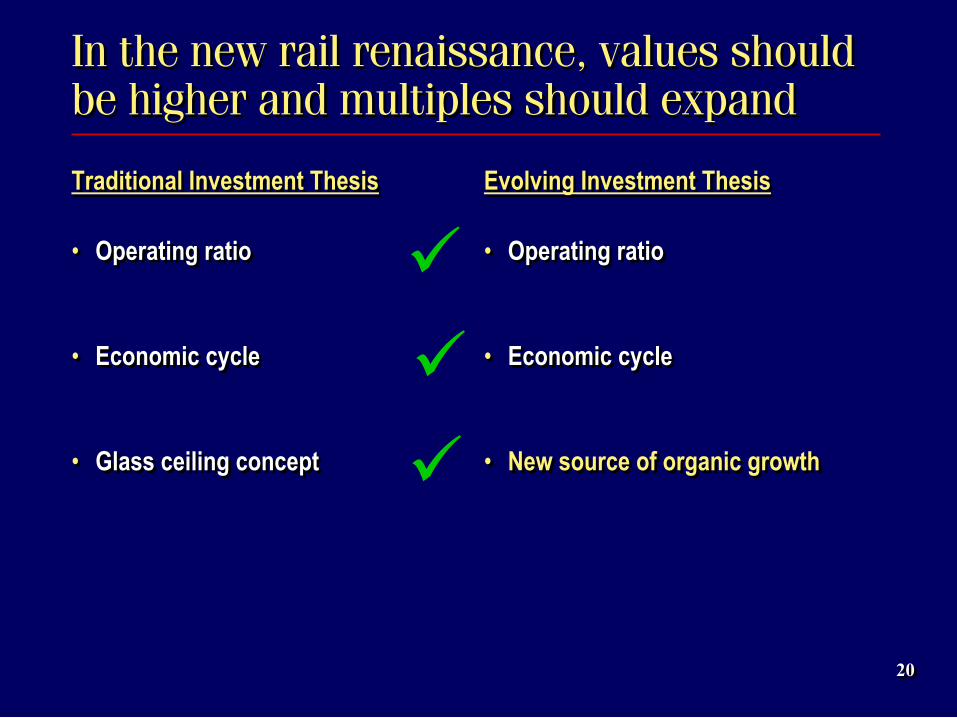
In the new rail renaissance, values should be higher and multiples should expand In the new rail renaissance, values should be higher and multiples should expand
Traditional Investment Thesis
• Operating ratio
• Economic cycle
• Glass ceiling concept
Traditional Investment Thesis
• Operating ratio
• Economic cycle
• Glass ceiling concept
Evolving Investment Thesis
• Operating ratio
• Economic cycle
• New source of organic growth
Evolving Investment Thesis
• Operating ratio
• Economic cycle
• New source of organic growth

Deutsche Bank Global Transportation Conference
Oscar MunozExecutive Vice President
Chief Financial Officer
Deutsche Bank Global Transportation Conference
Oscar MunozExecutive Vice President
Chief Financial Officer


